Thin Film 2012–2016: Technologies, Markets and Strategies
8
THIN FILM 2012–2016 : Technologies, Markets and Strategies for Survival – MJ Shiao, Senior Analyst, Solar Markets | GTM Research No other PV technology has seen as many false fits and starts, or held as much promise, as thin-film PV. During the height of the polysilicon bottleneck between 2004 and 2009, thin-film PV’s prospects seemed unparalleled. Shipments of thin film grew from a paltry 68 MW in 2004 to 2 GW in 2009. By the end of 2009, thin film commanded 18% of the total market with no signs of slowing. While thin-film shipments continued to grow to 3.7 GW in 2011, cheap crystalline silicon dominated the industry from 2010 onward. Market share of thin-film PV dropped to 11%. In 2011, crystalline silicon PV prices dropped by over 40% over the course of the year, undermining the value proposition of thin-film solar cells. Yet, despite the crystalline pricing madness, the future of thin film has not necessarily disappeared. Venture capital investment into thin film in Q4 2011 and Q1 2012 combined to reach nearly $300 million. Solar Frontier continues to ramp up its GW- scale CIGS facility. Tokyo Electron bought Oerlikon Solar for $275 million, affirming long-term faith in the thin-film silicon manufacturing space. With CdTe, GE continues to invest heavily in Primestar, and First Solar still intends to open new capacity in Vietnam and Mesa, Arizona. TOP THIN FILM PV PRODUCERS, 2012 (EST.) SOURCE: GTM RESEARCH Certainly, the current supply-demand balance is in flux, but in the long term, the fundamental value proposition of thin-film solar – low-cost PV divorced from polysilicon at comparable efficiencies – remains steadfast, although the path to competitiveness has been accelerated. At 250 pages, Thin Film 2012–2016: Technologies, Markets and Strategies for Survival is the fourth edition of GTM Research's annual update on the thin film PV space. With detailed, accurate historical data, a granular examination of manufacturing costs, technology analysis, recommendations for supplier strategies, and competitive intelligence on the top 80 firms in the space, it is the most comprehensive, data-driven and objective assessment of the space available to date.
-
Upload
andreiceaglei -
Category
Documents
-
view
34 -
download
2
Transcript of Thin Film 2012–2016: Technologies, Markets and Strategies

Thin Film 2012–2016: Technologies, Markets and Strategies for Survival – MJ Shiao, Senior Analyst, Solar Markets | GTM Research
No other PV technology has seen as many false fits and starts, or held as much promise, as thin-film PV. During the height of the polysilicon bottleneck between 2004 and 2009, thin-film PV’s prospects seemed unparalleled. Shipments of thin film grew from a paltry 68 MW in 2004 to 2 GW in 2009. By the end of 2009, thin film commanded 18% of the total market with no signs of slowing.
While thin-film shipments continued to grow to 3.7 GW in 2011, cheap crystalline silicon dominated the industry from 2010 onward. Market share of thin-film PV dropped to 11%. In 2011, crystalline silicon PV prices dropped by over 40% over the course of the year, undermining the value proposition of thin-film solar cells.
Yet, despite the crystalline pricing madness, the future of thin film has not necessarily disappeared. Venture capital investment into thin film in Q4 2011 and Q1 2012 combined to reach nearly $300 million. Solar Frontier continues to ramp up its GW-scale CIGS facility. Tokyo Electron bought Oerlikon Solar for $275 million, affirming long-term faith in the thin-film silicon manufacturing space. With CdTe, GE continues to invest heavily in Primestar, and First Solar still intends to open new capacity in Vietnam and Mesa, Arizona.
Top Thin Film pV producers, 2012 (esT.)
SOuRCE: GTM RESEARCh
Certainly, the current supply-demand balance is in flux, but in the long term, the fundamental value proposition of thin-film solar – low-cost PV divorced from polysilicon at comparable efficiencies – remains steadfast, although the path to competitiveness has been accelerated.
At 250 pages, Thin Film 2012–2016: Technologies, Markets and Strategies for Survival is the fourth edition of GTM Research's annual update on the thin film PV space. With detailed, accurate historical data, a granular examination of manufacturing costs, technology analysis, recommendations for supplier strategies, and competitive intelligence on the top 80 firms in the space, it
is the most comprehensive, data-driven and objective assessment of the space available to date.

Table oF conTenTs
1. inTroducTion1.1. The Eroding Value Proposition and Promise of Thin-Film PV
1.2. A Brief history of Successful Thin Film Manufacturers
1.3. Key Questions for the Thin Film Industry
1.4. Report Structure
2. pV Technologies2.1. Crystalline Silicon (c-Si)
2.2. Thin Films
2.2.1. Cadmium Telluride (CdTe)
2.2.2. Copper Indium (Gallium) Diselenide (CIS/CIGS)
2.2.3. Thin Film Silicon (TF Si)
2.2.4. Multi-Junction Cells
2.2.5. Tandem-Junction/Microcrystalline Thin Film Silicon
2.3. Third-Generation Thin Film
2.3.1. Dye-Sensitized Cells (DSCs)
2.3.2. Organic PV (OPV)
2.4. Thin Film Coverage
3. maTerials and manuFacTuring3.1. Batch Versus Continuous Manufacturing
3.2. Thin-Film PV Process Flow
3.3. Substrate Selection
3.4 . Deposition Processes
3.4.1. CdTe
3.4.2. CIGS
3.4.3. Thin Film Silicon
3.5. Module Integration
3.5.1. Monolithic Integration
3.5.2. Cell-Based Module Integration
3.6. Encapsulation
3.7. Glass Lamination
3.8. Materials Requirements and Considerations
3.8.1. CdTe
3.8.2. CIS/CIGS
3.8.3. Amorphous Si
3.8.4. Commodity Materials
3.9. Glass and Transparent Conductive Oxide (TCO)
3.9.1. Transparent Conductive Oxide (TCO)
3.10 . Turnkey Versus Proprietary Equipment
3.10.1. Turnkey Manufacturing Providers
4. Thin Film perFormance and Technology characTerisTics
4.1. Efficiency
4.1.1. how Efficiency Matters
4.1.2. Research Cell vs. Commercial Cell Efficiencies
4.1.3. Commercial Cell vs. Module Efficiency
4.1.4. historical Module Efficiencies
4.1.5. Projected Future Efficiency
4.1.6. Limitations to Improvements
4.1.7. Efficiency Effects on Total System Costs
4.2. Module Degradation
4.3. Sensitivity to Temperature
4.4. Spectral (Light) Sensitivity
4.4.1. Light Soaking
4.5. Energy Yield and Performance- ‐Adjusted BOS Penalties
4.6. Inverter Compatibility
4.7. Area Footprint
4.8. Module Weight
5. Thin Film in 2012: consTrained demand in a suFFocaTing price enVironmenT
5.1. Surveying the Thin Film Landscape
5.2. Early Blows and the Imminent Shakeout
5.3. The Pricing Cliff
5.3.1. Crystalline Silicon Module Pricing Crashes
5.3.2. Polysilicon Prices Continue to Fall
5.4. Soft Global PV Demand
5.4.1. Crawling Toward a Recovering Demand Market in 2013
5.5. Bankability Concerns Continue to haunt Thin Film
5.5.1. An Imperfect Solution: Warranty Insurance
5.5.2. Acquisitions by Large New Entrants
5.6. Long- Term Potential and Investments
5.6.1. American Manufacturers Continue Expansion Plans
5.7. From Shakeout to Recovery: Survival of the Fit
5.7.1. The Importance of Downstream Integration
5.7.2. The Role of Emerging Regional Markets
5.7.3. The (Non)- Emergence of BIPV
5.7.4. Thin Film at Scale: Too Late?
5.8. CdTe: The First Solar Juggernaut Meets Competition
5.8.1. First Solar in 2011
5.8.2. Abound Solar
5.8.3. General Electric (Primestar)
5.8.4. Other CdTe Companies
5.9. CIGS: Death Before Life?
5.9.1. Solar Frontier: The Coming of Second Solar?
5.9.2. The Shakeout Starts
5.9.3. VC- Funded Companies Looking to Cash Out
5.9.4. The Experience of Turnkey Equipment Vendors
5.9.5. Targeting New Markets
5.10. Thin Film Silicon: Mixed Outlooks
5.10.1. Turnkey Equipment Customers: A Distressed Market
5.10.2. The Producer and Efficiency Landscape
5.11. What Does Consolidation Look Like?
6. manuFacTuring cosTs and compeTiTiVeness6.1. Module Cost Structure
6.2. Capital Expenditure (Capex)
6.3. Raw Material Costs
6.3.1. CdTe Material Costs (Cadmium, Tellurium)

Table oF conTenTs
6.3.2. CIGS Material Costs (Copper, Indium, Gallium, Selenium)
6.3.3. Thin-Film Silicon Material Costs (Silane)
6.3.4. Other Raw Materials
6.4 .Applying Scale Effects and Labor Costs
6.5. Implementing a Baseline
6.6. Capex Effects
6.7. Efficiency Effects
6.8. Scale Effects
6.9. Process Yield Effects
6.10. uptime/utilization Effects
6.11. Regional Effects
6.12. Modeling the Thin Film Landscape
6.12.1. Surveying the Cost Landscape
6.13. Module Prices
6.14. Cost Roadmaps
6.15. Gross Margins
6.16. Actual Thin Film Costs (Less Than Full utilization)
6.17. Required Module Costs at Fixed Margins
6.18. Manufacturer-Specific Costs
6.18.1. The Troubled Titan: First Solar
6.18.2. Imitation is the Best Form of Flattery: Abound and Primestar
6.18.3. Pioneering Gigawatt-Scale CIGS: Solar Frontier
6.18.4. On the Cusp of Greatness? (MiaSolé, TSMC)
6.19. The Closing Window (Nanosolar, helioVolt, Solibro, Avancis)
6.19.1. Can Flexible Play in the Market?
6.19.2. Tokyo Electron’s Prospects: Smart or Swindled?
6.19.3. The Tenuous Top: Sharp Solar
6.19.4. The Other Turnkey Players: Apollo and uLVAC
7. markeTs and applicaTions7.1. Grid-Tied Residential
7.2. Grid-Tied Commercial
7.3. Grid-Tied utility-Scale
7.4. Off-Grid and Niche Applications
7.5. Downstream Integration by Thin Film Manufacturers
8. manuFacTuring capaciTy and producTion8.1. Capacity vs. Production
8.2. The Need to Derate
8.3. Capacity Projections
8.3.1. By Technology
8.3.2. By Region
8.3.3. Top Manufacturers
9. Thin Film demand9.1. historical Production and Market Share
9.2. From Capacity to Production: The Need to Derate
9.2.1. Thin Film Capacity: A Tenuous Notion
9.2.2. Exogenous Factors: Market Conditions, Product Value
9.3. Quantifying Thin Film Production: From the Bottom up
9.4. Market Sizing
9.5. What Consolidation Looks Like
10. conclusions10.1. Answering the Questions That Matter
10.1.1. What happened to thin film’s prospects?
10.1.2. Does thin film’s value proposition still hold true?
10.1.3. What will be the size of the thin film market?
10.1.4. Which technologies will win out in thin film?
10.1.5. What does consolidation look like in the thin film sector?
10.1.6. Who is best positioned to survive the solar shakeout?
10.1.7. What must thin film players do to stay competitive in the PV market?
10.2. Shaky Times, Bold Calls
10.3. Thin Film Prospects: Caveat Emptor
11. proFiles3Sun
Abound Solar
Applied Quantum Technology
(AQT)
Ascent Solar
Astronergy
Avancis
AxunTek Solar Energy
Calyxo Gmbh
Dow Solar
ENN Solar
First Solar
Global Solar
GS Solar
hanergy
heliosphera
hevel Solar
hunan Gongchuang
Inventux Technologies AG
Kaneka Solartech Co., Ltd.
Masdar
MiaSole
Mitsubishi heavy Industries
Moser Baer
Nanosolar
NexPower Technology
Nuvosun
Odersun
GE (Primestar)
Sharp
Solar Frontier
Solarion
Solibro Gmbh
SoloPower
Soltecture (Sulfurcell)
Stion
Tianwei SolarFilms Co
Trony Solar
TSMC
T-Solar
united Solar
WK Solar
Xunlight
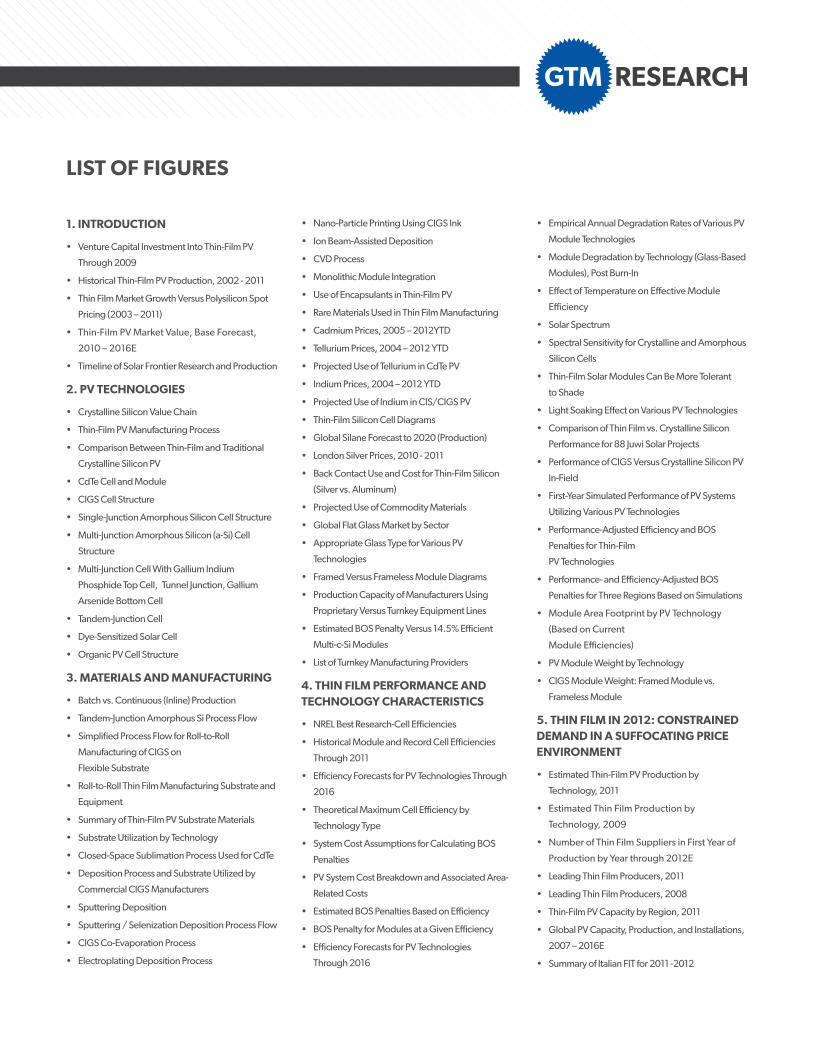
lisT oF Figures
1. inTroducTion
• Venture Capital Investment Into Thin-Film PV
Through 2009
• historical Thin-Film PV Production, 2002 - 2011
• Thin Film Market Growth Versus Polysilicon Spot
Pricing (2003 – 2011)
• Thin-Film PV Market Value, Base Forecast,
2010 – 2016E
• Timeline of Solar Frontier Research and Production
2. pV Technologies
• Crystalline Silicon Value Chain
• Thin-Film PV Manufacturing Process
• Comparison Between Thin-Film and Traditional
Crystalline Silicon PV
• CdTe Cell and Module
• CIGS Cell Structure
• Single-Junction Amorphous Silicon Cell Structure
• Multi-Junction Amorphous Silicon (a-Si) Cell
Structure
• Multi-Junction Cell With Gallium Indium
Phosphide Top Cell, Tunnel Junction, Gallium
Arsenide Bottom Cell
• Tandem-Junction Cell
• Dye-Sensitized Solar Cell
• Organic PV Cell Structure
3. maTerials and manuFacTuring
• Batch vs. Continuous (Inline) Production
• Tandem-Junction Amorphous Si Process Flow
• Simplified Process Flow for Roll-to-Roll
Manufacturing of CIGS on
Flexible Substrate
• Roll-to-Roll Thin Film Manufacturing Substrate and
Equipment
• Summary of Thin-Film PV Substrate Materials
• Substrate utilization by Technology
• Closed-Space Sublimation Process used for CdTe
• Deposition Process and Substrate utilized by
Commercial CIGS Manufacturers
• Sputtering Deposition
• Sputtering / Selenization Deposition Process Flow
• CIGS Co-Evaporation Process
• Electroplating Deposition Process
• Nano-Particle Printing using CIGS Ink
• Ion Beam-Assisted Deposition
• CVD Process
• Monolithic Module Integration
• use of Encapsulants in Thin-Film PV
• Rare Materials used in Thin Film Manufacturing
• Cadmium Prices, 2005 – 2012YTD
• Tellurium Prices, 2004 – 2012 YTD
• Projected use of Tellurium in CdTe PV
• Indium Prices, 2004 – 2012 YTD
• Projected use of Indium in CIS/CIGS PV
• Thin-Film Silicon Cell Diagrams
• Global Silane Forecast to 2020 (Production)
• London Silver Prices, 2010 - 2011
• Back Contact use and Cost for Thin-Film Silicon
(Silver vs. Aluminum)
• Projected use of Commodity Materials
• Global Flat Glass Market by Sector
• Appropriate Glass Type for Various PV
Technologies
• Framed Versus Frameless Module Diagrams
• Production Capacity of Manufacturers using
Proprietary Versus Turnkey Equipment Lines
• Estimated BOS Penalty Versus 14.5% Efficient
Multi-c-Si Modules
• List of Turnkey Manufacturing Providers
4. Thin Film perFormance and Technology characTerisTics
• NREL Best Research-Cell Efficiencies
• historical Module and Record Cell Efficiencies
Through 2011
• Efficiency Forecasts for PV Technologies Through
2016
• Theoretical Maximum Cell Efficiency by
Technology Type
• System Cost Assumptions for Calculating BOS
Penalties
• PV System Cost Breakdown and Associated Area-
Related Costs
• Estimated BOS Penalties Based on Efficiency
• BOS Penalty for Modules at a Given Efficiency
• Efficiency Forecasts for PV Technologies
Through 2016
• Empirical Annual Degradation Rates of Various PV
Module Technologies
• Module Degradation by Technology (Glass-Based
Modules), Post Burn-In
• Effect of Temperature on Effective Module
Efficiency
• Solar Spectrum
• Spectral Sensitivity for Crystalline and Amorphous
Silicon Cells
• Thin-Film Solar Modules Can Be More Tolerant
to Shade
• Light Soaking Effect on Various PV Technologies
• Comparison of Thin Film vs. Crystalline Silicon
Performance for 88 Juwi Solar Projects
• Performance of CIGS Versus Crystalline Silicon PV
In-Field
• First-Year Simulated Performance of PV Systems
utilizing Various PV Technologies
• Performance-Adjusted Efficiency and BOS
Penalties for Thin-Film
PV Technologies
• Performance- and Efficiency-Adjusted BOS
Penalties for Three Regions Based on Simulations
• Module Area Footprint by PV Technology
(Based on Current
Module Efficiencies)
• PV Module Weight by Technology
• CIGS Module Weight: Framed Module vs.
Frameless Module
5. Thin Film in 2012: consTrained demand in a suFFocaTing price enVironmenT
• Estimated Thin-Film PV Production by
Technology, 2011
• Estimated Thin Film Production by
Technology, 2009
• Number of Thin Film Suppliers in First Year of
Production by Year through 2012E
• Leading Thin Film Producers, 2011
• Leading Thin Film Producers, 2008
• Thin-Film PV Capacity by Region, 2011
• Global PV Capacity, Production, and Installations,
2007 – 2016E
• Summary of Italian FIT for 2011 -2012

lisT oF Figures
• German PV Installations by Quarter Versus c-Si ASPs
• Diagram of Solyndra Cylindrical Cell
• 2011 c-Si ASPs by Quarter
• Chronology of PV Polysilicon Price Dynamics,
2007 - 2010
• Polysilicon Output vs. Demand, 2008 - 2016
• Polysilicon Contract, Spot, and Cash Costs,
1998 – 2016E
• Cost Breakdown of Vertically Integrated c-Si
Producers, 2010 – 2015E
• Rational, Performance-Adjusted Thin Film ASPs
Based on c-Si Forecasts
• Performance-Adjusted Thin Film ASPs Versus
Industry Weighted Average Costs, 2011 – 2016E
• Performance-Adjusted Thin Film ASPs Versus
Industry Best Costs, 2011 – 2016E
• Installed PV Capacity in China, 2010 – 2016E
• u.S. PV Installations and Global Market Share,
2005 – 2016E
• Global PV Installation Forecast by Region,
2010 – 2016E
• Venture Capital Invested into Thin Film
Manufacturers, 2007 – 2012 YTD
• u.S. Thin-Film PV Manufacturing Forecast,
2010 – 2016E
• First Solar Shipments: Captive Versus Non-Captive,
Q1 2010 – Q4 2012E
• Leading u.S. utility Pipelines by Developer
Through Q1 2012
• Global PV Installations by Region, 2010 – 2016E
• Emerging Markets Installations by Market Segment,
2009 – 2015E
• Estimated PV System Costs for Multi-MW Ground-
Mount Projects, T-Solar vs. Tier 1/2 Chinese c- Si
• Thin Film Production Capacity by Companies With
BIPV Products
• Thin Film Facilities by Production Capacity, 2011
• Thin-Film PV Capacity Expansion Plans
• First Solar ASPs Versus Costs, Q4 2010 – Q4 2011
• First Solar Systems Pipeline
• Solar Frontier Efficiency Roadmap, 2010 - 2014
• Venture Capital Investment Into Thin Film
Manufacturing, 2007 – 2012 YTD
• Venture Capital Investment Into Thin Film
Manufacturing by Manufacturer
• Turnkey CIGS Equipment Manufacturers and
Key Customers
• Efficiency Roadmap for Thin-Film Silicon
• Manufacturing Capacity by Turnkey Equipment
Provider, 2007 - 2012
• Single-Junction a-Si Suppliers
• Tandem-Junction a-Si/μSi Suppliers
• Double- and Triple-Junction a-Si Suppliers
6. manuFacTuring cosTs and compeTiTiVeness
• GTM Research CIGS Cost Model
• Granular Cost Model Breakdown: Absorber Layer
• Summary of Capex for Various Thin Film
Manufacturers
• Chinese Multicrystalline Silicon PV: Cost
Breakdown
• First Solar: Oder Facility Cost Structure, 2012
• CdTe Feedstock Image
• CdTe Feedstock Costs
• Breakdown of CdTe Absorber Layer Costs, 2012
• Indium Sputtering Targets
• CIGS Sputtering Targets Costs, 2011
• Breakdown of CIGS Absorber Layer Composition
• Breakdown of CIGS Absorber Layer Costs, 2012
• Breakdown of Thin-Film Si Absorber Layer
Costs, 2012
• Thin Film Materials Costs, 2012
• Scale Effect on Production Costs
• Direct Employees Versus Thin Film
Manufacturing Capacity
• Reference CdTe Facility Cost Structure, 2012
• Reference CIGS Facility Cost Structure, 2012
• Reference Thin-Film Si Facility Cost Structure, 2012
• Effect of Capex on Module Costs
• Thin-Film Si Costs vs. Efficiency
• CIGS Costs vs. Efficiency
• CdTe Costs vs. Efficiency
• Comparison of Efficiency Effect on Module Costs
by Technology
• Thin-Film Si Costs vs. Scale
• CIGS Costs vs. Production Scale
• CdTe Costs vs. Production Scale
• Comparison of Scale Effect on Thin Film Costs
by Technology
• Thin-Film Si Costs vs. Process Yields
• CIGS Costs vs. Process Yields
• CdTe Costs vs. Process Yields
• Comparison of Process Yield Effects on Thin Film
Costs by Technology
• Thin-Film Si Costs vs. utilization
• CIGS Costs vs. utilization
• CdTe Costs vs. utilization
• CIGS Costs By Facility Region
• Thin-Film Si Costs By Facility Region
• CdTe Costs By Facility Region
• Breakdown of c-Si Shipping Costs by Sea From
China to u.S.
• GTM Research Thin Film Manufacturing Facility
Cost Archetypes
• Archetype and Manufacturer-Specific Efficiency
Roadmaps
• Archetype- and Manufacturer-Specific Process
Yield Roadmaps
• Archetype and Manufacturer-Specific
Miscellaneous Modeling Parameters
• Archetype and Manufacturer-Specific Efficiency
Base Costs (No Labor Component or Scale Effects)
• Archetype and Manufacturer-Specific Weighted
Average Costs
• Chinese c-Si Costs and ASPs, 2010 – 2016E
• Efficiency Forecasts by PV Technology,
2011 – 2016E
• Performance-Adjusted ASPs for Thin-Film PV by
Technology
• Performance-Adjusted Thin-Film PV ASPs Versus
Weighted Average Costs by Technology
• Performance-Adjusted Thin-Film PV ASPs Versus
Best in-Market Costs by Technology
• Average Gross Margins by PV Technology,
Assuming Full utilization
• Best-in-Market Gross Margins by PV Technology,
Assuming Full utilization
• Thin Film Cost Roadmap by Technology,
2010 – 2016E
• Required Module Costs for First Solar, 2012
• Required Module Costs for First Solar, 2013

lisT oF Figures
• Required Module Costs for Solar Frontier, 2012
• Required Module Costs for Solar Frontier, 2013
• Required Module Costs for Sharp Thin-Film Si, 2012
• Required Module Costs for Sharp Thin-Film Si, 2016
• Estimated Costs for First Solar’s Malaysia Facility,
2010 – 2016E
• Estimated Costs for First Solar’s Vietnam Facility,
2010 – 2016E
• First Solar Production Capacity Versus Production
Guidance, 2012E
• Estimated Costs for First Solar’s Germany Facility at
Full Versus half utilization
• Estimated Costs for First Solar Germany Facility,
2010 – 2016E
• Estimated Costs of Abound Solar, 2010 – 2016E
• Abound Solar Cost Versus ASP Targets,
2010 – 2016E
• Solar Frontier’s Estimated Costs, 2010 – 2016E
• Solar Frontier Versus First Solar Costs, 2010 – 2012E
• MiaSolé Estimated Costs, 2010 – 2016E
• MiaSolé’s Estimated Costs at Various
utilizations, 2012
• MiaSolé’s Estimated Costs at Various
utilizations, 2013
• Stion’s Estimated Costs at Full utilization,
2010 – 2016E
• TSMC Estimated Costs at Full utilization,
2010 – 2016E
• Nanosolar’s Estimated Costs, 2010 – 2012E
• Various CIGS Manufacturers’ Estimated
Costs, 2012E
• Various CIGS Manufacturers’ Estimated Costs at
Scale, 2014E
• SoloPower’s Estimated Costs, 2012E – 2014E
• Oerlikon Solar’s Technical Specifications for
Generation 2 ThinFab
• Astronergy’s Estimated Costs, 2012E
• Oerlikon/TEL Eu/NA/JP Estimated Costs,
2010 – 2016E
• Sharp Solar’s Estimated Costs at Various
Scales, 2016E
• NexPower’s Estimated Costs, 2010-2016E
• hanergy’s Estimated Costs, 2010-2016E
7. markeTs and applicaTions
• 5-kW Amorphous Silicon Residential Rooftop
Installation, Germany
• Thin Film Market Share in California CSI Residential
Program, 2010 - 2011
• PV Module Power Density, 2011 vs. 2016
• Global PV Installations by Market Segment,
2009 – 2015E
• Global PV Residential Installations, 2009 – 2015E
• 900 kW Tandem-Junction Commercial Rooftop
Installation, Japan
• Global PV Commercial Installations, 2009 – 2015E
• 21 MW CdTe utility-Scale Project, Nevada
• utility PV-Targeted Product Lines
• u.S. utility Solar Projects in Operation by
Technology
• u.S. Contracted utility Pipeline by Technology
• 10-kW CIGS BIPV Façade
• Rural Off-Grid PV System
• CIGS-Based Portable Solar Charger
• Feasibility of PV Technology Deployment by End-
Application
8. manuFacTuring capaciTy and producTion
• Average Ramped Capacity by Technology, 2010
– 2016E
• Average Ramped Thin-Film PV Production Capacity
by Region, 2010 – 2016E
• Top Thin-Film PV Producers by Average Ramped
Capacity, 2010 – 2016E
9. Thin Film demand
• Thin Film Production by Technology, 2002 - 2011
• Thin Film Market Growth Versus Polysilicon Spot
Pricing, 2003 - 2011
• Capacity utilization by Technology, 2010 - 2011
• Required Components of Thin-Film Production/
Demand Model
• Thin Film Production by Technology, Base Forecast,
2010 – 2016E
• Thin Film Production by Technology, Low Forecast,
2010 – 2016E
• Thin Film Production by Technology, high Forecast,
2010 – 2016E
• Top Ten Thin Film Producers, 2008
• op Ten Thin Film Producers, 2011
• Top Ten Thin Film Producers, 2012
• Top Ten Thin Film Producers, 2014
• Estimated Thin Film Production, 2010 – 2016E
• Thin-Film Module Market Size, 2010 – 2016E
($ Million)
• Thin-Film PV Market Value, 2010 – 2016E
10. conclusions
• Estimated Thin Film Production, 2010 – 2016E
• Estimated Thin Film Market Value, 2010 – 2016E
• Thin-Film PV Market Value, 2010 – 2016E
• Top 10 Thin Film Companies by Production, 2014E
• historical and Forecasted Thin Film PV Production,
2002 – 2016E

sample analysis and Figures
With solar module prices dropping by over 50 percent in the past year, thin-film PV manufacturers are in a fight for survival. In 2011, the technology’s global market share eroded to 11 percent from its peak of nearly 20 percent in 2009 -- a year when thin film’s cost advantages in relation to rival crystalline silicon (c-Si) technologies made it the darling of the solar industry. Today however, thin film is trapped in a fiercely competitive photovoltaics (PV) supply market, as oversupply has brought sub-$1 per watt c-Si to global markets.
Thin-Film pV base ForecasT markeT Value and producTion, 2010 – 2016e
perFormance-adjusTed asps For Thin Film pV
In this figure, based on technology reference efficiencies and best regional performance benefits, we chart the necessary ASP levels for thin films to remain competitive with crystalline silicon modules. Note that by 2015 and 2016, a CIGS module at 15% efficiency could actually charge a premium against multicrystalline silicon modules due to better performance. The challenge for thin film manufacturers will be surviving the deep cost declines in the past year and upcoming in 2012. Furthermore, the target ASPs are dependent on meeting efficiency roadmaps, which has proven difficult for some suppliers.

paymenT meThod
Please send an invoice
Thin Film 2012–2016 - Single Site License $2995
Thin Film 2012–2016 - Enterprise License $5395
* For shipping outside the U.S, a shipping fee of $100.00 will be added to the order.
Name Company
Street
City State Country Zip/Postal Code
Phone Number Email
Credit Card Number Expiration CW
Signature
Total (including shipping) to be charged $
co
nT
ac
T:
A Greentech Media Company
mj shiao
Senior Analyst, Solar Markets
+1 617 500 4956
justin Freedman
Director of Research Sales
+1 617 500 6243
To place your order, fax this form to: Ken Marini, 781-846-0391. To purchase a bundle, please contact a member of our sales team, contacts below, or visit www.gtmresearch.com.
reporT order Form
For more information, please visit www.greentechmedia.com/research/report/thin-film-2012-2016
preFerred FormaT
Hardcopy (plus $100)
PDFCredit Card: Amex Mastercard Visa
Thin Film 2012–2016: Technologies, Markets and Strategies for Survival – MJ Shiao, Senior Analyst, Solar Markets | GTM Research