studentsrepo.um.edu.mystudentsrepo.um.edu.my/10758/2/Muhammad_Aslam_–_Thesis.pdf · iii ABSTRACT...
292
MECHANICAL PROPERTIES AND STRUCTURAL PERFORMANCE OF SUSTAINABLE LIGHTWEIGHT AGGREGATE CONCRETE USING BLENDED OIL PALM BIO-PRODUCTS MUHAMMAD ASLAM FACULTY OF ENGINEERING UNIVERSITY OF MALAYA KUALA LUMPUR 2017 University of Malaya
Transcript of studentsrepo.um.edu.mystudentsrepo.um.edu.my/10758/2/Muhammad_Aslam_–_Thesis.pdf · iii ABSTRACT...
MECHANICAL PROPERTIES AND STRUCTURAL PERFORMANCE OF SUSTAINABLE LIGHTWEIGHT
AGGREGATE CONCRETE USING BLENDED OIL PALM BIO-PRODUCTS
MUHAMMAD ASLAM
FACULTY OF ENGINEERING
UNIVERSITY OF MALAYA KUALA LUMPUR
2017
Univers
ity of
Mala
ya

MECHANICAL PROPERTIES AND STRUCTURAL PERFORMANCE OF SUSTAINABLE LIGHTWEIGHT
AGGREGATE CONCRETE USING BLENDED OIL PALM BIO-PRODUCTS
MUHAMMAD ASLAM
THESIS SUBMITTED IN FULFILMENT OF THE
REQUIREMENTS FOR THE DEGREE OF DOCTOR OF PHILOSOPHY
FACULTY OF ENGINEERING UNIVERSITY OF MALAYA
KUALA LUMPUR
2017
Univers
ity of
Mala
ya

ii
UNIVERSITY OF MALAYA
ORIGINAL LITERARY WORK DECLARATION
Name of Candidate: Muhammad Aslam
Registration/Matric No: KHA120129
Name of Degree: Doctor of Philosophy
Title of Thesis:
Mechanical Properties and Structural Performance of Sustainable Lightweight
Aggregate Concrete using Blended Oil Palm Bio-products
Field of Study: Structural Engineering & Materials
I do solemnly and sincerely declare that: (1) I am the sole author/writer of this Work; (2) This Work is original; (3) Any use of any work in which copyright exists was done by way of fair dealing
and for permitted purposes and any excerpt or extract from, or reference to or reproduction of any copyright work has been disclosed expressly and sufficiently and the title of the Work and its authorship have been acknowledged in this Work;
(4) I do not have any actual knowledge nor do I ought reasonably to know that the making of this work constitutes an infringement of any copyright work;
(5) I hereby assign all and every rights in the copyright to this Work to the University of Malaya (“UM”), who henceforth shall be owner of the copyright in this Work and that any reproduction or use in any form or by any means whatsoever is prohibited without the written consent of UM having been first had and obtained;
(6) I am fully aware that if in the course of making this Work I have infringed any copyright whether intentionally or otherwise, I may be subject to legal action or any other action as may be determined by UM.
Candidate’s Signature Date:
Subscribed and solemnly declared before,
Witness’s Signature Date:
Name:
Designation:
Univers
ity of
Mala
ya

iii
ABSTRACT
A number of materials have been proposed for producing structural grade of lightweight
concretes. However, the main concerns of civil engineers and researchers to develop a
proper structural lightweight concrete are cost effective, being environmental friendly and
durable, as well as behaves satisfactorily under structural applications. Although several
types of artificial lightweight aggregates are available to produce structural lightweight
concrete, however, these types of aggregates require huge amount of energy in their
preparation. Therefore, use of industrial waste as an alternative lightweight aggregate to
build environmentally sustainable structures has several practical and economic
advantages. Oil palm shell (OPS) is a solid waste material from the palm oil industry that
has been successfully used to produce high strength lightweight concrete. However, this
type of concrete is very sensitive to a poor curing environment. In addition, OPS concrete
with normal and high strengths have relatively high drying shrinkage at early and later
ages. Therefore, to produce a cleaner and greener concrete, this study tried to resolve
disadvantages of OPS lightweight concrete using another type of lightweight aggregate
waste origin from palm oil industry namely oil-palm-boiler clinker (OPBC). Therefore, a
new high strength lightweight concrete containing blended coarse lightweight aggregates
was developed and its mechanical and time-dependent properties as well as structural
performance in term of shear behaviour of simply supported reinforced concrete beams
were investigated. It was found from this study that use of blended OPS and OPBC can
produce a workable high strength lightweight concrete with a 28-day compressive
strength in the range of 40 to 53 MPa and dry density less than 2000 kg/m3. The individual
use of OPBC as coarse aggregate can produce high strength semi-lightweight concrete
with 28-day compressive strength of 60 MPa and dry density of 2050 kg/m3. Test results
showed that when OPS concrete is very sensitive to poor curing and minimum period of
7 days moist curing is recommended for this concrete, the sensitivity of compressive
Univers
ity of
Mala
ya

iv
strength of concrete to the lack of curing is significantly reduced when OPS was partially
replaced with OPBC. The substitution of OPS with OPBC significantly improved the
splitting tensile and flexural strengths as well as the modulus of elasticity of the concretes.
Concretes containing blended coarse lightweight aggregates of OPS and OPBC showed
initial and final water absorption of less than 3% and 10%, respectively, and can be
considered as good quality concrete. Drying shrinkage strain value of OPS and OPS-
OPBC blended coarse concretes is found to be similar at early ages. However, the long-
term shrinkage of blended coarse concretes was significantly lower than OPS concrete.
Under 7-day initial moist curing condition, OPS concrete showed significantly higher
drying shrinkage of about 47%, 41% and 39% compared to the shrinkages of normal
weight, artificial lightweight and OPBC concretes at one year age. In structural
performance, OPS reinforced concrete beams without shear links showed lower ultimate
load carrying capacity compared to the blended coarse lightweight concrete beams.
However, higher substitution of OPBC in OPS concrete with high grade concrete
significantly improved the structural performance and failure nature of the beams.
Univers
ity of
Mala
ya
v
ABSTRAK
Beberapa bahan telah dicadangkan untuk menghasilkan konkrit ringan. Walau
bagaimanapun, kebimbangan utama jurutera awam dan penyelidik adalah untuk
membangunkan konkrit struktur ringan yang betul dimana haruslah kos efektif, mesra
alam, tahan lama, dan secara khususya bersifat memuaskan di bawah struktur aplikasi.
Walaupun, beberapa jenis agregat buatan ringan boleh didapati tetapi ia memerlukan
sejumlah tenaga yang besar untuk penyediaan dan menggunakan sejumlah wang yang
besar. Oleh itu, penggunaan sisa industri sebagai agregat alternatif untuk membina
struktur alam sekitar yang mampan mempunyai beberapa kelebihan praktikal dan
ekonomi. Tempurung kelapa sawit (OPS) adalah bahan buangan pejal daripada industri
minyak sawit yang telah berjaya digunakan untuk menghasilkan konkrit ringan tahan
lama berkuatan tinggi. Walau bagaimanapun, jenis konkrit ini adalah sangat sensitif
kepada pengawetan alam sekitar yang kurang. Tanbahan pula, konkrit tempurung kelapa
sawit yang normal berkuatan tinggi mempunyai pengecutan kering yang agak tinggi pada
peringkat awal dan seterusnya. Oleh itu, untuk menghasilkan konkrit yang lebih bersih
dan hijau, kajian ini menggunakan dua bahan buangan daripada industri minyak sawit
sebagai agregat kasar; untuk membangunkan struktur konkrit ringan berkuatan tinggi
serta sifat-sifat mekanikal dan bergantung kepada masa, dan sifat struktur telah disiasat.
Kajian mendapati bahawa penggunaan bahan-bahan campuran seperti tempurung kelapa
sawit dan minyak sawit dandang klinker boleh menghasilkan konkrit ringan berkuatan
tinggi kebolehkerjaan tinggi dan kekuatan mampatan dalam 28 hari kira-kira 40 hingga
53 MPa dan ketumpatan kering kurang daripada 2000 kg/m3. Penggunaan individu
minyak sawit dandang klinker sebagai agregat boleh menghasilkan kekuatan konkrit
semi-ringan yang tinggi dengan 28 hari kekuatan mampatan 57 MPa dan ketumpatan
kering 2050 kg/m3. Walau bagaimanapun, konkrit tempurung kelapa sawit adalah sangat
sensitif kepada pengawetan yang kurang dan tempoh minimum 7 hari pengawetan lembap
Univers
ity of
Mala
ya

vi
adalah disyorkan. Kepekaan kekuatan mampatan konkrit tempurung kelapa sawit
kekurangan pengawetan semakin berkurangan disebabkan oleh penggunaan agregat
sebati. Semua konkrit sebati masing-masing menunjukkan penyerapan air awal dan akhir
kurang daripada 3% dan 10%, boleh dianggap konkrit yang baik. Penggantian tempurung
kelapa sawit dengan minyak sawit-dandang klinker dengan ketara meningkatkan
tegangan belahan dan kekuatan lenturan dan modulus keanjalan konkrit. Lenturan kepada
nisbah kekuatan mampatan dan modulus keanjalan konkrit sebati berada dalam julat berat
normal dan konkrit agregat ringan berkekuatan tinggi. Pengecutan pengeringan pal
minyak kelapa dan konkrit sebati didapati sama pada peringkat awal. Walau
bagaimanapun, pengecutan jangka panjang konkrit sebati adalah jauh lebih rendah
berbanding konkrit tempurung kelapa sawit. Dengan cara lain, sumbangan minyak sawit
dandang klinker dalam konkrit tempurung kelapa sawit dengan pengurangan kecil air
kepada nisbah simen mengurangkan pengecutan kering kira-kira 40% berbanding dengan
konkrit tempurung kelapa sawit kawalan. Di bawah 7 hari pengawetan lembap, konkrit
tempurung kelapa sawit menunjukkan pengecutan pengeringan jauh lebih tinggi kira-
kira 47%, 41% dan 39% berbanding dengan kesusutan berat normal, buatan ringan dan
konkrit minyak sawit dandang klinker. Dari segi prestasi struktur, tulang rasuk konkrit
tempurung kelapa sawit menunjukkan kapasiti beban yang lebih rendah daripada rasuk
konkrit ringan sebati. Walau bagaimanapun, penggantian yang lebih tinggi bagi minyak
sawit-dandang klinker dalam konkrit tempurung kelapa sawit dengan konkrit gred tinggi
dengan ketara meningkatkan prestasi struktur dan sifat kegagalan rasuk.
Univers
ity of
Mala
ya
vii
ACKNOWLEDGMENTS
I wish to express my deepest gratitude to my supervisors Dr Payam Shafigh and Professor
Ir Dr Mohd Zamin Jumaat for their time, advice, encouragement, and expertise during
the research. This thesis would not have been possible without their elaborate comments,
guidance and full encouragement at various stages.
I would also like to thank my best friend Engr Waqar Ahmad Unar and the laboratory
assistant Mr. Sreedharan for their cooperation in providing and preparing the required
laboratory equipment.
Special thank is extended to the financial support of University of Malaya, High Impact
Research Grant (HIRG) No. UM.C/625/1/HIR/MOHE/ENG/36 (16001-00-D000036),
“Strengthening Structural Elements for Load and Fatigue”.
Every challenging work needs self-efforts as well as guidance of elders especially those
who were very close to our heart. My humble effort I dedicate to sweet and loving;
FATHER & MOTHER
Whose affection, love, encouragement, and prays of day and nights make me able to
get such success and honor.
MY WIFE & SON (ARSU), UNCLE, BROTHERS & SISTERS
Who supported me each step of the way, and for their extreme love,
Along with all hardworking and Respected
TEACHERS
Univers
ity of
Mala
ya
viii
TABLE OF CONTENTS
Abstract ............................................................................................................................ iii
Abstrak .............................................................................................................................. v
Acknowledgments ........................................................................................................... vii
Table of Contents ........................................................................................................... viii
List of Figures ................................................................................................................ xvi
List of Tables.................................................................................................................. xxi
List of Symbols and Abbreviations .............................................................................. xxiii
INTRODUCTION .................................................................................. 1
1.1 Introduction.............................................................................................................. 1
1.2 Lightweight Concrete .............................................................................................. 2
1.3 Lightweight Aggregates........................................................................................... 3
1.4 Problem Statement ................................................................................................... 4
1.5 Objectives of the Research ...................................................................................... 5
1.6 Scope of the Study ................................................................................................... 5
1.7 Thesis Layout........................................................................................................... 6
LITERATURE REVIEW ...................................................................... 8
2.1 Introduction.............................................................................................................. 8
2.2 Sustainable Development ...................................................................................... 11
2.2.1 Cleaner Production ................................................................................... 12
2.2.2 Environmental Sustainability Assessment ............................................... 14
2.3 Oil-palm-boiler Clinker (OPBC) as Aggregate ..................................................... 17
2.3.1 Origin of OPBC ........................................................................................ 17
2.3.2 Physical Properties of OPBC ................................................................... 19
Univers
ity of
Mala
ya

ix
2.3.2.1 Specific gravity ......................................................................... 19
2.3.2.2 Sieve analysis of OPBC ............................................................ 21
2.3.2.3 Shape thickness and texture ...................................................... 22
2.3.2.4 Bulk density ............................................................................... 23
2.3.2.5 Water absorption ....................................................................... 24
2.3.3 Comparison of the Chemical Composition of OPBC with Other LWAs . 25
2.3.4 Mechanical Properties of OPBC Compared with Other LWAs ............... 26
2.4 Mix Design for OPBC Concrete ............................................................................ 28
2.5 Physical Properties of OPBC Concrete ................................................................. 30
2.5.1 Workability ............................................................................................... 30
2.5.2 Plastic Density .......................................................................................... 32
2.5.3 Hardened Density of OPBC Concrete ...................................................... 32
2.6 Mechanical Properties of OPBC Concrete ............................................................ 35
2.6.1 Compressive Strength ............................................................................... 35
2.6.2 Modulus of Rupture .................................................................................. 38
2.6.3 Splitting Tensile Strength ......................................................................... 40
2.6.4 Modulus of Elasticity ............................................................................... 42
2.7 Structural Behaviour of OPBC Concrete ............................................................... 44
2.7.1 Flexural Behaviour ................................................................................... 44
2.7.2 Shear Behaviour ....................................................................................... 46
2.7.3 Behaviour of OPBC Concrete under Prestressing .................................... 48
2.8 Conclusions ........................................................................................................... 50
BENEFITS OF USING BLENDED WASTE COARSE
LIGHTWEIGHT AGGREGATES IN STRUCTURAL LIGHTWEIGHT
AGGREGATE CONCRETE ....................................................................................... 53
3.1 Introduction............................................................................................................ 53
Univers
ity of
Mala
ya

x
3.2 Experimental Programme ...................................................................................... 57
3.2.1 Materials ................................................................................................... 57
3.2.1.1 Cement ...................................................................................... 57
3.2.1.2 Aggregate .................................................................................. 57
3.2.1.3 Super-plasticizer (SP) ................................................................ 58
3.2.1.4 Water used ................................................................................. 59
3.2.2 Mix Proportions ........................................................................................ 59
3.2.3 Curing Conditions .................................................................................... 59
3.2.4 Test Methods ............................................................................................ 60
3.3 Results and Discussion .......................................................................................... 61
3.3.1 Slump ........................................................................................................ 61
3.3.2 Density ...................................................................................................... 62
3.3.3 Compressive Strength ............................................................................... 63
3.3.3.1 Under continuous moist curing ................................................. 63
3.3.3.2 Under air-drying ........................................................................ 65
3.3.3.3 Under partial early curing ......................................................... 68
3.3.4 Splitting Tensile Strength ......................................................................... 70
3.3.5 Flexural Strength ...................................................................................... 72
3.3.6 Modulus of Elasticity ............................................................................... 74
3.3.7 Water Absorption ..................................................................................... 76
3.4 Conclusions ........................................................................................................... 77
HIGH STRENGTH LIGHTWEIGHT AGGREGATE CONCRETE
USING BLENDED COARSE LIGHTWEIGHT AGGREGATE ORIGIN FROM
PALM OIL INDUSTRY ............................................................................................... 79
4.1 Introduction............................................................................................................ 79
4.2 Experimental Details ............................................................................................. 81
Univers
ity of
Mala
ya
xi
4.2.1 Materials Used .......................................................................................... 81
4.3 Mix Proportions and Procedure ............................................................................. 83
4.4 Results and Discussion .......................................................................................... 84
4.4.1 Workability and Density .......................................................................... 84
4.4.2 Compressive Strength ............................................................................... 85
4.4.3 Splitting Tensile and Flexural Strengths .................................................. 87
4.4.4 Modulus of Elasticity ............................................................................... 88
4.4.5 Water Absorption ..................................................................................... 89
4.4.6 Drying Shrinkage ..................................................................................... 90
4.5 Conclusions ........................................................................................................... 93
MANUFACTURING HIGH-STRENGTH LIGHTWEIGHT
AGGREGATE CONCRETE USING OIL PALM SHELL IN A SEMI-
LIGHTWEIGHT OIL-PALM-BOILER CLINKER CONCRETE ......................... 95
5.1 Introduction............................................................................................................ 95
5.2 Experimental Investigation .................................................................................... 98
5.2.1 Materials Used .......................................................................................... 98
5.2.2 Mix Proportions ........................................................................................ 99
5.2.3 Test Methods .......................................................................................... 100
5.3 Test Results and Discussion ................................................................................ 100
5.3.1 Density .................................................................................................... 100
5.3.2 Compressive Strength ............................................................................. 102
5.3.3 Stress-strain Relationship of OPBC-OPS Concretes .............................. 106
5.3.4 Splitting Tensile Strength ....................................................................... 109
5.3.5 Flexural Strength .................................................................................... 112
5.3.6 Modulus of Elasticity ............................................................................. 115
5.3.7 Water Absorption ................................................................................... 118
Univers
ity of
Mala
ya

xii
5.4 Conclusions ......................................................................................................... 119
DRYING SHRINKAGE BEHAVIOUR OF STRUCTURAL
LIGHTWEIGHT AGGREGATE CONCRETE CONTAINING BLENDED OIL-
PALM BIO-PRODUCTS ........................................................................................... 121
6.1 Introduction.......................................................................................................... 121
6.2 Experimental Program ......................................................................................... 125
6.2.1 Materials Used ........................................................................................ 125
6.2.2 Concrete Mixing and Mix Proportions ................................................... 126
6.2.3 Curing Conditions .................................................................................. 129
6.2.4 Experimental Procedure ......................................................................... 129
6.3 Results and Discussion ........................................................................................ 130
6.3.1 Compressive Strength ............................................................................. 130
6.3.2 Specific Strength .................................................................................... 132
6.3.3 Drying Shrinkage Development ............................................................. 134
6.3.3.1 Drying shrinkage of uncured specimens ................................. 134
6.3.3.2 Drying shrinkage of 7-day cured specimens ........................... 144
6.3.3.3 Effect of curing condition ....................................................... 149
6.4 Conclusions ......................................................................................................... 152
EFFECT OF COARSE LIGHTWEIGHT AGGREGATE TYPE ON
THE DRYING SHRINKAGE DEVELOPMENT OF CONCRETE ..................... 154
7.1 Introduction.......................................................................................................... 154
7.2 Experimental Programme .................................................................................... 157
7.2.1 Materials ................................................................................................. 157
7.2.2 Mix Proportions and Mixing Procedure ................................................. 158
7.2.3 Curing Conditions .................................................................................. 159
Univers
ity of
Mala
ya
xiii
7.2.4 Specimens Size and Testing Procedure .................................................. 160
7.3 Results and Discussions ....................................................................................... 160
7.3.1 Drying Shrinkage Development ............................................................. 160
7.3.1.1 Drying shrinkage of uncured specimens ................................. 160
7.3.1.2 Drying shrinkage of cured specimens ..................................... 166
7.3.2 Effect of Curing Condition on the Drying Shrinkage ............................ 167
7.4 Comparison of Drying Shrinkage Strains with Prediction Model ....................... 169
7.5 Conclusions ......................................................................................................... 172
PREDICTION MODELS FOR DRYING SHRINKAGE IN PALM
OIL BY-PRODUCT LIGHTWEIGHT CONCRETES ........................................... 174
8.1 Introduction.......................................................................................................... 174
8.2 Experimental Program ......................................................................................... 176
8.2.1 Materials and Mix Proportions ............................................................... 176
8.2.2 Test Methods and Specimen Sizes ......................................................... 178
8.3 Results and Discussions ....................................................................................... 179
8.3.1 Shrinkage Prediction Models ................................................................. 179
8.3.1.1 ACI-209R shrinkage model .................................................... 179
8.3.1.2 Eurocode shrinkage model ...................................................... 182
8.3.1.3 Model Code 2010 shrinkage model ........................................ 184
8.3.1.4 CEB/FIP90 shrinkage model ................................................... 186
8.3.1.5 AASHTO-LRFD shrinkage model as modified by Shams and
Kahn (2000) ............................................................................. 188
8.3.1.6 Gardner and Lockman (GL2000) shrinkage model ................ 189
8.3.1.7 Australian Standards model for shrinkage prediction ............. 191
8.3.1.8 Japan Standards 3600 shrinkage prediction model ................. 193
8.3.1.9 Sakata shrinkage prediction model ......................................... 195
Univers
ity of
Mala
ya

xiv
8.3.1.10 Bazant and Baweja shrinkage model ...................................... 196
8.3.2 Accuracy of the Prediction Models ........................................................ 198
8.4 Conclusions ......................................................................................................... 203
SHEAR BEHAVIOUR OF PALM OIL BY-PRODUCT
LIGHTWEIGHT AGGREGATE CONCRETE BEAMS WITHOUT SHEAR
REINFORCEMENT ................................................................................................... 205
9.1 Introduction.......................................................................................................... 205
9.2 Experimental Programme .................................................................................... 208
9.2.1 Materials ................................................................................................. 208
9.2.2 Mix Proportions ...................................................................................... 209
9.2.3 Preparation of Specimens ....................................................................... 211
9.2.4 Instrumentation and Testing ................................................................... 212
9.3 Results and Discussions ....................................................................................... 213
9.3.1 Structural Behaviour ............................................................................... 213
9.3.1.1 OPS concrete beams with different grades.............................. 213
9.3.1.2 OPS-OPBC concrete beams with different grades .................. 214
9.3.1.3 Comparison of structural behaviour between OPSC and OPS-
OPBC concrete beams ............................................................. 216
9.3.2 Shear Behaviour of Beams ..................................................................... 219
9.3.3 Cracking Behaviour ................................................................................ 220
9.3.4 Failure Modes ......................................................................................... 225
9.3.5 Deflection ............................................................................................... 226
9.3.6 Comparison of Experimental and Predicted Shear Strengths ................ 227
9.4 Conclusions ......................................................................................................... 231
CONCLUSIONS AND RECOMMENDATIONS ......................... 233
Univers
ity of
Mala
ya
xv
10.1 Conclusions ......................................................................................................... 233
10.1.1 Workability ............................................................................................. 233
10.1.2 Density .................................................................................................... 233
10.1.3 Compressive Strength ............................................................................. 234
10.1.4 Effect of Curing Regimes on Compressive Strength ............................. 234
10.1.5 Splitting Tensile Strength ....................................................................... 235
10.1.6 Flexural Strength .................................................................................... 235
10.1.7 Specific Strength .................................................................................... 236
10.1.8 Modulus of Elasticity ............................................................................. 236
10.1.9 Ductility Performance ............................................................................ 237
10.1.10 Water Absorption ................................................................................... 237
10.1.11 Drying Shrinkage ................................................................................... 237
10.1.12 Structural Performance ........................................................................... 240
10.2 Recommendations for Future .............................................................................. 241
References ..................................................................................................................... 242
List of Publications and Papers Presented .................................................................... 262
Univers
ity of
Mala
ya
xvi
LIST OF FIGURES
Figure 2.1: Sustainability of the manufacturing process of the palm oil industry .......... 12
Figure 2.2: Methodology of the cleaner production........................................................ 14
Figure 2.3: The stages of Life cycle assessment ............................................................. 15
Figure 2.4: Oil palm bio-products in Malaysia (millions of tons per year) .................... 18
Figure 2.5: Chart of extraction process of oil-palm-boiler clinkers ................................ 19
Figure 2.6: Particle size distribution of the OPBC compared with other LWA reported in the literature .................................................................................................................... 22
Figure 2.7: OPBC aggregates: a) OPBC big lumps, b) Prepared OPBC for concrete .... 23
Figure 2.8: Compressive strengths of OPBC concrete at different w/c ratios ................ 38
Figure 3.1: Oil palm shell (left) and oil-palm-boiler clinker (right) ............................... 58
Figure 3.2: Relationship between density and OPBC content ........................................ 63
Figure 3.3: Compressive strength development of concrete ........................................... 64
Figure 3.4: Surface texture of OPS and OPBC aggregates with mortar matrix .............. 65
Figure 3.5: The relationship between compressive strength of OPS-OPBC concrete with and without curing and comparison with OPS concrete containing silica fume (OPS-SF), normal concrete containing silica fume (NC-SF), OPS concrete containing fly ash (OPS-FA) and OPS concrete containing GGBFS (OPS-GGBFS) ............................................ 67
Figure 3.6: Experimental and theoretical splitting tensile strength of all concrete mixes ......................................................................................................................................... 72
Figure 3.7: Experimental and theoretical flexural strength results of all concrete mixes ......................................................................................................................................... 74
Figure 3.8: Relationship between OPBC content and water absorption ......................... 77
Figure 4.1: Oil palm shell (left) and oil-palm-boiler clinker (right) ............................... 82
Figure 4.2: Grading of OPS and OPBC aggregates ........................................................ 82
Figure 4.3: Development of compressive strength ......................................................... 86
Figure 4.4: Water absorption of concrete mixes ............................................................. 90
Univers
ity of
Mala
ya
xvii
Figure 4.5: Drying shrinkage strain development of concretes ...................................... 93
Figure 5.1: Relationship between density, percentage substitution of OPS and concrete weight reduction (%) ..................................................................................................... 101
Figure 5.2: The relationship between the dry density and 28-day compressive strength of OPBC-OPS mixes and comparison with OPS concretes (OPSC); palm oil clinker concrete containing OPBC as coarse and fine; high strength lightweight concrete containing scoria aggregate; volcanic pumice lightweight concrete and coconut shell concretes ............ 102
Figure 5.3: Development of compressive strength of the concrete mixes .................... 103
Figure 5.4: The relationship between early ages and 28-day compressive strength of all mixes and comparisons with OPS lightweight concretes; scoria lightweight concrete; and coconut shell lightweight concretes .............................................................................. 104
Figure 5.5: 28-day compressive strength with and without curing ............................... 105
Figure 5.6: Stress-strain curves for the prepared concrete mixes ................................. 107
Figure 5.7: Relationship between the 28-day compressive strength and strains at peak stress and comparison with predicted values ................................................................ 109
Figure 5.8: Relationship between the splitting tensile strength and the substitution of OPS ....................................................................................................................................... 110
Figure 5.9: Experimental and predicted splitting tensile strength of concretes ............ 112
Figure 5.10: Relationship between the flexural strength and the substitution of OPS . 113
Figure 5.11: Experimental and predicted flexural strength results of the concretes ..... 115
Figure 5.12: Relationship between the modulus of elasticity and 28-day compressive strength .......................................................................................................................... 117
Figure 5.13: Relationship between the modulus of elasticity and contribution of OPS in OPBC ............................................................................................................................ 117
Figure 5.14: Relationship between water absorption and the OPS content .................. 119
Figure 6.1: The grading of the aggregates as per limits specified by ASTM C-33 ...... 126
Figure 6.2: Oil palm shell (left) and oil-palm-boiler clinker (right) ............................. 126
Figure 6.3: The image of the measurement of drying shrinkage .................................. 130
Figure 6.4: 28-day compressive strength of concrete mixes ......................................... 132
Univers
ity of
Mala
ya
xviii
Figure 6.5: Specific strength of concrete mixes ............................................................ 133
Figure 6.6: Development of drying shrinkage of set (1) concrete mixes ...................... 135
Figure 6.7: Development of dying shrinkage of set (2) concrete mixes ....................... 136
Figure 6.8: Development of dying shrinkage of both sets mixes .................................. 137
Figure 6.9: 234-days age shrinkage versus the replacement of OPS by OPBC aggregates ....................................................................................................................................... 142
Figure 6.10: Drying shrinkage and OPBC content versus the w/c ratio ....................... 143
Figure 6.11: Drying shrinkage of OPS-OPBC mixtures after 7 days curing ................ 145
Figure 6.12: Drying shrinkage of OPS-OPBC mixtures at reduced water/cement ratios ....................................................................................................................................... 146
Figure 6.13: Development of dying shrinkage of both set mixes under 7-day curing .. 147
Figure 7.1: Types of coarse aggregates (a) Oil-palm-boiler clinker (OPBC), (b) Crushed granite, (c) Oil palm shell (OPS) and (d) Lightweight expanded clay aggregate (LECA) ....................................................................................................................................... 158
Figure 7.2: Development of drying shrinkage strains under air-drying condition ........ 162
Figure 7.3: Scanning Electronic Microscopic image of the aggregates ........................ 165
Figure 7.4: A micro-cracks occurred during the drying of OPS concrete .................... 166
Figure 7.5: Development of drying shrinkage strains under 7-days moist curing ........ 167
Figure 7.6: Development of drying shrinkage with average prediction model results under air-drying condition ....................................................................................................... 171
Figure 7.7: Development of drying shrinkage with average predicted results under 7-day moist cuing condition .................................................................................................... 172
Figure 8.1: Development of the drying shrinkage (Experimental vs. average ACI209R (2008) prediction).......................................................................................................... 182
Figure 8.2: Development of drying shrinkage (Experimental and average EN1992 (2010) prediction) ..................................................................................................................... 184
Figure 8.3: Development of drying shrinkage (Experimental and average MC2010 (2011) prediction) ..................................................................................................................... 186
Univers
ity of
Mala
ya

xix
Figure 8.4: Development of drying shrinkage (Experimental and average CEB/FIP90 (2001) prediction).......................................................................................................... 188
Figure 8.5: Development of drying shrinkage (Experimental and average AASHTO-LRFD (Shams & Kahn, 2000) prediction) .................................................................... 189
Figure 8.6: Development of drying shrinkage (Experimental and average GL2000 predictions) .................................................................................................................... 191
Figure 8.7: Development of drying shrinkage (Experimental and AS3600 model predictions) .................................................................................................................... 193
Figure 8.8: Development of drying shrinkage (Experimental and average JSCE3600 model predictions) ......................................................................................................... 194
Figure 8.9: Development of drying shrinkage (Experimental and average SAK model predictions) .................................................................................................................... 196
Figure 8.10: Development of drying shrinkage (Experimental and average B3 model predictions) .................................................................................................................... 198
Figure 8.11: Comparison of drying shrinkage of OPS concrete (mix P) to the prediction models ........................................................................................................................... 199
Figure 8.12: Comparison of drying shrinkage of OPS-OPBC concrete (mix C30) to the prediction models .......................................................................................................... 200
Figure 8.13: Comparison of drying shrinkage of OPS-OPBC concrete (mix C50) to the prediction models .......................................................................................................... 200
Figure 9.1: Reinforcement details of the beams without shear reinforcement ............. 212
Figure 9.2: Test setup and Instrumentation ................................................................... 213
Figure 9.3: Structural behaviour of OPS concrete beams (set-1) without shear reinforcement ................................................................................................................ 214
Figure 9.4: Structural behaviour of OPS-OPBC30% concrete beams (set-2) without shear reinforcement ................................................................................................................ 215
Figure 9.5: Structural behaviour of OPS-OPBC50% concrete beams (set-3) without shear reinforcement ................................................................................................................ 216
Figure 9.6: Structural behaviour of all the beams without shear reinforcement ........... 217
Figure 9.7: Ultimate load capacity of all the beams with the respective deflections .... 218
Univers
ity of
Mala
ya
xx
Figure 9.8: Cracks pattern and Failure modes of the set-1 (OPS) lightweight weight concrete beams .............................................................................................................. 221
Figure 9.9: Cracks pattern and Failure modes of the set-2 (OPS-OPBC30%) LWC beams ....................................................................................................................................... 221
Figure 9.10: Cracks pattern and Failure modes of the set-3 (OPS-OPBC50%) LWC beams ....................................................................................................................................... 222
Figure 9.11: Development of cracks widths of Grade 25 concrete beams.................... 223
Figure 9.12: Development of cracks widths of Grade 35 concrete beams.................... 223
Figure 9.13: Development of cracks widths of Grade 45 concrete beams.................... 225
Univers
ity of
Mala
ya

xxi
LIST OF TABLES
Table 2.1: Environmental impact categories with the environmental sustainability for the production process of waste materials from the oil palm industry ................................. 17
Table 2.2: Physical properties of OPBC aggregate ......................................................... 21
Table 2.3: Chemical properties of OPBC aggregates compared with other LWAs........ 26
Table 2.4: Mechanical properties of OPBC compared with other LW & NW aggregates ......................................................................................................................................... 27
Table 2.5: Selected mix proportions of OPBC concrete and its fresh and mechanical properties ......................................................................................................................... 34
Table 2.6: Physical and mechanical properties of the pre-tensioned concretes .............. 49
Table 3.1: Grading of OPS and OPBC aggregates ......................................................... 58
Table 3.2: Physical and mechanical properties of aggregates ........................................ 58
Table 3.3: Mix proportions for concretes ........................................................................ 59
Table 3.4: Curing conditions ........................................................................................... 60
Table 3.5: The slump value of all the mix proportions ................................................... 62
Table 3.6: Effect of different curing conditions on 28-day compressive strength .......... 70
Table 3.7: Splitting tensile strength and flexural strength .............................................. 71
Table 4.1: Physical and mechanical properties of lightweight aggregates ..................... 83
Table 4.2: Mix proportions for concretes ........................................................................ 83
Table 4.3: Slump and density .......................................................................................... 85
Table 4.4: Slitting tensile and flexural strengths ............................................................. 88
Table 5.1: Details of the concrete mixes (kg/m3) ............................................................ 99
Table 5.2: Models to predict the strain at peak stress for concrete ............................... 108
Table 5.3: Models to predict the modulus of elasticity ................................................. 118
Table 5.4: Measured and predicted modulus of elasticity ............................................. 118
Table 6.1: Physical and mechanical properties of aggregates ...................................... 125
Univers
ity of
Mala
ya
xxii
Table 6.2: Mix proportions (kg/m3), slump value (mm) and dry density (kg/m3) of concretes ........................................................................................................................ 128
Table 6.3: Effect of curing at early ages on the drying shrinkage ................................ 151
Table 6.4: Effect of long-term cure on the drying shrinkage ........................................ 151
Table 7.1: Physical properties of the aggregates ........................................................... 158
Table 7.2: Concrete mix proportions ............................................................................ 159
Table 7.3: Effect of curing on drying shrinkage of concretes at early age ................... 169
Table 7.4: Effect of curing on long term drying shrinkage of concretes ...................... 169
Table 8.1: Physical properties of the aggregates ........................................................... 177
Table 8.2: Concrete mix proportions ............................................................................ 177
Table 8.3: Selected parameters for prediction models .................................................. 179
Table 8.4: Selected factors for the prediction of drying shrinkage ............................... 181
Table 8.5: Error percentage analyses for the mixes at early-ages (14 days) ................. 202
Table 8.6: Coefficient of variation analyses for the mixes at early-ages (14 days) ...... 202
Table 8.7: Error percentage analyses for the mixes at long-term ages (365 days) ....... 203
Table 8.8: Coefficient of variation analyses for the mixes at long-term ages (365 days) ....................................................................................................................................... 203
Table 9.1: Chemical composition of fly ash (FA) and cement (OPC) .......................... 209
Table 9.2: Physical properties of the aggregates ........................................................... 209
Table 9.3: Concrete mix proportions ............................................................................ 210
Table 9.4: Properties of the specimens / beams ............................................................ 211
Table 9.5: Summary of Experimental results ................................................................ 220
Table 9.6: Comparison of experimental and predicted results for beams without shear reinforcements ............................................................................................................... 230
Univers
ity of
Mala
ya

xxiii
LIST OF SYMBOLS AND ABBREVIATIONS
3R : Reduce, Reuse, Recycle
2T2D : Two times 2 days curing
2T6D : Two times 6 days curing
2D : Two days curing in water
4D : Four days curing in water
6D : Six days curing in water
7W : Seven days moist curing
AASHTO : American Association of State Highway and Transportation Officials
AC : Air curing
ACI : American Concrete Institute
AS : Australian Standards
ASTM : American Society for Testing and Materials
BS : British Standards
C : OPBC semi-lightweight concrete
CSA : Canadian Standard Association
CV : Coefficient of variation
DoE : Department of Environment
E : Young’s modulus of elasticity
E-value : Value of Young’s modulus of elasticity
EFB : Empty fruit bunches
EP : Error percentage
EQ : Ecosystem quality
FA : Fly ash
FFB : Fresh fruit bunches
Univers
ity of
Mala
ya

xxiv
FIP : Federation Internationale de la Precontrainte
FW : Continuous moist curing
GGBFS : Ground granulated blast furnace slag
HSC : High Strength Concrete
HSLWAC : High strength lightweight aggregate concrete
IS : Indian Standards
ISO : International Standard Organization
IUTM : Instron Universal Testing Machine
JSCE : Japan Society of Civil Engineers
K : Constant parameter
L : Leca lightweight aggregate concrete
LCA : Life cycle assessment
LCI : Life cycle inventory
LECA : Lightweight expanded clay aggregate
LEED : Leadership in Energy and Environmental Design
LUC : Land-use change
LVDT : Linear voltage differential transducers
LWA : Lightweight Aggregate
LWAC : Lightweight aggregate concrete
LWC : Lightweight concrete
LWAFC : Lightweight aggregate foamed concrete
MC : Model Code
MOR : Modulus of rupture
MS : Malaysian Standards
N : Normal weight concrete mix
NC-SF : Normal weight concrete containing silica fume
Univers
ity of
Mala
ya

xxv
NWA : Normal weight aggregate
NWC : Normal weight concrete
OPBC : Oil-palm-boiler clinker
OPBCC : Oil-palm-boiler clinker concrete
OPBC-C : Oil-palm-boiler clinker as coarse aggregate
OPBC-F : Oil-palm-boiler clinker as fine aggregate
OPC : Ordinary Portland cement
OPS : Oil palm shell
OPS-FA : Oil palm shell concrete containing fly ash
OPSFC : Oil palm shell foamed concrete
OPS-SF : Oil palm shell concrete containing silica fume
P : Oil palm shell concrete mix
PKS : Palm Kernel shell
PKSC : Palm Kernel shell concrete
PS : Plastic sheet
POC : Palm oil clinker
POFA : Palm oil fly ash
POME : Palm oil mill effluent
RC : Reinforced concrete
RSM : Response Surface Methodology
SCC : Self-compacting concrete
SLWAC : Structural lightweight aggregate concrete
SP : Super-plasticizer
SRC : Sulphate Resistant Cement
UNEP : United Nations Environment Programme
UN : United Nations
Univers
ity of
Mala
ya

xxvi
USGBC : United States Green Building Council's
fcu : Cubical compressive strength
fcy : Cylinder compressive strength
ft : Splitting tensile strength
fr : Flexural strength
w/c : Water cement ratio
MPa : Mega Pascal
ω : Air dry density of concrete (kg/m3)
bw : Width of the beam
a/d : Shear span to effective depth ratio
Mult : Ultimate moment
ρ : Tension reinforcement ratio
Vc : Shear resistance
β : Shear resistance factor of concrete
d : Effective depth of the beam
λ : Factor for low density concrete
w : Dry density (kg/m3)
St : Drying shrinkage strain
S∞ : Ultimate shrinkage strain
Ƴsh : Product of several factors
v/s : Volume to surface area ratio
Ƴtc : Curing time coefficient
ƳRH : Relative humidity coefficient
Ƴvs : Factor related to volume to surface area ratio
Ƴs : Slump related factor (slump in mm)
Ƴψ : Fine aggregate to total aggregate ratio
Univers
ity of
Mala
ya

xxvii
Ƴc : Cement related factor (cement content in kg/m3)
Ƴα : Air content factor (%)
𝐾1′ : Curing time coefficient
𝐾2′ : Relative humidity coefficient
𝐾3′ : Factor related to volume to surface area ratio
𝐾4′ : Slump related factor (slump in mm)
𝐾5′ : Fine aggregate to total aggregate ratio
𝐾6′ : Cement related factor (cement content in kg/m3)
𝐾7′ : Air content factor (%)
ε0 : Strain at peak stress
𝜀𝑐𝑠 : Total drying shrinkage strain
𝜀𝑐𝑑 : Drying shrinkage strain
𝜀𝑐𝑎 : Autogenous shrinkage
ɛ𝑠ℎ(𝑡-𝑡0) : Drying shrinkage strain
𝜀𝑠ℎ𝑢 : Ultimate shrinkage strain
ɛ𝑠ℎ∞ : Ultimate shrinkage strain
𝜀𝑠𝑜 : Notional shrinkage coefficient
𝛽𝑠𝑐 : Cement type factor
Ac : Cross-sectional area in (mm2)
µ : Exposed perimeter (mm)
𝑘𝑣𝑠 : Size factor
𝐾𝐻′ : Ambient relative humidity factor
𝑘𝑡0′ : Factor for maturity of concrete
h : Relative humidity in decimals
α : Factor for type of cement
𝜏𝑠ℎ : Size and shape dependent factor
Univers
ity of
Mala
ya

xxviii
α1 : Cement type factor
α : Angle of deflection lines in structural behaviour of beams
β : Angle of deflection lines in structural behaviour of beams
ρ1 : Longitudinal reinforcement ratio
do : Effective depth related factor
α2 : Curing type factor
𝑘ℎ : Humidity dependent factor
VRd,c : Shear resistance of concrete
CRd,c : Additional factor for shear capacity
η1 : Additional factor for shear capacity
ɣc : Partial safety factor
As : Area of steel reinforcement
W/mK : Unit of thermal conductivity (Watts per meter-Kelvin)
Univers
ity of
Mala
ya
1
INTRODUCTION
1.1 Introduction
Concrete and steel are the most commonly used materials in construction industry.
Among that the structural concrete plays very important role in all types of civil
engineering structures. Because it has an excellent resistance to water and can be formed
into a variety of shapes and sizes. The principal constituents to make concrete are cement,
fine and coarse aggregates and water, and these materials are commonly available in all
over the world.
Generally, the concrete can be classified into three categories based on its unit weight
or density, namely normal weight, lightweight and heavy weight concrete. Among, such
types, the lightweight concrete (LWC) has attracted a considerable attention due to its
higher strength to weight ratio compared to the normal weight concrete (NWC). In
addition, the high demand of NWC made with normal weight aggregates has extremely
reduced the natural stone deposits and caused an irreparable damage to the environment.
As a result, the emphasis on the sustainable materials has been increased recently, which
motivated the researchers to focus their investigation on the use of recycled or waste
materials into the potential construction materials.
There are several methods to produce lightweight concrete. The most popular way of
achieving LWC production is by using lightweight aggregate (LWA). The lightweight
concrete is not a new invention in concrete technology; it has been used since ancient
times and the most interesting field for the researchers because of its advantages such as
savings in scaffolding, formwork and reinforcement, it also reduces the foundation,
erection and transport costs. Furthermore, the other advantages of LWC are better heat
insulation, fire resistance, frost resistance, sound absorption, superior anti-condensation
properties and also increased damping (Shafigh, Mahmud, & Jumaat, 2010).
Univers
ity of
Mala
ya
2
1.2 Lightweight Concrete
The concrete can be considered as a lightweight concrete with the density lower than
the usual range of concretes made with the normal weight aggregates. Lightweight
concrete was further classified into three categories based on their production methods
(Neville & Brooks, 2008);
i. The concrete made from the porous aggregate of lower specific gravity can be
considered as the lightweight aggregate concrete.
ii. The concrete made by introducing the air voids in the cement paste can be
considered as cellular, aerate, foamed or gas lightweight concrete.
iii. The concrete made by omitting fine aggregates can be considered as no-fine
lightweight concrete.
Based on the application of concrete, the lightweight concrete can also be classified in
three categories (Neville, 2008);
i. The concrete with the minimum 28-day cylinder compressive strength of 17
MPa and the density in the range of 1350 to 1900 kg/m3 can be considered as
structural lightweight concrete because it can be used for structural purposes
(ASTMC330, 2003).
ii. The concrete with the cylinder compressive strength in the range of 7 to 17
MPa with the dry density range between 300 to 800 kg/m3 can be considered
as lightweight concrete used in masonry units (ASTMC331, 2003).
iii. The concrete with the standard cylinder compressive strength between 0.7 and
7 MPa with the dry density range between 300 and 800 kg/m3 can be considered
as low density or insulation concrete (ASTMC332, 2003).
Univers
ity of
Mala
ya

3
Generally, structural lightweight concrete is similar to the normal weight concrete
except it has lower density. It was found that the lightweight concrete can be produced
with the 28-day cube compressive strengths from 1 to over 60 MPa and the oven-dry
density range of approximately 300 to a maximum of 2000 kg/m3, and the thermal
conductivities of 0.2 to 0.1 W/mk (Newman & Owens, 2003). Typically, the density of
structural lightweight concrete range between 1400 to 2000 kg/m3 (Shannag, 2011) and
the 28-day compressive strength ranges between 20 to 35 MPa (Kosmatka, Kerkhoff, &
Panarese, 2002). It is also possible to produce high strength structural lightweight
concrete with the compressive strength range of 35 to over 70 MPa by introducing various
pozzolans such as silica fume, fly ash and metakaolin etc. (Holm & Bremner, 2000).
1.3 Lightweight Aggregates
The lightweight aggregates (LWAs) are generally classified in two groups, natural and
artificial (manufactured). The main natural LWAs are pumice, diatomite, volcanic
cinders, scoria and tuff (Neville, 2008), and the artificial aggregates are further classified
in two groups. The naturally arising materials that need further processing (produced by
the application of high temperature) such as shale, expanded clay, slate, vermiculite and
perlite, and the materials that occur as industrial by products such as sintered slate,
sintered pulverized fuel ash (fly ash) and colliery waste, expanded or foamed blast-
furnace slag (Shafigh et al., 2010).
Since 2nd A.D. different types of LWA such as foamed slag, and expanded clay has
been used as construction material. Oil Palm Shells (OPS), sometimes called Palm Kernel
Shells (PKS) and Oil-palm-boiler clinkers (OPBC) are an alternative LWA in tropical
regimes and countries that have a palm oil industry. Malaysia is one of the top listed
countries which has huge assets of OPS, and contributes about 58% of the total supply of
palm oil in the world (Ahmad, Ibrahim, & Tahir, 2010). OPS and OPBC are produced in
Univers
ity of
Mala
ya
4
large quantities by the oil mills. For instance, in Malaysia and Nigeria it was estimated
that over 4 million tonnes of OPS solid waste is produced annually and only a fraction is
used for the production of the fuel and activated carbon. In Malaysia, the use of OPS as
a LWA or porous aggregate in producing LWC was introduced by Sallam & Abdullah
(1985).
1.4 Problem Statement
The use of high strength normal weight concrete has several advantages. However,
high strength lightweight concretes have significant benefits over high strength normal
weight concrete because of the reduction of dead load and the construction costs. Since
last few decades, the lightweight concrete has attracted a considerable attention. The
number of researchers have investigated the lightweight concretes by using several types
of lightweight aggregates. However, not all types of lightweight aggregates are suitable
for the production of high strength lightweight concrete (Zhang & Gjorv, 1990).
The OPS and OPBC are an alternative lightweight aggregate from the oil palm
industry. Several researchers have investigated the properties of the lightweight concretes
by using OPS as lightweight aggregate. However, the test results of time dependent
properties of this type of LWC has shown that the most grades of this concrete cannot be
utilized for the structural purposes. It is because of high drying shrinkage and
consequently high creep value. Further, it was also observed that OPS concrete is very
sensitive to the curing and a significant reduction in the compressive strength and other
mechanical properties was observed in poor curing environment. Furthermore, for
structural applications, there is not much information available on the structural behaviour
of oil palm shell or oil-palm-boiler clinker concretes.
Univers
ity of
Mala
ya

5
Based on the reasons mentioned above, the present research program was developed
to investigate the mechanical properties and the structural performance of the high-
strength lightweight concrete by using oil palm bio-products as a lightweight aggregate.
1.5 Objectives of the Research
The main objective of this research is to develop a sustainable high strength
lightweight aggregate concrete to be used in structural elements using bio-product wastes
from palm oil industry. The sub-objectives of this study are as followings:
1. To investigate the optimum contribution level of oil-palm-boiler clinker (OPBC) in
oil palm shell (OPS) concrete to produce lightweight aggregate concrete for
structural applications.
2. To study the mechanical properties of the high strength lightweight aggregate
concrete made of blended of OPS and OPBC.
3. To investigate the drying shrinkage behaviour of lightweight concretes made of bio-
product aggregates.
4. To evaluate the shear behaviour of reinforced concrete beams made of OPS and
OPBC.
1.6 Scope of the Study
The experimental investigation consisted of conducting the physical and mechanical
properties of all the aggregates namely oil palm shell (OPS), oil-palm-boiler clinker
(OPBC), lightweight expanded clay aggregate (LECA) and the normal weight aggregate
(NWA). After that different mix proportions of the lightweight, semi-lightweight and the
normal weight concretes were prepared to identify the physical, mechanical, durability
and drying shrinkage of the concretes. While, the structural performance involved shear
behaviour of the lightweight reinforced concrete beams under flexure was carried out.
The aim of this study was to produce a new type of lightweight concrete which can be
Univers
ity of
Mala
ya
6
applicable for the real-life structures. The role of different types of aggregates in the
concrete was also considered under different curing regimes. In structural performance,
the experimental program consisted of nine lightweight reinforced concrete beams. All
the beams were designed to investigate the shear behaviour of the lightweight concrete
beams containing oil palm by-products as lightweight aggregates. The main differences
between the beams are the grade of concretes, type of aggregates, cement contents and
fly ash to examine the effect on the shear and cracking behaviours, and the failure modes
under flexural loading.
1.7 Thesis Layout
The results of this research investigation in the thesis have been planned to publish in
various ISI indexed and refereed journals. Although, some of results were already
published in several ISI indexed journals, however, still some of articles are still under
process. This thesis is divided into ten chapters. Chapter one provides the basic
introduction about the research area and specifies the research needs, objectives and the
scope of work. A comprehensive critical review on the use of by-product materials based
on the relevant topic is presented in chapter two. The literature provided in this chapter
was already published as a review paper entitled “Oil-palm by-products as lightweight
aggregate in concrete mixture - A review”.
The mechanical properties of the prepared lightweight and semi-lightweight aggregate
concretes by using blended coarse aggregates with their benefits and advantages were
discussed and presented in chapters three, four and five. Among these, the chapters three
and four were already published in ISI indexed journals, however, the fifth one is still
under review in the ISI indexed journal.
The time-dependent deformation, drying shrinkage of the oil palm shell (OPS) and
OPS-OPBC concretes and their comparisons with other types of concretes, effects of
Univers
ity of
Mala
ya
7
different types of coarse aggregates, and the validation of the experimental results with
different prediction models are presented and discussed in chapters six, seven and eight.
Among these, the article six already published in ISI indexed journal, whereas, seventh
and eighth are submitted to the ISI indexed journals.
In structural performance, the shear behaviour of the oil-palm by-product lightweight
concretes without shear reinforcement is presented in chapter nine. After some
modifications, soon the article will be submitted to the ISI indexed journal. Finally,
chapter ten presented the cumulative conclusions of the major findings of the present
research investigation, as well as some future recommendations were also suggested.
Univers
ity of
Mala
ya
8
LITERATURE REVIEW
2.1 Introduction
Structural concrete is the most widely used construction material in the majority of
civil engineering structures (Hosseini, Booshehrian, Delkash, Ghavami, & Zanjani,
2009). It has an excellent resistance to water and can be formed into a variety of shapes
and sizes (Calkins, 2009). Nowadays, the concrete industry consumes 1.5 billion tonnes
of cement, 10-12 billion tonnes of sand and rock together, and 1 billion tonnes of mixing
water annually (Shafigh, Jumaat, Mahmud, & Alengaram, 2013). This means that a huge
amount of raw materials and natural resources are being consumed for the production of
concrete worldwide (Altwair & Kabir, 2010). Because of the huge amount of concrete
being produced daily, even a small reduction in the environmental impact per tonne of
concrete will result in considerable benefits to the environment (Silva, Brito, & Dhir,
2016). This reduction can be achieved by considering the composition of ingredients
constituting structural concrete, most importantly, the composition of ordinary Portland
cement (OPC).
The high demand for concrete in construction using normal weight aggregates
(NWAs) has drastically reduced natural stone deposits and caused irreparable damage to
the environment. As a result, recently, the emphasis on sustainable materials has
intensified (Alengaram, Al-Muhit, & Jumaat, 2013). The growing need for sustainable
development has motivated researchers to focus their investigation on the use and
conversion of waste or recycled material into potential construction materials (Mo,
Alengaram, Jumaat, & Yap, 2015).
Lightweight concrete (LWC) is not a new invention in concrete technology. It has been
used since ancient times and is a most interesting field of research because of its
advantages, such as better heat insulation, fire and frost resistance, sound absorption,
Univers
ity of
Mala
ya
9
superior anti-condensation properties and increased seismic damping (Shafigh et al.,
2010). The most popular way of achieving LWC production is by using a lightweight
aggregate (LWA) (Polat, Demirboga, & Karakoc, 2010). The LWAs are generally
classified into two groups: natural and artificial. The main natural LWAs are pumice,
diatomite, volcanic cinders, scoria and tuff (Neville & Brooks, 2008). The artificial
aggregates are further classified into two groups, namely, the industrial by-products and
modified naturally arising materials. The industrial by-product materials utilized as
LWAs are sintered slate, sintered pulverized fuel ash, expanded or foamed blast furnace
slag and colliery waste. The naturally arising materials that need further processing
(produced by the application of high temperature), such as shale, expanded clay, slate,
vermiculite and perlite, are also used as LWAs in the construction industry (Shafigh et
al., 2010).
The industrial waste materials that are mostly used as lightweight aggregates (LWAs)
are expanded slag, sintered pulverized fuel ash, and bed ash, which promote the use of
sustainable materials (Chandra & Berntsson, 2002). LWAs have been used over a long
period of time during which they have proven to be cost effective and fulfilled the purpose
of providing both the structural stability and economic viability (Emdadi, Asim, Yarmo,
& Shamsudin, 2014). The lower the weight, the more versatile are the structures (Zhang
& Poon, 2015). Since second millennium, different types of natural and manufactured
LWAs, such as foamed slag, diatomite, pumice, volcanic cinders, scoria, tuff, expanded
clay, shale, slate, perlite and vermiculite and materials that occur as industrial by-
products, such as sintered pulverized-fuel ash, sintered slate and colliery waste, and
foamed or expanded blast-furnace slag have been used as construction materials
(CEB/FIP, 1983; Mo, Alengaram, Jumaat, Liu, & Lim, 2016). Oil palm shell (OPS) and
oil-palm-boiler clinker (OPBC) are used as an alternative LWA in tropical regimes and
countries that have a palm oil industry (Mo, Alengaram, & Jumaat, 2014). Countries such
Univers
ity of
Mala
ya

10
as Malaysia, Indonesia, and Thailand, have vast palm oil plantations. In fact, these
countries contributed to about 90% of the total world's palm oil production in the year
2009 (Islam, Mo, Alengaram, & Jumaat, 2016; Liu, Alengaram, Jumaat, & Mo, 2014).
Malaysia contributes about 58% of the total world supply of palm oil, and is one of the
top listed countries with huge resources of OPS (Ahmad et al., 2010). OPS and OPBC are
produced in large quantities by oil mills. For instance, in Malaysia, it was estimated that
over 4 million tonnes of OPS solid waste is produced annually (Nagaratnam, Rahman,
Mirasa, Mannan, & Lame, 2015), however, only a fraction is used for the production of
fuel and activated carbon (Sobuz, Hasan, Tamanna, & Islam, 2014). The OPBC is an
aggregate extracted from boiler of palm oil mill with higher specific gravity and density
compared to other lightweight aggregates such as OPS, coconut shell, expanded clay, and
lytag. It was reported by Shi, Wu, Lv, & Wu (2015) that the utilization of these waste
materials in concrete leads to sustainable concrete and reduces environmental impact
from the manufacture of concrete using conventional materials. In Malaysia, the concept
of using OPS as a LWA in producing LWC was introduced by Sallam & Abdullah (1985).
The number of studies are available in the literature regarding the use OPS as an aggregate
in concrete mixture. However, study on the use of OPBC in concrete is new and it needs
further investigations.
The main objective of this study is to review the potential use of OPBC as a lightweight
aggregate in concrete. A detailed study was conducted to identify the physical and
chemical properties of OPBC and its properties were compared with other LWAs. In
addition, the effect of using OPBC in concrete mixture on the mechanical properties of
concrete is discussed. In light of the available literature, the authors believe that
significant achievements can be attained by analyzing and summarizing the properties of
OPBC. Furthermore, new subjects for the research are identified for researchers to
explore innovative LWC based on financial and environmental design factors.
Univers
ity of
Mala
ya

11
2.2 Sustainable Development
Sustainable development is the major issue in the world these days. It meets the needs
of the present without compromising the ability of future generations to meet their own
needs. It involves the practices which would eventually produce high efficiency products
for the benefit of the ecosystem and the mankind (Brundtland, 1987). The sustainable
development involves a progressive transformation of economy and society. The major
objective of this development is the satisfaction of human aspirations and needs
(Drexhage & Murphy, 2010). To fulfil the basic requirements in the human life, demands
are increasing regularly, including food, fresh air, clean water, clothing, shelter, rapid and
safe transport of people and goods, waste disposal, industrial and residential buildings,
and the sources of energy (Karim, Zain, Jamil, & Lai, 2011). United Nations (UN)
provides a comprehensive agenda 21 on actions to be taken locally, nationally and
globally by major groups, governments and organizations in every area in which humans
influence the environment. The task is to balance economic development with social and
environmental objectives (United Nations, 1993). The palm oil industry has nevertheless
generated a million tonnes of waste every year and its sustainability covers the whole
manufacturing system. The sustainability of the palm oil industry mainly focuses the
countries and international acts, standards and regulations, life cycle assessment (LCA),
reverse logistics, GHG emissions, new degradation method, zero waste, energy
generation, renewable energy, waste treatment systems, eco-label and bio-energy, food
products and consumption, optimization processes, clean production, energy efficiency,
and process improvement (Abdullah, Mahmood, Fauadi, Rahman, & Ahmad, 2015). The
sustainable manufacturing process of the palm oil industry is shown in Figure 2.1.
In fact, the entire world accepted that concrete performs outstanding responsibilities
in the modern construction industry such as infrastructures, urbanization and
industrialization for the growing population (Blodgett, 2004). Beside this, it is important
Univers
ity of
Mala
ya
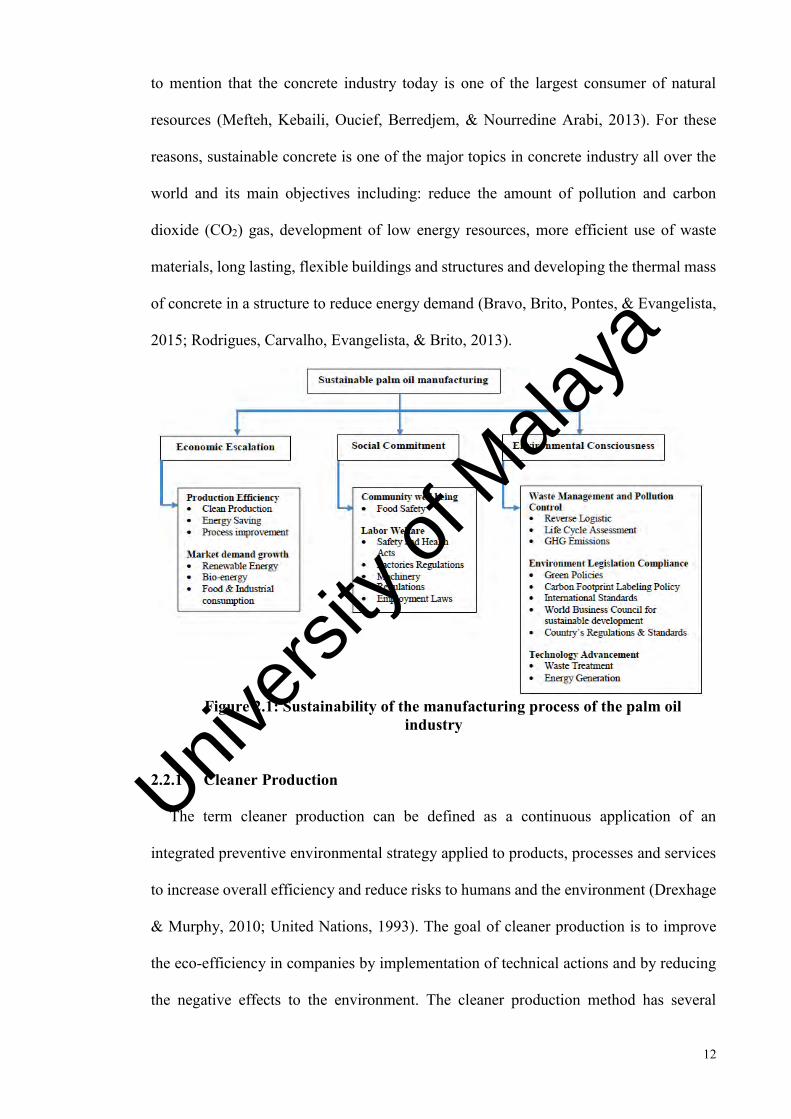
12
to mention that the concrete industry today is one of the largest consumer of natural
resources (Mefteh, Kebaili, Oucief, Berredjem, & Nourredine Arabi, 2013). For these
reasons, sustainable concrete is one of the major topics in concrete industry all over the
world and its main objectives including: reduce the amount of pollution and carbon
dioxide (CO2) gas, development of low energy resources, more efficient use of waste
materials, long lasting, flexible buildings and structures and developing the thermal mass
of concrete in a structure to reduce energy demand (Bravo, Brito, Pontes, & Evangelista,
2015; Rodrigues, Carvalho, Evangelista, & Brito, 2013).
Figure 2.1: Sustainability of the manufacturing process of the palm oil
industry
2.2.1 Cleaner Production
The term cleaner production can be defined as a continuous application of an
integrated preventive environmental strategy applied to products, processes and services
to increase overall efficiency and reduce risks to humans and the environment (Drexhage
& Murphy, 2010; United Nations, 1993). The goal of cleaner production is to improve
the eco-efficiency in companies by implementation of technical actions and by reducing
the negative effects to the environment. The cleaner production method has several
Univers
ity of
Mala
ya

13
benefits including improving environmental situation, increasing economical benefits,
increasing productivity, continuous environmental improvement and gaining competitive
advantage (Drexhage & Murphy, 2010). To avoid or to overcome the barriers and to
guarantee a successful implementation, cleaner production calls for an organized
approach (UNEP, 2013). The cleaner production assessment also can be described as
consisting of four basic steps, as shown in Figure 2.2.
The agro-based industries play a major role in the economy of the Malaysia from last
few decades, and the products from this industry generated a huge amount of wastes that
needs suitable disposal (Kanadasan & Razak, 2014a). Oil palm factories generate various
types of wastes, including, OPS, fibres, OPBC, palm oil mill effluent (POME) and empty
fruit bunches (EFB). Improper management of these wastes could result the
environmental pollution. The 3R (Reduce, Reuse, Recycle) concept could be more
beneficial to save the environment besides supporting the sustainability of certain
industries (Kanadasan & Razak, 2014b). For the clean production, the oil palm industry
is following the following stages in manufacturing process and procurement of materials:
1) Fruit contamination control, 2) the increase of free fatty acids control, 3) best operating
procedures application, 4) wasted oil collection, 5) standard operating procedures
assertion, 6) empty fruit bunches utilization, 7) water use efficiency improvement, and 8)
liquid waste utilization for producing bio-gas. These aspects of implementation of the
cleaner production was then analyzed and verified by experts using Analytical Hierarchy
Process (AHP) (Ling, 2011). Usage of solid wastes such as OPS and OPBC as aggregate
in concrete mixture can be considered as one of the environmental benefits and green
production that will be recognized by most of the sustainability rating systems such as the
United States Green Building Council's (USGBC) which is Leadership in Energy and
Environmental Design (LEED) (Leed, 2009).
Univers
ity of
Mala
ya
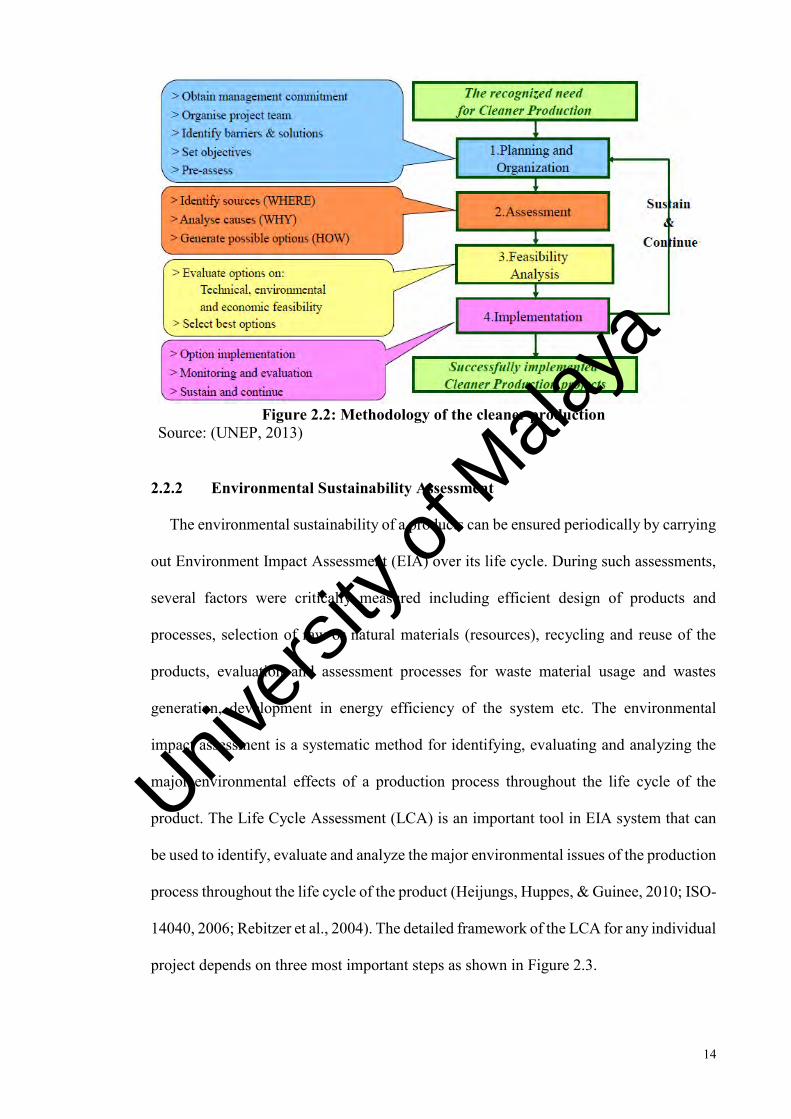
14
Figure 2.2: Methodology of the cleaner production
Source: (UNEP, 2013)
2.2.2 Environmental Sustainability Assessment
The environmental sustainability of a products can be ensured periodically by carrying
out Environment Impact Assessment (EIA) over its life cycle. During such assessments,
several factors were critically measured including efficient design of products and
processes, selection of raw or natural materials (resources), recycling and reuse of the
products, evaluation and assessment processes for waste material usage and wastes
generation, development in energy efficiency of the system etc. The environmental
impact assessment is a systematic method for identifying, evaluating and analyzing the
major environmental effects of a production process throughout the life cycle of the
product. The Life Cycle Assessment (LCA) is an important tool in EIA system that can
be used to identify, evaluate and analyze the major environmental issues of the production
process throughout the life cycle of the product (Heijungs, Huppes, & Guinee, 2010; ISO-
14040, 2006; Rebitzer et al., 2004). The detailed framework of the LCA for any individual
project depends on three most important steps as shown in Figure 2.3.
Univers
ity of
Mala
ya
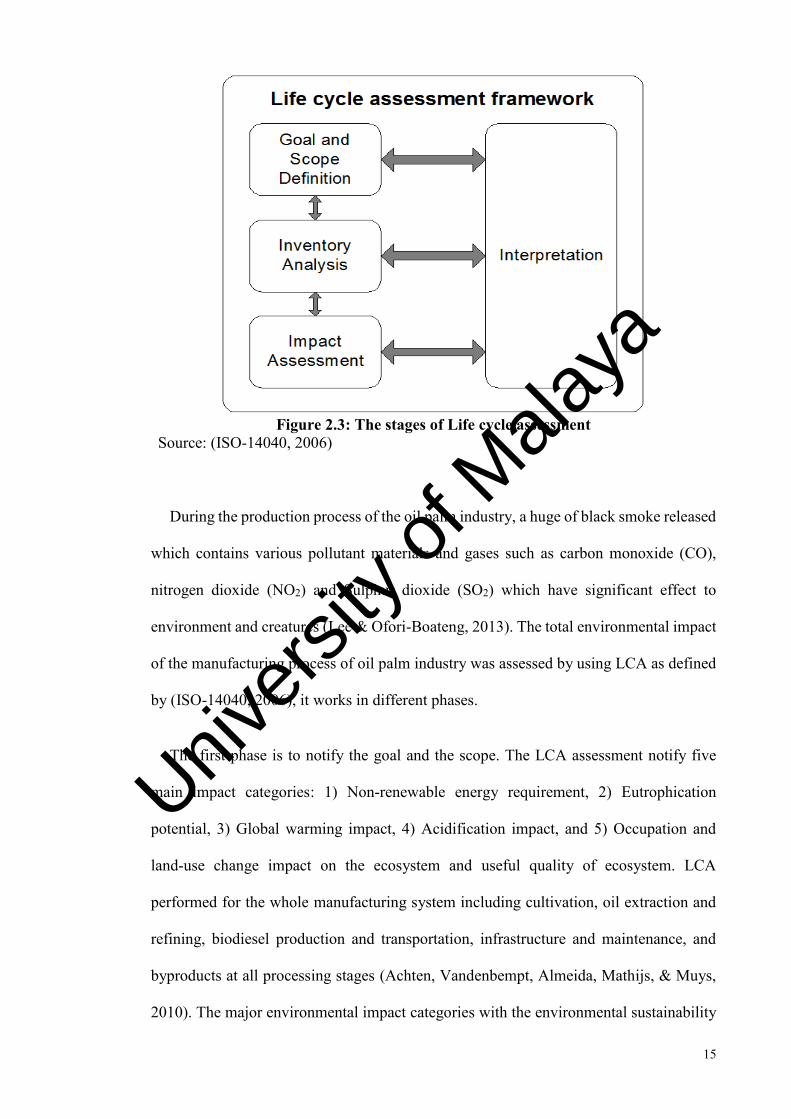
15
Figure 2.3: The stages of Life cycle assessment
Source: (ISO-14040, 2006)
During the production process of the oil palm industry, a huge of black smoke released
which contains various pollutant materials and gases such as carbon monoxide (CO),
nitrogen dioxide (NO2) and Sulphur dioxide (SO2) which have significant effect to
environment and creatures (Lee & Ofori-Boateng, 2013). The total environmental impact
of the manufacturing process of oil palm industry was assessed by using LCA as defined
by (ISO-14040, 2006), it works in different phases.
The first phase is to notify the goal and the scope. The LCA assessment notify five
main impact categories: 1) Non-renewable energy requirement, 2) Eutrophication
potential, 3) Global warming impact, 4) Acidification impact, and 5) Occupation and
land-use change impact on the ecosystem and useful quality of ecosystem. LCA
performed for the whole manufacturing system including cultivation, oil extraction and
refining, biodiesel production and transportation, infrastructure and maintenance, and
byproducts at all processing stages (Achten, Vandenbempt, Almeida, Mathijs, & Muys,
2010). The major environmental impact categories with the environmental sustainability
Univers
ity of
Mala
ya
16
for the production process of waste materials from the oil palm industry are mentioned in
Table 2.1.
The second phase is the life cycle inventory (LCI). In this phase, the data will be
collected through different sources, either can be descriptive data or factory specific data
and expert interviews. In addition, the field data on biodiversity, soil, vegetation structure,
water balance and biomass necessary for the impact of land-use, were collected from the
oil palm industry. From this specific information, the amount of carbon can also be
computed (Achten et al., 2010; Eggleston, Buendia, Miwa, Nagara, & Tanabe, 2006).
Continue to this, the production system was carried out which performs two main
functions during the refinery process. After bleaching, cleaning, and separating the free
fatty acids, the stearin fraction was separated from the olein fraction. Then the stearin
fraction was sent to bio-diesel production and olein fraction is sold as cooking oil. After
that the product output and fossil reference system was performed, in that all the products
and by-products of the palm oil manufacturing system should be substituted in the fossil
reference system. The substitutions reflect to the local reference system, where crude
palm oil is used as kitchen oil. Other by-products of the biodiesel system are palm kernel
oil which is sold as fine oil for the cosmetic industry, palm kernel meal, that can be used
as local animal feeds (Lam, Lee, & Mohamed, 2009; Yee, Tan, Abdullah, & Lee, 2009).
The third phase is the evaluation of the environmental impacts, the overview of the
basic calculation methods are provided here as; the impact calculation for nonrenewable
energy requirement is the sum of fossil energy requirement throughout the life cycle. The
global warming potential can be computed as the sum greenhouse gas emissions
throughout the life cycle. Acidification potential is the sum of NH3, NOx, and SOx
emissions throughout the life cycle, whereas, Eutrophication potential is the sum of
nitrogen emissions and flows to water ways or ground water. The land-use impact
Univers
ity of
Mala
ya
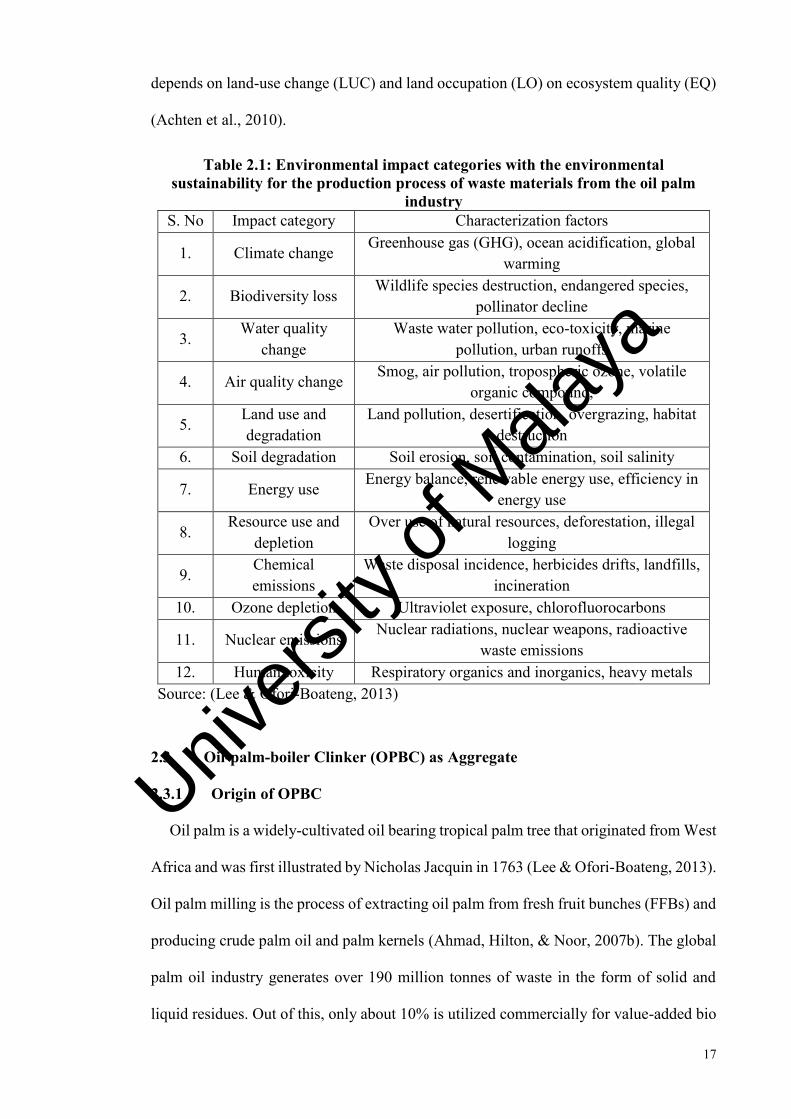
17
depends on land-use change (LUC) and land occupation (LO) on ecosystem quality (EQ)
(Achten et al., 2010).
Table 2.1: Environmental impact categories with the environmental sustainability for the production process of waste materials from the oil palm
industry S. No Impact category Characterization factors
1. Climate change Greenhouse gas (GHG), ocean acidification, global
warming
2. Biodiversity loss Wildlife species destruction, endangered species,
pollinator decline
3. Water quality
change Waste water pollution, eco-toxicity, marine
pollution, urban runoffs
4. Air quality change Smog, air pollution, tropospheric ozone, volatile
organic compound,
5. Land use and degradation
Land pollution, desertification, overgrazing, habitat destruction
6. Soil degradation Soil erosion, soil contamination, soil salinity
7. Energy use Energy balance, renewable energy use, efficiency in
energy use
8. Resource use and
depletion Over use of natural resources, deforestation, illegal
logging
9. Chemical emissions
Waste disposal incidence, herbicides drifts, landfills, incineration
10. Ozone depletion Ultraviolet exposure, chlorofluorocarbons
11. Nuclear emissions Nuclear radiations, nuclear weapons, radioactive
waste emissions 12. Human toxicity Respiratory organics and inorganics, heavy metals
Source: (Lee & Ofori-Boateng, 2013)
2.3 Oil-palm-boiler Clinker (OPBC) as Aggregate
2.3.1 Origin of OPBC
Oil palm is a widely-cultivated oil bearing tropical palm tree that originated from West
Africa and was first illustrated by Nicholas Jacquin in 1763 (Lee & Ofori-Boateng, 2013).
Oil palm milling is the process of extracting oil palm from fresh fruit bunches (FFBs) and
producing crude palm oil and palm kernels (Ahmad, Hilton, & Noor, 2007b). The global
palm oil industry generates over 190 million tonnes of waste in the form of solid and
liquid residues. Out of this, only about 10% is utilized commercially for value-added bio
Univers
ity of
Mala
ya
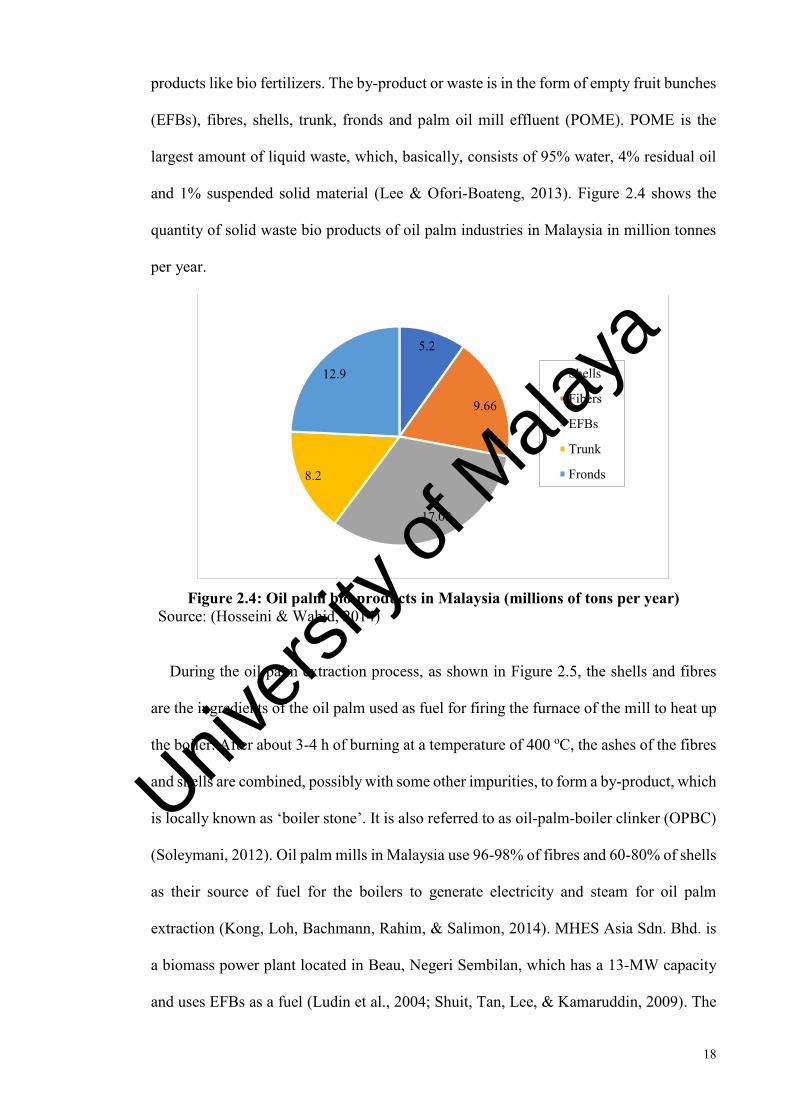
18
products like bio fertilizers. The by-product or waste is in the form of empty fruit bunches
(EFBs), fibres, shells, trunk, fronds and palm oil mill effluent (POME). POME is the
largest amount of liquid waste, which, basically, consists of 95% water, 4% residual oil
and 1% suspended solid material (Lee & Ofori-Boateng, 2013). Figure 2.4 shows the
quantity of solid waste bio products of oil palm industries in Malaysia in million tonnes
per year.
Figure 2.4: Oil palm bio-products in Malaysia (millions of tons per year)
Source: (Hosseini & Wahid, 2014)
During the oil palm extraction process, as shown in Figure 2.5, the shells and fibres
are the ingredients of the oil palm used as fuel for firing the furnace of the mill to heat up
the boiler. After about 3-4 h of burning at a temperature of 400 oC, the ashes of the fibres
and shells are combined, possibly with some other impurities, to form a by-product, which
is locally known as ‘boiler stone’. It is also referred to as oil-palm-boiler clinker (OPBC)
(Soleymani, 2012). Oil palm mills in Malaysia use 96-98% of fibres and 60-80% of shells
as their source of fuel for the boilers to generate electricity and steam for oil palm
extraction (Kong, Loh, Bachmann, Rahim, & Salimon, 2014). MHES Asia Sdn. Bhd. is
a biomass power plant located in Beau, Negeri Sembilan, which has a 13-MW capacity
and uses EFBs as a fuel (Ludin et al., 2004; Shuit, Tan, Lee, & Kamaruddin, 2009). The
5.2
9.66
17.08
8.2
12.9 Shells
Fibers
EFBs
Trunk
Fronds
Univers
ity of
Mala
ya

19
stipulated annual cost saving in running industrial boilers when biomass and fossil fuel
are applied simultaneously is around US$270,000 based on 80% diesel and 20% biomass
consumption, and US$630,000 in the case of 50% diesel and 50% biomass consumption
(Faaij, 2006).
Figure 2.5: Chart of extraction process of oil-palm-boiler clinkers
2.3.2 Physical Properties of OPBC
The mechanical properties of OPBC concrete (OPBCC) depend on the physical
properties of OPBC aggregate. In this study, the investigated physical properties are
specific gravity, shape, thickness, surface texture, loose and compacted bulk densities, air
and moisture content, porosity and water absorption. These properties are compared with
the properties of normal weight aggregates (NWAs).
2.3.2.1 Specific gravity
The specific gravity of a material is the ratio of the density of that particular material
and that of water (Ahmad, Hilton, & Noor, 2007a). Researchers generally prefer OPBC
both in the form of fine and coarse aggregates (Abdullahi, Al-Mattarneh, Abu Hassan,
Hassan, & Mohammed, 2008; Ahmad et al., 2007a, 2007b; Ahmad, Noor, & Adnan,
2008; Kamaruddin, 1991; Mohammed, Foo, & Abdullahi, 2014; Mohammed, Hossain,
Univers
ity of
Mala
ya
20
Foo, & Abdullahi, 2013; Roslli & Mohamed, 2002; Zakaria, 1986). From the reports
(Ahmad et al., 2007a; Alengaram et al., 2013; Mohammed et al., 2014), it can be seen
that although OPBC has varying specific gravity values they never exceeded the value of
the specific gravity of NWA (Table 2.2).
The range of specific gravity for OPBC is 1.7 to 2.2. The lowest value of 1.7 for the
specific gravity of fine OPBC was reported by Zakaria (1986), while the researchers
(Ahmad et al., 2007a; Chan & Robani, 2008; Robani & Chee, 2009) reported the highest
value of 2.2 for the specific gravity of fine OPBC. The lowest proposed value of specific
gravity for coarse OPBC is 1.7 (Mannan & Neglo, 2010), while Robani & Chee (2009)
and Chan & Robani (2008) reported the highest value of specific gravity for coarse OPBC
as 2.2. The main reason for such a variety of specific gravities may be due to the different
sources. The values for the specific gravity of other artificial lightweight aggregates, such
as Lytag and LECA, range from 0.8 to 0.9, and natural LWA such as pumice, is found in
the range of 1.3 to 1.7 (Hemmings, Cornelius, Yuran, & Milton, 2009). However, the
specific gravity of OPBC aggregates is 15 to 35 % less than the normal weight aggregates,
47 to 53% higher than the artificial LWAs and 24% higher than natural LWAs like
pumice, diatomite and volcanic cinders.
Univers
ity of
Mala
ya

21
Table 2.2: Physical properties of OPBC aggregate
Size of aggregate
Specific gravity
Loose bulk
density (kg/m3)
Compacted bulk
density (kg/m3)
Moisture content (%)
24 h Water absorption
(%) References
Fine Coarse
1.8 1.7
1120 790 - - 14.3
5.4 (Abdullahi et al.,
2008)
Fine Coarse
2.0 1.8
1120 780 - 0.11
0.07 26.4 4.4
(Mohammed, Al-Ganad, & Abdullahi,
2011)
Fine Coarse
1.97 1.73 - - 0.5 ± 0.25
1 ± 0.5 10 ± 5 3 ± 2
(Kanadasan & Razak, 2015)
Coarse 1.7 - 800 - 2.7 (Mannan & Neglo, 2010)
Fine Coarse
- 1.73 - 1080
827 - 7.5 3.0
(Roslli & Mohamed, 2002)
Fine Coarse
2.2 1.8
- 740
1040 860 - -
4.6 (Ahmad et al., 2007b)
Fine Coarse
1.7 1.95 - 1080
815 - - (Zakaria, 1986)
Coarse 2.2 - 860 0.08 4.6 (Ahmad et al., 2008) Fine
Coarse 2.2 1.7 - - 0.5 ± 0.25
1 ± 0.5 10 ± 5 3 ± 2
(Kanadasan & Razak, 2014a, 2014b)
2.3.2.2 Sieve analysis of OPBC
The sieve analysis, also known as the gradation test, is a basic essential test for all
aggregate technicians. The sieve analysis determines the gradation (the distribution of
aggregate particles, by size, within a given sample) in order to determine compliance with
the design, production control requirements and verification specifications. OPBC is
available as both fine and coarse aggregate and is a well-graded and promising material
for use in concrete work, as shown in Figure 2.6 (Abdullahi et al., 2008; Mahmud, Jumaat,
& Alengaram, 2009; Mannan & Neglo, 2010). Univers
ity of
Mala
ya

22
Figure 2.6: Particle size distribution of the OPBC compared with other LWA
reported in the literature Source: (Abdullahi et al., 2008; Alengaram et al., 2013; Mahmud et al., 2009; Mannan & Neglo, 2010)
2.3.2.3 Shape thickness and texture
When OPBC is withdrawn from the furnace, it is found in lumps of irregular shapes
with a size varying from 150 to 225 mm, as shown in Figure 2.7. OPBC is whitish grey
in colour and has the appearance of a porous stone, a feature that contributes to its
lightweightness. It is usually flaky and irregular in shape, with rough and spiky broken
edges (Aslam, Shafigh, Jumaat, & Lachemi, 2016). However, OPBC with a nominal size
of 20 mm is used as a coarse aggregate, and, for fine aggregate, a size below 4.75 mm is
preferred (Ahmad et al., 2008).
0
20
40
60
80
100
0.01 0.1 1 10 100
Part
icle
fine
r (%
)
Sieve sizes (mm)
OPBC-COPBC-FGraniteOPSSand
Univers
ity of
Mala
ya

23
(a) (b)
Figure 2.7: OPBC aggregates: a) OPBC big lumps, b) Prepared OPBC for concrete
Source: (Abdullahi et al., 2008; Alengaram et al., 2013; Mahmud et al., 2009; Mannan & Neglo, 2010)
2.3.2.4 Bulk density
The bulk density estimates how tightly the aggregates are packed together and shows
the approximate size distribution and shape of the particles (Ahmad et al., 2007b). The
loose and compacted bulk densities of OPBC aggregate vary within the different ranges,
as shown in Table 2.2. The compacted bulk density for fine OPBC varied in the range of
860 to 1080 kg/m3, while the loose and compacted bulk densities of coarse OPBC ranged
from 740 to 790 kg/m3 and 800 to 840 kg/m3 (Abdullahi et al., 2008; Ahmad et al., 2007a,
2007b; Chan & Robani, 2008; Mannan & Neglo, 2010; Mohammed, Al-Ganad, et al.,
2011; Mohammed et al., 2014; Mohammed, Hossain, Foo, & Abdullahi, 2011;
Mohammed et al., 2013; Robani & Chee, 2009). For structural satisfaction, the density of
the aggregates ranged between 700 and 1400 kg/m3 (Ahmad et al., 2007b).
The bulk density of fine OPBC is 35 to 43% lower than normal sand, and the density
of coarse OPBC is 40 to 45% lower than conventional coarse aggregate. However,
compared to other types of lightweight aggregate originating from agricultural waste,
namely oil palm shell and coconut shell, the density of OPBC is 23 to 30% higher. The
bulk density of coarse OPBC is 6 to 46% higher than the artificial LWAs, namely LECA
Univers
ity of
Mala
ya

24
and Lytag, and 6 to 66% higher than natural LWAs like pumice, diatomite and volcanic
cinders.
2.3.2.5 Water absorption
OPBC aggregate is a porous material and will absorb huge amounts of water compared
to the normal weight aggregate (Ahmad et al., 2007a). The 24-h water absorption for fine
OPBC aggregates ranges from 4.7 to 26.5% and for coarse it found in the range of 1.8 to
5.4%. Although, OPBC aggregate has a high-water absorption, it was reported that
pumice aggregate has a higher water absorption of approximately 37% (Hossain &
Khandaker, 2004). For the purpose of concrete mix design, it is very important to specify
the quantity of water absorption that is required for the aggregates, otherwise, it will
create a problem of workability and consistency of the concrete (Ahmad et al., 2007b).
The high-water absorption of OPBC aggregate can be valuable for the resultant hardened
concrete. It is reported that LWC with a porous aggregate is less sensitive to poor curing
compared to NWC, especially in the early ages due to the internal water supply placed in
the pores of LWAs (Mohammed et al., 2014).
The utilization of OPBC particles in the geo-polymeric samples to observe the water
absorption was carried out by several researchers (Nazari, Riahi, & Bagheri, 2012;
Sanjayan, Nazari, Chen, & Nguyen, 2015). The results showed that using the OPBC
particles results in a good resistance to water absorption with respect to the OPBC-free
specimens at early ages which make them appropriate for weightless applications. They
used Fuzzy logic and ANFIS techniques to prediction the experimental test results
(Nazari, 2012; Nazari & Khalaj, 2012). It was found that by using of these techniques the
experimental results can be predicted by 90-99% reliability.
The water content of the aggregates mostly depends on the humidity of the atmosphere
in which the aggregates are stored. If the aggregates have been stored in the laboratory,
Univers
ity of
Mala
ya

25
they will not be exposed to rain, which creates moisture not only on the surface but also
inside the aggregates as the pores will absorb water inside the particles. This amount of
moisture is of significant importance while the concrete mix design is carried out as it is
impossible to dry the bulk quantity of the aggregates on site (Ahmad et al., 2007b). It was
found that the free moisture content of OPBC varied between 0.05 to 1%, and the moisture
content of the NWA was typically found to be in the range of 0.5 to 1% (Alengaram et
al., 2013).
2.3.3 Comparison of the Chemical Composition of OPBC with Other LWAs
As with the physical properties of the materials, it is also very important to know the
chemical properties of OPBC to ensure that when using the binder it behaves properly. In
material selection, the use of OPS and OPBC, either alone or in combination, is very
effective in reducing the permeability of the concrete (Bremner & Holm, 1995; Holm &
Bremner, 1991). Mostly, in LWC, the lower permeability is expected due to the improved
contact zone between the LWA and the binder paste. The improved contact zone is due
to internal curing and to the vesicular nature of the aggregate, which enables the paste to
seep into the LWA particles for a better bond, and the pozzolanic nature of the aggregate
surface, which enables a chemical bond between the aggregate and the paste (CEB/FIP-
83, 1983). In LWC, the expansive products caused in these chemical reactions, if they
ever occur, can move into the pores of LWA, minimizing the distress (Bremner & Holm,
1995). The chemical composition of OPBC aggregate compared with other LWA
aggregates is mentioned in Table 2.3. As can be seen in this table, the chemical
composition of OPBC is almost similar to natural lightweight aggregate like pumice and
artificial lightweight aggregates such as lightweight expanded clay aggregate (LECA)
and Lytag. In contrast to these lightweight aggregates, OPS has much different chemical
compositions showing that it is a volatile organic (agricultural waste) material. Therefore,
Univers
ity of
Mala
ya

26
it is expected that concretes containing OPBC have better performance compared to OPS
concrete particularly at elevated temperature.
Table 2.3: Chemical properties of OPBC aggregates compared with other LWAs
Element Concentration (%)
OPBC OPS Pumice LECA* Lytag Calcium Oxide CaO 2.3-8.2 0.08 1.0-2.0 2.0-2.5 3.0-4.0 Silica dioxide SiO2 59.6-81.8 0.01 60.0-75.0 62.0-66.0 50.0-53.0 Ferric Oxide Fe2O3 4.62-5.2 0.03 1.0-7.0 7.0-9.0 5.0-6.0
Sulphur trioxide SO3 0.73 - 0.14 1.0-16.0 0.3 Aluminum Oxide Al2O3 3.5-3.7 0.13 13.0-17.0 0.2-16.0 23.0-25.0 Magnesium Oxide MgO 1.2-5.0 0.03 1.0-2.0 1.0-4.0 2.8-3.0
Phosphorous pentoxide P2O5 0.8-5.3 - - 0.21 - Potassium Oxide K2O 4.6-11.6 0.00 7.0-8.0 2.0-3.5 0.2 Titanium dioxide TiO2 0.2 - - - - Natrium Oxide Na2O 0.1-0.3 0.00 3.0-5.0 0.7-2.0 0.3
Manganese trioxide Mn2O3 - - - - - Manganese Oxide MnO - - - 0.14 -
- LOI - - - 0.84 - Ash - - 1.53 - - -
Nitrogen N - 0.41 - - - Sulphur S - 0.00 - - - Chloride Cl- - 0.00 - - -
Loss on ignition - - 98.5 1.52 - 3.1
Source: (Ahmmad, Jumaat, Bahri, & Islam, 2014; Arioz & Karasu, 2008; Hemmings et al., 2009; Hossain & Khandaker, 2004; Robani & Chee, 2009; Shafigh, Mahmoud, Razavi, & Kobraei, 2011; Shafigh et al., 2010)
2.3.4 Mechanical Properties of OPBC Compared with Other LWAs
The mechanical properties of OPBC aggregate, such as Los Angeles abrasion test, and
impact and crushing values, have been reported by many researchers. It has been reported
that the structure of OPBC aggregate and its rate of water absorption can significantly
affect the mechanical properties of the LWC (Ahmad et al., 2008). The density and
strength of the structural lightweight concrete depend on the mechanical properties of
OPBC aggregate (Mohammed et al., 2013). The mechanical properties of various LWAs
compared with OPBC aggregate are shown in Table 2.4. The crushing value of the
aggregates give a relative measure of the resistance of an aggregate to crushing under a
gradually applied compressive load. The crushing value of aggregates is restricted to 30%
for concrete used for roads and pavements, while 45% may be permitted for other
Univers
ity of
Mala
ya

27
structures (Mehta & Monteiro, 2006). The crushing value for OPBC aggregate is 6 to
10% lower than for crushed granite, and can be used for all types of structures.
In concrete, the toughness of the aggregates is usually considered as the resistance of
the material to failure by impact. IS-283 (1970) specifies that the impact value of
aggregates shall not exceed 45% by weight for aggregates used for concrete other than
for the wearing surface, and 30% by weight for concrete for the wearing surface (Mehta
& Monteiro, 2006; Neville & Brooks, 2008). With respect to impact and crushing
resistance, the resistance to wear is also an important factor for the aggregates. Generally,
the abrasion resistance of LWA is inferior to that of NWA due to the lower stiffness of
LWA (Alengaram et al., 2013). The abrasion value should not be more than 30% for the
wearing surface, and not more than 50% for concrete other than for the wearing surface
(Neville & Brooks, 2008). As can be seen in Table 2.4, the abrasion value for OPBC
aggregate is around 8 to 26% higher than for crushed granite. It was observed that all the
mechanical properties for OPBC aggregate were found to be in suitable ranges, and, can
be used in the construction industry as aggregate. Table 2.4 shows that the crushing,
impact and abrasion values of OPS and coconut shells are much lower than OPBC and
granite aggregates. The main reason for this difference is that these shells are similar to
wood and are relatively ductile materials while OPBC like granite aggregate is similar to
stone with brittle behaviour.
Table 2.4: Mechanical properties of OPBC compared with other LW & NW aggregates
Properties Agricultural solid wastes Crushed
granite OPBC Oil Palm Shell Coconut shell Aggregate Crushing value (%) 18.0-18.8 5.0-10.0 2.6 20.0 Aggregate Impact value (%) 25.0-38.6 4.0-8.0 8.2 13.0-17.0
Los Angeles abrasion value (%) 27.1 3.0-5.0 1.6 20.0-25.0
Source: (Ahmad et al., 2007b; Ahmad et al., 2008; Mohammed et al., 2014; Mohammed, Hossain, et al., 2011; Shafigh, Mahmud, Jumaat, Ahmmad, & Bahri, 2014)
Univers
ity of
Mala
ya
28
2.4 Mix Design for OPBC Concrete
In well-proportioned mixtures, the amount of cement and strength relationship are
fairly constant for a particular type or between one type and another. Therefore,
researchers prefer different trial mixtures with varying cement content, OPBC as fine and
coarse aggregates as well as other normal weight aggregates to develop the required range
of compressive strengths. From the literature, the selected mix proportions, and fresh and
hardened properties of OPBC concrete are shown in Table 2.5. Several researchers
conducted a series of experiments using cement, and OPBC as fine and coarse aggregates
to produce a structural lightweight aggregate concrete. It was reported that, without any
admixture, OPBC aggregate gives good workability of the concrete. The slump value was
found to be in the range of 45 to 190 mm while the 28-day compressive strength ranged
between 17 and 47 MPa (Abdullahi et al., 2008; Mohammed et al., 2014). The several
trial mixes to determine the suitable mix proportions for OPBC lightweight concrete was
examined by Mannan and Neglo (2010); they preferred three different mix design
methods. In all the mix proportions, the materials used were cement, river sand and OPBC
as the coarse aggregate, together with a super-plasticizer (SP). The slump value of the
mixes was in the range of 40-100 mm with the 28-day compressive strength and dry
density in the range of 27-36 MPa and 1845-1980 kg/m3, respectively. They also reported
that the addition of SP did not increase the workability of OPBC concrete, while Zakaria
(1986) used the same materials without any admixture and reported very low slump
values and a 28-day compressive strength range of 15 to 28 MPa. The effect of SP in
OPBC concrete was previously a controversial issue because it was totally a new waste
material. For comparison with NWC, Ahmad et al. (2007a) prepared five different mix
trials with one normal weight concrete and four LWC mixes. The NWC mix design was
based on the method proposed by the Department of Environment (DoE), while the LWC
series was designed using the Federation Internationale de la Precontrainte (FIP) method.
Univers
ity of
Mala
ya
29
The four mixes of LWC were further divided into two sets. The first set contained two
mixes; one mix was prepared using normal sand as the fine aggregate and OPBC as the
coarse aggregate. The second mix contained OPBC as both the fine and coarse aggregates.
It was observed that the mix prepared by using OPBC as the coarse and fine aggregates
gave an 18% lower compressive strength compared to the other trial mixes. The second
set was prepared by using the same aggregates as in the first set; however, in this set, the
cement was replaced with 10% fly ash. It was observed that the mix was prepared by
using OPBC as the coarse and fine aggregates and fly ash gave a 12% lower compressive
strength compared to the other trial mixes. Due to the porous nature of OPBC aggregate,
they preferred the use of an admixture to compensate the workability issue and to achieve
a stronger and more durable concrete. Finally, they concluded that OPBC concrete with
coarse OPBC, fine sand and 10% fly ash replacement in cement content produced higher
compressive and tensile strengths than concrete having 100% OPBC aggregates (coarse
and fine).
The comparative behaviour of normal and lightweight concretes using normal and
OPBC aggregates was studied by Hassan, Al-Mattarneh, Abdullahi, Mohamed, &
Mustafa (2008). A normal weight concrete mix was considered as the control mix, and,
in the other four mixes, the conventional aggregates were replaced in increments of 25%
with OPBC fine and coarse aggregates. The slump value and compressive strength of all
the mixes were found to be in the range of 0 to 70 mm and 26 to 42 MPa. It was observed
that the compressive strength of OPBC concrete increased up to 5% compared to the
control mix, through replacement with 25% OPBC coarse and fine aggregates. However,
a 35% reduction in the compressive strength and zero slump value compared to control
mix were observed through the 100% replacement with OPBC coarse and fine aggregates.
The reduction in the slump value and the compressive strength of OPBC concrete was
due to the high porosity and water absorption of OPBC aggregate. While, the durability
Univers
ity of
Mala
ya

30
properties of foamed OPBC concrete was investigated by (Chandran, 2010). They
reported that the foamed concrete incorporating OPBC aggregates has better chemical
resistance compared to conventional concrete.
The behaviour of the OPS concrete by replacing the normal sand with fine OPBC
aggregate was conducted by Shafigh et al. (2014). The OPS concrete with normal sand
was considered as the control concrete, and, in other mixes, the river sand was replaced
with fine OPBC aggregate in increment of 12.5% up to 50% replacement of sand. The
slump value and compressive strength for all OPBC-OPS concrete mixes were found in
the range of 30 to 76 mm and 32 to 37 MPa. While, Kanadasan & Razak (2014b) used
the particle packing concept to investigate the fresh and hardened properties of self-
compacting concrete (SCC) incorporating waste product of oil-palm-boiler clinker
aggregate. The actual packing level of aggregate and paste volume were integrated into
the method. The results indicated that the mixture design could be employed not only for
oil-palm-boiler clinker but also for a variety of combinations of aggregates. A study
conducted from Aslam, Shafigh, & Jumaat (2015) revealed that OPBC coarse aggregate
can be used as a partial replacement with OPS in OPS lightweight concrete. The
advantages of using OPBC in OPS concrete were significant increase in compressive
strength and efficiency factor (compressive strength to weight ratio).
2.5 Physical Properties of OPBC Concrete
2.5.1 Workability
One of the standard tests to check the workability of the concrete is the slump test,
which measures the consistency of concrete according to ACI-116R (2000). It is very
beneficial to manipulate the variations in the uniformity of the given mix proportions
(Neville, 2008). Similar to NWC, the slump value of LWAC also increased with an
increase in the water cement ratio; as shown in Table 2.5. It was reported by Shafigh et
Univers
ity of
Mala
ya

31
al. (2014) that OPBC, when used as a fine aggregate, it can absorb more water, even three
times to the normal weight sand. Therefore, it is expected that by increasing the amount
of OPBC aggregate and reducing the amount of normal sand in the concrete mixture, the
slump value decreases. Abdullahi et al. (2008) found that the slump ranges varied from
45 to 190 mm without using any admixture and posited that concrete using OPBC would
give good workability. After many trials, Mannan & Neglo (2010) obtained slump values
ranging between 40 and 100 mm with the super-plasticizer and having a compressive
strength up to 33 MPa. However, Ahmad et al. (2007a) used different types of aggregate,
such as normal sand as the fine aggregate and OPBC as both the fine and coarse
aggregates with the admixture. The slump value of concrete using OPBC as the fine and
coarse aggregates ranged from 85 to 105 mm with a compressive strength of 34 to 42
MPa. The concrete casted with OPBC and fly ash had a slump value ranging between 100
to 125 mm, and a compressive strength between 36 to 42 MPa. They demonstrated that
the 10% cement replacement by fly ash could even increase the compressive strength of
OPBC concrete. They further reported that by incorporating a small percentage of
admixture, a higher slump value could be achieved. They demonstrated that high range
water reducing admixtures are capable of dispersing cement grains that lead towards a
high slump value resulting in high workability. The detailed study was conducted using
OPBC as the coarse aggregate and natural sand as the fine aggregate to fabricate LWC
(Zakaria, 1986). The observed slump value was very low, varying from 1 to 15 mm with
a compressive strength up to 28 MPa. However, this does not necessarily mean that the
low slump ensures lower compressive strength. Hassan et al. (2008) reported a slump
value for NWC of 70mm with a compressive strength of 40 MPa, while the slump varied
from 0 to 50mm for LWC using both natural (coarse and fine) and OPBC (coarse and
fine) aggregates but with a compressive strength up to 42 MPa. The OPBC after crushing
is round in shape which may cause improvement on workability of concrete. For example,
Univers
ity of
Mala
ya

32
the incorporation of the OPBC as coarse aggregate in OPS concrete has significantly
improved the workability of the concrete. However, the contribution of fine OPBC in
OPS concrete reduced the slump value which was majorly due to the higher water
absorption compared to natural mining sand.
2.5.2 Plastic Density
The unit mass or unit weight in air of fresh concrete can be referred to as the plastic
density or fresh density of concrete. It can be computed by taking the sum of the masses
of all the ingredients of a batch of concrete divided by the volume filled by the concrete.
The LWAC using OPBC as both the fine and coarse aggregates was prepared by
Abdullahi et al. (2008). They reported that the plastic densities of OPBC concrete were
in the range of 1900 to 1970 kg/m3, depending on the mix proportions and the w/c ratio;
as shown in Table 2.5. The air-dry density for OPBC concrete is less than these values
yielding a lightweight concrete. Usually, the fresh concrete density of OPBC lightweight
concrete is 120 to 460 kg/m3 more than the saturated density, which might be attributed
to the water absorption of OPBC aggregate.
2.5.3 Hardened Density of OPBC Concrete
The compressive strength of concrete depends on the hardened density and is one of
the most important variables to consider in the design of concrete structures. The density
of structural lightweight aggregate concrete (SLWAC) typically ranges from 1400 to
2000 kg/m3 compared to that of 2400 kg/m3 for normal-weight concrete (NWC).
According to (Neville, 2008), the density of lightweight aggregate concrete lies between
350 to 1850 kg/m3, whereas Clarke (2002) reported that the density of LWC varies
between 1200 and 2000 kg/m3. Attempts have been made by many researchers to decrease
the density of OPBC concrete without affecting the compressive strength. The density of
OPBC concrete depends on various factors, such as, the type of cement, the specific
Univers
ity of
Mala
ya

33
gravity of OPBC, water cement ratio, sand and OPBC content, and water absorption of
OPBC. Some researchers studied the use of OPBC as both fine and coarse aggregates and
reported that the density of OPBC structural LWC ranged between 1440 and 1850 kg/m3
and was 23 to 40% lower than the density of NWC (Abdullahi et al., 2008; Kanadasan &
Razak, 2014b; Mohammed et al., 2014; Mohammed, Hossain, et al., 2011; Mohammed
et al., 2013). Few researchers Mannan & Neglo (2010) and Zakaria (1986) studied the
combination of OPBC (as coarse) and natural sand (as fine) aggregates. They stated that
the density of OPBC structural LWC lay in the range of 1800 to 2000 kg/m3. Whereas
Ahmad et al. (2007a) used the same materials, OPBC and natural sand as aggregates, but
replaced the cement by weight with 10% fly ash. They computed the density range as
1880 to 2030 kg/m3 and approximately 16 to 22% lower than the density of the NWC. It
was observed that by incorporating the 10% fly ash as a binder in OPBC concrete, the
density of the LWC was increased in the range of 1 to 4% compared to the mixes without
fly ash. A comparative study using a mixture of both ordinary aggregates and LWA
(OPBC as fine and coarse) was conducted by Hassan et al. (2008). The range for LWC
density varied between 1820 and 2345 kg/m3 and was 2 to 24% lower than the density of
NWC; as shown in Table 2.5. It was reported by Shafigh et al. (2014) that by
incorporating OPBC sand in OPS lightweight concrete up to 50% of the weight of normal
sand, the density of OPS concrete further reduced from 1990 to 1920 kg/m3. Further,
(Trumble & Santizo, 1993) stated that in the construction of a tower, LWC was
considered for use in the floors, whereas NWC was considered for use in the columns.
The volume of slabs is usually between 70% and 90% of the total volume of the concrete
used in the building (CEB/FIP, 1977). Moreover, strength is not a major consideration in
floor slabs; therefore, a large amount of LWC is used to decrease the dead load of the
concrete in the floors of multi-storey buildings (Mehta & Monteiro, 2006).
Univers
ity of
Mala
ya
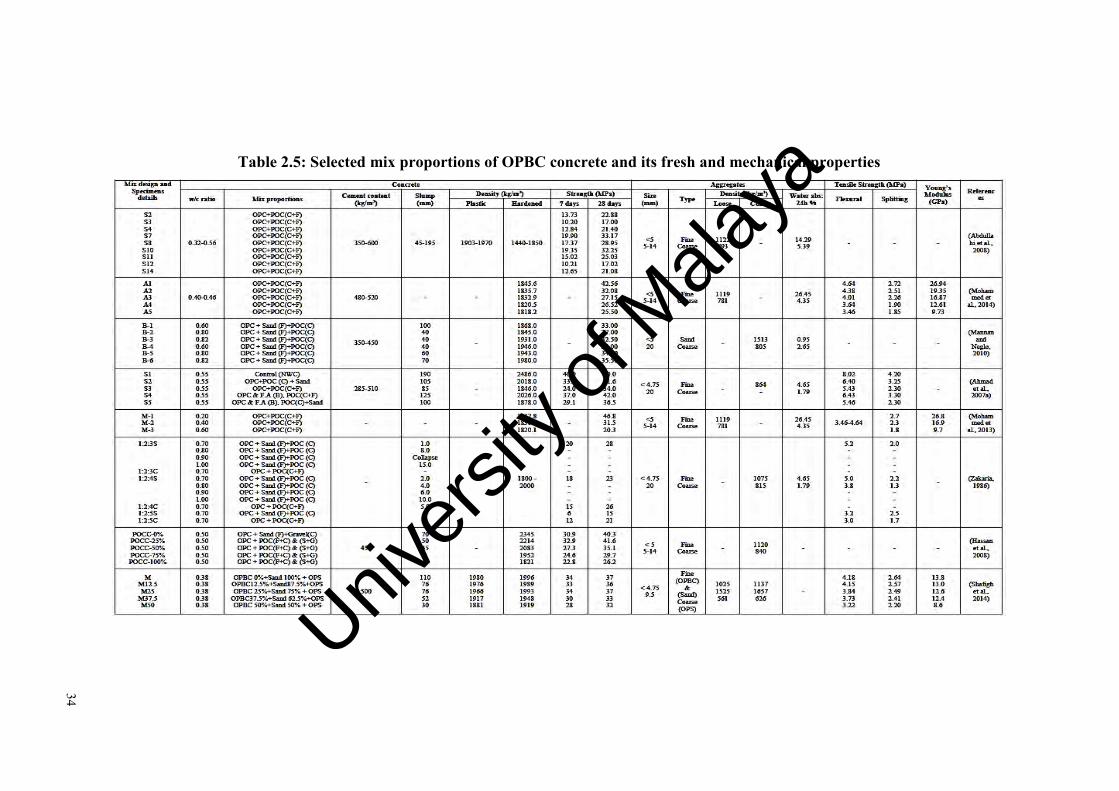
34
Table 2.5: Selected mix proportions of OPBC concrete and its fresh and mechanical properties
Univers
ity of
Mala
ya

35
2.6 Mechanical Properties of OPBC Concrete
2.6.1 Compressive Strength
The compressive strength of structural concrete is the most appropriate property for
any innovative material used in concrete technology. It affects all the other mechanical
properties of concrete such as flexural strength, splitting tensile strength and modulus of
elasticity. According to ACI, the cylindrical compressive strength of LWC at 28 days
should not be less than 17 MPa (Neville & Brooks, 2008).
Researchers have studied different LWAs, mix design and curing conditions to achieve
varying grades of strength. Some of them used OPBC as both fine and coarse aggregates
to develop a LWAC known as oil-palm-boiler clinker concrete (OPBCC). Abdullahi et
al. (2008) have studied properties of LWC by using of OPBC as both coarse and fine
aggregates in concrete mixture. Firstly, they selected a w/c ratio in the range of 0.32-0.56
and succeeded in developing a compressive strength range of 17 to 33 MPa. Further, they
continued their research to investigate the flexural strength of the same concrete, but this
time they selected the w/c ratio in the range of 0.40 and 0.46, and achieved a higher
compressive strength up to 47 MPa (Mohammed et al., 2014; Mohammed et al., 2013);
as shown in Table 2.5. Ahmad et al. (2007a) comparatively studied NWC by using the
DoE method and LWC using the FIP design method. They designed five different mix
proportions, one for NWC and four for LWC at the same w/c ratio of 0.5. The
compressive strength achieved for NWC was about 50 MPa, whereas for LWC, in the
first proportion, the materials preferred were binder (cement), OPBC (C) and natural sand
as aggregates at the same w/c ratio. This proportion gave an average compressive strength
of 42 MPa. It was approximately 16 % lower than the compressive strength of NWC. In
the second mix proportion, the preferred materials were the same, however, instead of
natural sand, fine OPBC was used. The reduction observed in the compressive strength
was up to 32%. Then, for the other two mix proportions, the materials preferred were the
Univers
ity of
Mala
ya

36
same as in the first and second mixes; however, fly ash was added with a binder up to
10% of OPC content. Nevertheless, the compressive strength was not affected by using
the fly ash, the compressive strength was 16 to 28% lower than the compressive strength
of NWC.
Several researchers studied the use of OPBC as a coarse aggregate for developing a
structural LWAC. Zakaria (1986) studied the use of OPBC as a coarse aggregate and
natural sand as a fine aggregate. The range selected for the w/c ratio varied between 0.70
and 1.0. Due to the high w/c ratio, he achieved a 28-day compressive strength ranging
between 15 and 28 MPa. Later, Mannan and Neglo (2010) studied the same aggregates
(OPBC and natural sand) to develop a LWC, but they selected a w/c range between 0.60
and 0.82. Due to the proper selection of the w/c ratio, they achieved better compressive
strength results varying between 27 and 36 MPa. The behaviour of LWC by using OPS
(coarse), normal and OPBC sands with a constant w/c ratio of 0.38 was studied by Shafigh
et al. (2014). The first matrix was considered as the control with cement, OPS and natural
sand; whereas, for the other proportions, the natural sand was replaced by OPBC sand at
12.5, 25, 37.5 and 50%. The 28-day compressive strength achieved ranged from 30 to 38
MPa, as shown in Figure 2.8.
Some researchers conducted a comparative study of the behaviour using a mixture of
normal weight aggregate (NWA) and OPBC as the coarse and fine aggregates to fabricate
LWAC. Hassan et al. (2008) fabricated five different mix proportions by using the ACI
design method with the same w/c ratio of 0.50. The first matrix was considered as the
control mix of NWC. In the next four matrixes, they replaced the NWA with OPBC
aggregate with 25% increments. The compressive strength for the mixes containing 0,
25%, 50%, 75% and 100% OPBC were 40, 42, 35, 30 and 26 MPa, respectively. The 25%
replacement of NWA with OPBC was able to give even better compressive strength than
Univers
ity of
Mala
ya
37
NWC. Later, Kanadasan and Razak (2014a) studied the same materials and mix pattern
with different w/c ratios ranging from 0.42 to 0.54. Due to the lower w/c ratio, they
achieved even better results for the compressive strength of concrete containing OPBC
varying from 35 to 50 MPa compared to control OPS concrete. Test results of a study by
Aslam et al. (2015) showed that in OPS lightweight concrete if OPS is substituted with
40% OPBC, the new concrete with this blended coarse lightweight aggregate has higher
compressive strength compared to OPS concrete. The main problem of OPS concrete is
due to the smooth surface texture of the shell for both concave and convex faces which
resulted weak bond in concrete. However, the incorporation of the rough textured OPBC
aggregate in OPS concrete has a significant effect on the compressive strength of the
concrete.
Figure 2.8 shows the relationship between the water to cement ratio with compressive
strength of OPBC concretes at 28 days age. As expected, by increasing the water to
cement ratio the compressive strength of OPBC concrete containing coarse or coarse and
fine aggregates reduces. This relationship shows that at the same water to cement ratio,
concrete containing coarse OPBC has higher compressive strength than the concrete
containing coarse and fine OPBC aggregates. This difference is more significant at higher
water to cement ratios.
Univers
ity of
Mala
ya
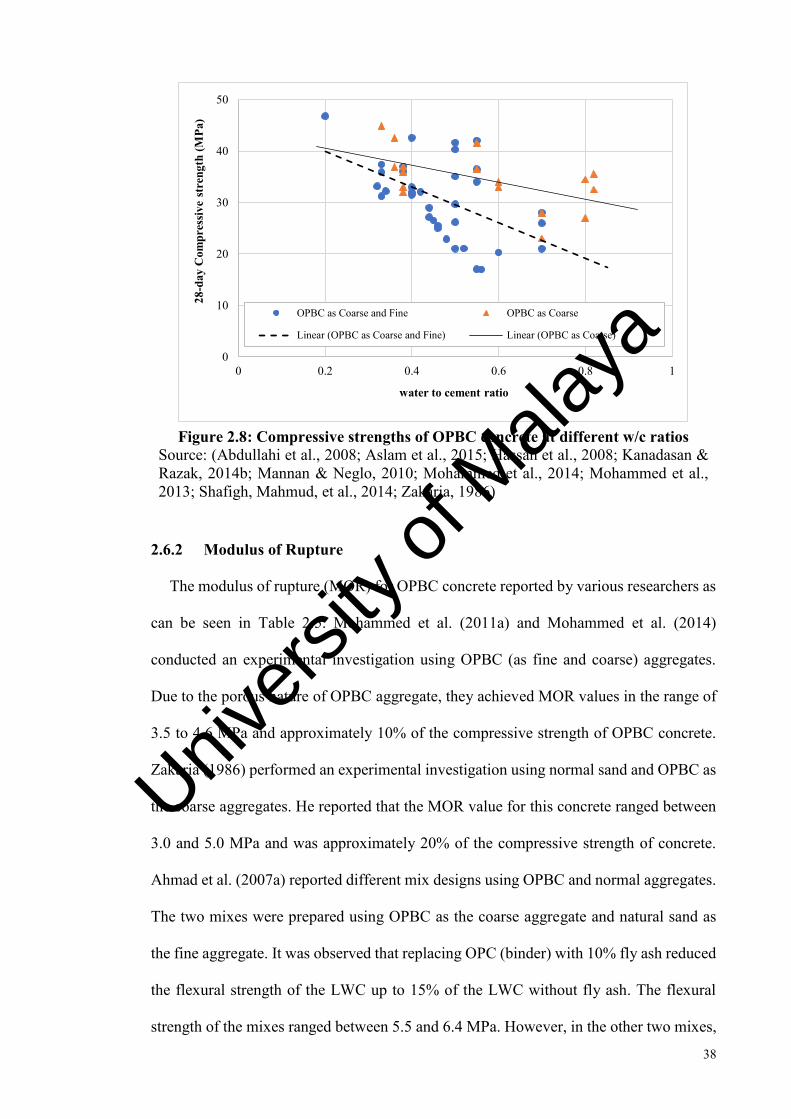
38
Figure 2.8: Compressive strengths of OPBC concrete at different w/c ratios
Source: (Abdullahi et al., 2008; Aslam et al., 2015; Hassan et al., 2008; Kanadasan & Razak, 2014b; Mannan & Neglo, 2010; Mohammed et al., 2014; Mohammed et al., 2013; Shafigh, Mahmud, et al., 2014; Zakaria, 1986)
2.6.2 Modulus of Rupture
The modulus of rupture (MOR) for OPBC concrete reported by various researchers as
can be seen in Table 2.5. Mohammed et al. (2011a) and Mohammed et al. (2014)
conducted an experimental investigation using OPBC (as fine and coarse) aggregates.
Due to the porous nature of OPBC aggregate, they achieved MOR values in the range of
3.5 to 4.6 MPa and approximately 10% of the compressive strength of OPBC concrete.
Zakaria (1986) performed an experimental investigation using normal sand and OPBC as
the coarse aggregates. He reported that the MOR value for this concrete ranged between
3.0 and 5.0 MPa and was approximately 20% of the compressive strength of concrete.
Ahmad et al. (2007a) reported different mix designs using OPBC and normal aggregates.
The two mixes were prepared using OPBC as the coarse aggregate and natural sand as
the fine aggregate. It was observed that replacing OPC (binder) with 10% fly ash reduced
the flexural strength of the LWC up to 15% of the LWC without fly ash. The flexural
strength of the mixes ranged between 5.5 and 6.4 MPa. However, in the other two mixes,
0
10
20
30
40
50
0 0.2 0.4 0.6 0.8 1
28-d
ay C
ompr
essiv
e st
reng
th (M
Pa)
water to cement ratio
OPBC as Coarse and Fine OPBC as Coarse
Linear (OPBC as Coarse and Fine) Linear (OPBC as Coarse)
Univers
ity of
Mala
ya

39
which contained OPBC as the coarse and fine aggregates, it was reported that replacing
OPC with 10% fly ash could enhance the modulus of rupture up to 15% of the mix without
fly ash. The MOR values for these mixes were found to be in the range of 5.4 to 6.4 MPa,
and these values were almost 15% of the compressive strength of the LWC. The MOR
value is affected from the mix design proportions. Mohammed et al. (2014) and Ahmad
et al. (2007a) used nearly similar w/c ratios, but with a higher binder (fly ash) content,
Ahmad et al. (2007a) reported an increment in the MOR of the lightweight concrete. A
similar trend was reported by Mahmud et al. (2009), albeit with the use of cementitious
materials. It was further reported that the MOR increased when the amount of cement
content increased, and decreased when the w/c ratio increased (Mohammed, Hossain, et
al., 2011; Mohammed et al., 2013).
The relationship between the MOR and compressive strength was further investigated
using the different equations suggested by a number of standards and researchers. The
fabrication of the LWAC was examined with OPBC as coarse and fine aggregates, as
well as with natural sand and OPS. The binders can be used normally or mixed with fly
ash for the fabrication of LWAC. There are several proposed equations to predict the
MOR from the compressive strength (CEB/FIP, 1977; Shafigh, Jumaat, Mahmud, &
Norjidah, 2012). However, not all of them can be used for OPBC concrete. Using the
existing data, Equation 2.1 gives a good estimation of the MOR for OPBC concrete from
the compressive strength with a R2 of 70 to 90%. However, as a specific equation,
Equation 2.2 could be used. This equation (CEB/FIP, 1977) was previously suggested for
predicting the MOR of LWAC with a cube compressive strength in the range of 20 to 60
MPa. The Equation 2.2 gives about 85% reliability between the experimental and
predicted values.
fr = K √𝑓𝑐𝑢 (2.1)
Univers
ity of
Mala
ya

40
fr = 0.46 √𝑓𝑐𝑢23 (2.2)
where, fr and fcu are the 28-day flexural and compressive strengths in MPa, and “K” is
the constant parameter ranging between 0.73 and 0.76.
A comparison between the existing experimental data for OPBC concrete with the
predicted modulus of rapture from the equations proposed by (ACI363, 1992); (Lo, Cui,
& Li, 2004), IS (Short, 1978), and the proposed equation for high strength lightweight
aggregate concrete (HSLWAC) (CEB/FIP, 1977) shows that the equations suggested by
ACI and IS gives almost similar results (an error below 10%) to the experimental values.
While, the equation proposed for HSLWAC gives very conservative estimation for all
OPBC concretes.
2.6.3 Splitting Tensile Strength
The compressive strength is the property of concrete normally considered in a
structural design, however, for some purposes, such as the design of airfield slabs and
highways, resistance to cracking, the shear strength and the tensile strength are of interest
(Neville, 2008). Mohammed et al. (2013; 2014) reported that when using OPBC as fine
and coarse aggregates, the splitting tensile strength value ranged between 1.8 and 2.7 MPa
with the w/c ratio varying from 0.20 to 0.60, and was around 6 to 10% of the compressive
strength. They further reported that the splitting tensile strength increased when the
cement content increased, and decreased when the w/c ratio increased. Ahmad et al.
(2007a) fabricated LWC using OPBC aggregate and binders (OPC and fly ash); the
observed splitting tensile strength varied from 2.30 to 3.30 MPa, and was 6 to 8% of the
compressive strength. This range of splitting tensile strength was about 16 to 32% less
than the control normal weight concrete. They reported that the splitting tensile strength
of the concrete was dependent on the splitting tensile strength of OPBC aggregate.
Univers
ity of
Mala
ya

41
Zakaria (1986), who studied the mixture of natural sand and OPBC (as coarse), found
that the splitting tensile strength of concrete varied from 1.3 to 2.5 MPa with a very high
w/c ratio of 0.70 to 1.0, and was about 6 to 16% of the compressive strength. As reported
by Al-Khaiat & Haque (1998) that the splitting tensile strength of structural LWC was
less than the tensile strength of similar strength grade NWC. Furthermore, Shafigh et al.
(2014) performed a detailed study using OPS (as coarse), normal and OPBC sands. The
splitting tensile strength ranged between 2.2 and 2.6 MPa. They reported that the rate of
compressive strength gained with time was more significant than the rate of the splitting
tensile strength.
The relationship between the splitting tensile strength and the compressive strength
was further investigated using the different equations suggested by a number of standards
and researchers. The fabrication of the LWAC was examined when OPBC was used as
coarse and fine aggregates, or with the natural sand and OPS. Equation 2.3 shows a
general relationship between the splitting tensile strength and compressive strength
(ACI363, 1992; Slate, Nilson, & Martinez, 1986). In this form of proposed equation, if
the constant K varied between 0.46 and 0.53, the splitting tensile strength of OPBC
concrete could be predicted with a 77 to 91% reliability. The equation suggested by
(Shetty, 2005) for the splitting tensile strength of NWC was also implemented for OPBC
concrete. It was observed that this (Equation 2.4) gave more reliable results of
approximately 90% of the experimental results for the splitting tensile strength of OPBC
lightweight concrete. An equation for the splitting tensile strength of the LWC with
expanded clay and shale with a cube compressive strength ranging between 20 and 60
MPa, was also investigated (Shafigh et al., 2010). It also gave very high reliability ranges
between 70 and 97% for OPBC concrete, as shown in Equation 2.5.
ft = K √𝑓𝑐𝑢 0.46 < K < 0.53 (2.3)
Univers
ity of
Mala
ya

42
ft = 1.05 + 0.005fcu (2.4)
ft = 0.27 (fcu) 0.63 (2.5)
where, ft is splitting tensile strength and fcu is the 28-day compressive strength in MPa.
The experimental data for OPBC concrete was also compared with the predicted
splitting tensile strength from the equations proposed by ACI 363 (1992), CEB/FIP,
(1977), and NWC (Shetty, 2005). It was observed from the results that the equations
suggested by ACI, CEB-FIP and NWC showed closer estimations (an error in the range
of 5-15%) to the experimental values. If it be assumed that a prediction error of up to 10%
is acceptable then all these equations can be used for OPBC concretes.
2.6.4 Modulus of Elasticity
The Young’s modulus of elasticity or E-value of the concrete is one of the most
important parameters in the design of structural members. The modulus of elasticity of a
material is a measure of its stiffness, and, for most materials, remains constant over a
range of stresses. The E-value of the concrete depends upon the moduli of elasticity of its
constituents and their quantities by volume in the concrete; its value is reduced when
NWAs were replaced by LWAs (Neville, 2008). The modulus of elasticity of LWAs was
less than NWAs and was even smaller than mortar, ranging mostly from 5 to 28 GPa
(CEB/FIP, 1977). Therefore, it is projected that by enhancing the volume of LWA and
reducing the volume of the normal aggregate, there is a reduction in the modulus of
elasticity of concrete. Generally, the modulus of elasticity of structural LWC ranges
between 10 and 24 GPa, while, in NWC, it ranges from 14 to 41 GPa (Shafigh et al.,
2014). Only a few researchers have focused on this important property in their study.
Mohammed et al. (2013; 2014) used OPBC as both fine and coarse aggregates with
different mix proportions and w/c ratios. The E-value varies from 9.7 to 27 GPa. Shafigh
Univers
ity of
Mala
ya
43
et al. (2014) considered different materials, such as OPS as lightweight coarse aggregate,
normal and OPBC sands as fine aggregates with different mix proportions, and attained
a varying range of modulus of elasticity between 8.6 and 13.8 GPa. They reported that
the modulus of elasticity of OPS concrete containing 37.5% (percentage of total sand) of
OPBC sand is in the normal range for structural LWA concrete.
The relationship between the modulus of elasticity (E) and compressive strength (fcu)
was further investigated using the different equations suggested by some researchers. The
fabrication of the LWAC was examined when OPBC was used as both coarse and fine
aggregates. The general equation (2.6) proposed by ACI318R (2005) for the modulus of
elasticity of NWC was investigated for OPBC lightweight concrete. It was observed that
this equation gave an 80% reliability between the experimental and theoretical results.
The equation suggested by BS-8110 (1986) for the modulus of elasticity of the NWC was
also implemented for OPBC concrete. It was observed that this (Equation 2.7) gave good
reliability for OPBC lightweight concrete.
E = 0.043 ω1.5 (fcy)0.5 (2.6)
E = 0.0017 ω2 (fcu)0.33 (2.7)
where, E is the expected modulus of elasticity (MPa), ω is the air-dry density (kg/m3);
fcu and fcy are the cubical and cylindrical compressive strengths (MPa).
The experimental data for OPBC concrete was also compared with the equations
proposed by ACI 318 (2005), CEB/FIP (1977) and BS-8110 (1986). The results showed
that for OPBC concretes, the models suggested by ACI, BS-8110 and NWC gives closer
results (an error up to 13%) to the experimental values. While, the equation of CEB-FIP
gives very conservative results for all OPBC concretes.
Univers
ity of
Mala
ya

44
2.7 Structural Behaviour of OPBC Concrete
2.7.1 Flexural Behaviour
The flexural behaviour of reinforced concrete (RC) beams produced by OPBC (as
coarse and fine aggregates) was reported by Mohammed et al. (2014). Eight beams, four
each, singly and doubly reinforced, and were tested with different reinforcement ratios
varying between 0.34 and 2.21%. It was observed that all OPBC concrete beams showed
the typical flexural failure mode, whereas, the flexural cracks originated first in the
constant moment zone. The beams were designed as under-reinforced; therefore, the
failure was initiated by yielding of the tensile steel reinforcement before the compression
failure of the concrete. Generally, similar to the NWC beams, the ductility ratio of the
reinforced OPBC concrete beams reduced as the steel reinforcement ratio increased.
Mohammed et al. (2014) further suggested that due to the increasing load, the effect of
flexure and shear combination created new flexural cracks in the shear span and curved
diagonally. They further computed the ultimate moment (Mult) and the theoretical design
moment (recommended by BS-8110), and claimed that OPBC concrete beams with
reinforcement ratios of 2.23 or less the ultimate moment (Mult) obtained experimentally
was approximately 1 to 7% higher than the predicted value. Further, they recommended
that the BS-8110 based design equations be used for the prediction of the flexural capacity
of OPBC concrete beams with reinforcement ratios up to 2.23% because most of the
ductility index observed in OPBC concrete beams was 2.71. From this result, they
reported that the reinforced OPBC concrete beams exhibited lower ductility behaviour
with the increase in the reinforcement ratio. In addition, the deflection under the design
service loads for singly reinforced OPBC concrete beams with a reinforcement ratio less
than 0.5% was within the allowable limit provided by BS-8110. Therefore, it was
suggested that for beams with a higher reinforcement ratio, beam depths should be
increased. Six under-reinforced beams with varying reinforcement ratios (0.52% to
Univers
ity of
Mala
ya
45
3.90%) were designed by Teo, Mannan, & Kurian (2006). They reported that the ultimate
moments predicted using BS-8110 provided a conservative estimate for OPS concrete
beams up to a reinforcement ratio of 3.14%, with experimental ultimate moments of
approximately 4% to 35% higher compared to the predicted moments. For the beam with
a 3.90% reinforcement ratio, BS-8110 underestimated the ultimate moment capacity by
about 6%. Further, it was observed that in OPS concrete beams with reinforcement ratios
up to 2.01%, the ductility ratio was more than 3, which showed relatively good ductility.
It was also reported that a higher tension reinforcement ratio resulted in lower ductile
behaviour. Therefore, it could be seen that for both types of lightweight aggregate
originating from the palm oil industry, the steel reinforcement ratio of RC beams should
be limited to a certain amount. In general, the reinforcement ratio of RC beams for normal
weight concrete beams varied from 0.3 to 8 % of the gross cross-sectional area of the
concrete (Narayanan, Wilson, & Milne, 2000). While for LWC, the British and American
codes do not differentiate between the lightweight and normal weight concrete under
flexure; however, the draft European code considers lightly stressed and highly stressed
members, based on the level of stress in the reinforcement. As a guide, it says that
members with less than 0.5% of tension reinforcement can be taken as being lightly
stressed, as is normally the case for slabs. Highly stressed members are assumed to have
1.5% of reinforcement or more (Clarke, 2002).
Mohammed et al. (2014) also reported that the crack widths for OPBC concrete beams
at service loads ranged from 0.24 mm to 0.30 mm while it is 0.22 mm to 0.27 mm for
OPS concrete beams (Teo et al., 2006). The researchers reported that the crack widths for
OPS and OPBC concrete beams were found in the allowable limit as recommended by
ACI 318 and BS-8110 for durability requirements. ACI 318 permits the crack widths up
to 0.41 mm, whereas this limitation for BS-8110 is 0.3 mm (Mohammed et al., 2014).
Further, Hussein, Mustapha, Muda, & Budde (2012) carried out modelling works on
Univers
ity of
Mala
ya
46
reinforced OPBC beams with web openings using response surface methodology (RSM).
The authors revealed that the use of RSM was capable of predicting the ultimate load of
reinforced POC beams with web openings with an accuracy of 99.27%.
Mohammed et al. (2011a) used OPBC aggregate to fabricate composite floor slab with
profiled steel sheeting and compared its flexural performance with the corresponding
conventional NWC slab with both long and short shear spans. In the study, it was found
that both types of slab failed in a similar manner, which was shear-bond failure.
Nevertheless, all the slabs were considered to exhibit ductile behaviour. The deflection
of the OPBC slab was found to be higher compared to conventional NWC slab and the
authors reasoned this to the lower modulus of elasticity of OPBC. Despite this, the authors
concluded that the behaviour of the OPBC slab was satisfactory and could be used for the
construction of composite slabs. Since one of the main advantages of using composite
deck slab is being a lightweight structure building material, the use of OPBC for such
purpose could further enhance its application since the OPBC slab was found to have
about 18% lower self-weight compared to NWC slab in this study.
2.7.2 Shear Behaviour
In terms of structural behaviour, the shear strength of concrete is considered as the
most controversial topic (Kong & Evans, 1998). Mohammed et al. (2013) fabricated
seven reinforced OPBC concrete beams to investigate the shear behaviour. All the beams
were designed as under-reinforced and the compressive strength of selected OPBC
concrete was about 20, 32 and 40 MPa with an air-dry density of 1820, 1830 and 1838
kg/m3. They considered three main parameters to investigate the shear behaviour of
OPBC concrete beams: the shear span to effective depth ratio (a/d), tension reinforcement
ratio (ρ) and compressive strength of OPBC concrete. They reported that the structural
behaviour and failure mode of the reinforced OPBC concrete beams under shear were
Univers
ity of
Mala
ya

47
similar to that of the conventional RC beam. The experimental results were also compared
with the shear strength design equation proposed by the Canadian Standard Association
(CSA). For the beams having a shear span to effective depth (a/d) ratio less than 2, the
bending cracks did not develop, but, suddenly, the shear cracks developed at 45o and ran
through the compression zone and produced collapse. However, for the beams having
2<a/d<6, the initial bending appeared and became inclined early in the loading stage, and,
at collapse, horizontal cracks were produced and ran parallel to the tensile reinforcement.
These horizontal cracks decreased the shear resistance of the member by destroying the
dowel force and reduced the bond stresses between OPBC concrete and steel. Further, it
was noted that the shear-cracking mode of reinforced OPBC concrete beams was very
similar to that of conventional reinforced concrete beams without shear reinforcement.
The theoretical shear resistance of reinforced OPBC concrete beams (Vc) was
computed using different equations, as given in ACI-318 (2002) (Eq: 2.8) and CSA (Eq:
2.9), and as given below (Mohammed et al., 2013):
Vc = 𝜆√𝑓𝑐
′
6𝑏𝑤𝑑 (2.8)
Vc = βφcλ√𝑓𝑐′ bwd (2.9)
where 𝑓𝑐′ is the standard cylinder compressive strength, bw is the width of the beam, d
is the effective depth of the beam, β is the factor accounting for the shear resistance of the
cracked concrete = 0.18, φc is the resistance factor of concrete having the value 0.65 and
λ is the factor for low density concrete = 0.75.
Mohammed et al. (2013) generally found four different types of failure: (1) if a/d > 6;
the failure mode was similar to that of pure bending, (2) when 2<a/d<6; the failure mode
was in shear due to the anchorage failure between the steel and concrete, (3) if a/d < 2;
Univers
ity of
Mala
ya

48
the failure mode was in shear due to compression zone failure, and finally, (4) if a/d = 0;
the punching shear failure was occurred. It should be noted that the shear strength has
been expressed as the failure moment obtained by multiplying it with the shear span (a).
The failure of the beam governed by a/d ratio could be classified in four groups. When
the a/d ratio was less than 1, the beams failed in splitting or experienced compression
failure. This normally appeared as an inclined thrust between the load and the support
point. However, when the a/d ratio ranged from 1 to 2.5, it forced the beams to fail in
shear compression. Diagonal tension failure occurred when the a/d ratio was in the range
of 2.5 to 6. Flexural failure occurred when the a/d ratio is greater than 6. This failure was
initiated due to the yielding of the tension steel reinforcement (Sinha, 2002).
Clarke (2002) studied the available data and carried out additional tests on beams, both
with and without shear reinforcement by using two artificial LWAs as well as pumice.
The resulting strengths were 30 and 50 MPa at densities of 1700 and 2000 kg/m3. It was
concluded that without shear reinforcement, a 0.9 reduction factor would be more
appropriate. For beams with links, no reduction factor was necessary. Furthermore, it was
reported that by replacing 0.8 with 0.9 led to an effective reduction factor of 0.94 with
nominal shear reinforcement. Lightweight aggregate beams with shear reinforcement will
carry 90% capacity compared to normal weight beams. It was also reported that the a/d
ratios for lightweight aggregate concrete was 0.85 times that for normal weight concrete
(Clarke, 2002).
2.7.3 Behaviour of OPBC Concrete under Prestressing
LWA concrete has been used in place of NWC in building applications to reduce the
dead load and dimensions of the members. Recently, researchers and bridge engineers
have wanted to implement the use of normal strength LWC and high strength LWC for
similar reasons. It was reported by Bender (1980) found that the LWC was very
Univers
ity of
Mala
ya

49
economical, especially for long span structures. Roslli and Mohamed (2002) studied and
compared the performance of prestressed OPBC lightweight concrete beams with normal
prestressed concrete beams under two-point static loading. They designed four pre-
tensioned prestressed concrete beam specimens without web reinforcement; two beams
were cast using OPBC (as coarse and fine aggregates) and another two beams using
normal weight aggregates. Both types of concrete were designed to achieve the targeted
strength of 40 MPa, which is the minimum required strength for pre-tensioned prestressed
structures (BS-8110, 1986). The concrete batches were designed for a workable and
cohesive mixture. The physical and mechanical properties of OPBC and normal concretes
used for pre-tensioned beams are mentioned in Table 2.6.
Table 2.6: Physical and mechanical properties of the pre-tensioned concretes
Properties OPBC lightweight
concrete Normal weight
concrete Fresh unit weight (kg/m3) 1950 2370
Cubical compressive strength (MPa) 46.0 44.0 Modulus of rupture (MPa) 6.1 6.4
Tensile strength (MPa) 3.2 3.3 Modulus of Elasticity (GPa) 22.0 30.0
Source: (Roslli & Mohamed, 2002)
Roslli and Mohamed (2002) also reported the cracking behaviour in prestressed OPBC
concrete beams. The cracks appeared in the early stages because of the lower cracking
load and low tensile strength as compared to NWC. The crack lines in OPBC concrete
propagated smoothly and almost linear during load increment. This was due to the softer
and weaker properties of OPBC concrete, while for the NWC with high strength
aggregates the crack lines propagated roughly. The difference in the load carrying
capacity for prestressed lightweight concrete beams was only 6.4%. The deflection at
maximum load for prestressed OPBC concrete beams was approximately 25% higher
than for the prestressed normal weight concrete beams. This is because materials with a
Univers
ity of
Mala
ya

50
lower modulus of elasticity deform more than stiffer materials (Shuaib & Barker, 1991).
It was also found that OPBC concrete beams tend to have higher deflection of about 32%
at lower failure load compared to the NWC specimens. The failure mode of both NWC
and OPBC concrete beams showed a very similar result. All beam specimens failed in
shear with almost similar maximum strength.
2.8 Conclusions
The application of oil-palm-boiler clinker (OPBC) as lightweight aggregate (LWA) to
produce OPBC concrete was reviewed through existing literature. The physical,
mechanical, chemical, durability, functional and structural behaviour of OPBC concrete
were discussed and compared with other lightweight aggregates. The behaviour of OPBC
concrete was compared also with conventional concrete. Based on the literature review,
the following conclusions can be drawn:
1. OPBC is in lump of irregular shapes with rough and spiky broken edges and sizes
varying from 150 to 225 mm, whitish grey in colour and has the appearance of a
porous stone. OPBC can be termed as lightweight aggregate with a specific
gravity of 1.70-2.20. OPBC aggregate is 15-30% lighter than NWAs and 47-53%
heavier than artificial LWAs.
2. The OPBC aggregate is a porous material and it will absorb high amount of water
compared to the normal weight aggregates. The 24-h water absorption for fine and
coarse OPBC aggregates ranges from 4.7 to 26.5% and 1.8-5.4%, respectively.
3. The Los Angeles abrasion and crushing values of OPBC aggregates are much
lower than agricultural solid wastes such as oil palm shell and coconut shell.
However, the values of these properties for OPBC aggregates are in suitable range
suggested by the codes, and show that it can be used in all types of structures. The
Univers
ity of
Mala
ya

51
main reason for lower abrasion and crushing values is that the shells are similar to
wood and are relatively ductile materials while an OPBC is a brittle material.
4. OPBC is stated to have very low workability as seen from slump values due to
rough, spiky and angular edges. Though, the super-plasticizer can be used to solve
the low workability problem.
5. The hardened density of OPBC concrete was found in the range of 1440-2212
kg/m3.
6. When OPBC was used as coarse aggregate with normal sand, the 28-day
compressive strength was found in the range of 15-42 MPa with the density of
1800-2000 kg/m3. However, concretes containing both coarse and fine OPBC
aggregates may have a compressive strength in the range of 17-47 MPa with a
density of 1440-1850 kg/m3.
7. The self-compacting concrete (SCC) can be successfully produced using OPBC
aggregates and particle packing method. The results indicated that the mixture
design could be employed not only for OPBC but also for a variety of
combinations of aggregates. It not only helps to conserve the natural resources but
also promotes sustainability in preserving the environment.
8. The replacement of natural mining sand with OPBC sand in OPS concrete reduces
the compressive strength of the concrete. However, the substitution level of OPBC
sand was optimized up to 25% in OPS concrete.
9. The OPBC concrete showed the modulus of rupture in the range of 10-20% of the
compressive strength, whereas this range is about 6-10% for splitting tensile
strength. However, the modulus of elasticity of this lightweight concrete was
found in the range of 8.5-27.0 GPa.
10. The reinforced OPBC concrete beams show the typical flexural failure mode, and
displayed higher ductile behaviour compared to the NWC beams. The moment
Univers
ity of
Mala
ya
52
curvatures of the beams of OPBC concrete also followed the same trend as that of
NWC with a crack widths at service loads in the range between 0.24 mm and 0.30
mm.
11. The structural behaviour and the failure mode of OPBC reinforced concrete beam
under shear is similar to that of conventional reinforced concrete beam, and the
aggregate interlock property increases the shear strength in OPBC concrete.
12. The use of response surface methodology (RSM) on reinforced OPBC beams is
capable of predicting the ultimate load of reinforced OPBC beams with web
openings with an accuracy of 99.27%.
13. The OPBC aggregate can contribute to good bonding strength with the mortar
matrix due to its surface texture and rough plane faces.
14. The deflection of the prestressed OPBC concrete beams was slightly greater than
the NWC beams. This was expected due to lower elastic modulus. The cracking
behaviour of prestressed OPBC lightweight concrete beams is almost similar to
that of prestressed NWC beams.
Univers
ity of
Mala
ya

53
BENEFITS OF USING BLENDED WASTE COARSE
LIGHTWEIGHT AGGREGATES IN STRUCTURAL LIGHTWEIGHT
AGGREGATE CONCRETE
3.1 Introduction
Concrete is the most widely used construction material in civil engineering structures.
It has an excellent resistance to water and can be formed into a variety of shapes and sizes
(Shafigh et al., 2010). Nowadays, the concrete industry consumes enormous amounts of
natural resources and raw materials for production (Shafigh et al., 2013). Because of the
huge amount of concrete produced daily, even a small reduction in the use of raw
materials in concrete mixtures will result in considerable benefits to the environment
(Altwair & Kabir, 2010). The best way to achieve sustainability in the concrete industry
is to utilize by-products and waste materials (Mannan & Neglo, 2010).
The use of lightweight concrete (LWC) in a structure reduces its overall dead load
which can be considerable (Bremner & Eng, 2001). Structural lightweight concrete is
usually made with lightweight aggregate (LWA). In most cases, the LWA used in
lightweight aggregate concrete (LWAC) is coarse. One LWA that is abundantly available
in most tropical countries is oil palm shell (OPS), a solid waste from the palm oil industry.
The density of OPS is within the range of most typical lightweight aggregates, with a
specific gravity in the range of 1.1-1.4 (Shafigh, Jumaat, Mahmud, et al., 2012). However,
reports (Alengaram et al., 2013; Teo et al., 2006) have shown that it has high water
absorption in the range of 14-33%.
In the last two decades, OPS have been used as an LWA for producing structural
LWAC with a density 20-25% lower than NWC (Shafigh, Jumaat, Mahmud, et al., 2012;
Shafigh et al., 2010). Ali, Abdullah, Salam, and Rahim (1984) and Salam, Ali, and
Abdullah (1987) introduced the use of OPS as an LWA, achieving a compressive strength
Univers
ity of
Mala
ya

54
of 20 MPa with a water to cement ratio of 0.4. Okafor (1988) reported a compressive
strength of 25-35 MPa for OPS concrete, which is in the range of typical compressive
strength for structural lightweight concrete (Kosmatka et al., 2002). Mannan and
Ganapathy (2001b) reported that depending on the curing condition, the 28-day
compressive strength of OPS concrete ranged between 20 and 24 MPa with a water to
cement ratio of 0.41. Later, they stated that OPS aggregate could be treated by using a
20% polyvinyl alcohol solution, which significantly reduces water absorption and
provides a better interlock with cement paste. They reported that lightweight concrete
containing treated OPS has a 40% higher compressive strength than the control OPS
concrete (Mannan, Alexander, Ganapathy, & Teo, 2006). Yew, Mahmud, Ang, and Yew
(2014) also examined the heating method for treatment of OPS coarse aggregate. They
reported that the advance in heat treatment methods has no significant effect on the
compressive strength. However, it enhances workability by about 20% and slightly
reduces the density of the OPS concrete. They achieved a 28-day compressive strength
of 49 MPa for OPS concrete using treated OPS. Alengaram, Mahmud, and Jumaat (2011)
achieved the highest compressive strength, reaching about 37 MPa by using silica fume
and class F fly ash. Recently, high strength OPS lightweight concrete was successfully
produced by (Shafigh, Jumaat, & Mahmud, 2011; Shafigh, Jumaat, Mahmud, &
Alengaram, 2011; Shafigh, Mahmud, & Jumaat, 2011) with a compressive strength in the
range of 42-53 MPa. The key characteristic of mix proportions of a high strength OPS
concrete is the use of crushed OPS, smaller sizes of coarse OPS, low water to cement
ratio and the use of limestone powder in the concrete mixture as filler (Shafigh, Jumaat,
& Mahmud, 2011). Recently, Mo et al. (2016) investigated the durability properties of a
sustainable concrete by using OPS as coarse and manufactured sand as fine aggregates.
They reported that the use of GGBFS as partial cement replacement in the OPS concrete
Univers
ity of
Mala
ya
55
increased the compressive strength gain compared to OPS concrete without any GGBFS
over the curing period of 1 year.
A report by Teo, Mannan, and Kurian (2009) revealed that when normal coarse
aggregate is substituted with OPS, mechanical properties such as compressive, splitting
tensile and flexural strengths are reduced by about 48%, 62% and 42%, respectively.
However, a maximum reduction of up to 73% was observed for the modulus of elasticity.
The modulus of elasticity of OPS concrete is in the normal range of 5.5-11 GPa, which is
considered a low value in this property (Alengaram, Mahmud, et al., 2011; Mannan &
Ganapathy, 2002). However, Shafigh, Mahmud, and Jumaat (2012) reported that for high
strength OPS concrete, it could increase up to 18 GPa. It should be noted that, generally,
the modulus of elasticity of structural lightweight concrete ranges between 10 and 24 GPa
(CEB/FIP, 1977). A low value causes excessive deformation in structural elements such
as slabs and beams. The durability properties of different grades of OPS concrete have
also been studied by several researchers (Haque, Al-Khaiat, & Kayali, 2004; Mannan et
al., 2006; Teo, Mannan, Kurian, & Ganapathy, 2007), and their reports have shown that
this concrete can be considered a durable.
Although previous studies have shown that OPS concrete has satisfactory mechanical
and durability properties, it does have some drawbacks that need to be addressed before
it can be used in real structures. One of the main drawbacks is sensitivity of compressive
strength in poor curing conditions. Compared to normal aggregate concrete, OPS show a
significant reduction in strength when not properly cured (Mannan & Ganapathy, 2002;
Shafigh, Jumaat, & Mahmud, 2011). Mannan and Ganapathy (2002) reported that OPS
concrete subjected to 7-day moist curing showed 17% lower compressive strength than
OPS concrete under full water curing. High strength OPS concrete is also sensitive to
poor curing. A minimum period of 7 days of moist curing is recommended for this type
Univers
ity of
Mala
ya

56
of concrete (Shafigh, Jumaat, Mahmud, et al., 2012). The sensitivity of compressive
strength of OPS concrete increases when the mixture contains a high cement dosage, low
water to cement ratio or high OPS content (Shafigh, Jumaat, & Mahmud, 2011). Islam et
al. (2016) investigated the fresh and mechanical properties of sustainable OPS lightweight
by using agro-solid waste materials. The OPS was used as coarse aggregate while ground
POFA was used at partial cement replacement levels of up to 25%. They reported that
OPS concrete specimens subjected to continuous moist curing showed higher
compressive strength compared to partially cured and air dried specimens. Therefore,
they recommended that the incorporation of POFA could reduce the sensitivity of OPS
concrete towards poor curing. High cement content and low water to cement ratio are
needed to produce a structural grade of LWAC with satisfactory durability properties,
particularly when high strength is required. Therefore, changing the volume of OPS
content may reduce sensitivity.
The aim of this study was to investigate the possibility of reducing compressive
strength sensitivity of OPS concrete by reducing OPS aggregate volume. For this purpose,
OPS was partially substituted with oil-palm-boiler clinker (OPBC). OPBC is a by-product
of the burning of solid waste in the boiler combustion process in palm oil mills. It is like
a porous stone, grey in colour, flaky and irregular in shape (Ahmad et al., 2007a, 2007b).
Previous studies (Ahmad et al., 2008; Chan & Robani, 2008; Zakaria, 1986) have shown
that OPBC can be used as lightweight aggregate in concrete. The density and the 28-day
compressive strength of OPBC concrete fulfil the requirements of structural LWAC
(Mohammed et al., 2014). OPBC was chosen as a partial replacement as it is a waste
without any current application, as well as being a lightweight aggregate. Because there
are no reports pertaining to the compressive strength sensitivity of OPBC concrete in poor
curing conditions. This study used two types of waste coarse lightweight aggregate to
identify the optimum substitution level of OPBC in OPS concrete.
Univers
ity of
Mala
ya

57
3.2 Experimental Programme
3.2.1 Materials
3.2.1.1 Cement
Ordinary Portland cement (OPC) with a 7- and 28-day compressive strength of 36 and
48 MPa, respectively, was used. The specific gravity and Blaine specific surface area of
the cement were 3.14 and 3510 cm2/g, respectively.
3.2.1.2 Aggregate
The OPS and OPBC (Figure 3.1) used as coarse aggregate were collected from a local
palm oil mill, then washed and dried in the laboratory. After drying, they were crushed
using a crushing machine and then sieved. Table 3.1 shows that these two types of coarse
aggregate have almost the same grading. For each mix proportion, the OPS and OPBC
aggregates were weighed in dry conditions, immersed in water for 24 h, then air dried in
the lab environment for 2-3 h to obtain an aggregate with an almost saturated dry surface
condition. The physical properties of OPS and OPBC are shown in Table 3.2; it shows
that OPBC is heavier than OPS but has significantly lower water absorption. The
crushing, impact and abrasion values of OPBC are significantly higher than OPS, which
shows that OPBC is weaker. In general, an OPBC grain is round in shape and has porosity
on the surface, while, OPS is flaky without visible surface porosity (Figure 3.1).
Local mining sand was used as fine aggregate. It had a fineness modulus of 2.89,
specific gravity of 2.68 and maximum grain size of 4.75 mm. Univers
ity of
Mala
ya

58
Figure 3.1: Oil palm shell (left) and oil-palm-boiler clinker (right)
Table 3.1: Grading of OPS and OPBC aggregates Sieve size (mm) 19 12.5 9.5 8 4.75
Cumulative % by weight passing
OPS 100 96.80 84.24 61.20 2.98 OPBC 100 98.35 90.32 70.75 3.27
Table 3.2: Physical and mechanical properties of aggregates
Physical and mechanical properties Coarse aggregate Fine aggregate
OPS OPBC Normal Sand Specific gravity (saturated surface dry) 1.19 1.69 2.68
Bulk density (compacted) (kg/m3) 610 860 1657 24 h water absorption (%) 20.5 7.0 1.2
Crushing value (%) 0.2 21.2 - Impact value (%) 5.5 36.3 -
Abrasion value (%) 5.7 23.9 -
3.2.1.3 Super-plasticizer (SP)
Sika ViscoCrete was used as the SP in this study. This admixture is chloride free
according to BS 5075 and is compatible with all types of Portland cement including
Sulphate Resistant Cement (SRC). It can be used at a rate of 500-2000 ml per 100 kg of
cement, depending on workability and strength requirements. The maximum SP used in
this study was 1% of total cement mass.
Univers
ity of
Mala
ya
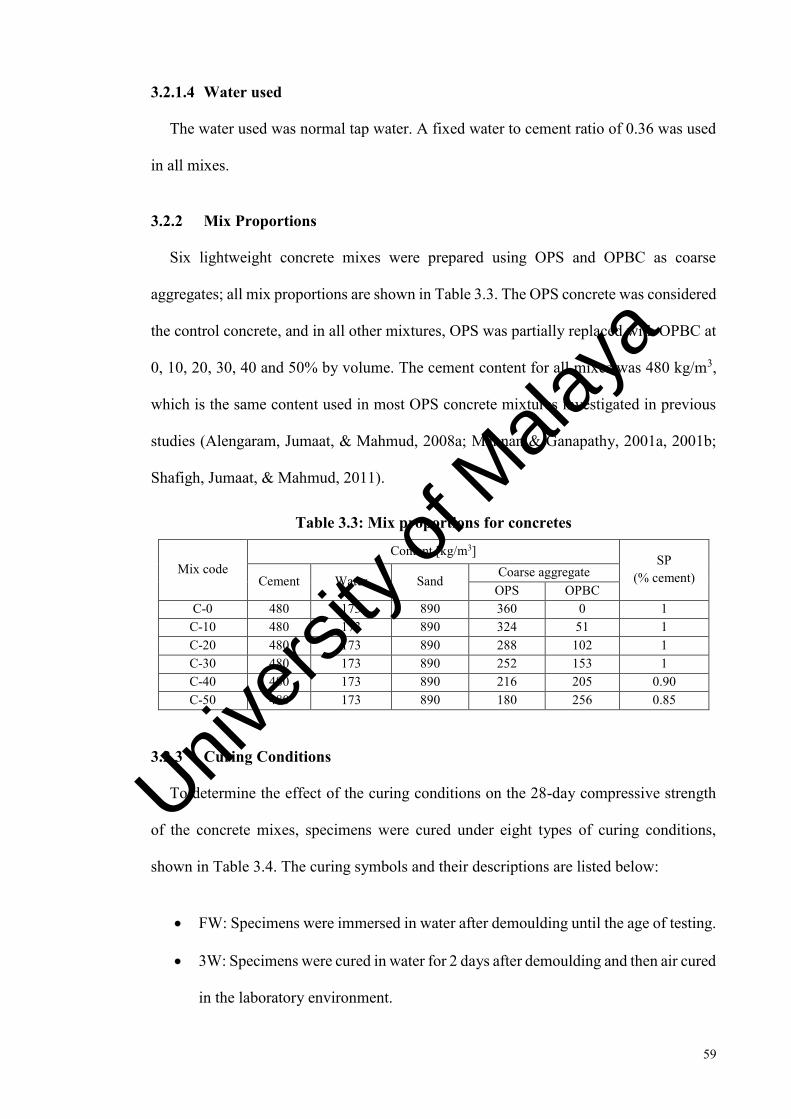
59
3.2.1.4 Water used
The water used was normal tap water. A fixed water to cement ratio of 0.36 was used
in all mixes.
3.2.2 Mix Proportions
Six lightweight concrete mixes were prepared using OPS and OPBC as coarse
aggregates; all mix proportions are shown in Table 3.3. The OPS concrete was considered
the control concrete, and in all other mixtures, OPS was partially replaced with OPBC at
0, 10, 20, 30, 40 and 50% by volume. The cement content for all mixes was 480 kg/m3,
which is the same content used in most OPS concrete mixtures investigated in previous
studies (Alengaram, Jumaat, & Mahmud, 2008a; Mannan & Ganapathy, 2001a, 2001b;
Shafigh, Jumaat, & Mahmud, 2011).
Table 3.3: Mix proportions for concretes
Mix code Content [kg/m3]
SP (% cement) Cement Water Sand
Coarse aggregate OPS OPBC
C-0 480 173 890 360 0 1 C-10 480 173 890 324 51 1 C-20 480 173 890 288 102 1 C-30 480 173 890 252 153 1 C-40 480 173 890 216 205 0.90 C-50 480 173 890 180 256 0.85
3.2.3 Curing Conditions
To determine the effect of the curing conditions on the 28-day compressive strength
of the concrete mixes, specimens were cured under eight types of curing conditions,
shown in Table 3.4. The curing symbols and their descriptions are listed below:
• FW: Specimens were immersed in water after demoulding until the age of testing.
• 3W: Specimens were cured in water for 2 days after demoulding and then air cured
in the laboratory environment.
Univers
ity of
Mala
ya

60
• 5W: Specimens were cured in water for 4 days after demoulding and then air cured
in the laboratory environment.
• 7W: Specimens were cured in water for 6 days after demoulding and then air cured
in the laboratory environment.
• 2T2D: Specimens were watered twice a day (morning and evening) for 2 days
after demoulding and then air cured in the laboratory environment.
• 2T6D: Specimens were watered twice a day (morning and evening) for 6 days
after demoulding and then air cured in the laboratory environment.
• PS: Specimens were wrapped in 4 layers of a 1 mm thick plastic sheet after
demoulding and then kept in the laboratory environment.
• AC: Specimens were kept in the laboratory environment after demoulding.
Table 3.4: Curing conditions Curing
condition Day in mould Day in water Watering (time/day)
Day in lab environment
FW 1 27 0 27 3W 1 2 0 25 5W 1 4 0 23 7W 1 6 0 21
2T2D 1 0 2 27 2T6D 1 0 2 27
PS 1 0 0 27 AC 1 0 0 27
3.2.4 Test Methods
To create each mix, the cement and aggregates were placed mixed for 2 min in a mixer.
A mixture of 70% mixing water with SP was added, and mixing continued for another 3
min. The remaining water was added and mixing continued for another 5 min. After that,
the slump test was performed. The concrete specimens were cast in 100 mm cube steel
moulds to determine compressive strength, cylinders of 100 mm diameter and 200 mm
height for splitting tensile strength, cylinders of 150 mm diameter and 300 mm height for
Univers
ity of
Mala
ya

61
modulus of elasticity, and prisms of 100 × 100 × 500 mm3 for flexural strength.
Specimens were compacted using a vibrating table.
After casting, specimens were covered with plastic sheets and stored in the laboratory
environment, then demoulded one day after casting. Three test specimens were prepared
to obtain average values of mechanical properties at any age. For curing condition, four
specimens were used to obtain an average value. The main reason to prepare three or four
specimens was to achieve the proper results of the property. The average values were only
selected from those specimens which were giving 95-100% similar results.
To determine the water absorption of all mixes, specimens were dried in the oven at
105 ± 5 oC to reach a constant mass, then fully immersed in water kept at 23 ± 3 oC. Water
absorption was measured after 30 min, then after 24 and 72 h.
3.3 Results and Discussion
3.3.1 Slump
The slump values of all the mixes are shown in Table 3.5. Since OPBC is round in
shape and has a lower water absorption rate than OPS (about 66%), partial substitution of
OPS by OPBC offers better workability. For example, mix C-30 showed a 39% higher
slump value than OPS concrete for the same amount of SP. A structural LWAC with
slump value in the range of 50-75 mm is considered to be a lightweight concrete with
good workability (Mehta & Monteiro, 2006). Excessive slump value causes segregation
of the LWA from the cement matrix. Therefore, to avoid segregation, SP content in the
C-40 and C-50 mixes was reduced. However, these mixes had a much better slump value
than the control mix, even though they had lower SP content of 10% and 15%,
respectively. Increasing workability and using less SP are significant advantages of
OPBC in OPS concrete.
Univers
ity of
Mala
ya
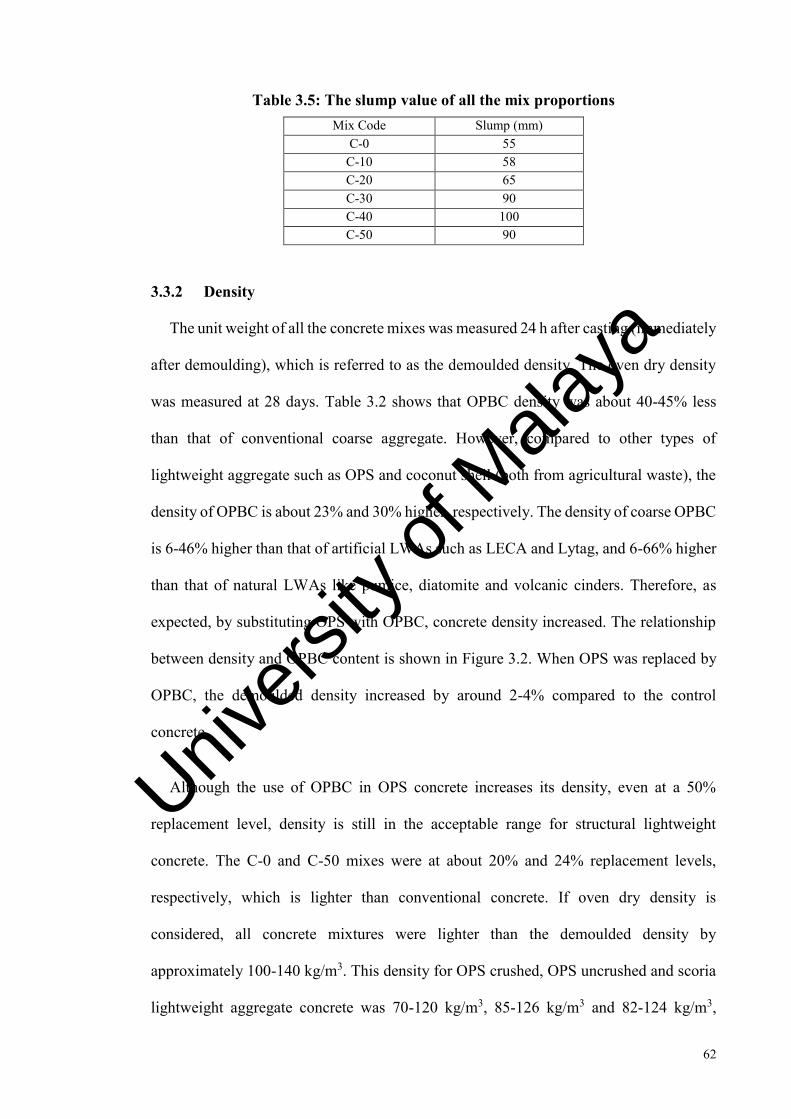
62
Table 3.5: The slump value of all the mix proportions Mix Code Slump (mm)
C-0 55 C-10 58 C-20 65 C-30 90 C-40 100 C-50 90
3.3.2 Density
The unit weight of all the concrete mixes was measured 24 h after casting (immediately
after demoulding), which is referred to as the demoulded density. The oven dry density
was measured at 28 days. Table 3.2 shows that OPBC density was about 40-45% less
than that of conventional coarse aggregate. However, compared to other types of
lightweight aggregate such as OPS and coconut shell (both from agricultural waste), the
density of OPBC is about 23% and 30% higher, respectively. The density of coarse OPBC
is 6-46% higher than that of artificial LWAs such as LECA and Lytag, and 6-66% higher
than that of natural LWAs like pumice, diatomite and volcanic cinders. Therefore, as
expected, by substituting OPS with OPBC, concrete density increased. The relationship
between density and OPBC content is shown in Figure 3.2. When OPS was replaced by
OPBC, the demoulded density increased by around 2-4% compared to the control
concrete.
Although the use of OPBC in OPS concrete increases its density, even at a 50%
replacement level, density is still in the acceptable range for structural lightweight
concrete. The C-0 and C-50 mixes were at about 20% and 24% replacement levels,
respectively, which is lighter than conventional concrete. If oven dry density is
considered, all concrete mixtures were lighter than the demoulded density by
approximately 100-140 kg/m3. This density for OPS crushed, OPS uncrushed and scoria
lightweight aggregate concrete was 70-120 kg/m3, 85-126 kg/m3 and 82-124 kg/m3,
Univers
ity of
Mala
ya

63
respectively (Kilic, Atis, Yasar, & Ozcan, 2003; Shafigh, Jumaat, & Mahmud, 2011;
Shafigh, Jumaat, Mahmud, et al., 2011).
Figure 3.2: Relationship between density and OPBC content
3.3.3 Compressive Strength
3.3.3.1 Under continuous moist curing
The 28-day compressive strength of OPS concrete without OPBC aggregate (C-0) was
about 36 MPa, which shows that the control mix is a normal strength lightweight concrete.
The effects of OPBC aggregate addition on the compressive strength development of all
mixes up to 56 days is shown in Figure 3.3. As can be seen in this figure, using 10%
OPBC did not affect the compressive strength of OPS concrete. However, compared to
the control mix, the compressive strength of the OPS specimens containing more than
10% OPBC improved significantly, particularly at later ages. Compressive strength of
specimens containing 20-50% OPBC increased by 13-18%. The highest 28-day
compressive strength, which was about 44 MPa was achieved for OPS concrete
containing 30% OPBC.
y = 1.8218x + 1916R² = 0.9811
y = 1.9945x + 1790R² = 0.8737
1750
1800
1850
1900
1950
2000
2050
0 10 20 30 40 50 60
Den
sity
(kg/
m3 )
OPBC content (%)
Demoulded density
Oven dry density
Univers
ity of
Mala
ya
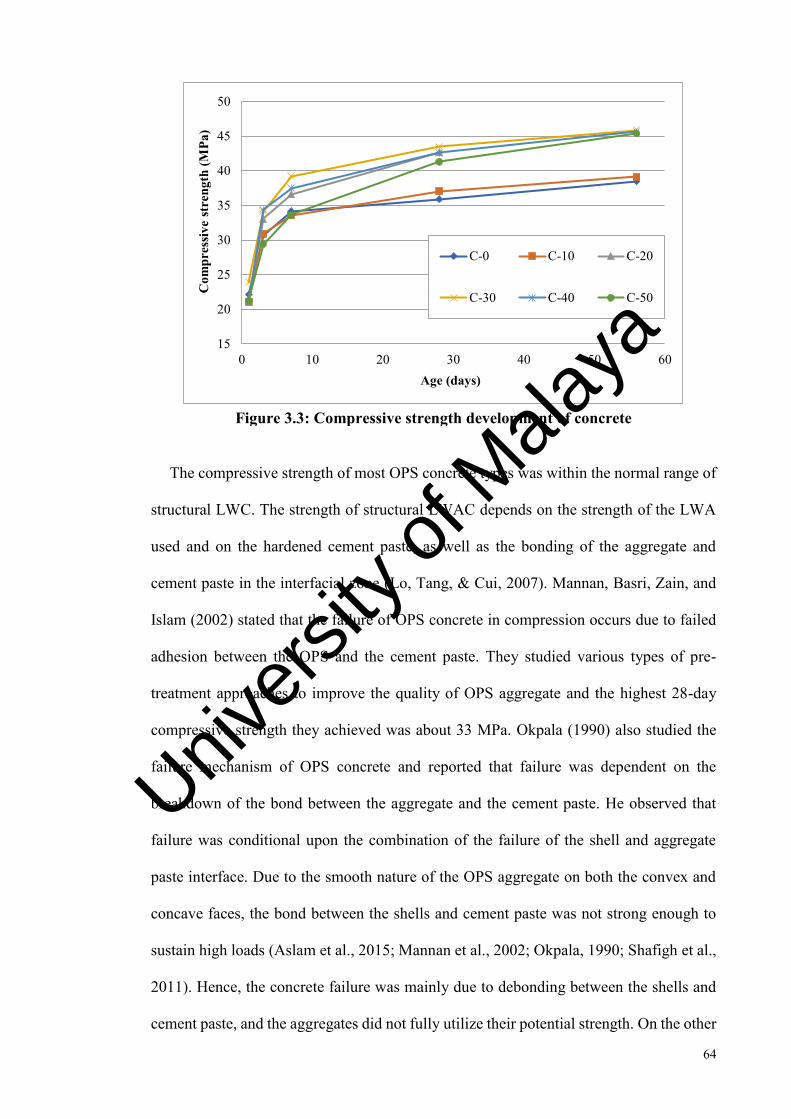
64
Figure 3.3: Compressive strength development of concrete
The compressive strength of most OPS concrete types was within the normal range of
structural LWC. The strength of structural LWAC depends on the strength of the LWA
used and on the hardened cement paste, as well as the bonding of the aggregate and
cement paste in the interfacial zone (Lo, Tang, & Cui, 2007). Mannan, Basri, Zain, and
Islam (2002) stated that the failure of OPS concrete in compression occurs due to failed
adhesion between the OPS and the cement paste. They studied various types of pre-
treatment approaches to improve the quality of OPS aggregate and the highest 28-day
compressive strength they achieved was about 33 MPa. Okpala (1990) also studied the
failure mechanism of OPS concrete and reported that failure was dependent on the
breakdown of the bond between the aggregate and the cement paste. He observed that
failure was conditional upon the combination of the failure of the shell and aggregate
paste interface. Due to the smooth nature of the OPS aggregate on both the convex and
concave faces, the bond between the shells and cement paste was not strong enough to
sustain high loads (Aslam et al., 2015; Mannan et al., 2002; Okpala, 1990; Shafigh et al.,
2011). Hence, the concrete failure was mainly due to debonding between the shells and
cement paste, and the aggregates did not fully utilize their potential strength. On the other
15
20
25
30
35
40
45
50
0 10 20 30 40 50 60
Com
pres
sive
stre
ngth
(MPa
)
Age (days)
C-0 C-10 C-20
C-30 C-40 C-50
Univers
ity of
Mala
ya

65
hand, OPBC is a porous aggregate with a rough surface texture (Figure 3.1). It was
therefore expected that it would have a better interlock with the cement matrix, and,
consequently, higher compressive strength. Figure 3.4 shows a section of concrete
containing OPS and OPBC aggregate, and their connection with the cement matrix.
Figure 3.4: Surface texture of OPS and OPBC aggregates with mortar
matrix
The 28-day compressive strength test results show that incorporating 20-50% OPBC
in OPS concrete enhances compressive strength from grade 35 to grade 40, which can be
considered high strength lightweight concrete. As reported earlier, the C-0 and C-10
mixes had almost the same compressive strength at all ages; 90-95% of the 28-day
compressive strength was achieved at 7 days, while the same ratio for mixes containing
20-50% OPBC was 81-90%. For an artificial lightweight aggregate, this ratio was
reported to be in the range of 76-87% (Wilson & Malhotra, 1988). The ratio for the 1-day
and 3-day to 28-day compressive strength of OPS-OPBC concrete was in the range of 49-
57% and 71-83%, respectively.
3.3.3.2 Under air-drying
All the concrete mixes showed a reduction on the compressive strength at 28 days
under air-drying conditions (AC). Compared to the full water curing condition (FW), the
reductions in compressive strength of the OPS concrete containing 0, 10%, 20%, 30%,
Univers
ity of
Mala
ya

66
40% and 50% OPBC were about 25%, 10%, 17%, 9%, 3% and 3%, respectively. The
reduction for the OPS-OPBC concrete was 3-17%, with an average value of about 8.5%.
The contribution of OPBC significantly reduced strength loss in poor curing conditions,
particularly when the contribution was more than 30%. In the AC condition, the OPS-
OPBC concretes had 24-54% higher compressive strength than the control mix (C-0),
while this range was 3-21% under FW curing.
One of the reasons for these results is the better performance of OPBC in terms of
internal curing. During the process of internal curing, saturated lightweight aggregates
develop suction pressure in the hydrated cement paste due to self-desiccation and
chemical shrinkage. Henkensiefken, Bentz, Nantung, and Weiss (2009) reported that in
the process of internal curing, the biggest pores will lose water first as the developed
capillary stress decreases when the pores are emptied in this order. The LWA pores are
generally larger than those of the surrounding cement paste, which increases cement
hydration and strength development, and restrains shrinkage cracking behaviour. The
pore sizes of OPBC aggregate are larger than those of OPS, and, hence, the OPBC
aggregate quickly loses water and minimizes capillary stress when pores are emptied
consequently, its internal curing performance is superior to that of OPS.
The replacement of normal coarse aggregates by LWA of similar size in high
performance concrete as a means of providing internal curing for improved strength was
studied by Weber & Reinhardt (1997a, 1997b); they named this method autogenous
curing. In their study, months of continuous hydration after casting was observed with X-
ray diffraction; the prepared concrete improved mechanical properties regardless of
curing condition. They proposed a mechanism of water transport from the LWA to the
hydrating cement paste based on capillary suction. In addition to the benefit of using
LWA for increased compressive strength due to internal curing, it also enhanced
Univers
ity of
Mala
ya

67
durability performance due to the higher degree of hydration, improved density of the
hydrated cement paste and reduced drying shrinkage, which minimized the effect of self-
desiccation and elimination of plastic and drying shrinkage cracking (Shafigh et al., 2014;
Weber & Reinhardt, 1997b).
Figure 3.5 shows the relationship between the 28-day compressive strength of all
different types of OPS-OPBC concretes in air-drying and water curing conditions. As a
comparison, this relationship was plotted for different types of concrete reported in
previous research (Atis et al., 2005; Shafigh, Alengaram, Mahmud, & Jumaat, 2013;
Shafigh, Jumaat, et al., 2013; Shafigh, Mahmud, et al., 2012). As seen in this figure, OPS
concrete containing OPBC has a better compressive strength than both OP and normal
weight concrete containing silica fume as well as OPS concrete with fly ash or GGBFS.
Figure 3.5: The relationship between compressive strength of OPS-OPBC
concrete with and without curing and comparison with OPS concrete containing silica fume (OPS-SF), normal concrete containing silica fume (NC-SF), OPS concrete containing fly ash (OPS-FA) and OPS concrete
containing GGBFS (OPS-GGBFS) Source: (Atis et al., 2005; Shafigh, Alengaram, et al., 2013; Shafigh, Jumaat, et al., 2013; Shafigh, Mahmud, et al., 2012)
y = 0.8957xR² = 0.6319
25
27
29
31
33
35
37
39
41
43
30 32 34 36 38 40 42 44 46
Com
pres
sive
str
engt
h (M
Pa) w
ithou
t cur
ing
Compressive strength (MPa) with curing
Linear (OPS-OPBC)
Linear (OPS-SF)
Linear (NC-SF)
Linear (OPS-FA)
Linear (OPS-GGBFS)
Univers
ity of
Mala
ya

68
3.3.3.3 Under partial early curing
Curing is the practice of maintaining suitable moisture content and temperature in
concrete during its early stages to ensure it develops its desired properties (ACI308,
1980). A minimum period of 7 days of moist curing is generally recommended with
concrete containing normal Portland cement. However, for concrete mixtures containing
a mineral admixture, a longer curing period is desirable to ensure the strength contribution
from the pozzolanic reaction (Mehta & Monteiro, 2006). LWAs in concrete mixtures
contain internal water, which helps increase the hydration of cement; due to the
advantages of internal curing, recommended early age curing may be reduced in the case
of lightweight aggregate concrete, which reduces the curing cost.
Table 3.6 shows the effect of different curing conditions on the 28-day compressive
strength of all mixes. The data shows that partial early curing can improve 28-day
compressive strength more than air-drying. Compared to the AC condition, the
effectiveness of the 2T2D and 2T6D conditions on the improvement of compressive
strength of OPS containing 0-20% OPBC was more significant compared to other mixes.
Under these two curing conditions, the compressive strength of OPS concrete (mix C-0)
was still significantly lower than for the FW curing condition, while the compressive
strength of OPS concretes containing OPBC was very close to the FW curing condition.
This is additional evidence that the compressive strength of concrete containing OPS as
coarse aggregate is very sensitive to poor curing conditions. However, even a small
amount of OPBC could significantly reduce this sensitivity. In general, partial early
curing of 2T2D was better than 2T6D; if the curing method is a type of watering that
occurs a few times a days, it should not continue over several days due to the negative
effect of the wetting-drying condition on concrete. The test results of these two curing
conditions reveal that 2T2D was better than 2T6D, with a savings in curing costs.
Univers
ity of
Mala
ya

69
Compared to the AC condition, partial early curing of 2D, 4D and 6D improved
compressive strength. A longer curing time resulted in better compressive strength for all
concrete types. However, the rate of improvement for the OPS control mix was higher
than for the other types, which may be due to the C-0 mix experiencing a significant
reduction in compressive strength under the AC condition compared to other mixes. Early
water curing therefore caused a greater improvement in compressive strength. However,
the compressive strength of mix C-0 under 2D, 4D and 6D curing conditions was about
82-89% of compressive strength under FW curing, while this range for all types of OPS-
OPBC concretes was 88-109%. This is additional evidence that concrete containing OPS
as coarse aggregate needs special attention in terms of curing.
As can be seen in Table 3.6, the 28-day compressive strength for all concrete types
under 2D, 4D and 6D conditions is almost the same. However, among the OPS-OPBC
mixes, the closer values are for the C-40 and C-50 mixes which means that the 2D initial
water curing may be sufficient for curing these two types of concrete.
Test results show that curing with a plastic sheet (PS) is a more effective method of
improving compressive strength than air drying. This method led to an improvement of
about 21% in the control mix (C-0), which was significantly higher than its effect on the
OPS concrete containing OPBC, which was 3-12%. The higher improvement in the
compressive strength of the control mix was due to a significant reduction (about 25%)
in the compressive strength of this concrete under dry conditions. For OPS-OPBC
concrete this drop was about 8%, on average. Any partial early curing therefore had better
performance on the control mix compared to the OPS-OPBC concretes. If all types of
partial curing conditions are considered, the control OPS concrete had about 13% more
compressive strength than the AC condition and 6.5% for the OPS-OPBC concrete
specimens.
Univers
ity of
Mala
ya

70
Most codes of practice recommend 7-day moist curing (Haque, 1990). However, for
some structural elements such as columns, it can be difficult to achieve. Nevertheless, as
can be seen in Table 3.6, compressive strength is equivalent for 6D and PS, which means
a plastic sheet can be used instead of 7-day moist curing; this method of curing may be
more practical.
Table 3.6: Effect of different curing conditions on 28-day compressive strength Mix codes AC 2D 4D 6D 2T2D 2T6D Plastic (PS) FW
C-0 27.0 29.6 31.0 32.1 30.8 27.4 32.7 36.0 C-10 33.5 36.9 36.7 33.9 37.3 38.3 37.6 37.1 C-20 35.6 37.7 39.3 43.6 41.3 37.0 37.2 42.7 C-30 39.8 41.3 38.2 42.7 41.2 41.3 41.9 43.5 C-40 41.5 41.9 43.5 43.8 41.0 40.4 42.7 42.6 C-50 40.0 45.2 42.2 44.8 42.5 38.9 43.9 41.3
3.3.4 Splitting Tensile Strength
Splitting tensile strength for all the mixes is shown in Table 3.7. The minimum 28-day
splitting tensile strength required for structural lightweight concrete to be used in
structural elements is 2.0 MPa (Kockal & Ozturan, 2011). Table 3.7 shows that all the
concrete mixes have more than 2.0 MPa splitting tensile strength from a 3-day age and
that splitting tensile strength increased with compressive strength. The substitution of
OPS with OPBC up to 30% did not affect splitting tensile strength at all ages (slightly
reduced). The reduction was significant in the 40% and 50% substitution levels at early
ages. However, it diminished with the increasing age of the concrete; the 28-day splitting
tensile strength of the concretes containing 40% and 50% OPBC was similar to the control
mix. It is interesting to note that a significant improvement was observed from 7 to 28
days for the splitting tensile strength of the C-40 and C-50 mixes, while improvement for
the other mixes was minor. On the other hand, compressive strength improvement with
water curing from 7 to 28 days was also significant, particularly for mix C-50.
Univers
ity of
Mala
ya

71
The 28-day splitting tensile strength of concretes containing OPBC ranged from 3.05-
3.31 MPa. Generally, the ratio of splitting tensile/compressive strength of normal weight
concrete falls in the range of 8-14% (Kockal & Ozturan, 2011; Shafigh et al., 2014).
However, the ratio of splitting tensile to compressive strength achieved for OPS concrete
was 8-10% and 7-10.5% for OPS-OPBC mixes.
Table 3.7: Splitting tensile strength and flexural strength
Mix no. Splitting tensile strength (MPa) Flexural strength (MPa)
1 day 3 days 7 days 28 days 7 days 28 days
C-0 2.20 2.89 3.03 3.29 4.43 5.38
C-10 2.20 2.80 3.25 3.30 4.50 4.48
C-20 2.00 2.81 2.92 3.05 4.17 4.98
C-30 2.03 3.10 3.12 3.25 4.80 5.37
C-40 1.80 2.48 2.64 3.31 4.54 5.30
C-50 1.70 2.33 2.66 3.10 4.89 5.24
Figure 3.6 shows a comparison of splitting tensile strength results with those predicted
by the equations proposed by various standards and researchers. ACI-318 (2005)
proposed Eq. (3.1) for normal weight concrete with a cylinder compressive strength in
the range of 21-83 MPa. Gesoglu, Ozturan, and Guneyisi (2004) proposed Eq. (3.2) for
cold-bonded fly ash LWAC with a cube compressive strength ranging from 20 to 47 MPa
and Eq. (3.3) is the proposed equation from (CEB/FIP, 1993). Shafigh et al. (2014)
proposed Eq. (3.4) for LWC using two types of waste material from the palm oil industry.
Neville (2008) reported Eq. (3.5) for pelletized blast furnace slag LWAC, with cube
compressive strength ranging from 10 to 65 MPa.
ft = 0.59 (fcy) 0.5 (3.1)
ft = 0.27 √𝑓𝑐𝑢23 (3.2)
ft = 0.301 (fcy) 0.67 (3.3)
ft = 0.27 (fcu) 0.63 (3.4)
Univers
ity of
Mala
ya

72
ft = 0.23 √𝑓𝑐𝑢23 (3.5)
where, ft is the splitting tensile strength, fcu and fcy are the cube and cylindrical
compressive strengths, respectively. As can be seen in Figure 3.6, Equations 3.2 and 3.3
showed values closer to the experimental results, with a reliability of about 90%.
Figure 3.6: Experimental and theoretical splitting tensile strength of all concrete
mixes
3.3.5 Flexural Strength
Flexural strength of all mixes at 7 and 28 days is shown in Table 3.7. The 28-day
flexural strength of all OPS-OPBC mixes ranged from 4.48 to 5.52 MPa, an average of
12% higher than the 7-day flexural strength. The flexural strength of normal weight
concrete with a compressive strength of 34-55 MPa is in the range of 5-6 MPa with a
flexural/compressive strength ratio of 11.6-13.5% (Mehta & Monteiro, 2006). The 28-
day flexural to compressive strength ratios of the OPS-OPBC mixes were 12-12.7%. It
can therefore be concluded that all the OPS-OPBC concrete mixes had a similar flexural
strength, and flexural to compressive strength ratio was similar to the NWC of the same
grade. Holm and Bremner (2000) reported that the flexural strength of high strength
lightweight aggregate concrete (HSLWAC) was generally 9-11% of compressive
1.5
2
2.5
3
3.5
20 25 30 35 40 45
Split
ting
tens
ile st
reng
th (M
Pa)
Compressive strength (MPa)
ft (Exp) Eq: 1
Eq: 2 Eq: 3
Eq: 4 Eq: 5
Univers
ity of
Mala
ya

73
strength. The results of the study being described in this paper showed that OPS-OPBC
concretes had a higher flexural to compressive strength ratio than HSLWAC. The ratio
of splitting tensile to flexural strength for C-10, C-20, C-30, C-40 and C-50 was 67%,
61%, 57%, 62% and 59%, respectively. However, for OPS concrete with compressive
strength from 34 to 53 MPa, this ratio varied between 51% and 72% (Alengaram, Jumaat,
& Mahmud, 2008b; Shafigh, Jumaat, Mahmud, et al., 2012) depending mostly on the
amount of OPS in the mixture (Shafigh et al., 2012).
Figure 3.7 shows the relationship between flexural strength and corresponding
compressive strength. The experimental results were compared with the predicted results
using equations proposed by applicable standards and researchers. CEB-FIP (1977)
proposed Eq. (3.6) for LWC made with expanded shale and clay aggregates, with cubical
compressive strength ranging varying between 20-60 MPa. Shafigh, Jumaat, Mahmud, et
al. (2012) proposed Eq. (3.7) for crushed OPS concretes, with cubical compressive
strength between 35 and 53 MPa. Zhang and Gjvorv (1991) proposed Eq. 3.8 to predict
the flexural strength of high strength lightweight concrete. The equation prediction of Lo
et al. (2004) is for expanded clay LWAC with a cubical compressive strength of 29-43
MPa Eq. (3.9).
fr = 0.46 √𝑓𝑐𝑢23 (3.6)
fr = 0.12 𝑓𝑐𝑢1.03 (3.7)
fr = 0.73√𝑓𝑐𝑢 (3.8)
fr = 0.69√𝑓𝑐𝑢 (3.9)
where, fr is the flexural strength, and fcu is the cube compressive strength of the
concrete in MPa. Equations 3.6 and 3.8 showed that predictions of flexural strength from
Univers
ity of
Mala
ya
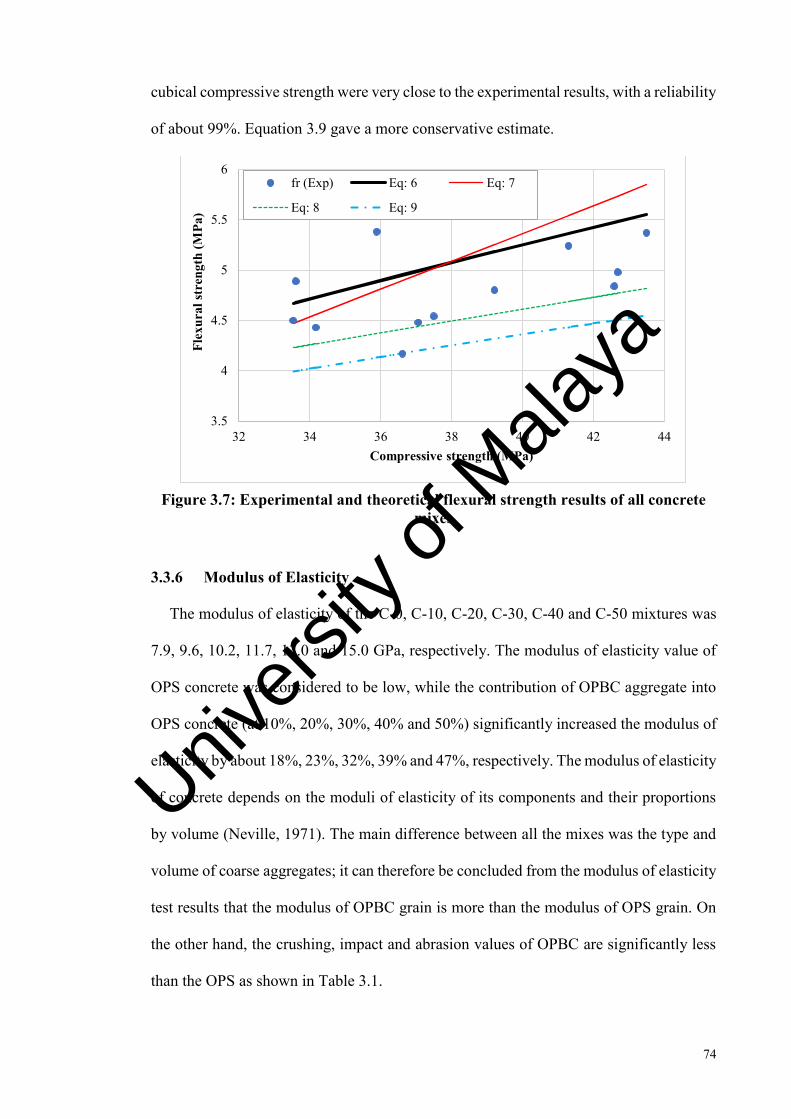
74
cubical compressive strength were very close to the experimental results, with a reliability
of about 99%. Equation 3.9 gave a more conservative estimate.
Figure 3.7: Experimental and theoretical flexural strength results of all concrete
mixes
3.3.6 Modulus of Elasticity
The modulus of elasticity of the C-0, C-10, C-20, C-30, C-40 and C-50 mixtures was
7.9, 9.6, 10.2, 11.7, 13.0 and 15.0 GPa, respectively. The modulus of elasticity value of
OPS concrete was considered to be low, while the contribution of OPBC aggregate into
OPS concrete (at 10%, 20%, 30%, 40% and 50%) significantly increased the modulus of
elasticity by about 18%, 23%, 32%, 39% and 47%, respectively. The modulus of elasticity
of concrete depends on the moduli of elasticity of its components and their proportions
by volume (Neville, 1971). The main difference between all the mixes was the type and
volume of coarse aggregates; it can therefore be concluded from the modulus of elasticity
test results that the modulus of OPBC grain is more than the modulus of OPS grain. On
the other hand, the crushing, impact and abrasion values of OPBC are significantly less
than the OPS as shown in Table 3.1.
3.5
4
4.5
5
5.5
6
32 34 36 38 40 42 44
Flex
ural
stre
ngth
(MPa
)
Compressive strength (MPa)
fr (Exp) Eq: 6 Eq: 7
Eq: 8 Eq: 9
Univers
ity of
Mala
ya

75
Generally, the modulus of elasticity of structural LWC ranges between 10 and 24 GPa,
and from 14 to 41 GPa in NWC (Shafigh et al., 2014). The test results of this study showed
that the modulus of elasticity of OPS concrete containing OPBC aggregates was in the
normal range for structural lightweight aggregate concretes.
Tasnimi (2004) presented Eq. (3.10) for artificial LWA concretes with a cylindrical
compressive strength of about 15-55 MPa. Hossain, Ahmed, and Lachemi (2011)
proposed Eq. (3.11), reporting data for LWC by incorporating pumice with a 28-day
cylinder compressive strength of 16-35 MPa and density of about 1460-2185 kg/m3.
Alengaram et al. (2011) reported Eq. (3.12) for OPS concrete with 28-day cubical
compressive strength of 25-39 MPa and air-dry density of 1640-1890 kg/m3. The
CEB/FIP model code (Short, 1978) proposed Eq. (3.13) to predict the modulus of
elasticity of LWACs.
E = 2.1684 𝑓𝑦0.535 (3.10)
E = 0.03w1.5 𝑓𝑦0.5 (3.11)
E = 5 𝑓𝑐𝑢0.33 (w/2400) (3.12)
E = 9.1 (w/2400)2 𝑓𝑐𝑢2 (3.13)
where, E is the modulus of elasticity (GPa), w is the dry density (kg/m3), fcy is the
cylinder compressive strength (MPa) and fcu is the cubical compressive strength (MPa).
When compared to test results, all the equations provided very conservative
estimations with Eq. (3.12) being the closest to the experimental results. Changing the
constant value in equation (Eq. 3.14) from 5 to 6 provided a good estimation with a
reliability of about 90%.
E = 6 𝑓𝑐𝑢0.33 (w/2400) (3.14)
Univers
ity of
Mala
ya

76
3.3.7 Water Absorption
Water absorption of all concrete mixes was measured at the age of 56 days for 30 min,
24 h and 72 h, as shown in Figure 3.8. The water absorption of the concretes containing
OPBC aggregates was lower than that of the control OPS concrete. Water absorption was
reduced when the amount of OPBC aggregate in the mixture was increased. Due to the
high-water absorption of OPS, substitution of normal coarse aggregate with this
lightweight aggregate increased its water absorption capacity. Therefore, reducing OPS
volume in concrete was expected to reduce initial and final water absorption. Table 3.2
shows that the water absorption rate of OPBC aggregate was significantly lower than for
OPS. Therefore, as shown in Figure 3.8, OPS-OPBC concretes had lower water
absorption rates than OPS concrete. For OPS concretes with normal compressive
strength, water absorption was higher than 10% (Teo et al., 2007). Water absorption for
other types of structural lightweight concretes such as expanded polystyrene aggregate
concrete and pumice aggregate concrete ranged from 3 to 6% and 14 to 22%, respectively
(Babu & Babu, 2003; Gunduz & Ugur, 2005).
Ranjbar, Madandoust, Mousavi, and Yosefi (2013) categorized the quality of concrete
as good, average and poor based on initial water absorption (absorption in 30 min) values
of 0-3%, 3-5%, and above 5%, respectively. All concrete mixes showed initial absorption
of less than 3%, which can be categorized as “good”. Moreover, the moderate (24 h) water
absorption was in the range of 5.3-6.3% and the final (72 h) absorption was 6.3-7.1%.
Neville (2008) reported that although concrete quality cannot be predicted by water
absorption, good concretes generally have a rate of less than 10% by mass.
Univers
ity of
Mala
ya

77
Figure 3.8: Relationship between OPBC content and water absorption
3.4 Conclusions
In this study, oil-palm-boiler clinker (OPBC) was partially used instead of oil palm
shell (OPS) as coarse lightweight aggregate in an OPS lightweight concrete and the effect
of this substitution on the mechanical properties of concrete was investigated. Based on
the test results, the following conclusions can be drawn:
1. Increasing OPBC coarse aggregates in OPS concrete increased slump value.
2. Substituting OPS with OPBC aggregates increased the density of OPS concrete
by about 2-4%. However, even at the 50% substitution level, density was still in
the acceptable range for structural lightweight aggregate concrete.
3. The contribution of 20-50% levels of OPBC in OPS concrete significantly
improved compressive strength under standard curing. At these substitution
levels, grade 35 OPS concrete was transferred to grade 40, which can be
considered high strength lightweight aggregate concrete. The optimum
substitution level was determined as 30%.
4. Incorporating OPBC aggregate into OPS concrete reduces the sensitivity of
compressive strength to lack of curing. OPS concrete (without OPBC aggregate)
1
2
3
4
5
6
7
8
0% 10% 20% 30% 40% 50%
Wat
er a
bsor
ptio
n (%
)
OPBC content (%)
30 mints
24 hr
72 hr
Univers
ity of
Mala
ya
78
under air-drying showed a reduction of about 25% compared to continuous water
curing while OPS concrete containing 30-50% OPBC only showed a reduction of
about 5%. This may be due to the better performance of OPBC lightweight
aggregates for internal curing.
5. Partial early curing improves compressive strength more than air-drying because
it is more effective when OPBC content is higher. However, if partial early curing
occurs though watering a few times a day (like 2T2D and 2T6D), it is
recommended that this method is not used continuously over several days due to
the negative effect of the wetting-drying condition on concrete.
6. The 28-day splitting tensile strength of concretes containing OPBC was 3.05-3.31
MPa, which is in the usual range for structural lightweight aggregate concrete.
7. The 28-day flexural strength ranged from 4.48 to 5.38 MPa, which was 12-15%
of the 28-day compressive strength. These ratios are equivalent to the normal
weight concrete ratio.
8. The modulus of elasticity of OPS concretes increased about 18-24% with the
incorporation of OPBC aggregates. OPS-OPBC concretes containing more than
20% OPBC aggregate had a modulus of elasticity in the normal range for
structural lightweight aggregate concretes.
9. The water absorption of OPS concrete was reduced by increasing the percentage
of OPBC aggregates. All OPS-OPBC mixes showed initial and final water
absorption of less than 3% and 10%, respectively, and can be considered good
concretes.
Univers
ity of
Mala
ya

79
HIGH STRENGTH LIGHTWEIGHT AGGREGATE CONCRETE
USING BLENDED COARSE LIGHTWEIGHT AGGREGATE ORIGIN FROM
PALM OIL INDUSTRY
4.1 Introduction
The concrete industry nowadays is the largest consumer of natural resources due to its
widely usage in civil engineering structures. Its annually consumption of materials is as
2.282 billion tonnes of cement, 10-12 billion tonnes of stones and rocks together and 1
billion tonne of mixing water (Chuan, 2015; Mehta & Monteiro, 2006). Due to the huge
amount of concrete production, it has a significant effect on the social, economic and
environmental problems (Pelisser, Barcelos, Santos, Peterson, & Bernardin, 2012; Sari,
Mat, Badri, & Zain, 2015; Tam, 2009). The best alternative to achieve an environmentally
friendly and sustainability in concrete industry is to use waste and by-product materials
instead of raw materials in concrete mixtures, which can contribute to a better quality of
life for all mankind (Aslam et al., 2015; Shafigh, Jumaat, Mahmud, et al., 2012).
Lightweight concrete (LWC) is a most interesting field of research and has been
widely used in buildings since ancient times. It has many advantages such as better heat
insulation, sound absorption, fire and frost resistance and increased seismic damping
(Aslam, Shafigh, & Jumaat, 2016b; Shafigh et al., 2010). High strength lightweight
concrete can be produced up to grade 60 with an oven dry density range of about 350-
2000 kg/m3 (Shafigh et al., 2010). Study from Sari & Pasamehmetoglu (2005) revealed
that the NWC has a low strength to weight ratio and its use in structural members such as
multi story buildings, bridges and floating structures is a huge economic disadvantage.
Therefore, the best way to resolve this issue is to use high strength lightweight concrete
(HSLWC). It can also reduce the dead load of the structures by reducing the cross sections
of beams, columns and foundations (Yasar, Atis, & Kiliç, 2004).
Univers
ity of
Mala
ya

80
The most popular method of fabricating LWC is by using lightweight aggregate
(LWA) (Polat et al., 2010). Since last few decades many types of lightweight aggregate
such as foamed slag, volcanic cinders, diatomite, expanded clay, tuff, scoria, shale, slate,
vermiculite, perlite and materials occurred as industrial by-products such as sintered slate,
pulverized-fuel ash and expanded blast-furnace slag has been used as construction
material (CEB/FIP, 1977; Neville, 2008; Shafigh et al., 2014). The artificial LWAs were
produced by the application of high temperature and pressure, which results in high fuel
costs (Shafigh et al., 2010). Therefore, the best alternative source for LWAs is the
utilization of waste materials, which significantly reduces the construction costs as well
as have many benefits in environmental issues. Oil palm shell (OPS) and oil-palm-boiler
clinker (OPBC) are an alternative waste materials found in tropical regime countries and
can be used as aggregate in concretes. It was found that Malaysia alone annually produced
more than 4 million tonnes of OPS, very small amount of this solid waste is used as a fuel
in oil palm mills (Sobuz et al., 2014). Previous studies (Hilmi, Shafigh, & Jumaat, 2014;
Mannan & Neglo, 2010) revealed that OPS and OPBC can be used as coarse aggregate
to produce green and sustainable structural lightweight aggregate concrete. The densities
of the both aggregates were also found in the suitable range of structural lightweight
aggregates. Recent studies (Aslam et al., 2015; Shafigh et al., 2014) have showed that the
OPS and OPBC can be used as lightweight aggregate to produce high strength lightweight
concrete.
Substitution of normal aggregates with OPS in normal weight concrete reduces its
mechanical properties and increases water absorption of concrete (Shafigh et al., 2012).
A lightweight concrete containing OPS has high drying shrinkage (Abdullah, 1996;
Mannan & Ganapathy, 2002; Shafigh, Mahmud, et al., 2014). This concrete should have
very well moist cured, otherwise it may have significant reduction on compressive
strength (Mannan & Ganapathy, 2002; Shafigh et al., 2011). Higher volume OPS in
Univers
ity of
Mala
ya
81
concrete mixture causes to be more sensitive to lack of curing. On the other hand, OPBC
is a crushed porous stone which is produced by burning of agricultural solid wastes in the
boiler combustion process in oil palm mills. Therefore, it is expected that by using of
OPBC in OPS concrete and reduction of the amount of OPS aggregates the engineering
properties of resulted concrete are improved. Therefore, the objective of this paper is to
produce a new type of lightweight aggregate concrete using a blended coarse lightweight
aggregate by incorporating OPS and OPBC in concrete mixture. In this study, the
engineering properties of the developed lightweight aggregate concrete were investigated.
The mechanical properties such as compressive, splitting tensile and flexural strengths
and modulus of elasticity of OPS-OPBC concrete were measured. In addition, initial and
final water absorptions as well as drying shrinkage strain of this blended coarse
lightweight aggregate concrete were also investigated. The drying shrinkage strain results
were also compared by the ACI-Standard model.
4.2 Experimental Details
4.2.1 Materials Used
Ordinary Portland cement (OPC) with specific gravity of 3.14 and 28-day compressive
strength of 48 MPa was used as binder. The OPS and OPBC were used as coarse
aggregates (Figure 4.1). They were collected from a local palm oil mill then washed and
dried in the laboratory. After drying, they were crushed using a crushing machine and
sieved to achieve almost the same grading of the coarse aggregates (see Figure 4.2). For
both concrete mixes, the OPS and OPBC aggregates were weighed in dry condition and
then immersed in water for 24 hours. After that they were air dried in the lab environment
for about 2 hours to obtain aggregate with saturated surface dry condition.
The physical and mechanical properties of OPS and OPBC are shown in Table 4.1. As
can be seen from Table 4.1, OPBC has higher density but it has significantly lower water
Univers
ity of
Mala
ya
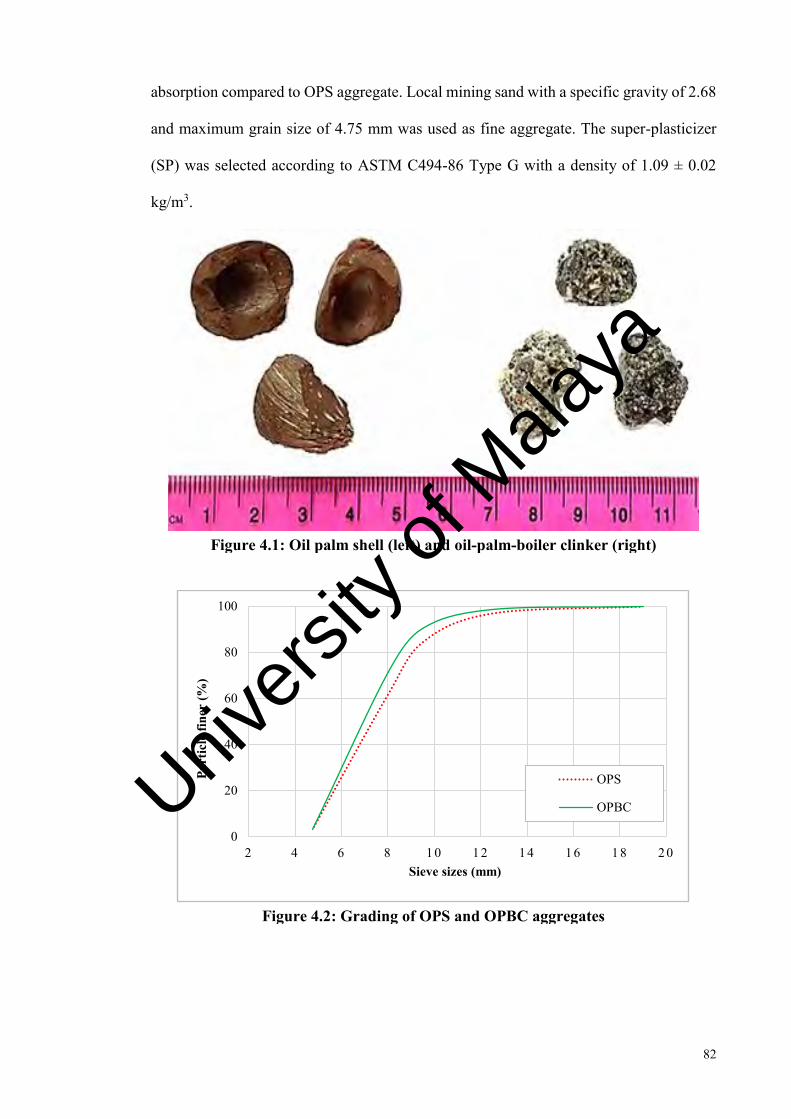
82
absorption compared to OPS aggregate. Local mining sand with a specific gravity of 2.68
and maximum grain size of 4.75 mm was used as fine aggregate. The super-plasticizer
(SP) was selected according to ASTM C494-86 Type G with a density of 1.09 ± 0.02
kg/m3.
Figure 4.1: Oil palm shell (left) and oil-palm-boiler clinker (right)
Figure 4.2: Grading of OPS and OPBC aggregates
0
20
40
60
80
100
2 4 6 8 1 0 1 2 1 4 1 6 1 8 2 0
Part
icle
fine
r (%
)
Sieve sizes (mm)
OPS
OPBCUnivers
ity of
Mala
ya
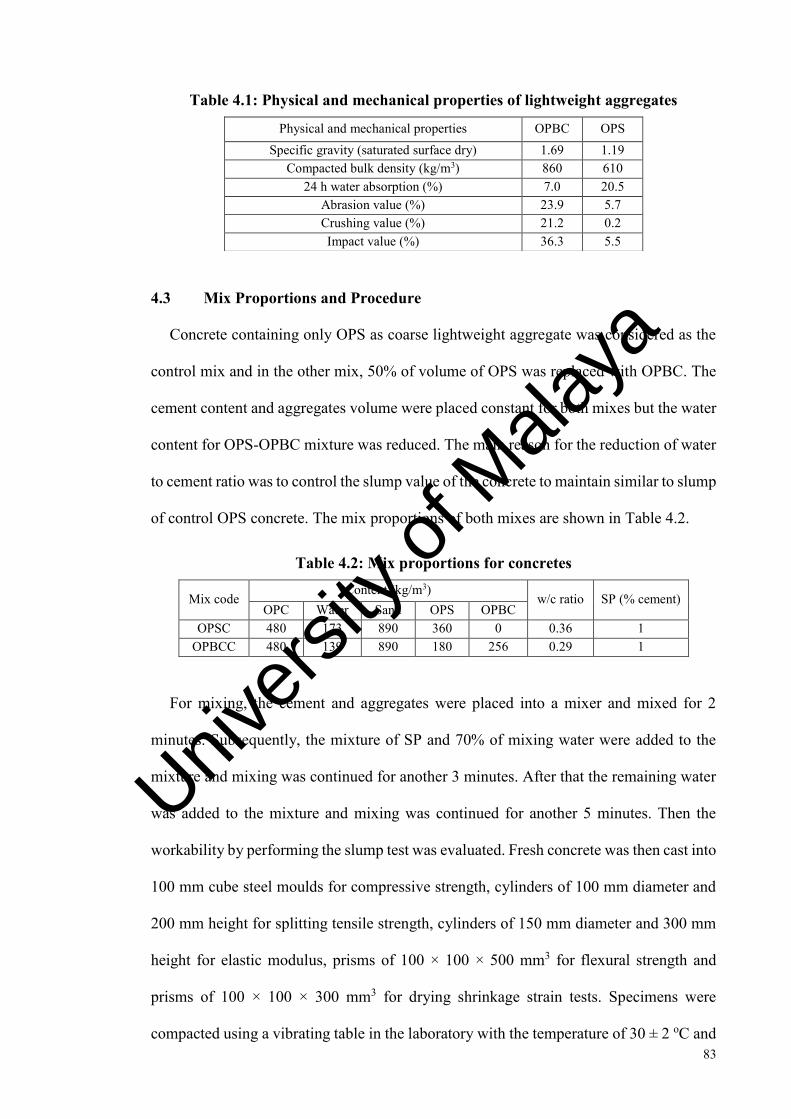
83
Table 4.1: Physical and mechanical properties of lightweight aggregates
Physical and mechanical properties OPBC OPS Specific gravity (saturated surface dry) 1.69 1.19
Compacted bulk density (kg/m3) 860 610 24 h water absorption (%) 7.0 20.5
Abrasion value (%) 23.9 5.7 Crushing value (%) 21.2 0.2 Impact value (%) 36.3 5.5
4.3 Mix Proportions and Procedure
Concrete containing only OPS as coarse lightweight aggregate was considered as the
control mix and in the other mix, 50% of volume of OPS was replaced with OPBC. The
cement content and aggregates volume were placed constant for both mixes but the water
content for OPS-OPBC mixture was reduced. The main reason for the reduction of water
to cement ratio was to control the slump value of the concrete to maintain similar to slump
of control OPS concrete. The mix proportions of both mixes are shown in Table 4.2.
Table 4.2: Mix proportions for concretes
Mix code Content (kg/m3)
w/c ratio SP (% cement) OPC Water Sand OPS OPBC
OPSC 480 173 890 360 0 0.36 1 OPBCC 480 139 890 180 256 0.29 1
For mixing, the cement and aggregates were placed into a mixer and mixed for 2
minutes. Subsequently, the mixture of SP and 70% of mixing water were added to the
mixture and mixing was continued for another 3 minutes. After that the remaining water
was added to the mixture and mixing was continued for another 5 minutes. Then the
workability by performing the slump test was evaluated. Fresh concrete was then cast into
100 mm cube steel moulds for compressive strength, cylinders of 100 mm diameter and
200 mm height for splitting tensile strength, cylinders of 150 mm diameter and 300 mm
height for elastic modulus, prisms of 100 × 100 × 500 mm3 for flexural strength and
prisms of 100 × 100 × 300 mm3 for drying shrinkage strain tests. Specimens were
compacted using a vibrating table in the laboratory with the temperature of 30 ± 2 oC and
Univers
ity of
Mala
ya
84
relative humidity of about 70%. The specimens were demoulded after 24 hours of casting
and were immersed in water at the temperature of 24 ± 2 oC. Three test specimens were
prepared to obtain the average values of the mechanical properties at any age. The drying
shrinkage specimens were kept under 7 days moist curing, after that shrinkage readings
were recorded under laboratory environment condition.
4.4 Results and Discussion
4.4.1 Workability and Density
Table 4.3 shows the slump value and density of the concrete mixes. It was observed
that both OPSC and OPBCC mixes showed similar and satisfactory workability. As can
be seen in Table 4.2, the water to cement ratio of OPBCC is significantly less than OPSC,
while their workability was similar. This is due to the shape and physical properties of
OPBC aggregate. Compared to OPS aggregates, OPBC aggregate is circular in shape and
has lower water absorption of about 66%, therefore at the same mix proportions concrete
containing OPBC has higher slump value compared to OPS concrete (Aslam, Shafigh,
Jumaat, et al., 2016). For this reason, to keep constant similar slump value water content
in OPBCC was reduced. According to Mehta & Monteiro (2006), structural lightweight
aggregate concrete with a slump value in the range of 50 to 75 mm is considered as a
LWC with good workability. At the same workability, concrete containing 50% coarse
OPBC aggregates has about 20% lower water to cement ratio. This significant reduction
in water to cement ratio may significantly affect hardened properties of the concrete.
Table 4.3 shows that concrete containing OPBC aggregate is heavier than OPS
concrete. This is due to the density of OPBC is more than OPS. However, it should be
noted that, although the incorporation of OPBC in OPS concrete increased the density,
however, the density of OPBC concrete is still in the acceptable range for the structural
lightweight concrete.
Univers
ity of
Mala
ya

85
Table 4.3: Slump and density
Mix code Slump (mm) Density (kg/m3)
Demoulded Oven dry
OPSC 55 1920 1790 OPBCC 52 2015 1940
4.4.2 Compressive Strength
The development of compressive strength of OPSC and OPBCC mixes under
continuous moist curing up to age of 56 days is shown in Figure 4.3. It was observed that
both mixes showed similarly sharp gain in compressive strengths at early ages. The
OPBCC mix has showed higher compressive strengths of about 25.9%, 28.1%, 28.4%,
30.7% and 28.9% at 1, 3, 7, 28 and 56 days, respectively compared to the control OPS
concrete. The OPSC and OPBCC mixes showed a significant difference between the
compressive strength results. The compressive strength of control OPS concrete showed
a 11.4%, 16.8% and 20.2% increase at 7, 28 and 56 days, respectively, as compared to 3-
days strength. While, these ratios for OPBCC mix are 11.7%, 19.8% and 21.2%,
respectively. Consequently, the OPBC concrete mixture showed higher rate of strength
gain up to 28-days but at later ages this rate was lower when compared to OPSC mix.
The OPBCC mixture showed 28-day compressive strength of about 53.3 MPa, which
is about 30.7% higher than the control OPS concrete. The key problem in OPS concrete
is due to it includes many shapes such as roughly parabolic, flaky and irregular with
smooth surface texture. OPBCC showed higher compressive strength due to: 1) OPBC
aggregates are not flakey. 2) They have rough surfaces which improve interlocking
between cement matrix and aggregate. 3) The density of OPBC aggregate is higher than
OPS aggregate, and, therefore, reduction of OPS and increase the OPBC content
improved the compressive strength of concrete. 4) it was found that due to round shape
of OPBC grains, substitution of OPS with OPBC improved the workability of concrete.
Univers
ity of
Mala
ya

86
Therefore, for the same workability, the water to cement ratio in OPBCC could be
reduced. The lower water to cement ratio increased the compressive strength.
Figure 4.3: Development of compressive strength
Lo et al. (2004) reported that strength of LWC depends on the properties of the
aggregates used and the hardened cement paste and their interfacial bonding. Okpala
(1990) reported that the failure of OPS concrete dependent upon the breakdown of the
bond between the shell and the cement paste. Mannan et al. (2006) stated that the OPS
concrete was generally failed due to the adhesion between the shell and the cement paste.
Further, they improved the quality of the shells using pre-treatment methods and achieved
the 28-day compressive strength of about 33 MPa.
From 28 days compressive strength results it can be seen that the replacement of OPS
by 50% OPBC in second mix highly increases the compressive strength from grade 35 to
grade 50 which can be consider as high strength lightweight aggregate concrete. The
major reason to show higher compressive strength in OPBCC is due to this concrete has
significantly lower water to cement ratio as compared to OPS concrete. Therefore, it is
10
20
30
40
50
60
0 10 20 30 40 50 60
Com
pres
sive
Stre
ngth
(MPa
)
Age (days)
OPSC
OPBCC
Univers
ity of
Mala
ya
87
expected that this aggregate has better interlock with cement matrix and consequently
higher compressive strength.
4.4.3 Splitting Tensile and Flexural Strengths
ASTMC330 (2005) specified that the minimum 28-day splitting tensile strength
required for structural LWAC must be 2.0 MPa. As can be seen in Table 4.4, both mixes
showed significantly higher splitting tensile strength (39% for OPSC and 44% for
OPBCC) than the minimum requirement of ASTMC330 (2005). Generally, the splitting
tensile strength of the concretes is proportional to its compressive strength, the higher the
compressive strength higher will be the splitting tensile strength. Literature (Abdullah,
1996; Alengaram et al., 2008a; Mannan & Ganapathy, 2002) revealed that under standard
curing, the OPS concrete showed the 28-day splitting tensile strength in the range of 1.10-
2.41 MPa. As can be seen in Table 4.4, in this study, OPS concrete showed significantly
higher splitting tensile strength compared to previous studies. However, in the mix
OPBCC, the replacement of OPS aggregate by 50% OPBC aggregate improved the
splitting tensile strength at all ages. It is interesting to note that a significant improvement
from 7 to 28 days for the splitting tensile strength of the OPBCC mix was observed, while
for OPS concrete the improvement was small. Normally, the ratio of splitting tensile to
compressive strength of NWC was found in the range of 8-14% (Shafigh et al., 2014).
However, this ratio for OPS and OPBC concretes is about 9% and 6.7%, respectively.
This ratio for OPS concrete was in the range of NWCs, however, this ratio for OPBCC
was lower than the minimum value of 8%. This is due to OPBCC is a high strength
concrete. In high strength LWC, this ratio is in the range of 6-7% (Holm & Bremner,
2000).
The flexural strength of OPSC and OPBCC mixes at 7- and 28 days are shown in Table
4.4. It was observed that similar to compressive and splitting tensile strengths, the flexural
Univers
ity of
Mala
ya
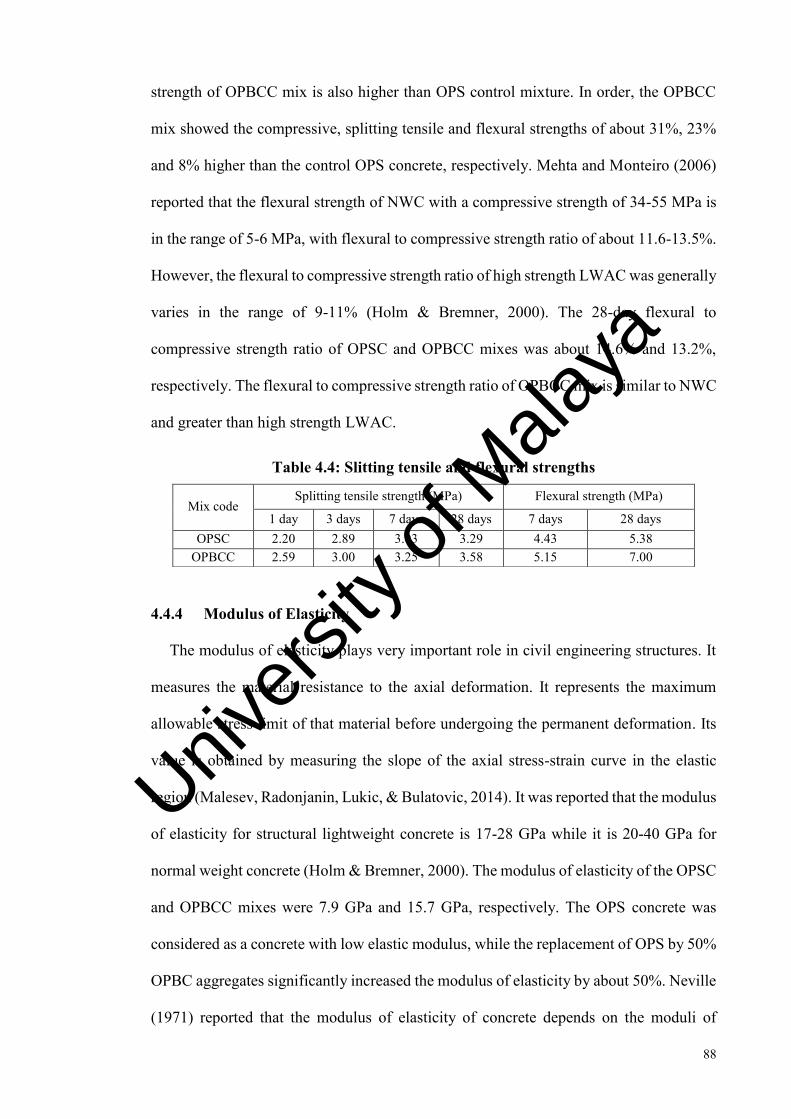
88
strength of OPBCC mix is also higher than OPS control mixture. In order, the OPBCC
mix showed the compressive, splitting tensile and flexural strengths of about 31%, 23%
and 8% higher than the control OPS concrete, respectively. Mehta and Monteiro (2006)
reported that the flexural strength of NWC with a compressive strength of 34-55 MPa is
in the range of 5-6 MPa, with flexural to compressive strength ratio of about 11.6-13.5%.
However, the flexural to compressive strength ratio of high strength LWAC was generally
varies in the range of 9-11% (Holm & Bremner, 2000). The 28-day flexural to
compressive strength ratio of OPSC and OPBCC mixes was about 14.6% and 13.2%,
respectively. The flexural to compressive strength ratio of OPBCC mix is similar to NWC
and greater than high strength LWAC.
Table 4.4: Slitting tensile and flexural strengths
Mix code Splitting tensile strength (MPa) Flexural strength (MPa)
1 day 3 days 7 days 28 days 7 days 28 days OPSC 2.20 2.89 3.03 3.29 4.43 5.38
OPBCC 2.59 3.00 3.25 3.58 5.15 7.00
4.4.4 Modulus of Elasticity
The modulus of elasticity plays very important role in civil engineering structures. It
measures the material resistance to the axial deformation. It represents the maximum
allowable stress limit of that material before undergoing the permanent deformation. Its
value is obtained by measuring the slope of the axial stress-strain curve in the elastic
region (Malesev, Radonjanin, Lukic, & Bulatovic, 2014). It was reported that the modulus
of elasticity for structural lightweight concrete is 17-28 GPa while it is 20-40 GPa for
normal weight concrete (Holm & Bremner, 2000). The modulus of elasticity of the OPSC
and OPBCC mixes were 7.9 GPa and 15.7 GPa, respectively. The OPS concrete was
considered as a concrete with low elastic modulus, while the replacement of OPS by 50%
OPBC aggregates significantly increased the modulus of elasticity by about 50%. Neville
(1971) reported that the modulus of elasticity of concrete depends on the moduli of
Univers
ity of
Mala
ya
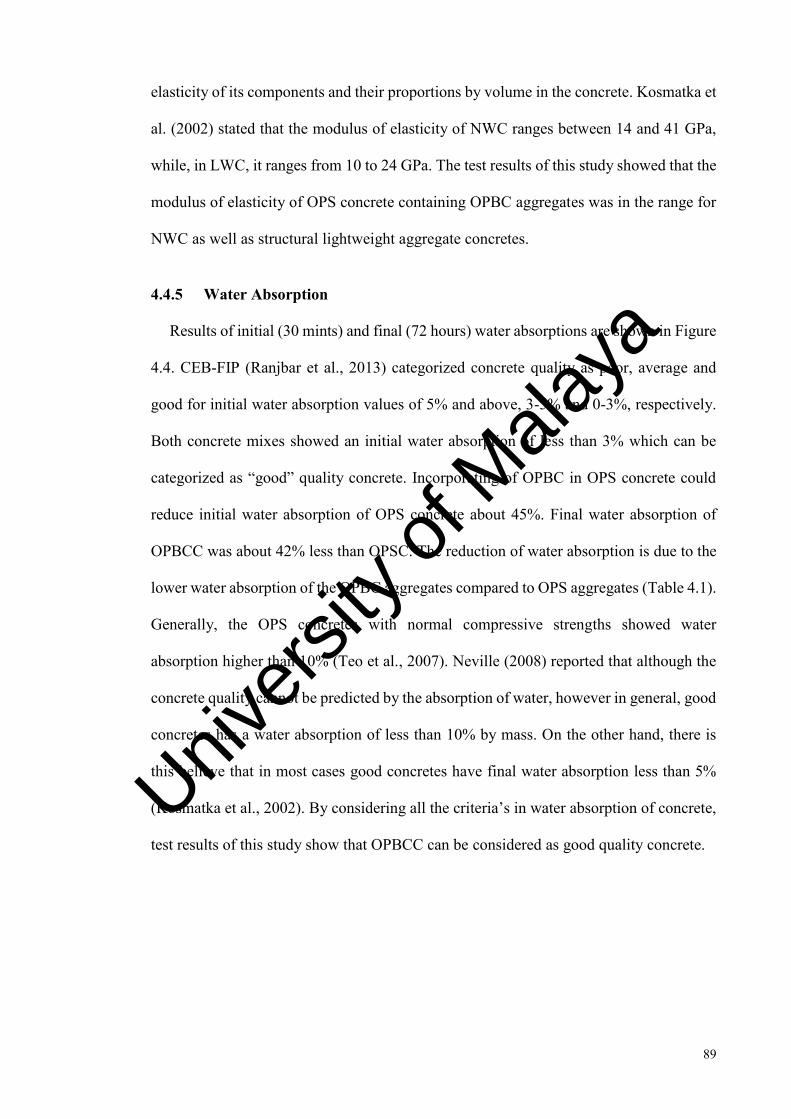
89
elasticity of its components and their proportions by volume in the concrete. Kosmatka et
al. (2002) stated that the modulus of elasticity of NWC ranges between 14 and 41 GPa,
while, in LWC, it ranges from 10 to 24 GPa. The test results of this study showed that the
modulus of elasticity of OPS concrete containing OPBC aggregates was in the range for
NWC as well as structural lightweight aggregate concretes.
4.4.5 Water Absorption
Results of initial (30 mints) and final (72 hours) water absorptions are shown in Figure
4.4. CEB-FIP (Ranjbar et al., 2013) categorized concrete quality as poor, average and
good for initial water absorption values of 5% and above, 3-5% and 0-3%, respectively.
Both concrete mixes showed an initial water absorption of less than 3% which can be
categorized as “good” quality concrete. Incorporating of OPBC in OPS concrete could
reduce initial water absorption of OPS concrete about 45%. Final water absorption of
OPBCC was about 42% less than OPSC. The reduction of water absorption is due to the
lower water absorption of the OPBC aggregates compared to OPS aggregates (Table 4.1).
Generally, the OPS concretes with normal compressive strengths showed water
absorption higher than 10% (Teo et al., 2007). Neville (2008) reported that although the
concrete quality cannot be predicted by the absorption of water, however in general, good
concretes has a water absorption of less than 10% by mass. On the other hand, there is
this believe that in most cases good concretes have final water absorption less than 5%
(Kosmatka et al., 2002). By considering all the criteria’s in water absorption of concrete,
test results of this study show that OPBCC can be considered as good quality concrete. Univ
ersity
of M
alaya
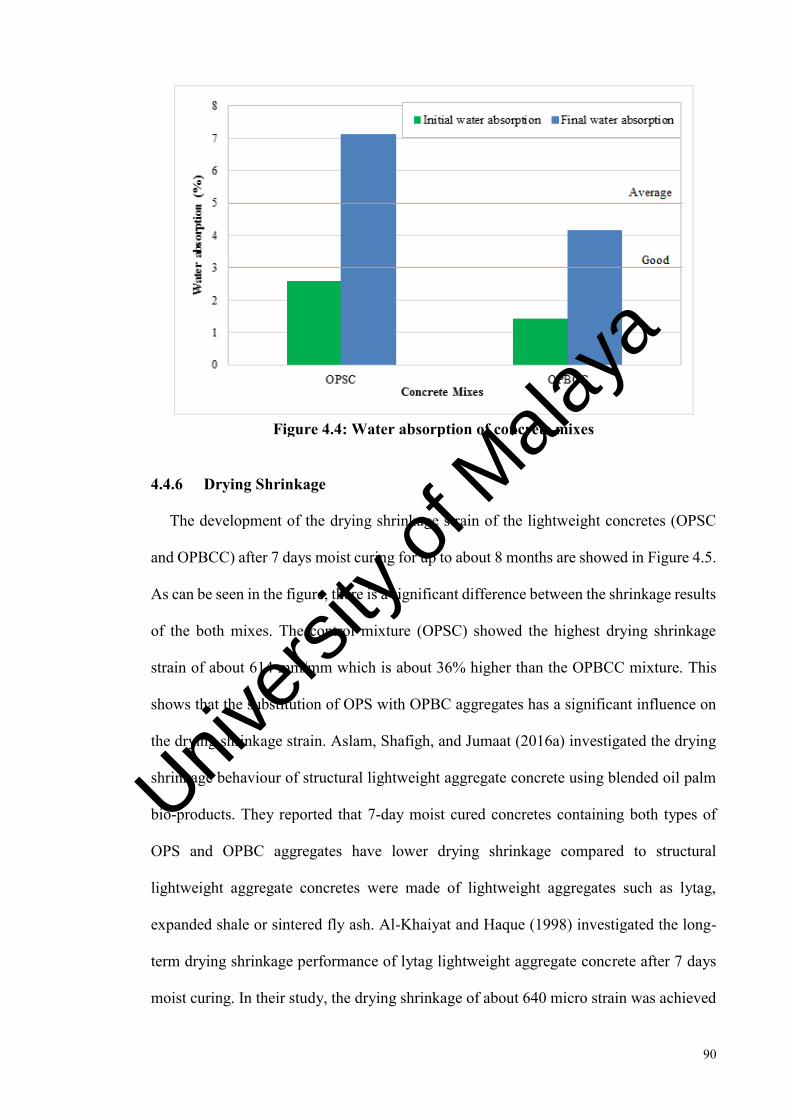
90
Figure 4.4: Water absorption of concrete mixes
4.4.6 Drying Shrinkage
The development of the drying shrinkage strain of the lightweight concretes (OPSC
and OPBCC) after 7 days moist curing for up to about 8 months are showed in Figure 4.5.
As can be seen in the figure, there is a significant difference between the shrinkage results
of the both mixes. The control mixture (OPSC) showed the highest drying shrinkage
strain of about 614 mm/mm which is about 36% higher than the OPBCC mixture. This
shows that the substitution of OPS with OPBC aggregates has a significant influence on
the drying shrinkage strain. Aslam, Shafigh, and Jumaat (2016a) investigated the drying
shrinkage behaviour of structural lightweight aggregate concrete using blended oil palm
bio-products. They reported that 7-day moist cured concretes containing both types of
OPS and OPBC aggregates have lower drying shrinkage compared to structural
lightweight aggregate concretes were made of lightweight aggregates such as lytag,
expanded shale or sintered fly ash. Al-Khaiyat and Haque (1998) investigated the long-
term drying shrinkage performance of lytag lightweight aggregate concrete after 7 days
moist curing. In their study, the drying shrinkage of about 640 micro strain was achieved
Univers
ity of
Mala
ya

91
at the age of 3 months. They have reported that various types of lightweight aggregate
usually resulted different behaviour in drying shrinkage. Further, some lightweight
concretes made of expanded clay and expanded shale aggregates with the compressive
strengths of 30-50 MPa showed a drying shrinkage strain in the range of 400 to 600 micro-
strain (CEB/FIP, 1977).
The drying shrinkage strain of the OPS concrete was significantly reduced, might be
due to the following reasons. (1) OPS is an agricultural waste with smooth surface texture
and has lower specific surface area, while the OPBC is a porous crushed stone so it is
expected that the drying shrinkage of OPS is higher than OPBC aggregate. Al-Attar
(2008) investigated the shrinkage strain of NWC by using crushed and uncrushed gravels
as aggregates. He reported that the round uncrushed gravels have lower specific surface
area and smoother texture due to that it showed higher drying shrinkage compared to
crushed gravel aggregate concrete. Therefore, it can be seen that surface texture of
aggregate influences the drying shrinkage of concrete. (2) It was observed that by the
incorporation of the OPBC in OPS concrete, the all mechanical properties were improved.
This is another reason that concrete with higher elastic modulus have lower drying
shrinkage. This might be due to the strong interfacial bond between the OPBC aggregates
and the cement paste. Neville (1977) reported that LWA usually leads to higher shrinkage
in concrete due to its lower elastic modulus. In this study, the modulus of elasticity was
highly improved by the contribution of the OPBC aggregate and was found in the range
of normal weight concretes. (3) Another important reason of lower drying shrinkage
strain of OPBC concrete was due to significant reduction of water to cement ratio from
0.36 to 0.29 in mix OPBCC. Bogas, Nogueira, and Almeida (2014) reported that for the
same cement content, the drying shrinkage strain increases with increasing water to
cement ratio. In fact, there is an increment of the volume of paste and a corresponding
reduction of the aggregate content. The higher the water to cement ratio the lower the
Univers
ity of
Mala
ya

92
mortar stiffness and the higher the volume of evaporable water. A small reduction of the
w/c ratio also causes a significant delay in drying shrinkage strain (Carlson, 1938).
The experimental results of the drying shrinkage strain were also compared with the
prediction model proposed by ACI209R (2008). The ACI209R (2008) proposed
shrinkage prediction model as, S(t, tc) at time t (days) measured from start of drying at tc
(days), and S∞ is the ultimate shrinkage.
S(t, tc) = (t− 𝑡𝑐)
𝑓+(t− 𝑡𝑐)x S∞ (4.1)
f = 26.0 ∗ 𝑒[1.42∗10−2(𝑉
𝑆)] (4.2)
S∞ = 780 x 10-6 x (Ƴsh) (4.3)
Ƴsh = Ƴtc · ƳRH · Ƴvs · Ƴs · Ƴψ · Ƴc · Ƴα (4.4)
where, f = 35 for concrete water-cured for 7 days while to take into account the size
and geometry on the drying of concrete specimens. Volume to surface area ratio is (𝑉
𝑆)
and Ƴsh represents the product of several factors. Ƴtc is the curing time coefficient, ƳRH is
the relative humidity coefficient, Ƴvs depends on volume to surface area ratio, Ƴs is the
slump factor (slump in mm), Ƴψ is the fine aggregate ratio (fine aggregate to the total
aggregates), Ƴc is the cement content in kg/m3 and Ƴα is the air content (%).
The ACI209R (2008) prediction model of shrinkage strain gave close results to
shrinkage values of both concretes up to one month. After one month, the drying
shrinkage values from the model are closer to drying shrinkage of OPSC mix. In general,
it can be concluded that this model code is suitable to predict drying shrinkage of OPS
and OPS-OPBC concretes at short time (for up to one month) and for OPS concrete at
later ages (for more than five months). Therefore, a new model code to predict drying
shrinkage of OPS-OPBC concrete should be developed.
Univers
ity of
Mala
ya
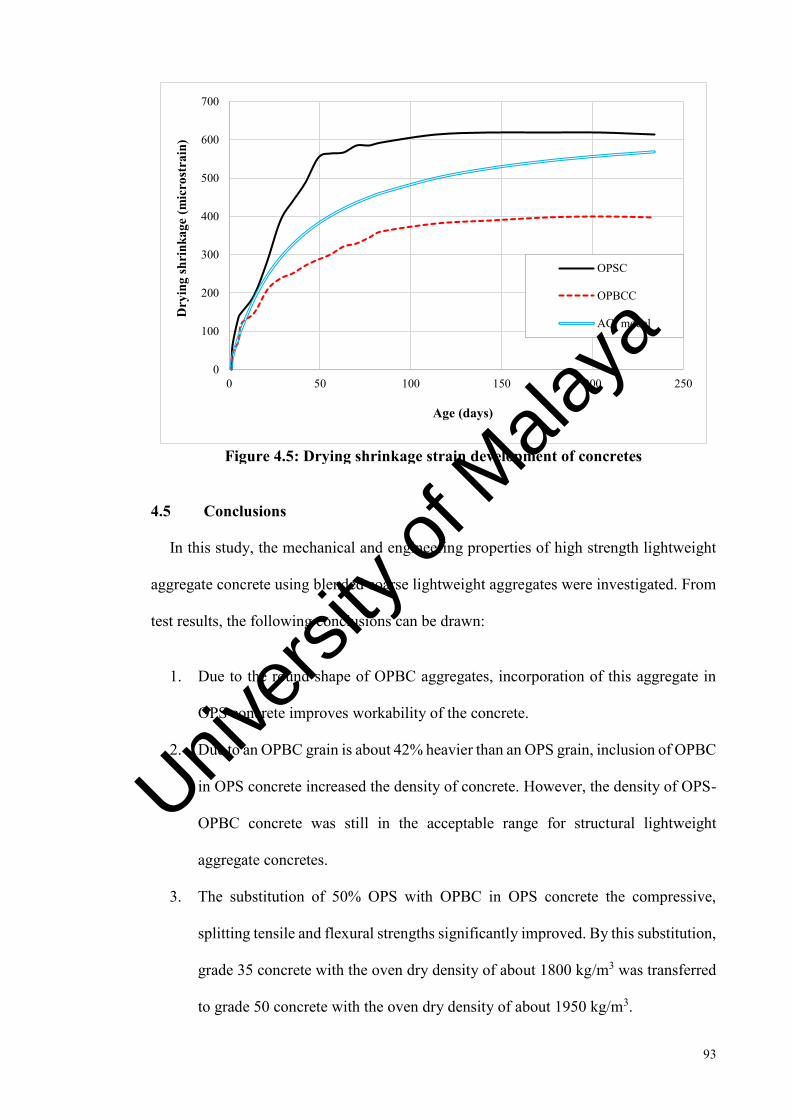
93
Figure 4.5: Drying shrinkage strain development of concretes
4.5 Conclusions
In this study, the mechanical and engineering properties of high strength lightweight
aggregate concrete using blended coarse lightweight aggregates were investigated. From
test results, the following conclusions can be drawn:
1. Due to the round shape of OPBC aggregates, incorporation of this aggregate in
OPS concrete improves workability of the concrete.
2. Due to an OPBC grain is about 42% heavier than an OPS grain, inclusion of OPBC
in OPS concrete increased the density of concrete. However, the density of OPS-
OPBC concrete was still in the acceptable range for structural lightweight
aggregate concretes.
3. The substitution of 50% OPS with OPBC in OPS concrete the compressive,
splitting tensile and flexural strengths significantly improved. By this substitution,
grade 35 concrete with the oven dry density of about 1800 kg/m3 was transferred
to grade 50 concrete with the oven dry density of about 1950 kg/m3.
0
100
200
300
400
500
600
700
0 50 100 150 200 250
Dry
ing
shri
nkag
e (m
icro
stra
in)
Age (days)
OPSC
OPBCC
ACI model
Univers
ity of
Mala
ya
94
4. The modulus of elasticity of grade 35 OPS concrete is very low compared to
normal concrete and structural lightweight aggregate concrete at the same
compressive strength. However, the incorporation of OPBC in OPS concrete
significantly enhanced this property. The modulus of elasticity of OPS-OPBC
concrete is in the normal range of structural concretes.
5. The initial and final water absorption of OPS-OPBC concrete is significantly less
than OPS concrete. Based on water absorption, this concrete is considered as good
quality concrete.
6. The drying shrinkage of OPS and OPS-OPBC concretes is similar at early ages.
However, OPS-OPBC concrete showed significantly lower drying shrinkage
compared to OPS concrete after one month. The ACI-209R has conservative
estimation for OPS-OPBC concrete.
Univers
ity of
Mala
ya

95
MANUFACTURING HIGH-STRENGTH LIGHTWEIGHT
AGGREGATE CONCRETE USING OIL PALM SHELL IN A SEMI-
LIGHTWEIGHT OIL-PALM-BOILER CLINKER CONCRETE
5.1 Introduction
The weight of concrete is one of the most important parameters to make an economical
structure. Compared to conventional concrete, lightweight concrete (LWC) shows better
economy with lower dead load and higher efficiency (Shafigh, Jumaat, & Mahmud,
2012). Lightweight concrete has been used since ancient times and is a most interesting
field of research because of its several advantages including lesser transport,
reinforcement, and foundation cost, cost-effective scaffolding and formwork, improved
constructability, better durability, no surface bleed water, sound absorption, superior anti-
condensation properties, improved hydration due to internal curing, lower tendency to
buckle due to variant temperature gradients, reduced seismic forces, and better heat
insulation, fire and frost resistance (CEB/FIP, 1977; Duzgun, Gul, & Aydin, 2005;
Neville, 2008). However, this type of concrete also has several disadvantages including
lower mechanical and durability properties, greater amount of cement is required
compared to conventional concrete of the same grade, higher drying shrinkage and creep,
high prestressing losses, higher material costs, and lack of sufficient shear reinforcement
(Shafigh et al., 2011). Such drawbacks justified the efforts to resolve the problems of the
existing lightweight concretes.
The most popular way of achieving structural LWC is by using lightweight aggregates
(LWA) (Polat et al., 2010), which may be either natural or artificial. The main natural
LWAs such as diatomite, pumice, volcanic cinders, scoria, tuff and artificial LWAs such
as expanded clay, shale, slate, perlite and vermiculite have been used as construction
materials (Aslam et al., 2016b). Another type of artificial (factory-made) LWA is an oil-
Univers
ity of
Mala
ya

96
palm-boiler clinker (OPBC) obtained from the oil palm industry. In countries, such as
Malaysia, Indonesia and Nigeria, the oil palm industry produces huge amount of
agricultural wastes. Malaysia contributes about 58% of the total world supply of palm oil,
and one of the top listed countries with huge amount of solid waste from the oil palm
industry (Ahmad et al., 2010). The OPBC is produced during the oil palm extraction
process and is locally known as boiler stone. It is also referred to as oil-palm-boiler clinker
(OPBC) with whitish grey in colour and has the appearance of a porous stone, which
contributes to its light-weightiness (Aslam, Shafigh, Jumaat, et al., 2016; Soleymani,
2012). The density of OPBC aggregates is about 15-35 % less than conventional
aggregates.
Several researchers have studied the use of OPBC as an aggregate in concretes to
achieve varying grades of strength. Some of them used OPBC as both fine and coarse
aggregates to develop a LWAC known as oil-palm-boiler clinker concrete. Abdullahi et
al. (2008) investigated the properties of LWC using OPBC as fine and coarse aggregates
in concrete mixture. They successfully developed a LWC with 28-day compressive
strength range of 17-33 MPa with the dry density in the range of 1440-1850 kg/m3.
Zakaria (1986) prepared the LWC by utilizing the OPBC as coarse and normal sand as
fine aggregates. He achieved the 28-day compressive strength range of 15-28 MPa, with
the dry density range of 1800-2000 kg/m3. Later, Mannan and Neglo (2010) studied the
use of OPBC as coarse aggregate in concrete to develop a structural LWAC. They
achieved better compressive strength varying between 27-36 MPa with the dry density
range of 1845-1980 kg/m3. Ahmad et al. (2007) changed the concrete mixture by using
OPBC as coarse and mining sand as fine aggregate. They produced semi-lightweight
aggregate concrete with the 28-day compressive strength of about 42 MPa and the dry
density of about 2020 kg/m3.
Univers
ity of
Mala
ya
97
From the previous studies, it was observed that using OPBC as coarse aggregate with
normal sand, the density of concrete might be higher than the density required for a
structural lightweight concrete according to code of practices (ACI213R, 1999). The
density of the structural LWAC normally ranges from 1400-2000 kg/m3 compared to that
of normal weight concrete (NWC) that is around 2400 kg/m3. Neville (2008) reported that
the density of LWC lies between 350 to 1850 kg/m3. In the most cases, artificial LWAs
were used to produce structural LWAC in practice. However, it should be noted that
manufacturing process of these types of LWAs is not ecological and environmental due
to need of very high temperature up to about 1200 °C (Priyadharshini & Santhi, 2012).
To provide such a high temperature huge amount of fossil fuel is required. In addition,
the cost of artificial LWAs is more than conventional aggregates because of high energy
demand for preparation process. If this type of LWA is not locally available, it should be
imported which makes it to be more expansive. A solid waste namely oil palm shell (OPS)
is an alternative LWA in tropical regions, where there is oil palm industry. OPS is an
agro-waste material and is the most abundantly produced solid waste material in tropical
regions. It has characteristics of a lightweight aggregate (Okafor, 1988) and can be used
in concrete mixture to produce a structural LWAC (Mannan & Ganapathy, 2002; Shafigh,
Jumaat, & Mahmud, 2012). OPS lightweight aggregate is about 58% lighter than
conventional aggregates. OPS lightweight concrete with a 28-day compressive strength
of 20-35 MPa (typical compressive strength range for structural LWC) has a dry density
of about 20-25% less than conventional concrete (Mannan & Ganapathy, 2004). Recently,
high strength OPS lightweight concretes with a compressive strength in the range of 42-
53 MPa and dry density in the range of 1790-1990 kg/m3 were also produced by (Shafigh,
Jumaat, & Mahmud, 2012; Shafigh, Jumaat, Mahmud, et al., 2011).
From the literature, it could be found that OPBC concrete with high strength is
considered as semi-lightweight concrete. In addition, reports show that the OPBC
Univers
ity of
Mala
ya
98
concrete is heavier than OPS concrete at the same compressive strength. This is because
the density of OPBC is about 30% more than OPS. To reduce the density of OPBC
concrete from semi-lightweight to lightweight concrete a part of OPBC volume should
be substituted by a lighter lightweight aggregate. OPS with a density about 30% less than
OPBC could be suitable to be used for this purpose. In the current study, OPBC therefore
was partially substituted with OPS aggregates in a grade 55 semi-lightweight OPBC
concrete.
This study is organized as follows: In section 5.2, we describe our experiment setup in
details. In section 5.3, we evaluate the efficiency of OPS aggregates on density,
compressive strengths under different curing conditions, splitting tensile, flexural
strengths, modulus of elasticity, stress-strain relationship, and water absorption in a semi-
lightweight OPBC concrete. Finally, we summarize our conclusions in section 5.4.
5.2 Experimental Investigation
5.2.1 Materials Used
The ordinary Portland cement (OPC) with the 28-day compressive strength of 48 MPa
was used as a binder. The OPC conforming to MS522, part-1:2003 with a specific surface
area and specific gravity of 1.89 m2/g and 3.14, respectively.
Local mining sand with a maximum size of 4.75 mm and specific gravity of 2.68, was
used as fine aggregate. The locally collected materials of OPBC and OPS, as shown
Figure 4.1, were used as coarse aggregates. The OPS aggregates were washed with
detergent to remove the dust and the oil coating from the surface and dried in the
laboratory. However, the OPBC aggregates were crushed using a crushing machine and
then sieved. The both aggregates (OPS and OPBC) were prepared with the similar grading
of the aggregates with the maximum size of 12 mm. For each concrete mix, the OPBC
and OPS aggregates were weighed in dry conditions and immersed in water for 24 hours.
Univers
ity of
Mala
ya

99
Then they air dried in the laboratory environment for 2-3 hours to obtain an aggregate
with an almost saturated surface dry condition. Table 3.2 shows the physical properties
of OPBC and OPS aggregates. In addition, Sika ViscoCrete was used as the super-
plasticizer (SP), and normal tap water was used as mixing water in this study.
5.2.2 Mix Proportions
To investigate the effectiveness of partial replacement of OPBC with OPS on the
properties of OPBC concrete, a grade 55 OPBC concrete was used as control mix. The
mix proportions of control concrete with high strength and good workability were
achieved by several trial and error methods. The density of this concrete was in the range
of semi-lightweight concrete. To reduce the density of this concrete, OPBC coarse
aggregates were substituted with OPS coarse aggregates in percentages of 20, 40 and 60
by volume. Mix proportions and slump value of all concrete mixes are shown in Table
5.1.
It was observed that the partial substitution of OPBC by OPS improved the slump
value of the mixes. This was mainly due to the shape and surface texture of the aggregates.
The OPS aggregate have smooth surfaces which resulted higher workability than the
OPBC concrete (Aslam et al., 2016b; Mannan & Ganapathy, 2002). However, all the
mixes showed very good workability without any segregation. Mehta and Monteiro
(2006) reported that the structural LWAC with the slump value of 50-75 mm is equivalent
to 100-125 mm slump of the NWC.
Table 5.1: Details of the concrete mixes (kg/m3)
Mix code Cement Water w/c Sand Coarse aggregate SP (%
cement) Slump (mm) OPBC OPS
M-0 480 173 0.36 890 511 0 0.85 85 M-20 480 173 0.36 890 409 72 0.85 95 M-40 480 173 0.36 890 307 144 0.85 90 M-60 480 173 0.36 890 204 216 0.90 100
Univers
ity of
Mala
ya

100
5.2.3 Test Methods
The slump test was performed before casting of the specimens. The concrete
specimens were casted in 100 mm steel cube moulds to determine compressive strength
and water absorption. The cylinders of 200 mm height and 100 mm diameter for splitting
tensile strength, cylinders of 300 mm height and 150 mm diameter for modulus of
elasticity, and prisms of 100 × 100 × 500 mm for flexural strength were used.
The effect of curing conditions on the 28-day compressive strength was investigated
under three different curing conditions, 1) continuous moist curing (FW) until the time of
testing, 2) 7 days moist curing (7W) in which the specimens were cured in water for 6
days and then in the lab environment, and 3) air-dry curing (AC) in which the specimens
did not have any moist curing. The curing water had a temperature of 23 ± 3 °C. The
temperature and relative humidity of the lab environment were 31 ± 3 °C and 84 ± 3 %,
respectively. At least three test specimens were prepared to obtain average values of
mechanical properties at any age.
5.3 Test Results and Discussion
5.3.1 Density
Figure 5.1 shows the relationship between the OPS substitution level and density. Test
results show that substitution of OPBC with OPS reduced the density of the concrete.
This occurs due to the lower specific gravity of OPS compared to that of OPBC. The
density of control OPBC concrete (mix M-0) in both cases of demoulded and dried
densities is between 2000-2200 kg/m3. In this range, the concrete is considered as semi-
lightweight (Abouhussien, Hassan, & Ismail, 2015). Substitution of OPBC with OPS in
control mix in the substitution levels of 20, 40 and 60% could reduce the dried density
about 2.8%, 5.5% and 9.5%, respectively. All the concretes containing OPS aggregates
Univers
ity of
Mala
ya

101
have a dried density less than 2000 kg/m3. Therefore, they could be considered as
lightweight concrete (Aslam, Shafigh, et al., 2016b).
The difference between demoulded and oven dried densities for OPBC concrete mix
was 26 kg/m3. This difference significantly increased with increasing the substitution
levels of OPBC with OPS. It was 51, 68 and 138 kg/m3 for M-20, M-40 and M-60,
respectively. The main reason for increasing the difference between these two densities
is high water absorption of OPS compared to OPBC.
Figure 5.1: Relationship between density, percentage substitution of OPS and
concrete weight reduction (%)
Figure 5.2 shows the relationship between dry density and the 28-day compressive
strength of concretes with strong correlation. This figure also illustrates the variation of
28-day compressive strength with respect to dry density for other lightweight concrete
that were made with different lightweight aggregates. As can be seen in this figure, 28-
day compressive strength increases with increasing dry density for all types of lightweight
aggregate concrete.
0
2
4
6
8
10
1750
1800
1850
1900
1950
2000
2050
2100
0 20 40 60
Con
cret
e w
eigh
t red
uctio
n (%
)
Dry
den
sity
(kg/
m3 )
OPS substitution (%)
Density Concrete weight reduction
Univers
ity of
Mala
ya
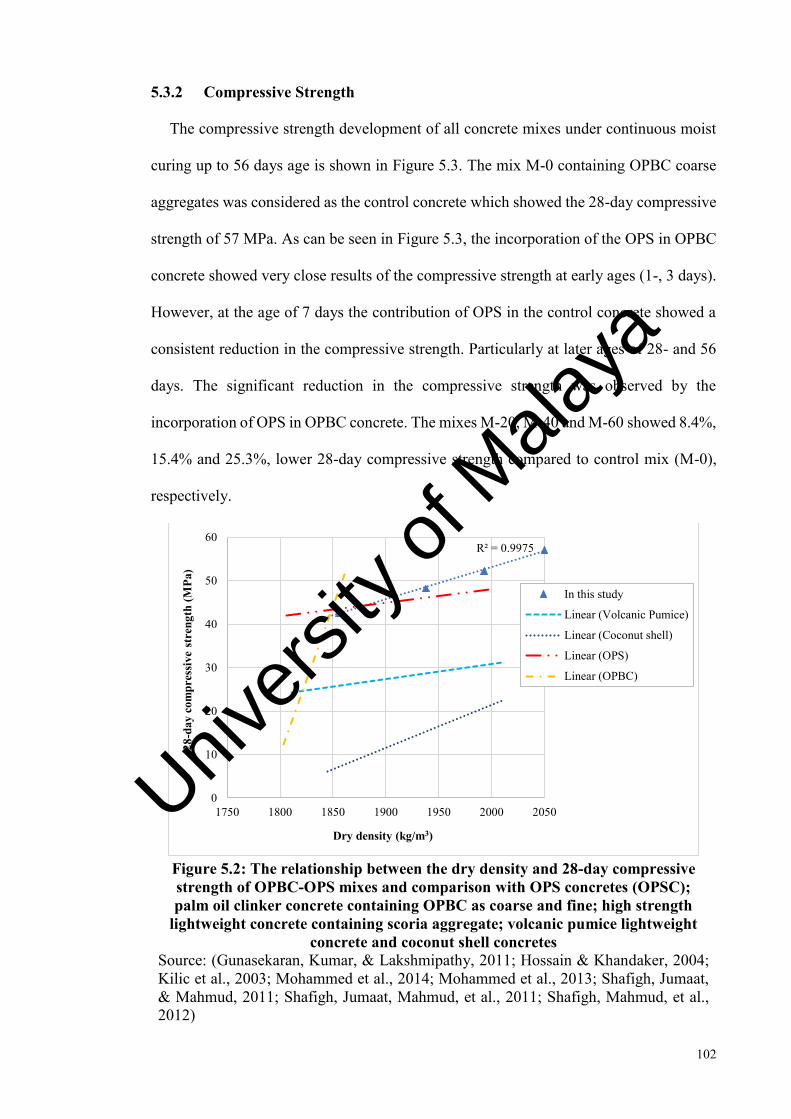
102
5.3.2 Compressive Strength
The compressive strength development of all concrete mixes under continuous moist
curing up to 56 days age is shown in Figure 5.3. The mix M-0 containing OPBC coarse
aggregates was considered as the control concrete which showed the 28-day compressive
strength of 57 MPa. As can be seen in Figure 5.3, the incorporation of the OPS in OPBC
concrete showed very close results of the compressive strength at early ages (1-, 3 days).
However, at the age of 7 days the contribution of OPS in the control concrete showed a
consistent reduction in the compressive strength. Particularly at later ages of 28- and 56
days. The significant reduction in the compressive strength was observed by the
incorporation of OPS in OPBC concrete. The mixes M-20, M-40 and M-60 showed 8.4%,
15.4% and 25.3%, lower 28-day compressive strength compared to control mix (M-0),
respectively.
Figure 5.2: The relationship between the dry density and 28-day compressive strength of OPBC-OPS mixes and comparison with OPS concretes (OPSC); palm oil clinker concrete containing OPBC as coarse and fine; high strength
lightweight concrete containing scoria aggregate; volcanic pumice lightweight concrete and coconut shell concretes
Source: (Gunasekaran, Kumar, & Lakshmipathy, 2011; Hossain & Khandaker, 2004; Kilic et al., 2003; Mohammed et al., 2014; Mohammed et al., 2013; Shafigh, Jumaat, & Mahmud, 2011; Shafigh, Jumaat, Mahmud, et al., 2011; Shafigh, Mahmud, et al., 2012)
R² = 0.9975
0
10
20
30
40
50
60
1750 1800 1850 1900 1950 2000 2050
28-d
ay c
ompr
essi
ve s
tren
gth
(MPa
)
Dry density (kg/m3)
In this study
Linear (Volcanic Pumice)
Linear (Coconut shell)
Linear (OPS)
Linear (OPBC)
Univers
ity of
Mala
ya
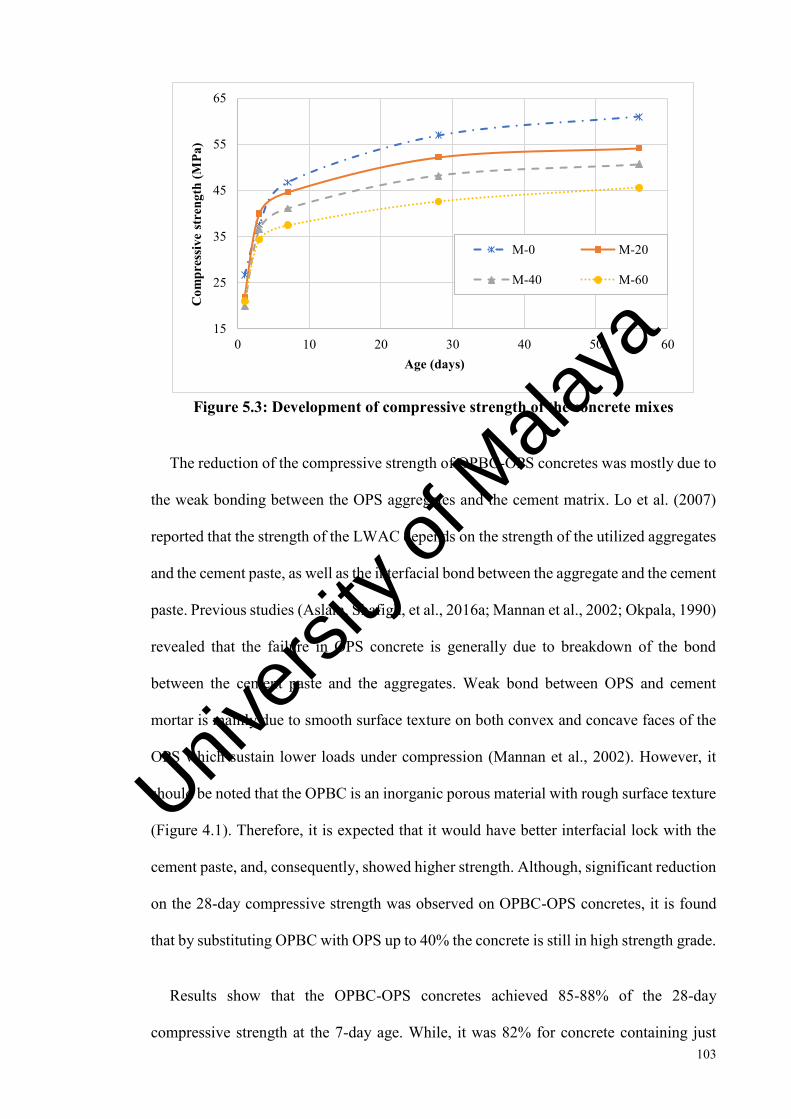
103
Figure 5.3: Development of compressive strength of the concrete mixes
The reduction of the compressive strength of OPBC-OPS concretes was mostly due to
the weak bonding between the OPS aggregates and the cement matrix. Lo et al. (2007)
reported that the strength of the LWAC depends on the strength of the utilized aggregates
and the cement paste, as well as the interfacial bond between the aggregate and the cement
paste. Previous studies (Aslam, Shafigh, et al., 2016a; Mannan et al., 2002; Okpala, 1990)
revealed that the failure in OPS concrete is generally due to breakdown of the bond
between the cement paste and the aggregates. Weak bond between OPS and cement
mortar is mainly due to smooth surface texture on both convex and concave faces of the
OPS which sustain lower loads under compression (Mannan et al., 2002). However, it
should be noted that the OPBC is an inorganic porous material with rough surface texture
(Figure 4.1). Therefore, it is expected that it would have better interfacial lock with the
cement paste, and, consequently, showed higher strength. Although, significant reduction
on the 28-day compressive strength was observed on OPBC-OPS concretes, it is found
that by substituting OPBC with OPS up to 40% the concrete is still in high strength grade.
Results show that the OPBC-OPS concretes achieved 85-88% of the 28-day
compressive strength at the 7-day age. While, it was 82% for concrete containing just
15
25
35
45
55
65
0 10 20 30 40 50 60
Com
pres
sive
stre
ngth
(MPa
)
Age (days)
M-0 M-20
M-40 M-60
Univers
ity of
Mala
ya
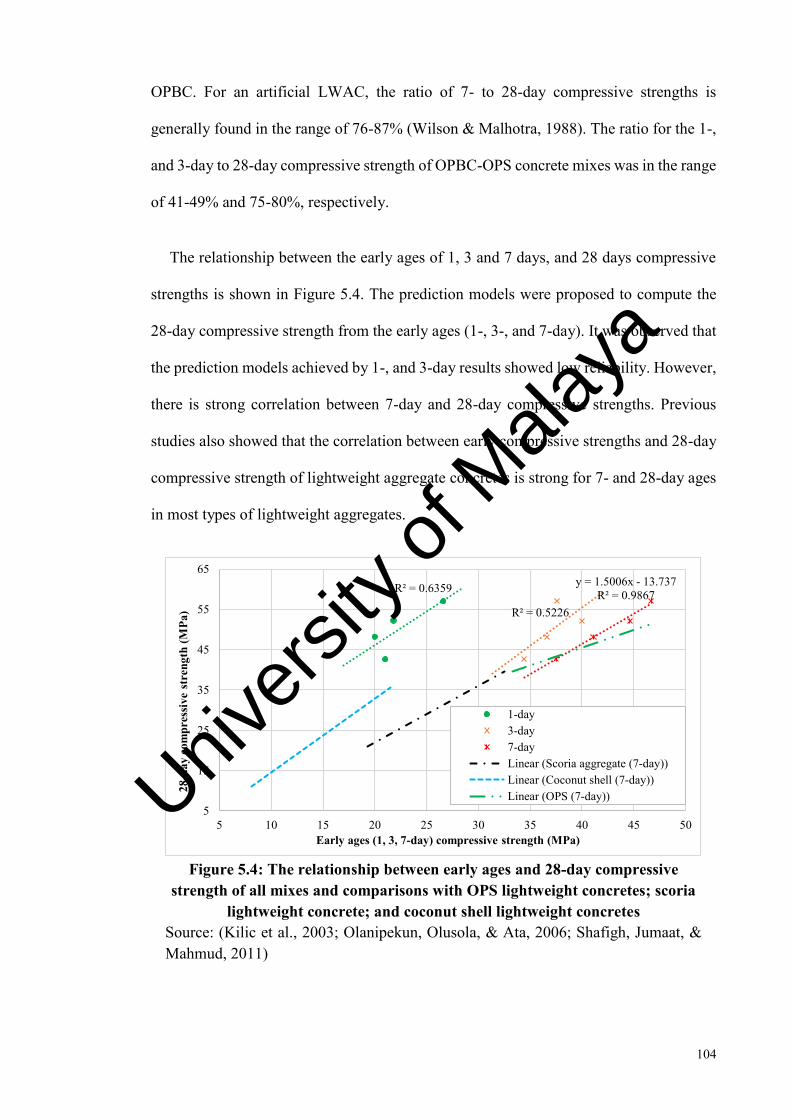
104
OPBC. For an artificial LWAC, the ratio of 7- to 28-day compressive strengths is
generally found in the range of 76-87% (Wilson & Malhotra, 1988). The ratio for the 1-,
and 3-day to 28-day compressive strength of OPBC-OPS concrete mixes was in the range
of 41-49% and 75-80%, respectively.
The relationship between the early ages of 1, 3 and 7 days, and 28 days compressive
strengths is shown in Figure 5.4. The prediction models were proposed to compute the
28-day compressive strength from the early ages (1-, 3-, and 7-day). It was observed that
the prediction models achieved by 1-, and 3-day results showed low reliability. However,
there is strong correlation between 7-day and 28-day compressive strengths. Previous
studies also showed that the correlation between early compressive strengths and 28-day
compressive strength of lightweight aggregate concretes is strong for 7- and 28-day ages
in most types of lightweight aggregates.
Figure 5.4: The relationship between early ages and 28-day compressive
strength of all mixes and comparisons with OPS lightweight concretes; scoria lightweight concrete; and coconut shell lightweight concretes
Source: (Kilic et al., 2003; Olanipekun, Olusola, & Ata, 2006; Shafigh, Jumaat, & Mahmud, 2011)
R² = 0.6359
R² = 0.5226
y = 1.5006x - 13.737R² = 0.9867
5
15
25
35
45
55
65
5 10 15 20 25 30 35 40 45 50
28-d
ay c
ompr
essi
ve s
tren
gth
(MPa
)
Early ages (1, 3, 7-day) compressive strength (MPa)
1-day3-day7-dayLinear (Scoria aggregate (7-day))Linear (Coconut shell (7-day))Linear (OPS (7-day))Univ
ersity
of M
alaya

105
The comparison of the 28-day compressive strength under continuous moist curing
(FW), 7-day water curing (7W) and air-dried (AC) condition of all the mixes is shown in
Figure 5.5. As can be seen in this figure, all the concrete mixes showed a reduction in the
28-day compressive strength under AC. Compared to FW, the reduction in the
compressive strength of the OPBC concrete mixes by the incorporation of 0, 20, 40 and
60% OPS aggregate were about 4%, 15%, 10% and 3%, respectively. It was observed
from the results that the OPBC concrete showed very low reduction in the compressive
strength under air-drying condition.
Figure 5.5: 28-day compressive strength with and without curing
As can be seen in Figure 5.5, the partial early curing of 7W showed higher compressive
strength for all the mixes. Compared to AC condition, partial early curing of 7W
improved the compressive strength of the M-0, M-20, M-40 and M-60 mixes by about
5.4%, 17%, 13% and 5%, respectively. Early water curing therefore caused a greater
improvement in compressive strength. However, the compressive strength of all the
concrete mixes under 7W curing condition was on average about 2% higher than the
compressive strength under FW curing. It was observed that all the mixes under 7W
35
40
45
50
55
60
M-0 M-20 M-40 M-60
28-d
ay c
ompr
essi
ve s
tren
gth
(MPa
)
Concrete Mix
FW curing 7W curing Air drying
Univers
ity of
Mala
ya
106
curing condition gave very similar results to that of the continuous moist cured specimens.
It seems that due to this reason most of the codes recommended sufficient curing to
achieve a maturity equivalent to 7-day moist curing (Haque, 1990).
5.3.3 Stress-strain Relationship of OPBC-OPS Concretes
The stress-strain relationship in compression is one of the important property of
concrete to predict the behaviour of structural elements under action loads. From the
stress-strain relationships many properties of a concrete can be derived, such as the strains
at peak stresses, ultimate strains, fracture toughness, and the modulus of elasticity. The
compressive stress-strain relationship is typically divided in four parts; firstly the initial
linear stress-strain relationship in which the concrete behaved elastically, secondly the
existence of micro-cracks which changes the shape of the curve into a non-linear
relationship, thirdly the consequent formation of macro-cracks in which the stress–strain
curve bends towards the horizontal and the concrete could not sustain additional loads,
and finally the development of larger cracks in that the load carrying capacity of the
concrete was reduced and the stress-strain curve descends (Mo, Alengaram, & Jumaat,
2015). The higher strain capacity of concrete shows an ability to absorb movements and
also improve the resistance to cracking (Turatsinze & Garros, 2008).
The stress-strain relationship for the concrete mixes of M-0, M-40 and M-60 is shown
in Figure 5.6. The strain at the peak stress (ε0) of these mixes was found to be 0.00214,
0.00278 and 0.00418, respectively. The incorporation of 40 and 60% OPS aggregate in
OPBC concrete showed 23% and 49%, higher strain (ɛ0) values compared to control
OPBC concrete, respectively. Shafigh et al. (2012) reported that the volume of OPS
aggregates in the concrete mixtures significantly affects the peak and rupture strain
values. The ɛ0 for the NWC is normally in the range of 0.0015 to 0.002 (Akbar, 2008).
Results of this study showed that ɛ0 of OPBC concrete is similar to conventional aggregate
Univers
ity of
Mala
ya

107
concrete while incorporation of OPS in OPBC concrete increased the ɛ0 values. The mix
M-60 showed the higher peak stress which may be resulted higher number of cracks
compared to all other concretes, especially, the control OPBC concrete. It was observed
that as the amount of OPS aggregate increases, the number of cracks also increases which
in turn may reduce the brittle nature of the control OPBC concrete. This could be more
advantageous to overcome the shrinkage cracks on the structural component. Balendran,
Zhou, Nadeem, and Leung (2002) reported that compared to NWC, the lightweight
aggregate concrete is more inelastic in nature which causes a sudden failure. This fact
was observed in stress-strain curve of control OPBC concrete. However, OPBC-OPS
concretes showed ductile behaviour. These results indicated that the type of lightweight
aggregate and their properties has significant effect on the stress-strain behaviour of a
concrete.
Figure 5.6: Stress-strain curves for the prepared concrete mixes
The experimental results of the strains (ε0) at the peak stress were also computed from
the compressive strengths by using several prediction models proposed by different
researchers, as can be seen in Figure 5.7. The details of the prediction models for the
strains from peak stress are summarized in Table 5.2.
0
10
20
30
40
50
60
0 0.001 0.002 0.003 0.004 0.005 0.006
Stre
ss (M
Pa)
Strain (ε)
M-0M-40M-60
Univers
ity of
Mala
ya
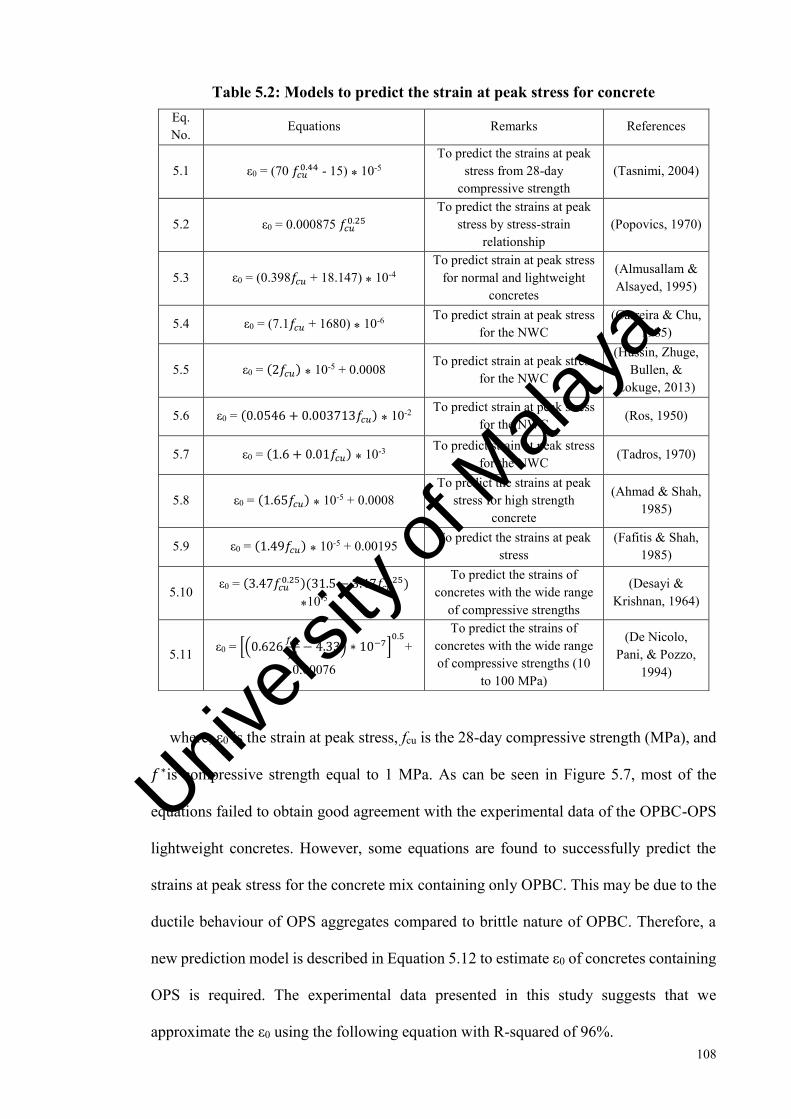
108
Table 5.2: Models to predict the strain at peak stress for concrete Eq. No.
Equations Remarks References
5.1 ε0 = (70 𝑓𝑐𝑢0.44 - 15) ⁎ 10-5
To predict the strains at peak stress from 28-day
compressive strength (Tasnimi, 2004)
5.2 ε0 = 0.000875 𝑓𝑐𝑢0.25
To predict the strains at peak stress by stress-strain
relationship (Popovics, 1970)
5.3 ε0 = (0.398𝑓𝑐𝑢 + 18.147) ⁎ 10-4 To predict strain at peak stress
for normal and lightweight concretes
(Almusallam & Alsayed, 1995)
5.4 ε0 = (7.1𝑓𝑐𝑢 + 1680) ⁎ 10-6 To predict strain at peak stress
for the NWC (Carreira & Chu,
1985)
5.5 ε0 = (2𝑓𝑐𝑢) ⁎ 10-5 + 0.0008 To predict strain at peak stress
for the NWC
(Hussin, Zhuge, Bullen, &
Lokuge, 2013)
5.6 ε0 = (0.0546 + 0.003713𝑓𝑐𝑢) ⁎ 10-2 To predict strain at peak stress
for the NWC (Ros, 1950)
5.7 ε0 = (1.6 + 0.01𝑓𝑐𝑢) ⁎ 10-3 To predict strain at peak stress
for the NWC (Tadros, 1970)
5.8 ε0 = (1.65𝑓𝑐𝑢) ⁎ 10-5 + 0.0008 To predict the strains at peak
stress for high strength concrete
(Ahmad & Shah, 1985)
5.9 ε0 = (1.49𝑓𝑐𝑢) ⁎ 10-5 + 0.00195 To predict the strains at peak
stress (Fafitis & Shah,
1985)
5.10 ε0 = (3.47𝑓𝑐𝑢0.25)(31.5 − 3.47𝑓𝑐𝑢
0.25) ⁎10-5
To predict the strains of concretes with the wide range
of compressive strengths
(Desayi & Krishnan, 1964)
5.11 ε0 = [(0.626𝑓𝑐𝑢
𝑓∗ − 4.33) ∗ 10−7]0.5
+
0.00076
To predict the strains of concretes with the wide range of compressive strengths (10
to 100 MPa)
(De Nicolo, Pani, & Pozzo,
1994)
where, ε0 is the strain at peak stress, fcu is the 28-day compressive strength (MPa), and
𝑓∗is compressive strength equal to 1 MPa. As can be seen in Figure 5.7, most of the
equations failed to obtain good agreement with the experimental data of the OPBC-OPS
lightweight concretes. However, some equations are found to successfully predict the
strains at peak stress for the concrete mix containing only OPBC. This may be due to the
ductile behaviour of OPS aggregates compared to brittle nature of OPBC. Therefore, a
new prediction model is described in Equation 5.12 to estimate ε0 of concretes containing
OPS is required. The experimental data presented in this study suggests that we
approximate the ε0 using the following equation with R-squared of 96%.
Univers
ity of
Mala
ya
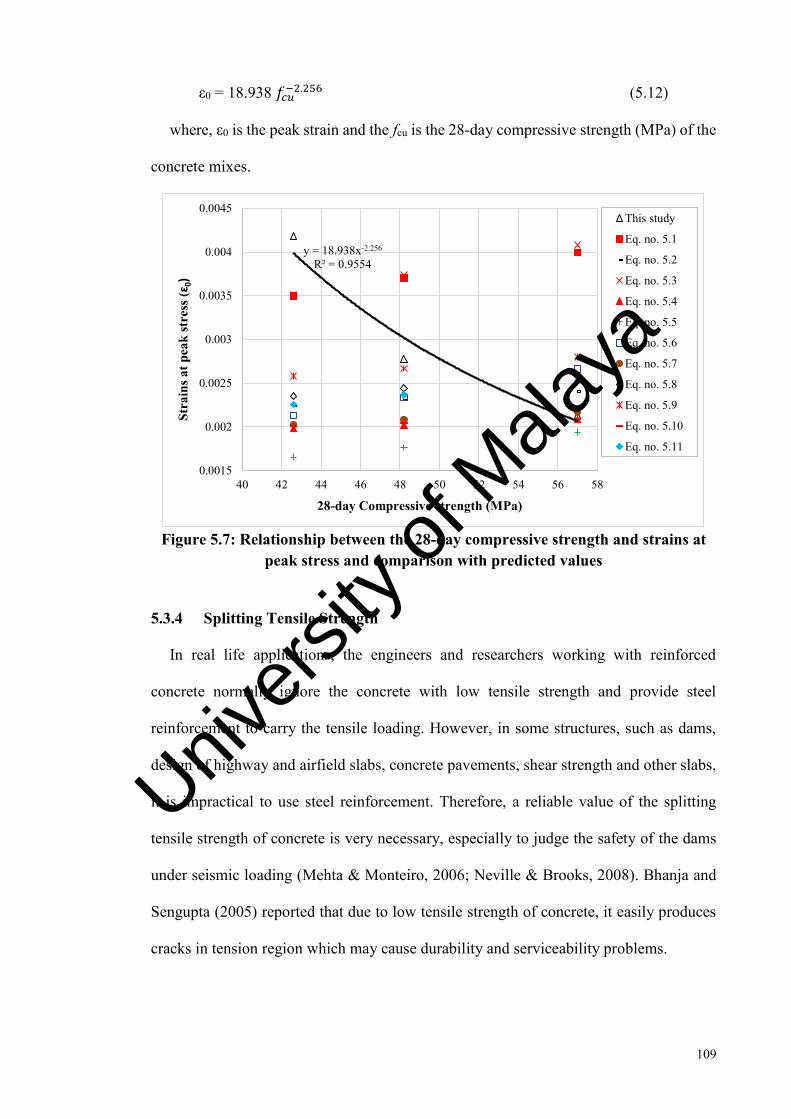
109
ε0 = 18.938 𝑓𝑐𝑢−2.256 (5.12)
where, ε0 is the peak strain and the fcu is the 28-day compressive strength (MPa) of the
concrete mixes.
Figure 5.7: Relationship between the 28-day compressive strength and strains at
peak stress and comparison with predicted values
5.3.4 Splitting Tensile Strength
In real life applications, the engineers and researchers working with reinforced
concrete normally ignore the concrete with low tensile strength and provide steel
reinforcement to carry the tensile loading. However, in some structures, such as dams,
design of highway and airfield slabs, concrete pavements, shear strength and other slabs,
it is impractical to use steel reinforcement. Therefore, a reliable value of the splitting
tensile strength of concrete is very necessary, especially to judge the safety of the dams
under seismic loading (Mehta & Monteiro, 2006; Neville & Brooks, 2008). Bhanja and
Sengupta (2005) reported that due to low tensile strength of concrete, it easily produces
cracks in tension region which may cause durability and serviceability problems.
y = 18.938x-2.256
R² = 0.9554
0.0015
0.002
0.0025
0.003
0.0035
0.004
0.0045
40 42 44 46 48 50 52 54 56 58
Stra
ins a
t pea
k st
ress
(ɛ0)
28-day Compressive strength (MPa)
This study
Eq. no. 5.1
Eq. no. 5.2
Eq. no. 5.3
Eq. no. 5.4
Eq. no. 5.5
Eq. no. 5.6
Eq. no. 5.7
Eq. no. 5.8
Eq. no. 5.9
Eq. no. 5.10
Eq. no. 5.11
Univers
ity of
Mala
ya
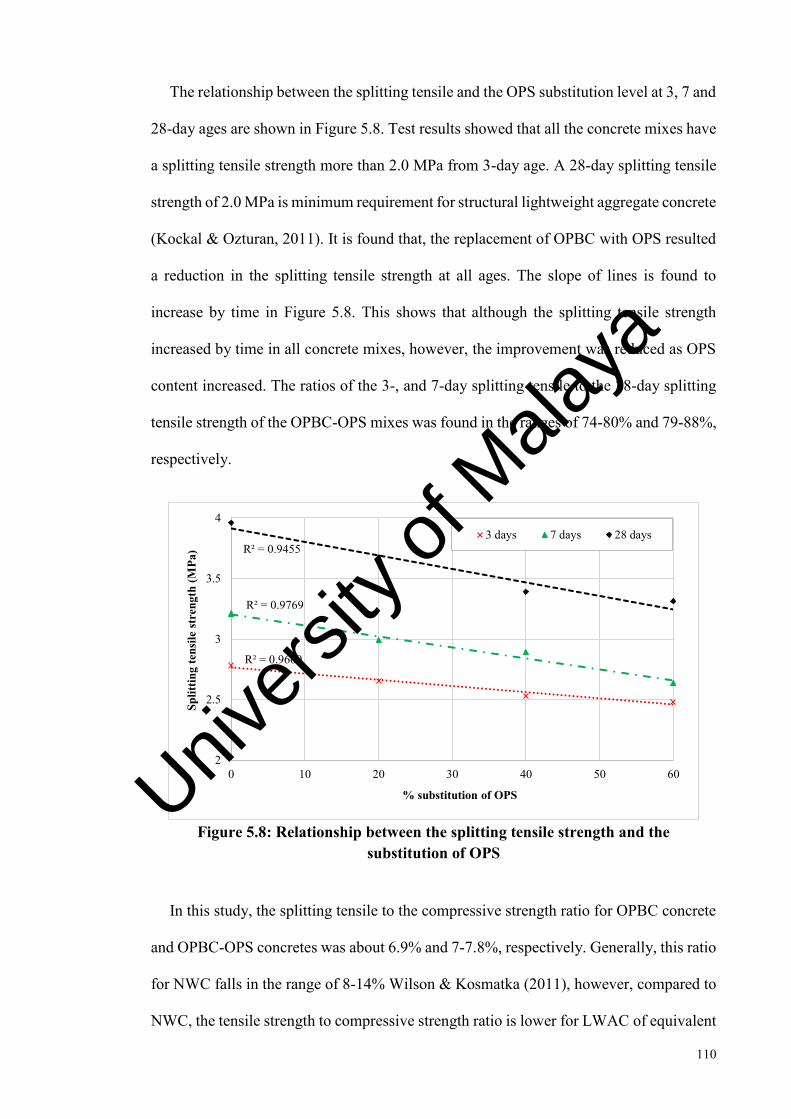
110
The relationship between the splitting tensile and the OPS substitution level at 3, 7 and
28-day ages are shown in Figure 5.8. Test results showed that all the concrete mixes have
a splitting tensile strength more than 2.0 MPa from 3-day age. A 28-day splitting tensile
strength of 2.0 MPa is minimum requirement for structural lightweight aggregate concrete
(Kockal & Ozturan, 2011). It is found that, the replacement of OPBC with OPS resulted
a reduction in the splitting tensile strength at all ages. The slope of lines is found to
increase by time in Figure 5.8. This shows that although the splitting tensile strength
increased by time in all concrete mixes, however, the improvement was reduced as OPS
content increased. The ratios of the 3-, and 7-day splitting tensile to the 28-day splitting
tensile strength of the OPBC-OPS mixes was found in the ranges of 74-80% and 79-88%,
respectively.
Figure 5.8: Relationship between the splitting tensile strength and the
substitution of OPS
In this study, the splitting tensile to the compressive strength ratio for OPBC concrete
and OPBC-OPS concretes was about 6.9% and 7-7.8%, respectively. Generally, this ratio
for NWC falls in the range of 8-14% Wilson & Kosmatka (2011), however, compared to
NWC, the tensile strength to compressive strength ratio is lower for LWAC of equivalent
R² = 0.9669
R² = 0.9769
R² = 0.9455
2
2.5
3
3.5
4
0 10 20 30 40 50 60
Split
ting
tens
ile st
reng
th (M
Pa)
% substitution of OPS
3 days 7 days 28 days
Univers
ity of
Mala
ya

111
grade (Haque et al., 2004). Additionally, it was reported that for high strength LWC, in
continuous moist curing; the splitting tensile strength is generally 6-7% of the
compressive strength (Holm & Bremner, 2000). Reports show that this ratio for OPS
lightweight concrete is 8-10% (Shafigh et al., 2012) and for OPBC concrete is 5.7-8.9%
(Mohammed et al., 2013; 2014).
The experimental results of the splitting tensile strength were also compared with the
predicted results as shown in Figure 5.9. The Eq. (5.13) was proposed by ACI318 (2005)
for NWC with the 28-day cylinder compressive strength range of 21-83 MPa. Whereas,
the Eq. (5.14) was proposed for LWAC containing cold-bonded fly ash with a cubical
compressive strength range of 20-47 MPa (Gesoglu et al., 2004), and Eq. (5.15) was
proposed from CEB-FIP (2010).
ft = 0.59 (fcy) 0.5 (5.13)
ft = 0.27 √𝑓𝑐𝑢23 (5.14)
ft = 0.301 (fcy) 0.67 (5.15)
where, ft is the splitting tensile strength (MPa), fcu and fcy are the cube and cylindrical
compressive strengths (MPa), respectively.
It was observed that the equations (5.14) and (5.15) can predict very close results to
the experimental values with an error of about 6%. While this error was about 15% for
the equation (5.13).
Univers
ity of
Mala
ya

112
Figure 5.9: Experimental and predicted splitting tensile strength of concretes
5.3.5 Flexural Strength
The effect of the flexural strength of all the mixes at 7 and 28-days are shown in Figure
5.10. It can be seen that the contribution of OPS in the OPBC concrete reduced the
flexural strength. Compared to control concrete, the reduction of the 28-day flexural
strength was about 15.3%, 24.5% and 31% at the OPS substitution levels of 20, 40 and
60%, respectively. The flexural strength of the NWC with a 28-day compressive strength
of about 34-55 MPa found in the range of 5-6 MPa (Mehta & Monteiro, 2006), whereas
this range for OPS lightweight concrete was found in the range of 2.1-4.9 MPa
(Alengaram et al., 2008; Okpala, 1990; Teo et al., 2006). With the highest contribution
of OPS in OPBC concrete (mix M-60) the 28-day flexural strength was about 5.3 MPa,
which is still in the acceptable range of the NWC.
The control OPBC concrete showed 26% higher 28-day flexural strength compared to
its 7-day strength. Whereas, this increment in OPBC-OPS mixes was about 20% on
average. On the other hand, the 7-day compressive strength of control OPBC concrete
and OPBC-OPS concretes were about 82% and 86% of the 28-day compressive strength,
y = 0.0664x + 0.1715R² = 0.9293
2
2.5
3
3.5
4
4.5
30 35 40 45 50 55 60
Split
ting
tens
ile st
reng
th (M
Pa)
28-day Compressive strength (MPa)
ft (Exp)
Eq. no. 5.13
Eq. no. 5.14
Eq. no. 5.15
Univers
ity of
Mala
ya

113
respectively. As can be seen in Figure 5.10, the 7-day splitting tensile strength of the
prepared concretes was found in the range of 80-85% of the 28-day splitting tensile
strength. The splitting tensile to flexural strength ratio for the control (M-0) mix is about
51%, whereas, this ratio for OPBC-OPS mixes was found in the range of 56-63%. Shafigh
et al. (2012b) reported that for a wide range of compressive strength of OPS concretes
(up to 53 MPa), the splitting to flexural strength ratio varies in the range of 51 to 72%,
and this ratio is affected by the amount of OPS in the mixture. Therefore, a structural
member made of these lightweight aggregate concretes can be oppressed at an early age
of 7 days.
The flexural to compressive strength ratio for OPBC concrete was about 13%. This
ratio for OPBC-OPS concretes, however, was found in the range of 12-12.5%. While, this
ratio for NWC and high strength lightweight aggregate concrete was found in the ranges
of 11.6-13.5% (Holm & Bremner, 2000) and 9-11% (Mehta & Monteiro, 2006),
respectively. It can therefore be concluded that all the OPBC-OPS concretes had a similar
flexural strength, and flexural to compressive strength ratio to the NWC and high strength
lightweight aggregate concrete.
Figure 5.10: Relationship between the flexural strength and the substitution
of OPS
R² = 0.906
R² = 0.9499
4
4.5
5
5.5
6
6.5
7
7.5
8
0 10 20 30 40 50 60
Flex
ural
stre
ngth
(MPa
)
% substitution of OPS
7-day 28-day
Univers
ity of
Mala
ya

114
The relationship between the experimental and predicted flexural strength results and
the corresponding compressive strengths is shown in Figure 5.11. The experimental test
results were also compared with estimated values from proposed equations. The Eq.
(5.16) was proposed for crushed OPS concrete with cube compressive strength range of
35-53 MPa (Shafigh et al., 2012). CEB-FIP (1977) proposed Eq. (5.17) for expanded
shake and clay LWAC with cube compressive strength range of 20-60 MPa, and Eq.
(5.18) was proposed for the flexural strength of the high strength LWC (Zhang & Gjvorv,
1991).
fr = 0.12fcu1.03 (5.16)
fr = 0.46 √𝑓𝑐𝑢23 (5.17)
fr = 0.73√𝑓𝑐𝑢 (5.18)
where, fr is the flexural strength (MPa), and fcu is the cube compressive strength (MPa)
of the concrete.
It was observed that the equations (5.16) and (5.17) predicted very close results to the
experimental values with the average difference of about 7%. However, the equation
(5.18) showed good correlation between the experimental and predicted values for the
concretes (mixes M-40 and M-60) with the 28-day compressive strength up to 45 MPa,
whereas, for the grade 50 and above concretes (mixes M-20 and M-0) this equation
underestimated the predicted results.
Univers
ity of
Mala
ya

115
Figure 5.11: Experimental and predicted flexural strength results of the
concretes
5.3.6 Modulus of Elasticity
The modulus of elasticity of the M-0, M-20, M-40 and M-60 mixes was 28.2, 23.4,
20.0 and 13.0 GPa, respectively. Similar to the other mechanical properties, the elastic
modulus was also reduced by increasing OPS in OPBC concrete. The reduction of the
modulus of elasticity at 20%, 40% and 60% substitution levels was about 17%, 29% and
54%, respectively.
The volume fraction, density and the modulus of elasticity of the aggregates and the
characterization of the interfacial transition zone plays very important role to determine
the elastic behaviour of the concrete. Among the aggregate characteristics, the porosity
seems to be most important, because it determines the stiffness and also controls the
matrix strains. In general, the modulus of elasticity of LWAC ranges from 10 to 24 GPa,
which is about 50 - 75 % of the elastic modulus of NWC of the same grade (Holm &
Bremner, 2000).
y = 1.5328e0.0279x
R² = 0.9618
3
3.5
4
4.5
5
5.5
6
6.5
7
7.5
8
30 35 40 45 50 55 60
Flex
ural
stre
ngth
(MPa
)
28-day Compressive strength (MPa)
fr (Exp)
Eq. no. 5.16
Eq. no. 5.17
Eq. no. 5.18
Univers
ity of
Mala
ya
116
In this study, the main difference in all the concrete mixes was the type and volume of
coarse aggregates. As the incorporation of OPS aggregate in OPBC concrete increased,
the modulus of elasticity was reduced. This might be due to lower modulus of elasticity
of OPS compared to OPBC as well as weakness in the interfacial transition zone between
OPS and cement matrix due to smooth surface texture of OPS in both concave and convex
surfaces.
Although the modulus of elasticity for 60% substitution (mix M60) is significantly less
than control OPBC concrete, however, it is still in the normal range for LWACs. The low
modulus of elasticity may cause excessive deflection in flexural reinforced concrete
members. However, it may be beneficial for reducing the internal stress concentrations in
concretes and consequently reducing the micro-cracks (Bremner & Holm, 1995).
The modulus of elasticity is related to the compressive strength of concrete. As the
compressive strength increased the modulus of elasticity also increases (CEB/FIP, 1977).
Figure 5.12 illustrates the relationship between the 28-day compressive strength and the
modulus of elasticity of all concrete mixes. A strong linear correlation with R2 of 0.99
was achieved between the 28-day compressive strength and the modulus of elasticity.
Whereas, Figure 5.13 shows the variation of the modulus of elasticity with the
contribution of OPS aggregate in the OPBC concrete. The strong linear correlation with
R2 of 0.98 was achieved. Univers
ity of
Mala
ya

117
Figure 5.12: Relationship between the modulus of elasticity and 28-day
compressive strength
Figure 5.13: Relationship between the modulus of elasticity and contribution of
OPS in OPBC
Several prediction equations were also used to compute the modulus of elasticity of
the prepared concrete mixes, the detailed description of the prediction models and the
predicted E-values are mentioned in Table 5.3 and Table 5.4, respectively.
y = 1.0433x - 31.014R² = 0.9936
10
14
18
22
26
30
34
40 45 50 55 60
Mod
ulus
of E
last
icity
(GPa
)
28-day compressive strength (MPa)
y = -0.245x + 28.5R² = 0.9799
10
15
20
25
30
0 10 20 30 40 50 60
Mod
ulus
of E
last
icity
(GPa
)
Contribution of OPS in OPBCUnivers
ity of
Mala
ya

118
Table 5.3: Models to predict the modulus of elasticity
Eq. No. Equations Remarks References
5.19 E = 0.03w1.5 𝑓𝑐𝑦0.5
To predict the E-value of lightweight pumice concrete with a 28-day cylinder compressive strength of 16-35 MPa and density of about
1460-2185 kg/m3.
(Hossain et al., 2011)
5.20 E = 5𝑓𝑐𝑢0.33(𝑤/2400)2
To predict the E-value of the OPS concrete with 28-day cube compressive strength of 25-
39 MPa and air-dry density of 1640-1890 kg/m3.
(Alengaram et al., 2011)
5.21 E = 2.168𝑓𝑐𝑦0.535
To predict E-value for artificial LWA concretes with a cylindrical compressive
strength of about 15-55 MPa. (Tasnimi, 2004)
5.22 E = 9.1(𝑤/2400)2𝑓𝑐𝑢2
To predict the modulus of elasticity of LWACs.
(Short, 1978)
5.23 E = 0.0017w2 𝑓𝑐𝑢0.33 To predict the E value of the concretes. (BS-8110, 1986)
5.24 E = (0.062+0.0297𝑓𝑐𝑦
0.5) w1.5
To predict the E-value of high strength lightweight concrete.
(Slate et al., 1986)
where, E is the modulus of elasticity (GPa), w is the dry density (kg/m3), fcy and fcu are the cylinder and cube compressive strengths (MPa).
Table 5.4: Measured and predicted modulus of elasticity
Mix code
28-day compressive
strength (MPa)
Dry density (kg/m3)
Measured modulus of elasticity
(GPa)
Estimated modulus of elasticity (GPa)
Eq. (5.19)
Eq. (5.20)
Eq. (5.21)
Eq. (5.22)
Eq. (5.23)
Eq. (5.24)
M-0 57 2050 28.2 18.8 13.9 16.7 21.6 27.2 18.6 M-20 52.2 1993 23.4 17.3 12.7 15.9 17.0 24.9 17.0 M-40 48.2 1938 20.0 15.9 11.7 15.3 13.8 22.9 15.7 M-60 42.6 1856 13.0 14.0 10.3 14.3 9.9 20.2 13.8
5.3.7 Water Absorption
Water absorption is an essential factor which is primarily related to the porosity and
the durability of the concrete. The effect of the replacement of OPBC with OPS aggregate
on moderate (24 hours) and final (72 hours) water absorption of the mixes was measured
at the age of 56 days, as shown in Figure 5.14. It was observed that the water absorption
of the mixes containing OPS aggregates was higher than that of the control OPBC
concrete. It was consistently increased when the amount of OPS aggregate in the mixture
was increased. This was mainly due to the high-water absorption of the OPS aggregates,
as can be seen in Table 4.1. It was reported by Topcu and Uygunoglu (2010) that the
Univers
ity of
Mala
ya

119
replacement of conventional aggregates with natural LWAs, such as tuff, diatomite and
pumice increased water absorption of the concrete. Teo et al. (2007) reported that
regardless the type of curing, the water absorption of OPS concrete is more than 10%.
Neville (2008) reported that although concrete quality cannot be predicted by water
absorption, however, good concretes generally have a rate of absorption less than 10% by
mass. On the other hand, Kosmatka et al. (2002) stated that the concrete with high quality
usually has water absorption less than 5%. In this study, it was observed that although the
incorporation of OPS in OPBC concrete increased the absorption of the concretes, the
highest contribution of OPS showed the overall absorption less than 10%. However,
based on Figure 5.14, the final water absorption of OPBC-OPS concrete would be less
than 5% if OPS contribution in OPBC concrete is less than 40%.
Figure 5.14: Relationship between water absorption and the OPS content
5.4 Conclusions
In this study, a semi-lightweight aggregate concrete was made of coarse oil-palm-
boiler clinker (OPBC) was partially substituted with coarse oil palm shell (OPS)
aggregate to investigate possibility of producing OPBC high-strength lightweight
concrete. The effectiveness of this substitution on density, mechanical properties and
R² = 0.9008
R² = 0.9764
0
1
2
3
4
5
6
7
0 10 20 30 40 50 60 70
Wat
er a
bsor
ptio
n (%
)
OPS content (%)
24 h water absorption 72 h water absorption
Univers
ity of
Mala
ya

120
water absorption of the concretes was investigated. Based on the test results, the following
conclusions can be drawn:
1. The density of concrete is found to decrease with the substitution of the OPBC
with OPS. The substitution between 20 to 40 % could turn high-strength semi-
lightweight OPBC concrete into high-strength lightweight concrete.
2. All concretes containing OPBC and OPS lightweight aggregates showed lower
compressive strength under air drying. However, six days moist curing after
demoulding is enough to achieve equivalent compressive strength under full water
curing.
3. Contribution of OPS in OPBC concrete up to 60% could significantly increase the
strain at the peak stress (ε0) of the concrete mixes. This shows that OPS
lightweight aggregate can improve ductility performance of lightweight aggregate
concretes.
4. Although, OPBC concretes containing OPS had lower tensile strengths compared
to OPBC concrete, the splitting tensile strength was found to be in the usual range
for structural lightweight aggregate concrete. Moreover, the OPBC-OPS
concretes showed flexural strength and flexural/compressive strength ratio similar
to NWC and high strength lightweight aggregate concretes.
5. The modulus of elasticity of the OPBC concrete was reduced by the incorporation
of the OPS aggregates. The reduction of the modulus of elasticity at high volume
substitution of 60% was found to be very significant.
6. Water absorption of the OPBC concrete increased linearly by increasing OPS
content in this concrete. This occurs due to higher water absorption of OPS
compared to OPBC. The results of the current study suggest that the substitution
level should be limited to 20-40% (by volume).
Univers
ity of
Mala
ya
121
DRYING SHRINKAGE BEHAVIOUR OF STRUCTURAL
LIGHTWEIGHT AGGREGATE CONCRETE CONTAINING BLENDED OIL-
PALM BIO-PRODUCTS
6.1 Introduction
The increase in shrinkage increases proportionally with the age of concrete. It shrinks
when it is exposed to a drying environment which causes an increase in tensile stress
leading to cracking and external deflection, before the concrete is subjected to loading
(Day, 2003). The shrinkage of a concrete is influenced by the amount of mixing, time
after addition of water, temperature fluctuation, placement, and curing (McKeen &
Ledbetter, 1969). The higher the amount of water present in the fresh concrete the highly
drying shrinkage will be affected (Day, 2003). The makeup of concrete is very important
because each ingredient have distinctive characteristics which contribute to the shrinkage
of concrete. Drying shrinkage can occur in beams, slabs, columns, foundations and causes
stress loss in prestressed members and failure of joints (Shafigh, Alengaram, et al., 2013).
In the case of lightweight aggregate concrete (LWAC), the drying shrinkage is greater
than conventional concrete and is mostly affected by the properties and the amount of
aggregates (Satish & Berntsson, 2003). The fact is that the shrinkage of concrete is
essentially governed by the cement paste due to its contraction. Because the water inside
C-S-H is removed in the drying condition. Wongkeo, Thongsanitgarn, and Chaipanich
(2012) reported that when small capillary pores (pores less than 50 nm) losses the water,
it significantly affects the change in volume of concrete. The degree of hydration or
change in volume of concrete affects the drying shrinkage strain of concrete (Basma &
Jawad, 1995). One of the main source to oppose this contraction is by the addition of the
aggregates to restrain the shrinkage of Portland cement paste to a point that the concrete
becomes a practical material (CEB/FIP, 1977). Since structural LWAC is modified at
Univers
ity of
Mala
ya

122
these two factors, it is expected that its behaviour differs from that observed in normal
weight concrete (NWC). Firstly, the use of less rigid porous aggregates decreases the
restriction effect on paste deformation (Zhang, Li, & Paramasivam, 2005). Secondly,
either for strength purposes or for reasons of workability and stability of the mixtures,
lightweight concrete (LWC) is usually characterized by larger volumes of better quality
paste and lower volume of coarse aggregates (Bogas, 2011; Holm & Bremner, 2000).
Therefore, the long-term shrinkage of lightweight concrete should be higher than that of
NWC of the same grade. On the other hand, it should be noted that water absorbed by
lightweight aggregate (LWA) is released later into the paste due to internal curing, which
compensates for the initial water lost by drying and self-desiccation. Because of the
internal curing and the continued hydration of the paste, the deformation resistance of the
matrix is higher and therefore less water is available for evaporation (Selih & Bremner,
1996). The combination of all these affecting factors together with different variability of
lightweight aggregates, the higher shrinkage in LWAC compared to NWC was reported
(Coquillat, 1986; Hossain & Lachemi, 2007; Shafigh, Ghafari, Mahmud, & Jumaat,
2014). However, some reports showed that shrinkage in LWAC is less than or similar to
shrinkage of NWC (Shafigh, Ghafari, et al., 2014; Wegen & Bijen, 1985). For general
design work, it was suggested that the shrinkage of LWAC is between 1.4 and 2 times
that of NWC (Clarke, 2002). The drying shrinkage values for structural lightweight
concrete may vary between 0.04% and 0.15% (Lamond, 2006).
Since last two decades, oil palm shell (OPS) or palm kernel shell (PKS) has been used
as a LWA for producing structural LWAC with a density of 20-25% lower than NWC
(Shafigh et al., 2012). There is a little information in the literature concerning the
shrinkage of OPS concrete. The drying shrinkage of OPS concrete was first investigated
by Abdullah (1996), who reported that OPS concrete showed about 5 times higher drying
shrinkage than the NWC. Mannan and Ganapathy (2002) investigated the drying
Univers
ity of
Mala
ya

123
shrinkage of OPS concrete and NWC up to 90 days age. They reported that the drying
shrinkage of both the concretes was increased with age but OPS concrete showed higher
increment. The OPS concrete showed 14% higher drying shrinkage compared to NWC at
the age of 90 days. Alengaram (2009) measured the drying shrinkage of several types of
OPS lightweight concrete without any initial moist curing. The specimens were exposed
to laboratory environment immediately after demoulding with average humidity of 75%
and temperature of 30 oC. The cement content, total binder content (cement + fly ash +
silica fume), water to binder ratio and 28-day compressive strength varied between 500
and 560 kg/m3, 560-595 kg/m3, 0.30-0.35 and 22-38 MPa, respectively. He reported that
drying shrinkage of OPS concrete at 28, 56 and 90 days is in the range of 160-520, 300-
990 and 540-1300 micro-strain, respectively. He reported that structural lightweight OPS
concrete has high drying shrinkage due to high cement and OPS (as coarse aggregate)
contents.
The drying shrinkage of OPS concretes with the substitution of fly ash with cement
and normal sand with oil-palm-boiler clinker (OPBC) sand was studied by (Shafigh,
Alengaram, et al., 2013; Shafigh, Mahmud, et al., 2014). They reported that the use of
10% fly ash in OPS high strength concrete did not affect the drying shrinkage of the
concrete. However, generally, for higher percentage replacement levels of 30% and 50%,
the drying shrinkage increased but was not significant. The substitution of normal sand
with OPBC sand in OPS concrete does not influence the drying shrinkage (Shafigh et al.,
2014b). However, they further conducted a comparative study of OPS and expanded clay
lightweight concretes (Shafigh et al., 2014). The investigations showed that, although the
OPS concrete had a better engineering properties and greater efficiency factor
(compressive strength to density ratio) but it showed twice the amount of drying shrinkage
at early ages. However, this ratio reduces significantly at later ages. Recently, Mo et al.
(2016) investigated the durability properties of a sustainable concrete by using OPS as
Univers
ity of
Mala
ya

124
coarse and manufactured sand as fine aggregates. The GGBFS was used as partial cement
replacement at 20, 40 and 60% levels in the OPS concrete. They reported the drying
shrinkage values of about 740-760 micro-strain at GGBFS replacement levels of 20% and
40%, it was closer to that of the control OPS concrete. However, the substitution of 60%
GGBFS increased the shrinkage values by about 20% compared to control OPS concrete.
Previous studies (Mannan et al., 2006; Teo et al., 2007) revealed that OPS concrete
has good mechanical properties and durability performance. However, this concrete has
some drawbacks which needs to be solved before it is used in practice. One of the
drawbacks is its high drying shrinkage compared to artificial lightweight concretes and
also normal weight concrete. The main objective of this study is to resolve the high drying
shrinkage problem of OPS concrete. Shafigh et al. (2013) reported that the main reason
for high drying shrinkage of OPS concrete is due to high cement content and OPS (as
coarse) contents. Therefore, it seems that one way to reduce the drying shrinkage of this
concrete is to reduce the volume of coarse OPS in concrete mixture. For this purpose, oil-
palm-boiler clinker (OPBC) as lightweight aggregate was selected to be used as partially
replacement with OPS. The reason for choosing the incorporation of OPBC aggregates
in OPS concrete is that OPBC is a solid waste and lightweight material produced from
burning of solid wastes in the boiler combustion process in palm oil mills. It is like a
porous stone, grey in colour, flaky and irregular in shape (Ahmad et al., 2007). Previous
studies (Abdullahi et al., 2008; Chan & Robani, 2008; Zakaria, 1986) have shown that
OPBC can be used as coarse lightweight aggregate in concrete. The density and the 28-
day compressive strength of OPBC concrete fulfil the requirements of structural LWAC.
Therefore, in this study, two types of waste originated from the palm oil industry, namely
OPS and OPBC, were used as coarse aggregates. The optimum substitution level of
OPBC in OPS concrete to reduce drying shrinkage of OPS concrete was identified.
Univers
ity of
Mala
ya

125
6.2 Experimental Program
6.2.1 Materials Used
Ordinary Portland cement (OPC), having 3-, 7- and 28-day compressive strength of
26, 36 and 48 MPa, respectively was used as binder conforming to MS522, part-1:2003.
The specific gravity and Blaine specific surface area of the cement were 3.14 and 3510
cm2/g, respectively. A Sika Viscocrete containing total chloride ion content of ≤0.1 and
compatible with all type of cements according to BS-5075 was used as super-plasticizer
(SP). The local mining sand with a fineness modulus of 2.89, specific gravity of 2.68 and
maximum grain size of 4.75 mm was used as fine aggregate. The OPS and OPBC were
collected from a local palm oil mill. They were used as coarse aggregate. The OPS
aggregates were placed in open air for 6 months to remove fibres from the surface and
then washed (Shafigh, Jumaat, & Mahmud, 2011). While the OPBC aggregates were
crushed using a crushing machine. After washing and crushing, both aggregates were
sieved to get the same grading of the aggregates (Figure 6.1). The physical and
mechanical properties of aggregates are shown in Table 6.1. From Table 6.1, it can be
seen that OPBC has higher density and lower water absorption compared to OPS.
However, crushing, impact and abrasion values of the coarse aggregates show that OPBC
is weaker in strength compared to OPS. As can be seen in Figure 6.2, an OPBC grain is
round in shape and has many porosities on the surface while OPS is flaky and elongated
with no porosity on the surface.
Table 6.1: Physical and mechanical properties of aggregates
Physical and mechanical properties Coarse aggregate Fine aggregate
OPS OPBC Normal Sand Specific gravity 1.19 1.69 2.68
Compacted bulk density (kg/m3) 610 860 1657 24 h water absorption (%) 20.5 7.0 1.2
Crushing value (%) 0.2 21.2 - Impact value (%) 5.5 36.3 -
Abrasion value (%) 5.7 23.9 -
Univers
ity of
Mala
ya
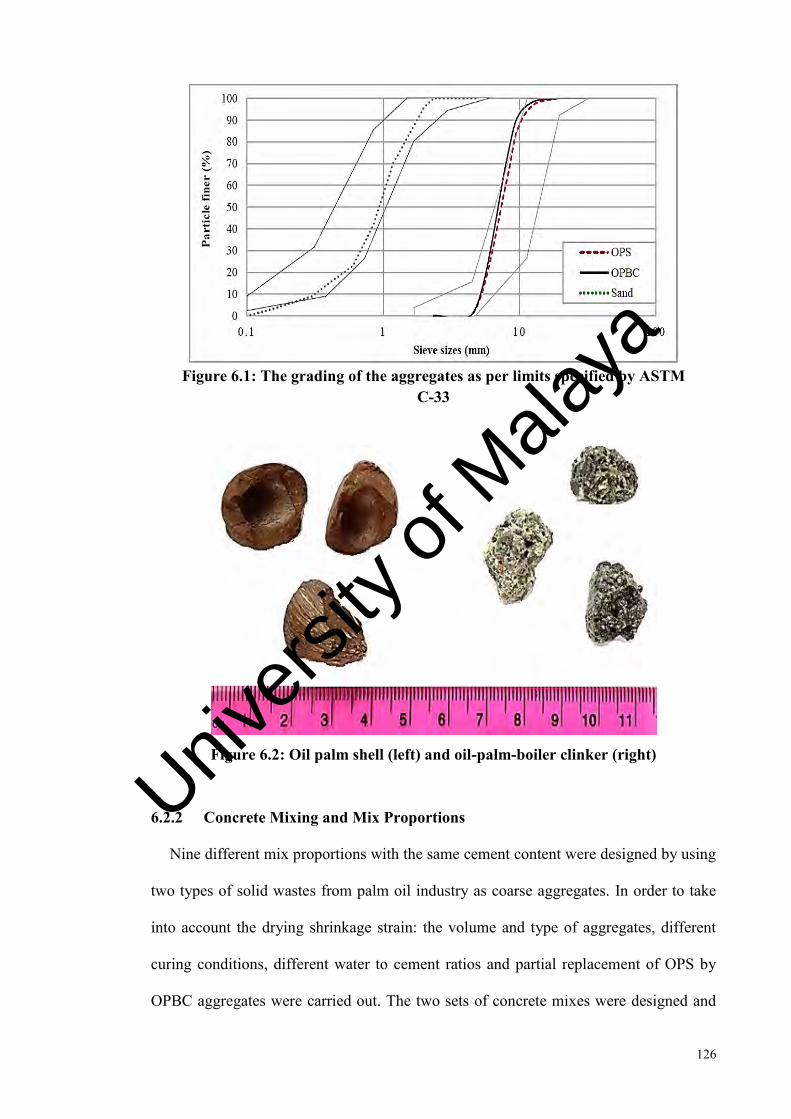
126
Figure 6.1: The grading of the aggregates as per limits specified by ASTM
C-33
Figure 6.2: Oil palm shell (left) and oil-palm-boiler clinker (right)
6.2.2 Concrete Mixing and Mix Proportions
Nine different mix proportions with the same cement content were designed by using
two types of solid wastes from palm oil industry as coarse aggregates. In order to take
into account the drying shrinkage strain: the volume and type of aggregates, different
curing conditions, different water to cement ratios and partial replacement of OPS by
OPBC aggregates were carried out. The two sets of concrete mixes were designed and
Univers
ity of
Mala
ya
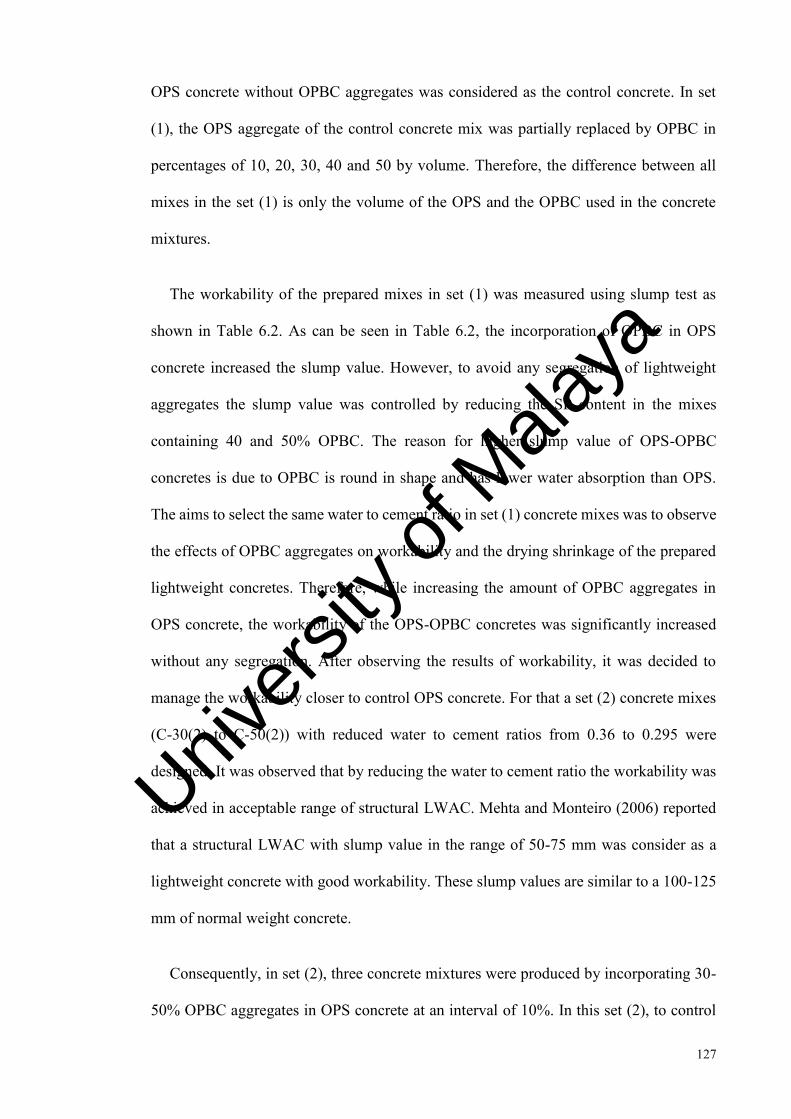
127
OPS concrete without OPBC aggregates was considered as the control concrete. In set
(1), the OPS aggregate of the control concrete mix was partially replaced by OPBC in
percentages of 10, 20, 30, 40 and 50 by volume. Therefore, the difference between all
mixes in the set (1) is only the volume of the OPS and the OPBC used in the concrete
mixtures.
The workability of the prepared mixes in set (1) was measured using slump test as
shown in Table 6.2. As can be seen in Table 6.2, the incorporation of OPBC in OPS
concrete increased the slump value. However, to avoid any segregation of lightweight
aggregates the slump value was controlled by reducing the SP content in the mixes
containing 40 and 50% OPBC. The reason for higher slump value of OPS-OPBC
concretes is due to OPBC is round in shape and has lower water absorption than OPS.
The aims to select the same water to cement ratio in set (1) concrete mixes was to observe
the effects of OPBC aggregates on workability and the drying shrinkage of the prepared
lightweight concretes. Therefore, while increasing the amount of OPBC aggregates in
OPS concrete, the workability of the OPS-OPBC concretes was significantly increased
without any segregation. After observing the results of workability, it was decided to
manage the workability closer to control OPS concrete. For that a set (2) concrete mixes
(C-30(2) to C-50(2)) with reduced water to cement ratios from 0.36 to 0.295 were
designed. It was observed that by reducing the water to cement ratio the workability was
achieved in acceptable range of structural LWAC. Mehta and Monteiro (2006) reported
that a structural LWAC with slump value in the range of 50-75 mm was consider as a
lightweight concrete with good workability. These slump values are similar to a 100-125
mm of normal weight concrete.
Consequently, in set (2), three concrete mixtures were produced by incorporating 30-
50% OPBC aggregates in OPS concrete at an interval of 10%. In this set (2), to control
Univers
ity of
Mala
ya
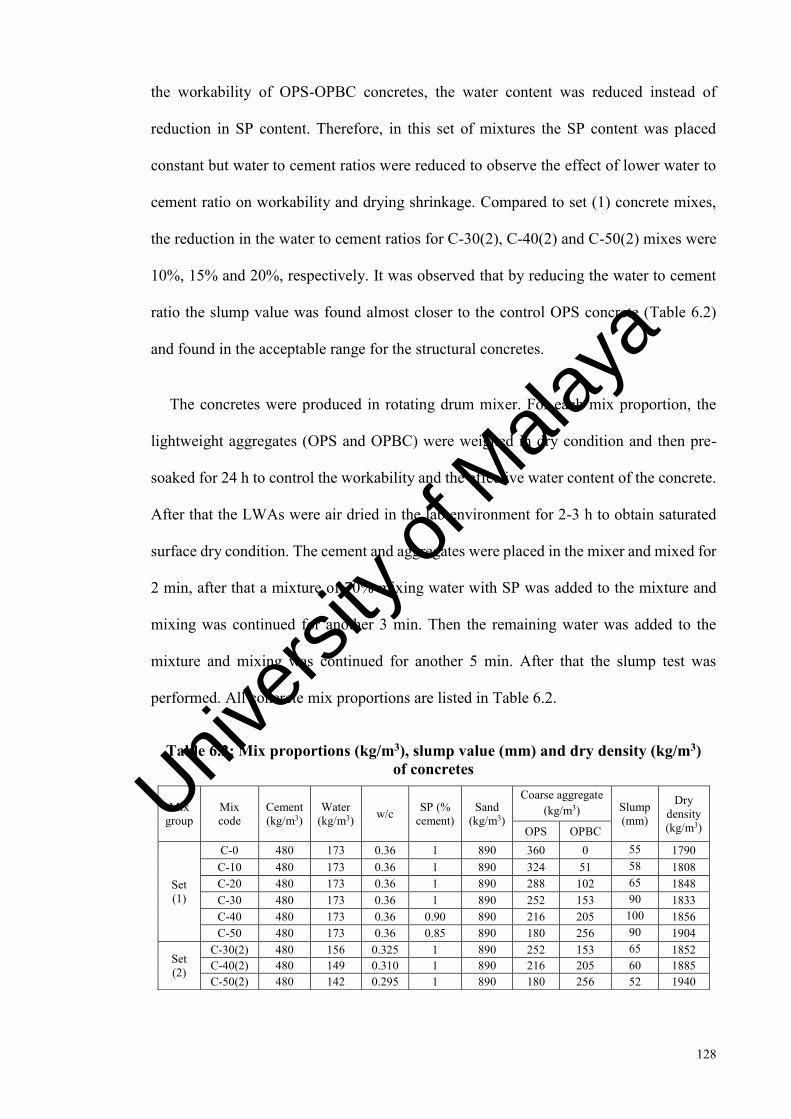
128
the workability of OPS-OPBC concretes, the water content was reduced instead of
reduction in SP content. Therefore, in this set of mixtures the SP content was placed
constant but water to cement ratios were reduced to observe the effect of lower water to
cement ratio on workability and drying shrinkage. Compared to set (1) concrete mixes,
the reduction in the water to cement ratios for C-30(2), C-40(2) and C-50(2) mixes were
10%, 15% and 20%, respectively. It was observed that by reducing the water to cement
ratio the slump value was found almost closer to the control OPS concrete (Table 6.2)
and found in the acceptable range for the structural concretes.
The concretes were produced in rotating drum mixer. For each mix proportion, the
lightweight aggregates (OPS and OPBC) were weighed in dry condition and then pre-
soaked for 24 h to control the workability and the effective water content of the concrete.
After that the LWAs were air dried in the lab environment for 2-3 h to obtain saturated
surface dry condition. The cement and aggregates were placed in the mixer and mixed for
2 min, after that a mixture of 70% mixing water with SP was added to the mixture and
mixing was continued for another 3 min. Then the remaining water was added to the
mixture and mixing was continued for another 5 min. After that the slump test was
performed. All concrete mix proportions are listed in Table 6.2.
Table 6.2: Mix proportions (kg/m3), slump value (mm) and dry density (kg/m3) of concretes
Mix group
Mix code
Cement (kg/m3)
Water (kg/m3) w/c SP (%
cement) Sand
(kg/m3)
Coarse aggregate (kg/m3) Slump
(mm)
Dry density (kg/m3) OPS OPBC
Set (1)
C-0 480 173 0.36 1 890 360 0 55 1790 C-10 480 173 0.36 1 890 324 51 58 1808 C-20 480 173 0.36 1 890 288 102 65 1848 C-30 480 173 0.36 1 890 252 153 90 1833 C-40 480 173 0.36 0.90 890 216 205 100 1856 C-50 480 173 0.36 0.85 890 180 256 90 1904
Set (2)
C-30(2) 480 156 0.325 1 890 252 153 65 1852 C-40(2) 480 149 0.310 1 890 216 205 60 1885 C-50(2) 480 142 0.295 1 890 180 256 52 1940
Univers
ity of
Mala
ya
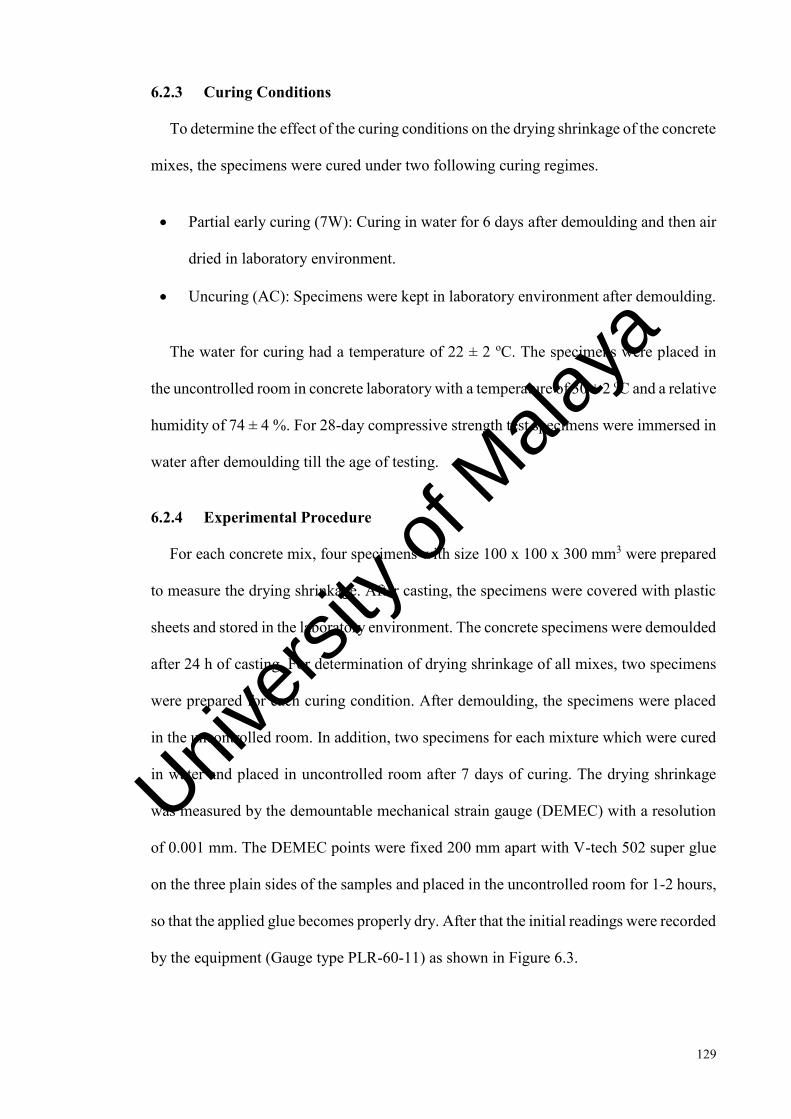
129
6.2.3 Curing Conditions
To determine the effect of the curing conditions on the drying shrinkage of the concrete
mixes, the specimens were cured under two following curing regimes.
• Partial early curing (7W): Curing in water for 6 days after demoulding and then air
dried in laboratory environment.
• Uncuring (AC): Specimens were kept in laboratory environment after demoulding.
The water for curing had a temperature of 22 ± 2 oC. The specimens were placed in
the uncontrolled room in concrete laboratory with a temperature of 30 ± 2 oC and a relative
humidity of 74 ± 4 %. For 28-day compressive strength test specimens were immersed in
water after demoulding till the age of testing.
6.2.4 Experimental Procedure
For each concrete mix, four specimens with size 100 x 100 x 300 mm3 were prepared
to measure the drying shrinkage. After casting, the specimens were covered with plastic
sheets and stored in the laboratory environment. The concrete specimens were demoulded
after 24 h of casting. For determination of drying shrinkage of all mixes, two specimens
were prepared for each curing condition. After demoulding, the specimens were placed
in the uncontrolled room. In addition, two specimens for each mixture which were cured
in water and placed in uncontrolled room after 7 days of curing. The drying shrinkage
was measured by the demountable mechanical strain gauge (DEMEC) with a resolution
of 0.001 mm. The DEMEC points were fixed 200 mm apart with V-tech 502 super glue
on the three plain sides of the samples and placed in the uncontrolled room for 1-2 hours,
so that the applied glue becomes properly dry. After that the initial readings were recorded
by the equipment (Gauge type PLR-60-11) as shown in Figure 6.3.
Univers
ity of
Mala
ya

130
The 28-day compressive strength of all the concretes was selected as average of three
cube specimens with 100 mm3 dimensions. However, the values of the drying shrinkage
was obtained using the average measurements of six values for each type of concrete. The
average values for test results were selected from the specimens which gave the reliability
of about 95±4%.
Figure 6.3: The image of the measurement of drying shrinkage
6.3 Results and Discussion
6.3.1 Compressive Strength
The 28-day compressive strength of all prepared lightweight concretes is shown in
Figure 6.4. It was observed that the control OPS concrete (C-0) showed the 28-day
compressive strength of about 36 MPa, which falls in the category of normal strength
lightweight concrete. As can be seen in the Figure 6.4, the substitution of 10% OPBC
aggregates in OPS concrete the compressive strength slightly increased. However, a
significant improvement in the compressive strength of OPS concrete was observed when
the substitution level of OPBC aggregates was more than 10%. Reduction on the water
used in the OPS concrete mixes containing 30 to 50% OPBC further improved the
Univers
ity of
Mala
ya

131
compressive strength of the concretes. The increment in the compressive strength of these
concretes (C-30(2) to C-50(2)) was about 20-30%. All these concretes could be
considered as high strength lightweight concrete. The highest 28-day compressive
strength of 52 MPa was achieved by C-50(2) mixture at 20% lower w/c ratio compared
to the mix C-50. This concrete had an oven dry density of about 1940 kg/m3 which shows
that it is around 17% lighter than conventional concrete. The strength grade of this
concrete is similar to the 28-day compressive strength of OPS lightweight concrete made
with an oven dry density of 1920 kg/m3 (Shafigh, Mahmud, et al., 2012).
The main reason for the improvement in the compressive strength of OPS-OPBC
mixes is that the OPS aggregates are flaky in shape and have smooth surface texture on
both concave and convex faces than OPBC aggregate. Due to that the interfacial bond
between the aggregates and the cement was very weak and causes a concrete failure under
smaller loads (Aslam, Shafigh, Jumaat, et al., 2016). Therefore, the most of the grades of
the OPS concrete were within the normal range of lightweight concrete. It was reported
by Wilson and Malhotra (1988) that the compressive strength of structural lightweight
concrete is directly relevant to the strength of the LWA and the hardened cement paste,
as well as the bonding of the aggregate and cement paste in the interfacial zone. However,
as can be seen Figure 6.2, the OPBC has more porosity with some holes on the surface.
Therefore, compared to smooth textured surface of OPS aggregate there is better interlock
between the OPBC aggregates and the cement paste which caused significant
improvement on compressive strength of concrete. Univ
ersity
of M
alaya

132
Figure 6.4: 28-day compressive strength of concrete mixes
6.3.2 Specific Strength
Normal weight concrete has low specific strength (compressive strength to density
ratio, the 28-day cube compressive strength was used for the computation of the specific
strength) compared to steel, which results some economic disadvantages, when being
used in multi-story buildings and bridges. However, its efficiency ratio can be improved
either by increasing its compressive strength or reducing its density (Aslam et al., 2015).
The best alternative to resolve this issue is the use of high strength lightweight concrete.
Structural LWAC showed significantly higher specific strength than NWC of the same
grade (Mehta & Monteiro, 2006). Moravia, Gumieri, and Vasconcelos (2010)
investigated the specific strength and modulus of elasticity of the structural LWAC made
of expanded clay aggregate and reported that even though this LWC has a lower
compressive strength than NWC, but it has significantly higher specific strength. Figure
6.5 shows the specific strengths of all the concrete mixes. It can be seen that although the
contribution of the OPBC aggregates in the OPS concrete increased the dry density of the
OPS concrete in the range of 1-8%, however, in most cases, the specific strength of OPS
concretes containing OPBC is significantly higher than concrete containing only OPS
30
40
50
60
C-0 C-10 C-20 C-30 C-40 C-50 C-30(2) C-40(2) C-50(2)
28-d
ay C
ompr
essiv
e st
reng
th (M
Pa)
Mix codes
Univers
ity of
Mala
ya
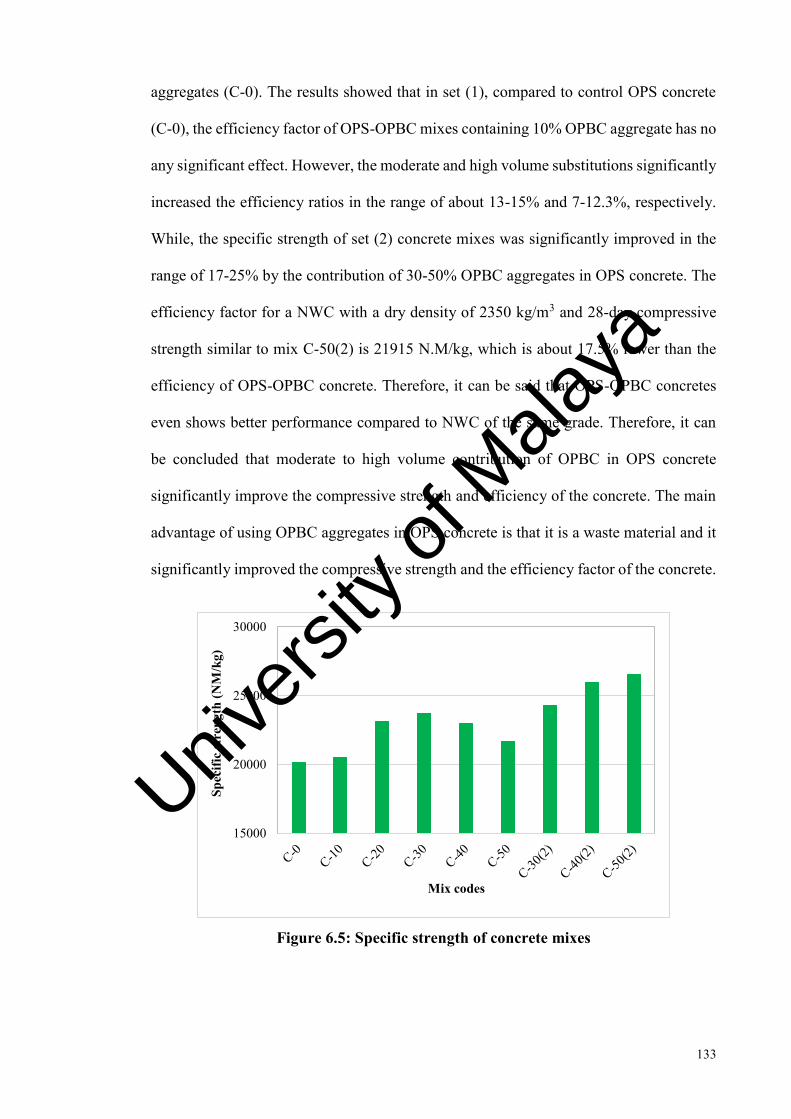
133
aggregates (C-0). The results showed that in set (1), compared to control OPS concrete
(C-0), the efficiency factor of OPS-OPBC mixes containing 10% OPBC aggregate has no
any significant effect. However, the moderate and high volume substitutions significantly
increased the efficiency ratios in the range of about 13-15% and 7-12.3%, respectively.
While, the specific strength of set (2) concrete mixes was significantly improved in the
range of 17-25% by the contribution of 30-50% OPBC aggregates in OPS concrete. The
efficiency factor for a NWC with a dry density of 2350 kg/m3 and 28-day compressive
strength similar to mix C-50(2) is 21915 N.M/kg, which is about 17.5% lower than the
efficiency of OPS-OPBC concrete. Therefore, it can be said that OPS-OPBC concretes
even shows better performance compared to NWC of the same grade. Therefore, it can
be concluded that moderate to high volume contribution of OPBC in OPS concrete
significantly improve the compressive strength and efficiency of the concrete. The main
advantage of using OPBC aggregates in OPS concrete is that it is a waste material and it
significantly improved the compressive strength and the efficiency factor of the concrete.
Figure 6.5: Specific strength of concrete mixes
15000
20000
25000
30000
Spec
ific
stre
ngth
(NM
/kg)
Mix codes
Univers
ity of
Mala
ya
134
6.3.3 Drying Shrinkage Development
The shrinkage of normal to moderate strength LWC is not usually critical when it is
used for fill or insulation purposes, however, in structural use, shrinkage must be
considered and is possibly deleterious when it is restrained (Kosmatka et al., 2002).
Previous studies (Neville, 2008; Satish & Berntsson, 2003) reported that the drying
shrinkage of LWC is greater than NWC and is mostly affected by properties and the
quantity of aggregates. In this study, the effect of partially replacement of OPS with
OPBC on drying shrinkage of concrete in two sets of concretes was investigated. In the
first set of concretes, the pure effect of this substitution was studied. While, in the second
set the effect of OPBC contribution as well as reduction of water to cement ratio were
investigated together.
6.3.3.1 Drying shrinkage of uncured specimens
The development of drying shrinkage of uncured concrete specimens of mixes
illustrated in Figure 6.6 and Figure 6.7. The drying shrinkage of the control OPS
lightweight concrete at the age of 234 days was relatively high as 564 micro-strain.
Normally, the drying shrinkages of normal concrete are reported to be in the range of 200-
800 micro-strain (Zia, Shuaib, & Leming, 1997), while the oil palm kernel shell concrete
showed five times the shrinkage value of NWC (Abdullah, 1996). As can be seen in the
Figure 6.6, the drying shrinkage of OPS-OPBC concretes is similar to the OPS concrete
at early ages. The increasing rate of drying shrinkage of all the mixes was very sharp in
the first 28-days. However, the shrinkage value after 56 days was almost constant for all
mixes. The mixes C-0 and C-10 showed the same trend of the drying shrinkage up to 3
months, after that the gradually reduction in shrinkage was observed for mix C-10. The
mixes of C-20, C-30, C-40 and C-50 showed almost similar trend of the shrinkage from
28-234 days and the shrinkage values observed for these mixes were very close. The mix
(C-0) showed similar shrinkage results to all OPS-OPBC mixes in early ages up to 1
Univers
ity of
Mala
ya

135
month. Although, the similar results were achieved by low (10%) contribution of OPBC
up to 3 months. However, at later ages (around 9 months) the OPS concrete on average
showed 10% higher shrinkage values compared to OPS-OPBC mixes.
Figure 6.6: Development of drying shrinkage of set (1) concrete mixes
Figure 6.7 shows the results of the drying shrinkage of the set (2) concrete mixes.
Compared to set (1) concrete mixes the reduction of w/c ratio for mixes of C-30(2), C-
40(2) and C-50(2) was about 10%, 15% and 20%, respectively. As can be seen in Figure
6.7, the drying shrinkage of OPS-OPBC concretes is very similar to the OPS concrete in
the first week, but at the later ages a significant reduction in the drying shrinkage was
observed in the set (2) concrete mixes. All the three mixes with lower water to cement
ratio showed the increasing trend of shrinkage up to 70 days but at later ages the drying
shrinkage was almost constant for all mixes. All OPS-OPBC mixes from set (2) showed
almost similar results in early ages (28 days) and these values were on average 37% lower
than control OPS concrete at the same age. However, at later ages, the mixes C-30(2) and
C-40(2) showed lower shrinkage values of about 27% and 35%, respectively compared
0
100
200
300
400
500
600
0 50 100 150 200 250
Dry
ing
shri
nkag
e (m
icro
stra
in)
Age (days)
C-0 C-10
C-20 C-30
C-40 C-50
Univers
ity of
Mala
ya
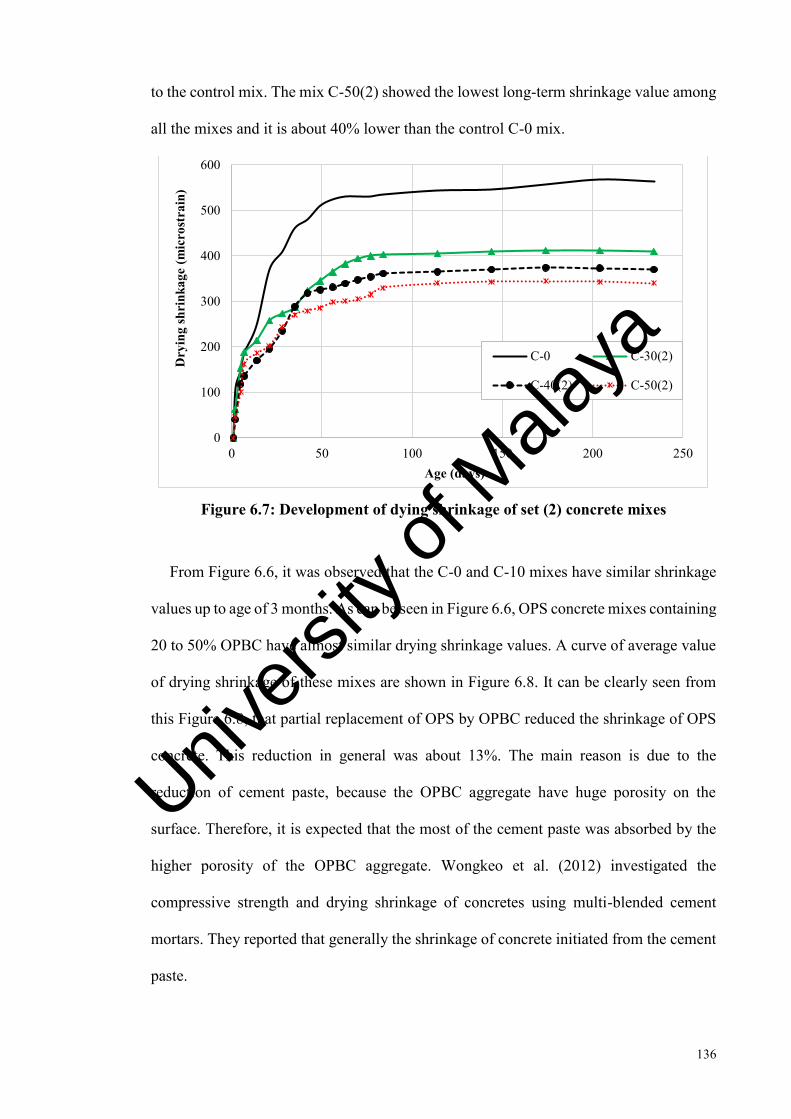
136
to the control mix. The mix C-50(2) showed the lowest long-term shrinkage value among
all the mixes and it is about 40% lower than the control C-0 mix.
Figure 6.7: Development of dying shrinkage of set (2) concrete mixes
From Figure 6.6, it was observed that the C-0 and C-10 mixes have similar shrinkage
values up to age of 3 months. As can be seen in Figure 6.6, OPS concrete mixes containing
20 to 50% OPBC have almost similar drying shrinkage values. A curve of average value
of drying shrinkage of these mixes are shown in Figure 6.8. It can be clearly seen from
this Figure 6.8, that partial replacement of OPS by OPBC reduced the shrinkage of OPS
concrete. This reduction in general was about 13%. The main reason is due to the
reduction of cement paste, because the OPBC aggregate have huge porosity on the
surface. Therefore, it is expected that the most of the cement paste was absorbed by the
higher porosity of the OPBC aggregate. Wongkeo et al. (2012) investigated the
compressive strength and drying shrinkage of concretes using multi-blended cement
mortars. They reported that generally the shrinkage of concrete initiated from the cement
paste.
0
100
200
300
400
500
600
0 50 100 150 200 250
Dry
ing
shri
nkag
e (m
icro
stra
in)
Age (days)
C-0 C-30(2)
C-40(2) C-50(2)
Univers
ity of
Mala
ya

137
Similarly, it can be observed from Figure 6.7 that the set (2) concrete mixes (C-30(2)
to (C-50(2)) showed very close results to each other at all ages with the average difference
of about 14%. Therefore, average values were taken and plotted in Figure 6.8. It can be
seen in this Figure 6.8 that the contribution of OPBC in OPS concrete along with
reduction on water to cement ratio significantly reduced the drying shrinkage compared
to control OPS concrete mix. The average reduction in the drying shrinkage values of the
OPS-OPBC concrete mixes (set (2) concrete mixes) was about 34% than the control OPS
concrete and about 24% compared to the set (1) concrete mixes containing 20-50% OPBC
aggregates. Bogas et al. (2014) reported that the higher the w/c ratio the lower will be the
mortar stiffness and higher the volume of evaporable water which cause a significant
volume change in the concrete.
Figure 6.8: Development of dying shrinkage of both sets mixes
There are certain reasons, which possibly play a major role to reduce the drying
shrinkage. First reason is the shape and surface texture of the aggregates. It was observed
from the experimental results (Figure 6.8) that the OPS concrete is showing the highest
0
100
200
300
400
500
600
0 50 100 150 200 250
Dry
ing
shri
nkag
e (m
icro
stra
in)
Age (days)
Control OPSC
Average (C-20 to C-50)
Average (C-30(2) to C-50(2))
Univers
ity of
Mala
ya
138
drying shrinkage at almost all ages. This might be due to the shape and surface texture of
the OPS aggregates; the OPS aggregates are normally flaky in shape with smooth surface
texture as compared to the crushed OPBC aggregates. Al-Attar (2008) investigated the
drying shrinkage of the ordinary concrete by using crushed and uncrushed gravels as
aggregates. He reported that due to smooth texture surface of uncrushed gravels concrete
containing these aggregates have more drying compared to crushed aggregate concrete.
The second reason is the type and the stiffness of the aggregates. Previous studies
showed that compared to other types of lightweight concrete, modulus of elasticity of
OPS concrete is low. It is in the range of 5.31-10.90 GPa (Alengaram et al., 2013;
Mahmud et al., 2009). However concrete containing only OPBC as coarse aggregate
showed higher modulus of elasticity in the range of 12-26 GPa (Mohammed et al., 2013;
2014). Therefore, it was expected that by using these both aggregates together in one
mixture, the modulus of elasticity is improved. It can be verified from the compressive
strength results that the incorporation of the OPBC aggregates in OPS concrete
significantly increased the strength. The elastic modulus of concrete depends on the
moduli of elasticity of its components and their proportions by volume in the concrete
(Neville, 1971). Therefore, the main difference between all the prepared mixes is the type
and the volume of the coarse aggregates so it can be concluded that the elastic modulus
of OPBC grain is higher than the modulus of OPS grain. This is another reason that
concrete/aggregate with higher elastic modulus have lower drying shrinkage (Neville,
2008). Shafigh et al. (2012) reported that an expanded clay LWC with a compressive
strength of 30% less than OPS concrete showed about 40% higher modulus of elasticity
compared to OPS concrete. In this study, the OPS concrete showed higher drying
shrinkage results compared to OPS-OPBC mixes. This was majorly due to the
improvement in the properties of OPS concrete by the incorporation of OPBC aggregates.
Univers
ity of
Mala
ya

139
The third reason is the effect of moisture content present in the aggregates. Literature
revealed that, several strategies exists to reduce the drying shrinkage, such as use of
expansive cements (Saito, Kawamura, & Arakawa, 1991; Weiss & Shah, 2002), addition
of shrinkage reducing admixtures (Henkensiefken, Nantung, & Weiss, 2008) and addition
of saturate lightweight aggregates (Hemmings et al., 2009; P. Lura et al., 2006). In this
study both types of lightweight coarse aggregates were pre-saturated before using in
concrete mixture. As can be seen in Table 6.1, OPS have 34% higher water absorption
than OPBC aggregates. Therefore, while designing the OPS concrete mixture at the
similar water to cement ratio to the OPBC mixtures, the overall water content in the
mixture was increased which might be able to create a problem during hydration process.
The shrinkage results of the OPS concrete were significantly reduced by the replacement
of OPS with OPBC, which might be due to maintained water content in the concrete
mixes. Generally, in any type of concrete, if the water content in the mixture will be
higher, the mechanical properties will be reduced. Al-Attar (2008) reported that by using
saturated coarse aggregates in the concrete mix, it always yields higher drying shrinkage
than in dry aggregate mixture. In this study, mostly the mixes which contained higher
amount of OPBC aggregates (C-50 and C-50(2)) showed the lowest drying shrinkage.
This was due to the moderate internal moisture present in the aggregates which properly
performed in the internal curing due to that the properties such as compressive strength
and drying shrinkage of the concretes were increased (Figures 6.6 to 6.11).
Another reason might be porosity and the internal curing. Literature revealed (Mannan
et al., 2002; Okpala, 1990) that OPS aggregate have smooth nature on both the concave
and convex faces, due to that the bond between the shell and cement paste was very weak.
However, the crushed OPBC aggregates have higher porosity which causes better
interfacial bond with the cement paste. Therefore, it was expected that when the high
porous OPBC aggregates were incorporated in OPS concrete it performs better role in the
Univers
ity of
Mala
ya

140
internal curing. During the process of internal curing, saturated LWAs develop a suction
pressure in the hydrated cement paste due to the self-desiccation and chemical shrinkage.
Henkensiefken et al. (2009) stated that during the process of internal curing, the biggest
pores loses water quickly and reduces the capillary stress which increases the hydration
process. Therefore, it can be concluded that OPBC with the higher porosity loses internal
water quickly, which increases the hydration process of the mixture, due to that the
mechanical and durability properties were significantly improved. Bogas et al. (2014)
reported that when the internal curing becomes less relevant there is a sudden increase in
the shrinkage rate of LWC compared to NWC. They also reported that the shrinkage of
LWC depends on the water lost by evaporation. Generally, the LWAs have lower
restriction effect on the paste deformations which increases the rate of drying shrinkage.
Figure 6.9 shows the relationship of the drying shrinkage and amount of OPBC
aggregates with different proportion levels. It can be clearly seen that as the replacement
level increase the drying shrinkage was reduced. This was majorly due to the replacement
of OPS by OPBC aggregates in OPS concrete and this higher replacement is protecting
majority of the cement paste from drying. It was observed from the experimental results
that the OPS concrete showed higher drying shrinkage. As the OPS aggregates were
partially replaced by OPBC aggregates at 10% interval, the drying shrinkage was reduced.
The mix with 50% replacement of OPS with OPBC gives the lowest drying shrinkage
value compared to all the set (1) concrete mixes. This value was about 11.4% lower than
control OPS concrete at the long-term ages. However, uncured condition, the set (2)
concrete mixes shows sharp reduction rate in shrinkage strain compared to set (1) concrete
mixes, due to reduction in water to cement ratio. Kovler and Jensen (2007) reported that
if the volume of aggregate replacements increased, the fraction of paste also increases
within a specified closeness of a saturated lightweight aggregate. However, when lower
replacements were used the fraction of paste was rapidly increase within 1 mm of a
Univers
ity of
Mala
ya

141
saturated LWA particles. Therefore, at low replacement levels, if water in the saturated
LWA can travel up to 1 mm than a majority of the paste will be protected (Kovler &
Jensen, 2007). While, in higher replacement levels, a larger paste fraction is within 0.2
mm, which might be important at later ages. In this study, it was observed that partial
substitution of OPBC aggregates in OPS concrete has a significant effect on the drying
shrinkage. Both set mixes showed similar drying shrinkage results to the control concrete
up to 7 days, however, the OPS-OPBC mixes of set (1) on average continued the closer
trend to the control OPS concrete up to 28 days, after that the shrinkage was reduced. The
long-term shrinkage of the OPS concrete was significantly reduced by the contribution of
OPBC aggregate. The set (1) concrete mixes showed the reliability of about 55% between
the shrinkage results at different OPBC substitutions. However, this ratio for set (2)
concrete mixes was very high about 99%. This might be due to reduction in water contents
of the aggregates because OPS aggregate have about 39% higher water absorption
compared to OPBC. Therefore, the substitution of OPBC in OPS concrete maintains the
total amount of water in the mixture. Gribniak, Kaklauskas, Kliukas, and Jakubovskis
(2013) reported that the aggregates with high water absorption tend to increase the
shrinkage deformations.
Univers
ity of
Mala
ya

142
Figure 6.9: 234-days age shrinkage versus the replacement of OPS by OPBC
aggregates
In this study, the drying shrinkage was investigated for two sets of concrete mixtures.
As discussed earlier, in first set all prepared mixes (C-0 to C-50) contain same water
content and were investigated to observe the effect of OPBC aggregate substitutions in
the OPS concrete. Although, the small reduction in the drying shrinkage was found in
OPS-OPBC mixes compared to the control OPS mixture. This reduction in the shrinkage
strain was majorly due to the replacement of the aggregates. After that it was decided to
manage the workability closer to control OPS concrete. For that a set (2) concrete mixes
(C-30(2) to C-50(2)) with reduced water to cement ratios from 0.36 to 0.295 were
designed and drying shrinkage behaviour was investigated. Figure 6.10 shows the
relationship between drying shrinkage and water to cement ratios and OPBC content. It
can be clearly seen that by reducing the w/c ratio, the drying shrinkage was significantly
reduced. The mix C-50(2) at w/c ratio of 0.295 gives lowest drying shrinkage of about
40% under uncured condition compared to OPS concrete at the age of about 9 months.
The mixes C-30(2), C-40(2) and C-50(2) showed about 15.5%, 23% and 32% lower
R² = 0.5504
R² = 0.7977
R² = 0.9932
R² = 0.9196
300
350
400
450
500
550
600
650
0 40 80 120 160 200 240 280
Dry
ing
shri
nkag
e (m
icro
stra
in)
Replacement of OPS with OPBC (kg/m3)
Un-cured
7-day cured
Un-cured set 2 mixes
7-day cured set 2 mixes
Univers
ity of
Mala
ya
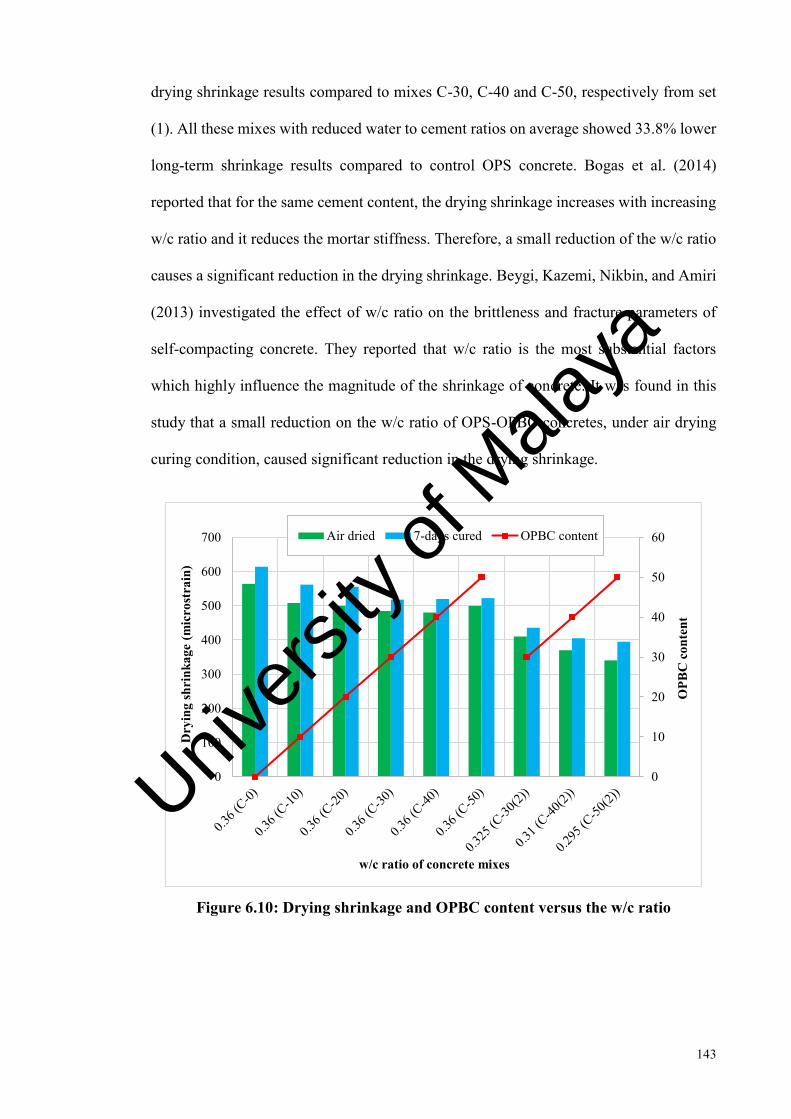
143
drying shrinkage results compared to mixes C-30, C-40 and C-50, respectively from set
(1). All these mixes with reduced water to cement ratios on average showed 33.8% lower
long-term shrinkage results compared to control OPS concrete. Bogas et al. (2014)
reported that for the same cement content, the drying shrinkage increases with increasing
w/c ratio and it reduces the mortar stiffness. Therefore, a small reduction of the w/c ratio
causes a significant reduction in the drying shrinkage. Beygi, Kazemi, Nikbin, and Amiri
(2013) investigated the effect of w/c ratio on the brittleness and fracture parameters of
self-compacting concrete. They reported that w/c ratio is the most substantial factors
which highly influence the magnitude of the shrinkage of concrete. It was found in this
study that a small reduction on the w/c ratio of OPS-OPBC concretes, under air drying
curing condition, caused significant reduction in the drying shrinkage.
Figure 6.10: Drying shrinkage and OPBC content versus the w/c ratio
0
10
20
30
40
50
60
0
100
200
300
400
500
600
700
OPB
C c
onte
nt
Dry
ing
shri
nkag
e (m
icro
stra
in)
w/c ratio of concrete mixes
Air dried 7-days cured OPBC content
Univers
ity of
Mala
ya
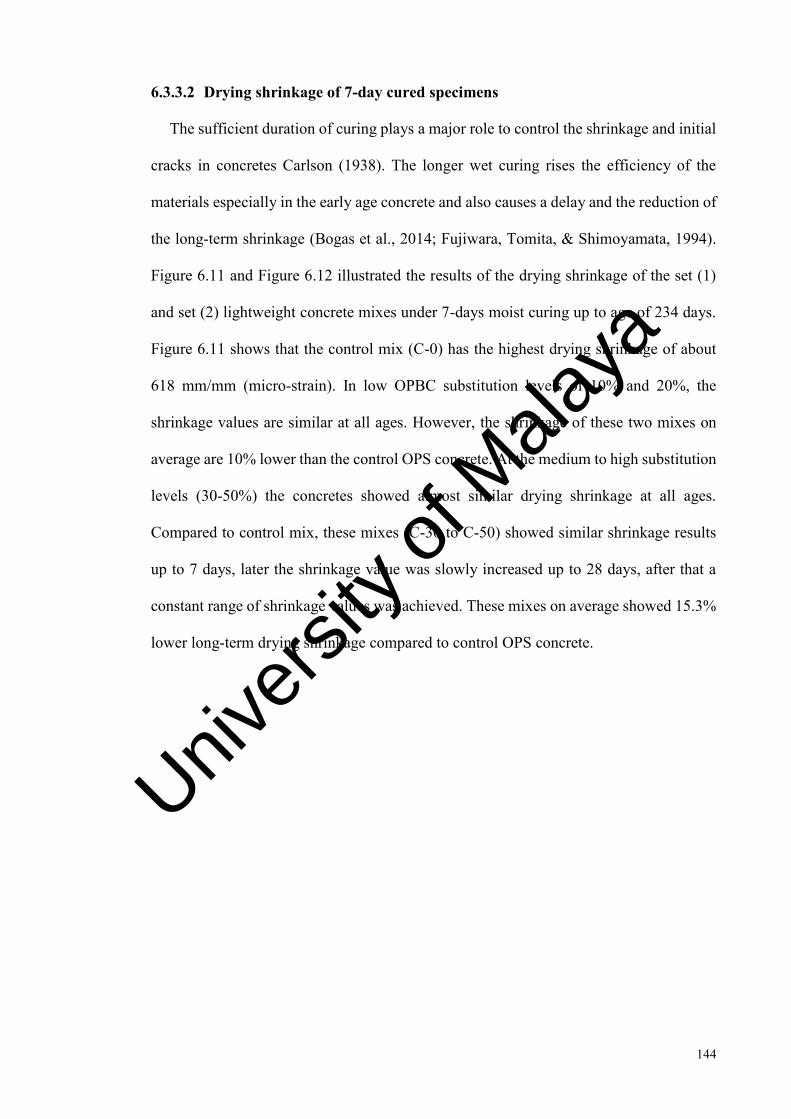
144
6.3.3.2 Drying shrinkage of 7-day cured specimens
The sufficient duration of curing plays a major role to control the shrinkage and initial
cracks in concretes Carlson (1938). The longer wet curing rises the efficiency of the
materials especially in the early age concrete and also causes a delay and the reduction of
the long-term shrinkage (Bogas et al., 2014; Fujiwara, Tomita, & Shimoyamata, 1994).
Figure 6.11 and Figure 6.12 illustrated the results of the drying shrinkage of the set (1)
and set (2) lightweight concrete mixes under 7-days moist curing up to age of 234 days.
Figure 6.11 shows that the control mix (C-0) has the highest drying shrinkage of about
618 mm/mm (micro-strain). In low OPBC substitution levels of 10% and 20%, the
shrinkage values are similar at all ages. However, the shrinkage of these two mixes on
average are 10% lower than the control OPS concrete. At the medium to high substitution
levels (30-50%) the concretes showed almost similar drying shrinkage at all ages.
Compared to control mix, these mixes (C-30 to C-50) showed similar shrinkage results
up to 7 days, later the shrinkage value was slowly increased up to 28 days, after that a
constant range of shrinkage values was achieved. These mixes on average showed 15.3%
lower long-term drying shrinkage compared to control OPS concrete.
Univers
ity of
Mala
ya
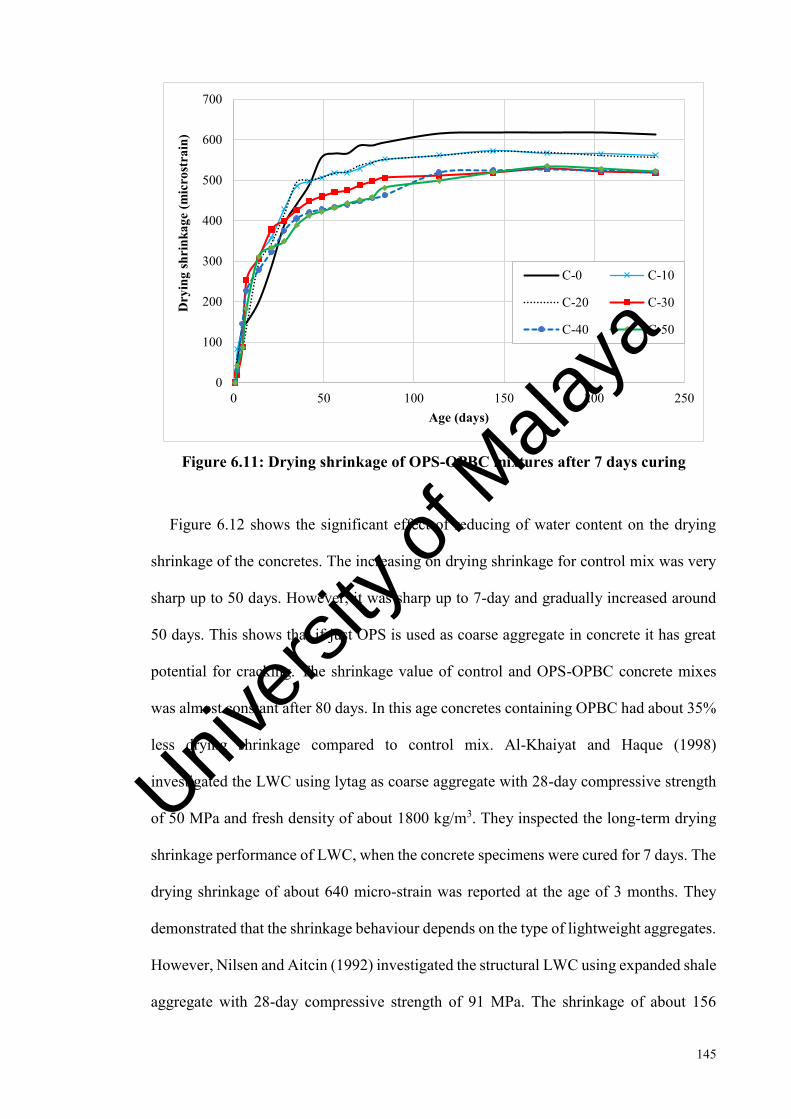
145
Figure 6.11: Drying shrinkage of OPS-OPBC mixtures after 7 days curing
Figure 6.12 shows the significant effect of reducing of water content on the drying
shrinkage of the concretes. The increasing on drying shrinkage for control mix was very
sharp up to 50 days. However, it was sharp up to 7-day and gradually increased around
50 days. This shows that if just OPS is used as coarse aggregate in concrete it has great
potential for cracking. The shrinkage value of control and OPS-OPBC concrete mixes
was almost constant after 80 days. In this age concretes containing OPBC had about 35%
less drying shrinkage compared to control mix. Al-Khaiyat and Haque (1998)
investigated the LWC using lytag as coarse aggregate with 28-day compressive strength
of 50 MPa and fresh density of about 1800 kg/m3. They inspected the long-term drying
shrinkage performance of LWC, when the concrete specimens were cured for 7 days. The
drying shrinkage of about 640 micro-strain was reported at the age of 3 months. They
demonstrated that the shrinkage behaviour depends on the type of lightweight aggregates.
However, Nilsen and Aitcin (1992) investigated the structural LWC using expanded shale
aggregate with 28-day compressive strength of 91 MPa. The shrinkage of about 156
0
100
200
300
400
500
600
700
0 50 100 150 200 250
Dry
ing
shri
nkag
e (m
icro
stra
in)
Age (days)
C-0 C-10
C-20 C-30
C-40 C-50
Univers
ity of
Mala
ya
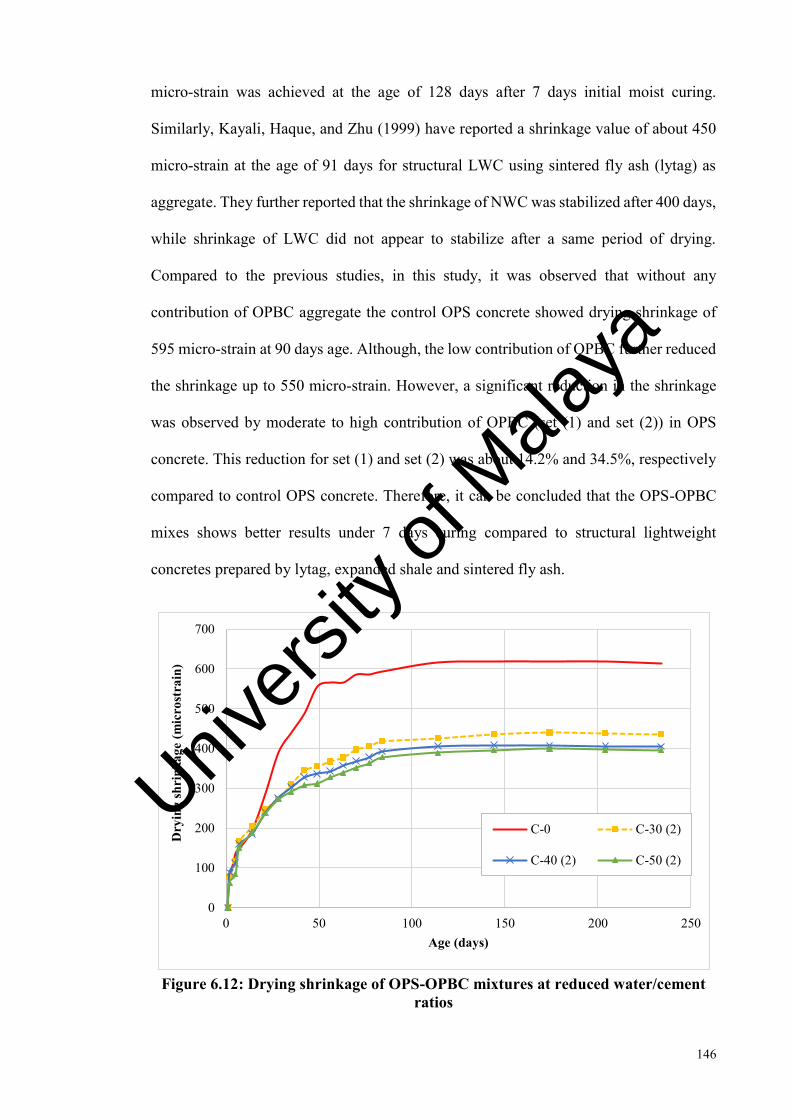
146
micro-strain was achieved at the age of 128 days after 7 days initial moist curing.
Similarly, Kayali, Haque, and Zhu (1999) have reported a shrinkage value of about 450
micro-strain at the age of 91 days for structural LWC using sintered fly ash (lytag) as
aggregate. They further reported that the shrinkage of NWC was stabilized after 400 days,
while shrinkage of LWC did not appear to stabilize after a same period of drying.
Compared to the previous studies, in this study, it was observed that without any
contribution of OPBC aggregate the control OPS concrete showed drying shrinkage of
595 micro-strain at 90 days age. Although, the low contribution of OPBC further reduced
the shrinkage up to 550 micro-strain. However, a significant reduction in the shrinkage
was observed by moderate to high contribution of OPBC (set (1) and set (2)) in OPS
concrete. This reduction for set (1) and set (2) was about 14.2% and 34.5%, respectively
compared to control OPS concrete. Therefore, it can be concluded that the OPS-OPBC
mixes shows better results under 7 days curing compared to structural lightweight
concretes prepared by lytag, expanded shale and sintered fly ash.
Figure 6.12: Drying shrinkage of OPS-OPBC mixtures at reduced water/cement
ratios
0
100
200
300
400
500
600
700
0 50 100 150 200 250
Dry
ing
shri
nkag
e (m
icro
stra
in)
Age (days)
C-0 C-30 (2)
C-40 (2) C-50 (2)
Univers
ity of
Mala
ya

147
Figure 6.13 shows average values of drying shrinkage development of C-30, C-40 and
C-50 mixes from set (1) and set (2) concrete mixes. This Figure 6.13 clearly shows the
effect of moderate to high volume contributions of OPBC in OPS concrete to reduce
drying shrinkage of the concrete. The contribution of 30-50% OPBC in OPS concrete
reduced the drying shrinkage on average 15.3%. While at these substitution levels and by
reducing the water content the reduction on drying shrinkage of OPS concrete was on
average 32.8%.
The set (2) concrete mixes have similar drying shrinkage compared to C-30, C-40, C-
50 mixes at the age of 7 days. However, these mixes showed on average 16.5%, 22.4%
and 24.3% lower drying shrinkage at later ages. Mix C-50(2) showed the lowest drying
shrinkage value. The shrinkage value of this mix was about 40% and 36% lower than
OPS control mix for uncured and 7 days cured specimens, respectively.
Figure 6.13: Development of dying shrinkage of both set mixes under 7-day
curing
0
100
200
300
400
500
600
700
0 50 100 150 200 250
Dry
ing
shri
nkag
e st
rain
(mic
rost
rain
)
Age (days)
Control OPS concrete
Average (C-30 to C-50)
Average (C-30(2) to (C-50(2))Univers
ity of
Mala
ya

148
Figure 6.9 shows the relationship between the drying shrinkage and amount of OPBC
aggregates. As can be seen in this Figure 6.9, the set (1) concrete mixes showed a similar
decreasing trend under 7 days curing by the contribution of OPBC aggregates. The mixes
with low to moderate contribution showed a sharp decrease in shrinkage results. While,
the higher contribution (40-50%) has no any significant effect on the shrinkage. This
might be due to similar water contents and 7-days curing. However, the set (2) concrete
mixes has shown a significant reduction in the drying shrinkage by the contribution of
OPBC aggregates. The mix C-50(2) showed the 14% lower drying shrinkage under air-
drying compared to 7-days water curing condition. Therefore, it was observed that the
replacement of the aggregates played a major role to reduce the drying shrinkage. Shafigh
et al. (2014) investigated the effect of using OPBC sand in OPS concrete on the drying
shrinkage of the concrete. They reported that the substitution of the normal sand with
OPBC sand had no any significant effect on the drying shrinkage of the OPS concrete.
Bogas et al. (2014) studied the NWC prepared by total and partial replacement of normal
aggregates with expanded clay lightweight aggregates. They reported that the higher
percentage replacement of NWA with expanded clay aggregate increased the long-term
shrinkage but the early age shrinkage was reduced due to delay in drying. Further, they
stated that the greater the percentage replacement of normal aggregate with LWA the
higher the water available to the paste at early ages and it also reduces the restriction
effect on the paste deformation. In this study, it was observed that partial substitution of
OPBC aggregates in OPS concrete has a significant effect on the drying shrinkage. Both
set mixes showed similar drying shrinkage results to the control concrete up to 7 days,
however, the long-term shrinkage was significantly reduced by the contribution of OPBC
aggregate.
The relationship of drying shrinkage, water to cement ratios and OPBC content is
shown in Figure 6.10. It was observed that all the concrete (both sets) mixes containing
Univers
ity of
Mala
ya

149
same volume of the aggregates. However, the major difference between both sets was the
w/c ratio. The set (2) concrete mixes with the reduced w/c ratios shows a significant
reduction in drying shrinkage compared to mixes with same w/c ratio, this was majorly
due to water content and cementitious materials (cement paste). Carlson (1938)
investigated the solid specimens of cement paste and concrete made with rubber particles.
These particles were porous and non-absorbent. He found that each shrank equally, and
concluded that cement paste, if unrestrained by aggregate, would shrink 5 to 15 times
more than ordinary concrete. He demonstrated that the water content is the most important
single factor which has a significant effect on the shrinkage of concrete. Previous studies
(Bogas et al., 2014; Pickett, 1956) revealed that at a constant cement and aggregate
contents, the shrinkage is proportional to the w/c ratio, because of the hydrostatic tension
in the concrete structure. Picket (1956) established that the original spacing between gel
particles depends on the w/c ratio. This was majorly due to the hydrostatic tension (large
spaces between particles will become larger and small spaces will become smaller) in the
concrete gel structure. He reported that the concretes with higher w/c ratios have a more
open structure with large capillaries and have high capacity to shrink as compared to low
w/c ratio concretes.
6.3.3.3 Effect of curing condition
Literature revealed that curing has a significant influence on the shrinkage and
cracking, therefore a proper curing is required to control the shrinkage reducing effect
(Maslehuddin, Ibrahim, Shameem, Ali, & Al-Mehthel, 2013; Tongaroonsri &
Tangtermsirikul, 2009). The concrete that is not cured will show higher early-age
shrinkage and be prone to cracking. Therefore, it is important to keep moisture on
concrete surface for longer than few hours to slow down the drying process of the
concrete. Table 6.3 shows the early-age drying shrinkage of all mixes. It can be clearly
seen that all the mixes from set (1) shows lower early-age drying shrinkage under 7-days
Univers
ity of
Mala
ya
150
curing. The reduction in the control OPS concrete was higher than OPS-OPBC mixes.
The results also confirm that the curing time is essential to minimize the shrinkage at
early ages. It causes a lower drying mass loss causing a delaying effect in the development
of shrinkage allowing the natural strength development (Oliveira, Ribeiro, & Branco,
2015). While from set (2) concrete mixes, the mixes containing 40-50% OPBC aggregate
showed higher early age shrinkage of about 13.5% on average. This increment in early-
age shrinkage strain was majorly due to lower water to cement ratio because it causes a
proper mixing without any bleeding on the surface of the concrete. West (2010)
investigated the process of self-desiccation and autogenous shrinkage. They reported that
when no additional water is available during curing of the concrete, moisture is lost
because it is consumed by hydration thus shrinkage occurs and majorly it occurs in low
water to cement ratio concretes. CCAA (2005) recommended that inadequate bleed water
on the surface of concrete will increase the early-age shrinkage and the tendency of the
concrete to crack. The major advantage of lower early-age drying shrinkage is very low
shrinkage cracks on the concrete surface.
The long-term drying shrinkage of all the mixes are shown in Table 6.4. It is found
that the cured specimens have higher shrinkage than the uncured ones, and the difference
on average is about 5 % for OPS-OPBC concretes with same water to cement ratio. While
this ratio for the reduced w/c ratio concrete mixes was about 9%. Neville (1996) reported
that the prolonged moist curing delays the initiation of shrinkage but ultimately has little
effect on the magnitude of shrinkage. Carlson (1938) stated the contradictory effects of
prolonged moist curing as; it hardens the cement paste and improve the restraining effect
against shrinkage; secondly it produces more hydrated cement which causes more
shrinkage. It was reported by (Neville, 2008; Mehta & Monteiro, 2006) reported that
when the curing period is completed and concrete is subjected to low relative humidity,
the resulting gradient acts as a driving force for moisture migration out of the material
Univers
ity of
Mala
ya

151
and causes volume reduction. Similarly, swelling occurs when there is an increase in
moisture content due to absorption of water. Therefore, due to the curing of the concrete
it resulted higher long-term drying shrinkage. Bogas et al. (2014) studied the comparative
behaviour of lightweight and normal weight concretes under 7-days curing. They reported
that curing causes a delay and a reduction in both lightweight (16.5%) and normal weight
(12.1%) concretes in the long-term shrinkage. Further they demonstrated that in 7 day
curing condition, the period in which the shrinkage of LWC is lower than that of NWC
was extended from about 3 to 5 months. Moreover, they stated that under real conditions
LWC can be quite slow to dry and only the long-term shrinkage should be more
meaningful.
Table 6.3: Effect of curing at early ages on the drying shrinkage
Groups Mixtures
Drying shrinkage (x10-6) Compared
average Uncured 7 days cured Age (days) Age (days)
3 7 14 3 7 14 %
Set (1)
C-0 108 188 247 63(-42%) 149(-21%) 197(-20%) -28 C-10 82 267 331 82(+0%) 185(-31%) 308(-7%) -13 C-20 68 218 302 67(-1%) 137(-37%) 293(-3%) -14 C-30 40 198 289 20(-50%) 253(+28%) 306(+6%) -5 C-40 48 167 328 31(-35%) 227(+36%) 278(-15%) -5 C-50 43 238 322 41(-5%) 183(-23%) 311(-3%) -10
Set (2) C-30(2) 64 188 214 78(+22%) 167(-11%) 205(-4%) +2 C-40(2) 40 136 170 88(+20%) 159(+17%) 185(+9%) +15 C-50(2) 45 163 186 63(+40%) 151(-7%) 189(+2%) +12
(-) decrease in shrinkage due to 7 days curing, (+) increase in shrinkage due to 7 days curing
Table 6.4: Effect of long-term cure on the drying shrinkage
Groups Mixtures
Drying shrinkage (x10-6) Compared
average Uncured) 7 days cured Age (days) Age (days)
28 84 174 234 28 84 174 234 %
Set (1)
C-0 410 535 556 564 390(-5%) 593(+11%) 619(+11%) 614(+9%) +7 C-10 422 530 517 508 430(+2%) 552(+4%) 567(+10%) 562(+11%) +7 C-20 397 488 502 500 418(+5%) 550(+13%) 569(+13%) 556(+11%) +11 C-30 372 468 483 485 400(+8%) 506(+8%) 528(+9%) 518(+7%) +8 C-40 355 462 488 480 375(+6%) 463(+1%) 527(+8%) 520(+8%) +6 C-50 429 500 513 500 349(-19%) 481(-4%) 535(+4%) 522(+4%) -4
Set (2) C-30(2) 273 403 412 410 273(+0%) 418(+4%) 440(+7%) 436(+6%) +4 C-40(2) 235 361 374 370 276(+17%) 392(+9%) 407(+9%) 405(+9%) +11 C-50(2) 243 330 344 340 272(+12%) 378(+15%) 400(+6%) 95(+16%) +12
(-) decrease in shrinkage due to 7 days curing, (+) increase in shrinkage due to 7 days curing
Univers
ity of
Mala
ya

152
6.4 Conclusions
Oil palm shell (or palm kernel shell) lightweight aggregate concrete has relatively high
short and long terms drying shrinkage and it can only be reduced by the reduction of OPS
volume in the concrete. For this purpose, in this study, OPS was partially replaced with
another solid waste from palm oil industry, namely oil-palm-boiler clinker (OPBC).
Based on the test results, the following conclusions can be drawn:
1. The increase in the amount of OPBC aggregates in OPS concrete increased the
slump value and dry density of the OPS concrete.
2. The contribution of OPBC aggregates in OPS concrete increased the specific
strength of the concrete.
3. In continuous moist curing, the set (1) concrete mixes containing OPBC from 20
to 50%, the compressive strength of grade 30 OPS concrete could be transformed
to grade 40. However, the set (2) concrete mixes with 30-50% OPBC aggregate
had significant improvement in the compressive strength and grade 50 OPS
lightweight concrete was achieved.
4. In set (1), the OPS-OPBC mixes showed similar shrinkage results to the control
OPS concrete at early ages. However, the long-term shrinkage was significantly
reduced compared to control OPS concrete.
5. The contribution of OPBC in OPS concrete along with reduction on water to
cement ratio significantly reduced the drying shrinkage compared to control OPS
concrete. The mix C-50(2) showed the lowest shrinkage value among all the mixes
and it was about 40% lower than the C-0 mixture.
6. The OPS-OPBC concrete mixes shows better results under 7-day moist curing
compared to structural lightweight aggregate concretes were made of lightweight
aggregates such as lytag, expanded shale and sintered fly ash.
Univers
ity of
Mala
ya
153
7. All the set (1) concrete mixes showed lower early-age drying shrinkage under 7-
day curing compared to uncured specimens. The results also confirm that the
curing time is essential to minimize the shrinkage at early ages. Therefore, the pre-
saturation of aggregates reduces the early-age shrinkage and delays the drying
shrinkage. While in set (2) concrete mixes, the mixes containing 40-50% OPBC
aggregate showed higher early age shrinkage, on average, about 13.5% under 7-
day curing compared to uncured specimens.
Univers
ity of
Mala
ya

154
EFFECT OF COARSE LIGHTWEIGHT AGGREGATE TYPE
ON THE DRYING SHRINKAGE DEVELOPMENT OF CONCRETE
7.1 Introduction
The knowledge of the shrinkage characteristics in the concrete is a necessary beginning
point in the design of structures for crack control. It helps the designer to evaluate the
probable shrinkage development in prestressed and reinforced concrete members and the
suitable steps can be taken in design to accommodate this movement (CCAA, 2002).
Similar to the hydration of cement, shrinkage is also an everlasting process when the
concrete is exposed to drying. It tends to reach an equilibrium with that environment
which causes evaporation of moisture from the gel pores and causes the change in volume
(CCAA, 2002). The rate of evaporation depends on several factors and ingredients such
as temperature, relative humidity, cement paste content, water to binder ratio and the area
of exposed surface of concrete. The higher the paste volume is, the higher will be the
drying shrinkage of concrete (Bissonnette, Pierre, & Pigeon, 1999). However, the
fineness and the type of cement do not have an important effect on shrinkage (Neville,
1996). Several researchers (Hansen, 1987; Neville, 1996) reported that the water to
cement ratio determines the porosity of concrete due to that it has an important influence
in the shrinkage process. Neville (1996; 2008) stated that the shrinkage of cement paste
is directly proportional to the water to binder ratio when it lies between 0.20 to 0.60.
The aggregates are the most important material in relation with shrinkage, it restricts
the cement paste contraction. Carlson (1938) was the pioneer to propose the restraining
effect of the aggregates on the shrinkage of concrete. However, the rigidity of an
aggregates has a significant effect on the shrinkage, the more the aggregate are rigid, the
less will be the shrinkage in concrete. Nevertheless, some of the aggregates also shrink
on drying, such those from some sedimentary rocks (Neville, 1996). Several researchers
Univers
ity of
Mala
ya

155
(Carlson, 1938; Pickett, 1956; Powers, 1959; Rao, 2001) reported that an increase in
aggregate size and contents increases the volume of aggregate which provides restraint in
concrete and causes reduction in shrinkage. Zhang, Zakaria, and Hama (2013)
investigated the influence of aggregate materials on the drying shrinkage properties of
concrete using five types of fine aggregates such as natural sand, copper slag sand,
limestone sand, hard sandstone and blast furnace slag sand. They found the maximum
drying shrinkage strain in the range of 650-790 micro-strain at the age of 90 days. Shafigh,
Mahmud, et al. (2014) investigated drying shrinkage behaviour of OPS lightweight
concrete in that the normal sand was replaced with oil-palm-boiler clinker (OPBC) sand
from 0 to 50%. They reported that the incorporation of OPBC sand in OPS concrete does
not have a significant effect on the drying shrinkage strain of OPS concrete. Carlson
(1938) investigated the effect of coarse aggregate on drying shrinkage of concrete and
reported that aggregates with high porosity and water absorption have usually low elastic
modulus, which will result in less restraint against shrinkage of concrete. Whereas,
Matsushita and Tsuruta (1998) investigated the effects of normal coarse aggregate types
such as Crystalline Schist, Amphibolite, and Andesite on the autogenous shrinkage of
concrete. They reported that if the coarse aggregate volume was maintained constant, it
negligibly affects the autogenous shrinkage of high-strength concrete.
In the case of lightweight aggregate concrete (LWAC), the drying shrinkage is greater
than conventional concrete and is mostly affected by the properties and the volume of
aggregates (Satish & Berntsson, 2003). Lura, Van Breugel, and Maruyama (2002)
reported that the use of lightweight aggregates (LWA) in the concrete mixes reduces the
self-desiccation of the cement paste. They described that LWAC showed lower drying
shrinkage at the early ages, however, at later ages, the rate of shrinkage strain was higher
compared to NWC. It was due to lower modulus of elasticity of LWA and offering less
restraint to shrinkage of the paste. Selih and Bremner (1996) stated that the adsorbed
Univers
ity of
Mala
ya

156
water in LWAs was latterly released into the cement paste due to the internal curing,
which compensates for the initial water lost by drying and self-desiccation. Due to the
continuous hydration of cement paste and the internal curing, the deformation resistance
of concrete matrix is higher, and, therefore, less water is available for evaporation. Several
researchers (Coquillat, 1986; Shafigh et al., 2014; Hossain & Lachemi, 2007) by
considering multi effective factors on drying shrinkage of concrete together with different
variability of LWAs, and concluded that LWACs have higher drying shrinkage compared
to NWCs. However, some reports showed that shrinkage in LWAC is less than or similar
to shrinkage of NWC (Shafigh et al., 2014; Wegen & Bijen, 1985). For general design
work, it was suggested that the shrinkage of LWAC is between 1.4 and 2 times that of
NWC (Clarke, 2002).
Oil palm shell (OPS) and oil-palm-boiler clinker (OPBC) are reported to be the most
growing agricultural solid waste materials from the oil palm industry in tropical regime
countries such as Malaysia, Indonesia, Nigeria and Thailand. Recently, because of the
growing environmental concerns, the recycling of the waste as a construction material
appears to be a feasible solution to resolve the pollution and economical problems to
design the green and sustainable buildings (Raut, Ralegaonkar, & Mandavgane, 2011).
OPS and OPBC as an alternative aggregate were investigated by the number of
researchers to produce structural lightweight aggregate concrete (Aslam et al., 2016;
Shafigh et al., 2013; Zhang et al., 2013). However, several researchers (Ayhan, Gonul,
Gonul, & Karakus, 2011; Bhatty & Reid, 1989) preferred to used artificial lightweight
aggregates such as expanded clay and lytag to produce structural lightweight aggregate
concrete. Production of artificial LWAs or synthetic products requires huge combustion
fuels and high temperatures (1100-1200 °C). Due to that, these types of lightweight
aggregates are not ecological and economical materials (Ayhan et al., 2011; Bhatty &
Univers
ity of
Mala
ya

157
Reid, 1989; Harmon, 2007). In addition, artificial LWAs (LECA) as an aggregate is not
locally available and should be imported to the country, however, it is expensive.
The main aim of this study is to investigate the effect of replacement of conventional
aggregate with lightweight solid wastes such as OPS and OPBC and comparison with
drying shrinkage of lightweight expanded clay lightweight aggregate concrete.
7.2 Experimental Programme
7.2.1 Materials
All the materials used in this study were collected and produced in the Malaysia,
except expanded clay lightweight aggregate. The ordinary Portland cement (OPC) of
grade 48 was used as a binder in this investigation, conforming to MS522, part-1:2003.
The specific gravity, Blaine surface area, initial and final setting times of the cement were
3.14, 3510 cm2/g, 65 min and 140 min, respectively.
The aggregates including crushed granite (NWA), oil palm shell (OPS), oil-palm-
boiler clinker (OPBC) and lightweight expanded clay (LECA) with the nominal size of
8-12 mm were used as coarse aggregates in the concrete mixtures. During preparation,
the OPS aggregates were stored at open atmosphere for about 6-8 months to remove the
fibers from the surface (Aslam et al., 2016). After that the aggregates were washed using
the detergent powder to remove the oil and impurities from the surface. While, the lumps
of the OPBC aggregates were crushed using a crushing machine. After washing and
crushing, both aggregates were sieved to get the similar grading to the expanded clay and
the conventional aggregates. The properties of those four types of coarse aggregates are
shown in Table 7.1, and their shapes are also mentioned in Figure 7.1. The locally
available mining sand with the maximum grain size, specific gravity, fineness modulus
and 24-h water absorption of 4.75 mm, 2.7, 2.9 and 1.2%, respectively, was used as fine
aggregate.
Univers
ity of
Mala
ya
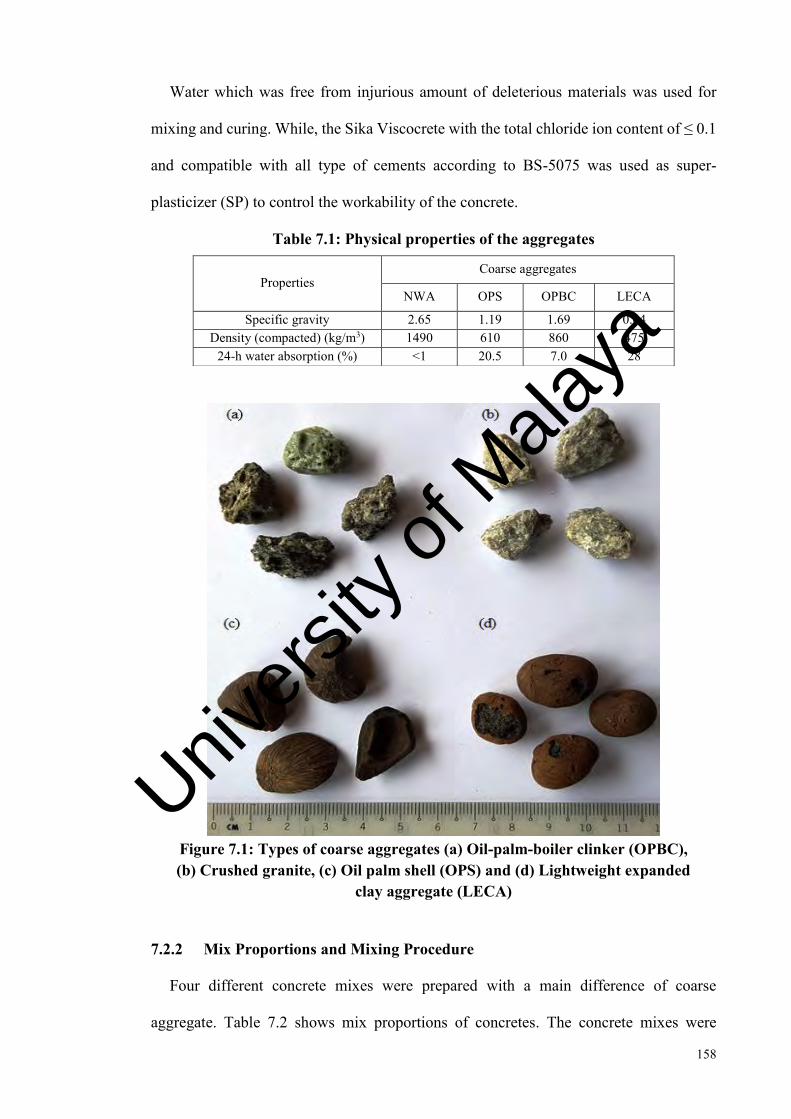
158
Water which was free from injurious amount of deleterious materials was used for
mixing and curing. While, the Sika Viscocrete with the total chloride ion content of ≤ 0.1
and compatible with all type of cements according to BS-5075 was used as super-
plasticizer (SP) to control the workability of the concrete.
Table 7.1: Physical properties of the aggregates
Properties Coarse aggregates
NWA OPS OPBC LECA
Specific gravity 2.65 1.19 1.69 0.64 Density (compacted) (kg/m3) 1490 610 860 475
24-h water absorption (%) <1 20.5 7.0 28
Figure 7.1: Types of coarse aggregates (a) Oil-palm-boiler clinker (OPBC), (b) Crushed granite, (c) Oil palm shell (OPS) and (d) Lightweight expanded
clay aggregate (LECA)
7.2.2 Mix Proportions and Mixing Procedure
Four different concrete mixes were prepared with a main difference of coarse
aggregate. Table 7.2 shows mix proportions of concretes. The concrete mixes were
Univers
ity of
Mala
ya

159
prepared in the rotating drum mixer. Initially, all the materials were weighed in dry
condition, the OPS, OPBC and LECA aggregates were pre-soaked in water for 24 hours
to control the effective water content of the concrete. After that the pre-soaked lightweight
aggregates were air dried in the lab environment for 2-3 hours to obtain saturated surface
dry condition. For each mix proportion, the cement and aggregates were placed in the
mixer and mixed for 2 minutes. Then the mixture of 70% mixing water with SP was added
to the mixer and mixing was continued for another 3 minutes. After that the remaining
water was added to the mixture and mixing was continued for another 5 minutes. Then,
slump test was conducted.
It was observed that substitution of normal coarse aggregate with lightweight
aggregates reduced the slump value. The reduction was more significant for OPS and
OPBC concretes. Therefore, SP dosage was slightly increased for these mixtures.
Table 7.2: Concrete mix proportions
Mix code
Cement (kg/m3)
Water (kg/m3)
SP (% cement)
Sand (kg/m3)
Coarse aggregate (kg/m3) Slump (mm)
Oven dry
density (kg/m3)
28-day compressive
strength (MPa)
OPS OPBC LECA NWA
NWC 480 173 0.85 890 - - - 802 115 2285 70
OPSC 480 173 1 890 360 - - - 55 1790 36 OPBC 480 173 1 890 - 460 - - 85 2050 57 LECA 480 173 0.85 890 - - 194 - 90 1590 25
7.2.3 Curing Conditions
To determine the effect of the curing conditions on the drying shrinkage of the concrete
mixes, the specimens were cured under two different curing regimes of air drying (AC)
in that the specimens were kept in laboratory environment after demoulding, and partial
early curing (7W) in that the specimens were cured in water for 6 days then dried in air
under laboratory environment. The curing water has an average temperature of 22 ± 2 oC,
while, the uncontrolled room in the laboratory had a temperature of 30 ± 2 oC and a
relative humidity of 74 ± 4 %.
Univers
ity of
Mala
ya
160
7.2.4 Specimens Size and Testing Procedure
Four specimens with the size of 100 × 100 × 300 mm were prepared to measure the
drying shrinkage strains of all the designed concrete mixes. After moulding, the
specimens were covered with plastic sheets and stored in the laboratory environment. The
specimens were demoulded after 24 h of the casting. Two specimens were prepared for
each mix to obtain the drying shrinkage strain under the two curing conditions. The drying
shrinkage strains were measured by demountable mechanical strain gauge (DEMEC) with
a resolution of 0.001 mm. The DEMEC points were fixed 200 mm apart with V-tech 502
super glue on the three plain sides of the specimens and placed in the uncontrolled room
for about one hour, so that the applied glue becomes properly dried, the initial readings
were recorded by the equipment (Gauge type PLR-60-11).
7.3 Results and Discussions
7.3.1 Drying Shrinkage Development
The drying shrinkage of normal to moderate strength LWCs plays very important role
in the structural applications, it must be considered and is possibly dangerous when it is
restrained (Kosmatka et al., 2002). Most of the studies (Neville, 2008; Satish &
Berntsson, 2003; Aslam et al., 2016) revealed that the shrinkage strain of LWC is higher
than the NWC and is mostly affected by the quantity and the properties of the aggregates.
Therefore, in this study, the effect of different types of coarse aggregates such as OPS,
OPBC, LECA and crushed granite on the drying shrinkage of the concretes was
investigated.
7.3.1.1 Drying shrinkage of uncured specimens
The drying shrinkage strain development of all the prepared concrete mixes is shown
in Figure 7.2 until the age of one year. All the concrete mixes have showed consistent
development of the drying shrinkage. Among the prepared concrete mixes, the
Univers
ity of
Mala
ya
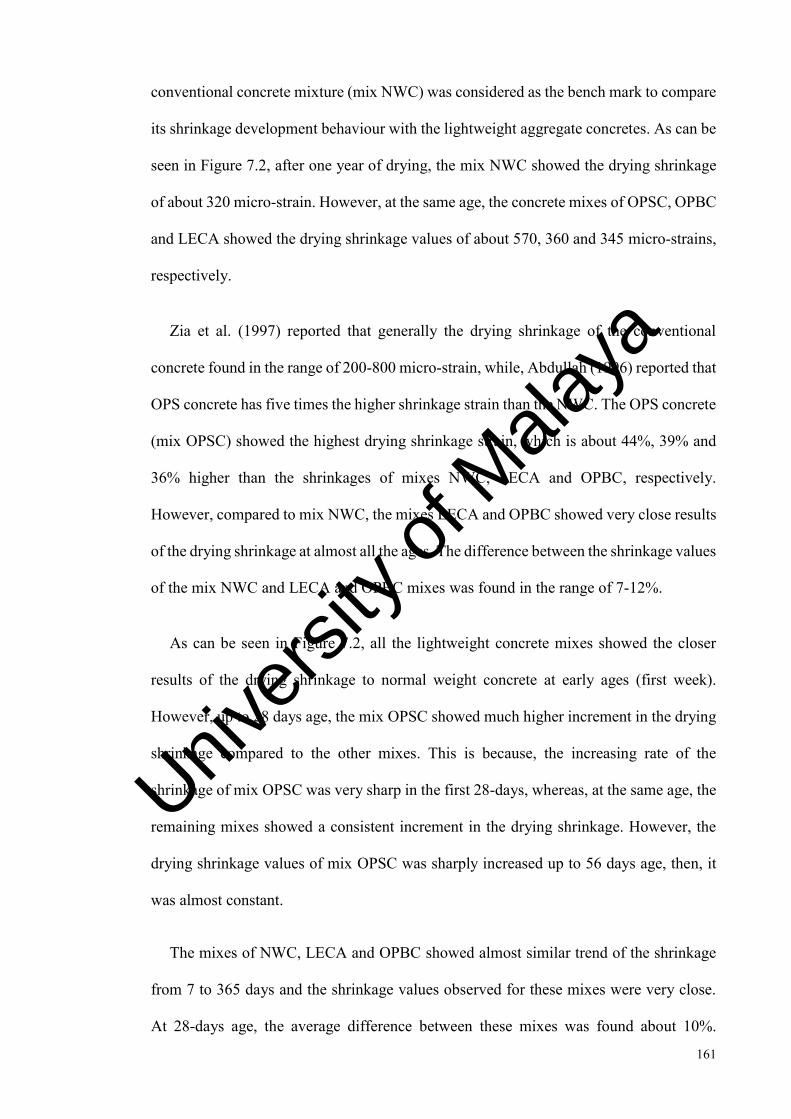
161
conventional concrete mixture (mix NWC) was considered as the bench mark to compare
its shrinkage development behaviour with the lightweight aggregate concretes. As can be
seen in Figure 7.2, after one year of drying, the mix NWC showed the drying shrinkage
of about 320 micro-strain. However, at the same age, the concrete mixes of OPSC, OPBC
and LECA showed the drying shrinkage values of about 570, 360 and 345 micro-strains,
respectively.
Zia et al. (1997) reported that generally the drying shrinkage of the conventional
concrete found in the range of 200-800 micro-strain, while, Abdullah (1996) reported that
OPS concrete has five times the higher shrinkage strain than the NWC. The OPS concrete
(mix OPSC) showed the highest drying shrinkage strain, which is about 44%, 39% and
36% higher than the shrinkages of mixes NWC, LECA and OPBC, respectively.
However, compared to mix NWC, the mixes LECA and OPBC showed very close results
of the drying shrinkage at almost all the ages. The difference between the shrinkage values
of the mix NWC and LECA and OPBC mixes was found in the range of 7-12%.
As can be seen in Figure 7.2, all the lightweight concrete mixes showed the closer
results of the drying shrinkage to normal weight concrete at early ages (first week).
However, up to 28 days age, the mix OPSC showed much higher increment in the drying
shrinkage compared to the other mixes. This is because, the increasing rate of the
shrinkage of mix OPSC was very sharp in the first 28-days, whereas, at the same age, the
remaining mixes showed a consistent increment in the drying shrinkage. However, the
drying shrinkage values of mix OPSC was sharply increased up to 56 days age, then, it
was almost constant.
The mixes of NWC, LECA and OPBC showed almost similar trend of the shrinkage
from 7 to 365 days and the shrinkage values observed for these mixes were very close.
At 28-days age, the average difference between these mixes was found about 10%.
Univers
ity of
Mala
ya
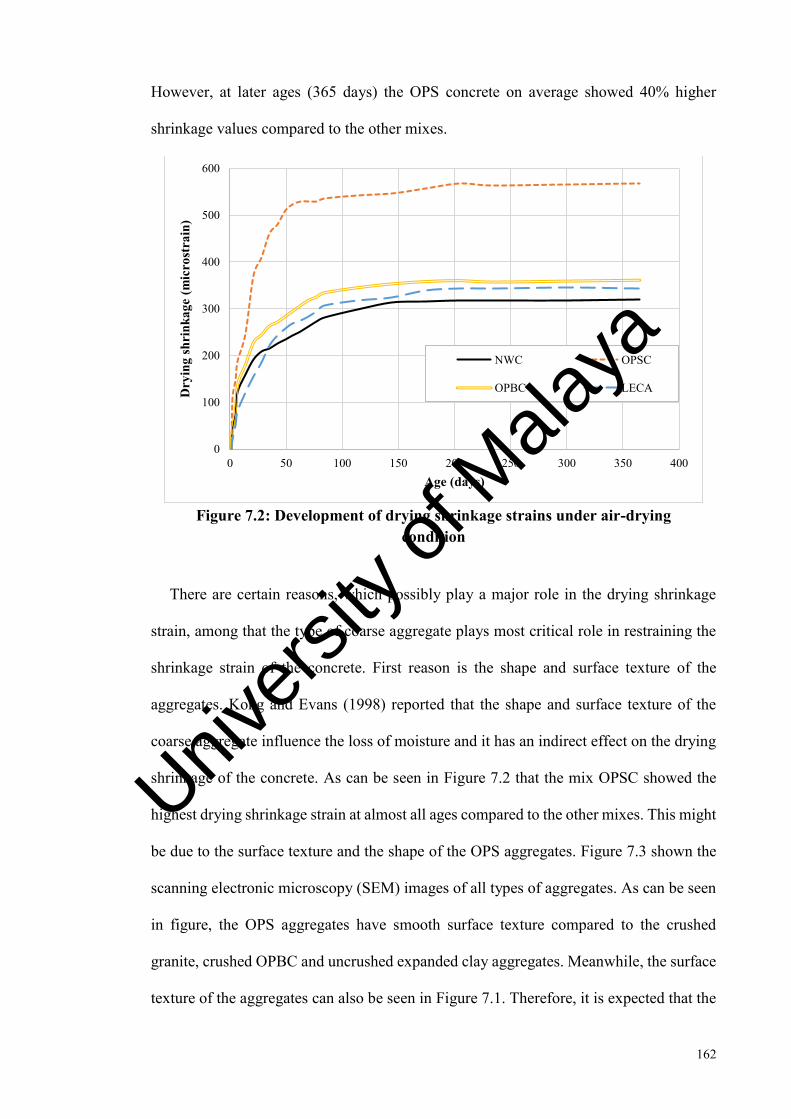
162
However, at later ages (365 days) the OPS concrete on average showed 40% higher
shrinkage values compared to the other mixes.
Figure 7.2: Development of drying shrinkage strains under air-drying
condition
There are certain reasons, which possibly play a major role in the drying shrinkage
strain, among that the type of coarse aggregate plays most critical role in restraining the
shrinkage strain of the concrete. First reason is the shape and surface texture of the
aggregates. Kong and Evans (1998) reported that the shape and surface texture of the
coarse aggregate influence the loss of moisture and it has an indirect effect on the drying
shrinkage of the concrete. As can be seen in Figure 7.2 that the mix OPSC showed the
highest drying shrinkage strain at almost all ages compared to the other mixes. This might
be due to the surface texture and the shape of the OPS aggregates. Figure 7.3 shown the
scanning electronic microscopy (SEM) images of all types of aggregates. As can be seen
in figure, the OPS aggregates have smooth surface texture compared to the crushed
granite, crushed OPBC and uncrushed expanded clay aggregates. Meanwhile, the surface
texture of the aggregates can also be seen in Figure 7.1. Therefore, it is expected that the
0
100
200
300
400
500
600
0 50 100 150 200 250 300 350 400
Dry
ing
shri
nkag
e (m
icro
stra
in)
Age (days)
NWC OPSC
OPBC LECA
Univers
ity of
Mala
ya

163
bonding between the OPS aggregate and the cement paste was not that much higher as
compared to other concretes. This might be the reason of higher drying shrinkage in the
OPS concrete. Al-Attar (2008) studied the shrinkage strain of the conventional concrete
using crushed and uncrushed gravels as coarse aggregates. He reported that due to smooth
texture surface of uncrushed gravels concrete containing these aggregates have more
drying shrinkage compared to crushed aggregate concrete.
The second reason is the strength and the toughness of the aggregates. Chandra and
Berntsson (2002) reported that the shrinkage strain of LWAC is mostly affected by the
properties of the LWA and the amount of the aggregate contents. This is because almost
75% of the volume of concrete is made up of aggregate. In addition, Mehta and Monteiro
(2006) reported that the modulus of elasticity of the aggregate is a more important factor
than the other characteristics of the aggregate. It can control the deformation of concrete.
Previous studies showed that the modulus of elasticity of the OPS lightweight concrete is
generally very low, found in the range of 5.30-11 GPa (Alengaram et al., 2013; Mahmud
et al., 2009). Whereas, the modulus of elasticity for OPBC concrete was found in the
range of 12-26 GPa (Mohammed et al., 2013; 2014), structural LWC using artificial
lightweight aggregate was found between 10 to 24 GPa (CEB/FIP, 1977), and normal
weight concretes in the range of 14-41 GPa (Wilson & Kosmatka, 2011). Neville (2008)
reported that the concrete/aggregate with higher elastic modulus have lower drying
shrinkage. Higher drying shrinkage of OPS concrete shows that this aggregate has lower
modulus of elasticity compared to the other aggregates. Aslam et al. (2016) reported that
the modulus of elasticity of OPS concrete was increased in the range of 18-24% by the
incorporation of OPBC aggregates. As can be seen in Table 7.1, the normal and OPBC
concretes showed about 49% and 37%, respectively higher the 28-day compressive
strength compared to the mix OPS. This is due to normal OPBC grains are tougher, which
resulted lower drying shrinkage for the OPBC concrete.
Univers
ity of
Mala
ya

164
LECA concrete showed lower drying shrinkage compared to the OPS concrete,
although, it has lowest 28-day compressive strength compared to the other concrete
mixes. This was also due to higher modulus of elasticity of a LECA grains compared to
an OPS grains. It was reported by (Shafigh, Jumaat, Mahmud, et al., 2012; Shafigh,
Mahmud, et al., 2012) that the LECA lightweight concrete with 30% lower 28-day
compressive strength than OPS concrete showed about 40% higher modulus of elasticity
compared to OPS concrete. Therefore, it can be concluded that the modulus of elasticity
of aggregate has more influence to drying shrinkage of concrete compared to compressive
strength of the aggregate.
The mix P showed higher drying shrinkage compared to shrinkage strain of the OPBC,
LECA and NWC mixes. This was majorly due to the formation of micro-cracks during
the hardening of the cement paste in concrete. Figure 7.4 shows the micro-cracks pattern
in the OPS lightweight concrete during the hardening of the cement paste. Gao, Lo, and
Tam (2002) reported that the main reason for the lower modulus of elasticity in high
performance LWACs is the formation of micro-cracks during the hardening of the cement
paste in concrete mixture. Due to the higher drying shrinkage of the mix OPS, as well as
the weak bonding between OPS and cement paste resulted micro-cracks in the interfacial
transaction zone (ITZ), and consequently reduces the mechanical properties such as
modulus of elasticity and compressive strength. Further, it can also be clarified that due
to the development of such micro-cracks in ITZ, the compressive strength of the OPS
concrete is more sensitive to the lack of curing. Previous studies (Aslam et al., 2016;
Shafigh et al., 2012; 2013) reported that the OPS concretes are very sensitive to the lack
of curing, particularly, when the cementitious materials were used in the concrete mixture.
However, compared to mix OPS, the aggregates in other concrete mixes (OPBC, LECA
and normal weight concrete) showed better bonding with the cement paste in the ITZ and
Univers
ity of
Mala
ya
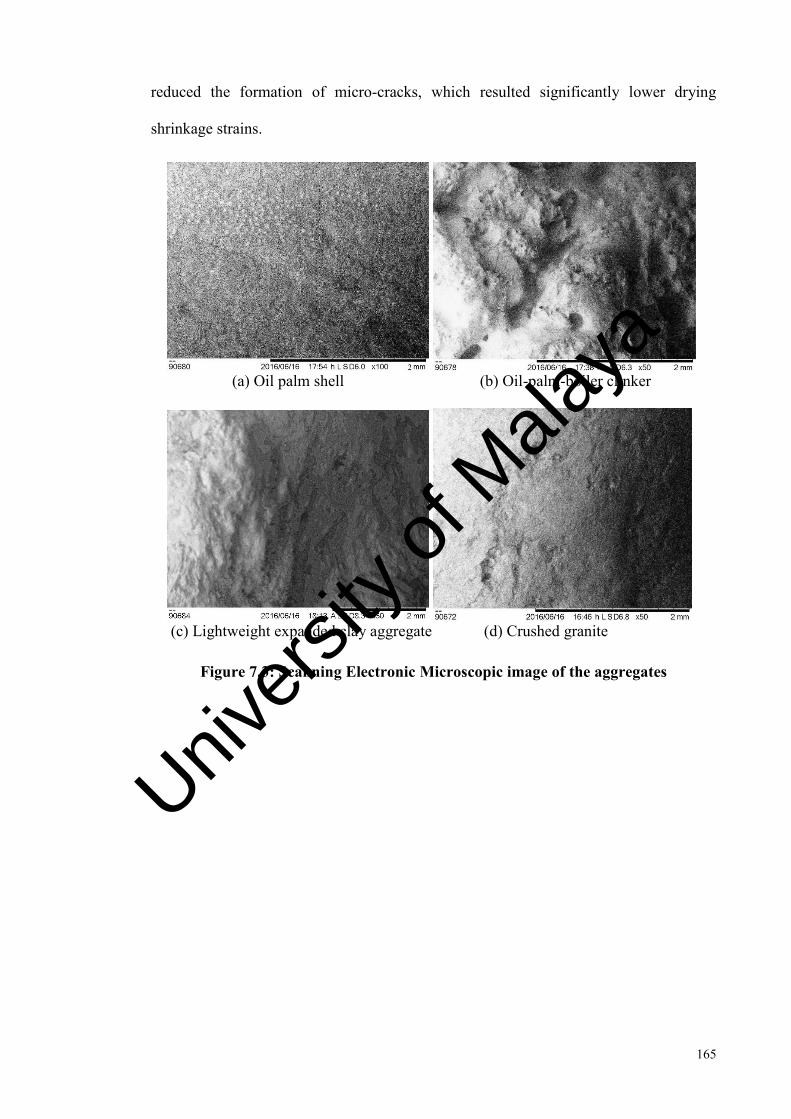
165
reduced the formation of micro-cracks, which resulted significantly lower drying
shrinkage strains.
(a) Oil palm shell (b) Oil-palm-boiler clinker
(c) Lightweight expanded clay aggregate (d) Crushed granite
Figure 7.3: Scanning Electronic Microscopic image of the aggregates
Univers
ity of
Mala
ya
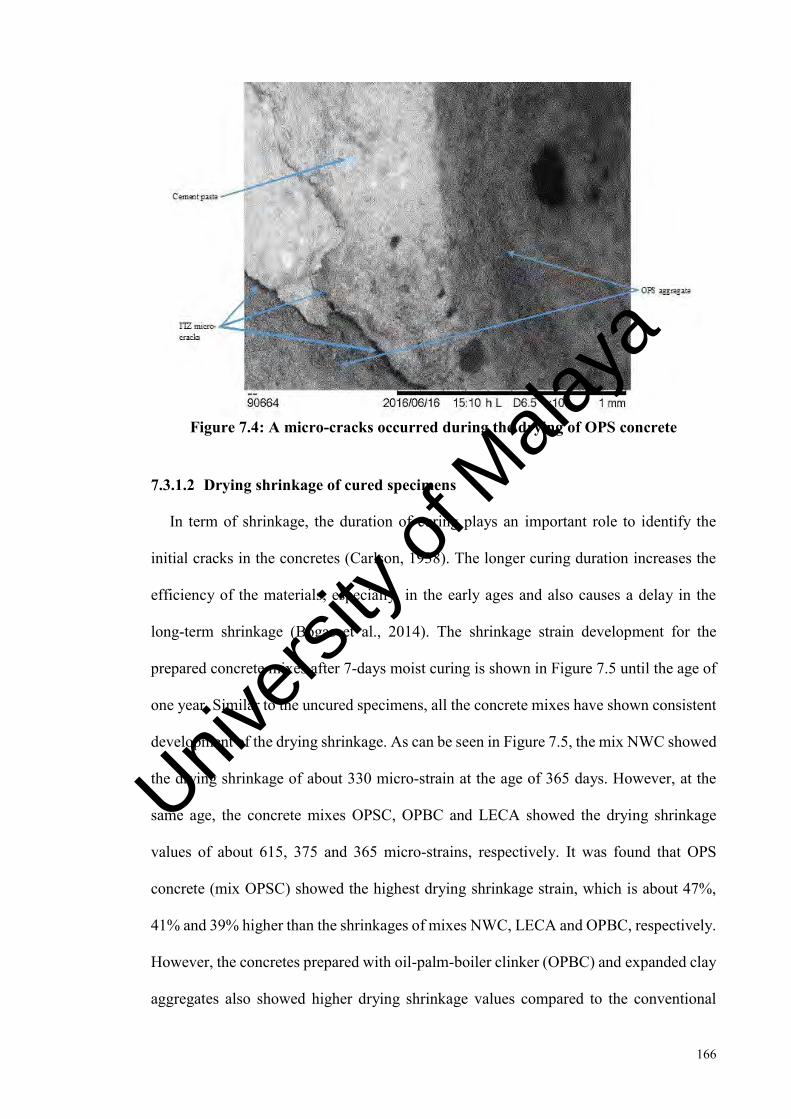
166
Figure 7.4: A micro-cracks occurred during the drying of OPS concrete
7.3.1.2 Drying shrinkage of cured specimens
In term of shrinkage, the duration of curing plays an important role to identify the
initial cracks in the concretes (Carlson, 1938). The longer curing duration increases the
efficiency of the materials, especially, in the early ages and also causes a delay in the
long-term shrinkage (Bogas et al., 2014). The shrinkage strain development for the
prepared concrete mixes after 7-days moist curing is shown in Figure 7.5 until the age of
one year. Similar to the uncured specimens, all the concrete mixes have shown consistent
development of the drying shrinkage. As can be seen in Figure 7.5, the mix NWC showed
the drying shrinkage of about 330 micro-strain at the age of 365 days. However, at the
same age, the concrete mixes OPSC, OPBC and LECA showed the drying shrinkage
values of about 615, 375 and 365 micro-strains, respectively. It was found that OPS
concrete (mix OPSC) showed the highest drying shrinkage strain, which is about 47%,
41% and 39% higher than the shrinkages of mixes NWC, LECA and OPBC, respectively.
However, the concretes prepared with oil-palm-boiler clinker (OPBC) and expanded clay
aggregates also showed higher drying shrinkage values compared to the conventional
Univers
ity of
Mala
ya

167
concrete. The average difference between the shrinkage values of the mix NWC and
mixes of LECA and OPBC was in the range of 10-13% for all ages.
As can be seen in Figure 7.5, all the concrete mixes showed the closer results of the
drying shrinkage at early ages (up to 7-days). However, from 7 to 50 days the drying
shrinkage of OPS concrete was sharply increased, the rate of increment in shrinkage for
this concrete was very high, and from 50 to 365 days age it slowly increased and changed
to the constant line. The mixes NWC, LECA and OPBC showed almost similar and the
consistent drying shrinkage results up to 75 days age, however, at later ages (365 days),
the average difference between drying shrinkage of mixes N, L and C was found about
11.5%.
Figure 7.5: Development of drying shrinkage strains under 7-days moist curing
7.3.2 Effect of Curing Condition on the Drying Shrinkage
The curing conditions under which the concretes were allowed to cure are important
considerations for the shrinkage. A prolonged moist curing period would allow better
hydration of the cement and also reduces the shrinkage effect (Maslehuddin et al., 2013;
0
100
200
300
400
500
600
700
0 50 100 150 200 250 300 350 400
Dry
ing
shri
nkag
e (m
icro
stra
in)
Age (days)
NWC OPSC
OPBC LECA
Univers
ity of
Mala
ya

168
McKeen & Ledbetter, 1969). A concrete without curing will show higher early-age
shrinkage and be prone to cracking. Therefore, it is important to keep moisture on
concrete surface for longer than few hours to slow down the drying process of the
concrete.
Table 7.3 shows the early-age drying shrinkage of all the prepared mixes. The OPSC,
OPBC and NW concretes showed lower early-age drying shrinkage under 7-days curing
compared to uncured concretes. The reduction on drying shrinkage due to curing in the
mix OPSC was higher than OPBC and NWC mixes. The results also confirm that the
curing time is essential to minimize the shrinkage at early ages for all concretes except
LECA lightweight concrete. Oliveira et al. (2015) reported that curing causes a lower
drying mass loss and causes a delaying effect in the development of shrinkage allowing
the natural strength development. However, the mix LECA showed higher shrinkage
value on average about 20% under 7-day moist curing compared to air drying. CCAA
(2005) reported that the insufficient bleeding on surface of concrete will increase the
early-age shrinkage and the tendency of the concrete to crack.
The long-term shrinkage strains of all the prepared mixes are shown in Table 7.4. It is
found that the cured specimens showed higher drying shrinkage than the air-dried
specimens. Neville (2008) and Mehta and Monteiro (2006) reported that after curing
period, the concrete is subjected to low relative humidity, which resulted a driving force
for moisture migration out of the material and causes volume reduction. Similarly,
swelling arises once there is increase in moisture content due to the absorption of water.
Therefore, due to the curing of the concrete, it resulted higher long-term drying shrinkage.
Univers
ity of
Mala
ya
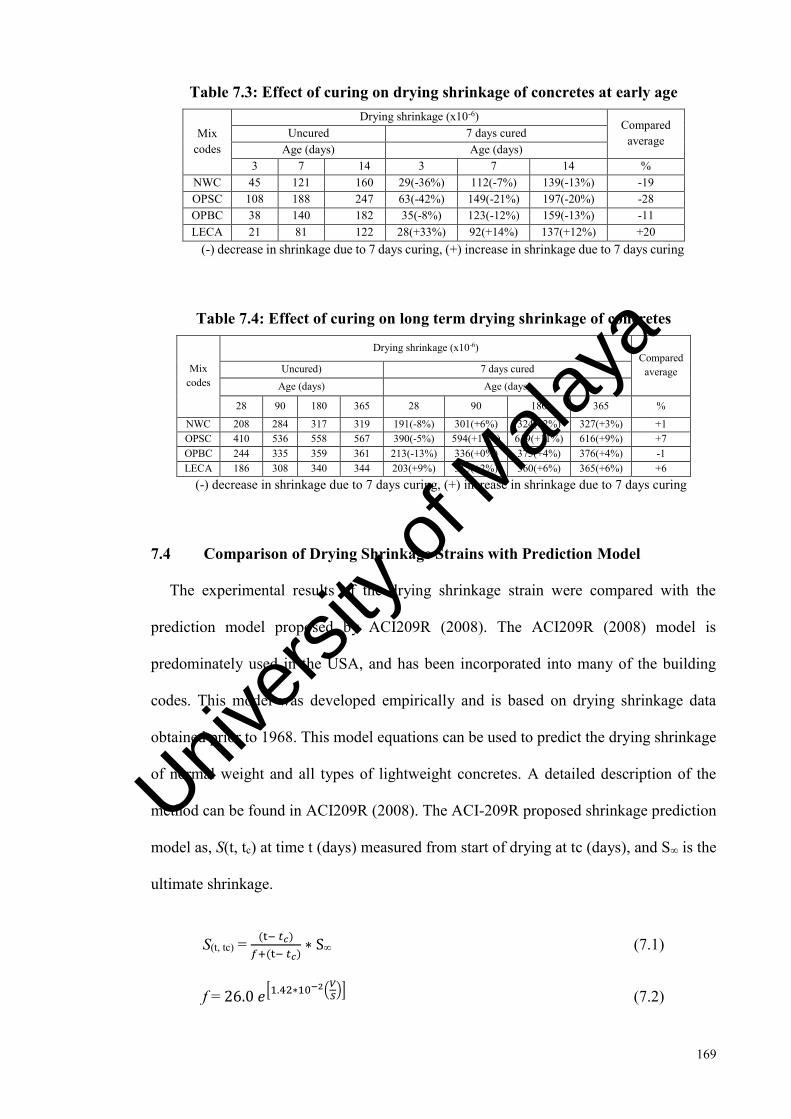
169
Table 7.3: Effect of curing on drying shrinkage of concretes at early age
Mix codes
Drying shrinkage (x10-6) Compared
average Uncured 7 days cured Age (days) Age (days)
3 7 14 3 7 14 % NWC 45 121 160 29(-36%) 112(-7%) 139(-13%) -19 OPSC 108 188 247 63(-42%) 149(-21%) 197(-20%) -28 OPBC 38 140 182 35(-8%) 123(-12%) 159(-13%) -11 LECA 21 81 122 28(+33%) 92(+14%) 137(+12%) +20
(-) decrease in shrinkage due to 7 days curing, (+) increase in shrinkage due to 7 days curing
Table 7.4: Effect of curing on long term drying shrinkage of concretes
Mix codes
Drying shrinkage (x10-6) Compared
average Uncured) 7 days cured Age (days) Age (days)
28 90 180 365 28 90 180 365 %
NWC 208 284 317 319 191(-8%) 301(+6%) 324(+2%) 327(+3%) +1 OPSC 410 536 558 567 390(-5%) 594(+11%) 619(+11%) 616(+9%) +7 OPBC 244 335 359 361 213(-13%) 336(+0%) 375(+4%) 376(+4%) -1 LECA 186 308 340 344 203(+9%) 315(+2%) 360(+6%) 365(+6%) +6
(-) decrease in shrinkage due to 7 days curing, (+) increase in shrinkage due to 7 days curing
7.4 Comparison of Drying Shrinkage Strains with Prediction Model
The experimental results of the drying shrinkage strain were compared with the
prediction model proposed by ACI209R (2008). The ACI209R (2008) model is
predominately used in the USA, and has been incorporated into many of the building
codes. This model was developed empirically and is based on drying shrinkage data
obtained prior to 1968. This model equations can be used to predict the drying shrinkage
of normal weight and all types of lightweight concretes. A detailed description of the
method can be found in ACI209R (2008). The ACI-209R proposed shrinkage prediction
model as, S(t, tc) at time t (days) measured from start of drying at tc (days), and S∞ is the
ultimate shrinkage.
S(t, tc) = (t− 𝑡𝑐)
𝑓+(t− 𝑡𝑐)∗ S∞ (7.1)
f = 26.0 𝑒[1.42∗10−2(𝑉
𝑆)] (7.2)
Univers
ity of
Mala
ya

170
S∞ = 780 x 10-6 (Ƴsh) (7.3)
Ƴsh = 𝐾1′ * 𝐾2
′ * 𝐾3
′ * 𝐾4′ * 𝐾5
′ * 𝐾6′ * 𝐾7
′ (7.4)
where, f is the compressive strength of the concrete in MPa. While to take into account
the size and geometry on the drying shrinkage of concrete specimens, the (𝑉
𝑆) is the
volume to surface area ratio. Where, Ƴsh represents the product of several factors that take
into account. 𝐾1′ is the curing time coefficient; 𝐾2
′ is the relative humidity coefficient; 𝐾3
′
depends on volume to surface area ratio; 𝐾4′ is the slump factor; 𝐾5
′ is the fine aggregate
ratio (fine aggregate to the total aggregates); 𝐾6′ is the cement content in kg/m3 and 𝐾7
′ is
the air content (%).
The average values were taken and development of shrinkage curve was plotted as can
be seen in Figure 7.6. It was observed that the mix OPSC showed very close shrinkage
results to the predicted results in early ages up to 14 days. However, in later ages, the
difference between the results was consistently increased, after one year of drying it was
about 30%. Whereas, the ACI-209R prediction model of shrinkage strain gave close
results to shrinkage values of the mixes NWC, OPBC and LECA in both early and later
ages. After 30 days, the mixes NWC, OPBC and LECA showed the difference between
experimental and predicted results of about 7%, 27% and 1%, respectively, however, after
one year of drying, these ratios were about 20%, 10% and 14%, respectively. Univers
ity of
Mala
ya
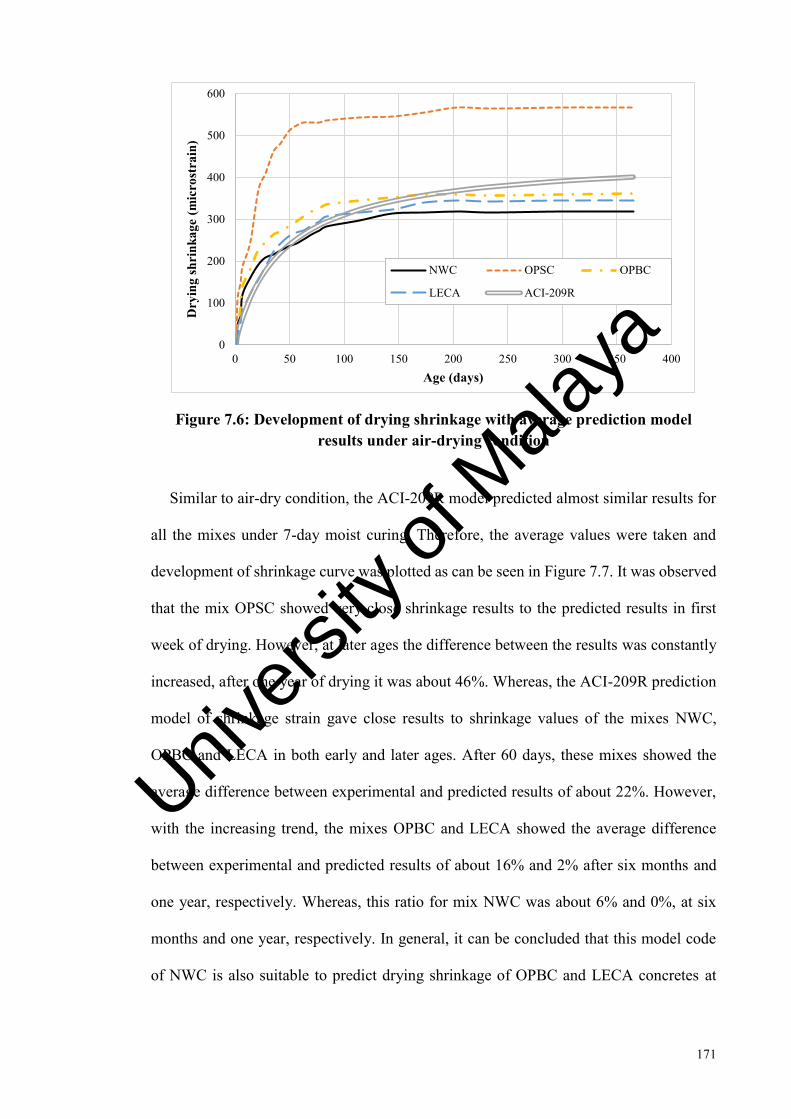
171
Figure 7.6: Development of drying shrinkage with average prediction model results under air-drying condition
Similar to air-dry condition, the ACI-209R model predicted almost similar results for
all the mixes under 7-day moist curing. Therefore, the average values were taken and
development of shrinkage curve was plotted as can be seen in Figure 7.7. It was observed
that the mix OPSC showed very close shrinkage results to the predicted results in first
week of drying. However, at later ages the difference between the results was constantly
increased, after one year of drying it was about 46%. Whereas, the ACI-209R prediction
model of shrinkage strain gave close results to shrinkage values of the mixes NWC,
OPBC and LECA in both early and later ages. After 60 days, these mixes showed the
average difference between experimental and predicted results of about 22%. However,
with the increasing trend, the mixes OPBC and LECA showed the average difference
between experimental and predicted results of about 16% and 2% after six months and
one year, respectively. Whereas, this ratio for mix NWC was about 6% and 0%, at six
months and one year, respectively. In general, it can be concluded that this model code
of NWC is also suitable to predict drying shrinkage of OPBC and LECA concretes at
0
100
200
300
400
500
600
0 50 100 150 200 250 300 350 400
Dry
ing
shri
nkag
e (m
icro
stra
in)
Age (days)
NWC OPSC OPBC
LECA ACI-209R
Univers
ity of
Mala
ya

172
short term and long term ages. However, for OPS concrete a new modified model can be
developed to predict the drying shrinkage.
Figure 7.7: Development of drying shrinkage with average predicted results
under 7-day moist cuing condition
7.5 Conclusions
The early-age and long-term drying shrinkage strain of the concretes containing
different types of aggregates were discussed. Based on the test results, the following
conclusions can be drawn:
1. In early ages, all the prepared lightweight concretes (OPSC, OPBCC and LECA
concrete) showed closer results of drying shrinkage to the conventional concrete
(NWC). Later at 56 days age, the OPSC showed significantly higher drying
shrinkage than the other concretes. Whereas, the OPBCC and LECA concrete
showed similar trend to the conventional concrete.
2. Long-term (after one year of drying), the OPS concrete on average showed 40%
higher drying shrinkage strains compared to the other concretes.
0
100
200
300
400
500
600
700
0 50 100 150 200 250 300 350 400
Dry
ing
shri
nkag
e (m
icro
stra
in)
Age (days)
NWC OPSC OPBC
LECA ACI-209R
Univers
ity of
Mala
ya

173
3. Compared to OPSC, the aggregates in other concrete mixes (OPBC, LECA and
NWC) showed better bonding with the cement paste in Interfacial Transaction
Zone (ITZ) and reduced the formation of micro-cracks, which resulted
significantly lower drying shrinkage strains.
4. OPSC showed significantly higher drying shrinkage results under 7-day moist
curing, which is about 47%, 41% and 39% higher than the shrinkages of mixes
NWC, LECA and OPBC, respectively. Whereas, the average difference between
the shrinkage values of NWC and OPBCC and LECA concretes was found in the
range of 10-13%.
5. The OPS, OPBC and conventional concrete shows lower early-age shrinkage
under 7-days curing, and the reduction in OPSC was higher than OPBCC and
NWC. This also confirm that the curing time is essential to minimize the shrinkage
at early ages. Whereas, in long-term shrinkage, the cured specimens showed
higher drying shrinkage than the uncured ones, and the average difference for
OPSC and LECA concretes was found almost similar of about 6%.
6. The ACI drying shrinkage prediction model estimated lower results for the OPS
concrete with the average difference of about 50%. However, for other concretes
(mixes NWC, OPBC and LECA), the ratio between the experimental and the
predicted results was found in the range of 20-30%.
Univers
ity of
Mala
ya

174
PREDICTION MODELS FOR DRYING SHRINKAGE IN PALM
OIL BY-PRODUCT LIGHTWEIGHT CONCRETES
8.1 Introduction
Among civil engineering materials, concrete is the only material that undergoes an
instantaneous deformation upon loading because of its hygroscopic nature and aging
(ACI 209R, 2005). “Shrinkage” can be defined as the decrease in length or volume of
hardened concrete with time, which is primarily due to moisture and chemical changes in
concrete (ACI 209R, 1997). Among several types of shrinkage, drying shrinkage plays
an extremely important role in the contraction of concrete because its driving force
removes adsorbed water from hydrated cement paste. Drying shrinkage in concrete
structures is critical particularly under severe climate conditions and seasonal fluctuations
in temperature and humidity. Sudden and continuous variations in temperature and
humidity create contraction/expansion cycles in concrete, which induces shrinkage and
thermal stresses leading to microcracking in concrete members (Asad, 1995).
The development of microcracks caused by deformation due to time-dependent
properties significantly reduces the safety margins, which majorly affects the service life
and durability of concrete structures (Bazant, Kim, & Panula, 1991; Boucherit, Kenai,
Kadri, & Khatib, 2014). The magnitude of shrinkage strains depends on several factors
such as relative humidity, type and quantity of binder, specimen size, water-to-binder
ratio, type and quantity of aggregates, curing conditions and mixing method. The
complexity of the subject is that the combined effect of the mix design parameters on the
equilibrium drying shrinkage of concrete is not well understood (Bazant, 2001; Young,
1988). Every increment in concrete shrinkage strain increases the deflection of a concrete
member, affects cracking progress, and causes loss of prestress (Sakata, Tsubaki, Inoue,
& Ayano, 2001). Moreover, the complexity of the phenomena including pressure of
Univers
ity of
Mala
ya

175
disjunction, capillary pressure, and surface tension and their effects on the properties of
cementing materials makes the establishment of a theoretical model difficult, which takes
into account all the factors influencing the drying shrinkage strain and their coupled
effects (Boucherit et al., 2014). Thus, to check the safety, durability and serviceability of
concrete structures, a means of predicting creep and shrinkage over the long term is highly
important (Sakata et al., 2001).
The shrinkage of the concrete is known to basically occur due to the contraction or
expansion of the cement paste in the mechanism, and this volumetric change can only be
opposed by the aggregates. Structural lightweight aggregate concrete (SLWAC) is
modified at these factors. This, SLWAC is expected to behave differently compared to
the normal weight concrete (NWC) (Bogas et al., 2014). First, the less rigid porous
aggregates decrease the restriction effect on the paste deformation (Aslam et al., 2016;
Zhang et al., 2005). Second, the lightweight concrete (LWC) is usually characterized by
larger volumes of better-quality paste and lower volume of coarse aggregates (Bogas,
2011; Holm & Bremner, 2000). Therefore, the long-term shrinkage of LWC should be
higher than that of NWC of the same grade. Although, some studies (Shafigh et al., 2014;
Wegen & Bijen, 1985) reported that the shrinkage of the lightweight aggregate concrete
(LWAC) is less than or similar to the shrinkage of NWC, for general design work, the
shrinkage of LWAC is suggested to be between 1.4 and 2 times that of NWC (Clarke,
2002).
Since the last few decades, the agricultural waste from the oil palm industry was
successfully utilized as a lightweight aggregate to produce green and sustainable
concretes. Previous studies (Aslam et al., 2016; Mannan et al., 2006; Shafigh et al., 2012)
reported that the oil palm shell (OPS) or palm kernel shell (PKS) can be used as a
lightweight aggregate (LWA) for producing structural LWAC with a density of 20-25%
Univers
ity of
Mala
ya
176
lower than the NWC and with good mechanical properties and durability properties.
However, this concrete has remarkably high drying shrinkage compared to artificial
lightweight and normal weight concretes. Aslam et al. (2016) investigated the drying
shrinkage of the OPS concrete by incorporating oil-palm-boiler clinker (OPBC) in the
OPS concrete. They reported that the contribution of OPBC in OPS concrete along with
the small reduction of water-to-cement significantly reduced the drying shrinkage
compared to control OPS concrete. Although several studies on the drying shrinkage of
the OPS and OPS-OPBC concretes are available in the literature, the prediction models
of these types of concretes still need further investigations. Therefore, in this study, 10
different drying shrinkage prediction models were selected from the literature to compare
the experimental and predicted results of the OPS and OPS-OPBC concretes.
8.2 Experimental Program
8.2.1 Materials and Mix Proportions
Ordinary Portland cement (OPC) of grade 48 conforming to Malaysian Standards (MS
522): Part 1: 2003 was selected as the cement in this investigation. The specific gravity
and the Blaine specific surface area of the cement were 3.14 and 3510 cm2/g, respectively.
The drinking water was utilized for mixing and curing the concrete specimens, whereas
the Sika ViscoCrete with a total chloride ion content of ≤ 0.1, which is compatible for all
types of cements according to British Standards (BS-5075), was used as super-plasticizer
(SP) to control the workability of the concrete.
The locally available agro-waste materials, such as OPS and OPBC, from the palm oil
industry were used as coarse aggregates. Both aggregates were stored at the open
atmosphere for approximately 6-8 months to properly dry them and remove the fibers
from the OPS surface. Then, the OPS aggregates were washed in the concrete mixer to
remove the oil and impurities from the surface, whereas, the OPBC aggregates were
Univers
ity of
Mala
ya

177
crushed using a crushing machine. The aggregates were sieved to achieve the same
grading. Locally available mining sand with a maximum grain size and fineness modulus
of 4.75 mm and 2.89, respectively, was used as a fine aggregate. Table 8.1 shows the
physical properties of the fine and coarse aggregates.
Three different lightweight concrete mixes were designed by using OPS and OPBC
lightweight aggregates. In all the mixes, the volume of aggregates, cement and SP
contents were kept constant. The details of the designed concrete mixes and the properties
of the concretes are shown in Table 8.2. The OPS concrete (mix P) was considered a
control concrete containing only agro-waste material. However, in the remaining mixes,
the OPS aggregate in mix P was partially replaced with inert OPBC material at 30% and
50% by volume. The main reason for the partial substitution of OPBC in OPS concretes
was to identify the blended effect of these aggregates on the drying shrinkage strain as
explained in other works (Aslam et al., 2016). However, in this study, the experimental
results of the drying shrinkage were compared with the shrinkage prediction model
results.
Table 8.1: Physical properties of the aggregates
Properties Fine aggregate Coarse aggregates
OPS OPBC Specific gravity 2.68 1.19 1.69
Density (compacted) (kg/m3) 1657 610 860 24-h water absorption (%) 1.2 20.5 7.0
Table 8.2: Concrete mix proportions
Mix code
Cement (kg/m3)
w/c ratio
SP (% cement)
Sand (kg/m3)
Coarse aggregate (kg/m3) Slump
(mm) Density (kg/m3)
28-day compressive
strength (MPa) OPS OPBC P 480 0.36 1 890 360 0 55 1790 36
C30 480 0.36 1 890 252 153 90 1833 43.5 C50 480 0.295 1 890 180 256 52 1940 51.5
Univers
ity of
Mala
ya

178
8.2.2 Test Methods and Specimen Sizes
The concrete mixes were prepared in the rotating drum mixer. Initially, all the
materials were weighed in dry condition, and the OPS and OPBC lightweight aggregates
were pre-soaked in water for 24 hours to control the effective water content of the
concrete. Then, the pre-soaked aggregates were air-dried in the laboratory environment
for 2-3 hours to obtain saturated surface dry condition. For each mix proportion, the
cement and aggregates were placed in the mixer and mixed for 2 minutes. Then, the
mixture of 70% mixing water with SP was added to the mixer, and mixing was continued
for another 3 minutes. After, the remaining water was added to the mixture, and mixing
was continued for another 5 minutes. Then, the fresh properties of the concretes were
measured (Table 8.2).
Two specimens with the size of 100 × 100 × 300 mm were prepared to measure the
drying shrinkage strains of all the designed concrete mixes. After moulding, the
specimens were covered with plastic sheets and stored in the laboratory atmosphere. After
demoulding and curing, the concrete samples were placed in the uncontrolled room. The
drying shrinkage strains were measured by demountable mechanical strain gauge
(DEMEC) with a resolution of 0.001 mm. The DEMEC points were fixed 200 mm apart
with V-tech 502 Super Glue on the three plain sides of the samples and placed in the
uncontrolled room for 1-2 hours, so that the applied glue becomes properly dry. Then the
initial readings were recorded by the equipment (gauge type PLR-60-11).
The specimens for the drying shrinkage of concretes were cured in water for 7 days.
Then, the samples were placed in an uncontrolled room in the laboratory. However, for
28-day compressive strength, the 100 mm cube specimens were placed in water until the
age of testing. The curing water has an average temperature of 22 ± 2oC, whereas the
Univers
ity of
Mala
ya
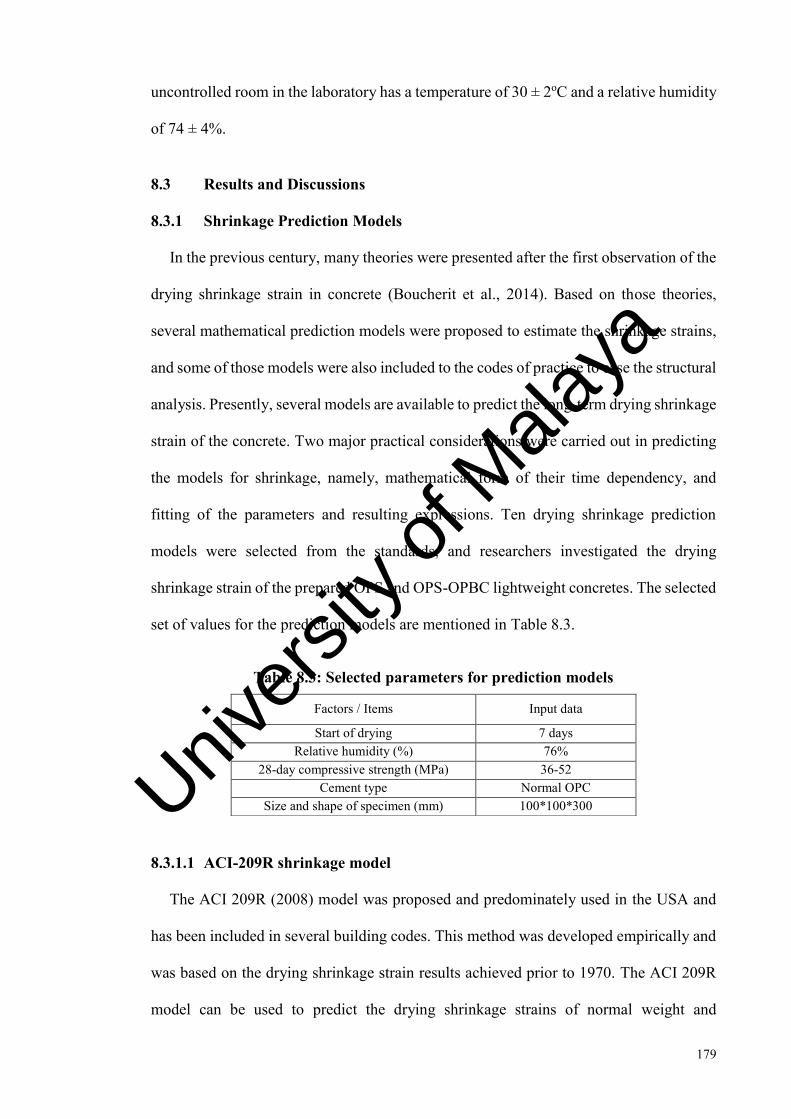
179
uncontrolled room in the laboratory has a temperature of 30 ± 2oC and a relative humidity
of 74 ± 4%.
8.3 Results and Discussions
8.3.1 Shrinkage Prediction Models
In the previous century, many theories were presented after the first observation of the
drying shrinkage strain in concrete (Boucherit et al., 2014). Based on those theories,
several mathematical prediction models were proposed to estimate the shrinkage strains,
and some of those models were also included to the codes of practice to ease the structural
analysis. Presently, several models are available to predict the long-term drying shrinkage
strain of the concrete. Two major practical considerations were carried out in predicting
the models for shrinkage, namely, mathematical form of their time dependency, and
fitting of the parameters and resulting expressions. Ten drying shrinkage prediction
models were selected from the standards, and researchers investigated the drying
shrinkage strain of the prepared OPS and OPS-OPBC lightweight concretes. The selected
set of values for the prediction models are mentioned in Table 8.3.
Table 8.3: Selected parameters for prediction models
Factors / Items Input data
Start of drying 7 days Relative humidity (%) 76%
28-day compressive strength (MPa) 36-52 Cement type Normal OPC
Size and shape of specimen (mm) 100*100*300
8.3.1.1 ACI-209R shrinkage model
The ACI 209R (2008) model was proposed and predominately used in the USA and
has been included in several building codes. This method was developed empirically and
was based on the drying shrinkage strain results achieved prior to 1970. The ACI 209R
model can be used to predict the drying shrinkage strains of normal weight and
Univers
ity of
Mala
ya

180
lightweight concretes with low to moderate strength, under controlled exposure
conditions. The expressions are empirically based and do not model shrinkage
phenomena. This document does not provide any coefficient to penalize the long-term
shrinkage of LWC. The ACI-209R proposed shrinkage prediction model as, S(t, tc) at
time “t” (days) measured from the start of drying at “tc” (days), and S∞ is the ultimate
shrinkage, as can be seen in Equations 8.1 to 8.4.
S(t, tc) = (t− 𝑡𝑐)
𝑓+(t− 𝑡𝑐)∗ S∞ (8.1)
f = 26.0 ∗ 𝑒[1.42∗10−2(𝑉
𝑆)] (8.2)
S∞ = 780 x 10-6 * (Ƴsh) (8.3)
Ƴsh = 𝐾1′ * 𝐾2
′ * 𝐾3
′ * 𝐾4′ * 𝐾5
′ * 𝐾6′ * 𝐾7
′ (8.4)
where, f = 35 for concrete water-cured for 7 days to take into account the size and
geometry on the drying of concrete specimens and (𝑉
𝑆) is the volume to surface area ratio.
The Ƴsh represents the product of several factors that take into account. 𝐾1′ is the curing
time coefficient, 𝐾2′ is the relative humidity coefficient, 𝐾3
′ depends on volume to surface
area ratio, 𝐾4′ is the slump factor, 𝐾5
′ is the fine aggregate ratio (fine aggregate to the total
aggregates), 𝐾6′ is the cement content in kg/m3 and 𝐾7
′ is the air content (%). As can be
seen in Table 8.4, the ACI209R (2008) is only the model which covers almost all types
of factors that has a direct or indirect effect on the drying shrinkage of the concrete.
Univers
ity of
Mala
ya

181
Table 8.4: Selected factors for the prediction of drying shrinkage
Factors Drying shrinkage prediction models
ACI-209R EN1992 MC2010 CEB/FIP AASHTO GL2000 AS3600 JSCE B3 SAK
Compressive strength (MPa)
* * * * * * * * * *
Curing factor * - - - * - - * * - Relative humidity * * * * * * - * * *
Volume to surface area ratio (v/s)
* - - * * * - - * *
Slump factor * - - - - - - - - - Fine agg. to
total aggregate (Af /A)
* - - - - - - * - -
Cement type factor * * * * - * - * * *
Water - - - - - - - - - * Air content
factor * - - - - - - - - -
Cross-section - * * * * * * * * * Environmental - - - - * - * * - -
Lightweight concrete
factor - * * - - - - - - -
The development of the drying shrinkage strain and the ACI predicted value trend are
shown in Figure 8.1. Based on the predicted values, the ACI model estimated almost the
same results for all the prepared concrete mixes. However, each mix has different
properties and was applied in the prediction model. Therefore, the average values were
taken and plotted as shown in figure 8.1. After the first week of drying, the predicted
results were found similar to the experimental results. By contrast, as the drying period
increases, the predicted model under-estimated the values. After one year of drying, the
ACI model predicted values were approximately 47%, 37%, and 18% lower than the
experimental values for the mixes P, C30, and C50, respectively.
Univers
ity of
Mala
ya
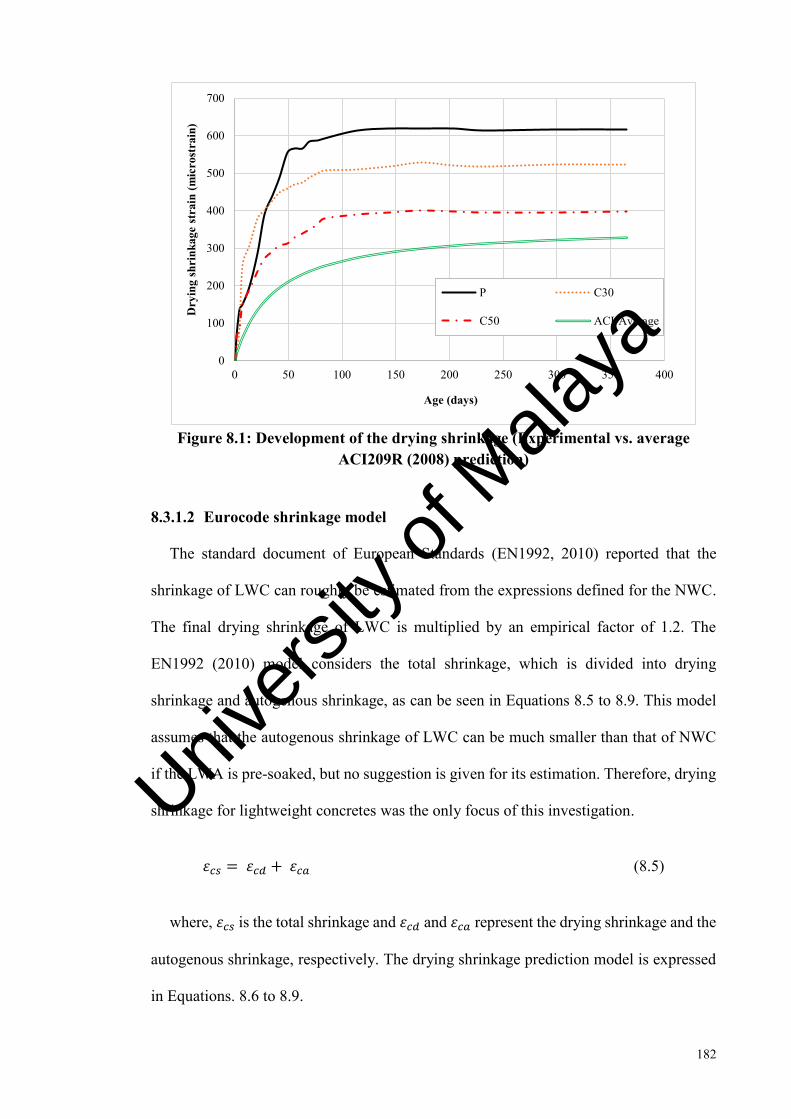
182
Figure 8.1: Development of the drying shrinkage (Experimental vs. average
ACI209R (2008) prediction)
8.3.1.2 Eurocode shrinkage model
The standard document of European Standards (EN1992, 2010) reported that the
shrinkage of LWC can roughly be estimated from the expressions defined for the NWC.
The final drying shrinkage of LWC is multiplied by an empirical factor of 1.2. The
EN1992 (2010) model considers the total shrinkage, which is divided into drying
shrinkage and autogenous shrinkage, as can be seen in Equations 8.5 to 8.9. This model
assumes that the autogenous shrinkage of LWC can be much smaller than that of NWC
if the LWA is pre-soaked, but no suggestion is given for its estimation. Therefore, drying
shrinkage for lightweight concretes was the only focus of this investigation.
𝜀𝑐𝑠 = 𝜀𝑐𝑑 + 𝜀𝑐𝑎 (8.5)
where, 𝜀𝑐𝑠 is the total shrinkage and 𝜀𝑐𝑑 and 𝜀𝑐𝑎 represent the drying shrinkage and the
autogenous shrinkage, respectively. The drying shrinkage prediction model is expressed
in Equations. 8.6 to 8.9.
0
100
200
300
400
500
600
700
0 50 100 150 200 250 300 350 400
Dry
ing
shri
nkag
e st
rain
(mic
rost
rain
)
Age (days)
P C30
C50 ACI-Average
Univers
ity of
Mala
ya
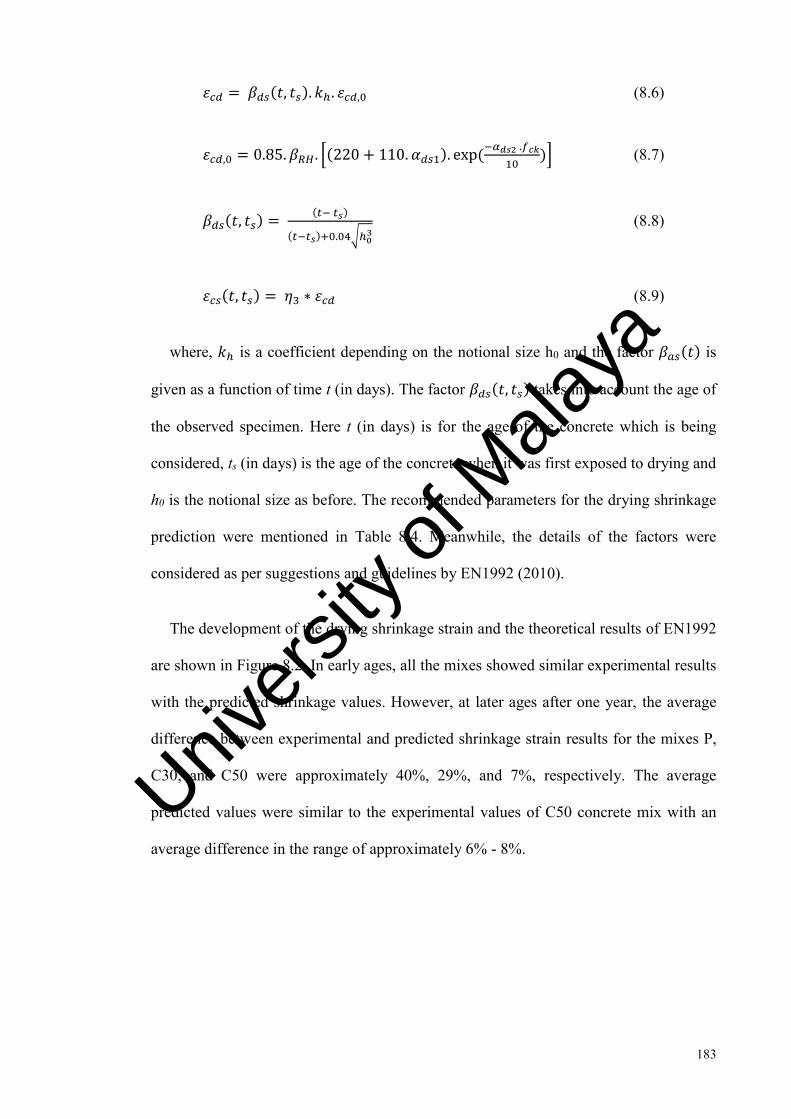
183
𝜀𝑐𝑑 = 𝛽𝑑𝑠(𝑡, 𝑡𝑠). 𝑘ℎ. 𝜀𝑐𝑑,0 (8.6)
𝜀𝑐𝑑,0 = 0.85. 𝛽𝑅𝐻. [(220 + 110. 𝛼𝑑𝑠1). exp (−𝛼𝑑𝑠2 .𝑓𝑐𝑘
10)] (8.7)
𝛽𝑑𝑠(𝑡, 𝑡𝑠) = (𝑡− 𝑡𝑠)
(𝑡−𝑡𝑠)+0.04√ℎ03 (8.8)
𝜀𝑐𝑠(𝑡, 𝑡𝑠) = 𝜂3 ∗ 𝜀𝑐𝑑 (8.9)
where, 𝑘ℎ is a coefficient depending on the notional size h0 and the factor 𝛽𝑎𝑠(𝑡) is
given as a function of time t (in days). The factor 𝛽𝑑𝑠(𝑡, 𝑡𝑠) takes into account the age of
the observed specimen. Here t (in days) is for the age of the concrete which is being
considered, ts (in days) is the age of the concrete when it was first exposed to drying and
h0 is the notional size as before. The recommended parameters for the drying shrinkage
prediction were mentioned in Table 8.4. Meanwhile, the details of the factors were
considered as per suggestions and guidelines by EN1992 (2010).
The development of the drying shrinkage strain and the theoretical results of EN1992
are shown in Figure 8.2. In early ages, all the mixes showed similar experimental results
with the predicted shrinkage values. However, at later ages after one year, the average
difference between experimental and predicted shrinkage strain results for the mixes P,
C30, and C50 were approximately 40%, 29%, and 7%, respectively. The average
predicted values were similar to the experimental values of C50 concrete mix with an
average difference in the range of approximately 6% - 8%.
Univers
ity of
Mala
ya

184
Figure 8.2: Development of drying shrinkage (Experimental and average
EN1992 (2010) prediction)
8.3.1.3 Model Code 2010 shrinkage model
Similar to EN1992 (2010), the Model Code (MC) 2010 (2011) also reported that the
shrinkage of LWC can be estimated from the equations proposed for the conventional
concrete by multiplying an empirical factor of 1.2. This model also focuses on the total
shrinkage, which contains both drying and autogenous shrinkages. However, the
autogenous shrinkage of LWC is assumed to be much smaller than that of NWC if the
LWA is pre-soaked, but no suggestion is given for its estimation. The detailed equations
proposed by the MC 2010 (2011) model for the total shrinkage actually considered drying
shrinkage and autogenous shrinkage, as shown in Equations 8.10 to 8.14.
𝜀𝑐𝑠(𝑡, 𝑡𝑠) = 𝜀𝑐𝑑 + 𝜀𝑐𝑎 (8.10)
where, 𝜀𝑐𝑠 (𝑡, 𝑡𝑠) is the total shrinkage strain between the age (t) and beginning of
drying (ts); and 𝜀𝑐𝑑 and 𝜀𝑐𝑎 represent the drying shrinkage and the autogenous shrinkage
accordingly. The recommended parameters for the drying shrinkage prediction were
mentioned in Table 8.4. The drying shrinkage is expressed as follows;
0
100
200
300
400
500
600
700
0 50 100 150 200 250 300 350 400
Dry
ing
shri
nkag
e (m
icro
-str
ain)
Age (days)
P C30
C50 Average EN1992
Univers
ity of
Mala
ya

185
𝜀𝑐𝑑(𝑡) = 𝛽𝑑𝑠(𝑡, 𝑡𝑠). 𝛽𝑅𝐻. 𝜀𝑐𝑑,0 (8.11)
𝜀𝑐𝑑,0 = [(220 + 110. 𝛼𝑑𝑠1). exp (−𝛼𝑑𝑠2 .𝑓𝑐𝑘
10)] (8.12)
𝛽𝑑𝑠(𝑡, 𝑡𝑠) = [(𝑡− 𝑡𝑠)
(𝑡−𝑡𝑠)+0.035 ℎ02]
0.5
(8.13)
𝜀𝑐𝑠(𝑡, 𝑡𝑠) = ɳ ∗ 𝜀𝑐𝑑 (8.14)
where, 𝑘ℎ is a coefficient depending on the notional size h0. The factor 𝛽𝑑𝑠(𝑡, 𝑡𝑠) takes
into account the age of the observed specimen. Here t (in days) is for the age of the
concrete which is being considered, ts (in days) is the age of the concrete when it was first
exposed to drying and h0 is the notional size as before. The autogenous part of the
shrinkage is defined as follows by the standard was calculated from the compressive
strength. And the factor 𝛽𝑎𝑠(𝑡) is given as a function of time t (in days).
The development of the drying shrinkage strain and the theoretical results by MC 2010
are shown in Figure 8.3. The MC 2010 model predicted highly similar results for all the
concrete mixes. Therefore, the average values were selected and plotted as shown in
figure 8.3. In early ages up to 14 days, the predicted results of shrinkage were almost
similar to the experimental results. However, at later ages after year of drying, the ratio
between the experimental and predicted results was higher, which was approximately
34% for mix P and 22.5% for mix C30, whereas the mix C50 showed almost similar
experimental results to the predicted results.
Univers
ity of
Mala
ya

186
Figure 8.3: Development of drying shrinkage (Experimental and average
MC2010 (2011) prediction)
8.3.1.4 CEB/FIP90 shrinkage model
Europeans typically use the prediction method developed in 1990 by the Comité Euro-
International du Béton (CEB). The CEB/FIP90 (2001) model was derived using
mathematical functions instead of tables and figures and has been optimized from
information from a data bank of structural concrete. This model predicts the time
dependent deformation of ordinary normal-weight concrete exposed to a temperature
range of 5 °C and 30 °C and a relative humidity of 40% to 100%. The CEB/FIP90 model
proposed Equations 8.15 to 8.18 of the drying shrinkage model which are as follows:
𝜀𝑠(𝑡 − 𝑡𝑜) = 𝜀𝑠𝑜 ∗ 𝛽𝑠(𝑡 − 𝑡𝑜) (8.15)
𝜀𝑠𝑜 = [160 + 10. 𝛽𝑠𝑐 (9 −𝑓𝑐
′
10) . 𝛽𝑅𝑀 (8.16)
𝛽𝑠(𝑡, 𝑡𝑜) = [(𝑡− 𝑡𝑜)
𝛽𝑆𝐻+(𝑡−𝑡𝑜)]
0.5
(8.17)
0
100
200
300
400
500
600
700
0 50 100 150 200 250 300 350 400
Dry
ing
shri
nkag
e (m
icro
-str
ain)
Age (days)
P C30
C50 Average MC10
Univers
ity of
Mala
ya

187
𝛽𝑆𝐻 = 350 ∗ [2∗
𝐴𝑐𝜇⁄
100]
2
(8.18)
where; 𝜀𝑠 is drying shrinkage of the concrete, 𝑡 is the age of concrete in days, 𝑡𝑜 is age
of concrete at beginning of drying in days, 𝜀𝑠𝑜 is the notional shrinkage coefficient, 𝛽𝑠𝑐
is the cement type factor, fc’ is the 28-day compressive strength, h is the relative humidity
in decimals, Ac is the cross-sectional area in (mm2), and μ is the exposed perimeter (mm)
of the sample. The recommended parameters for the drying shrinkage prediction were
mentioned in Table 8.4.
The development of the drying shrinkage strain and the theoretical results by
CEB/FIP90 model are shown in Figure 8.4. The CEB/FIP90 model predicted highly
similar results for all the concrete mixes. Therefore, the average values were selected and
plotted as shown in figure 8.4. In early ages up to 21 days, the predicted results of
shrinkage were almost similar to the experimental results. However, at later ages after
year of drying, the ratio between the experimental and predicted results was higher, which
was approximately 45% for mix P, 35% for mix C30, and 14% for mix C50.
Univers
ity of
Mala
ya

188
Figure 8.4: Development of drying shrinkage (Experimental and average
CEB/FIP90 (2001) prediction)
8.3.1.5 AASHTO-LRFD shrinkage model as modified by Shams and Kahn (2000)
AASHTO-LRFD (2004) general expression for shrinkage is similar to the ACI209R
(2008) method including the values for f as 35 and 55 for moist and steam-cured
concretes, respectively. The expression for calculating ultimate shrinkage is different
from ACI expression and contains slightly different correction factors. Shams and Kahn
(2000) proposed some changes to AASHTO-LRFD creep and shrinkage expression to
better predict long-term strains of the concretes.
ɛ𝑠ℎ(𝑡−𝑡0)= ɛ𝑠ℎ∞ ∗ 𝑘𝑣𝑠 ∗ 𝑘𝐻′ ∗ 𝑘𝑡0
′ ∗ [(t− 𝑡0)
𝑓+(t− 𝑡0)]
0.5
(8.19)
where, ɛ𝑠ℎ(𝑡−𝑡0) is the drying shrinkage strain, ɛ𝑠ℎ∞ is the ultimate shrinkage strain,
𝑘𝑣𝑠 is the size factor, 𝑘𝐻′ is the ambient relative humidity factor, 𝑘𝑡0
′ is factor for maturity
at the beginning of drying and f is the compressive strength of concrete. The
recommended parameters for the drying shrinkage prediction were mentioned in Table
8.4.
0
100
200
300
400
500
600
700
0 50 100 150 200 250 300 350 400
Dry
ing
shri
nkag
e (m
icro
-str
ain)
Age (days)
P C30 C50 Average CEB-FIP90
Univers
ity of
Mala
ya

189
The development of the drying shrinkage strain and the theoretical results are shown
in Figure 8.5. As shown in the figure, in the first month of drying, the predicted results of
shrinkage were found similar to the experimental results. However, at later ages after year
of drying, the model predicted better results as it underestimated the predicted results for
mixes P and C30 of approximately 28% and 15%, respectively, compared to the
experimental shrinkage results. However, for the C50 mix, the estimations were
approximately 11% higher than the experimental results.
Figure 8.5: Development of drying shrinkage (Experimental and average
AASHTO-LRFD (Shams & Kahn, 2000) prediction)
8.3.1.6 Gardner and Lockman (GL2000) shrinkage model
Gardner and Lockman (2001) proposed the GL2000 model to predict the shrinkage
strains of the concrete. This model is effective in predicting the shrinkage of normal-
strength concretes with a 28-day compressive strength of less than 82 MPa and water-to-
cement ratio ranging from 0.4 to 0.6. They reported that this model can be used to
accurately predict the shrinkage regardless of which mineral by-products, admixtures,
casting temperature, or curing regime is considered. However, this model assumes that
the shrinkage strains reduce with the increase of compressive strength and modulus
0
100
200
300
400
500
600
700
0 50 100 150 200 250 300 350 400
Dry
ing
shri
nkag
e (m
icro
-str
ain)
Age (days)
P
C30
C50
Average - AASHTO
Univers
ity of
Mala
ya

190
elasticity. The detailed expressions of this model for the prediction of drying shrinkage
strain are explained below.
𝜀𝑠ℎ(𝑡, 𝑡0) = 𝜀𝑠ℎ𝑢 ∗ (1 − 1.18 ∗ ℎ4) ∗ [(𝑡−𝑡0)
(𝑡−𝑡0)+0.15∗(𝑉𝑆⁄ )2
]1/2
(8.20)
𝜀𝑠ℎ𝑢 = 1000 ∗ 𝐾 ∗ (30
𝑓𝑐′)
1
2∗ 10−6 (8.21)
where, 𝜀𝑠ℎ is the shrinkage strain, 𝜀𝑠ℎ𝑢 is the ultimate shrinkage strain, 𝑓𝑐′ is 28-day
compressive strength (MPa), h is the relative humidity in decimals, V is the specimen
volume (mm3) and S is the surface area of the specimen surface (mm2). The recommended
parameters for the drying shrinkage prediction were mentioned in Table 8.4.
The development of the drying shrinkage strain and the theoretical results are shown
in Figure 8.6. As shown in the figure, in the first 30 days of drying, the predicted results
of shrinkage were found similar to the experimental results. Therefore, the average values
were selected from the predicted results and are plotted in figure 8.6. In the first 7 days
of drying, the predicted results of shrinkage were found similar to the experimental results
for all the mixes, whereas, the similar values were achieved up to 21 days for mixes P and
C50. However, the model predicted the same trend of shrinkages for C50 concrete up to
120 days of drying. Then the theoretical values were overestimated and the trend steadily
increased. At later ages after year of drying, the model predicted better results as it
underestimated the predicted results for mixes P and C30 by approximately 25% and
11%, respectively, compared to the experimental shrinkage results. However, for the mix
C50, the estimations were approximately 14% higher than the experimental results.
Univers
ity of
Mala
ya

191
Figure 8.6: Development of drying shrinkage (Experimental and average
GL2000 predictions)
8.3.1.7 Australian Standards model for shrinkage prediction
Australian Standards (AS) 3600 (2001) model reported that the design shrinkage for
the normal-strength concrete (≤ 50 MPa) can be calculated at any time after the beginning
of drying by using some basic equations. However, the proposed method in the AS 3600
that aims to predict the shrinkage strain was revised and extended to include high-strength
concrete (HSC) where the causes, magnitudes, mechanisms, and rates of the development
of shrinkage are significantly different than the normal-strength concrete. Gilbert (1998)
proposed the modified version of shrinkage prediction model for normal- and high-
strength concretes. This model considers the total shrinkage strain (εcs) and was divided
into two components, endogenous shrinkage (εcse) and drying shrinkage (εcsd). The
detailed specifications of this model can be found from the original source (Gilbert, 2002).
Moreover, the important expressions and equations of this model are shown below.
ɛ𝑐𝑠 = ɛ𝑐𝑠𝑒 + ɛ𝑐𝑠𝑑 (8.22)
0
100
200
300
400
500
600
700
0 50 100 150 200 250 300 350 400
Dry
ing
shri
nkag
e (m
icro
-str
ain)
Age (days)
P
C30
C50
Average - GL2000
Univers
ity of
Mala
ya

192
where, ɛ𝑐𝑠 is the total shrinkage strain, ɛ𝑐𝑠𝑒 + ɛ𝑐𝑠𝑑 are the endogenous and drying
shrinkages, respectively. Whereas, the drying shrinkage at any time “t” (in days) after the
commencement of drying can be computed by using the expression as;
ɛ𝑐𝑠𝑑 = 𝑘1 ∗ 𝑘4 ∗ ɛ𝑐𝑠𝑑,𝑏 (8.23)
The basic drying shrinkage ɛ𝑐𝑠𝑑,𝑏 is given by:
ɛ𝑐𝑠𝑑,𝑏 = (1.0 − 0.008𝑓𝑐′) ɛ𝑐𝑠𝑑,𝑏
∗ (8.24)
where, fc’ is 28-day compressive strength (MPa), ɛ𝑐𝑠𝑑,𝑏∗ is the shrinkage of the
aggregates depends on the quality of the local aggregates and may be taken as 800*10-6
for Sydney and Brisbane, 900*10-6 for Melbourne and 1000*10-6 elsewhere. The
recommended parameters for the drying shrinkage prediction were mentioned in Table
8.4.
The relationship between the experimental and predicted drying shrinkage results with
the respective age is shown in Figure 8.7. For mix P, the predicted results were almost
similar to the experimental values in the first 30 days. Consequently, the prediction model
underestimated the shrinkage results up to 10 months. Then the model predicted similar
results with an average difference of approximately 6%, whereas, the AS3600 model
predicted almost the same trend of the shrinkage results for the mix C30 with an accuracy
of approximately 100%. For mix C50, in the early ages, the predicted results were found
similar to the experimental values. However, at later ages, the results were overestimated
with an average difference of approximately 17% after one year of drying.
Univers
ity of
Mala
ya

193
Figure 8.7: Development of drying shrinkage (Experimental and AS3600 model
predictions)
8.3.1.8 Japan Standards 3600 shrinkage prediction model
Japan Standards (JSCE, 2007) described that the shrinkages of concrete were affected
by the properties of the cement and aggregate, compaction and curing of concretes,
temperature and relative humidity around structures, shape of the structural member, and
the mix proportions of the concrete. Generally, the shrinkage strain of concrete used for
confirmation purposes must be determined on the basis of the experimental data.
However, if no such data are available, then the shrinkage strains can be calculated by
using the following equations.
This code further explained that the relative humidity and size of the member strongly
affect the rate and the magnitude of the shrinkage strain, which can normally be estimated
using equation 25 for NWC with the compressive strength range of about 55 - 70 MPa.
The recommended parameters for the drying shrinkage prediction were mentioned in
Table 8.4. The detailed equations proposed by this standard are as follows:
ɛ𝑐𝑠′ (𝑡, 𝑡0) = [1 − exp{−0.018(𝑡 − 𝑡0)0.56}] ∗ ɛ𝑠ℎ
′ (8.25)
0
100
200
300
400
500
600
700
0 50 100 150 200 250 300 350 400
Dry
ing
shri
nkag
e (m
icro
-str
ain)
Age (days)
P C30
C50 AS3600-P
AS3600-C30 AS3600-C50
Univers
ity of
Mala
ya
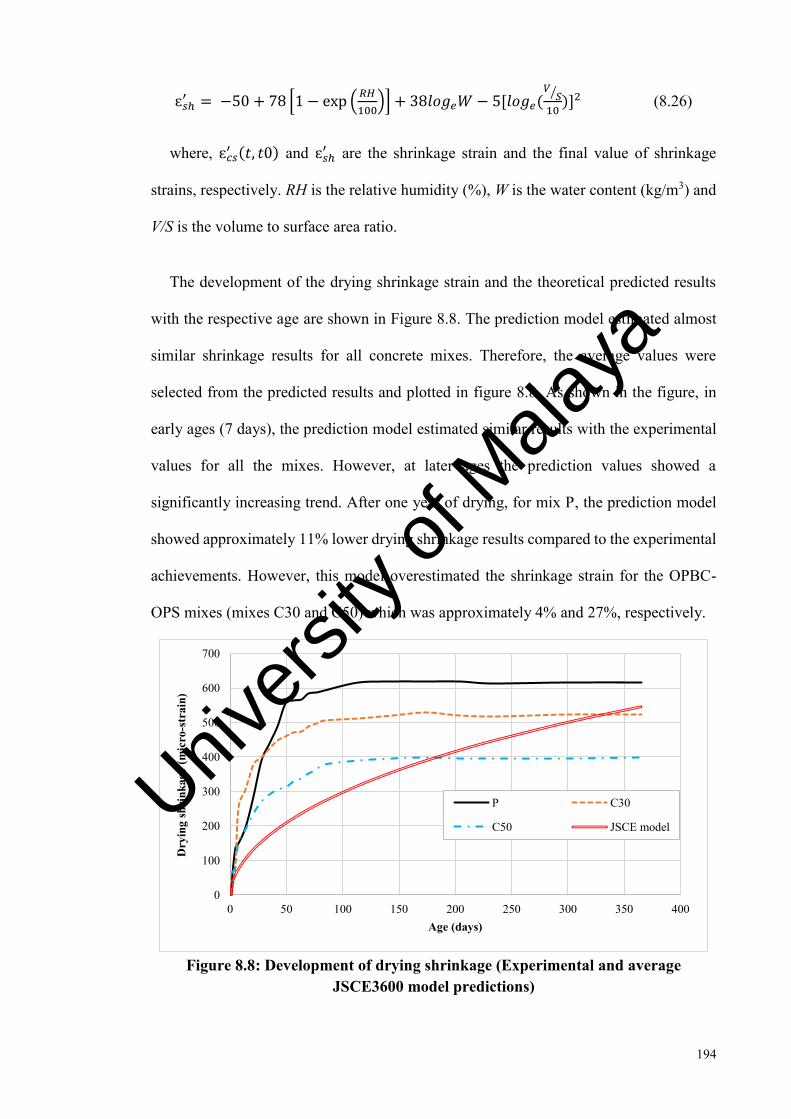
194
ɛ𝑠ℎ′ = −50 + 78 [1 − exp (
𝑅𝐻
100)] + 38𝑙𝑜𝑔𝑒𝑊 − 5[𝑙𝑜𝑔𝑒(
𝑉𝑆⁄
10)]2 (8.26)
where, ɛ𝑐𝑠′ (𝑡, 𝑡0) and ɛ𝑠ℎ
′ are the shrinkage strain and the final value of shrinkage
strains, respectively. RH is the relative humidity (%), W is the water content (kg/m3) and
V/S is the volume to surface area ratio.
The development of the drying shrinkage strain and the theoretical predicted results
with the respective age are shown in Figure 8.8. The prediction model estimated almost
similar shrinkage results for all concrete mixes. Therefore, the average values were
selected from the predicted results and plotted in figure 8.8. As shown in the figure, in
early ages (7 days), the prediction model estimated similar results with the experimental
values for all the mixes. However, at later ages the prediction values showed a
significantly increasing trend. After one year of drying, for mix P, the prediction model
showed approximately 11% lower drying shrinkage results compared to the experimental
achievements. However, this model overestimated the shrinkage strain for the OPBC-
OPS mixes (mixes C30 and C50) which was approximately 4% and 27%, respectively.
Figure 8.8: Development of drying shrinkage (Experimental and average
JSCE3600 model predictions)
0
100
200
300
400
500
600
700
0 50 100 150 200 250 300 350 400
Dry
ing
shri
nkag
e (m
icro
-str
ain)
Age (days)
P C30
C50 JSCE modelUnivers
ity of
Mala
ya
195
8.3.1.9 Sakata shrinkage prediction model
Sakata et al. (2001) developed an exponential model (SAK) for the drying shrinkage
strain. The presented model was based on several parameters such as member geometry,
relative humidity, cement, and water contents. The prediction model works for a wide
range of compressive strengths. The main source of the date used in establishing the new
prediction equations was the shrinkage data collected by RILEM and JSCE. The RILEM
database holds data consisting of 419 shrinkage records (RILEM, 1999), whereas, the
JSCE database contains 219 shrinkage records. The RILEM database consists mainly of
data from the western countries, whereas the JSCE has collected data from papers
published by Japanese organizations. The proposed prediction equations for the drying
shrinkage strain are as follows:
𝜀𝑠ℎ(𝑡, 𝑡0) = ɛ𝑠ℎ∞∗(𝑡−𝑡0)
𝛽+(𝑡−𝑡0) (8.27)
𝜀𝑠ℎ∞ = ɛ𝑠ℎ𝜌
1+𝜂∗𝑡0 (8.28)
𝜀𝑠ℎ𝜌 = 𝛼 (1−ℎ)𝑊
1+150exp {−500
𝑓𝑐′ (28)
} (8.29)
where, 𝜀𝑠ℎ(𝑡, 𝑡0) is the drying shrinkage strain, t, t0 is the current age and age at drying
(days), 𝜀𝑠ℎ∞ is the ultimate shrinkage strain, 𝑓𝑐′(28) is the 28-day compressive strength
(MPa), h is the relative humidity of the atmosphere, W is the unit water content (kg/m3)
and α is the factor for type of cement. The recommended parameters for the drying
shrinkage prediction were mentioned in Table 8.4.
The relationship of the experimental and predicted drying shrinkage results with the
respective age are shown in Figure 8.9. The prediction model estimated almost similar
shrinkage results for all concrete mixes. Therefore, the average values were selected from
the predicted results and plotted in figure 8.9. The SAK model estimated similar early age
Univers
ity of
Mala
ya

196
results with the experimental values for all the mixes. However, the model showed highly
similar strong relationship with the experimental results of the C50 concrete mixture,
whereas the predicted results were on average approximately 35% and 21% lower than
the experimental shrinkage results for mixes P and C30, respectively.
Figure 8.9: Development of drying shrinkage (Experimental and average SAK
model predictions)
8.3.1.10 Bazant and Baweja shrinkage model
The B3 model developed by Bazant and Baweja is a better theoretically justified model
than other proposed models (Bazant & Baweja, 2000; Recommendation & DE LA
RILEM, 1995). The model is based on “a systematic theoretical formulation of the basic
physical phenomena involved” and was “calibrated by a computerized data bank
comprising practically all the relevant test data obtained in various laboratories
throughout the world”. Bazant and Baweja (2000) stated that the coefficient of variations
for the B3 model is much lower than the ACI209R model and EN1992 model. The
detailed expressions of this model are shown as follows:
0
100
200
300
400
500
600
700
0 50 100 150 200 250 300 350 400
Dry
ing
shri
nkag
e (m
icro
-str
ain)
Age (days)
P C30
C50 SAK - Average
Univers
ity of
Mala
ya

197
𝜀𝑠ℎ(𝑡, 𝑡0) = −𝜀𝑠ℎ∞ ∗ 𝑘ℎ ∗ tan ℎ √𝑡−𝑡0
𝜏𝑠ℎ (8.30)
𝜀𝑠ℎ∞ = −𝛼1 ∗ 𝛼2 ∗ [0.00856 ∗ 𝑤2.1 ∗ (145 ∗ 𝑓𝑐′)−0.28 + 270] ∗
(607
4+0.85∗607)1/2
(𝑡0+𝜏𝑠ℎ
4+0.85∗(𝑡0+𝜏𝑠ℎ))1/2
(8.31)
where, 𝜀𝑠ℎ is the drying shrinkage strain, 𝜀𝑠ℎ∞ is the ultimate shrinkage strain, t is the
age of concrete (days), t0 is the age of concrete at the beginning of drying (days), α1 is the
cement type factor, α2 is the curing factor, w is the water content (kg/m3), 𝑓𝑐′ is the 28-day
compressive strength (MPa), 𝑘ℎ is the humidity dependent factor and 𝜏𝑠ℎ is the size and
shape dependent factor. The recommended parameters for the drying shrinkage prediction
were mentioned in Table 8.4.
The average prediction values were selected and compared with the experimental
drying shrinkage results with the respective ages, as shown in Figure 8.10. This model
predicted almost similar drying shrinkage results for all the mixes. In early ages (7 days),
the prediction model showed almost similar results to the experimental values for the
mixes. However, in the later ages, the model continuously underestimated the shrinkage
results. After one year of drying, the predicted results were approximately 77%, 68%, and
58% lower drying shrinkage values compared to the experimental results for mixes P,
C30, and C50, respectively.
Univers
ity of
Mala
ya

198
Figure 8.10: Development of drying shrinkage (Experimental and average B3
model predictions)
8.3.2 Accuracy of the Prediction Models
The development of the drying shrinkage strains for the OPS and OPS-OPBC concrete
mixes (mixes P, C30, and C50) is compared with 10 prediction models (ACI209R,
EN1992, MC2010, CEB/FIP1990, AASHTO-LRFD, GL2000, AS3600, JSCE3600, SAK
and B3) as shown in Figure 8.11, Figure 8.12, and Figure 8.13. As can be clearly seen in
the figures, in early ages, almost all the prediction equations estimated similar values to
the experimental results. However, at later ages, only few models showed similar results.
Therefore, to observe the accuracy of the prediction models for the prepared concrete
mixes, two analyses were performed: an error percentage analysis (EP) and coefficient of
variation (CV). For EP analysis, the residual values were calculated at the early age (14
days) and the long-term age (365 days) by considering the respective equations (Eq. 8.32).
Residual value = Predicted shrinkage value – Experimental shrinkage value (8.32)
0
100
200
300
400
500
600
700
0 100 200 300 400
Dry
ing
shri
nkag
e (m
icro
-str
ain)
Age (days)
P
C30
C50
Average - B3
Univers
ity of
Mala
ya

199
By contrast, the positive residual values indicate that the model overestimates the
experimental data, and the negative residual values specifies that the model
underestimates the experimental data (Khanzadeh, 2010). In the EP analysis, the model
with the minimum average error percentage can be considered the best predictor and the
best model for the CV test and thus is the model with the lowest value. The error
percentage analysis and the coefficient of variation were calculated as follows:
Error Percentage (EP) = (Residual value*100)/Experimental shrinkage value (8.33)
Coefficient of variation (CV) = Standard deviation / Mean (8.34)
Figure 8.11: Comparison of drying shrinkage of OPS concrete (mix P) to the
prediction models
0
100
200
300
400
500
600
700
0 50 100 150 200 250 300 350 400
Dry
ing
shri
nkag
e (m
icro
-str
ain)
Age (days)
Exp. Mix P
ACI209R
EN1992
MC2010
CEB1990
AASHTO
GL2000
AS3600
JSCE
B3
SAK
Univers
ity of
Mala
ya

200
Figure 8.12: Comparison of drying shrinkage of OPS-OPBC concrete (mix
C30) to the prediction models
Figure 8.13: Comparison of drying shrinkage of OPS-OPBC concrete (mix
C50) to the prediction models
0
100
200
300
400
500
600
0 100 200 300 400
Dry
ing
shri
nkag
e (m
icro
-str
ain)
Age (days)
Exp. Mix C30
ACI209R
EN1992
MC2010
CEB1990
AASHTO
GL2000
AS3600
JSCE
B3
SAK
0
100
200
300
400
500
600
0 100 200 300 400
Dry
ing
shri
nkag
e (m
icro
-str
ain)
Age (days)
Exp. Mix C50
ACI209R
EN1992
MC2010
CEB1990
AASHTO
GL2000
AS3600
JSCE
B3
SAKUnivers
ity of
Mala
ya

201
The summary of the error percentage and the coefficient of variation for all the mixes
in early ages are presented in Table 8.5 and Table 8.6, respectively. For OPS concrete
(mix P), based on the EP and CV tests, the EN1992 and MC2010 models were the best
predictors of the drying shrinkage, although the EN1992 model overestimated the results
and the MC2010 model underestimated the shrinkages. The ascending rank of the
remaining model predictions for the OPS concrete is ordered as GL2000, CEB/FIP, SAK,
AASHTO-LRFD, AS3600, JSCE, ACI209R and B3. On the contrary, for OPS-OPBC
concrete (mix C30), the models were selected based on the designed values of the EP and
CV. The AS3600 was found as the best predictor for the concrete in early ages. However,
the AASHTO model also predicted almost 90% similar results with the experimental
shrinkage values, although these models underestimated the shrinkage values. The
ascending rank of the remaining prediction models is ordered as CEB/FIP, GL2000,
EN1992, MC2010, SAK, JSCE, ACI209R and B3. In addition, in the analysis of the best
EP and CV, the prediction models for the OPS-OPBC concrete (C50) was observed. The
GL2000 model was found as the best indicator for the concrete with an accuracy of
approximately 100%, as shown in Table 8.6. However, the CEB/FIP and the EN1992
models predicted highly similar results with the experimental shrinkage values with an
accuracy of approximately 94%, whereas the remaining models predicted the shrinkage
results with the higher difference in the rank as MC2010, AASHTO-LRFD, SAK,
AS3600, JSCE, ACI209R and B3. In early ages, for all the three mixes, the ACI209R and
B3 models predicted lower results compared to the remaining models. This finding may
be due to the type of concretes and the aggregates, as these models were majorly proposed
for the normal weight concretes.
Univers
ity of
Mala
ya

202
Table 8.5: Error percentage analyses for the mixes at early-ages (14 days)
Mixes Prediction models
ACI209R EN1992 MC2010 CEB/FIP AASHTO GL2000 AS3600 JSCE SAK B3
P -50.25 5.07 -7.61 22.33 48.22 15.22 64.46 -45.68 -29.94 -67.51
C30 -65.03 -37.58 -45.09 -28.10 -11.11 -32.35 -3.26 -65.03 -55.22 -78.75
C50 -47.09 -7.40 -18.52 4.23 34.92 0.53 41.26 -43.38 -28.04 -65.07
Table 8.6: Coefficient of variation analyses for the mixes at early-ages (14 days)
Mixes Prediction models
ACI209R EN1992 MC2010 CEB/FIP AASHTO GL2000 AS3600 JSCE SAK B3
P 0.47 0.035 0.055 0.14 0.27 0.10 0.34 0.41 0.24 0.72
C30 0.68 0.32 0.41 0.23 0.08 0.27 0.023 0.68 0.53 0.91
C50 0.43 0.054 0.144 0.029 0.21 0.003 0.24 0.39 0.23 0.68
Table 8.7 and Table 8.8 show the summary of the error percentage and the coefficient
of variation for the mixes in long-term ages (365 days). For mix P, based on the EP and
CV results, the AS3600 and JSCE models are the best predictors with an accuracy
approximately 90%-96%, although these models underestimated the shrinkage results.
The same models (AS3600 and JSCE) were also found as the best predictors for the C30
concrete mixture with the accuracy of approximately 96%-100%. However, the GL2000,
AASHTO and MC2010 models predicted the shrinkage results for mixes P and C30 with
an accuracy in the range of approximately 70&-80%, although these models
underestimated the predictions. The ascending rank of the remaining model predictions
for the mixes P and C30 are ordered as SAK, EN1992, CEB/FIP, ACI209R and B3. For
the C50 concrete mixture, four models can be considered the best predictor, where the
SAK model predicted 100% similar results to the experimental values, whereas the
GL2000, MC2010 and AASHTO models predicted similar results to the experimental
Univers
ity of
Mala
ya
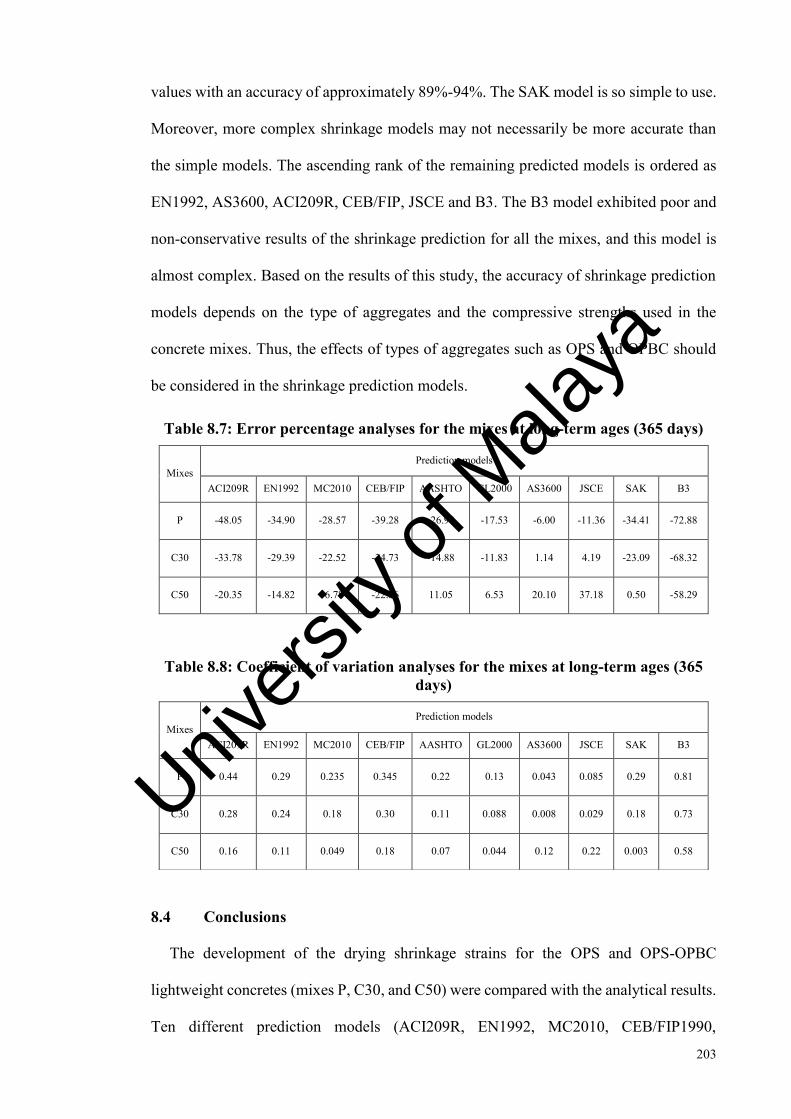
203
values with an accuracy of approximately 89%-94%. The SAK model is so simple to use.
Moreover, more complex shrinkage models may not necessarily be more accurate than
the simple models. The ascending rank of the remaining predicted models is ordered as
EN1992, AS3600, ACI209R, CEB/FIP, JSCE and B3. The B3 model exhibited poor and
non-conservative results of the shrinkage prediction for all the mixes, and this model is
almost complex. Based on the results of this study, the accuracy of shrinkage prediction
models depends on the type of aggregates and the compressive strengths used in the
concrete mixes. Thus, the effects of types of aggregates such as OPS and OPBC should
be considered in the shrinkage prediction models.
Table 8.7: Error percentage analyses for the mixes at long-term ages (365 days)
Mixes Prediction models
ACI209R EN1992 MC2010 CEB/FIP AASHTO GL2000 AS3600 JSCE SAK B3
P -48.05 -34.90 -28.57 -39.28 -26.94 -17.53 -6.00 -11.36 -34.41 -72.88
C30 -33.78 -29.39 -22.52 -34.73 -14.88 -11.83 1.14 4.19 -23.09 -68.32
C50 -20.35 -14.82 -6.78 -22.86 11.05 6.53 20.10 37.18 0.50 -58.29
Table 8.8: Coefficient of variation analyses for the mixes at long-term ages (365 days)
Mixes Prediction models
ACI209R EN1992 MC2010 CEB/FIP AASHTO GL2000 AS3600 JSCE SAK B3
P 0.44 0.29 0.235 0.345 0.22 0.13 0.043 0.085 0.29 0.81
C30 0.28 0.24 0.18 0.30 0.11 0.088 0.008 0.029 0.18 0.73
C50 0.16 0.11 0.049 0.18 0.07 0.044 0.12 0.22 0.003 0.58
8.4 Conclusions
The development of the drying shrinkage strains for the OPS and OPS-OPBC
lightweight concretes (mixes P, C30, and C50) were compared with the analytical results.
Ten different prediction models (ACI209R, EN1992, MC2010, CEB/FIP1990,
Univers
ity of
Mala
ya

204
AASHTO-LRFD, GL2000, AS3600, JSCE, SAK and B3) were selected from the
standards and researchers.
1. The error percentage (EP) and coefficient of variation (CV) equations were used to
achieve the best prediction model for the lightweight concretes. In early ages,
almost all the prediction models estimated similar results with the experimental
curves. However, at later ages, only few models showed closer results. For OPSC,
based on EP and CV values, the AS3600 and JSCE models were found as the best
predictors with an accuracy of approximately 90%-96%, although these models
underestimated the shrinkage results.
2. For OPS-OPBC50% concrete, four models can be considered the best predictors.
The SAK model predicted 100% similar results to the experimental values, whereas
the GL2000, MC2010 and AASHTO models predicted similar results with the
experimental values with an accuracy of approximately 89%-94%. The SAK model
is so simple to use. Moreover, more complex shrinkage models may not necessarily
be more accurate than the simple models.
3. By contrast, the B3 model exhibited poor and non-conservative results of the drying
shrinkage prediction for all mixes, and this model is more complex. Based on the
results of this study, the accuracy of shrinkage prediction models depends on the
type of aggregates and the compressive strengths of the concrete mixes. Thus, the
effects of types of aggregates such as OPS and OPBC should be considered in the
shrinkage prediction models.
Univers
ity of
Mala
ya

205
SHEAR BEHAVIOUR OF PALM OIL BY-PRODUCT
LIGHTWEIGHT AGGREGATE CONCRETE BEAMS WITHOUT SHEAR
REINFORCEMENT
9.1 Introduction
Shear behaviour is one of the most argumentized issue in the structural performance
of the concrete members (Kong & Evan, 1998). Shear behaviour was first investigated
about a century ago by (Morsch, 1909), who reported that a reliable definition of the shear
behaviour of reinforced concrete (RC) beams without shear reinforcement is unavailable.
However, shear behaviour can also be considered as brittle failure under a shear force,
with the development of diagonal cracks in the span (Yang, 2014). According to classic
beam theory, the maximum shear stress acts in the neutral axis of the beam section, which
places the first principal stress in the diagonal direction and opens diagonal cracks.
Therefore, such type of failure can be considered as shear failure. The use of
reinforcement in concrete has several advantages, such as chemical and freeze-thaw
resistance, lower time-dependent deformations, high modulus of elasticity etc. Apart from
these advantages, concrete is more predisposed to shear failure, which mostly appears
without any notification. A number of researchers have investigated the shear behaviour
of reinforced concrete (RC) beams without shear reinforcement and reported several
factors affecting the shear performance of RC members (Bukhari & Ahmad, 2008;
Reineck & Kuchma, 2003). The main factors include strength of concrete, type of
aggregate, shear-span to effect-depth ratio (a/d), loading type, longitudinal steel ratio (ρ)
and end support conditions.
The lightweight concrete (LWC) is weak under shear, which is a main result of low
tensile strength. The primarily failure in lightweight aggregate concrete (LWAC) occurs
from the bond failure between the aggregate and the cement matrix and from the breaking
of lightweight aggregate (LWA) (Alengaram, Jumaat, Mahmud, & Fayyadh, 2011).
Univers
ity of
Mala
ya

206
According to Kong and Evans (1998), the shear strength of concrete is the most
controversial topic in the structural performance of concrete members. Clarke (2002)
studied the shear behaviour of RC beams in both with and without shear reinforcement.
The concrete was made from two types of artificial LWAs, which have 28-day
compressive strengths of 30 and 50 MPa and dry densities of 1700 and 2000 kg/m3. The
reduction factor of 0.9 was proposed for beams without shear reinforcement. These LWA
concrete beams with the shear reinforcement can also carry about 90% capacity compared
with the conventional concrete beams. Weigler and Karl (1980) utilized the lightweight
expanded clay aggregates (LECA) and produced the lightweight aggregate foamed
concrete (LWAFC) with 28-day compressive strengths of 12-30 MPa and the densities of
1200-1600 kg/m3, successfully developing a structural grade LWAFC with thermal
insulating characteristics. Later, Jumaat, Alengaram, and Mahmud (2009) investigated
four oil palm shell foamed concrete (OPSFC) beams with the 28-day compressive
strength and density of 20 MPa and about 1600 kg/m3, respectively, where the OPSFC
beams has higher shear capacity than conventional concrete beams and has more flexural
and shear cracks in the absence of shear reinforcement.
Recently, Alengaram et al. (2011) investigated the shear performance of palm kernel
shell concrete (PKSC) beams. The shear strength of grade 30 PKSC concrete with a
density of 1850 kg/m3 was about 24% higher than NWC, with the former establishing a
better interlock of aggregates that produce shorter jagged cracks in comparison with the
longer plain cracks of the latter. The bond breakdown in concrete, brought by the frequent
failure of weaker OPS grains in PKSC arises from the concave and convex surfaces of
the OPS (Alengaram et al., 2008b). Mahmud et al. (2009) also reported that mineral
admixtures in the OPS concrete increases the mechanical properties and the bonding.
Mohammed et al. (2013) investigated the shear behaviour of seven reinforced OPBC
concrete beams, where the compressive strengths and air-dried densities of the selected
Univers
ity of
Mala
ya

207
concretes range at 20-40 MPa and about 1820-1840 kg/m3, respectively. Upon
consideration of shear-span to effective-depth ratio (a/d), the tensile reinforcement ratio
(ρ), and compressive strength of the concretes the structural behaviour and the failure
modes of the OPBC reinforced concrete beams were similar to normal weight RC beams.
The shear strength of LWC beams was not highly investigated compared to the
conventional gravel concrete. Only few studies are available, where researchers
investigated the shear performance of the oil palm shell (OPS) concrete. The oil-palm-
boiler clinker (OPBC) aggregate is a new waste material from the oil palm industry, which
still needs further structural investigations. Therefore, this research focuses on
investigating the shear performance of OPS and OPS-OPBC reinforced concrete beams
through the experimental work.
The main aim of this study is to use OPS and OPBC aggregates in producing different
structural grades of LWC ranging from 25 to 45. The dried density below 2000 kg/m3
was targeted and the shear behaviour of LWC without shear reinforcement was
investigated. As reported by Aslam et al. (2016b), the OPS and OPBC can be used as an
LWA in the concrete. The bulk density of the OPBC aggregate is about 40-45% lower
than the NWA, but about 23-30% higher density than OPS and coconut shell. In addition,
the smooth convex and concave surfaces of the OPS aggregate weaken the bond with the
cement matrix (Mannan et al., 2002; Okpala, 1990; Shafigh et al., 2011). Aslam et al.
(2016) studied the mechanical properties of green, environmentally-friendly, and high-
strength structural LWAC blends produced by incorporating high volume solid waste
materials (OPS and OPBC) from the palm oil industry. Though the literature on the
mechanical properties of OPS and OPS-OPBC concretes is available, the shear behaviour
of OPS-OPBC reinforced concrete beams is a neglected area.
Univers
ity of
Mala
ya

208
9.2 Experimental Programme
9.2.1 Materials
Ordinary Portland cement (OPC) and Fly Ash (FA) were used as a binder in this
investigation. Grade 48 OPC conforms to MS522, Part-1: 2003 and has a specific gravity
of 3.14 and Blaine surface area of 3510 cm2/g. The locally available FA of Class F
according to ASTM: C618 has a specific gravity of 2.18 and Blaine surface area of 7290
cm2/g. The chemical composition of the cement and fly ash is shown in Table 9.1.
Portable drinking water was used for mixing and curing of the concrete. According to
BS-5075, Sika ViscoCrete with <0.1 total chloride ion content and cement compatibility
was used as a super-plasticizer (SP) to control the workability of concrete. Local mining
sand with the fineness modulus, specific gravity, and maximum grain size of 2.89, 2.68
and 4.75 mm, respectively, was used as a fine aggregate.
The OPS and OPBC were collected from the local palm oil industry and were used as
a coarse aggregate. Both aggregates were stored at the open atmosphere for about 6-8
months for proper drying and removal of fibers from the OPS surface. OPS aggregates
were washed in the concrete mixer to remove the oil and impurities from the surface.
Whereas, the OPBC aggregates were crushed using a crushing machine. After that the
aggregates were sieved to achieve the same grading. The physical properties of the
selected aggregates are shown in Table 9.2. Univers
ity of
Mala
ya
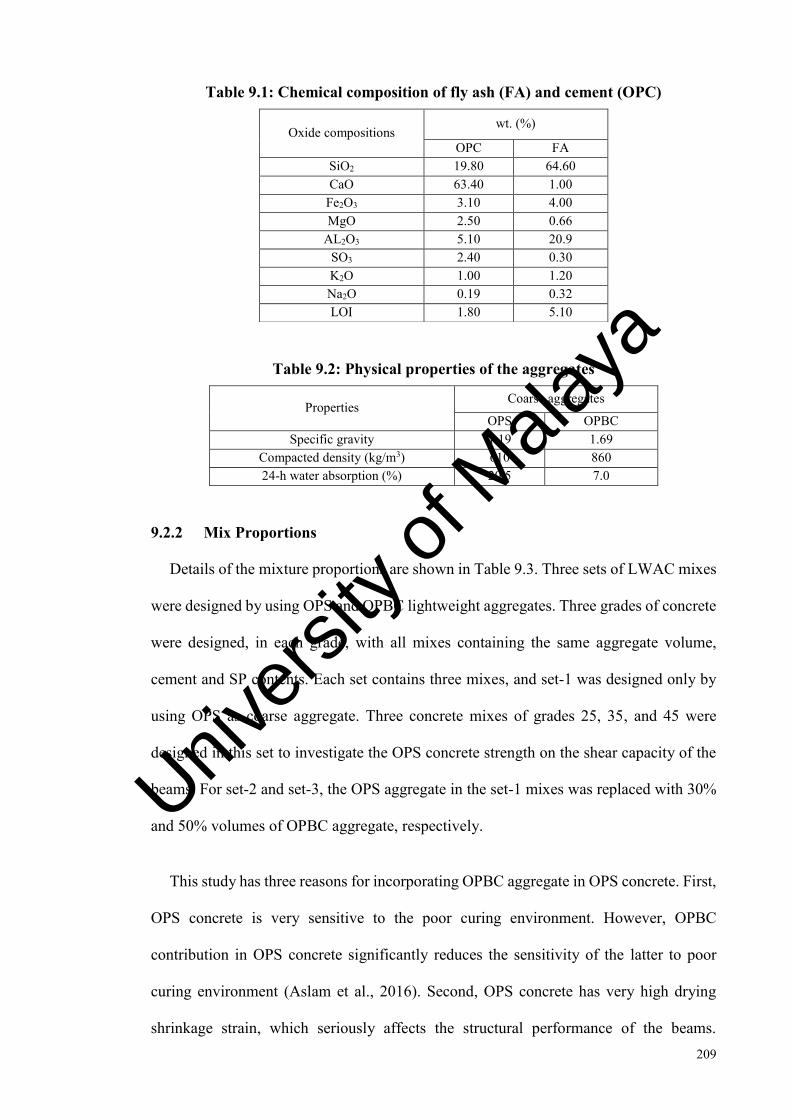
209
Table 9.1: Chemical composition of fly ash (FA) and cement (OPC)
Oxide compositions wt. (%)
OPC FA SiO2 19.80 64.60 CaO 63.40 1.00
Fe2O3 3.10 4.00 MgO 2.50 0.66
AL2O3 5.10 20.9 SO3 2.40 0.30 K2O 1.00 1.20 Na2O 0.19 0.32 LOI 1.80 5.10
Table 9.2: Physical properties of the aggregates
Properties Coarse aggregates
OPS OPBC Specific gravity 1.19 1.69
Compacted density (kg/m3) 610 860 24-h water absorption (%) 20.5 7.0
9.2.2 Mix Proportions
Details of the mixture proportions are shown in Table 9.3. Three sets of LWAC mixes
were designed by using OPS and OPBC lightweight aggregates. Three grades of concrete
were designed, in each grade, with all mixes containing the same aggregate volume,
cement and SP contents. Each set contains three mixes, and set-1 was designed only by
using OPS as coarse aggregate. Three concrete mixes of grades 25, 35, and 45 were
designed in this set to investigate the OPS concrete strength on the shear capacity of the
beams. For set-2 and set-3, the OPS aggregate in the set-1 mixes was replaced with 30%
and 50% volumes of OPBC aggregate, respectively.
This study has three reasons for incorporating OPBC aggregate in OPS concrete. First,
OPS concrete is very sensitive to the poor curing environment. However, OPBC
contribution in OPS concrete significantly reduces the sensitivity of the latter to poor
curing environment (Aslam et al., 2016). Second, OPS concrete has very high drying
shrinkage strain, which seriously affects the structural performance of the beams.
Univers
ity of
Mala
ya

210
Although, Aslam et al. (2016a) investigated the drying shrinkage behaviour of the OPS-
OPBC concretes, the OPBC contribution in OPS concrete with slightly reduced water-to-
cement ratio significantly reduces the drying shrinkage strain of OPS concretes. Third,
incorporating OPBC in OPS concrete reduces the smooth surface of the aggregates in the
concrete. Given the convex and concave nature of OPS aggregate on both faces, the bond
between the aggregate (shells) and the cement matrix is not strong enough to sustain
higher loads. Therefore, partial substitution of OPS and OPBC illustrated the blended
effect of LWAs on the shear capacity of RC beams without shear reinforcement.
All OPS and OPS-OPBC concrete mixes were prepared in the rotating drum mixer.
Initially, the materials were weighed under dry conditions. The OPS and OPBC
lightweight aggregates were pre-soaked in water for 24 hours and were dried in the
laboratory environment to obtain the saturated surface dry condition. For each mix
proportion, OPC, FA and aggregates were mixed for 2 minutes, before adding 70% water
with SP for another 3-minute mixing time. The rest of the water was added and the final
mixture was rotated for another 5 minutes. The properties of the fresh concretes were
measured (Table 9.3).
Table 9.3: Concrete mix proportions
Sets Mix code
Cement (kg/m3)
FA (kg/m3)
Water (kg/m3)
SP (kg/m3)
Sand (kg/m3)
Coarse aggregate (kg/m3) Slump
(mm) OPS OPBC
Set-1 P1 432 48 202.10 2.25 774 851 - 150 P2 450 50 181.34 5.00 779 856 - 195 P3 468 52 154.00 4.79 785 863 - 200
Set-2 C30-1 432 48 202.10 2.25 774 596 255 190 C30-2 450 50 181.34 3.80 779 599 257 180 C30-3 468 52 161.75 4.79 785 604 259 200
Set-3 C50-1 432 48 202.10 2.25 774 425.5 425.5 190 C50-2 450 50 181.34 3.80 779 428 428 215 C50-3 468 52 161.75 4.79 785 431.5 431.5 185
Univers
ity of
Mala
ya

211
9.2.3 Preparation of Specimens
A total of nine reinforced 1800 mm × 125 mm × 250 mm concrete beams were
designed and prepared by using OPS and OPS-OPBC concretes. A clear cover of about
25 mm was provided for all beams. The typical arrangement of reinforcement in the
beams is shown in Figure 9.1. All beams were designed with the same tensile
reinforcement ratio without shear reinforcement. While shear reinforcement was only
provided at the beam supports and the loading points to clearly observe the load impact
on the shear span of the beams, the main aim is to observe the shear capacity of different
concrete grades and the effect of different types of LWAs on shear behaviour. The steel
reinforcements with the same specifications were collected from one source for all the
beams. A high-yield strength of fy = 545 N/mm2 deformed bar was used for flexural
reinforcement, whereas the mild steel reinforcement with the yield strength of fyv = 300
N/mm2 was used for shear reinforcement. The shear-span to effective-depth ratio (a/d) of
2.87 was used for all beams without shear reinforcement.
All beams and the concrete specimens were cast in steel moulds. Compressive strength
and density of concrete were observed from 100 mm cube specimens. These specimens
were cast in parallel with the beams and cured under standard curing, however, the beams
were cured with water sprinkling and gunny bags curing method. The properties of the
concretes and the reinforcement details used in the beams are provided in Table 9.4.
Table 9.4: Properties of the specimens / beams
Sets Concretes Beam designation
Oven-dry density (kg/m3)
28-day compressive strength (MPa)
Tensile reinforcement ratio
Set-1 OPSC P1 1702 26.70 0.0128 OPSC P2 1757 36.60 0.0128 OPSC P3 1791 45.95 0.0128
Set-2 OPS-OPBCC30% C30-1 1795 29.94 0.0128 OPS-OPBCC30% C30-2 1824 37.34 0.0128 OPS-OPBCC30% C30-3 1903 46.96 0.0128
Set-3 OPS-OPBCC50% C50-1 1853 29.79 0.0128 OPS-OPBCC50% C50-2 1941 39.05 0.0128 OPS-OPBCC50% C50-3 1966 47.66 0.0128
Univers
ity of
Mala
ya
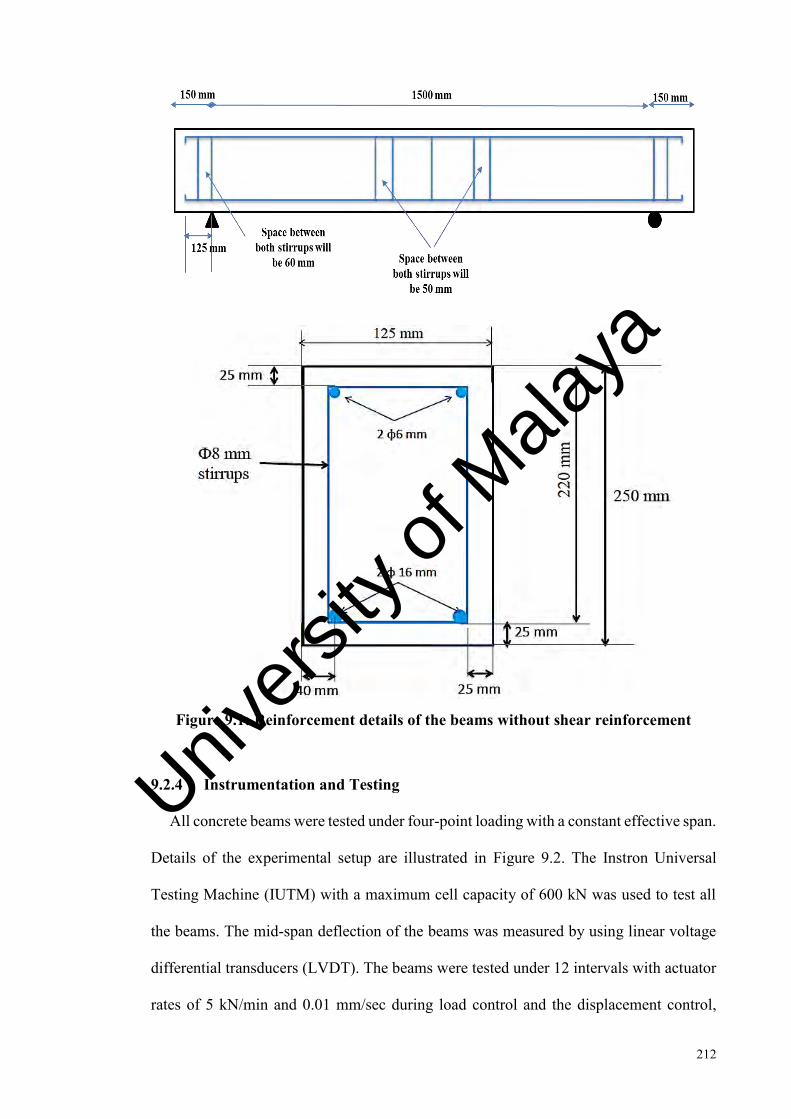
212
Figure 9.1: Reinforcement details of the beams without shear reinforcement
9.2.4 Instrumentation and Testing
All concrete beams were tested under four-point loading with a constant effective span.
Details of the experimental setup are illustrated in Figure 9.2. The Instron Universal
Testing Machine (IUTM) with a maximum cell capacity of 600 kN was used to test all
the beams. The mid-span deflection of the beams was measured by using linear voltage
differential transducers (LVDT). The beams were tested under 12 intervals with actuator
rates of 5 kN/min and 0.01 mm/sec during load control and the displacement control,
Univers
ity of
Mala
ya
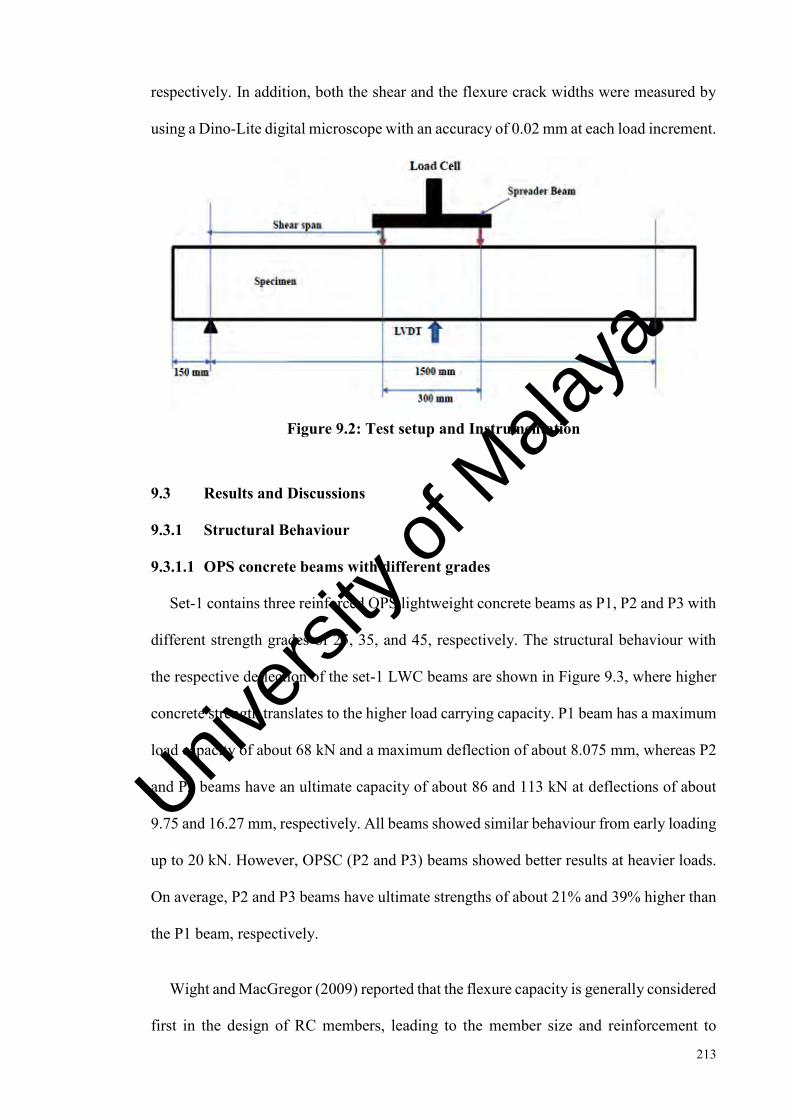
213
respectively. In addition, both the shear and the flexure crack widths were measured by
using a Dino-Lite digital microscope with an accuracy of 0.02 mm at each load increment.
Figure 9.2: Test setup and Instrumentation
9.3 Results and Discussions
9.3.1 Structural Behaviour
9.3.1.1 OPS concrete beams with different grades
Set-1 contains three reinforced OPS lightweight concrete beams as P1, P2 and P3 with
different strength grades of 25, 35, and 45, respectively. The structural behaviour with
the respective deflection of the set-1 LWC beams are shown in Figure 9.3, where higher
concrete strength translates to the higher load carrying capacity. P1 beam has a maximum
load capacity of about 68 kN and a maximum deflection of about 8.075 mm, whereas P2
and P3 beams have an ultimate capacity of about 86 and 113 kN at deflections of about
9.75 and 16.27 mm, respectively. All beams showed similar behaviour from early loading
up to 20 kN. However, OPSC (P2 and P3) beams showed better results at heavier loads.
On average, P2 and P3 beams have ultimate strengths of about 21% and 39% higher than
the P1 beam, respectively.
Wight and MacGregor (2009) reported that the flexure capacity is generally considered
first in the design of RC members, leading to the member size and reinforcement to
Univers
ity of
Mala
ya

214
provide necessary moment resistance. The limitations are only allowable during flexural
reinforcement to ensure the gradual failure of the structure. However, the shear is the only
failure in concrete, that is frequently sudden and brittle. Therefore, the shear strength must
be higher than flexural strength in the shear design of RC members. As seen in Figure
9.3, P1 and P2 beams showed very gradual shear failure in comparison with the P3 beam.
Figure 9.3: Structural behaviour of OPS concrete beams (set-1) without shear
reinforcement
9.3.1.2 OPS-OPBC concrete beams with different grades
Similar to set-1 of OPSC beams, set-2 and set-3 were designed with the same strength
grades by using OPS and OPBC aggregates. Each set in set-2 and set-3 concrete mixes
contain three beams with the modification of replacing OPS aggregates in set-1 mixes
with 30% and 50% OPBC aggregates, respectively. Therefore, the concrete mixes can be
considered as OPS-OPBC30% and OPS-OPBC50% concrete beams. The behaviour of
set-2 and set-3 reinforced LWC beams are shown in Figure 9.4 and Figure 9.5. As shown
in Figure 9.4, all set-2 mixes showed similar behaviour up to 60 kN loads, however, the
higher-grade concrete beams sustained higher loads under higher deflection as the loading
increases. The beam C30-1 showed the ultimate capacity of about 73 kN at a deflection
0
20
40
60
80
100
120
0 2 4 6 8 10 12 14 16 18 20
Loa
d (k
N)
Deflection (mm)
P1 P2 P3
Univers
ity of
Mala
ya

215
of 10.7 mm, whereas, the load carrying capacity of the beams also increases as the grade
of the same concrete increases beyond 25 MPa. The beams C30-2 and C30-3 showed the
highest ultimate loads of about 85 and 116 kN at deflections of 12.3 mm and 16.8 mm,
respectively. The ultimate load of beam C30-3 was about 37% and 27% higher than C30-
1 and C30-2 beams, respectively.
As seen in Figure 9.5, all set-3 mixes showed similar behaviour up to 75 kN load with
an average difference of about 4%. However, the ultimate capacity of the beams with
higher grade strength also increases as the loading increases. The C50-1 beam showed
the ultimate capacity of about 77 kN with a deflection of about 12.2 mm, whereas, the
load carrying capacity of the beams also increases as the grade of the same concrete
increases beyond 25 MPa. C50-2 and C50-3 beams showed the highest ultimate loads of
about 97 and 121 kN at the deflections of 15.5 mm and 16.97 mm, respectively. The
ultimate load of C50-3 was about 36% and 20% higher than C50-1 and C50-2 beams,
respectively.
Figure 9.4: Structural behaviour of OPS-OPBC30% concrete beams (set-2)
without shear reinforcement
0
20
40
60
80
100
120
0 5 10 15 20
Load
(kN
)
Deflection (mm)
C30-1 C30-2 C30-3
Univers
ity of
Mala
ya

216
Figure 9.5: Structural behaviour of OPS-OPBC50% concrete beams (set-3)
without shear reinforcement
9.3.1.3 Comparison of structural behaviour between OPSC and OPS-OPBC
concrete beams
Figure 9.6 shows a comparison of the structural behaviour of OPSC and OPS-OPBCC
beams, though the difference between the OPSC and OPS-OPBCC beams is not
significant. OPSC beams showed lower ultimate capacity compared with OPS-OPBC
concrete beams. OPS concrete beams (P1 and P2) were ductile after failure load, however
the failure load of P3 beam was more brittle. Similarly, the C30-1 and C30-2 beams also
showed the ductile behaviour, whereas the C30-3 suddenly failed after the ultimate
loading capacity. The structural behaviour of the set-3 beams is a bit different from set-1
and set-2 specimens. The beams C50-1 and C50-2 showed a bit ductile-natured behaviour
after the ultimate loading capacity, however, C50-3 beam showed total ductile behaviour
as its strength grade increases.
0
20
40
60
80
100
120
140
0 5 10 15 20
Loa
d (k
N)
Deflection (mm)
C50-1 C50-2 C50-3
Univers
ity of
Mala
ya

217
Figure 9.6: Structural behaviour of all the beams without shear reinforcement
The main reasons behind better structural performance of OPS-OPBC concrete beams
are mainly from the types of aggregates. As OPS aggregate is smooth by virtue of its
concave and convex faces, which weakens the bond between the aggregate and the
cement matrix (Aslam et al., 2016; Mannan et al., 2002; Okpala, 1990). Therefore, the
failure of the concrete results from the debonding of OPS aggregates from the cement
matrix, and from the inability of the shells fully utilize their potential strength. As reported
by Alengaram et al. (2011), the primary failure in most PKS lightweight concrete arises
from the breaking of both the aggregate and the bond between the aggregate and cement
matrix. The bond breakdown in concrete brought by the frequent failure of the weak OPS
grains arises from the concave and convex surfaces of the OPS (Alengaram et al., 2008b).
Mahmud et al. (2009) also reported that mineral admixtures in OPS concrete increases
the mechanical properties and the bonding. Recently, Aslam et al. (2016) demonstrated
the contribution of OPBC to the significant improvement of compressive strength in OPS
concrete under standard curing condition. Therefore, incorporation of the OPBC
0
20
40
60
80
100
120
140
0 2 4 6 8 10 12 14 16 18 20
Loa
d (k
N)
Deflection (mm)
P1 P2 P3
C30-1 C30-2 C30-3
C50-1 C50-2 C50-3
Univers
ity of
Mala
ya

218
aggregate in OPS concrete has a significant effect on the bond behaviour between
aggregates and the cement matrix. Based from the structural behaviour, the OPBC in the
OPS concrete increases the shear resistance of the beams. However, 50% OPBC in OPS
with higher strength grade concrete showed better ductile behaviour among all beams,
which mainly arose from the use of blended aggregates in the beam. Jumaat et al. (2009)
recommended that a good aggregate interlock in the concrete leads to a higher shear
resistance in the OPSC because the shapes of the various particles range from angular to
parabolic.
The ultimate load carrying capacity of all the beams with the respective deflections is
shown in Figure 9.7. Incorporation of 50% OPBC in OPS concrete increases the structural
performance of the OPSC beams. As seen from the figure, concrete grade increases along
with the increase of deflection and the gradual increase in the angles (α, β and ɵ) of the
deflection lines. The set-1 concrete beams showed the lowest angle (α), whereas, the set-
3 concrete showed highest angle (ɵ) between the deflection line.
Figure 9.7: Ultimate load capacity of all the beams with the respective deflections
Univers
ity of
Mala
ya

219
9.3.2 Shear Behaviour of Beams
Table 9.5 summarizes the first flexure crack load, first shear cracking load, ultimate
shear capacity, number of cracks at failure, failure modes, and the ratio of ultimate shear
capacity to the density of concrete. The incorporation of the OPBC aggregate significantly
increased the ultimate shear capacity of the OPS beams. Among grade 25 concrete beams,
the ultimate shear capacity of the C50-1 beam is about 7 and 11% higher than C30-1 and
P1 beams, respectively. Among grade 45 concrete beams, C50-3 beam showed the
highest ultimate shear capacity at 60.4 kN, which, on the average, was about 37% and
24% higher than G25 and G35 OPS-OPBC50% concrete beams, respectively.
The total number of cracks in each beam was also measured at the time of failure. As
seen in Table 9.5, all OPS concrete beams showed a higher number of cracks than the
OPS-OPBC beams because of two major possibilities. First, the number of cracks at the
time of failure reduces as the concrete grade improves. Second, OPBC in OPS concrete
reduces the total number of cracks in the beams. The C50-3 beam incorporated with 50%
OPBC and highest concrete grade of 45 showed the lowest number of total cracks at the
time of failure. Therefore, the incorporation of OPBC aggregate in the OPS concrete
significantly improved the bonding between the aggregate and the cement matrix which
resulted in the lower number of cracks.
The ratio of ultimate shear strength to the oven-dry density of the concrete beams is
also presented in Table 9.5. Beams with the same grade strength showed almost similar
shear strength to density ratios. Although, the performance of the OPS-OPBC concretes
improved from the incorporation of OPBC in the OPS concrete, the strength to density
ratio was found almost similar in each grade. In comparison with the reported ratio of
19.7 N/mm2/kg/m3 in NWC beams with the ultimate shear strength of 46 kN (Alengaram
Univers
ity of
Mala
ya

220
et al., 2011), the strength to density ratio of grade 45 beams in this present study is higher
by about 36%.
Table 9.5: Summary of Experimental results
Beam designation
First flexural crack load
(kN)
First shear crack load
(kN)
Ultimate shear
capacity (kN)
Number of cracks at failure
Failure modes
Ultimate shear / Concrete density (Nm3
/ kg mm2) x 1000
P1 10 12 34.2 29 Shear 20.0 P2 15 18 40.8 28 Shear 23.2 P3 10 24 56.5 26 Shear 31.5
C30-1 10 23 36.9 23 Shear 20.6 C30-2 20 28 42.7 22 Shear 23.4 C30-3 14 30 58.3 21 Shear 30.6 C50-1 12 23 38.6 20 Shear 20.8 C50-2 20 29 48.9 18 Shear 25.2 C50-3 15 35 60.4 13 Shear 30.7
9.3.3 Cracking Behaviour
The early flexural cracks in all beams may appear as a result of lower mechanical
properties such as splitting tensile and modulus of rupture of the concretes. However, the
incorporation of OPBC in OPS concrete increases the splitting tensile strength and the
modulus of rupture of the latter (Aslam et al., 2016). The diagonal tension cracks occurred
in all the beams, which appeared closer to the support and propagated towards the loading
point. The cracking patterns between the supports and the loading point of all the nine
beams tested under the shear are given in Figure 9.8, Figure 9.9 and Figure 9.10. All
beams displayed initial flexural cracking in the flexural zone. The OPSC (set-1) and OPS-
OPBC30% (set-2) beams had a greater number of both flexural and shear cracks and
closer spacing than the OPS-OPBC50% (set-3) concrete beams. As seen in Table 9.5, the
set-1 and set-2 beams under shear showed almost similar numbers of flexural and shear
cracks, whereas, the number of similar (flexural and shear) cracks is significantly lower
in set-3, which suggests that OPBC in the OPS concrete significantly increases the
bonding between the tension reinforcement and the OPS-OPBC concrete. Alengaram et
al. (2011) and Jumaat et al. (2009) reported that the PKSC and OPSFC beams with and
without shear reinforcement had a higher number of the flexural and shear cracks and
Univers
ity of
Mala
ya

221
closer spacing in comparison with the corresponding NWC beams. Although,
Mohammed et al. (2013) later did not report the cracking behaviour of palm-oil-clinker
(POC) RC beams the study specified that the reinforced POC beam showed similar failure
mode to that of the NWC beam.
Figure 9.8: Cracks pattern and Failure modes of the set-1 (OPS) lightweight
weight concrete beams
Figure 9.9: Cracks pattern and Failure modes of the set-2 (OPS-OPBC30%)
LWC beams
Univers
ity of
Mala
ya

222
Figure 9.10: Cracks pattern and Failure modes of the set-3 (OPS-OPBC50%)
LWC beams
Under service loading conditions, the crack width of the first crack appearance in all
beams was continuously observed at every interval up to 60 kN, and the final crack widths
were measured exactly after failure with the development of crack widths shown in
Figures 9.11 to 9.13. Based from the LWC beams with grade 25 strength presented in
Figure 9.11, all beams showed similar behaviour. However, P1 beam showed higher crack
widths in the range of 0.065-0.749 mm, whereas, C30-1 and C50-1 beams showed crack
width ranges of about 0.025-0.672 mm and 0.022-0.597 mm, respectively. At the failure
stage, the crack width of the P1 beam was about 11% and 20% higher than C30-1 and
C50-1 beams, respectively. This observation was attributed to the incorporation of the
OPBC aggregate in improving the performance of OPS-OPBCC beams in comparison
with OPSC. The similar behaviour was also found for grade 35 concrete beams (Figure
9.12), where the maximum ranges of crack widths in P2, C30-2, and C50-2 beams were
about 0.026-0.669 mm, 0.038-0.520 mm, and 0.038-0.477 mm, respectively. At the
Univers
ity of
Mala
ya

223
failure stage, the crack width of the P2 beam was about 22% and 29% higher than the
C30-2 and C50-2 beams.
Figure 9.11: Development of cracks widths of Grade 25 concrete beams
Figure 9.12: Development of cracks widths of Grade 35 concrete beams
Figure 9.13 can be described as the development of crack widths of the LWC beams
with the grade 45 strength. At the failure stage, the P3, C30-3, and C50-3 beams showed
0
10
20
30
40
50
60
70
80
0 0.1 0.2 0.3 0.4 0.5 0.6 0.7 0.8
Load
(kN
)
Crack width (mm)
P1 C30-1 C50-1
0
10
20
30
40
50
60
70
80
90
100
0 0.1 0.2 0.3 0.4 0.5 0.6 0.7 0.8
Loa
d (k
N)
Crack width (mm)
P2 C30-2 C50-2Univers
ity of
Mala
ya
224
the maximum crack widths at the range of 0.032-0.468 mm, 0.020-0.411 mm, and 0.018-
0.389 mm, respectively. As the grade of the concrete increases, the maximum crack
widths reduce. Comparatively, the crack width of the P3 beam was about 38% and 30%
higher than the P1 and P2 beams. The crack width of C30-3 beam was about 39% and
21% higher than the C30-1 and C30-2. The crack width of the C50-3 beam was about
35% and 18% lower than C50-1 and C50-2 beams.
Generally, the crack widths in the RC members can be considered based on certain
reasons such as leakage, appearance, and the reinforcement corrosion. ACI224.1R (2007)
reported that clean smooth surfaces and cracks wider than 0.254 mm to 0.330 mm can
easily lead to a public concern, despite the absence of any universal rule for the maximum
crack widths. Prior to 1999, the ACI Code recommended 0.330 mm for the exterior
exposure and 0.406 mm for the interior exposure as limits for the maximum crack widths
(Gergely & Lutz, 1973), whereas the Euro-International Concrete Committee (CEB-
Manual, 1985; CEB/FIP, 1993) limits the mean crack width to about 60% of the
maximum crack width for the exposure conditions, duration of the loading condition, and
the sensitivity of reinforcement to corrosion. In this study, a maximum of 60 kN service
loading condition in grades 25, 35, and 45 concrete beams showed the crack widths in the
range of 0.200 mm to 0.330 mm, which are almost equivalent to the maximum limits of
cracks width suggested by ACI standards. However, the crack widths of the beams at
failure stage were found higher than the suggested range. Univers
ity of
Mala
ya
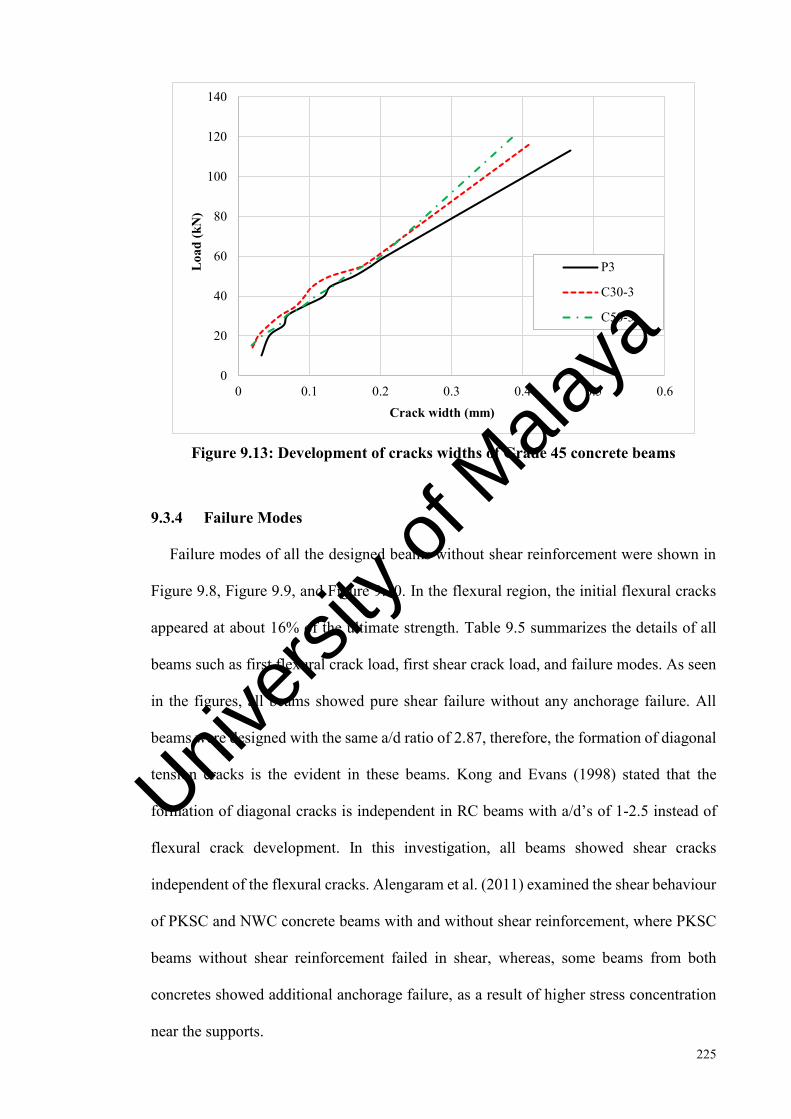
225
Figure 9.13: Development of cracks widths of Grade 45 concrete beams
9.3.4 Failure Modes
Failure modes of all the designed beams without shear reinforcement were shown in
Figure 9.8, Figure 9.9, and Figure 9.10. In the flexural region, the initial flexural cracks
appeared at about 16% of the ultimate strength. Table 9.5 summarizes the details of all
beams such as first flexural crack load, first shear crack load, and failure modes. As seen
in the figures, all beams showed pure shear failure without any anchorage failure. All
beams were designed with the same a/d ratio of 2.87, therefore, the formation of diagonal
tension cracks is the evident in these beams. Kong and Evans (1998) stated that the
formation of diagonal cracks is independent in RC beams with a/d’s of 1-2.5 instead of
flexural crack development. In this investigation, all beams showed shear cracks
independent of the flexural cracks. Alengaram et al. (2011) examined the shear behaviour
of PKSC and NWC concrete beams with and without shear reinforcement, where PKSC
beams without shear reinforcement failed in shear, whereas, some beams from both
concretes showed additional anchorage failure, as a result of higher stress concentration
near the supports.
0
20
40
60
80
100
120
140
0 0.1 0.2 0.3 0.4 0.5 0.6
Loa
d (k
N)
Crack width (mm)
P3
C30-3
C50-3
Univers
ity of
Mala
ya

226
Wight and MacGregor (2009) reported that short beam spans with a/d of 1-2.5
generally develop inclined cracks and carry additional loading after redistribution of
internal forces, in part by an arch action. Bond failure along the reinforcement or crushing
of compression zone, later referred to as the shear compression failure will cause the final
failure of such beams. With the inclined crack generally spreading deeper into the beam
rather than the flexural crack, failure occurs at less than the flexural moment capacity.
Furthermore, the inclined cracks in beams with a/d ratio of 2.5-6 disrupt the equilibrium
of the beams, which result in an inclined cracking load brought by beam failure. Beams
with a/d ratio higher than 6, normally failed in flexure prior to the appearance of inclined
cracks. However, all beams studied in this study showed a general shear failure.
9.3.5 Deflection
Figure 9.3 shows the mid-span deflection or the load-deflection behaviour of all the
beams without shear reinforcement. The initial linear portion of the curvatures shows that
the stiffness of the beams remains constant before the appearance of the flexural cracking.
The performance of the OPSC beams is comparable with that of OPS-OPBC concrete
beams. All lower to medium (25-35) strength concrete beams showed a consistent
increment in the deflection with respective loading, whereas the higher strength (grade
45) OPS and OPS-OPBC30% concretes showed a sudden failure without any increment
in the deflection. However, the failure of the same grade OPS-OPBC50% concrete was a
ductile failure with the constant increase in the deflection. Comparatively, the deflections
can be observed in two ways. First, if the concrete grade is considered, then improving
the concrete grade also increases the deflections. Second, the contribution of OPBC
aggregate in OPS concrete resulted in higher deflections and improved ductility of the
OPS-OPBC beam with higher grade concrete. BS8110 limits the total deflection to
span/250. However, the deflections of all beams at service loads were within the
allowable limit of 9.6 mm.
Univers
ity of
Mala
ya

227
In the load-deflection behaviour, the beam is initially un-cracked owing to its higher
stiffness. However, the stiffness and the moment of inertia of the beams decreases as the
cracking starts. Further cracking causes the yielding of steel reinforcement, leading to
higher deflections with the little change of load Wight and MacGregor (2009). Hence, all
beams in the early stage showed an elastic behaviour and the progressive reduction of
flexural stiffness owing to the increase in crack widths and loads caused non-linear load-
deflection.
9.3.6 Comparison of Experimental and Predicted Shear Strengths
The shear resistance of all the beams (Vc) was calculated using the equations proposed
by ACI318 (2002) Eurocode 2 (EN2, 2004), Canadian Standard (CSA-A23.3, 1994), and
Bazant and Kim (1984). According to ACI318 (2002), the shear resistance of non-
prestressed reinforced concrete members without shear reinforcement can be calculated
by using Eq. (9.1). However, this equation predicts the shear load in US-units. Therefore,
the shear strength was converted into the SI-units, as seen in Eq. (9.2).
𝑉𝑐 = 2 ∗ 𝜆 ∗ √𝑓𝑐′ ∗ 𝑏𝑤 ∗ 𝑑 (US-Units) (9.1)
𝑉𝑐 = (𝜆∗√𝑓𝑐
′
6) ∗ 𝑏𝑤 ∗ 𝑑 (SI-Units) (9.2)
where; Vc is the shear force, 𝜆 = 1, for NWC and lesser for LWCs.
The standard Eurocode 2 (EN2, 2004) normally considered the Variable Strut
Inclination Method to estimate the shear strength of the concretes, generally allowing the
designers to determine the economic amount of the shear reinforcement in the concrete
members (Mosley, Hulse, & Bungey, 2012). The empirical expression provided by EC2
in calculating the shear resistance of the concrete (VRd,c) is mentioned in Eq. (9.3). This
Univers
ity of
Mala
ya

228
standard generally considers the 28-day cylinder compressive strength of the concrete,
which can be converted from the 28-day cube compressive strength. This code also
recommended that the partial safety factor (ɣc) of 1.50 is not considered in the calculation
of shear strength. In addition, the EN2 recommended two different factors of (CRd,c) for
the conventional and LWC. Introduction of the factor (η1), which considers the concrete
density (ρ), allows the proper estimation of the shear capacity of the beams. However,
this factor may influence the shear resistance of the LWC, rather than the conventional
NWC.
𝑉𝑐 = [𝐶𝑅𝑑,𝑐 ∗ 𝑘𝑐 ∗ 𝜂1 ∗ (100 ∗ 𝜌1 ∗ 𝑓𝑐𝑘)1
3⁄ ] 𝑏 ∗ 𝑑 (9.3)
where,
𝐶𝑅𝑑,𝑐 =0.18
ɣ𝑐 for normal weight concrete (NWC); and
𝐶𝑅𝑑,𝑐 =0.15
ɣ𝑐 for lightweight concrete (LWC);
𝑘𝑐 = 1 + √200
𝑑≤ 2.0 where d is the depth in (mm);
𝜂1 = 0.4 +0.6𝜌
2200≤ 1.0 where ρ is the concrete density in (kg/m3);
𝜌1 =𝐴𝑠
𝑏𝑤𝑑≤ 0.02
The Canadian standard (CSA-A23.3, 1994) proposed the shear strength prediction Eq.
(9.4). The Canadian standard does not consider the effects of a/d and the tension
reinforcement on the shear strength of concrete. According to the equation, the fc’ is the
28-day compressive strength of the concrete in MPa, whereas bw and “d” are the effective
width and depth of the effective cross-section in millimeter, respectively.
Univers
ity of
Mala
ya

229
𝑉𝑐 = 0.2 ∗ √𝑓𝑐′ ∗ 𝑏𝑤 ∗ 𝑑 (9.4)
Bazant and Kim (1984) formulated the shear strength prediction model for the concrete
members shown in Eq. (9.5). The model looks complicated because the equation
considers several parameters in predicting the shear strength of concrete members. Aside
from the diagonal shear failure of RC beams and the slabs without shear reinforcement,
the model considers the size effect, which theoretically resulted from the dimensional
analysis of the energy release rate during fracture propagation that disperses cracking
zones at their front.
𝑉𝑐 = [0.54 ∗ √𝜌3 ∗ (√𝑓𝑐′ + 249√
𝜌
(𝑎𝑑⁄ )
3) ∗ (1+√5.08
𝑑0⁄
√1+𝑑(25𝑑0)⁄
)] 𝑏𝑤 ∗ 𝑑 (9.5)
where, 𝑓𝑐′ is the 28-day compressive strength of the concrete; 𝑏𝑤𝑑 is the width and
depth of effective cross-section in mm; a/d is the shear span to the effective depth ratio,
and ρ is the longitudinal reinforcement ratio.
The experimental and the predicted results of the shear strength of all beams is shown
in Table 9.6. All prediction models selected from different standards estimated close
results in the actual shear strength of the beams. The ratios of the experimental to the
ACI318 model results for set-1, set-2, and set-3 beams are 1.41-1.78, 1.44-1.81, and 1.51-
1.86, respectively. This ratios in EC 2 ranges at 1.38-1.85, 1.39-1.83, and 1.44-1.86 for
set-1, set-2, and set-3 beams, respectively. The ACI318 and the EC2 models predicted
very conservative results of ultimate shear strengths at an average ratio of 1.60. However,
the model proposed by Canadian Standards predicted better results compared with
ACI318 and EC2. The ratios of the experimental to the Canadian model results for the
set-1, set-2, and set-3 beams were in the ranges of 1.18-1.48, 1.20-1.51, and 1.26-1.56,
respectively. The ACI318 and EC2 models predicted conservative results in comparison
Univers
ity of
Mala
ya
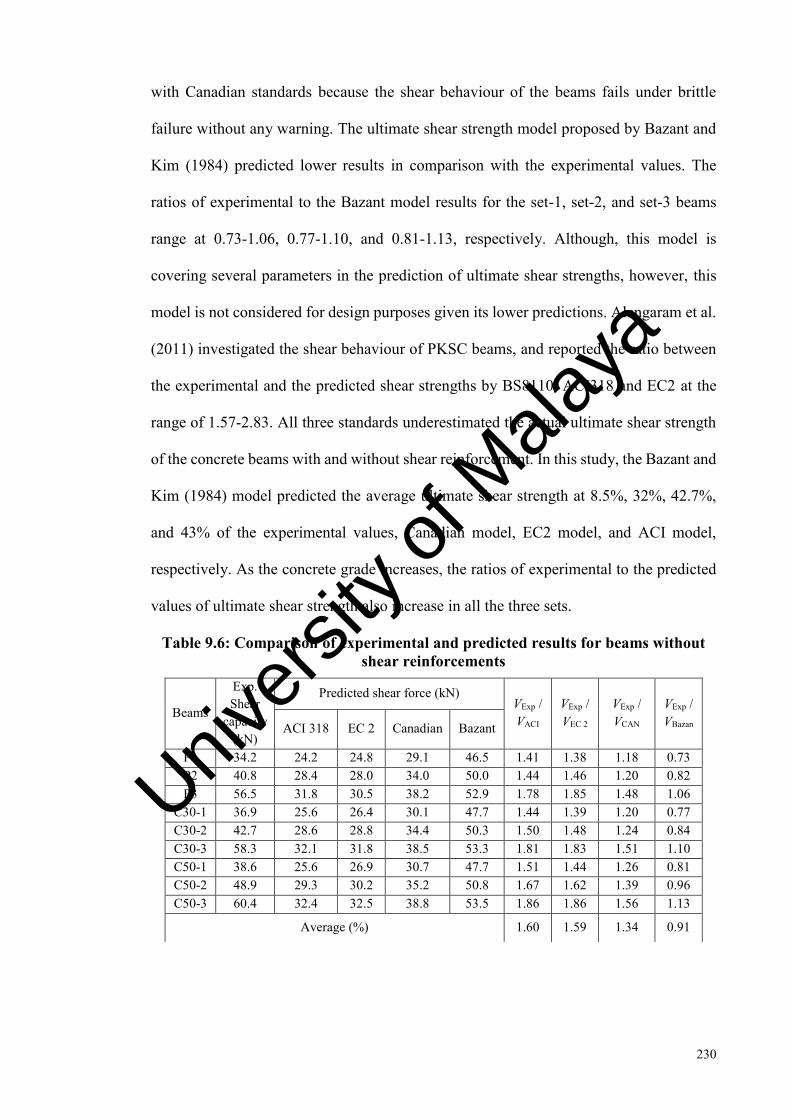
230
with Canadian standards because the shear behaviour of the beams fails under brittle
failure without any warning. The ultimate shear strength model proposed by Bazant and
Kim (1984) predicted lower results in comparison with the experimental values. The
ratios of experimental to the Bazant model results for the set-1, set-2, and set-3 beams
range at 0.73-1.06, 0.77-1.10, and 0.81-1.13, respectively. Although, this model is
covering several parameters in the prediction of ultimate shear strengths, however, this
model is not considered for design purposes given its lower predictions. Alengaram et al.
(2011) investigated the shear behaviour of PKSC beams, and reported the ratio between
the experimental and the predicted shear strengths by BS8110, ACI318 and EC2 at the
range of 1.57-2.83. All three standards underestimated the actual ultimate shear strength
of the concrete beams with and without shear reinforcement. In this study, the Bazant and
Kim (1984) model predicted the average ultimate shear strength at 8.5%, 32%, 42.7%,
and 43% of the experimental values, Canadian model, EC2 model, and ACI model,
respectively. As the concrete grade increases, the ratios of experimental to the predicted
values of ultimate shear strength also increase in all the three sets.
Table 9.6: Comparison of experimental and predicted results for beams without shear reinforcements
Beams
Exp. Shear
capacity (kN)
Predicted shear force (kN) VExp / VACI
VExp / VEC 2
VExp / VCAN
VExp / VBazan ACI 318 EC 2 Canadian Bazant
P1 34.2 24.2 24.8 29.1 46.5 1.41 1.38 1.18 0.73 P2 40.8 28.4 28.0 34.0 50.0 1.44 1.46 1.20 0.82 P3 56.5 31.8 30.5 38.2 52.9 1.78 1.85 1.48 1.06
C30-1 36.9 25.6 26.4 30.1 47.7 1.44 1.39 1.20 0.77 C30-2 42.7 28.6 28.8 34.4 50.3 1.50 1.48 1.24 0.84 C30-3 58.3 32.1 31.8 38.5 53.3 1.81 1.83 1.51 1.10 C50-1 38.6 25.6 26.9 30.7 47.7 1.51 1.44 1.26 0.81 C50-2 48.9 29.3 30.2 35.2 50.8 1.67 1.62 1.39 0.96 C50-3 60.4 32.4 32.5 38.8 53.5 1.86 1.86 1.56 1.13
Average (%) 1.60 1.59 1.34 0.91
Univers
ity of
Mala
ya

231
9.4 Conclusions
Three sets of the lightweight aggregate concrete (LWAC) mixes were designed using
coarse waste materials from the palm oil industry, namely, oil palm shell (OPS) and oil-
palm-boiler clinker (OPBC) to investigate the shear behaviour. Each set contains three
concrete mixes of grades 25, 35, and 45. Set-1 was designed by only using OPS as a
coarse aggregate, whereas in set-2 and set-3, replaced the OPS aggregate in the set-1
mixes with 30% and 50% volume of OPBC aggregate, respectively. Based on this
investigation, several conclusions can be drawn:
1. In set-1 (OPSC beams), a stronger concrete indicated a higher load carrying
capacity. The ultimate strengths of Grade 35 (P2) and grade 45 (P3) beams were
about 21% and 39% higher than the grade 25 (P1) beam, respectively.
2. In set-2 (OPS-OPBCC30% beams), the ultimate load of beam C30-3 (grade 45) was
the highest at about 37% and 27% higher than C30-1 (grade 25) and C30-2 (grade
35) beams, respectively.
3. In set-3 (OPS-OPBCC50% beams), all beams showed similar behaviour up to 75
kN. The ultimate load of beam C50-3 (grade 45) was the highest at about 36% and
20% higher than the C50-1 (grade 25) and C50-2 (grade 35) beams, respectively.
4. Comparatively, the OPSC beams have lower ultimate capacity in comparison with
OPS-OPBC concrete beams. The OPSC beams up to grade 35 showed a ductile
behaviour after ultimate load carrying capacity. However, the beam showed brittle
failure without any warning as the grade of OPSC increased. On the other hand,
incorporation of 50% OPBC aggregate in the OPSC significantly improves the
structural performance and the failure nature of the beam.
5. All OPSC beams showed a higher number of flexural and shear cracks than OPS-
OPBC beams for two main reasons. First, the concrete grade improves as the
Univers
ity of
Mala
ya
232
number of cracks at the time failure reduces. Second, the OPBC in OPSCs reduces
the total number of cracks in the beams.
6. The ratio of ultimate shear strength to the oven-dry density of the concrete beams
was also observed. Beams with the same grade strength showed almost similar
shear strength to the density ratios. This ratio was also compared with the ratio of
NWC beam selected from literature, where the strength to density ratio of the grade
45 concrete beams in this study is 36% higher than NWC beams.
7. Under 60 kN service loading conditions, grades 25, 35, and 45 concrete beams
showed the crack widths of 0.20-0.3305 mm which is almost equivalent to the
maximum cracks width limit suggested by ACI standards.
8. The beams in this study were designed with the same a/d of 2.87 and without the
shear reinforcement. Therefore, all beams showed pure shear failure without any
anchorage failure.
9. The experimental results of ultimate shear strength of the beams were also
compared with the predicted results. All prediction models selected from different
standards estimated close results with the actual shear strength of the beams. On
average, the ACI 318 and the EC 2 models predicted conservative results of the
ultimate shear strengths at an average ratio of 1.60.
Univers
ity of
Mala
ya

233
CONCLUSIONS AND RECOMMENDATIONS
10.1 Conclusions
The possibility of using oil-palm-boiler clinker (OPBC) and oil palm shell (OPS) as
lightweight aggregate in the concrete to produce green, sustainable and high strength
blended coarse lightweight aggregate concrete. The following are the general conclusions
based on the cumulative conclusions given in the papers:
10.1.1 Workability
i. It is possible to produce green, sustainable and high strength lightweight aggregate
concrete with high workability without any segregation.
ii. By replacing oil palm shell by oil-palm-boiler clinker in a oil palm shell concrete
workability increases as the percentage of OPS substitution increases.
iii. Substitution of cement by fly ash up to 10% also increases the workability of the
OPS and OPS-OPBC lightweight concretes.
10.1.2 Density
i. OPBC grain is about 42% heavier than an OPS grain, inclusion of OPBC in OPS
concrete increased the density of concrete by about 2-4%. However, even at the
50% substitution level, the density of OPS-OPBC concrete was still in the
acceptable range for structural lightweight aggregate concretes.
ii. The density of concrete is found to decrease with the substitution of the OPBC
with OPS aggregates. The substitution between 20 to 40 % could turn high-
strength semi-lightweight OPBC concrete into high-strength lightweight
aggregate concrete.
iii. The lowest 28-day oven dry density was measured for artificial lightweight
aggregate concrete (leca concrete) was about 1590 kg/m3, which was significantly
lower than the OPS, OPS-OPBC, OPBC and normal weight concretes.
Univers
ity of
Mala
ya
234
10.1.3 Compressive Strength
i. It is possible to produce high strength lightweight aggregate concrete by using
waste materials as blended coarse aggregates.
ii. The contribution of oil-palm-boiler clinker (OPBC) in OPS concrete significantly
improved the compressive strength under standard curing. At the substitution
between 20-40% levels, grade 35 OPS concrete was transferred to grade 40.
iii. The substitution of 50% OPS with OPBC in OPS concrete the compressive
strength was significantly improved. By this substitution, grade 35 concrete with
the oven dry density of about 1800 kg/m3 was transferred to grade 50 concrete
with the oven dry density of about 1950 kg/m3.
iv. In continuous moist curing, the set (1) concrete mixes containing OPBC from 20
to 50%, the compressive strength of grade 30 OPS concrete could be transformed
to grade 40. However, the set (2) concrete mixes with 30-50% OPBC aggregate
had significant improvement in the compressive strength and grade 50 OPS
lightweight concrete was achieved.
v. The 28-day compressive strength of the artificial lightweight aggregate concrete
(leca concrete) was found about 25 MPa, which is significantly lower than the
OPS and OPS-OPBC lightweight concretes.
10.1.4 Effect of Curing Regimes on Compressive Strength
i. Incorporating oil-palm-boiler clinker (OPBC) aggregate into OPS concrete
reduces the sensitivity of compressive strength to lack of curing. OPS concrete
(without OPBC aggregate) under air-drying showed a reduction of about 25%
compared to continuous water curing while OPS concrete containing 30-50%
OPBC only showed a reduction of about 5%. This may be due to the better
performance of OPBC lightweight aggregates for internal curing.
Univers
ity of
Mala
ya

235
ii. Partial early curing improves compressive strength more than air-drying because
it is more effective when OPBC content is higher. However, if partial early curing
occurs though watering a few times a day (like 2T2D and 2T6D), it is
recommended that this method is not used continuously over several days due to
the negative effect of the wetting-drying condition on concrete.
iii. The concretes containing OPBC and OPS lightweight aggregates showed lower
compressive strength under air drying. However, six days moist curing after
demoulding is enough to achieve equivalent compressive strength under full water
curing.
10.1.5 Splitting Tensile Strength
i. The 28-day splitting tensile strength of concretes containing OPBC from 10-50%
was found in the range of 3.05-3.31 MPa, which is in the usual range for structural
lightweight aggregate concrete.
ii. The substitution of 50% OPS with OPBC in OPS concrete significantly improved
the splitting tensile strength of the concrete.
iii. Although, OPBC concretes containing OPS had lower tensile strengths compared
to OPBC concrete, the splitting tensile strength was found to be in the usual range
for structural lightweight aggregate concrete.
10.1.6 Flexural Strength
i. The 28-day flexural strength of OPS-OPBC concretes ranged from 4.48 to 5.38
MPa, which was 12-15% of the 28-day compressive strength. These ratios are
equivalent to the normal weight concrete ratio.
ii. The substitution of 50% OPS with OPBC in OPS concrete the flexural strengths
significantly improved. By this substitution, grade 35 concrete with the oven dry
Univers
ity of
Mala
ya

236
density of about 1800 kg/m3 was transferred to grade 50 concrete with the oven
dry density of about 1950 kg/m3.
iii. Although, OPBC concretes containing OPS had lower flexural strengths
compared to OPBC concrete, moreover, the OPBC-OPS concretes showed
flexural strength and flexural/compressive strength ratio similar to NWC and high
strength lightweight aggregate concretes.
10.1.7 Specific Strength
i. The incorporation of OPBC aggregate in OPS concrete increased the specific
strength of the concrete. The specific strength for a NWC with a dry density of
2350 kg/m3 and 28-day compressive strength similar to mix OPS-OPBC50% is
21915 N.M/kg, which is about 17.5% lower than the specific strength of OPS-
OPBC concrete. Therefore, it can be said that OPS-OPBC concretes even shows
better performance compared to NWC of the same grade.
10.1.8 Modulus of Elasticity
i. The modulus of elasticity of OPS concretes increased about 18-24% with the
incorporation of OPBC aggregates. OPS-OPBC concretes containing more than
20% OPBC aggregate had a modulus of elasticity in the normal range for
structural lightweight aggregate concretes.
ii. The modulus of elasticity of grade 35 OPS concrete is very low compared to
normal concrete and structural lightweight aggregate concrete at the same
compressive strength. However, the incorporation of OPBC in OPS concrete
significantly enhanced this property. The modulus of elasticity of OPS-OPBC
concrete is in the normal range of structural concretes.
Univers
ity of
Mala
ya

237
iii. The modulus of elasticity of the OPBC concrete was reduced by the incorporation
of the OPS aggregates. The reduction of the modulus of elasticity at high volume
substitution of 60% was found to be very significant.
10.1.9 Ductility Performance
i. The contribution of OPS in OPBC concrete up to 60% could significantly increase
the strain at the peak stress (ε0) of the concrete mixes. This shows that OPS
lightweight aggregate can improve ductility performance of lightweight aggregate
concretes.
10.1.10 Water Absorption
i. The water absorption of OPS concrete was reduced by increasing the percentage
of OPBC aggregates. All OPS-OPBC mixes showed initial and final water
absorption of less than 3% and 10%, respectively, and can be considered good
quality concretes.
ii. Water absorption of the OPBC concrete increased linearly by increasing OPS
content in this concrete. This occurs due to higher water absorption of OPS
compared to OPBC. The results of the current study suggest that the substitution
level should be limited to 20-40% (by volume).
10.1.11 Drying Shrinkage
i. The drying shrinkage of OPS and OPS-OPBC concretes is similar at early ages.
However, OPS-OPBC concrete showed significantly lower drying shrinkage
compared to OPS concrete after one month.
ii. The contribution of OPBC in OPS concrete showed similar shrinkage results of
the drying shrinkage to the control OPS concrete at early ages. However, the long-
term shrinkage was significantly reduced compared to control OPS concrete.
Univers
ity of
Mala
ya
238
iii. The contribution of OPBC in OPS concrete along with small reduction on water
to cement ratio significantly reduced the drying shrinkage compared to control
OPS concrete. The mix C-50(2) showed the lowest shrinkage value among all the
mixes and it was about 40% lower than the OPS concrete.
iv. The incorporation of OPBC aggregate in OPS concrete shows better results under
7-day moist curing compared to structural lightweight aggregate concretes made
of lightweight aggregates such as lytag, expanded shale and sintered fly ash.
v. The OPS-OPBC concrete mixes showed lower early-age drying shrinkage under
7-day curing compared to uncured specimens. The results also confirm that the
curing time is essential to minimize the shrinkage at early ages. Therefore, the pre-
saturation of aggregates reduces the early-age shrinkage and delays the drying
shrinkage.
vi. In early ages, all the prepared lightweight concretes (OPSC, OPBCC and LECA
concrete) showed closer results of drying shrinkage to the conventional concrete
(NWC). Later at 56 days age, the OPSC showed significantly higher drying
shrinkage than the other concretes. Whereas, the OPBCC and LECA concrete
showed similar trend to the conventional concrete.
vii. Long-term (after one year of drying), the OPS concrete on average showed 40%
higher drying shrinkage strains compared to the other concretes.
viii. Compared to OPSC, the aggregates in other concrete mixes (C, L and N) showed
better bonding with the cement paste in Interfacial Transaction Zone (ITZ) and
reduced the formation of micro-cracks, which resulted significantly lower drying
shrinkage strains.
ix. OPSC showed significantly higher drying shrinkage results under 7-day moist
curing, which is about 47%, 41% and 39% higher than the shrinkages of normal
weight, LECA and OPBC concretes, respectively. Whereas, the average
Univers
ity of
Mala
ya
239
difference between the shrinkage values of NWC and OPBCC and LECA
concretes was found in the range of 10-13%.
x. The OPS, OPBC and conventional concrete shows lower early-age shrinkage
under 7-days curing, and the reduction in OPSC was higher than OPBCC and
NWC. This also confirm that the curing time is essential to minimize the shrinkage
at early ages. Whereas, in long-term shrinkage, the cured specimens showed
higher drying shrinkage than the uncured ones, and the average difference for
OPSC and LECA concretes was found almost similar of about 6%.
xi. The ACI drying shrinkage prediction model estimated lower results for the OPS
concrete with the average difference of about 50%. However, for other concretes
(mixes N, C and L), the ratio between the experimental and the predicted results
was found in the range of 20-30%.
xii. The error percentage (EP) and the coefficient of variation (CV) equations were
used to achieve the best prediction model for the lightweight concretes. It was
observed that in early ages, almost all the prediction models estimated closer
results to the experimental curves. However, at later ages only few models showed
closer results. For OPSC, based on EP and CV values, the AS3600 and JSCE
models were the found as best predictors with the accuracy of about 90-96%,
although these models underestimated the shrinkage results.
xiii. For OPS-OPBC50% concrete, four models can be considered as the best predictor,
in that the SAK model predicted 100% similar results to the experimental values,
whereas, the GL2000, MC2010 and AASHTO models predicted closer results to
the experimental values with the accuracy range of about 89-94%. The SAK
model is so simple to use and it can be shown that more complex shrinkage models
may not necessarily be more accurate than the simple models.
Univers
ity of
Mala
ya

240
xiv. Whereas, The B3 model exhibited poor and non-conservative results of the drying
shrinkage prediction for all the mixes, although, this model is more complex.
Based on the results of this study, the accuracy of shrinkage prediction models
depends on the type of aggregates and the compressive strengths of the concrete
mixes. Thus, the effects of types of aggregates such as OPS and OPBC should be
consider in the shrinkage prediction models.
10.1.12 Structural Performance
i. In all the lightweight concrete beams, higher the strength of the concrete the
higher was the ultimate load carrying capacity.
ii. The contribution of oil-palm-boiler clinker (OPBC) in the OPSC beams increased
the structural behaviour of the OPS concrete beams. The OPSC beams up to 35
grade showed a ductile behaviour, however, as the grade of OPSC increased the
beam showed brittle failure without any warning. Whereas, the incorporation of
50% OPBC aggregate in OPSC significantly improves the structural performance
and the failure nature of the beam.
iii. Contribution of the OPBC aggregate in OPS concrete significantly reduced the
number of flexural and shear cracks at the of failure beams.
iv. The ratio of ultimate shear strength to the oven-dry density of the OPS-OPBC
concrete beams was found about 36% higher than the strength to density ratio of
the NWC beams.
v. Contribution of OPBC aggregate in OPS concrete showed better bonding with the
cement paste which reduced the maximum crack widths of the beams at failure.
vi. All the beams showed pure shear failure, without any anchorage failure.
vii. The experimental results of ultimate shear strength of the beams were also
compared with the predicted results. It was found that all the prediction models
selected from different standards estimated very close results of the actual shear
Univers
ity of
Mala
ya

241
strength of the beams. On average, the ACI 318 and the EC 2 models predicted
very conservative results of the ultimate shear strengths with the average ratio of
1.60.
10.2 Recommendations for Future
Further researches are required in order to encompass the different aspects of the
behaviour of OPBC reinforced concrete beams. Following are some recommendations
for future investigations and research.
i. Palm oil industry is producing millions of tons of solid waste materials (OPBC
and OPS) every year, which may be are hazardous and producing environmental
damage. The OPBC have good properties and suitable to use as structural material.
So, the OPBC concrete can be studied in detail under different structural members.
ii. In general, OPBC lightweight has lower workability. Further study is needed to
find proper mix proportions for this type of lightweight concrete with good
workability.
iii. The long-term durability behaviour of OPBC concrete need further study. In
addition, the properties such as drying shrinkage, creep, elastic modulus and bond
strength are not defined extensively. Furthermore, research is needed to
investigate the fire and sound resistance of OPBC concrete.
iv. Only few studies are available about the performance and properties of reinforced
prestressed OPBC concrete beams under static loading. It can be further
investigated in detail under both static and fatigue loadings.
Univers
ity of
Mala
ya
242
REFERENCES
AASHTO-LRFD. (2004). AASHTO LRFD Bridge Design Specifications: Third ed. Washington: American Association of State Highway and Transportation Officials.
Abdullah, AAA. (1996). Palm oil shell aggregate for lightweight concrete. Waste material used in concrete manufacturing, 624-636.
Abdullah, I, Mahmood, WHW, Fauadi, MHF, Rahman, MNA, & Ahmad, F. (2015). Sustainability in Malaysian Palm Oil: A Review on Manufacturing Perspective. Polish Journal of Environmental Studies, 24(4), 1463-1475.
Abdullahi, M, Al-Mattarneh, HMA, Abu Hassan, AH, Hassan, MDH, & Mohammed, BS. (2008). Trial mix design methodology for Palm Oil Clinker (POC) concrete. Paper presented at the In Proceeding of International Conference on Construction and Building Technology (ICCBT)-(45), Malaysia.
Abouhussien, AA, Hassan, AA, & Ismail, MK. (2015). Properties of semi-lightweight self-consolidating concrete containing lightweight slag aggregate. Construction and Building Materials, 75, 63-73.
Achten, WMJ, Vandenbempt, P, Almeida, J, Mathijs, E, & Muys, B. (2010). Life Cycle Assessment of a Palm Oil System with Simultaneous Production of Biodiesel and Cooking Oil in Cameroon. Environmental Science and Technology, 44, 4809-4815.
ACI116R-00. (2000). Cement and Concrete Terminology: American Concrete Institute, Farmington Hills, Michigan, USA, pp. 73.
ACI209-05. (2005). Report on Factors Affecting Shrinkage and Creep of Hardened Concrete: In ACI Manual of Concrete Practice. American Concrete Institute: Farmington Hills, MI.
ACI209R-08. (2008). Guide for modeling and calculating shrinkage and creep in hardened concrete: American Concrete Institute, Farmington Hills, Michigan, USA.
ACI209R-97. (1997). Prediction of Creep, Shrinkage, and Temperature Effects in Concrete Structures (pp. 209R.201-209R.247): In ACI Manual of Concrete Practice. American Concrete Institute: Farmington Hills, MI.
ACI213R-87. (1999). Guide for structural lightweight aggregate concrete. Detroit, American Concrete Institute, USA.
ACI224.1R-07. (2007). Causes, Evaluation, and Repair of Cracks in Concrete Structures: ACI Manual of Concrete Practice, American Concrete Institute, Farmington Hills, MI.
Univers
ity of
Mala
ya
243
ACI308-80. (1980). Proposed ACI Standard: Standard Practice for Curing Concrete (ACI 308-80) (pp. 45-55, 42(11)). American Concrete Institute, Farmington Hills, Michigan, USA.
ACI318-02. (2002). ACI manual of concrete practice, Part 3-02: American Concrete Institute.
ACI318R-05. (2005). Building Code Requirements for Structural Concrete (ACI 318-05) and Commentary (318R-05): American Concrete Institute, Farmington Hills, Michigan, USA.
ACI363-92. (1992). State-of-the-art report on high-strength concrete (ACI 363R-92). American Concrete Institute, Farmington Hills, Michigan, USA.
Ahmad, H, Hilton, M, & Noor, NM. (2007a). Mechanical properties of palm oil clinker concrete. Paper presented at the Proceedings of 1st Engineering conference on Energy and Environment (EnCon2007), Sarawak, Malaysia, UTHM repository.
Ahmad, H, Hilton, M, & Noor, NM. (2007b). Physical properties of local palm oil clinker and fly ash. Paper presented at the Proceedings of 1st Engineering conference on Energy and Environment (EnCon2007), Sarawak, Malaysia, UTHM repository.
Ahmad, Z, Ibrahim, A, & Tahir, P. (2010). Drying shrinkage characteristics of concrete reinforced with oil palm trunk fiber. International Journal of Engineering Science and Technology, 2(5), 1441-1450.
Ahmad, MH, Noor, MN, & Adnan, SH. (2008). Shrinkage of Malaysian palm oil clinker concrete. Paper presented at the In International Conference on Civil Engineering Practice (ICCE08), Kuantan, Malaysia, UTHM repository.
Ahmad, SH, & Shah, SP. (1985). Structural properties of high strength concrete and its implications for precast prestressed concrete. PCI Journal, 30(6), 92-119.
Ahmmad, R, Jumaat, MZ, Bahri, S, & Islam, ABMS. (2014). Ductility performance of lightweight concrete element containing massive palm shell clinker. Construction and Building Materials, 63, 234-241.
Akbar, H. (2008). Design of Reinforced Concrete Structures: Basic Topics. Simay Danesh Publ. Iran.
Al-Attar, TS. (2008). Effect of Coarse Aggregate Characteristics on Drying Shrinkage of Concrete. Journal of Engineering and Technology, 26(2).
Al-Khaiat, H, & Haque, MN. (1998). Effect of initial curing on early strength and physical properties of a lightweight concrete. Cement and Concrete Research, 28(6), 859-866.
Alengaram, UJ. (2009). Mechanical Properties and Structural Behaviour of Palm Kernel Shell Foamed and Non-foamed Concrete. Univerity of Malaya, Malaysia.
Univers
ity of
Mala
ya
244
Alengaram, UJ, Al-Muhit, BA, & Jumaat, MZ. (2013). Utilization of oil palm kernel shell as lightweight aggregate in concrete-a review. Construction and Building Materials, 38, 161-172.
Alengaram, UJ, Jumaat, MZ, & Mahmud, H. (2008a). Ductility behaviour of reinforced palm kernel shell concrete beams. European Journal of Scientific Research, 23(3), 406-420.
Alengaram, UJ, Jumaat, MZ, & Mahmud, H. (2008b). Influence of sand content and silica fume on mechanical properties of palm kernel shell concrete. Paper presented at the In: International Conference on Construction and Building Technology (ICCBT).
Alengaram, UJ, Jumaat, MZ, Mahmud, H, & Fayyadh, MM. (2011). Shear behaviour of reinforced palm kernel shell concrete beams. Construction and Building Materials, 25(6), 2918-2927.
Alengaram, UJ, Mahmud, H, & Jumaat, MZ. (2011). Enhancement and prediction of modulus of elasticity of palm kernel shell concrete. Materials & Design, 32(4), 2143-2148.
Ali, A, Abdullah, A, Salam, ASK, & Rahim, AA. (1984). Basic strength properties of lightweight concrete using agricultural wastes as aggregates. Paper presented at the In International Conference on Low Cost Housing for Developing Countries, 12-17 Nov. 1984, Roorkee, India.
Almusallam, TH, & Alsayed, SH. (1995). Stress-strain relationship of normal, high-strength and lightweight concrete. Magazine of Concrete Research, 47(170), 39-44.
Altwair, NM, & Kabir, SG. (2010). Concrete structures by replacing cement with pozzolanic materials to reduce greenhouse gas emissions for sustainable environment. Paper presented at the Paper presented in American society of civil engineers, 6th International engineering and construction conference (IECC’6), Cairo, Egypt.
Arioz, KO, & Karasu, K. (2008). A preliminary research on the properties of lightweight expanded clay aggregate. Journal of the Australian Ceramic Society, 69(23-30).
AS3600. (2001). Concrete Structures. Standards Australia.
Asad, M. (1995). Computational modelling of shrinkage in repaired concrete. King Fahd University of Petroleum & Minerals, Dhahran, Saudi Arabi.
Aslam, M, Shafigh, P, & Jumaat, MZ. (2015). Structural Lightweight Aggregate Concrete by Incorporating Solid Wastes as Coarse Lightweight Aggregate. Applied Mechanics and Materials, 749, 337-342.
Aslam, M, Shafigh, P, & Jumaat, MZ. (2016a). Drying shrinkage behaviour of structural lightweight aggregate concrete containing blended oil palm bio-products. Journal of Cleaner Production, 127, 183-194.
Univers
ity of
Mala
ya
245
Aslam, M, Shafigh, P, & Jumaat, MZ. (2016b). Oil-palm by-products as lightweight aggregate in concrete mixture: A review. Journal of Cleaner Production, 126, 56-73.
Aslam, M, Shafigh, P, Jumaat, MZ, & Lachemi, M. (2016). Benefits of using blended waste coarse lightweight aggregates in structural lightweight aggregate concrete. Journal of Cleaner Production, 119(108-117).
ASTMC330-05. (2005). Standard specification for lightweight aggregates for structural concrete: Annual book of ASTM standards.
ASTMC330-89. (2003). Standard specification for lightweight aggregates for structural concrete, : Annual Book of ASTM Standards.
ASTMC331-89. (2003). Standard specification for lightweight aggregates for concrete masonry units: ASTM International.
ASTMC332-89. (2003). Standard specification for lightweight aggregates for insulating concrete: Annual Book of ASTM Standards, USA.
ASTMC618. (2003). Standard specification for coal fly ash and raw or calcined natural pozzolan for use in concrete. American society for testing and materials. West Conshohocken, PA, USA: ASTM International.
Atis, CD, Ozcan, F, Kilic, A, Karahan, O, Bilim, C, & Severcan, MH. (2005). Influence of dry and wet curing conditions on compressive strength of silica fume concrete. Building Environment, 40(12), 1678-1683.
Ayhan, M, Gonul, H, Gonul, IA, & Karakus, A. (2011). Effect of basic pumice on morphologic properties of interfacial transition zone in load-bearing lightweight/semi-lightweight concretes. Construction and Building Materials, 25, 2507-2518.
Babu, KG, & Babu, DS. (2003). Behaviour of lightweight expanded polystyrene concrete containing silica fume. Cement and Concrete Research, 33(5), 755-762.
Balendran, R, Zhou, F, Nadeem, A, & Leung, A. (2002). Influence of steel fibres on strength and ductility of normal and lightweight high strength concrete. Building Environment, 37(12), 1361-1367.
Basma, AA, & Jawad, YA. (1995). Probability model for the drying shrinkage of concrete. ACI Materials Journal, 92(3).
Bazant, ZP. (2001). Prediction of concrete creep and shrinkage: past, present and future. Nuclear Engineering and Design, 203(1), 27-38.
Bazant, ZP, & Baweja, S. (2000). Creep and shrinkage prediction model for analysis and design of concrete structures: Model B3. ACI Special Publications, 194, 1-84.
Bazant, ZP, & Kim, JK. (1984). Size effect in shear failure of longitudinally reinforced beams. In Journal Proceedings, 81(5), 456-468.
Univers
ity of
Mala
ya

246
Bazant, ZP, Kim, JK, & Panula, L. (1991). Improved prediction model for time-dependent deformations of concrete: Part 1-Shrinkage. Materials and Structures, 24(5), 327-345.
Bender, B. (1980). The Economics and Use of Lightweight Concrete in Civil Engineering Structure. Paper presented at the Proceedings of the Second International Congress on Lightweight Concrete, United Kingdom.
Beygi, MHA, Kazemi, MT, Nikbin, IM, & Amiri, JV. (2013). The effect of water to cement ratio on fracture parameters and brittleness of self-compacting concrete. Materials & Design, 50, 267-276.
Bhanja, S, & Sengupta, B. (2005). Influence of silica fume on the tensile strength of concrete. Cement and Concrete Research, 35(4), 743-747.
Bhatty, JI, & Reid, KJ. (1989). Lightweight aggregates from incinerated sludge ash. Waste Management & Research, 7, 363-376.
Bissonnette, B, Pierre, P, & Pigeon, M. (1999). Influence of key parameters on drying shrinkage of cementitious materials. Cement and Concrete Research, 29(10), 1655-1662.
Blodgett, MS. (2004). Environmental Impacts of Aggregate and Stone Mining New Mexico Case Study. Center for Science in Public Participation.
Bogas, JA. (2011). Characterization of Structural Lightweight Expanded Clay Aggregate Concrete. Technical University of Lisbon, Instituto Superior Tecnico, Lisbon.
Bogas, JA, Nogueira, R, & Almeida, N. G. (2014). Influence of mineral additions and different compositional parameters on the shrinkage of structural expanded clay lightweight concrete. Materials & Design, 56, 1039-1048.
Boucherit, D, Kenai, S, Kadri, E, & Khatib, JM. (2014). A simplified model for the prediction of long term concrete drying shrinkage. KSCE Journal of Civil Engineering, 18(7), 2196-2208.
Bravo, M, Brito, J, Pontes, J., & Evangelista, L. (2015). Mechanical performance of concrete made with aggregates from construction and demolition waste recycling plants. Journal of Cleaner Production, 99, 59-74.
Bremner, TW, & Eng, P. (2001). Environmental aspects of concrete: problems and solutions. Paper presented at the In: Invited Paper for the Plenary Session of the 1st All Russian Conference on Concrete and Reinforced Concrete.
Bremner, TW, & Holm, TA. (1995). High performance lightweight concrete-a review. ACI Special Publication, 154(1-20).
Brundtland, GH. (1987). Report of the World Commission on environment and development: "Our common future": . United Nations (UN).
BS-8110. (1986). Structural Use of Concrete, code of Practice for Design and Construction (BS-8110: Part 1): United Kingdom.
Univers
ity of
Mala
ya

247
Bukhari, IA, & Ahmad, S (2008). Evaluation of shear strength of high-strength concrete beams without stirrups. Arabian Journal for Science and Engineering, 33(2), 321.
Calkins, M. (2009). Materials for sustainable sites: a complete guide to the evaluation, selection, and use of sustainable construction materials. New York: John Wiley.
Carlson, RW. (1938). Drying Shrinkage of Concrete as Affected by Many Factors. Paper presented at the Paper presented at the Proceedings ASTM.
Carreira, DJ, & Chu, KH. (1985). Stress-strain relationship for plain concrete in compression. Journal Proceedings, 82(6), 797-804.
CCAA-02. (2002). Drying Shrinkage of Cement and Concrete. Cement Concrete & Aggregates Australia.
CCAA-05. (2005). Early-age Shrinkage of Concrete: Cement Concrete and Aggregates Australia.
CEB-Manual. (1985). Cracking and Deformations (pp. 232): Ecole Polytechnique Fédérale de Lausanne.
CEB/FIP90. (2001). CEB Code Final Draft Section 3 Materials prEN 1992-1 (pp. 25-31): Comite Euro-Internacional du Beton (CEB) and Federation Internationale de la Precontrainte (FIP).
CEB/FIP-83. (1983). Manual of design and technology, Lightweight Aggregate Concrete. The Construction Press, London, New York.
CEB/FIP-90. (1993). Committee Euro-International du Beton (CEB-FIP). Thomas Telford, London.
CEB/FIP. (1977). CEB/FIP manual of design and technology, Lightweight Aggregate Concrete: First pub. The Construction Press Ltd, Lancaster, England.
Chan, CM, & Robani, R. (2008). Alternative aggregates from Clay-POC: an exploratory study. Paper presented at the In Proceeding of International Conference on Construction and Building Technology (ICCBT), June 16-20, 2008, Kuala Lumpur, Malaysia.
Chandra, S, & Berntsson, L. (2002). Lightweight aggregate concrete: Science, technology, and applications. United States, Noyes/William A Pub, Elsevier.
Chandran, S. (2010). Performance of Foamed concrete by using by product material: Palm Oil Clinker Crushed (POCC) as sand replacement. (Bachelor of Civil Engineering), University Malaysia Pahang.
Chuan, LF. (2015). Innovative Cement Additives Quality Improvers in Sustainable Cement and Concrete. Sains Malaysiana, 44(11), 1599-1607.
Clarke, JL. (2002). Structural lightweight aggregate concrete: Taylor &Francis e-Library, CRC Press, London, United Kingdom.
Univers
ity of
Mala
ya

248
Coquillat, G. (1986). Influence of Physical and Mechanical Properties of Lightweight Aggregate on the Properties of Lightweight Concrete Structure (pp. 255-298). Aggregates and Concretes Lightweight Bilan e Ten Years of Research, Arnould and Virlogeux. National School of Bridges and Roads Press.
CSA-A23.3. (2004). Design of Concrete Structures (CSA A23.3-04), Canadian Standards Association, Mississauga, ON, Canada, pp. 214.
Day, KW. (2003). Concrete Mix Design, Quality Control and Specification: CRC Press, Croydon, Victoria, Australia.
De Nicolo, B, Pani, L, & Pozzo, E. (1994). Strain of concrete at peak compressive stress for a wide range of compressive strengths. Materials and Structures, 27(4), 206-210.
Desayi, P, & Krishnan, S. (1964). Equation for the stress-strain curve of concrete. ACI Journal, 61(3), 345-350.
Drexhage, J, & Murphy, D. (2010). Sustainable development: from Brundtland to Rio 2012 (pp. 9-13). United Nations Headquarters, New York.
Duzgun, OA, Gul, R, & Aydin, AC. (2005). Effect of steel fibers on the mechanical properties of natural lightweight aggregate concrete. Materials letters, 59(27), 3357-3363.
Eggleston, S, Buendia, L, Miwa, K, Nagara, T, & Tanabe, K. (2006). IPCC Guidelines for National Greenhouse Gas Inventories. Vol. 4 - Agriculture, Forestry and Other Land Use; IGES. Japan.
Emdadi, Z, Asim, N, Yarmo, MA, & Shamsudin, R. (2014). Investigation of More Environmental Friendly Materials for Passive Cooling Application Based on Geopolymer. APCBEE Procedia, 10, 69-73.
EN2. (2004). Design of concrete structures – part 1-1: General rules and rules for buildings: BS EN 1992-1-1: London: British Standards Institution.
EN1992. (2010). Eurocode 2: Design of concrete structures - Part 1-1: General rules and rules for buildings: European Committee for standardization CEN.
Faaij, A. (2006). Modern biomass conversion technologies. Mitigation and adaptation strategies for global change, 11(2), 335-367.
Fafitis, A, & Shah, SP. (1985). Predictions of ultimate behavior of confined columns subjected to large deformations. In Journal of the ACI, 82(2), 423-433.
Fujiwara, H, Tomita, R, & Shimoyamata, Y. (1994). Study of Frost Resistance of Concrete Using an Organic Shrinkage-reducing Agent. ACI Special Publication, 145, 643-656.
Gao, XF, Lo, YT, & Tam, CM. (2002). Investigation of micro-cracks and microstructure of high performance lightweight aggregate concrete. Building Environment, 37(5), 485-489.
Univers
ity of
Mala
ya

249
Gardner, NJ, & Lockman, MJ. (2001). Design Provisions for Drying Shrinkage and Creep of Normal-Strength Concrete. ACI Materials Journal, 98, 159-167.
Gergely, P, & Lutz, L. (1973). Maximum Crack Width in Reinforced Concrete Flexural Members, Causes, Mechanism and Control of Cracking in Concrete. ACI Publication SP-20, American Concrete Institute, Detroit, MI(87-117).
Gesoglu, M, Ozturan, T, & Guneyisi, E. (2004). Shrinkage cracking of lightweight concrete made with cold-bonded fly ash aggregates. Cement and Concrete Research, 34(7), 1121-1130.
Gilbert, RI. (1998). Serviceability considerations and requirements for high performance reinforced concrete slabs. Paper presented at the In Proceedings International Conference On High Performance High Strength Concrete.
Gilbert, RI. (2002). Creep and shrinkage models for high strength concrete-proposals for inclusion in AS3600. Australian Journal of Structural Engineering, 4(2), 95-106.
Gribniak, V, Kaklauskas, G, Kliukas, R, & Jakubovskis, R. (2013). Shrinkage effect on short-term deformation behavior of reinforced concrete - when it should not be neglected. Materials & Design, 51, 1060-1070.
Gunasekaran, K, Kumar, PS, & Lakshmipathy, M. (2011). Mechanical and bond properties of coconut shell concrete. Construction and Building Materials, 25, 92-98.
Gunduz, L, & Ugur, I. (2005). The effects of different fine and coarse pumice aggregate/cement ratios on the structural concrete properties without using any admixtures. Cement and Concrete Research, 35(9), 1859-1864.
Hansen, W. (1987). Drying shrinkage mechanisms in Portland cement paste. Journal of the American Ceramic society, 70(5), 323-328.
Haque, M. (1990). Some concretes need 7 days initial curing. Concrete International, 12(2), 42-46.
Haque, M, Al-Khaiat, H, & Kayali, O. (2004). Strength and durability of lightweight concrete. Cement and Concrete Composites, 26(4), 307-314.
Harmon, KS. (2007). Engineering properties of structural lightweight concrete. Carolina Stalite Company.
Hassan, AH, Al-Mattarneh, HMA, Abdullahi, M, Mohamed, BS, & Mustafa, AH. (2008). Compressive Strength and Absorption of Concrete Composed of Natural and Palm Oil Clinker (POC) Aggregates. ICCBT 2008-A-(07), 93-100.
Heijungs, R, Huppes, G, & Guinee, JB. (2010). Life cycle assessment and sustainability analysis of products, materials and technologies. Toward a scientific framework for sustainability life cycle analysis. Polymer Degradation and Stability, 95, 422-428.
Univers
ity of
Mala
ya
250
Hemmings, RT, Cornelius, BJ, Yuran, P, & Milton, W. (2009). Comparative study of lightweight aggregates. Paper presented at the Paper presented at the In 2009 World of Coal Ash (WOCA) Conference, May 4-7. 2009, in Lexington, KY, USA.
Henkensiefken, R, Bentz, D, Nantung, T, & Weiss, J. (2009). Volume change and cracking in internally cured mixtures made with saturated lightweight aggregate under sealed and unsealed conditions. Cement and Concrete Composites, 31(7), 427-437.
Henkensiefken, R, Nantung, T, & Weiss, J. (2008). Reducing restrained shrinkage cracking in concrete: examining the behavior of self-curing concrete made using different volumes of saturated lightweight aggregate. Paper presented at the In: Paper Presented at the National Concrete Bridge Conference, St. Louis, MO.
Hilmi, M, Shafigh, P, & Jumaat, MZ. (2014). Structural lightweight aggregate concrete containing high volume waste materials. Key Engineering Materials (594-595), 498-502.
Holm, TA, & Bremner, TW. (1991). Durability of Structural Lightweight Concrete. ACI Special Publication, 126, 1119-1134.
Holm, TA, & Bremner, TW. (2000). State of the art report on high strength, high durability structural low-density concrete for applications in severe marine environments: US Army Corps of Engineers, Engineering Research and Development Center, ERDC/SLTR-00-3.
Hossain, KMA, Ahmed, S, & Lachemi, M. (2011). Lightweight concrete incorporating pumice based blended cement and aggregate: mechanical and durability characteristics. Construction and Building Materials, 25(3), 1186-1195.
Hossain, Khandaker, MA. (2004). Properties of volcanic pumice based cement and lightweight concrete. Cement and Concrete Research, 34(2), 283-291.
Hossain, K, & Lachemi, M. (2007). Mixture design, strength, durability, and fire resistance of lightweight pumice concrete. ACI Materials Journal, 104(5).
Hosseini, Booshehrian, A, Delkash, M, Ghavami, S, & Zanjani, MK. (2009). Use of nano-SiO2 to improve microstructure and compressive strength of recycled aggregate concretes. Paper presented at the In: Proceeding, nanotechnology in construction (NICOM3). Springer.
Hosseini, SE, & Wahid, MA. (2014). Utilization of palm solid residue as a source of renewable and sustainable energy in Malaysia. Renewable and Sustainable Energy Reviews, 40, 621-632.
Hussein, SH, Mustapha, KMB, Muda, ZC, & Budde, S. (2012). Modelling of ultimate load for lightweight palm oil clinker reinforced concrete beams with web openings using response surface methodology. International Journal of Civil Engineering and Technology, 3(1), 33-44.
Univers
ity of
Mala
ya

251
Hussin, M, Zhuge, Y, Bullen, F, & Lokuge, W. (2013). A mathematical model for complete stress-strain curve prediction of permeable concrete. Paper presented at the Proceedings of the 22nd Australasian Conference on the Mechanics of Structures and Materials (ACMSM 22). Taylor & Francis (CRC Press)/Balkema.
Islam, MMU, Mo, KM, Alengaram, UJ, & Jumaat, MZ. (2016). Mechanical and fresh properties of sustainable oil palm shell lightweight concrete incorporating palm oil fuel ash. Journal of Cleaner Production, 115, 307-314.
ISO-14040. (2006). International Standardization for Organization (ISO), Environmental Management: Life Cycle Assessment: Principles and Framework (Vol. 14040) (pp. 20).
JSCE3600. (2007). JSCE Guideline for Concrete No. 15, Standard Specifications for Concrete Structures - Design: Concrete Committee of Japan Society of Civil Engineers.
Jumaat, MZ, Alengaram, UJ, & Mahmud, H. (2009). Shear strength of oil palm shell foamed concrete beams. Materials & Design, 30(6), 2227-2236.
Kamaruddin, R. (1991). Application of Bamboo and oil palm clinker in lightweight reinforced concrete beams. (Master of Science in the Faculty of Engineering), University Pertanian Malaysia.
Kanadasan, J, & Razak, HA. (2014a). Fresh Properties of Self-Compacting Concrete Incorporating Palm Oil Clinker. In CIEC 2013 (pp.249-259): Springer.
Kanadasan, J, & Razak, HA. (2014b). Mix design for self-compacting palm oil clinker concrete based on particle packing. Materials & Design, 56, 9-19.
Kanadasan, J, & Razak, HA. (2015). Engineering and sustainability performance of self-compacting palm oil mill incinerated waste concrete. Journal of Cleaner Production, 89, 78-86.
Karim, MR, Zain, MFM, Jamil, M, & Lai, FC. (2011). Significance of Waste Materials in Sustainable Concrete and Sustainable Development. Paper presented at the International Conference on Biotechnology and Environment Management IPCBEE vol.18, IACSIT Press, Singapore.
Kayali, O, Haque, MN, & Zhu, B. (1999). Drying shrinkage of fibre-reinforced lightweight aggregate concrete containing fly ash. Cement and Concrete Research, 29(11), 1835-1840.
Khanzadeh, M. (2010). Accuracy of Shrinkage Prediction Models in High Performance Concretes Containing Slag and Silica Fume. Paper presented at the In Second International Conference on Sustainable Construction Materials and Technologies: Ancona, Italy.
Kilic, A, Atis, CD, Yasar, E, & Ozcan, F. (2003). High-strength lightweight concrete made with scoria aggregate containing mineral admixtures. Cement and Concrete Research, 33(10), 1595-1599.
Univers
ity of
Mala
ya
252
Kockal, NU, & Ozturan, T. (2011). Strength and elastic properties of structural lightweight concretes. Materials & Design, 32(4), 2396-2403.
Kong, & Evans, RH. (1998). Reinforced and prestressed concrete. CRC Press, London, United Kingdom.
Kong, Loh, SK, Bachmann, RT, Rahim, SA, & Salimon, J. (2014). Biochar from oil palm biomass: A review of its potential and challenges. Renewable and Sustainable Energy Reviews, 39, 729-739.
Kosmatka, SH, Kerkhoff, B, & Panarese, WC. (2002). Design and control of concrete mixtures. 14th ed. USA: Portland cement Association.
Kovler, K, & Jensen, OM. (2007). Internal Curing of Concrete, Conclusion and Outlook. pp. 137-140. RILEM TC 196-ICC- State-of-the-art report.
Lam, MK, Lee, KT, & Mohamed, AR. (2009). Life cycle assessment for the production of biodiesel: A case study in Malaysia for palm oil versus Jatropha oil. Biofuels, Bioproducts and Biorefining, 3, 601-612.
Lamond, JF. (2006). Significance of tests and properties of concrete and concrete making materials ASTM Intternational (Vol. 169). USA.
Lee, KT, & Ofori-Boateng, C. (2013). Sustainability of biofuel production from oil palm biomass. First Ed. Springer, SPS Penang, Malaysia.
Leed. (2009). US Green Building Council. LEED Reference Guide for Green Building Design and Construction 2010 (pp. 678). Edition: LEED 2009, ISBN 9781932444346, Washington DC.
Ling, KA. (2011). Evaluation of oil palm site suitability using Analytical Hierarchy Processing developed index and geographical information system application at KG. Beratok and KG. (Tapah, Samarahan. MSc Environmental Science), University Malaysia Sarawak, Malaysia.
Liu, MYJ, Alengaram, UJ, Jumaat, MZ, & Mo, KH. (2014). Evaluation of thermal conductivity, mechanical and transport properties of lightweight aggregate foamed geopolymer concrete. Energy and Buildings, 72, 238-245.
Lo, TY, Cui, HZ, & Li, ZG. (2004). Influence of aggregate pre-wetting and fly ash on mechanical properties of lightweight concrete. Waste management, 24(4), 333-338.
Lo, TY, Tang, WC, & Cui, HZ. (2007). The effects of aggregate properties on lightweight concrete. Building Environment, 42(8), 3025-3029.
Ludin, NA, Bakri, MAM, Hashim, M, Sawilla, B, Menon, NR, & Mokhtar, H. (2004). Palm oil biomass for electricity generation in Malaysia. Pusat Tenaga Malaysia, Malaysia Palm Oil Board, the Institution of Engineers Malaysia.
Lura, Van Breugel, K, & Maruyama, I. (2002). Autogenous and drying shrinkage of high-strength lightweight aggregate concrete at early ages-the effect of specimen size.
Univers
ity of
Mala
ya
253
Paper presented at the In Proc: Early Age Cracking in Cementitious Systems-EAC01, Proceedings of the International RILEM Conference.
Lura, P, Bentz, DP, Lange, DA, Kovler, K, Bentur, A, & Breugel, K. (2006). Measurement of water transport from saturated pumice aggregates to hardening cement paste. Materials and Structures, 39(9), 861-868.
Mahmud, H, Jumaat, MZ, & Alengaram, UJ. (2009). Influence of sand/cement ratio on mechanical properties of palm kernel shell concrete. Journal of Applied Science, 9(9), 1764-1769.
Malesev, M, Radonjanin, V, Lukic, I, & Bulatovic, V. (2014). The effect of aggregate, type and quantity of cement on modulus of elasticity of lightweight aggregate concrete. Arabian Journal for Science and Engineering, 39(2), 705-711.
Mannan, MA, Alexander, J, Ganapathy, C, & Teo, DCL. (2006). Quality improvement of oil palm shell (OPS) as coarse aggregate in lightweight concrete. Building Environment, 41(9), 1239-1242.
Mannan, MA, Basri, HB, Zain, MFM, & Islam, MN. (2002). Effect of curing conditions on the properties of OPS-concrete. Building Environment, 37(11), 1167-1171.
Mannan, MA, & Ganapathy, C. (2001a). Long-term strengths of concrete with oil palm shell as coarse aggregate. Cement and Concrete Research, 31(9), 1319-1321.
Mannan, MA, & Ganapathy, C. (2001b). Mix design for oil palm shell concrete. Cement Concrete Research, 31(9), 1323-1325.
Mannan, MA, & Ganapathy, C. (2002). Engineering properties of concrete with oil palm shell as coarse aggregate. Construction and Building Materials, 16(1), 29-34.
Mannan, MA, & Ganapathy, C. (2004). Concrete from an agricultural waste-oil palm shell (OPS). Building Environment, 39(4), 441-448.
Mannan, MA, & Neglo, K. (2010). Mix design for oil-palm-boiler clinker (OPBC) concrete. Journal of Science and Technology (Ghana), 30(1).
Maslehuddin, M, Ibrahim, M, Shameem, M, Ali, MR, & Al-Mehthel, MH. (2013). Effect of curing methods on shrinkage and corrosion resistance of concrete. Construction and Building Materials, 41, 634-641.
Matsushita, H, & Tsuruta, H. (1998). The Influences of Quality of Coarse Aggregate on the Autogenous Shrinkage Stress in High-Fluidity Concrete, Autogenous Shrinkage of Concrete. Paper presented at the In Proceedings of the International Workshop Organized by JCI, Hiroshima, Japan, E & FN Books, London and New York.
MC2010. (2011). Model Code (MC) prepared by fib special Activity Group 5 – Final draft: CEB/FIP.
Univers
ity of
Mala
ya

254
McKeen, RG, & Ledbetter, WB. (1969). Evaluation of Shrinkage-cracking Characteristics of Structural Lightweight Concrete. Texas A&M University College Station, Texas. Research Report 81-11.
Mefteh, H, Kebaili, O, Oucief, H, Berredjem, L, & Nourredine Arabi, N. (2013). Influence of moisture conditioning of recycled aggregates on the properties of fresh and hardened concrete. Journal of Cleaner Production, 54, 282-288.
Mehta, PK, & Monteiro, PJM (2006). Concrete: Microstructure, Properties and Materials. Third Ed. McGraw-Hill, USA, New York.
Mo, KH, Alengaram, UJ, & Jumaat, MZ. (2014). A review on the use of agriculture waste material as lightweight aggregate for reinforced concrete structural members. Advances in Materials Science and Engineering, 2014, 9 pages.
Mo, KH, Alengaram, UJ, & Jumaat, MZ. (2015). Compressive behaviour of lightweight oil palm shell concrete incorporating slag. Construction and Building Materials, 94, 263-269.
Mo, KH, Alengaram, UJ, Jumaat, MZ, Liu, MYJ, & Lim, J. (2016). Assessing some durability properties of sustainable lightweight oil palm shell concrete incorporating slag and manufactured sand. Journal of Cleaner Production, 112, 763-770.
Mo, KH, Alengaram, UJ, Jumaat, MZ, & Yap, SP. (2015). Feasibility study of high volume slag as cement replacement for sustainable structural lightweight oil palm shell concrete. Journal of Cleaner Production, 91, 297-304.
Mohammed, BS, Al-Ganad, MA, & Abdullahi, M. (2011). Analytical and experimental studies on composite slabs utilizing palm oil clinker concrete. Construction and Building Materials, 25(8), 3550-3560.
Mohammed, BS, Foo, WL, & Abdullahi, M. (2014). Flexural strength of palm oil clinker concrete beams. Materials & Design, 53, 325-331.
Mohammed, BS, Hossain, KMA, Foo, WL, & Abdullahi, M. (2011). Rapid Chloride Permeability Test on Lightweight Concrete Made with Oil Palm Clinker. Journal of Engineering Research and Applications (IJERA) ISSN. 2248, 9622.
Mohammed, BS, Hossain, KMA, Foo, WL, & Abdullahi, M. (2013). Shear strength of palm oil clinker concrete beams. Materials & Design, 46, 270-276.
Moravia, WG, Gumieri, AG, & Vasconcelos, WL. (2010). Efficiency factor and modulus of elasticity of the lightweight concrete with expanded clay aggregate. IBRACON Structures and Materials Journal, 3(2), 195-204.
Morsch, E. (1909). Concrete steel construction (Der Eisenbetonbau). English translation of the 3rd German edition, McGraw-Hill Book Co., New York.
Mosley, WH, Hulse, R, & Bungey, JH. (2012). Reinforced Concrete Design: to Eurocode 2: 6th ed. New York: Palgrave Macmillan.
Univers
ity of
Mala
ya

255
Nagaratnam, BH, Rahman, ME, Mirasa, AK, Mannan, MA, & Lame, SO. (2015). Workability and Heat of Hydration of Self-Compacting Concrete incorporating Agro-Industrial Waste. Journal of Cleaner Production, 112(1), 882-894.
Narayanan, RS, Wilson, KR, & Milne, RJW. (2000). Manual for the design of reinforced concrete building structures to EC2. Published for the Institution of Structural Engineers. Published by SETO.
Nazari, A. (2012). Fuzzy logic for prediction water absorption of lightweight geopolymers produced from waste materials. Ceramics International, 38(6), 4729-4736.
Nazari, A, & Khalaj, G. (2012). Prediction compressive strength of lightweight geopolymers by ANFIS. Ceramics International, 38(6), 4501-4510.
Nazari, A, Riahi, S, & Bagheri, A. (2012). Designing water resistant lightweight geopolymers produced from waste materials. Materials & Design, 35, 296-302.
Neville, AM. (1971). Hardened Concrete: Physical and Mechanical Aspects. ACI Monograph No. 6. American Concrete Institute, Iowa State University Press, Detroit, USA.
Neville, AM. (1996). Properties of Concrete. Fourth Ed. John Wiley and Sons, Inc, NewYork.
Neville, AM. (2008). Properties of concrete. 14th ed., Prentice Hall, Malaysia.
Neville, AM, & Brooks, JJ. (2008). Concrete Technology. Malaysia: Prentice Hall.
Newman, J, & Owens, P. (2003). Properties of lightweight aggregate. Advanced concrete technology set, 3-29.
Nilsen, UA, & Aitcin, PC. (1992). Properties of high-strength concrete containing light-, normal-, and heavyweight aggregate. Cement, Concrete and Aggregate, 14(1), 8-12.
Okafor, FO. (1988). Palm kernel shell as a lightweight aggregate for concrete. Cement Concrete Research, 18(6), 901-910.
Okpala, D. (1990). Palm kernel shell as a lightweight aggregate in concrete. Building Environment, 25(4), 291-296.
Olanipekun, EA, Olusola, KO, & Ata, O. (2006). A comparative study of concrete properties using coconut shell and palm kernel shell as coarse aggregates. Building Environment, 41(3), 297-301.
Oliveira, MJ, Ribeiro, AB, & Branco, FG. (2015). Curing effect in the shrinkage of a lower strength self-compacting concrete. Construction and Building Materials, 93, 1206-1215.
Univers
ity of
Mala
ya

256
Pelisser, F, Barcelos, A, Santos, D, Peterson, M, & Bernardin, AM. (2012). Lightweight concrete production with low Portland cement consumption. Journal of Cleaner Production, 23, 68-74.
Pickett, G. (1956). Effect of aggregate on shrinkage of concrete and hypothesis concerning shrinkage. Journal Proceedings, 27(5), 581-590.
Polat, R, Demirboga, R, & Karakoc, MB. (2010). The influence of lightweight aggregate on the physico-mechanical properties of concrete exposed to freeze-thaw cycles. Cold Regions Science and Technology, 60(1), 51-56.
Popovics, S. (1970). A review of stress-strain relationships for concrete. In ACI Journal proceedings, 67(3), 243-248.
Powers, TC. (1959). Causes and Control of Volume Change. Journal of the PCA Research and Development Laboratories, 1(1), 29-39.
Priyadharshini, PG, & Santhi, AS. (2012). A review on artificial aggregates. International Journal of Earth Science and Engineering, 5(3), 540-546.
Ranjbar, MM, Madandoust, R, Mousavi, SY, & Yosefi, S. (2013). Effects of natural zeolite on the fresh and hardened properties of self-compacted concrete. Construction and Building Materials, 47, 806-813.
Rao, GA. (2001). Long-term drying shrinkage of mortar-influence of silica fume and size of fine aggregate. Cement and Concrete Research, 31(2), 171-175.
Raut, SP, Ralegaonkar, RV, & Mandavgane, SA. (2011). Development of sustainable construction material using industrial and agricultural solid waste: A review of waste-create bricks. Construction and Building Materials, 25(10), 4037-4042.
Rebitzer, G, Ekvall, T, Frischknecht, R, Hunkeler, D, Norris, G, Rydberg, T, . . . Pennington, DW. (2004). Life Cycle Assessment. Part 1: framework, goal and scope definition, inventory analysis, and applications. Environment International, 30, 701-720.
Recommendation, RD, & DE LA RILEM, PDR. (1995). Creep and shrinkage prediction model for analysis and design of concrete structures-model B3. Ed. ZP Bazant, S. Baweja. Materials and Structures, 28, 357-365.
Reineck, KH, & Kuchma, DA. (2003). Shear database for reinforced concrete members without shear reinforcement. ACI Structural Journal, 2, 240-249.
RILEM. (1999). Database on creep and shrinkage tests - 3.0.
Robani, R, & Chee, MC. (2009). Reusing soft soils with cement-palm oil clinker (POC) stabilization. Paper presented at the Paper presented at the International Conference on Engineering and Education In the 21st Century held in conjunction with the IEM 50th Anniversary Celebration, 23-25 March 2009, Sarawak, Malaysia, pp.1-4.
Univers
ity of
Mala
ya

257
Rodrigues, F, Carvalho, MT, Evangelista, L, & Brito, J. (2013). Physical-chemical and mineralogical characterization of fine aggregates from construction and demolition waste recycling plants. Journal of Cleaner Production, 52, 438-445.
Ros, M. (1950). Material-technological foundation and problems of reinforced concrete. Bericht, 162.
Roslli, WO, & Mohamed, N. (2002). The performance of pretensioned prestressed concrete beams made with lightweight concrete. Jurnal Kejuruteraan Awam, 14(1), 60-70.
Saito, M, Kawamura, M, & Arakawa, S. (1991). Role of aggregate in the shrinkage of ordinary Portland and expansive cement concrete. Cement and Concrete Composites, 13(2), 115-121.
Sakata, K, Tsubaki, T, Inoue, S, & Ayano, T. (2001). Prediction equations of creep and drying shrinkage for wide-ranged strength concrete. In Creep, Shrinkage and Durability of Concrete and other quasi-brittle Materials. Paper presented at the Proceedings of the Sixth International Conference, Cambridge (MA).
Salam, SA, Ali, SK, & Abdullah, A. (1987). Lightweight concrete using oil palm shells as aggregates. Paper presented at the In National Symposium on Oil Palm by Products for Agro-Based Industries, 5-6 Nov. 1985, Kuala Lumpur.
Sallam, SA, & Abdullah, AAA. (1985). Lightweight concrete using oil palm shells as aggregates. National symposium on oil palm by-products for agro-based industries. Kuala Lumpur.
Sanjayan, JG, Nazari, A, Chen, L, & Nguyen, GH. (2015). Physical and mechanical properties of lightweight aerated geopolymer. Construction and Building Materials, 79(236-244).
Sari, Mat, S, Badri, KH, & Zain, MFM. (2015). A Study on the Characteristics of Palm-Based Polyurethane as a Lightweight Aggregate in Concrete Mix. Sains Malaysiana, 44(6), 771-778.
Sari, & Pasamehmetoglu, AG. (2005). The effects of gradation and admixture on the pumice lightweight aggregate concrete. Cement and Concrete Research, 35(5), 936-942.
Satish, C, & Berntsson, L. (2003). Lightweight Aggregate Concrete, Science, Technology, and Applications: Noyes Publications, New York.
Selih, J, & Bremner, TW. (1996). Drying of saturated lightweight concrete: an experimental investigation. Materials and Structures, 29(7), 401-405.
Shafigh, P, Alengaram, UJ, Mahmud, HB, & Jumaat, MZ. (2013). Engineering properties of oil palm shell lightweight concrete containing fly ash. Materials & Design, 49, 613-621.
Univers
ity of
Mala
ya
258
Shafigh, P, Ghafari, H, Mahmud, HB, & Jumaat, MZ. (2014). A comparison study of the mechanical properties and drying shrinkage of oil palm shell and expanded clay lightweight aggregate concretes. Materials & Design, 60, 320-327.
Shafigh, P, Jumaat, MZ, & Mahmud, H. (2011). Oil palm shell as a lightweight aggregate for production high strength lightweight concrete. Construction and Building Materials, 25(4), 1848-1853.
Shafigh, P, Jumaat, MZ, & Mahmud, H. (2012). Effect of replacement of normal weight coarse aggregate with oil palm shell on properties of concrete. Arabian Journal for Science and Engineering, 37(4), 955-964.
Shafigh, P, Jumaat, MZ, Mahmud, H, & Alengaram, UJ. (2013). Oil palm shell lightweight concrete containing high volume ground granulated blast furnace slag. Construction and Building Materials, 40, 231-238.
Shafigh, P, Jumaat, MZ, Mahmud, H, & Norjidah, AA. (2012). Lightweight concrete made from crushed oil palm shell: tensile strength and effect of initial curing on compressive strength. Construction and Building Materials, 27(1), 252-258.
Shafigh, P, Jumaat, MZ, Mahmud, HB, & Alengaram, UJ. (2011). A new method of producing high strength oil palm shell lightweight concrete. Materials & Design, 32(10), 4839-4843.
Shafigh, P, Mahmud, H, & Jumaat, MZ. (2010). Mix design and mechanical properties of oil palm shell lightweight aggregate concrete: a review. International journal of the physical sciences, 5(14), 2127-2134.
Shafigh, P, Mahmud, H, & Jumaat, MZ. (2011). Effect of steel fiber on the mechanical properties of oil palm shell lightweight concrete. Materials & Design, 32(7), 3926-3932.
Shafigh, P, Mahmud, H, Jumaat, MZ, Ahmmad, R, & Bahri, S. (2014). Structural lightweight aggregate concrete using two types of waste from the palm oil industry as aggregate. Journal of Cleaner Production, 80, 187-196.
Shafigh, P, Mahmud, HB, & Jumaat, MZ. (2012). Oil palm shell lightweight concrete as a ductile material. Materials & Design, 36, 650-654.
Shams, MK, & Kahn, LF. (2000). Time-dependent behavior of high-strength concrete: task 3, use of high strength/high performance concrete for precast prestressed concrete bridges in Georgia. Structural Engineering, Mechanics, and Materials Research Report No. 00-1, Georgia Institute of Technology, Atlanta GA.
Shannag, MJ. (2011). Characteristics of lightweight concrete containing mineral admixtures. Construction and Building Materials, 25, 658-662.
Shetty, MS. (2005). Concrete technology – theory and practice. New Delhi, India: S. Chand and Company Limited.
Shi, C, Wu, Z, Lv, K, & Wu, L. (2015). A review on mixture design methods for self-compacting concrete. Construction and Building Materials, 84, 387-398.
Univers
ity of
Mala
ya

259
Short, AKW. (1978). Lightweight concrete. London, United Kingdom: Applied Science Publishers Ltd.
Shuaib, HA, & Barker, R. (1991). Flexural behavior of reinforced high-strength lightweight concrete beams. ACI Structural Journal USA, 88(1), 69-77.
Shuit, SH, Tan, KT, Lee, KT, & Kamaruddin, AH. (2009). Oil palm biomass as a sustainable energy source: a Malaysian case study. Energy, 34(9), 1225-1235.
Silva, RV, Brito, J, & Dhir, RK. (2016). Establishing a relationship between modulus of elasticity and compressive strength of recycled aggregate concrete. Journal of Cleaner Production, 112(4), 2171-2186.
Sinha, SN. (2002). Reinforced concrete design. Tata McGraw-Hill Education.
Slate, FO, Nilson, AH, & Martinez, S. (1986). Mechanical properties of high-strength lightweight concrete. Paper presented at the ACI Journal Proceedings, 83(4), 606-613.
Sobuz, HR, Hasan, NMS, Tamanna, N, & Islam, MS. (2014). Structural Lightweight Concrete Production by Using Oil Palm Shell. Journal of Materials, 2014, 1-6.
Soleymani, F. (2012). Pore structure and flexural strength of ZrO2 nanopowders palm oil clinker aggregate-based binary blended concrete. Journal of American Science, 8(6), 187-194.
Tadros, GS. (1970). Plastic rotation of reinforced concrete members subjected to bending, axial load and shear.
Tam, VWY. (2009). Comparing the implementation of concrete recycling in the Australian and Japanese construction industries. Journal of Cleaner Production, 17(688-702).
Tasnimi, A. (2004). Mathematical model for complete stress-strain curve prediction of normal, light-weight and high-strength concretes. Magazine of Concrete Research, 56(1), 23-34.
Teo, DCL, Mannan, MA, & Kurian, JV. (2006). Flexural behaviour of reinforced lightweight concrete beams made with oil palm shell (OPS). Journal of advanced concrete technology, 4(3), 459-468.
Teo, DCL, Mannan, MA, & Kurian, VJ. (2009). Production of lightweight concrete using oil palm shell (OPS) aggregates. Paper presented at the In: 4th International Conference on Structural Materials (ConMat 2009), 24-26 August 2009, Nagoya.
Teo, DCL, Mannan, MA, Kurian, VJ, & Ganapathy, C. (2007). Lightweight concrete made from oil palm shell (OPS): structural bond and durability properties. Building Environment, 42(7), 2614-2621.
Tongaroonsri, S, & Tangtermsirikul, S. (2009). Effect of mineral admixtures and curing periods on shrinkage and cracking age under restrained condition. Construction and Building Materials, 23, 1050-1056.
Univers
ity of
Mala
ya

260
Topcu, IB, & Uygunoglu, T. (2010). Effect of aggregate type on properties of hardened self-consolidating lightweight concrete (SCLC). Construction and Building Materials, 24(7), 1286-1295.
Trumble, R, & Santizo, L. (1993). Advantages of using lightweight concrete in a medium rise building and adjoining post-tensioned parking garage. ACI Special Publication, 136, 247-254.
Turatsinze, A, & Garros, M. (2008). On the modulus of elasticity and strain capacity of self-compacting concrete incorporating rubber aggregates. Resources, Conservation and Recycling, 52, 1209-1215.
UNEP. (2013). United Nations Environment Programme (UNEP), Global environment outlook 2000. Routledge, London, Sterling, VA.
United Nations. (1993). Report of the United Nations Conference on Environment and Development. Rio de Janeiro, 3-14 June 1992: New York: United Nations (UN).
Weber, S, & Reinhardt, HW. (1997a). Improved Durability of High-Strength Concrete Due to Autogenous Curing. ACI Special Publication, 170.
Weber, S, & Reinhardt, HW. (1997b). A new generation of high performance concrete: concrete with autogenous curing. Advanced Cement Based Materials, 6(2), 59-68.
Wegen, V, & Bijen, J. (1985). Properties of concrete made with three types of artificial PFA coarse aggregates. Cement and Concrete Composites, 7, 159-167.
Weigler, H, & Karl, S. (1980). Structural lightweight aggregate concrete with reduced density-lightweight aggregate foamed concrete. International Journal of Cement Composites and Lightweight Concrete, 2(2), 101-104.
Weiss, WJ, & Shah, SP. (2002). Restrained shrinkage cracking: the role of shrinkage reducing admixtures and specimen geometry. Materials and Structures, 35(2), 85-91.
West, MB. (2010). Effect of Materials and Curing Period on Shrinkage of Concrete. (MS Thesis), University of Kansas Center for Research, Kansas. (Project No. TPF-5(051)-SM Report No. 98)
Wight, J, & MacGregor, J. (2009). Reinforced concrete: mechanics and design: Vol. 6 Edition. Prentice Hall Upper Saddle River, NJ.
Wilson, ML, & Kosmatka, SH. (2011). Design and control of concrete mixtures. Portland Cement Association: USA.
Wilson, HS, & Malhotra, V. (1988). Development of high strength lightweight concrete for structural applications. International Journal of Cement Composites and Lightweight Concrete, 10(2), 79-90.
Wongkeo, W, Thongsanitgarn, P, & Chaipanich, A. (2012). Compressive strength and drying shrinkage of fly ash-bottom ash-silica fume multi-blended cement mortars. Materials & Design, 36, 655-662.
Univers
ity of
Mala
ya

261
Yang, Y. (2014). Shear Behaviour of Reinforced Concrete Members without Shear Reinforcement: a New Look at an Old Problem. TU Delft, Delft University of Technology.
Yasar, E, Atis, CD, & Kiliç, A. (2004). High strength lightweight concrete made with ternary mixtures of cement-fly ash-silica fume and scoria as aggregate. Turkish Journal of Engineering and Environmental Sciences, 28(2), 95-100.
Yee, KF, Tan, KT, Abdullah, AZ, & Lee, KT. (2009). Life cycle assessment of palm biodiesel: Revealing facts and benefits for sustainability. Applied Energy, 86, 189-196.
Yew, MK, Mahmud, HB, Ang, BC, & Yew, MC. (2014). Effects of heat treatment on oil palm shell coarse aggregates for high strength lightweight concrete. Materials & Design, 54, 702-707.
Young, JF. (1988). Physical mechanisms and their mathematical descriptions. Mathematical modelling of creep and shrinkage of concrete, Wiley, Chichester, 63-98.
Zakaria, ML. (1986). Strength Properties of Oil Palm Clinker Concrete. Jurnal Teknologi UTM, 8(1), 28-37.
Zhang, MH, & Gjorv, OE. (1990). Development of high-strength lightweight concrete. ACI special publication, 121, 667-682.
Zhang, MH, & Gjvorv, OE. (1991). Mechanical properties of high-strength lightweight concrete. Materials Journal, 88(3), 240-247.
Zhang, MH, Li, L, & Paramasivam, P. (2005). Shrinkage of high-strength lightweight aggregate concrete exposed to dry environment. ACI Materials Journal, 102(2), 86-92.
Zhang, B, & Poon, CS. (2015). Use of Furnace Bottom Ash for producing lightweight aggregate concrete with thermal insulation properties. Journal of Cleaner Production, 99, 94-100.
Zhang, W, Zakaria, M, & Hama, Y. (2013). Influence of aggregate materials characteristics on the drying shrinkage properties of mortar and concrete. Construction and Building Materials, 49, 500-510.
Zia, P, Shuaib, A, & Leming, M. (1997). High-performance Concretes, a State-of-art Report (1989-1994). Federal Highway Administration, FHWA-RD-97-030: McLean (VA).
Univers
ity of
Mala
ya

262
LIST OF PUBLICATIONS AND PAPERS PRESENTED
A. ISI Indexed Journals
1. Muhammad Aslam, Payam Shafigh, Mohd Zamin Jumaat. Oil-palm by-products
as lightweight aggregate in concrete mixture - A review. Journal of Cleaner
Production 2016, 126: 56-73.
2. Muhammad Aslam, Payam Shafigh, Mohd Zamin Jumaat, Mohamed Lachemi.
Benefits of using blended waste coarse lightweight aggregates in structural
lightweight aggregate concrete. Journal of Cleaner Production 2016, 119: 108-
117.
3. Muhammad Aslam, Payam Shafigh, Mohd Zamin Jumaat. Drying shrinkage
behaviour of structural lightweight aggregate concrete containing blended oil
palm bio-products. Journal of Cleaner Production 2016, 127: 183-194.
4. Muhammad Aslam, Payam Shafigh, Mohd Zamin Jumaat. High Strength
Lightweight Aggregate Concrete Using Blended Coarse Lightweight Aggregate
Origin from Palm Oil Industry. Accepted in Sains Malaysiana 2016.
5. Muhammad Aslam, Payam Shafigh, Mohammad Alizadeh Nomeli, Mohd
Zamin Jumaat. Manufacturing High-strength Lightweight Aggregate Concrete
using Oil Palm Shell in a Semi-Lightweight Oil-palm-boiler clinker Concrete.
Revisions Received from Journal of Building Engineering, 2016.
B. SCOPUS Indexed Journals
1. Muhammad Aslam, Payam Shafigh, Mohd Zamin Jumaat. Structural Lightweight
Aggregate Concrete by Incorporating Solid Wastes as Coarse Lightweight
Aggregate. Applied Mechanics and Materials 2015, 749: 337-342.
Univers
ity of
Mala
ya
263
2. Muhammad Aslam, Payam Shafigh, Mohd Zamin Jumaat. Effect of replacement
of oil-palm-boiler clinker with oil palm shell on the properties of concrete. AIP
Conference Proceedings 2016, 1774: 030004-1 to 030004-6.
C. Papers Presented in International Conferences
1. Muhammad Aslam, Payam Shafigh, Mohd Zamin Jumaat. Structural lightweight
aggregate concrete by incorporating solid wastes as coarse lightweight aggregate.
International Conference on Intelligent Materials and Manufacturing Engineering
(IMME-2015), (Poster Presented), Jan 16-17, 2015, Phuket Island, Thailand.
2. Muhammad Aslam, Payam Shafigh, Mohd Zamin Jumaat. Effect of replacement
of oil-palm-boiler clinker with oil palm shell on the properties of concrete.
International Conference on Advanced Science, Engineering and Technology
(ICASET) 2015: Lighting the Way Towards Sustainable, Penang, Malaysia.
D. Papers Ready to be Submitted in ISI-Indexed Journals
1. Muhammad Aslam, Payam Shafigh, Mohd Zamin Jumaat. Effect of coarse
aggregate type on the drying shrinkage development of concrete.
2. Muhammad Aslam, Payam Shafigh, Mohd Zamin Jumaat. Prediction models
estimations for drying shrinkage in oil-palm by-product lightweight concretes.
3. Muhammad Aslam, Payam Shafigh, Mohd Zamin Jumaat. Shear behaviour of
oil-palm by-product lightweight aggregate concrete beams without shear
reinforcement.
Univers
ity of
Mala
ya