EFFECT OF SALINITY ON THE BIOLOGICAL TREATMENT OF...
207
EFFECT OF SALINITY ON THE BIOLOGICAL TREATMENT OF WASTEWATER FROM FISH PROCESSING INDUSTRY CHING YUN CHEN FACULTY OF SCIENCE UNIVERSITY OF MALAYA KUALA LUMPUR 2017 University of Malaya
Transcript of EFFECT OF SALINITY ON THE BIOLOGICAL TREATMENT OF...

EFFECT OF SALINITY ON THE BIOLOGICAL
TREATMENT OF WASTEWATER FROM
FISH PROCESSING INDUSTRY
CHING YUN CHEN
FACULTY OF SCIENCE
UNIVERSITY OF MALAYA
KUALA LUMPUR
2017Univers
ity of
Mala
ya

EFFECT OF SALINITY ON THE BIOLOGICAL
TREATMENT OF WASTEWATER FROM
FISH PROCESSING INDUSTRY
CHING YUN CHEN
DISSERTATION SUBMITTED IN FULFILMENT OF
THE REQUIREMENTS FOR THE DEGREE OF
MASTER OF SCIENCE
INSTITUTE OF BIOLOGICAL SCIENCES
FACULTY OF SCIENCE UNIVERSITY OF MALAYA
KUALA LUMPUR
2017 Univ
ersity
of M
alaya

ii
UNIVERSITY OF MALAYA
ORIGINAL LITERARY WORK DECLARATION
Name of Candidate: CHING YUN CHEN
Matric No: SHC 060031
Name of Degree: Master of Science (M.Sc.)
Title of Project Paper/Research Report/Dissertation/Thesis (“this Work”):
Effect of Salinity on the Biological Treatment of Wastewater
from Fish Processing Industry
Field of Study: Environmental Pollution Control
I do solemnly and sincerely declare that:
(1) I am the sole author/writer of this Work; (2) This Work is original; (3) Any use of any work in which copyright exists was done by way of fair
dealing and for permitted purposes and any excerpt or extract from, or reference to or reproduction of any copyright work has been disclosed expressly and sufficiently and the title of the Work and its authorship have been acknowledged in this Work;
(4) I do not have any actual knowledge nor do I ought reasonably to know that the making of this work constitutes an infringement of any copyright work;
(5) I hereby assign all and every rights in the copyright to this Work to the University of Malaya (“UM”), who henceforth shall be owner of the copyright in this Work and that any reproduction or use in any form or by any means whatsoever is prohibited without the written consent of UM having been first had and obtained;
(6) I am fully aware that if in the course of making this Work I have infringed any copyright whether intentionally or otherwise, I may be subject to legal action or any other action as may be determined by UM.
Candidate’s Signature Date:
Subscribed and solemnly declared before,
Witness’s Signature Date:
Name:
Designation:
Univers
ity of
Mala
ya

ii
UNIVERSITI MALAYA
PERAKUAN KEASLIAN PENULISAN
Nama: CHING YUN CHEN
No. Matrik: SHC 060031
Nama Ijazah: Master Sains (MSc)
Tajuk Kertas Projek / Laporan Penyelidikan / Disertasi / Tesis (“Hasil Kerja ini”):
Kesan Paras Kandungan Garam ke atas Rawatan Biologikal Air Sisa dari
Industri Pemprosesan Ikan
Bidang Penyelidikan: Kawalan Pencemaran Alam Sekitar
Saya dengan sesungguhnya dan sebenarnya mengaku bahawa:
(1) Saya adalah satu-satunya pengarang/penulis Hasil Kerja ini; (2) Hasil Kerja ini adalah asli; (3) Apa-apa penggunaan mana-mana hasil kerja yang mengandungi hak cipta
telah dilakukan secara urusan yang wajar dan bagi maksud yang dibenarkan dan apa-apa petikan, ekstrak, rujukan atau pengeluaran semula daripada atau kepada mana-mana hasil kerja yang mengandungi hak cipta telah dinyatakan dengan sejelasnya dan secukupnya dan satu pengiktirafan tajuk hasil kerja tersebut dan pengarang/penulisnya telah dilakukan di dalam Hasil Kerja ini;
(4) Saya tidak mempunyai apa-apa pengetahuan sebenar atau patut semunasabahnya tahu bahawa penghasilan Hasil Kerja ini melanggar suatu hak cipta hasil kerja yang lain;
(5) Saya dengan ini menyerahkan kesemua dan tiap-tiap hak yang terkandung di dalam hak cipta Hasil Kerja ini kepada Universiti Malaya (“UM”) yang seterusnya mula dari sekarang adalah tuan punya kepada hakcipta di dalam Hasil Kerja ini dan apa-apa pengeluaran semula atau penggunaan dalam apa jua bentuk atau dengan apa juga cara sekali pun adalah dilarang tanpa terlebih dahulu mendapat kebenaran bertulis dari UM;
(6) Saya sedar sepenuhnya sekiranya dalam masa penghasilan Hasil Kerja ini saya telah melanggar suatu hak cipta hasil kerja yang lain sama ada dengan niat atau sebaliknya, saya boleh dikenakan tindakan undang-undang atau apa-apa tindakan lain sebagaimana yang diputuskan oleh UM.
Tandatangan Calon Tarikh:
Diperbuat dan sesungguhnya diakui di hadapan,
Tandatangan Saksi Tarikh:
Nama:
Jawatan:
Univers
ity of
Mala
ya

iii
EFFECT OF SALINITY ON THE BIOLOGICAL TREATMENT OF
WASTEWATER FROM FISH PROCESSING INDUSTRY
ABSTRACT
The fish processing industries produce large volumes of saline wastewater with high
organic and nutrient concentrations. This research was aimed to study the effect of salt
(NaCl) concentration on the biomass yield and biodegradation of fish processing
wastewater in batch and continuous flow system by natural biodegradation. Three
categories of synthetic wastewater were prepared according to random concentration
which was diluted from the average concentration of fish processing wastewater; with
the dilution at 30, 50 and 100 fold dilution. Each concentration of synthetic wastewater
was later added with 12 series of salt concentration ranging from 0.0 g/L to 70.0 g/L of
NaCl. All synthetic wastewater including the control were tested in the lab using 2.0 L
bioreactor (oxygenated continuous stirred) with agitation speed at 250 rotation per
minute (rpm) and operating temperature at 30oC. Studies were carried out using batch
and continuous operation with a 5-day cycle treatment. In continuous flow system, the
first phase of the experiments were focused towards the evaluation of system
performance via evaluating biomass yield and substrate removal at 9 different operating
hydraulic retention time (HRT) range of 2-10 day in the 30-, 50-, and 100-fold diluted
wastewater without salt content in the reactor. The second phase of the experiments was
to investigate the effects of eleven different salt content (NaCl: 0.5-7%) in the 30-, 50-,
and 100-fold diluted wastewater at the obtained optimal HRT of 10, 9 and 8 day. In
each run of continuous system, daily samples are taken at set time to analyze the
concentration of biomass and substrates for study the biomass growth and substrate
removal efficiency. Organic and nutrient removal together with biomass yield were used
indicators for its performance efficiency. In the batch operation, the efficiency of
substrate removal and biomass yield dropped at 2.5% NaCl for all types of synthetic
Univers
ity of
Mala
ya

iv
fish processing wastewater. The efficiency of substrate removal and biomass yield
dropped for continuous operation after 3.0% NaCl. The most efficient substrate removal
and biomass yield took place at the salt concentration of 1.0% salt for batch and
continuous operation in all types of synthetic fish processing wastewater. Continuous
operation has shown that the longer hydraulic retention time (HRT) give the better
efficiency of substrate removal up to 10-day HRT. Meanwhile for biomass yield, the
HRT eight days has given the best results with 49.0% growth percentage found in the
30-fold diluted fish processing wastewater. The biomass yield and the substrate removal
were decreased with bigger dilution factor of the diluted influent in both of the batch
and continuous flow system. Results from this study could potentially increase fish
processing saline wastewater handling and the treated wastewater reuse as an
environmental friendly liquid fertilizer in agriculture, which is expected to yield high
economic value.
Keywords: fish processing wastewater, salt concentration, batch and continuous
operation, biodegradation, biomass yield
Univers
ity of
Mala
ya

v
KESAN PARAS KANDUNGAN GARAM KE ATAS RAWATAN BIOLOGIKAL
AIR SISA DARI INDUSTRI PEMPROSESAN IKAN
ABSTRAK
Industri pemprosesan ikan menghasilkan air sisa bergaram yang besar kuantiti dengan
kepekatan organik dan nutrien yang tinggi. Penyelidikan ini bertujuan untuk mengkaji
kesan kepekatan garam (NaCl) ke atas penghasilan biojisim dan biouraian air sisa
pemprosesan ikan dalam sistem sesekumpul dan sistem selanjar secara proses biouraian
semulajadi. Tiga kategori air sisa sintetik telah disediakan mengikut kepekatan rawak
yang telah dicairkan dari kepekatan purata air sisa pemprosesan ikan, dengan 30, 50 dan
100 kali ganda pencairan. Setiap kepekatan air sisa sintetik kemudian ditambah dengan
12 siri kepekatan garam antara 0.0 g/L hingga 70.0 g/L NaCl. Semua air sisa sintetik
termasuk kawalan diuji di makmal menggunakan 2.0 L bioreaktor (pengudaraan
oksigen dan dikacau berterusan) dengan kelajuan penggoncangan pada 250 putaran per
minit (rpm) dan operasi suhu pada 30oC. Kajian telah dijalankan dengan menggunakan
operasi sesekumpul dan selanjar dengan satu kitaran tempoh rawatan 5 hari. Dalam
sistem selanjar, fasa pertama eksperimen difokuskan terhadap penilaian prestasi sistem
melalui penilaian kadar penghasilan biojisim dan penurunan substrat pada 9 operasi
masa penahanan hidraulik (HRT) yang berlainan dengan julat masa 2-10 hari dalam air
sisa tanpa kandungan garam yang dicairkan 30-, 50-, dan 100-kali dalam reaktor. Fasa
kedua eksperimen adalah untuk mengkaji kesan sebelas kandungan garam yang
berlainan (NaCl: 0.5-7%) dalam air sisa yang dicairkan 30-, 50-, dan 100-kali pada HRT
paling baik yang diperolehi iaitu HRT 10, 9 dan 8 hari. Dalam setiap operasi sistem
selanjar, sampel harian diambil pada masa yang ditentukan untuk analisa kepekatan
biojisim dan substrat bagi menganalisis keupayaan pertumbuhan biojisim dan
penurunan substrat. Penurunan organik dan nutrien bersama dengan penghasilan
biojisim merupakan penunjuk yang digunakan bagi penilaian prestasi sistem. Dalam
Univers
ity of
Mala
ya

vi
operasi sesekumpul, prestasi penurunan substrat dan penghasilan biojisim menurun pada
2.5% NaCl untuk semua jenis air sisa pemprosesan ikan sintetik. Prestasi penurunan
substrat dan penghasilan biojisim menurun selepas 3.0% NaCl untuk operasi selanjar.
Penurunan substrat dan penghasilan biojisim yang paling berkesan berlaku pada
kepekatan garam sebanyak 1.0% bagi operasi sesekumpul dan operasi selanjar dalam
semua jenis air sisa pemprosesan ikan sintetik. Operasi selanjar telah menunjukkan
bahawa masa penahanan hidraulik (HRT) yang lebih lama akan memberi kecekapan
penurunan substrat yang lebih baik sehingga HRT 10 hari. Manakala dalam penghasilan
biojisim, HRT lapan hari telah memberikan hasil yang terbaik dengan 49.0%
pertumbuhan biojisim didapati dalam air sisa pemprosesan ikan yang dicairkan 30-kali.
Penghasilan biojisim dan penurunan substrat berkurang dengan faktor pencairan influen
yang lebih besar dalam kedua-dua sistem sesekumpul dan selanjar. Keputusan daripada
kajian ini berpotensi boleh meningkatkan pengendalian air sisa bergaram pemprosesan
ikan dan penggunaan semula air sisa terolah sebagai baja cecair mesra alam dalam
pertanian, yang dijangka menghasilkan nilai ekonomi yang tinggi.
Kata kunci: Air sisa pemprosesan ikan, kepekatan garam, operasi sesekumpul dan
selanjar, penghasilan biojisim, proses biouraian
Univers
ity of
Mala
ya

vii
ACKNOWLEDGEMENTS
Firstly, I would like to extend my outmost gratitude to my supervisor, Assoc. Prof.
Dr. Ghufran bin Redzwan for his continuous support in my study and throughout this
research journey. His patient guidance, together with his immense knowledge, had
certainly given me the motivation and inspiration to complete this research project.
Besides my supervisors, I thank my fellow research mates for the success of my
research.
I would also express my gratitude towards all the lab technicians from the University
of Malaya Environmental Lab, Faculty of Science, and Institute of Graduate Studies
which have provided me with the necessary that ultimately leads the production of this
dissertation.
Finally, I would like to extend special thanks to my family members especially my
mother for their continuous spiritual support throughout my research years and my life
in general for completing this research study.
Univers
ity of
Mala
ya

viii
TABLE OF CONTENTS
Abstract .......................................................................................................................iii
Abstrak ......................................................................................................................... v
Acknowledgements ....................... …………………………………………………….vii
Table of Contents ........................................................................................... ………viii
List of Figures…………………………………………………………………............ xii
List of Table ……………………………………………………………………………xv
List of Symbols and Abbreviations……………………………………………….…...xvi
List of Appendices………………………………………………………………...…xviii
CHAPTER 1: INTRODUCTION ............................................................................... 1
1.1 World Fisheries Production and Consumption ...................................................... 1
1.1.1 Fisheries Production and Consumptionin Malaysia……………….………...1
1.2 Wastewater from Fish Processing ………..………………………………………. 2
1.2.1 Biological Treatmentof Fish Processing Wastewater ……………………. .3
1.3 Problem Statement ………………………………………………………………... 4
1.4 Aim and Objectives ...…………………………………………………………….. 5
1.5 Scope of Study …………………………………………………………………..... 6
1.6 Importance of the Research……………………………………………………….. 7
1.7 Outline of Thesis Structure ………………………………………………………...8
CHAPTER 2: LITERATURE REVIEW ................................................................. 11
2.1 Fish Processing Industry ……………………………………………………….....11
2.1.1 Fish Industry in Malaysia ……………………………………………….. .11
2.2 Wastewater from Food Processing Sector ……………………………………......12
2.3 Wastewater from Fish Processing ………………………………………………..12
Univers
ity of
Mala
ya

ix
2.3.1 Salted Fish Processing …………………………………………………... 13
2.3.2 Steamed Canned Shrimp Processing ……………………………………. 15
2.3.3 Commercial Fish Processing Industry ………………………………....... 17
2.4 Fish Processing Wastewater Characteristics ..………………………………......18
2.4.1 Physicochemical Parameter ……………......……………………….........19
2.4.2 Organic Matters……………………………………………….................. 24
2.4.3 Nutrients ……………………………………………………………….....29
2.5 Environmental Impacts of Fish Processing Wastewater ……………………….. 32
2.6 Biological Treatment Processes ………………………………………………… 33
2.6.1 Aerobic Treatment Process …………………………………………….. ..35
2.6.2 Effects of High Salinity on Biological Wastewater Treatment Processes.. 37
2.7 Fish Processing Effluent Reuse ………………………………………………… 41
2.8 Summary………………………………………………………………………….42
CHAPTER 3:MATERIALS AND METHODS ...................................................... 44
3.1 Preparation of Synthetic Fish Processing Wastewate………………………….....44
3.1.1 Wastewater Characterization Study……….……………………………... 45
3.2 Biological Wastewater Operation…………………………………………….…..46
3.2.1 Batch Operation at VariousSubstrate and Salt Concentrations ………....47
3.2.2 Continuous Operation at Various Substrate concentrations………….… 47
3.2.3 Continuous Operation at Optimum HRT with Various Substrate and Salt Concentrations………………………………………………...48
3.3 Wastewater Characterization……………………………………………………..48
3.3.1 Physicochemical Parameters………………..…………………………….48
3.3.2 Organic Contents………………………….……………………………….52
3.3.3 Nutrient Contents ….………………………………………………………58
3.3.4 Analysis of Biomass Yield ……………………………...……………….. 59
Univers
ity of
Mala
ya

x
CHAPTER 4: RESULTS……………………………………………………………. 61
4.1 Fish Processing Wastewater Characteristics………………………………….….61
4.2 Batch Operation at Various Substrate and Salt Concentrations…………...……..62
4.2.1 Solids Removal…………………...…………………………………….... 62
4.2.2 Organic Contents Removal………………………………………………..66
4.2.3 Nutrient Contents Removal ..……………………………………………..68
4.2.4 Biomass Yield…….………………………………………...................... 71
4.3 Continuous Operation atDifferent Substrate Concentrations and HRT …........... 72
4.3.1 Solids Removal…………….……...……………………………………... 72
4.3.2 Organic Contents Removal…………………………………….…….........76
4.3.3 Nutrient ContentsRemoval .……………………………………………... 78
4.3.4 Biomass Yield…….………………………………………………….…....81
4.4 Continuous Operation at DifferentSubstrate and Salt Concentrations ................. 82
4.4.1 Solids Removal……………..……...………………………………….….. 82
4.4.2 Organic Contents Removal ………………………………………..…… 86
4.4.3 Nutrient Contents Removal………………………………………………..89
4.4.4 Biomass Yield…….………………………………………………………..92
CHAPTER 5: DISCUSSION …………………………………………………..........94
5.1 Introduction ……………………………………………………………………...94
5.2 pH Observation during Batch and Continuous Operation………………………. 95
5.3 Effects of Substrate and Salt Concentrations on Batch Operation Efficiency……96
5.4 Effects of HRT and Substrate Concentrations on Continuous Operation Efficiency………………………………………………………………………... 96 5.5 Effects of Salt and Substrate Concentrations on Continuous Operation Efficiency………………………………………………………………………... 97 5.6 Effects of Salt Concentrations on the Solids, Organic and Nutrient Contents
Removal in Batch and Continuous Operation …………………………………...98
Univers
ity of
Mala
ya
xi
5.7 Summary ………………………………………………………………………. 100
CHAPTER 6: CONCLUSIONS AND RECOMMENDATION…………………..101
6.1 Conclusions ……………………………………………………………………..101
6.2 Recommendations ……………………………………………………………….102
References ................................................................................................................ 105
List of Publications and Papers Presented .................................................................. 118
APPENDIX A Fish Processing Wastewater Treatment Operation in Lab ………....119
APPENDIX B Analysis Methods for Wastewater Parameter of pH, TS, TSS, TDS,VSS, NH3-N, NO3
--N, PO43-………...............................121
APPENDIX C Analysis Methods for Wastewater Parameter of BOD5, NH3-N,
NO3--N, PO4
3-………………………………………………………..129 APPENDIX D Maintenance for Spectrophotometer ……………………….............185
Univers
ity of
Mala
ya

xii
LIST OF FIGURES
Figure Title Page
2.1 Flow diagram of dried and salted fish processing................................... 14
2.2 Flow diagram of steamed canned shrimp processing………………….. 16
3.1 Operation of fish processing wastewater treatment in two identical laboratory scale bioreactor systems........................................................ 46
4.1 TS removal percentage in a batch treatment system for 30-, 50-, and 100-fold diluted fish processing wastewater with 0.0-7.0% NaCl concentrations.................................................................................... 63
4.2 TSS removal percentage in a batch treatment system for 30-, 50-, and 100-fold diluted fish processing wastewater with 0.0-7.0% NaCl concentrations....................................................................................
64
4.3 TDS removal percentage in a batch treatment system for 3 different concentrations of 0-, 50-, and 100-fold diluted fish processing wastewater with 0.0-7.0% of NaClconcentrations…………………….. 65
4.4 VSS increase percentage in a batch system treatment for 30-, 50-, and 100- fold diluted fish processing wastewater with 0.0-7.0% of NaCl concentrations.................................................................................... 66
4.5 5-day BOD removal percentage in a batch treatment system for tree different fish processing wastewaters with 0.0-7.0% of NaCl concentrations......................................................................................... 67
4.6 COD removal percentage in a batch treatment system for 30-, 50-, and 100-fold diluted fish processing wastewaters with 0.0-7.0% of NaCl concentrations………………………………………………………...... 68
4.7 Ammoniacal nitrogen removal percentage in a batch treatment system for 30-, 50-, and 100-fold diluted fish processing wastewater with 0.0- 7.0% of NaCl concentrations……………………………………… 69
4.8 NO3--N removal percentage in a batch treatment system for three
different concentrations of diluted fish processing wastewaters with 0.0-7.0% of NaClconcentrations……………………………………….. 70
4.9 Phosphorus removal percentage in batch treatment system for three different concentrations of diluted fish processing wastewater with 0.0-7.0% of NaCl concentrations……………………………………… 71
4.10 Field percentage in a batch treatment system for three different concentrations of diluted fish processing wastewaters with 0-7.0% of NaCl concentrations……………………………………………………. 72
Univers
ity of
Mala
ya

xiii
4.11 TS removal percentage in a continuous treatment system for three different concentrations of diluted fish processing wastewater with nine different operating HRTs…………………………………………. 73
4.12 TSS removal percentage in a continuous treatment system for three different concentrations of diluted fish processing wastewater with nine different operating HRTs…………………………………………. 74
4.13 TDS removal percentage in a continuous treatment system for three different concentrations of diluted fish processing wastewaters with nine different operating HRT…………………………………………... 75
4.14 VSS increase percentage in a continuous treatment system for three different concentration of diluted fish processing wastewater with nine different operating HRT………………………………………………... 76
4.15 BOD5 removal percentage in a continuous treatment system for three different concentrations of diluted fish processing wastewaters with nine different operating HRTs…………………………………………. 77
4.16 COD removal percentage in a continuous treatment system for three different concentrations of diluted fish processing wastewaters with nine different operating HRTs…………………………………………. 78
4.17 NH3-N removal percentage in a continuous treatment system for three different concentrations of diluted fish processing wastewaters with nine different operating HRT conditions………………………………. 79
4.18 NO3--N removal percentage in a continuous treatment system for three
different concentration of diluted fish processing wastewaters with nine differentHRToperating conditions………………………………... 80
4.19 P removal percentage in a continuous treatment system for three different concentrations of diluted fish processing wastewaters with nine different HRT operating conditions………………………………. 81
4.20 Biomass yield percentage in a continuous treatment system for three different concentrations of diluted fish processing wastewaters with nine different operating HRT conditions………………………………. 82
4.21 TS removal percentage in a continuous treatment system for three different concentrations of diluted fish processing wastewater with 12 different salt concentrations at HRT of 8, 9 and 10 days……………… 83
4.22 TSS removal percentage in a continuous treatment system for three different concentrations of diluted fish processing wastewater with 12 different salt concentration at HRT of 8, 9 and 10 days………………. 84
4.23 TDS removal percentage in a continuous system treatment for three different concentration of diluted fish processing wastewater with 12 different salt concentration at HRT of 8, 9 and 10 days……………….. 85
Univers
ity of
Mala
ya

xiv
4.24 VSS increase percentage in continuous treatment system for three different concentrations of diluted fish processing wastewaters with 12 different salt concentrations at the HRTs of 8, 9 and 10 days…………. 86
4.25 BOD5 removal percentage in a continuous treatment system for three different concentrations of diluted fish processing wastewater with 12 different salt concentration at HRTs of 8, 9 and 10 days……………… 87
4.26 COD removal percentage in a continuous treatment system for three different concentrations of diluted fish processing wastewaters with12 different salt concentrations at HRTs of 8, 9 and 10 days …………….. 88
4.27 NH3-N removal percentage in a continuous treatment system for three different concentrations of diluted fish processing wastewaters with 12 different salt concentrations at the HRTs of 8, 9 and 10 days…………. 89
4.28 NO3--N removal percentage in a continuous treatment system for three
different concentrations of diluted fish processing wastewaters with 12 different salt concentrations at HRTs of 8, 9 and 10 days……………... 90
4.29 P removal percentage in a continuous treatment system for of diluted fish processing wastewaters with 12 different salt concentrations at HRT of 8, 9 and 10 days…………………………………………….. 91
4.30 Biomass yield removal percentage in a continuous treatment system for three different concentrations of diluted fish processing wastewaters with 12 different salt concentrations at the HRTs of 8, 9 and 10 days…………………………………………………………….. 92
Univers
ity of
Mala
ya

xv
LIST OF TABLES
Table Title Page
2.1 Characteristics of wastewater from the dried salted fish plant…………. 15
2.2 Characteristics of raw wastewater at each step of seafood processing in North Carolina seafood processing plants (Carawan, 1991; Chowdhury et al., 2010)………………………………………………...
18
2.3 Characteristics of raw wastewater at each step of seafood processing in North Carolina seafood processing plants (Carawan, 1991; Chowdhury et al., 2010)………………………………………………...
21
2.4 Organic matters of the raw fish processing wastewater from the canned and preserved seafood processing industry……………………………..
25
2.5 Nutrient content of the raw seafood processing wastewater from different seafood processing industry…………………………………...
30
3.1 Wastewater characterization study on 10 parameters.............................. 45
3.2 Each type of Hach COD Digestion Reagent Vial and the maximum acceptable level of chloride concentration in the sample for pipette into each type of COD vial to perform COD test………………………. 58
4.1 Characteristics of the simulated original (without dilution) and 30-, 50- and 100-fold diluted fish processing wastewater………………
62
Univers
ity of
Mala
ya

xvi
LIST OF SYMBOLS AND ABBREVIATIONS
APHA : American Public Health Association
AWWA : American Water Works Association
BOD5 : Biochemical Oxygen Demand (five days)
CaCO3 : Calcium carbonate
CH4 : Methane
Cl- : Chloride
CO2 : Carbon dioxide
COD : Chemical Oxygen Demand
Cr+3 : Chromium ion
DVS : Dissolved Volatile Solids
EPA : Environmental Protection Agency
EQA : Environmental Quality Act
FAO : Food and Agricultural Organization of the United Nations
FAS : Ferrous Ammonium Sulphate
g/kg : gram per kilogram
g/m3 : gram per cubic meter
GFC : glass microfiber filters
GPD : gallons per day
H2O : water
HRT : Hydraulic Retention Time
H2SO4 : sulphuric acid / sulfuric acid
KHP : potassium acid phthalate
L : litre
m3/ton : cubic meter per tonne
mg/L : milligram per litre
Univers
ity of
Mala
ya

xvii
mL : milliliter
M : Molarity (moles/Litre)
MW : molecular weight
NaCl : Sodium Chloride
NaOH : Sodium hydroxide
NH3-N : Ammoniacal nitrogen
nm : nanometer
NO3--N : Nitrate nitrogen
PO43- : Orthophosphate
O2 : Oxygen
P : Phosphorus
RM : Ringgit Malaysia
rpm : rotation per minute
SMEs : small and medium enterprises
TDS : Total Dissolved Solids
TS : Total Solids
TSS : Total Suspended Solids
TVS : Total Volatile Solids
VSS : Volatile Suspended Solids
WPCF : Water Pollution Control Federation
w/w : weight per weight
w/v : weight per volume
oC : degree(s) Celsius (Centigrade)
µm : micrometer
% : percentage
Λ : wavelength
Univers
ity of
Mala
ya

xviii
LIST OF APPENDICES
Appendix Title Page
A Fish Processing Wastewater Treatment Operation in Lab……….... 119
A-1 Operation of fish processing wastewater treatment in two identical laboratory scale reactor……………………………………………. 119
A-2 The reactor was operated continuously with agitation speed set at 250 rpm and have supplied with air aeration using aquarium air pump. Temperature of the reactor was set at 30oC for operation……………………………………………………...... 119
A-3 Aerobic biodegradation of fish processing wastewater were examined in a 2 liter reactor with 1800 mL working volume. (wastewater treatment in day 1 operation)………………………. 120
A-4 Measure pH value of treated fish processing effluent using Mettler Toledo Delta 320 pH meter……………………………
120
B Analysis Methods for Wastewater Parameter of pH, TS, TSS, TDS, VSS, BOD5, and COD……………………………………… 121
B-1 pH Meter Calibration and Measurement Procedure……………... 121
B-2 TS Measurement Procedure……………………………………... 122
B-3 TSS Measurement Procedure……………………………………. 123
B-4 TDS Measurement Procedure…………………………………… 124
B-5 VSS Measurement Procedure…………………………………… 125
B-6 Operation of Hach BOD TrakTM Apparatus 115/230 Vac, 50/60 Hz…………………………………………………………. 126
B-7 COD Measurement Procedure…………………………………... 127
C Analysis Methods for Wastewater Parameter of BOD5, NH3-N, NO3
--N, PO43- …………………………………………………… 129
C-1 Analysis method for BOD test - according to the Wastewater and Biosolids Analysis Manual: Oxygen Demand, Biochemical. Dilution Method Test Procedure………………………………… 129
C-2 Analysis method for BOD test - according to the Wastewater and Biosolids Analysis Manual: Oxygen Demand, Biochemical. Respirometric Method (using the BOD Trak apparatus) Test Procedure ………………………………………………….. 145
Univers
ity of
Mala
ya

xix
C-3 Analysis method for Nitrogen, Ammonia test - according to the DR/2000 Spectrophotometer Instrument Manual……………….. 160
C-4 Analysis method for Nitrate, High Range (HR) test - according to the DR/2000 Spectrophotometer Instrument Manual…………. 164
C-5 Analysis method for Phosphorus, Reactive test - according to the DR/2000 Spectrophotometer Instrument Manual ..……………... 173
D Maintenance for Spectrophotometer…………………………….. 185
D-1 Maintenance – Cleaning for Spectrophotometer, Sample Cells, and Pour-Thru Sample Cell; Replacement
Instructions: Battery Replacement, and Lamp Replacement; Lamp Calibration Adjustment - according to the DR/2000 Spectrophotometer Instrument Manual……………………………...
185
Univers
ity of
Mala
ya

1
CHAPTER 1
INTRODUCTION
1.1 World Fisheries Production and Consumption
The world fish processing industry plays a significant role in the economic and social
well-being of nations, as well as in the feeding of a significant part of the world’s
population. As a highly perishable commodity, fish has a significant requirement for
processing for human and animal consumption or non-edible purposes. World per capita
apparent fish consumption increased from an average of 9.9 kg in the 1960s to 19.2 kg
in 2012 (preliminary estimate) (FAO, 2014). Fish is versatile as it can be processed into
a wide array of products to increase its economic value. In 2000, more than 60% of total
world fisheries production underwent some form of processing (FAO, 2002). It is
generally distributed as live, fresh, chilled, frozen, heat-treated, fermented, dried,
smoked, salted, pickled, boiled, fried, freeze-dried, minced, powdered or canned, or as a
combination of two or more of these forms (FAO, 2002; Garibaldi, 2012).
1.1.1 Fisheries Production and Consumption in Malaysia
Malaysia is one of the few countries in world that consume more than 50 kg of fish
per person per year (Department of Fisheries Malaysia, 2017). Fish processing industry
has grown in Malaysia which is enriched with its fish resources since year 2006 during
the implementation of the ninth Malaysian Plan (RMK9) (2006-2010) (Ali et al., 2008).
Malaysia is an important producer, market and trading nation for fish and fishery
products in the region. In the year 2013, the fisheries’ sector contributed RM 11.5
million to the nation’s economy. The fisheries sector in Malaysia produced more than
1.5 million tonnes of fish, of which marine fisheries contributed more than 75% and the
Univers
ity of
Mala
ya

2
balance was contributed by aquaculture (Department of Fisheries Malaysia, 2017;
Department of Statistics Malaysia, 2017). The food fish sector which comprises of
marine capture fisheries, inland fisheries and aquaculture (excluding seaweed) produced
1,749,314 tonnes worth RM 10,818.60 million (Department of Fisheries Malaysia,
2017). Malaysia’s total export of fish and other seafood exceeded RM 2.5 billion per
annum (MIDA, 2017).
The fish processing industry in Malaysia is largely export-oriented and encompasses
the processing of prawns, the canning of fish, and the production of surimi products.
Fish processing, such as the making of pickled fish, frozen fish, salted fish, dried fish,
smoked fish, fermented fish, fish crackers, fish sauce, fish noodle, fish satay, fish
powder, fish balls, fish cake, and shrimp paste, was traditionally a family-operated
industry in fishing villages. However, the trend toward commercial operations has
increased lately with industrial-scale setups. The trend is likely to continue with the
slow phase out of small family businesses in the coming years. For example, the making
of fish balls and surimi is mostly industrial in nature now (Department of Fisheries
Malaysia, 2017).
1.2 Wastewater from Fish Processing
The opportunities for wastewater discharge from a fish processing plant are
recognized as either discharge to a municipal system or discharge directly to a stream,
estuary or the ocean (Boopathy et al., 2006). The fish processing wastewater are
primarily generated from the operations of ice preservation, cleaning and grinding
process in the fish processing plants. The wastewater has high loads of organic nutrients
that originate primarily from carbonaceous compounds and nitrogen-containing
compounds (protein, peptide, and volatile amines). In addition, the effluent may contain
Univers
ity of
Mala
ya

3
suspended and dissolved solids, microbes, and variable pH. Another important aspect of
this industrial wastewater is its high salinity (Na+, Cl-, SO42-).
The characteristics and generation rates of fish processing wastewater are highly
variable, depending on the specific types of fish-based product processing operations,
and the types of fish-based product’s production processes vary widely (Suzuki, 1981).
Characterization of wastewater is an important part of the initial work in the design of a
treatment process. The characteristic and nature of the wastewater need to be understand
and evaluated properly to determine the good treatment method with high efficiency.
The wastewater can be categorized according to their characteristics such as physical,
chemical and biological (Hammer, 2005).
1.2.1 Biological Treatment of Fish Processing Wastewater
Biological treatment technologies are in favor of wastewater treatment from fish
processing industries since the wastewater rich in nutrients (Grady et al., 1999). The
biological processes used for the treatment of wastewater are derived from processes
occurring in nature. Agro-food wastewater treatment has been extensively studied in
conventional biological treatment systems, mainly under aerobic conditions, in order to
understand the process mechanisms and to improve the biodegradation efficiency of the
system (Eric & Ronald, 2014). In most cases the substrates were not readily
biodegradable and therefore high biomass concentrations and hydraulic retention times
were required for degradation (Oren et al., 1992; Abbasi et al., 2015). Biodegradation is
the most important process contributing to the natural attenuation of contaminants in
wastewaters (FAO, 2016).
Univers
ity of
Mala
ya

4
Aerobic natural biodegradation in batch and continuous system would be applied as a
treatment option at small scale fish processing industries for the achievement of
treatment technology and economics (Knapp, 2014). There are several benefits in
utilizing natural biodegradation processes for the treatment of wastewaters. It can be
implied potential benefits to the environmental, operational, and economic in reference
to the optimal operational cost of the fish processing industry in our country. The
research in this field is very beneficial in the future especially when energy cost and
demand for water are steadily increasing; meanwhile environmental quality is degrading
at exponential rate. Some action shall be taken to strike the balance between need to live
and quality of life.
1.3 Problem Statement
The intensive production of fisheries products have carried an environmental burden,
as some of the fish processing factories in this region discharge untreated or partially
treated effluents into the receiving streams and rivers have resulted in water pollution
problems. In addition, fish processing industries have been known to pollute nearby
beaches and shores by releasing wastewater. In terms of numbers, small and medium-
sized firms dominate the food industry in Malaysia. Noncompliance is a direct result of
the lack of appropriate treatment technology, over utilized capacity, and poor
maintenance of the treatment systems (Tay et al., 2006; Eric & Ronald, 2014). This
industry is now facing both high treatment costs and problems in the operation of
conventional wastewater treatment plants. These operational problems are linked to
high organic loading, high salt content and bad smell (Len et al., 2008).
The fish processing wastewater is subject to bacterial decay, causes heavy pollution
and bad smell to receiving water. The pollutants contained in wastewater can cause
Univers
ity of
Mala
ya

5
eutrophication and oxygen depletion. Continual depletion of the oxygen in these waters
would starve aquatic life of the oxygen it needs, and anaerobic decomposition of
organic matter leads to the breakdown of proteins and other nitrogenous compounds,
releasing hydrogen sulphide, methane, amines, diamines, and sometimes ammonia, all
of which are potentially hazardous to the ecosystem, toxic to aquatic life in low
concentrations, and also give rise to the development of obnoxious odors and unsightly
scenes (Mostafa et al., 2006; Sherly et al., 2015). Odors are very important to the public
perception and acceptance of any fish processing wastewater treatment plant. Although
relatively harmless, it may affect general public life by inducing stress, nausea or
sickness. The spatial and temporal scale of the impacts of fish processing wastewater
may vary depending on the amount and nature of the waste output (Tay et al., 2004,
2006; Liu, 2007; Alrumman et al., 2016). However, local impacts are particularly
obvious because wastewaters from fish processing industries are generally produced
throughout the year, giving no chance for the environment to recover. Impacts are more
likely to be detrimental when the same ecosystem receives wastewater from the cluster
of processing industries.
1.4 Aim and Objectives
This research designed to study the effect of salt (NaCl) concentration on the
treatment efficiencies of fish processing wastewater in batch and continuous flow
system by natural aerobic biodegradation. The aim was to develop a low cost, simple
operation and using biological process for wastewater treatment system that is needed by
the local fish processing industries for the treatment of fish processing wastewater and
the treated fish processing wastewater can be reuse as liquid fertilizer in agricultural.
Therefore, this research effort was undertaken to address the following objectives:
Univers
ity of
Mala
ya

6
(i) To relate the substrate strength with the biomass yield in the biological
treatment process of fish processing wastewater at different concentration of
fish processing wastewater.
(ii) To study the effect of sodium chloride (NaCl) concentrations to substrate
(organic and nutrient) removal and biomass yield using batch operation at
different concentration of fish processing wastewater treatment.
(iii) To determine optimum operating HRT for continuous operation system by
evaluate the pollutants removal and biomass growth at different
concentration of fish processing wastewater at nine different operating HRT
conditions.
(iv) To study the effect of sodium chloride (NaCl) concentrations to substrate
(organic and nutrient) removal and biomass yield using continuous operation
in three different concentration of fish processing wastewater treatment at
the optimum HRT obtained.
1.5 Scope of Study
This study focused on the use of lab scale bioreactor, which was operated in aerobic
batch and continuous flow systems for the treatment of three different concentrations of
fish processing wastewater with salt concentrations varying from 0.0% – 7.0% w/v
NaCl using naturally occurring microorganisms present in the fish processing
wastewater.
Wastewater characterization study for the prepared raw concentrated synthetic
wastewater, diluted influent and the final treated effluent of each operational cycle for
Univers
ity of
Mala
ya

7
the batch and continuous flow system were performed. Parameters studied include
measurement of organic matter together with solids matter and nutrients. Experiments
were to be carried out using batch and continuous operation. Meanwhile the operational
variable which were to be studied are substrate and salt concentration, and hydraulic
retention time (HRT). The effect of operational variables would be observed on the
removal efficiency, biomass yield and odor.
1.6 Importance of the Research
The fish industry is seeking cost effective ways including recycling options to treat
wastewaters generated during fish processing (Tay et al., 2006; Knapp, 2014). The
social and economic requirement for a low-cost, simple operation and a practical
environmental technology wastewater treatment system has stimulated this study for
designing an efficient, cost-effective, and low-maintenance requirement wastewater
treatment system for fish processing industries; and the treated fish processing
wastewater has high potential to be reused as a useful product in agriculture. Most small
and medium enterprises (SMEs) of fish processing industries do not have treatment
equipment installed or lack of proper wastewater treatment system. Those who have
treatment systems face operation and maintenance problems and the systems often do
not work efficiently (Lim et al., 1996; Tay et al., 2006; Len at al., 2008; Eric & Ronald,
2014). The stirred tank batch reactor is still the most widely used reactor type both in
the laboratory and industry. Batch operation often are used because of their suitability
and convenient use (Ferraro et al., 2011). Industrial practice generally favors processing
continuously rather than in single batches, because overall investment and operating
costs usually are less (Mojiri et al., 2014). Results from this study would be useful in
determining the optimum operational conditions for fish processing wastewater
treatment in biological treatment processes of batch and continuous operation, and
Univers
ity of
Mala
ya

8
designing an efficient and cost-effective biodegradation system for the fish processing
wastewater treatment in a biological treatment processes. The natural biodegradation in
the continuous operation can be applied as a treatment option in small-scale fish
processing industries. Utilizing natural biodegradation processes for the treatment of
wastewater has several reasons or benefits that can be classified as environmental,
economical, and operational benefits. The biological system should minimize the
amounts of pollutants in the effluent water for reduction of environmental contaminant
levels and improve the fish processing effluent water quality so that it can be reused
satisfactorily as a liquid fertilizer for sustainable agriculture and the protection of
environment quality (Oliver & Rene, 2006).
1.7 Outline of Thesis Structure
This thesis consists of seven chapters.
Chapter 1 Introduction
The introduction provides information on the world fisheries production and
consumption, fisheries production and consumption in Malaysia, wastewater from fish
processing, biological treatment of fish processing wastewater, identified problems
associated with the wastewater produced from fish processing, introduce the aim and
objectives of the research project, the scope of the study, the importance of the research,
and the thesis outline.
Chapter 2 Literature Review
Literature review on fish processing, fish industry in Malaysia, wastewater from fish
processing, environmental problems relating to fish processing wastewater, fish
processing wastewater characteristic, the role of biological treatment technology in fish
Univers
ity of
Mala
ya

9
processing wastewater, various published works about the effects of high salinity on
biological wastewater treatment processes, and the reuse potential of the treated fish
processing wastewater.
Chapter 3 Materials and Methods
This chapter describes and explains the materials and research methodology used to
collect the data and generate the findings reported in this study. The preparation of
synthetic fish processing wastewater, reactor set up and operating condition,
experimental design and treatment operation methods, analytical methods for the
measurement of wastewater parameters, materials (chemicals and reagents, apparatus
and equipments) used in the experiments, and experimental procedures for this study are
reported.
Chapter 4 Results
This chapter contain results for the characteristics of the fish processing wastewater
used in the experimental works for this research; the system performance’s results for
three different concentrations of diluted fish processing wastewater (30-, 50-, and 100-
fold) operated in batch operation with 0.0% - 7.0% w/v salt content, continuous
operation of fish processing wastewater without salt addition at nine different operating
HRT that range from 2-10 days, and continuous operation at the optimal HRTs obtained
(HRT of 10, 9, and 8 days) with 11 different salt concentrations (0.5% -7.0% w/v NaCl)
were reported in this chapter.
Chapter 5 Discussion
This chapter discuss all the results that have presented in chapter 4: Results.
Observation of the pH value for the wastewater daily sample taken out from the reactor
along the operation of batch and continuous system; the effects of different substrate
concentration and salt concentration on the efficiency of biomass yield and pollutants
Univers
ity of
Mala
ya

10
removal in three different concentration of diluted fish processing wastewater in batch
and continuous operation, and the effects of different HRT on the efficiency
performance of the continuous operation in three different concentration of diluted fish
processing wastewater were presented. The findings from the experimental results are
discussed and compared with those of previous studies presented in the literature
review.
Chapter 6 Conclusion
In this chapter, the findings from the experimental results are summarized. Concluding
remarks is presented.
Chapter 7 Recommendations for Future Works
Suggestion for future research works.
Univers
ity of
Mala
ya

11
CHAPTER 2
LITERATURE REVIEW
2.1 Fish Processing Industry
Fishery industry represent one of the most-traded segments of the world food sector,
with about 78 percent of seafood products estimated to be exposed to international trade
competition (FAO, 2016). In 2012, about 200 countries reported exports of fish and
fishery products (FAO, 2014). The fishery trade is especially important for developing
nations, in some cases accounting for more than half of the total value of traded
commodities. In 2012, it represented about 10% of total agricultural exports and 1% of
the world merchandise trade in terms of value (FAO, 2014, 2016). The share of total
fishery production exported in different product forms for human consumption or non-
edible purposes grew from 25% in 1976 to 37% (58 million tonnes, live-weight
equivalent) in 2012. In 2012, of the fish marketed for edible purpose, 46% (63 million
tonnes) was in live, fresh or chilled forms, which in some markets are often the most
preferred and highly priced products forms. In addition, 12% (16 million tonnes) was
utilized in dried, salted, smoked or other cured forms, 13% (17 million tonnes) in
prepared and preserved forms, and 29% (40 million tonnes) in frozen form. Freezing is
the main processing method for fish for human consumption, accounting for 54% of
total processed fish for human consumption and 25% of total fish production in 2012
(FAO, 2014, 2016).
2.1.1 Fish Industry in Malaysia
Fisheries product in Malaysia includes processed seafood products such as frozen
and canned fish, dried fish, salted fish, pickled fish, fermented fish, smoked fish, fish
Univers
ity of
Mala
ya

12
ball, fish cakes, fish powder, fish crackers, fish sauce, fish maruku, fish noodle, fish
satar, fish satay, amplang, otak-otak, surimi, crustaceans and mollusks, shrimp and
shrimp products (Department of Fisheries Malaysia, 2017).
2.2 Wastewater from Food Processing Sector
Wastewater is sewage, storm water and water that has been used for various purposes
around the community and contains organic and inorganic materials in the form of
dissolved and suspended particles (Pankaj et al., 2010). Unless properly treated,
wastewater can harm public health and the environment. Most communities generate
wastewater from both residential and nonresidential sources. A large percentage of the
country’s total wastewater effluent is released by food processing companies (Nadiah
K., 2012). In terms of numbers, small and medium-sized firms dominate the food
industry in Malaysia. Food processing sector accounts for about 10% of Malaysia's
manufacturing output, the major sub-sector is the fish and fishery products, livestock
and livestock products, processed fruits and vegetables and cocoa. Fish processing
industry is one of the sub-sectors in the processed food and beverages industry which is
an important component of the agro-based industry (MIDA, 2017).
The treated/processed effluent is referring to the cleaned wastewater whereby the
water returns to nature. It can be discharged into local surface waters where it may be
reused (Water Pollution Control Federation, 1994; Andreas & Shane, 2015).
2.3 Wastewater from Fish Processing
Fish processing requires large amounts of water for the operations of ice
preservation, cleaning and grinding process in the fish processing plants. Washing is
one of the most important steps in fish-based product processing. The cyclic washing
and rinsing of the raw fish and fish mince with water are the central process in fish
Univers
ity of
Mala
ya

13
processing. The washing process improves gel-forming ability due to leaching of a
considerable amount of fat and sarcoplasmic proteins (Huidobro et al., 1998; Luo et al.,
2010; Ismail et al., 2011). Washing also separates myofibrillar proteins (Huidobro et al.,
1998; Luo et al., 2010), enzymes (proteases), blood and haem compounds causing lipid
oxidation leading to protein denaturation (Hall & Ahmad, 1992; Kolhe & Pawar, 2011).
2.3.1 Salted Fish Processing
The typical processing of dried salted fish is schematized in Figure 2.1. Slime, blood
and other contaminating substances of raw fish are washed off using a 3% solution of
salt in water (Dan et al., 2003; Lliyasu et al., 2011). This reduces bacterial loads on the
fish during subsequent salting. Large fish like mackerel are split open at the ventral side
from the head down. All visceral matter and blood are removed. The fish is then cut into
large pieces. Fishes have an odor of ammonia, the dressed fish, or fish fillets, are soaked
in mild brine (10%) and crushed iced for 6 to 10h. This may be followed by salting.
After washing in clean brine solution, the eviscerated fish is salted in 21% brine for
about 15h. Salted fish is placed on bamboo trays and sun dried for two to three days in
full sunshine, depending on the size of the fish. Salted fish can also be dried in ovens.
Fishes are then packed and stored (Dan et al., 2003).
The characteristics of wastewater from the dried salted fish plant are shown in Table
2.1. This wastewater contains very high salt content, ranging from 17 g to 46 g NaCl/L.
A large volume of wastewater is produced from soaking and washing operations. The
volume ranges from 10 to 12 m3/ton of preprocessed fish, and 20 - 30 m3/ton of iced or
fresh fish. The preprocessed fish, namely, is eviscerated or beheaded and cleaning at
fishing boats or villages in coastal zone before it is transported to sea-food processing
plant (Dan et al., 2003; Lliyasu et al., 2011; Ferraro et al., 2011)
Univers
ity of
Mala
ya

14
(*) WWPT- Wastewater treatment plant
Figure 2.1: Flow diagram of dried and salted fish processing.
EVISCERATION
FILLETING
WASHING
SOAKING
SALTING
DRYING
GRADING
PACKING
COOLING
Product
energy
water, ice
energy
water, ice
eviscera, skin,
meat particles
water, ice
Offal recovery
(animal feed)
water
10% salt
water
21% salt
Energy
RECEIVING
THAWING water
Energy
Energy
wastewater, blood
eviscera
wastewater
Ice, debris
wastewater
meat particles
wastewater, salt
Meat particles
WWPT (*)
For combined
wastewater
wastewater, salt
organics
wastewater, salt
organics
WWPT
for high salinity
wastewater
Univers
ity of
Mala
ya

15
Table 2.1: Characteristics of wastewater from the dried salted fish plant (Dan, 2000; Ferraro et al., 2011).
Parameter Unit Concentration
Washing + soaking tank Combine Wastewater Chemical Oxygen Demand (COD)
mg/L 5,250 873
Suspended Solids (SS)
mg/L 371 119
Total Disolved Solids (TDS)
mg/L 46 17
Chloride (Cl-) g/L 27 10 Sulfate (SO4
2-) mg/L 1,240 164 Total Kjeldal Nitrogen (TKN)
mg/L 747 128
Phosporus (P) mg/L 5 5
2.3.2 Steamed Canned Shrimp Processing
Process for canning shrimp is shown in Figure 2.2. In this process, receiving, peeling
and washing discharge large quantities of wastewater containing 90% of total COD.
High salinity wastewater is generated from precooking or brine treatment. In the
precooking operation, shrimp is boiled in brine solution for 3 - 5 minutes, or it is
steamed. These operations curl the meat, extract moisture and develop the pink or red
color of the finished product. The salt content of precooking wastewater is in range of 2
- 3% (UNEP, 1999; Ferraro et al., 2011).
The canning process for mollusks such as mussel, oysters, clams or scallops also
generates large quantities of wastewater with salt content above 2%. The mollusks are
shelled and washed with 3 to 6% salt solution. Then they are drained and steamed or
cooked for 10 to 15 minutes at 100oC. After inspection and grading, the cooked
mollusks are packed in cans with 1 to 2% brine. Mendez et al. (1992) reported that
wastewater from processing mollusks contained very high organic, nitrogen and salt
content (18.5 g COD/L, 4.0 g N/L and above 2% salt).
Univers
ity of
Mala
ya

16
Figure 2.2: Flow diagram of steamed canned shrimp processing.
THAWING
COOKING
SHELLING
WASHING
INSPECTION
SALTING
CANNING
RETORTING
COOLING
Product
water
water, salt
water, salt
water
water
water
RECEIVING water
steam
debris, shells
water, debris
ice, water
water, debris
shells
water, salt
meat particles
To wastewater
treatment plant
water
water
water, salt
water, salt
water, salt
hot water Univers
ity of
Mala
ya

17
2.3.3 Commercial Fish Processing Industry
The commercial fish-processing industry generates large quantities of solid waste
and wastewater. Solid waste includes whole waste fish, offal containing viscera and fish
scrap, which are residues from filleting (Hwang & Hansen, 1998). Wastewater comes
mainly from factory cleaning operations and washing of raw materials and contains
organic contaminants in soluble, colloidal and particulate form. This wastewater has to
be treated properly before discharge (Chowdhury et al., 2010). Because factories
process a broad range of products with large seasonal variation, pollution characteristics
vary significantly from plant to plant, and even within the same plant. Within a given
fish processing plant, the wastewater discharged from different unit operations may vary
with respect to flow rates and compositions. One important attribute is the general scale
of the operations, since fish processing extends from small, local operations to large-
scale national or international producers. This difference in scale is relevant not only in
identifying sources of wastewater, but also in determining appropriate reduction or
recycling options. Although the volume and characteristics of fish processing effluents
often exhibit extreme variability, waste and wastewater production in fish processing
industries are usually high in volume.
The wastewater generated by fish processing factories has high loads of organic and
nutrients that originate primarily from carbonaceous compounds and nitrogen
containing compounds (protein, peptide and volatile amines). In addition, effluent may
contain suspended and dissolved solids, microbes, and variable pH. The presence of
high chemical oxygen demand (COD) and organic nitrogen concentrations characterizes
the wastewater produced in fish processing (Sirianuntapiboon & Nimnu, 1999;
Alrumman et al., 2016). In general, the wastewater of fish processing wastewater can be
characterized by its chemical and physical characteristics. Important pollutant
parameters of the wastewater are chemical parameters of pH, five-day biochemical
Univers
ity of
Mala
ya

18
oxygen demand (BOD5), chemical oxygen demand (COD), ammoniacal nitrogen (NH3-
N), nitrate nitrogen (NO3--N), phosphorus (P); and physical parameter of temperature,
odor, colour, and solids content (Mitchell, 1974; Mojiri et al., 2014; Abbasi et al., 2015;
FAO, 2016). A comparison of wastewater pollutants concentrations in effluent from
each fish processing stage has been presented in Table 2.2. Despite the substantial
variation in results, these data provide a useful guideline for wastewater treatment
system design and act as a starting point for wastewater minimization.
Table 2.2: Characteristics of raw wastewater at each step of seafood processing in North Carolina seafood processing plants (Carawan, 1991; Chowdhury et al., 2010).
Parameter Rinsing Scaling Filleting Cleaning Total
Water Flow (WF)
5.5 3.2 4.6 0.16 13.4
Total Solids (TS) 2.08 4.74 3.44 0.27 10.53 Organic Solids
(OS) 1.71 2.6 2.08 0.15 6.54
Total Suspended Solids (TSS)
0.38 2.59 0.86 0.09 1.96
Total Dissolved Solids (TDS)
0.71 1.85 2.96 0.13 5.65
Biochemical Oxygen Demand
(BOD)
0.59 0.56 0.86 0.1 2.11
(Water flow is in liter and the other parameters are in g/kg of raw fish processed)
2.4 Fish Processing Wastewater Characteristics
In general, fish processing wastewater can be characterized by its chemical and
physical characteristics. The presence of high chemical oxygen demand (COD) and
organic nitrogen concentrations characterizes the wastewater in fish processing
(Sirianuntapiboo & Nimnu, 1999). The important pollutant parameters of the
wastewater are the chemical parameters of pH; the five-day biochemical oxygen
demand (BOD5); the COD, ammoniacal nitrogen (NH3-N), nitrate nitrogen (NO3--N),
and phosphorus (P); and the physical parameters, such as temperature, odor, color, and
Univers
ity of
Mala
ya

19
solid contents (Mitchell, 1974; Mojiri et al., 2014). Therefore, a review of fish
processing wastewater characterization studies is very important in this research project.
2.4.1 Physicochemical Parameter
(a) Temperature
With the exception of wastewaters from cooking and sterilization processes in a fish
canning factory, fish processing industries do not discharge wastewater above ambient
temperatures (Elena et al., 2007). The temperature of the receiving waterbody must not
increase by more than 2°C or 3°C, since greater increases in temperature may affect the
population balance and also reduce the solubility of oxygen, thereby threatening the
survival of some forms of aquatic wildlife. Wastewaters from canning operations should
be cooled if the receiving waterbody is not large enough to restrict the change in
temperature to 3°C (Ferraro et al., 2011).
(b) pH value
The pH analysis is used to determine if the process is operating within the acceptable
range of pH (Metcalf & Eddy, 1991; APHA, 1995, 2005; Radojevic & Bashkin, 1999).
pH serves as one of the important parameters because it may reveal contamination of a
wastewater or indicate the need for pH adjustment for biological treatment of the
wastewater. It is possible to treat organic wastewater over a wide pH range; however the
optimum pH for microbial growth is between 6.5 and 7.5. Bacteria grow best at slightly
alkaline water. Similarly, algae and fungi grow best in slightly acidic water (Miroslav &
Vladimir, 1999; Sagar & Pratap, 2012). The pH of wastewater needs to be remained in
the range of 6-9 for organism’s protection (Metcalf & Eddy, 1991; Efremenko et al.,
2006; Zhao et al., 2013).
Univers
ity of
Mala
ya

20
Effluent pH from seafood processing plants is usually close to neutral. For example,
a study found that the average pH of effluents from blue crab processing industries was
7.63, with a standard deviation of 0.54; for non-Alaska bottom fish, it was about 6.89
with a standard deviation of 0.69 (Carawan et al., 1979; USEPA, 2010). The pH levels
generally reflect the decomposition of proteinaceous matter and emission of ammonia
compounds (Sagar & Pratap, 2012).
(c) Solids Content
Fish processing wastewater contains variety of solid materials. The solids consisted
of blood, flesh, oil, and fat. Solids content in a wastewater can be divided into dissolved
solids and suspended solids. However, suspended solids are the primary concern since
they are objectionable on several grounds. Settleable solids may cause reduction of the
wastewater duct capacity; when the solids settle in the receiving water body, they may
affect the bottom-dwelling flora and the food chain. When they float, they may affect
the aquatic life by reducing the amount of light that enters the water. Soluble solids are
generally not inspected even though they are significant in effluents with a low degree
of contamination. They depend not only on the degree of contamination but also on the
quality of the supply water used for the treatment. In one analysis of fish filleting
wastewater, it was found that 65% of the total solids present in the effluent were already
in the supply water (Tay et al., 2006; Sagar & Pratap, 2012). A summary of the raw
wastewater characteristics for the canned and preserved seafood processing industry is
presented in Table 2.3.
Univers
ity of
Mala
ya

21
Table 2.3: Solids content of the raw fish processing wastewater from various seafood processing industries.
Subcategory TS TSS VSS TDS
Reference (mg/L)
Fish Processing 4721 918-1000 700-900
Del Valle & Aguilera, 1990; Jemli et al., 2015
Fish Processing 2905 -15600 875 488 Sagar & Pratap, 2012
Fish Processing 220-790 Avsan & Rao, 2001
Seafood processing 3640 -17000 900-1000 Cristóvão et al., 2015
Fishes and shrimps processing
235 3100 1276 Zeinaddine et al., 2013.
Herring 6966 1150-5310 Riddle & Shikaze, 1973
Herring 30000 600-5000 Cristóvão et al., 2015
Breaded/Non-Breaded Shrimp
800 Muthukumaran &
Baskaran, 2013 Tuna processing 17900 500-1091 Tay et al., 2006 Tuna processing
1000-2100 700-1000 73-83 Artigaa et al., 2008
Salmon 1030-2500 320-1100 225-855 Battistoni & Fava, 1995
Salmon 88-3422 40-1824 Stone et al., 1981 Salmon 220-3640 11-2180 NovaTec & EVS,
1994 Salmon 120 -1400 Jemli et al., 2015 Nile perch fish 5580-6350 4500-5150 900 Gumisirizal et al.,
2009 Fish salting 200 - 6,000 371 46 Ferraro et al., 2011 Fish Meal 70-20000 Carawan et al.,
1979; Sunny & Mathai, 2013
Surimi 5120-7790 Green et al., 1984 Surimi - 1500-2000 Olumura &
Uetana, 1992 Surimi 5500 330-5300 Aquametrix, 1993 Surimi 3920-10800 Tay et al., 2006
i) Total Solids (TS)
There was significant variation for TS value between the samples studied where it
ranges from 1,800 to 30,000 mg/L. The average value of TS was 17,900 mg/L in tuna
fish processing of which 40% was organic, and the herring processing wastewater
contained total solids concentration of 30,000 mg/L (Tay et al., 2006). While Sagar and
Univers
ity of
Mala
ya

22
Pratap (2012) have reported the TS value ranges from 2,905 mg/L to 15,600 mg/L in the
fish processing effluent released in Mirkarwada and Mandavi beach.
ii) Total Suspended Solids (TSS)
In fish processing wastewater, total suspended solids are primarily bacteria and
bacterial flocs, algae and protozoa, and organic debris. Suspended solids can lead to the
development of sludge deposits and anaerobic conditions when untreated wastewater is
discharged in the aquatic environment (Porntip et al., 2014).
Fish meal plants wastewater were reported to have a TSS of 70 to 20,000 mg/L, and
bottom fish was found to have a TSS of 100–800 mg/L (Carawan et al., 1979). Seafood
processing plant wastewaters were reported to have a TSS of 3,640 to 17,000 mg/L of
TSS (FREMP, 1993). Effluents from fish and crustacean processing plants are generally
characterized by high total suspended solids concentration as high as 125,000 mg/L
(AMEC Earth and Environmental Limited, 2003).
iii) Total Dissolved Solids (TDS)
Total dissolved solids are physical characteristics of wastewater, and also inorganic
indicators of water quality chemical characteristics of wastewater. TDS is a measure of
salt dissolved in a water sample after removal of suspended solids (Kuhn et al., 2007).
Wastewater from fish processing industries contain high fraction of dissolved solids.
The size of colloidal particles in wastewater is typically in the range from 0.01 to 1.0
micrometer. Sagar and Pratap (1994) reported that total dissolved solids in range 488
mg/L in the wastewater.
Univers
ity of
Mala
ya

23
vi) Volatile Suspended Solids (VSS)
Biomass in the bioreactor was mostly organic materials, thus an increase in biomass
could be measured by volatile suspended solids (VSS) or particulate COD (total COD
minus soluble COD). Other parameter that could be used to indicate biomass growth
was protein content.
VSS was the parameter used most commonly to follow biomass growth in full-scale
biological wastewater treatment system because its measurement was simple and
minimal time was required for analysis. The biomass yield was determined as gram of
VSS produced per gram of COD removed. Nevertheless, VSS measured include other
particulate organic matter in addition to biomass. However, the VSS measurement was
used as an apparent indicator of biomass production and also provided a useful
measurement of reactor solids in general (Sharrer et al., 2007; Knapp, 2014).
VSS play an important role in wastewater treatment. VSS test results are routinely to
assess the performance of conventional treatment processes and need for effluent
filtration in reuse application. VSS is an indication of bacteria or biomass content in the
wastewater, it is important for characterizing wastewater treatment basins (APHA,
2005). VSS are the samples under suspension and remains in water sample. The VSS
analysis is applied mainly to wastewater sludge to measure their biological stability on
the basis of their volatility at 550+/- 50oC.
Sagar et al. (2006) has reported that the average VSS from fish processing
wastewater was 875 mg/L. While Avsan and Rao (2001) observed the fish processing
wastewater contained 220 to 790 mg/L VSS.
Univers
ity of
Mala
ya

24
2.4.2 Organic Matters
The organic components in fish processing wastewater are highly biodegradable
indicates by the COD/BOD5 ratio in the range from 1.5 to 2 (Abbasi et al., 2015). In
waterways, bacteria will consume the organic components of the waste. The process of
biodegradation in waterways consumes oxygen according to Equation (2.1):
Organic Material + O2 → CO2 + H2O + Bacteria (2.1)
Organic compounds normally are some combination of carbon, hydrogen, oxygen,
nitrogen, and other elements. Many organics are proteins, carbohydrates, or fats and are
biodegradable, which means they can be consumed and broken down by organisms.
However, even biodegradable materials can cause pollution. In fact, too much organic
matter in wastewater can be devastating to receiving waters (APHA–AWWA, 2005).
It is clear that the main impact will be due to high organic loads. The organic
material in wastewater stimulates the growth of bacteria and fungi naturally present in
water, which then consume dissolved oxygen. The concentration of oxygen in a river
depends on both the rate at which oxygen is consumed by microorganisms and the rate
of reaeration from the atmosphere. As a result of falling oxygen levels, fish and other
creatures can suffocate (Mueller & Spahr, 2005; Olivier & René, 2006). A series of
organic matters of the raw fish processing wastewater from the canned and preserved
seafood processing industry is presented in Table 2.4.
Univers
ity of
Mala
ya

25
Table 2.4: Organic matters of the raw fish processing wastewater from the canned and preserved seafood processing industry.
Subcategory BOD
(mg/L)
COD
(mg/L) References
Fish Canning 10000-50000 700 Mendez et al., 1992
Fish Canning 5100 6000-9000 Chowdhury et al., 2010 Fish Processing
3300 3261-1432 Del Valle & Aguilera, 1990
Fishes and shrimps Processing
1050-1250 1730-1790 Zeinaddine et al., 2013.
Mechanized Blue Crab
600 1000 Andreas & Shane, 2015
Breaded/Non-Breaded Shrimp
720-1000 1200-2300 Noukeu et al., 2016
Fish Salting 2300 5400 Ziminska, 1985 Tuna processing 3300 5553 Chowdhury et al., 2010 Tuna Processing
700 1300-3250 Tay et al., 2006; Noukeu et al., 2016
Tuna Brine Steam injection
8000-12000 17000-26000
Artigaa et al., 2008
Fish Meal 100-24,000 150-42,000 Carawan et al., 1979
All Salmon 253-2600 300-5500 Cristóvão et al., 2015; Riddle & Shiikaze, 1973
All Salmon 665-2315 902-3177 Battistoni & Fava,1995 Bottom & Finfish (all)
200-1000 400-2000 Carawan et al., 1979; Sunny & Mathai, 2013
Herring 20-1745 25-4864 NovaTec, 1994 Mechanical Clams
500-1200 700-1500 Tay et al., 2006; Noukeu et al., 2016
All Oyster 250-800 500-2000 Tay et al., 2006 Surimi 5000-5500 1600-2200 Okumura & Uetana,
1992
a) Biochemical Oxygen Demand (BOD)
BOD estimates the degree of contamination by measuring the oxygen required for
oxidation of organic matter by aerobic metabolism of the microbial flora. In seafood-
processing wastewaters, this oxygen demand originates mainly from two sources. One
is the carbonaceous compounds that are used as substrate by the aerobic
microorganisms; the other source is the nitrogen-containing compounds that are
normally present in seafood-processing wastewaters, such as proteins, peptides, and
volatile amines. Standard BOD tests are conducted at 5-day incubation for
Univers
ity of
Mala
ya

26
determination of BOD5 concentrations (APHA, 1995, 2005; Sherly 2015; Zhao et al.,
2013).
The BOD is generated primarily from the butchering process and from general
cleaning (Sherly et al., 2015). Bottom fish was found to have a BOD5 of 200–1,000
mg/L; fish meal plants were reported to have a BOD5 of 100–24,000 mg/L, while the
average BOD5 value for fish processing stick water has been listed as ranging from
56,000 to 112,000 mg/L (Carawan et al., 1979). White fish filleting processes typically
produce 12.5–37.5 kg BOD5 for every ton of product. Fish canning industries have a
high concentration of BOD5 pollutants in the range of 10,000-50,000 mg/L (Mendez et
al., 1992). Wastewaters from seafood-processing operations can be very high in BOD5.
Literature data for seafood processing operations show a BOD5 production of one to
72.5 kg of BOD5 per ton of product (Tay et al., 2006).
b) Chemical Oxygen Demand (COD)
Organic matter is the major pollutant in wastewater. The chemical oxygen demand
(COD) is used as a measure of the oxygen equivalent of the organic matter content of a
sample that is susceptible to oxidation by a strong chemical oxidant. The COD test is
used to determine the degree of pollution in both wastewater and natural water (HACH,
1999; Miroslav & Vladimir, 1999).
The COD is an important pollutant parameter for the seafood industry. This method
is more convenient than BOD5 since it needs only about 3 hours for determination
compared with 5 days for BOD5 determination. The COD analysis, by the dichromate
method, is more commonly used to control and continuously monitor wastewater
treatment systems. Because the number of compounds that can be chemically oxidized
is greater than those that can be degraded biologically, the COD of an effluent is usually
Univers
ity of
Mala
ya

27
higher than the BOD5. Hence, it is common practice to correlate BOD5 vs. COD and
then use the analysis of COD as a rapid means of estimating the BOD5 of a wastewater.
Depending on the types of seafood processing, the COD of the wastewater can range
from 150 to about 42,000 mg/L. One study examined a tuna-canning and byproduct
rendering plant for five days and observed that the average daily COD ranged from
1,300–3,250 mg/L (Tay et al., 2006; Noukeu et al., 2014). Sagar et al., (2012) have
reported 1,825 mg/l of COD in fish processed wastewater.
Basically, the higher the COD value, the higher the amount of pollution in the test
sample (APHA, 2005; Andreas & Shane, 2015). This test allows measurement of a
wastewater in terms of the total quantity of oxygen required for oxidation to carbon
dioxide and water. The principal reaction using dichromate as the oxidizing agent may
be represented in a general way by the following unbalanced Equation (2.2):
(CaHbOc) Organic matter + Cr2O7-2 + H+ ----- catalysts & Heat ---� Cr+3 + CO2 + H2O
(2.2)
The measured wastewater sample is heated with a known amount of potassium
dichromate-sulfuric acid solution, after which the concentration of unreacted oxidizing
agent (chromate remaining) is determined by a redox back-titration or the amount of
reduced chromium produced is determined colorimetrically (HACH, 1999; Miroslav &
Vladimir, 1999; Andreas & Shane, 2015). Some of the dichromate is consumed in the
oxidation of organic wastes. The quantity of oxidant consumed is expressed in terms of
its oxygen equivalence.
Chloride is the primary and the most common interference when determining COD
concentration. It has the greatest effect on COD test results. The theoretical oxygen
demand of chloride is expressed by the following Equation (2.3):
Univers
ity of
Mala
ya

28
Cl– + O2 + 4 H+——>2 H2O + 2 Cl2 (2.3)
One molecule of oxygen consumes 4 molecules of chloride ions. On a weight basis,
the theoretical oxygen demand for chloride is 0.226 mg O2 per mg Cl–. A sample
containing 1000 mg/L chloride will have a theoretical oxygen demand of 226 mg/L
COD (Wayne, 1997; Andreas & Shane, 2015).
Chloride reacts with silver ion to precipitate silver chloride, and thus inhibits the
catalytic activity of silver. Bromide, iodide, and any other reagent that inactivates the
silver ion can interfere similarly. Such interferences are negative in that they tend to
restrict the oxidizing action of the dichromate ion itself. However, under the rigorous
digestion procedures for COD analyses, chloride, bromide, or iodide can react with
dichromate to produce the elemental form of the halogen and the chromic ion. Results
then are in error on the high side. The difficulties caused by the presence of the chloride
can be overcome largely, though not completely, by complexing with mercuric sulfate
(HgSO4) before the refluxing procedure. Although 1 g HgSO4 is specified for 50 mL
sample, a lesser amount may be used where sample chloride concentration is known to
be less than 2000 mg/L, as long as a 10:1 weight ratio of HgSO4: Cl– is maintained. This
ties up the chloride ion as a soluble mercuric chloride complex and greatly reduces its
ability to react further. Techniques designed to measure COD in saline waters are
available (Ruttanagosrigit & Boyd, 1989; Wayne, 1997; HACH, 1999).
Mercuric sulfate is the most widely used reagent for masking chloride interference
and is most effective when the ratio of mercuric sulfate to chloride is 10:1. For example,
a 2 mL sample containing 2000 mg/L chloride (4 mg Cl–) will require 40 mg mercuric
sulfate to effectively mask the chloride interference. Hach Dichromate COD Reagents
contain enough mercuric sulfate to eliminate the interference up to 2000 mg/L chloride.
Univers
ity of
Mala
ya

29
The ultra high range COD procedure will eliminate up to 20,000 mg/L chloride, because
the sample size used is 0.20 mL rather than the standard 2.00 mL (Wayne, 1997;
HACH, 1996, 1999).
2.4.3 Nutrients
Nitrogen and phosphorus are nutrients that are of environmental concern. They may
cause proliferation of algae and affect the aquatic life in a water body if they are present
in excess (Chowdhury et al., 2010; Sherly et al., 2015). However, the concentration of
nitrogen and phosphorus in the seafood-processing wastewater is minimal in most cases.
It is recommended that a ratio of N to P of 5:1 be achieved for proper growth of the
biomass in the biological treatment (Sherly et al., 2015). Sometimes the concentration
of nitrogen may also be high in seafood-processing wastewaters. One study shows that
high nitrogen levels are likely due to the high protein content (15–20% of wet weight)
of fish and marine invertebrates (Sherly et al., 2015). Similarly, Sagar et al. (2012) has
reported 150 mg/l of nitrate in fish processed waste water. Beside that, seafood-
processing wastewater was noted to sometimes contain high concentrations of chlorides
from processing water and brine solutions, and organic nitrogen of up to 300 mg/L from
processing water. Phosphorus also partly originates from the seafood, but can also be
introduced with processing and cleaning agents. Table 2.5 shows the nutrient contents
from various types of seafood processing wastewaters.
Univers
ity of
Mala
ya

30
Table 2.5: Nutrient contents of the raw seafood processing wastewater from different
seafood processing industry.
Subcategory Process
Nitrogen Phosphorous Reference
(mg/L)
Blue crab
Conventional 1000 Del Valle & Aguilera, 1990; Sagar & Pratap, 2012 Mechanical 3700
Shrimp
Breaded 5900 Cristóvão et al., 2015 Canned 9500
Frozen 10000 Tuna Conventional 2100 Cristóvão et al., 2015
Tuna Brine
Steam injection 1200-1800 2500-4000
Artigaa et al., 2008
Catfish Conventional 650 Muthukumaran & Baskaran, 2013
Salmon Conventional 0.26-1.12 Battistoni & Fava, 1995
Nile perch fish Conventional 61-340 9-20 Gumisirizal et al., 2009
Fishes processing
Conventional 150-300 Jemli et al., 2015
Fishes and shrimps processing
Conventional nitrate = 14-22 nitrite= 5.5-6.0
108-146 Zeinaddine et al., 2013.
Fishes processing
Conventional 4.79 0.72 Danh et al., 2013
Nitrogen is a very important component of the fish factory wastewaters. Some
protein will lose to the waste streams. Bacteria convert the nitrogen in proteins to the
inorganic forms including ammonia, and the ammonium, nitrite and nitrate ions. Each
of these inorganic forms of nitrogen has different environmental effects. The
nitrification process is used to convert the ammonia in the wastewater to nitrate.
Nitrification is a two steps biological process utilizing two species of nitrogen
converting bacteria. These species of bacteria are more active in the pH range of 7 to 8.
During the nitrification process, hydrogen ions are released and alkalinity is consumed
as the acid is neutralized (Ruiz et al., 2006; Zhao et al., 2013). For every 1.0 mg of
ammonia converted to nitrate, 8.14 mg of calcium carbonate (CaCO3) equivalent are
consumed. The generation of acid during ammonia conversion, and the need to maintain
Univers
ity of
Mala
ya

31
the proper pH, is the reason why an alkali is added to the system (Zhao et al., 2013).
Nitrification of the wastewater is the single largest factor which leads to the
consumption of alkalinity and the need to add alkali to the treatment system (Uygur &
Kargi, 2004; Daniels et al., 2012).
Nitrogen pollution in water resources is a long existing environmental and public
health problem. Nitrate ions are toxic in high concentrations to both humans and
livestock. In young infants, nitrate can be converted to the nitrite form, absorbed into
the bloodstream and convert haemoglobin to methaemoglobin (Alrumman et al., 2016).
Methaemoglobin cannot transport oxygen. The condition of methaemoglobinaemia
affects infants less than six months in age because they lack the necessary enzyme to
reconvert the methaemoglobin back to haemoglobin. High levels of nitrates pollution in
drinking water supply have been associated with (blue-baby) syndrome in infants
(Susquehanna River Basin Commission, 1991). To protect humans the usual limit
placed on drinking water supplies is 10 g/m3 of nitrate-nitrogen. Livestock can also
suffer from methaemoglobinaemia (Kavitha et al., 2012). Since ruminants have a more
neutral stomach pH and rumen bacteria that reduce nitrates to nitrite, deaths from
methaemoglobinaemia can occur. This usually results from the consumption of nitrate
rich feed; although a limit of 30 g/ m3 nitrate-nitrogen on drinking water for stock has
been suggested (Lefebvre & Moletta, 2006; Pramanic et al., 2012).
Inorganic forms of nitrogen (nitrate, nitrite and ammonium ions) and inorganic
phosphates act as plant nutrients and increase the chance of eutrophication occurring in
waterways (Cho et al., 2006; Ferraro et al., 2011). This can result in an abundance of
opportunistic algae, weeds and plants. The increase in total biomass also increases the
amount of microorganisms, which are involved in breaking down dead matter. The
overall result is a decrease in the amount of dissolved oxygen present in the water due to
Univers
ity of
Mala
ya

32
the decomposition of plants, algae, bacteria and other microorganisms. This therefore
has an adverse effect on any other organisms that reply on the dissolved oxygen to
survive (Mueller & Spahr, 2005; Cho et al., 2006; Garibaldi, 2012).
High levels of phosphorus cause a similar impact on waterways to nitrogen. Nitrogen
is more often the problem in salt waterways whereas phosphorus tends to affect fresh
waterways. Phosphorus is found mainly in detergents (Amir et al., 2013). Phosphorus
concentration in wastewater is also one of the parameter that needed to be monitored in
the wastewater. An excess of phosphorus, however, can cause eutrophication of natural
waters. This issue has become one of the most worrisome environmental problems
worldwide. U.S. Environmental Protection Agency discussed on eutrophication as
basically a problem caused by nutrient enrichment in surface water. Phosphorus, which
has been identified as a nutrient limiting primary production is usually responsible for
algal blooms and invasions of exotic species in most surface water ecosystems.
2.5 Environmental Impacts of Fish Processing Wastewater
The increased production of fish processing products may generate various types of
environmental problems such as excessive nutrients and short oxygen levels in both the
receiving soil and water body (Igbinosa & Okoh, 2009). The environmental
consequences in not adequately removing the pollutants from the waste stream can have
serious ecological ramifications (Amir et al., 2013). For example, if inadequately
treated wastewater were to be discharged to a stream or river, an eutrophic condition
would develop within the aquatic environment due to the discharge of biodegradable,
oxygen consuming compounds. If this condition were sustained for a sufficient amount
of time, the ecological balance of the receiving stream, river or lake (i.e., aquatic
microflora, plants and animals) would be upset. Continual depletion of the oxygen in
Univers
ity of
Mala
ya

33
these water systems would also result in the development of obnoxious odors and
unsightly scenes (Kincannon & Gaudy, 1968; Carawan et al., 1979; Chowdhury et al.,
2010; Cui et al., 2016). High organic pollution affects human and livestock health, the
fisheries and aquaculture industries in Malaysia. General or common indicators, such as
fish killing, odor generation, contamination of ground water and the decrease of crop
production, occur because of improper management of agricultural and fish processing
wastewater. These problems in environmental quality are closely associated with the
wastewater from the agricultural and food production system (FAO, 2014, 2016).
2.6 Biological Treatment Processes
Biological treatment uses microorganism to remove organic solids and nutrients from
wastewater. It is generally considered to be more cost effective and interesting method
since it is friendly to the environment in treating high organic strength wastewaters,
such as fish processing wastewater, as compared with physical and chemical treatment
methods (Tay et al., 2006; Zhao et al., 2013; Sherly et al., 2015). Biological treatment
involves the use of a biological reactor that contains wastewater rich in biodegradable
organics and nutrients, in which organic matter is utilized by microorganisms for life-
sustaining processes and as produce cell growth and reproduction. The nutrients
available in the wastewater enhanced the growth of microorganisms and allow the
biological treatment to be effective (Tay et al., 2006; Mojiri et al., 2014). The
assimilatory pathway occurs when microorganisms utilize nitrate to produce ammonia,
which is then utilized as a nitrogen source to generate biomass (Tay et al., 2004; Tay et
al, 2006; Liu, 2007; Alrumman et al., 2016). Biological treatment technologies are in
favor of wastewater treatment from fish processing industries since the wastewater is
rich in nutrients. Biodegradation is often the most important process contributing to the
natural attenuation of contaminants in wastewaters. Many different types of organisms
Univers
ity of
Mala
ya

34
live in wastewater and some are essential contributors to treatment. A variety of
bacteria, protozoa, and worms work to break down certain carbon-based (organic)
pollutants in wastewater by consuming them (Igbinosa & Okoh, 2009; Knapp, 2014).
Through this process, organisms turn wastes into carbon dioxide, water, or new cell
growth. Bacteria and other microorganisms such as viruses and protozoa are particularly
plentiful in wastewater and accomplish most of the treatment. Most wastewater
treatment systems are designed to rely in large part on biological processes (Bassin et
al., 2012; Eric & Ronald, 2014; Cui et al., 2016). In a single aerobic system, members
of the genera Pseudomonas, Nocardia, Flavobacterium, Achromobacter, and Zooglea
may be present, together with filamentous organisms (Andreas & Shane, 2015). In a
wellfunctioning system, protozoas and rotifers are usually present and are useful in
consuming dispersed bacteria or nonsettling particles (Tay et al., 2006; Andreas &
Shane, 2015).
In wastewater treatment, there are three types of bacteria used to treat the waste that
comes into the treatment plant: aerobic, anaerobic and facultative. The three conditions
differ in the way they use oxygen. Aerobic microorganisms require oxygen for their
metabolism, whereas anaerobic microorganisms grow in absence of oxygen; the
facultative microorganism can proliferate either in absence or presence of oxygen
although using different metabolic processes. Both aerobic and anaerobic technologies
and a combination of both technologies have been applied in treating fish processing
wastewaters (Ferraro et al., 2011; Knapp, 2014).
Biological treatment systems can convert approximately one-third of the colloidal
and dissolved organic matter into stable endproducts and convert the remaining two-
thirds into microbial cells that can be removed through gravity separation. The organic
load present is incorporated in part as biomass by the microbial populations, and almost
Univers
ity of
Mala
ya

35
all the rest is liberated gas. Carbon dioxide (CO2) is produced in aerobic treatments,
whereas anaerobic treatments produce both carbon dioxide and methane (CH4). In
seafood-processing wastewaters, the nonbiodegradable portion is very low.
2.6.1 Aerobic Treatment Process
Aerobic treatment is a biological process which uses the application of free or
dissolved oxygen by microorganisms in degradation of organic wastes. The
decomposition of contaminants in wastewater using aerobic method needs aeration;
which will be the oxygen source for the growth of aerobic microbes that will treat the
organic matter and form sludge as the by-product of the process (Yogalakshmi &
Joseph, 2010; Nena et al., 2013).
Biological wastewater treatment with aerobic microorganisms has been performed
for many years. The process was discovered in 1914 by Ardern and Lockett and came
into heavy use throughout the 1950s and 1960s as models and design principles for the
system were developed (Rittmann & McCarty, 2001; Alrmman et al., 2016).
Wastewaters contain organic and other matter that can cause serious environmental
problems if sent directly to natural bodies of water. In an aerobic biological treatment
system, the wastewater is pumped into a tank or pond that contains a suspension of
aerobic bacteria. The aerobic bacteria oxidize the organic matter forming CO2, H2O, and
more bacteria (Campos et al., 2002; Qasim & Mane, 2013). Collectively, all the organic
matter is referred to as BOD of the wastewater. BOD can be determined in the
laboratory by measuring total oxygen consumption of aerobic bacteria digesting a waste
over a defined period of time (Rittmann & McCarty, 2001; Vanerkar et al., 2013).
Aerobic process involves the reaction of the oxidation of organic matter in the
wastes. Thus, the main reaction products for the aerobic process are CO2, H2O and
Univers
ity of
Mala
ya

36
microbial biomass. The aerobic systems firstly applied to food processing wastewater
included activated sludge, trickling filters, oxidation ditch, sequencing batch reactor,
lagoons, irrigation and a combination of these processes (Zhu et al., 2008; Bouchra et
al., 2014). The aerobic microorganisms in activated sludge and aerated basins exist in
aggregates called flocs that are held together by biological polymers and electrostatic
forces (Garibaldi, 2012; Eric & Ronald, 2014). The main microorganisms degrading
waste are heterotrophic and are a diverse set of bacteria that breakdown a wide variety
of organic matter. Most of the organisms are secondary consumers, consuming the
products of primary consumers that are actually breaking down the organic matter of the
wastewater (Ferraro et al., 2011). The species composition is continuously changing as
bacteria turn-over and competes for organic matter. Accordingly, there seems to be a
large redundancy in the species of microorganisms those breakdown organic substrates
in wastewater (Zhu et al., 2008; Vymazal, 2014).
In fish processing wastewaters, the need for adding nutrients (the most common
being nitrogen and phosphorus) seldom occurs, but an adequate provision of oxygen is
essential for successful operation. The most common aerobic processes are activated
sludge systems, lagoons, trickling filters and rotating disc contactors. The reactions
occurring during the aerobic process can be summarized as follows:
Organic + O2 cells + CO2 + H2O (2.4)
Apart from economic considerations, several factors influence the choice of a
particular aerobic treatment system. The major considerations are: the area availability;
the ability to operate intermittently is critical for several seafood industries that do not
operate in a continuous fashion or work only seasonally; the skill needed for operation
of a particular treatment cannot be neglected; and finally the operating and capital costs
are also sometimes decisive.
Univers
ity of
Mala
ya

37
2.6.2 Effects of High Salinity on Biological Wastewater Treatment Processes
High salinity wastewaters are usually generated from industries such as fish
processing, vegetable canning, pickling, tanning and chemical manufacturing. Fish
processing wastewater was noted to contain high salinity (Na+, Cl-), caused both by the
raw materials and seawater used in various processes, and salt is usually be added to a
final wash to remove the last traces on the fish and improve water removal (Hall &
Ahmad, 1992; Sherly et al., 2015; Cui et al., 2016), the salinity of the fish processing
wastewater depending on the products or species being processed and type of
processing undertaken. The wastewater generated from precooking or brine treatment
for canning of shrimp process is in the range of 2–3% w/v NaCl (Vymazal, 2014). The
canning process for mollusks such as mussels, oysters, clams or scallops also generates
large quantities of wastewater with salt content above 2%. The mollusks are shelled and
washed with 3 to 6% salt solution (Chowdhry et al., 2010; FAO, 2014). Characteristics
of herring brine waste were found to contain 65 g/L chloride (Balslev et al., 1990).
While the wastewater from the dried salted fish plant contains very high salt contents,
ranging from 17 g to 46 g NaCl/L. A large volume of wastewater is produced from
soaking and washing operations. The raw fish’s slime, blood and other contaminating
substances are washed off using a 3% solution of clean salt in water. The dressed fish,
or fish fillets, are soaked in mild brine (10%). After washing in clean brine solution, the
eviscerated fish is salted in 21% brine (Vallero et al., 2003; Len et al., 2008; Cui et al.,
2016).
High salinity can cause high osmotic stress or the inhibition of the reaction pathways
in the organic degradation process (Sherly et al., 2015; Cui et al., 2016). This has
resulted in a significant decrease in biological treatment efficiency. In addition, high salt
content induces cell lysis, which causes increased effluent solids. The populations of
protozoa and filamentous organisms required for proper flocculation are also
Univers
ity of
Mala
ya

38
significantly reduced by the elevated salt content (Sherly et al., 2015; Cui et al., 2016).
Therefore, high salinity in fish processing wastewater will lead to difficulties in
biological treatment processes (Sherly et al., 2015). In wastewater treatment, conflicting
reports on the influence of salt or sodium chloride (NaCl) on the performance of
biological treatment processes exist. Several reports indicated the adverse effects of
high salinity or shocks of NaCl on organic removal efficiency and sludge settle ability
(Burnett, 1974; Joong et al., 2007; Bassin et al., 2012). Others reported that the constant
application of NaCl tobiological treatment systems does not upset the organic removal
efficiency, thereby resulting in the good flocculation of the biomass. This shows that
acclimation of the biomass and levels of salt are important factors that may explain
these different observations (Harmoda & Al-Attar, 1995; Lefebvre & Moletta, 2006;
Mostafa et al., 2006; Sherly et al., 2015).
Salt concentrations above 2% (20 g/L NaCl) in the wastewater will affect the growth
of the bacteria. Study from Joong et al. (Joong et al., 2007) in the experiment for
examination of the salt effect on cellular growth show that there is no effect on cellular
growth at concentrations of 1% and 2% NaCl, but observed that there is an effect on
cellular growth at the concentration of 3.5% NaCl. Burnett (1974) reported that
operation of activated sludge process at salt contents higher than 20 g/L is characterized
by poor flocculation, high effluent solids, and a severe decrease in substrate utilization
rate. Hamoda and Al-Attar (1995) published on the effect of standard sodium chloride
on aerobic activated sludge treatment processes. They demonstrate that no decrease in
wastewater treatment performance is observed at concentrations up to 3% NaCl (w/w).
Kargi and Uygur (1996) investigated the effects of high salinity on aerobic attach
growth such as trickling filter and rotating biological contactors. The results indicated
that the rate and efficiency of COD removal decrease significantly with the increase in
salt content above 20 g/L. The COD removal efficiency with salt-free wastewater is
Univers
ity of
Mala
ya

39
95%. The COD removal decreases to 60% at 5% salt content due to the adverse effect
of salt on microorganisms. The increase in salt content causes a linear reduction in the
COD removal rate. Kargi and Dincer (1999) reported that saline wastewaters with more
than 2% salt resulted in low BOD removal and flocculation efficiencies of conventional
biological processes such as activated sludge and attach-growth processes. It has been
reported that a critical salinity concentration of approximately 1–2% (w/w) exists at
which the mechanism governing bacteria aggregation and stability of sludge flocs
changes. Below this critical concentration, double layer compression or the hydrophobic
interactions improve inter bacterial interactions. However, as the concentration of
salinity exceeds this limit, the tendency of bacteria aggregation or adsorption decreases
Zhao et al., 2013; Andreas & Shane, 2015). Here, although salt acclimation can be
expected from conventional processes, the extent of adaptation is limited, and thus
conventional processes cannot be used to treat wastewaters containing more than 3%
salt (Bassin et al., 2012; Andreas & Shane, 2015; Cui et al., 2016 ).
In nitrogen removal processes, the oxidation of ammonia to nitrite and then nitrite to
nitrate (nitrification process) occurs under aerobic conditions (autotrophic bacteria), and
the reduction of nitrate to nitrogen gas (denitrification process) occurs under anoxic
conditions (hetetrophic bacteria) (Knapp, 2014). The system configuration, the
instability in the experimental conditions with respect to temperature and pH, and the
presence of inhibitory compounds are the factors that directly influence the extent of
salt effect on the nitrification process (Moussa et al., 2006; Bassin et al., 2012; Cui et
al., 2016). Nitrification is also susceptible to inhibition by salt, which has been
considered as an instability factor in many wastewater treatment plants, especially in
industrial settings (Moussa et al., 2006). Kargi and Dincer (1999) also reported that salt
content reduces the rate and the efficiency of nitrification and denitrification at salt
contents above 2% and 1%, respectively. Nitrobacter was more adversely affected by
Univers
ity of
Mala
ya

40
high salinity than Nitrosomonas, resulting in the accumulation of nitrite in the effluent
at salt contents above 2%. The denitrification rate seemed more sensitive to salt
inhibition than nitrification (Ruiz et al., 2006; Andreas & Shane, 2015; Sherly et al,
2015).
Panswad and Anan (1999a) investigated the effects of various salinity levels on
ammonia and nitrate uptake rates of the biological nutrient removal systems
(anaerobic/anoxic/aerobic). In the steadystate, the specific ammonia and nitrate uptake
rates decreased with increase in chloride concentrations. The total nitrogen removal
dropped from 85% to 70% when the salt contents in wastewater have increased from 20
g/L to 30 g/L. Concurrently, when the salt contents in wastewater have increased from 5
g/L to 30 g/L, COD removal of the system also dropped from 90% to 71%. This
indicated that the nitrifying and denitrifying bacteria are very sensitive to sudden high
salt content even with a high degree of pre-acclimation. The phosphorous removal of
this system decreased from 38% to 10% with gradually increase in salt content from 0
to 30 g/L. This indicates that poly-P bacteria have intense sensitivity to high salinity
condition. As the summary, all the researchers agree that the salt concentration affects
the effectiveness of the biodegradation process. Where there is a difference is the
limiting salt concentration. This may be related to the differences in the properties of the
aqueous system.
Currently, many saline wastewater treatment plants are able to overcome the
technical problems associated with high salinity by diluting the saline waste stream with
freshwater. Nevertheless, this practice is unsustainable due to the continuous pressure
on industries to reduce freshwater consumption (Eric & Ronald, 2014). The fish
processing industry seeks cost-effective reduction and recycling technologies for fish
processing wastewaters (Chowdhury et al., 2010). Industrial practice generally favors
Univers
ity of
Mala
ya

41
continuous processing rather than processing in single batches for relatively low overall
investment and operating costs (Eric & Ronald, 2014). Aerobic natural biodegradation
in continuous systems would be applied as a treatment option in small-scale fish
processing industries to achieve treatment technology and economics (Chowdhury et
al., 2010, Andreas & Shane, 2015). The social and economic requirements for a low
cost, simple operation, and a practical environmental technology wastewater treatment
system inspired this study to design an efficient, cost-effective, and low-maintenance
wastewater treatment system that is required by local fish processing industries for the
treatment of fish processing saline wastewater, and the treated fish processing
wastewater has high potential to be reused as liquid fertilizer in agriculture.
2.7 Fish Processing Effluent Reuse
Water use has been growing at more than twice the rate of population increase in
the last century (Andreas & Shane, 2015). Thus, the need for new water resources is
inevitable. The reuse of treated wastewater is one of the permanent water resources that
may have numerous applications (Amir et al., 2013). In addition to reusable water
production, wastewater treatment is important for health and environment protection
through the reduction of waste and production of natural fertilizer, energy and many
other advantages (Igbinosa & Okoh, 2009; Abbasi et al., 2015). We can reuse the
treated wastewater for beneficial purposes such as landscape irrigation and agricultural,
toilet flushing, industrial processes, and replenishing a ground water basin. The reuse of
treated wastewater offers water resource and financial savings. Wastewater treatment
can be tailored to meet the water quality requirements of a planned reuse (Andreas &
Shane, 2015).
Univers
ity of
Mala
ya

42
The effluent of fish processing wastewater which contains organic matter, nitrogen,
phosphorus and potassium may serve as plant nutrients when applied as irrigation water
which discharged directly to the environment (Elena et al., 2007; Pankaj et al., 2010;
Alrumman et al., 2016). Besides that, the organic matter that added through wastewater
irrigation serves as a soil conditioner over period time which increases its water holing
capacity. In addition through the soil humus build-up, preventing of land erosion and
soil conservation could be achieved (Igbinosa & Okoh, 2009). Therefore this reduces
requirements for artificial fertilizers or chemical fertilizers with a concomitant reduction
in energy expenditure and industrial pollution elsewhere (Andreas & Shane, 2015).
2.8 Summary
Fish processing wastewater could be a valuable resource for agriculture. However,
potential utilization of this fish wastewater has been limited because of its bad smell
(Tay et al., 2004; Tay et al, 2006; Liu, 2007). Biological treatment process is a
treatment that can make use of microbiology concept as a beneficial science for the
destruction of contaminants in wastewater. Generally, biological treatment involves the
use of a biological reactor that contains wastewater rich in biodegradable organics and
nutrients, in which organic matter is utilized by microorganisms for life-sustaining
processes and as a food source to produce cell growth and reproduction. The nutrients
available in the wastewater enhance the growth of microorganisms and allow the
biological treatment to be effective. The wastewater generated by fish processing
factories after biological treatment has a high potential to be reused in agriculture since
the main constituents are organic and nutrients substances capable of promoting plant
growth and the wastewater do not contain known toxic or carcinogenic materials.
Univers
ity of
Mala
ya

43
Aerobic natural biodegradation in continuous systems would be applied as a
treatment option in small-scale fish processing industries to achieve treatment
technology and economics. The utilization of natural biodegradation processes for the
treatment of wastewaters has several reasons or benefits. It is expected that the use of
aerobic natural biodegradation in continuous systems will bring benefits to the
environment, operations, and economics in reference to the optimal operational cost of
the fish processing industry in our country.
Univers
ity of
Mala
ya
44
CHAPTER 3
MATERIALS AND METHODS
3.1 Preparation of Synthetic Fish Processing Wastewater
Fish processing wastewater were collected from the processing of common types of
edible fish species commonly found within the Malaysian region. Fresh whole fish
(white pomfret, fourfinger threadfin, goldstripe sardinella, wolf herring, milkfish, short
mackerel, etc.) were purchased from a local fish market in Selangor and transported on
ice to University of Malaya Environmental Lab. The synthetic raw wastewater with the
same composition, with equivalent to the wastewater from fish industrial has been
simulated in laboratory for the series of experiments in this project. The processing of
fish involves hand-skinning, filleting, and washing with tap water without additional of
salt for the wastewater to be added with various salt concentrations in the series of
experiments to investigate the impact of increased salt concentration on a batch and
continuous treatment operation. The fish processing wash water and fish blood were
collected immediately in a beaker and homogenized by agitation on the stirrer plate for
30 min. The wastewater was then kept in a 1 L size polyethylene bottle and
subsequently stored in the freezer below 0°C for further use. There were around 100 kg
of fish had been collected and processed in this study and the total amount of water
utilized to clean the fish was around 100kg/m3 (Mitchell, 1974; Chapman, 1996; Dan,
2003; Chen et al., 2003).
Preparation of influent for feeding the bioreactor, the raw wastewater was diluted
with distilled water to achieve the required concentration. Preparation included three
different strength of wastewaters (30-, 50-, and 100-fold diluted fish processing
Univers
ity of
Mala
ya

45
wastewater) at eleven different salt (NaCl) concentrations (0.5%, 1.0%, 1.5%, 2.0%,
2.5%, 3.0%, 3.5%, 4.0%, 5.0%, 6.0% and 7.0% w/v) and without salt content (0.0% w/v
NaCl). The wastewater used as feed was stored in a refrigerator at 4°C. It was
maintained in a feed reservoir and mixing was applied manually at regular intervals of
feeding.
3.1.1 Wastewater Characterization Study
Wastewater characterization was performed for the prepared raw concentrated
synthetic wastewater, diluted influent, daily withdrawn samples, and also the treated
effluent of each operational cycle. The physicochemical parameter of TS, TDS, TSS,
VSS, and pH; organic contents of BOD5 and COD; and nutrient contents of NH3-N,
NO3--N, and P were analyzed as shown in Table 3.1 according to the procedures
outlined in Standard Methods for Water and Wastewater Examinations (APHA, 1995,
2005). All chemicals used were of analytical grade.
Table 3.1: Wastewater characterization study on 10 parameters.
Parameters Unit
Physicochemical TS mg/L TDS mg/L TSS mg/L VSS mg/L pH pH value
Organic Contents
BOD5 mg/L COD mg/L
Nutrient Contents NH3-N NH4
+ mg/L
NO3--N
NO3-
mg/L
P PO4
3- mg/L
Univers
ity of
Mala
ya
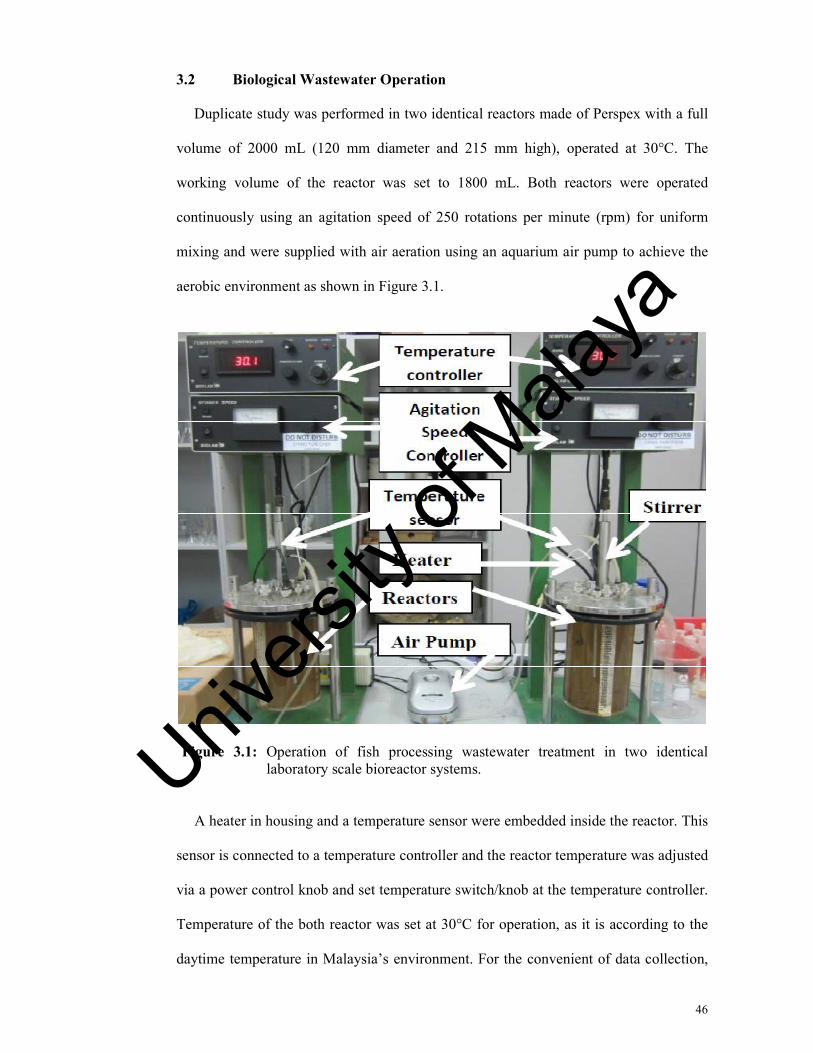
46
3.2 Biological Wastewater Operation
Duplicate study was performed in two identical reactors made of Perspex with a full
volume of 2000 mL (120 mm diameter and 215 mm high), operated at 30°C. The
working volume of the reactor was set to 1800 mL. Both reactors were operated
continuously using an agitation speed of 250 rotations per minute (rpm) for uniform
mixing and were supplied with air aeration using an aquarium air pump to achieve the
aerobic environment as shown in Figure 3.1.
Figure 3.1: Operation of fish processing wastewater treatment in two identical laboratory scale bioreactor systems.
A heater in housing and a temperature sensor were embedded inside the reactor. This
sensor is connected to a temperature controller and the reactor temperature was adjusted
via a power control knob and set temperature switch/knob at the temperature controller.
Temperature of the both reactor was set at 30°C for operation, as it is according to the
daytime temperature in Malaysia’s environment. For the convenient of data collection,
Univers
ity of
Mala
ya

47
the cycle length of each treatment was set for 5 days (i.e. running the experiment from
Monday to Friday), which inline with other experiment by Burnett (1974), Grady et al.
1999, Sagar and Pratap (2012). Feeding and withdrawal were done manually.
3.2.1 Batch Operation at Various Substrate and Salt Concentrations
In batch system operation, the influent, and the effluent after 5 days operation was
studied by measuring the following parameter: pH value, TSS, TDS, TS, VSS, BOD5,
COD, NH3-N, NO3--N, and P. All the experiments were performed using distilled water
for dilution and final rinsed for the apparatus. All measurements of the parameters were
performed in three replicates to obtain a consistent average value.
3.2.2 Continuous Operation at Various Substrate Concentrations
Continuous operation rans at several hydraulic retention time (HRT) in the
continuous flow system. The first phase of the experiments focused on the evaluation of
system performance by evaluating the biomass yield and the substrate removal at nine
different operating HRTs that ranged from ten to two days of HRT. The experiments
were carried out at different concentration of feed substrate/influent. The HRT was
calculated as HRT = V/Q, where V = volume of the reactor (L), and Q = influent flow
rate (L/day) as stated in Equation 3.1 (Metcalf & Eddy, 1991). Series of HRTs were set
based on the working volume of the bioreactor. Range of the fresh feed flow rates were
from 180 mL/day to 900 mL/day. The performance of the continuous operation was
measured every day using the samples withdrawn daily from each reactor. The fresh
medium was fed into the bioreactor at a specific flow rate based on the operating HRT.
Each operating HRT was kept running for 5 days.
HRT = V/Q (3.1)
Where:
Univers
ity of
Mala
ya

48
V = volume of the reactor (L)
Q = influent flow rate (L/day)
Nine different operating HRTs were performed in order to determine the optimal
retention time for the biological operation of fish processing wastewater. The degree of
optimization was assed using the biomass yield and substrate removal.
3.2.3 Continuous Operation at Optimum HRT with Various Substrate and Salt
Concentrations
At the second phase, the effects of 11 different salt contents (NaCl: 0.5%–7.0%) in
the 30-, 50-, and 100-fold diluted wastewaters were then investigated in the continuous
flow system at the obtained optimal HRT condition.
3.3 Wastewater Characterization
3.3.1 Physicochemical Parameters
(a) pH Value
Biological treatment processes have their own optimum range of pH (Len et al.,
2008; Pankaj et al., 2010; Porntip et al., 2014). The pH analysis is used to determine if
the process is operating within the acceptable range of pH. pH has a significant impact
on wastewater treatment (Metcalf & Eddy, 1991; Radojevic & Bashkin, 1999; APHA,
1995, 2005). Although different processes have varying ranges, generally wastewater
organisms in biological treatment systems function best at pH values from 6.5 to 7.5
(Metcalf & Eddy, 1991). The response to pH is largely due to changes in enzymatic
activity (Pankaj et al., 2010; Porntip et al., 2014).
The pH value in this research was monitored by pH meter model Delta 320 (Mettler
Toledo, Shanghai, P.R. China) using an integrated temperature electrode (ATC probe)
Univers
ity of
Mala
ya

49
method with automatic temperature compensation (ATC) measurement. For
measurement, the pH ATC electrode probe was taken out from the 3 mol/L KCL
(Potassium Chloride) storage solution and rinse with distilled water. Two-point
calibration of pH 7.00 and pH 4.01 was done daily using calibration buffer of pH 4.01
and pH 7.00 before measurement of the sample (APHA, 1995, 2005; Mettler Toledo,
2005). The procedure for the measurement of pH is stated in Appendix B-1.
(b) Total Solids (TS)
Total solids are the sum of dissolved and suspended solids in a water or wastewater.
TS was determined by measured a volume of sample and transfer it into a pre-weighed
porcelain. Evaporate to dryness in an oven at 105oC, cool in desiccators with moisture
indicate silica gel. The increase in weight over that of the empty porcelain dish
represents the total solids. Analytically, TS was the matter that remained as residue
upon evaporation at 103 to 105oC (APHA, 1995, 2005). The procedure for the
measurement of TS is stated in Appendix B-2. The TS was calculated using Equation
3.2:
TS (mg/L) = {Weight of the dish + dried residue (g)} – Weight of the dish (g)
Sample Volume (mL)
X 1000 mL/L (3.2)
Weight of the residue in mg (to convert W (g) to (mg), multiply w (g) with 1000)
Multiply the weight of the dry solids (in mg) by 1,000 mL/L to convert the sample size
from mL to L.
(c) Total Suspended Solids (TSS)
Total suspended solids are typically composed of fine clay or silt particles, plankton,
organic compounds, inorganic compounds or other microorganisms. TSS measure the
particulate matter suspended in a sample of water or wastewater. These suspended
Univers
ity of
Mala
ya

50
particles range in size from 10 nm to 0.1 mm, although in standardized laboratory tests,
TSS is defined as the material that cannot pass through a 0.45 µm diameter filter
(Radojevic & Bashkin, 1999; APHA, 1995, 2005). The procedure for the measurement
of TSS is stated in Appendix B-3. Suspended solids were calculated after the soluble
portion of the sample has passed through a filter by using Equation 3.3 (APHA, 1995,
2005).
TSS (mg/L) = (A – B)/C x 1000 mL/L (3.3)
Where A = Mass of nonfilterable residue on Whatman GF/C filter after evaporation at 105oC (mg) B = Mass of the filter paper prior to sample filtration (mg)
C = volume of the sample used for filtration (mL)
(d) Total Dissolved Solids (TDS)
Total dissolved solids are physical characteristics of wastewater, and also inorganic
indicators of water quality chemical characteristics of wastewater. TDS is a measure of
salt dissolved in a water sample after removal of suspended solids (Kuhn et al., 2007).
Total dissolved solids (TDS) are the weight per unit volume of all volatile and non-
volatile solids dissolved in water or wastewater after a sample has been filtered to
remove colloidal and suspended solids, the accumulated total of all solids that might be
dissolved in water. TDS is defined (analytically) as all the matter that remains as residue
upon evaporation at 180oC ± 2oC. The procedure for the measurement of TDS is stated
in Appendix B-4. The TDS was calculated according to Equation 3.4 (APHA, 1995,
2005).
TDS (mg/L) = (A – B)/C x 1000 mL/L (3.4)
Where A = Mass of dried porcelain plus filtrate after evaporation at 180oC (mg)
Univers
ity of
Mala
ya

51
B = Weight of the porcelain dish (mg)
C = volume of the sample used for filtration (mL)
(e) Volatile Suspended Solids (VSS) – Biomass Concentration
Solids remaining after the analysis for total solids, total dissolved solids or total
suspended solids are ignited at 550 +/-50°C to a constant weight. The results are called
total volatile solids (TVS), dissolved volatile solids (DVS) and total volatile suspended
solids (TVSS). The weight loss as a result of the ignition represents the volatile portion
of the solids. The difference in weight of the ash and support vessel remaining after
ignition compared to the empty vessel represents the fixed solids.
VSS is a water quality measure obtained from the loss on ignition of TSS. The VSS
analysis is applied most commonly to wastewater sludge to measure their biological
stability on the basis of their volatility at 550 ± 50 ◦C. The organic fraction will be
oxidized and will be driven off as gas at temperature of 550 ± 50 ◦C and are termed as
“volatile suspended solids”. The inorganic fraction remains as ash and is termed as
“fixed suspended solids” (or mineral content of the suspended solids). Loss in weight is
due to conversion of organic matter to CO2 and H2O (Metcalf & Eddy, 1991; Radojevic
& Bashkin, 1999; APHA, 1995, 2005). The procedure for the measurement of VSS is
stated in Appendix B-5. The VSS was calculated using Equation 3.5 as below (APHA
1995, 2005):
VSS (mg/L) = (A – B)/C x 1000 mL/L (3.5)
Where A = Mass of nonfilterable residue on Whatman GF/C filter after evaporation at 550oC (mg)
B = Mass of nonfilterable residue on Whatman GF/C filter after ignition at 150oC (mg)
C = Sample size that have used (mL) for filtration.
Univers
ity of
Mala
ya

52
3.3.2 Organic Contents
(a) 5-days Biochemical Oxygen Demand (BOD5)
The most widely used parameter of organic pollution applied to both wastewater and
surface water is the 5 day BOD (BOD5). This determination involves the measurement
of the dissolved oxygen used by microorganisms in the biochemical oxidation of
organic matter (Middlebrooks, 1965).
BOD test has its widest application in measuring waste loadings to treatment plants
and in evaluating the BOD removal efficiency of such treatment systems. The test
measures the molecular oxygen utilized during a specified incubation period for the
biochemical degradation of organic material (carbonaceous demand) and the oxygen
used to oxidize inorganic material such as sulfides and ferrous iron (APHA, 1998).
Two methods are widely used for BOD measurement. One method, the dilution
method, is a standard method of the American Public Health Association (APHA) and is
approved by the U.S. Environmental Protection Agency (USEPA). The other method,
the manometric method, has been used for over 75 years in many sewage plants and
other installations throughout the world. The USEPA denied approval of this method
when it selected methods for wastewater analysis, although in certain cases the USEPA
has approved the manometric method (Clifford et al., 1997).
In this research, BOD was measured in a 5-day test period (BOD5) using dilution
method, and manometric method using BOD Trak by respirometric method. The
procedure for the measurement of BOD5 with dilution method is stated in Appendix C-
1, and the procedure for the measurement of BOD5 with BOD Trak by respirometric
method is stated in Appendix B-6 and Appendix C-2.
Univers
ity of
Mala
ya

53
(i) BOD Measurement with Dilution Method
Since most wastewater has BOD5 that are much higher than the limited solubility of
oxygen in water (8 mg/L at room temperature), it is necessary to make a series of
dilutions containing varying amounts of sample in nutrient-containing, aerated dilution
water. For samples whose BOD5 does not exceed 7 mg/L, dilution is not necessary. The
fish processing wastewater sample was diluted with prepared dilution water so that
adequate nutrients and oxygen will be available during the incubation period. Several
dilutions with the calculated dilution factor were prepared to cover the complete range
of possible values. The dilution water was prepared by adding 1 mL of each of the
phosphate buffer solution, magnesium sulfate (MgSO4) solution, calcium chloride
(CaCl2) solution, and ferric chloride (FeCl3) solution per liter of aerated water at 20oC
(Metcalf & Eddy, 1991; Radojevic & Bashkin, 1999; HACH, 1995, 2005).
The dilution method is conducted by placing various incremental portions of the
sample into bottles and filling the bottles with dilution water, and measured with
membrane electrode method. The dilution water contains a known amount of dissolved
oxygen. The dilution water contains a portion of inorganic nutrients and a pH buffer.
The bottles are completely filled, freed of air bubbles, sealed and allowed to stand for
five days at a controlled temperature of 20°C (68°F) in the dark. During this period,
bacteria oxidize the organic matter using the dissolved oxygen present in the water. At
the end of the five-day period, the remaining dissolved oxygen is measured. The
relationship of oxygen that was consumed during the five days and the volume of the
sample increment are then used to calculate the BOD (Clifford et al., 1997).
Before starting the BOD test, the amount of dissolved oxygen in the test sample is
measured using Dissolved Oxygen Meter (YSI brand, Model No.: DO 200). At the end
of the test, the oxygen concentration is measured again. To find the oxygen demand,
Univers
ity of
Mala
ya

54
subtract the amount of dissolved oxygen on day five from the amount of dissolved
oxygen on day one. Next, multiply the subtracted result with the dilution ratio and get
the biochemical oxygen demand concentration in mg/L.
The wastewater sample that has diluted 50 times or more has insufficient bacteria to
oxidize the organic matter that is present for carrying out the BOD test. Seeding of
dilution water is required to test such sample. To make the seed solution, the contents of
one dehydrated Polyseed capsule (Interlab®, The Woodlands, TX, USA, Environmental
Protection Agency, EPA-approved BOD5 seed inoculum) was poured into 500 mL
dilution water to dissolve and rehydrate (aerate and stir for one hour, settle 15 min after
aeration has stopped for the bran and undissolved material, decant the supernatant), and
the decanted seeded dilution water (seed solution) was used to dilute the sample for
making up 10% of the overall sample volume. A seed control was prepared by diluting
the seed solution with dilution water for correcting the sample BOD measurement
(Metcalf & Eddy, 1991; Radojevic & Bashkin, 1999; HACH, 1995, 2005).
To calculate the BOD (dilution method) using Equation (3.7) and Equation (3.8)
When dilution water is not seeded:
BOD5, mg/L = D1 – D2 (3.7) P When dilution water is seeded: BOD5, mg/L = (D1 – D2) – (B1 – B2) f (3.8) P Where: D1 = DO of diluted sample immediately after preparation, mg/L D2 = DO of diluted sample after 5 d incubation at 20oC, mg/L P = decimal volumetric fraction of sample used
Univers
ity of
Mala
ya

55
B1 = DO of seed control before incubation, mg/L B2 = DO of seed control after incubation, mg/L f = ratio of seed in diluted sample to seed in seed control = (% seed in diluted sample) / (% seed in seed control)
(ii) BOD Measurement with Manometric Method
Biochemical Oxygen Demand, BOD5 was determined by respirometric method using
BOD Trak, and have accuracy check with a mixture of 150 mg/L each of glucose and
glutamic acid. BOD seeding using BOD seed solution, BOD seed control have carried
out for every batch of BOD experiment.
The Hach BOD Trak apparatus is based on the manometric principle of operation.
This apparatus has been compared with the standard dilution method under controlled
test conditions in the laboratory and in routine analysis. Results are equivalent in terms
of both accuracy and precision.
BOD test was conducted at 20°C within a controlled environment, for a period of
5 days. Some of the advantages of using BOD Trak methods over the dilution method
are as follows:
i. The sample is stirred constantly and maintained natural conditions. The BOD
Trak has an initial head space containing 21% oxygen above the water sample.
Continuous stirring replenishes dissolved oxygen to the sample. This makes the
BOD Trak results similar to occurrences found in natural environment. The
dilution method supplies no additional oxygen to the sample, this causes a higher
percentage of oxygen depletion, sometimes as much as 89 %.
ii. The BOD rate can be observed daily without disturbing the sample. Pressure
changes within the closed BOD Trak system are displayed graphically in
Univers
ity of
Mala
ya

56
milligrams per liter (mg/L) on an LCD. The system supplies 480 evenly space
data points over the selected period.
iii. The BOD Trak method continuously removes carbon dioxide from the system so
that the pressure difference observed is proportional to the amount of oxygen
used.
iv. Bubbles formed by degassing can cause errors when samples are warmed to the
experimental temperature. The BOD Trak compensates for this occurrence by
starting the test after the equilibrium temperature has been reached.
(b) Chemical Oxygen Demand (COD)
The chemical oxygen demand test is an index of water pollution measuring the mass
concentration of oxygen consumed by the chemical breakdown of organic and inorganic
matter. COD assays are generally used for the estimation of the chemically oxidizable
organic carbon of samples varying and unknown composition, such as domestic and
industrial wastes and natural waters (HACH, 1999). COD is significant in the control of
the total content of pollution and the management of water surroundings (Chapman,
1996).
COD is defined as the amount of a specified oxidant that reacts with the sample
under controlled conditions in an acidic medium. The quantity of oxidant consumed is
expressed in terms of its oxygen equivalence. The COD test is used to determine the
degree of pollution in water (APHA–AWWA, 2005). Either the open reflux method or
closed reactor method is acceptable as the method of COD measurement (APHA, 1998).
In this research project, COD was measured using method 5220 C, closed reflux, and
the titrimetric method according to procedures outlined in Standard Method for the
Examination of Water and Wastewater (APHA, 1995). The procedure for the
measurement of COD is stated in Appendix B-7, In addition, 2 mL diluted wastewater
Univers
ity of
Mala
ya

57
sample (for blank - 2 mL distilled water, for check the accur - 2 mL 500 mg/L phthalic
acid (potassium acid phthalate, KHP) solution as COD standard solution)was pipet into
Hach Dichromate COD Reagent vial of High Range type (0 to 1500 mg/L) or 0.20 mL
diluted wastewater sample (blank - 0.2 mL distilled water, accuracy check - 0.2 mL
10,000 mg/L KHP solution) was pipet into Hach Dichromate COD Reagents vial of
High Range Plus type: 0 to 15,000 mg/L. Closed the prepared sample digestion reagent
vial with the vial screw cap tightly. Mix the contents in the vial by shaking and invert
the vial several times. The prepared vials were put into the block digester and heated for
two hours at 150 ◦C. The digested sample was cooled to room temperature, added with
2 drops of ferroin indicator solution, and then titrated with standard ferrous ammonium
sulphate (FAS) 0.01 M. The sample was titrated until a sharp colour changed from blue-
green to reddish brown. Then the COD value was calculated using Equation 3.9
(APHA, 1995, 2005).
mg/L COD = (A – B) X M X 8000 X Dilution factor (3.9) mL sample
where: A = volume of FAS titrant used for blank, mL B = volume of FAS titrant used for sample, mL M = Molarity of FAS solution; 0.01 M was used 8000 = milliequivalent weight of oxygen × 1000 ml/L.
Chloride is the primary interference when determining COD concentration. Each
COD vial contains mercuric sulfate that will eliminate chloride interference up to the
level specified in column 1 in the Table 3.2 below. Samples with higher chloride
concentrations should be diluted. Dilute the sample enough to reduce the chloride
concentration to the level given in column 2. If sample dilution will cause the COD
concentration to be too low for accurate determination, add 0.50 g of mercuric sulfate
(HgSO4) to each COD vial before the sample is added. The additional mercuric sulfate
Univers
ity of
Mala
ya

58
will raise the maximum chloride concentration allowable to the level given in column 3
(HACH, 1996, 1999).
Table 3.2: Each type of Hach COD Digestion Reagent Vial and the maximum acceptable level of chloride concentration in the sample for pipette into each type of COD vial to perform COD test.
Column 1 Column 2 Column 3
Vial type Used Maximum Cl- concentration in sample (mg/L)
Maximum Cl- concentration of diluted samples (mg/L)
Maximum Cl- concentration in sample when 0.50 HgSO4 added (mg/L)
Low Range 2000 1000 8000 High Range 2000 1000 4000 High Range Plus 20,000 10,000 40,000
3.3.3 Nutrient Contents
(a) Ammoniacal Nitrogen (NH3-N)
Concentration of NH3-N was determined by DR/2000 spectrophotometer (HACH,
Loveland, CO, USA) using the Nessler Method (Method 8038) at wavelength (λ) 425 nm,
and this method is applicable over the range of 0 to 2.50 mg/L in 25 mL of water samples.
The matched pair of square glass 25 mL (sample cell) was used, and one sample cell was
filled with the wastewater sample, another sample cell (the blank) was filled with
demineralized water, and both prepared sample cells were added with reagent HACH tests
kits of Nessler reagent, mineral stabilizer, and polyvinyl alcohol dispersing agent. The blank
was used to set the spectrophotometer to zero. A yellow colour was developed in proportion
to the present of ammonia amount in the prepared sample cell (HACH, 2001). This
procedure is equivalent to the USEPA Method 350.2 and Standard Methods for the
Examination of Water and Wastewater, 4500-NH3 B and C for wastewater (HACH, 1995,
2005) (Refer to Appendix C-3 for the analysis method and detail procedure for the
measurement of NH3-N).
Univers
ity of
Mala
ya

59
(b) Nitrate Nitrogen (NO3−-N)
For this research, NO3−-N determination employed Cadmium Reduction, High Range
(HR) method (Method 8039) at wavelength (λ) 500 nm. One sample cell was filled with
wastewater sample and added with the contents of one Nitra Ver 5 Nitrate reagent powder
pillow, and another sample cell (the blank) was filled with wastewater sample without
reagent (HACH, 2001). This method is applicable over the range of 0 to 30.0 mg/L in 25
mL of water samples. This procedure is adapted from Standard Methods for the
Examination of Water and Wastewater (HACH, 1995, 2005) (Refer to Appendix C-4 for
the analysis method and detail procedure for the measurement of NO3--N).
(c) Phosphorus (P) / Orthophosphate (PO43-)
P/PO43- determination applied molybdovanadate method using molybdovanadate
reagent (method 8114) where the wavelength (λ) used was 430 nm to detect mg/L PO4 3−
or mg/L P concentration. One sample cell was filled with wastewater sample, another
sample cell (the blank) was filled with demineralized water, and both prepared sample cells
were added with Molybdovanadate reagent. This method is applicable over the range of 0 to
45.0 mg/L in 25 mL of water samples and a yellow colour was developed in proportion to
the presence of phosphate. This procedure is adapted from Standard Methods for the
Examination of Water and Wastewater (HACH, 1995, 2005). The analysis method and
experimental procedure for the measurement of Phosphorus is stated in Appendix C-5.
3.3.4 Analysis of Biomass Yield
Biomass concentrations in this research was measured as VSS. VSS is an indication
of bacteria or biomass content in the wastewater, it is important for characterizing
wastewater treatment basins (APHA, 1995, 2005; Grady et al., 1999; Radojevic &
Univers
ity of
Mala
ya

60
Bashkin, 1999; Mettler Toledo, 2005). The biomass yield was determined as g VSS
produced per g COD removed as shown in Equation 3.6 as below:
Biomass Yield = g biomass (VSS) accumulated g COD removed g biomass (VSS) accumulated/produced = VSS at day 5 (mg/L) – VSS at day 0 (mg/L) X 1.8 L = VSS (mg)/1000 g COD removed/utilized = COD at Day 0 (mg/L) – COD at day 5 (mg/L) X 1.8 L = COD (mg)/1000 Remarks : working volume of the fish processing wastewater in a bioreactor = 1.8 L
Univers
ity of
Mala
ya

61
CHAPTER 4
RESULTS
4.1 Fish Processing Wastewater Characteristics
Wastewater characterization was performed for the prepared raw concentrated
synthetic wastewater, diluted influent, daily withdrawn samples, and the final treated
effluent of each operational cycle. Wastewater characteristics of the simulated synthetic
original fish processing wastewater, and the influent of 30, 50 and 100-fold diluted
liquid of the original fish processing wastewater are summarized in Table 4.1.
pH analysis is used to determine if a process is operating within the acceptable range
of pH. In this study, the pH of the raw synthetic fish processing wastewater (simulated
original, without dilution) with pH range of 6.65 ± 0.02, while the pH of the diluted raw
wastewater with distilled water (30-, 50-, and 100-fold diluted) for feeding into the
reactor (influent) have pH value ranged from 7.41-7.33. Therefore, the influent feed
into the reactor for treatment processes was in the best pH value range of 6.5 to 7.5 for
the function of biological treatment system (Tay et al., 2006; Zhu et al., 2008; Bassin et
al., 2012).
Univers
ity of
Mala
ya

62
Table 4.1: Experimental results for the characteristics of the simulated original (without dilution) and 30-, 50- and 100-fold diluted fish processing wastewater.
Parameter
Fish processing wastewater concentration
Simulated
original
30-fold
dilution
50-fold
dilution
100-fold
dilution
A. Physicochemical
Parameter
TSS (mg/L) 5,530 ± 638 184 ± 21 110 ± 13 55 ± 6
TDS (mg/L) 2,590 ± 450 86 ± 15 52 ± 9 26 ± 5
TS (mg/L) 22,350 ± 480 750 ± 16 450 ± 9 225 ± 5
VSS (mg/L) 905 ± 5.5 30 ± 0.20 18 ± 0.10 9 ± 0.06
pH (value) 6.65 ± 0.02 7.36 ± 0.03 7.38 ± 0.02 7.40 ± 0.01
B. Chemical Parameter
: Organic
Contents
BOD (mg/L) 18,419 ± 660 614 ± 22 368 ± 12 184 ± 7
COD (mg/L) 30,000 ± 2,000 1,000 ± 66 600 ± 40 300 ± 20
C. Chemical
Parameter:
Nutrient Contents
NH3-N (mg/L)
NH4+ (mg/L)
504 ± 30
650.16 ± 38.7
17 ± 1
21.93 ± 1.29
10 ± 0.6
12.9± 0.77
5 ± 0.3
6.45 ± 0.39
NO3-N (mg/L)
NO3- ( mg/L)
51 ± 5
224.4 ± 22
2.4 ± 0.2
7.48 ± 0.88
1.0 ± 0.1
4.4±0.44
0.5 ± 0.05
2.2 ± 0.22
P (mg/L)
PO43- (mg/L)
95.5 ± 6.5
293.19 ± 19.96
3.2 ± 0.20
9.82 ± 0.61
1.91 ± 0.15
5.86 ± 0.46
0.96 ± 0.06
2.95 ± 0.18
4.2 Batch Operation at Various Substrate and Salt Concentrations
4.2.1 Solids Removal
(a) Total Solids (TS)
Figure 4.1 shows the TS removal in the batch system with three different
concentration of fish processing wastewater. After 5 days of batch system operation, TS
removal showed the highest percentage of TS removal of 30% in the 30-fold diluted fish
processing wastewater at 7% salt content. The lowest percentage of TS removal of 4.5%
was found in 30-fold diluted wastewater with 1% salt content.
Univers
ity of
Mala
ya

63
Figure 4.1: TS removal percentage in a batch treatment system for 30-, 50-, and 100-fold diluted fish processing wastewater with
0.0-7.0% of NaCl concentrations.
(b) Total Suspended solids (TSS)
Figure 4.2 shows the TSS removal percentage in batch system after 5 days of
treatment operations. TSS has the lowest removal percentage of 5.0% in batch system at
1% salt content in 30-fold diluted fish processing wastewater. The highest percentage
removal of 38.0% was found in 100-fold diluted fish processing wastewater at 7% salt
contents.
0
5
10
15
20
25
30
35
0 1 2 3 4 5 6 7 8
TS
rem
ov
al
(%)
Salt content (% NaCl)
30 x dilution
50 x dilution
100 x dilution
Univers
ity of
Mala
ya

64
Figure 4.2: TSS removal percentage in a batch treatment system for 30-, 50-, and 100-fold diluted fish processing wastewaters with 0-7.0% of NaCl concentrations.
(c) Total Dissolved Solids (TDS)
Figure 4.3 shows the TDS percentage removal after 5 days of batch system operation
for the three concentrations of fish processing wastewaters at twelve different
concentration of NaCl.
The lowest percentage of TDS removal was 9.0% in 30-fold diluted fish processing
wastewater containing 1% salt content. The highest percentage of TDS removal of
40.0% was found at 7% salt content in 100-fold diluted fish processing wastewater.
0
5
10
15
20
25
30
35
40
0 1 2 3 4 5 6 7 8
TS
S r
em
ov
al
(%)
Salt content (% NaCl)
30 x dilution
50 x dilution
100 x dilution
Univers
ity of
Mala
ya

65
Figure 4.3: TDS removal percentage in a batch treatment system for three different concentrations of 0-, 50-, and 100-fold diluted fish processing wastewaters with 0-7.0% of NaCl concentrations.
(d) Volatile Suspended Solids (VSS)
Figure 4.4 shows the VSS increase percentage after 5 days of batch system operation
for the three different type concentration of fish processing wastewaters at twelve
different concentrations of NaCl.
The lowest increase percentage of VSS of 8.0%, was found in 100-fold and 50-fold
diluted fish processing wastewater containing 7% of salt content. While the highest
increase percentage of VSS of 46.0% was observed in 30-fold diluted fish processing
wastewater at 1% salt content.
0
5
10
15
20
25
30
35
40
45
0 1 2 3 4 5 6 7 8
Salt content (% NaCl)
TD
S r
em
oval (%
)
30 x dilution
50 x dilution
100 x dilution
Univers
ity of
Mala
ya

66
Figure 4.4: VSS increase percentage in a batch treatment system for three different concentrations of diluted fish processing wastewater with 0-7.0% of NaCl concentrations.
4.2.2 Organic Contents Removal
(a) 5-day Biochemical Oxygen Demand (BOD5)
Figure 4.5 shows the BOD5 removal percentage after 5-day batch system operation
for the three different concentrations of fish processing wastewaters at twelve different
NaCl concentrations.
In batch treatment system, the highest BOD5 removal of 80.00% was achieved in 30-
fold diluted wastewater at 1% NaCl content. The lowest BOD5 removal of 11.54% was
found in 100-fold diluted wastewater at 7% of salt content.
0
5
10
15
20
25
30
35
40
45
50
0 1 2 3 4 5 6 7 8
Salt content (% NaCl)
VSS increase (%)
30 x dilution
50 x dilution
100 x dilution
Univers
ity of
Mala
ya

67
Figure 4.5: 5-day BOD removal percentage in a batch treatment system for three different concentrations of diluted fish processing wastewaters with 0-7.0% of NaCl concentrations.
(b) Chemical Oxygen Demand (COD)
Figure 4.6 shows the COD removal percentage after 5 days of batch system
operation for the three different concentrations of fish processing wastewater at twelve
different NaCl concentrations.
In batch treatment operation, COD removal achieved the highest value of 85.20% in
30-fold wastewater at 1% NaCl content. The lowest COD removal of 11.86% was found
in 100-fold diluted wastewater at 7% salt content.
0
10
20
30
40
50
60
70
80
90
0 1 2 3 4 5 6 7 8
Salt content (% NaCl)
BOD 5 removal (%
)
30 x dilution
50 x dilution
100 x dilution
Univers
ity of
Mala
ya

68
Figure 4.6: COD removal percentage in a batch system treatment for three different concentrations of diluted fish processing wastewater with 0-7.0 of NaCl concentrations.
4.2.3 Nutrient Contents Removal
(a) Ammoniacal Nitrogen (NH3-N)
Figure 4.7 shows the percentage of ammoniacal nitrogen removal found in the
effluent after 5 days of batch system operation of the three different concentrations of
fish processing wastewaters with eleven different salt concentrations and without salt
content as control.
After 5 days of batch system operation, the highest percentage of NH3-N removal,
68.93% was found in 30-fold diluted fish processing wastewater at 1% NaCl. While
NH3-N removal showed the lowest value of 10% in 100-fold diluted fish processing
wastewater at 7% of salt content.
0
10
20
30
40
50
60
70
80
90
0 1 2 3 4 5 6 7 8
Salt content (% NaCl)
COD removal (%
)
30 x dilution
50 x dilution
100 x dilution
Univers
ity of
Mala
ya

69
Figure 4.7: Ammoniacal nitrogen removal percentage in a batch treatment system for 30-, 50-, and 100-fold diluted fish processing wastewater with 0-7.0% of NaCl concentration.
(b) Nitrate Nitrogen (NO3−-N)
Figure 4.8 shows the percentage of nitrate nitrogen removal found in the effluent
after 5 days of batch system operation of the three different concentrations of fish
processing wastewaters with eleven different salt concentrations and without salt
content.
After 5 days of batch system operation, the highest percentage of NO3−-N removal
was 66% removed in 30-fold diluted fish processing wastewater containing 0.5% and
1.0% salt content. While the lowest percentage of NO3--N removal was 10% found in
100-fold diluted fish processing wastewater at 7% salt content.
0
10
20
30
40
50
60
70
80
0 1 2 3 4 5 6 7 8
Salt content (% NaCl)
NH3-N removal (%
)
30 x dilution
50 x dilution
100 x dilution
Univers
ity of
Mala
ya

70
Figure 4.8: NO3−-N removal percentage in a batch treatment system for
three different concentrations of diluted fish processing wastewaters with 0-7.0% of NaCl concentrations.
(c) Phosphorus (P)
Figure 4.9 shows the percentage of phosphorus removal found in the effluent after 5
days of batch system operation of the three different concentrations of fish processing
wastewaters with various salt contents.
After 5 days of batch system operation, the highest percentage of phosphorus
removal of 61% was found in 30-fold fish processing wastewater with the addition of
1.0% salt content. The lowest percentage of P removal was 4% had been recorded in
100-fold diluted fish processing wastewater at 7% salt content.
0
10
20
30
40
50
60
70
0 1 2 3 4 5 6 7 8
Salt content (% NaCl)
Nitrate Nitrogen removal (%
)
30 x dilution
50 x dilution
100 x dilution
Univers
ity of
Mala
ya

71
Figure 4.9: Phosphorus removal percentage in a batch treatment system for three different concentrations of diluted fish processing wastewater with 0-7.0% of NaCl concentrations.
4.2.4 Biomass Yield
Figure 4.10 shows the percentage of biomass yield obtained in the effluent after 5-
day batch system operation of the three different concentrations of fish processing
wastewater with eleven different salt concentrations and without salt content as control.
After 5 days batch system operation, the highest biomass yield percentage, 60.0%
was found in 50-fold fish processing wastewater at 1.0% salt content. While the lowest
percentage of biomass yields percentage of 8.0% was found in 100-fold diluted fish
processing wastewater at 7% salt content.
0
10
20
30
40
50
60
70
0 1 2 3 4 5 6 7 8
Salt content (% NaCl)
P removal (%
)
30 x dilution
50 x dilution
100 x dilution
Univers
ity of
Mala
ya
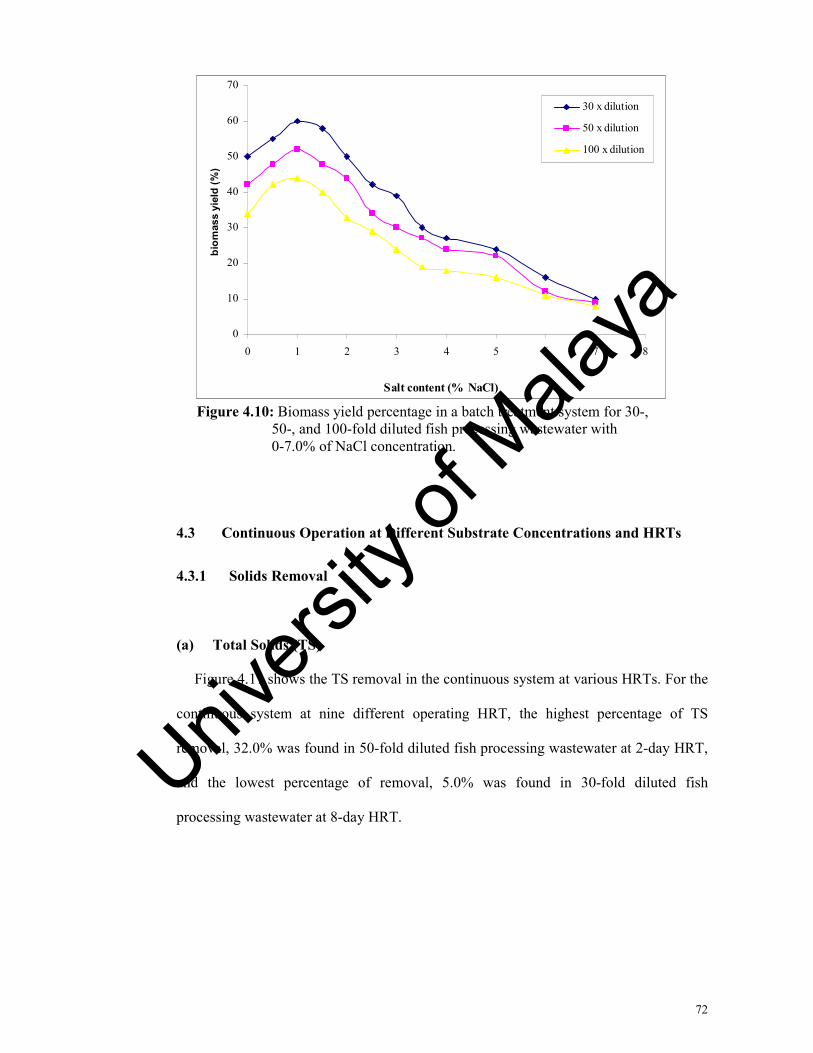
72
Figure 4.10: Biomass yield percentage in a batch treatment system for 30-, 50-, and 100-fold diluted fish processing wastewater with 0-7.0% of NaCl concentration.
4.3 Continuous Operation at Different Substrate Concentrations and HRTs
4.3.1 Solids Removal
(a) Total Solids (TS)
Figure 4.11 shows the TS removal in the continuous system at various HRTs. For the
continuous system at nine different operating HRT, the highest percentage of TS
removal, 32.0% was found in 50-fold diluted fish processing wastewater at 2-day HRT,
and the lowest percentage of removal, 5.0% was found in 30-fold diluted fish
processing wastewater at 8-day HRT.
0
10
20
30
40
50
60
70
0 1 2 3 4 5 6 7 8
Salt content (% NaCl)
biomass yield (%)
30 x dilution
50 x dilution
100 x dilution
Univers
ity of
Mala
ya

73
Figure 4.11: TS removal percentage in a continuous treatment system
for three different concentrations of diluted fish processing wastewaters with nine different operating HRTs.
(b) Total Suspended solids (TSS)
Figure 4.12 shows the TSS removal percentage in the effluent of the continuous
system without salt content at nine different operating HRTs after the 5-day treatment
operations. The lowest percentage of TSS removal (7.0%) was found at the 8-day HRT
in the 30-fold diluted fish processing wastewater. The highest percentage of TSS
removal was 33.0% found in the 100-fold diluted wastewater at the 2-day HRT.
0
5
10
15
20
25
30
35
0 2 4 6 8 10 12
HRT (day)
TS
rem
ov
al
(%)
30 x dilution
50 x dilution
100 x dilution
Univers
ity of
Mala
ya

Figure 4.12: TSS removal percentage in a continuous treatment syst for three different concentrations of diluted fish processing wastewaters with nine different operating HRTs
(c) Total Dissolved Solids (TDS)
Figure 4.13 shows the percentage removal a
with nine different operating HRT range from 10 to 2 days HRT (10, 9, 8, 7, 6, 5, 4, 3, 2
day) for the three different concentration of fish processing wastewater.
The lowest percentage removal of TDS, 9.0% was found
diluted fish processing wastewater. While the highest percentage of TDS removal of
35.0% was found in the 100
TSS removal percentage in a continuous treatment systfor three different concentrations of diluted fish processing wastewaters with nine different operating HRTs.
(c) Total Dissolved Solids (TDS)
Figure 4.13 shows the percentage removal after 5 day continuous system operation
with nine different operating HRT range from 10 to 2 days HRT (10, 9, 8, 7, 6, 5, 4, 3, 2
day) for the three different concentration of fish processing wastewater.
The lowest percentage removal of TDS, 9.0% was found at 8 days HRT in 30
diluted fish processing wastewater. While the highest percentage of TDS removal of
35.0% was found in the 100-fold diluted fish processing wastewater at 2
TSS removal percentage in a continuous treatment system for three different concentrations of diluted fish processing
fter 5 day continuous system operation
with nine different operating HRT range from 10 to 2 days HRT (10, 9, 8, 7, 6, 5, 4, 3, 2
day) for the three different concentration of fish processing wastewater.
at 8 days HRT in 30-fold
diluted fish processing wastewater. While the highest percentage of TDS removal of
diluted fish processing wastewater at 2-day HRT.
Univers
ity of
Mala
ya

75
Figure 4.13: TDS removal percentage in a continuous treatment system for three different concentrations of diluted fish processing wastewaters with nine different operating HRTs.
(d) Volatile Suspended Solids (VSS)
Figure 4.14 shows the VSS increase percentage after five days of continuous system
operation with nine different operating HRTs (10, 9, 8, 7, 6, 5, 4, 3, and 2 days) for the
three different concentrations of fish processing wastewaters. In the reactor with
continuous feeding and removal of substrates, the lowest VSS increase percentage of
9.0% was found at the 2-day HRT in the 100-fold diluted fish processing wastewater,
while the highest VSS increase percentage of 49.0% was found at the 8-day HRT in the
30-fold diluted fish processing wastewater.
0
5
10
15
20
25
30
35
40
0 2 4 6 8 10 12
HRT (day)
TD
S r
em
ov
al
(%)
30 x dilution
50 x dilution
100 x dilution
Univers
ity of
Mala
ya

Figure 4.14: VSS increase percentage in a continuous treatment system for three different concentrations of diluted fish processing wastewaters at nine diff
4.3.2 Organic Content
(a) 5-day Biochemical Oxygen Demand (BOD
Figure 4.15 shows the BOD removal percentage after five days of continuous system
operation at nine different operating HRTs for the three different concentration
processing wastewaters without salt content. In the continuous system treatment, 10
HRT attained the highest BOD removal rate of 81.0% in the 30
and the lowest removal rate of 15.0% was found at the 2
diluted wastewater.
VSS increase percentage in a continuous treatment system for three different concentrations of diluted fish processing wastewaters at nine different operating HRTs.
Organic Contents Removal
day Biochemical Oxygen Demand (BOD5)
Figure 4.15 shows the BOD removal percentage after five days of continuous system
operation at nine different operating HRTs for the three different concentration
processing wastewaters without salt content. In the continuous system treatment, 10
HRT attained the highest BOD removal rate of 81.0% in the 30-fold diluted wastewater
and the lowest removal rate of 15.0% was found at the 2-day HRT in the 10
VSS increase percentage in a continuous treatment system for three different concentrations of diluted fish processing
Figure 4.15 shows the BOD removal percentage after five days of continuous system
operation at nine different operating HRTs for the three different concentrations of fish
processing wastewaters without salt content. In the continuous system treatment, 10-day
fold diluted wastewater
day HRT in the 100-fold
Univers
ity of
Mala
ya

Figure 4.15: BOD5 removal percentage in a continuous treatment system for three different concentrations of diluted fish processing wastewaters with nine different operating HRTs.
(b) Chemical Oxygen Demand (COD)
Figure 4.16 shows the COD removal percentage after five days of continuous
system operation at nine different operating HRTs for the three different concentrations
of fish processing wastewaters without salt content. In the continuous
system, the 10-day HRT attained the highest COD removal rate of 85.5% in the 30
diluted wastewater and the lowest removal rate of 16.0% was found at the 2
the 100-fold diluted wastewater.
removal percentage in a continuous treatment system for three different concentrations of diluted fish processing wastewaters with nine different operating HRTs.
n Demand (COD)
Figure 4.16 shows the COD removal percentage after five days of continuous
system operation at nine different operating HRTs for the three different concentrations
of fish processing wastewaters without salt content. In the continuous
day HRT attained the highest COD removal rate of 85.5% in the 30
diluted wastewater and the lowest removal rate of 16.0% was found at the 2
fold diluted wastewater.
removal percentage in a continuous treatment system for three different concentrations of diluted fish processing
Figure 4.16 shows the COD removal percentage after five days of continuous
system operation at nine different operating HRTs for the three different concentrations
of fish processing wastewaters without salt content. In the continuous flow treatment
day HRT attained the highest COD removal rate of 85.5% in the 30-fold
diluted wastewater and the lowest removal rate of 16.0% was found at the 2-day HRT in
Univers
ity of
Mala
ya

78
Figure 4.16: COD removal percentage in a continuous flow treatment system for three different concentrations of diluted fish processing wastewaters with nine different operating HRTs.
4.3.3 Nutrient Contents Removal
(a) Ammoniacal Nitrogen (NH3-N)
Figure 4.17 shows the percentages of NH3-N removal found in the effluent after five
days of continuous flow system operation for the three concentrations of fish processing
wastewaters without salt content at nine different operating HRTs. The efficiency of
NH3-N removal decreased with the increasing dilution fold of the original fish
processing wastewater and decreasing of HRT from 7-day HRT to 2-day HRT. At
HRTs of 8, 9, and 10 days, the removal of NH3-N was more than 70.0% in 30-fold
diluted fish processing wastewater. The highest percentage of NH3-N removal, 72.5%
was found in 30-fold diluted fish processing wastewater at 10 day HRT, while the
lowest percentage of NH3-N removal, and 14.0% was found in 100-fold diluted fish
processing wastewater at 2-day HRT.
0
10
20
30
40
50
60
70
80
90
0 2 4 6 8 10 12
HRT (day)
COD removal (%
)
30 x dilution
50 x dilution
100 x dilution
Univers
ity of
Mala
ya

Figure 4.17: NH3-N removal percentage in a continuous treatment system for three different concentrations of diluted fish processing wastewaters with nine different operating HRT conditions.
(b) Nitrate Nitrogen (
Figure 4.18 shows the percentage of
days of continuous flow system operation of the three different concentrations of fish
processing wastewaters at nine different HRT conditions. After five days o
flow operation, the highest percentage of
30-fold diluted fish processing wastewater at the 10
of NO3−-N removal of 10.0% was found in the 30
wastewater at the 2-day HRT.
N removal percentage in a continuous treatment system for three different concentrations of diluted fish processing wastewaters with nine different operating HRT conditions.
Nitrate Nitrogen (NO3−-N)
Figure 4.18 shows the percentage of NO3−-N removal found in the effluent after five
days of continuous flow system operation of the three different concentrations of fish
processing wastewaters at nine different HRT conditions. After five days o
flow operation, the highest percentage of NO3−-N removal of 70.0% was found in the
fold diluted fish processing wastewater at the 10-day HRT. The lowest percentage
removal of 10.0% was found in the 30-fold diluted fish processing
day HRT.
N removal percentage in a continuous treatment system for three different concentrations of diluted fish processing wastewaters
removal found in the effluent after five
days of continuous flow system operation of the three different concentrations of fish
processing wastewaters at nine different HRT conditions. After five days of continuous
removal of 70.0% was found in the
day HRT. The lowest percentage
fold diluted fish processing
Univers
ity of
Mala
ya

Figure 4.18: NO3
−-N for three different concentrations of diluted fish processing wastewate
(c) Phosphorus (P)
Figure 4.19 shows the percentages of phosphorus removal found in the effluent after
five days of continuous system operation of the three different concentrations of fish
processing wastewaters without salt content. After five days of continuous flow
operation, the highest percentage of P removal of 62.0% was found in the 30
diluted fish processing wastewater at the 10
removal of 4.0% was foun
day HRT.
N removal percentage in a continuous treatment system for three different concentrations of diluted fish processing wastewaters with 9 different HRT operating conditions.
Figure 4.19 shows the percentages of phosphorus removal found in the effluent after
five days of continuous system operation of the three different concentrations of fish
waters without salt content. After five days of continuous flow
operation, the highest percentage of P removal of 62.0% was found in the 30
diluted fish processing wastewater at the 10-day HRT, while the lowest percentage of P
removal of 4.0% was found in the 100-fold diluted fish processing wastewater at the 2
removal percentage in a continuous treatment system for three different concentrations of diluted fish processing
Figure 4.19 shows the percentages of phosphorus removal found in the effluent after
five days of continuous system operation of the three different concentrations of fish
waters without salt content. After five days of continuous flow
operation, the highest percentage of P removal of 62.0% was found in the 30-fold
day HRT, while the lowest percentage of P
fold diluted fish processing wastewater at the 2-
Univers
ity of
Mala
ya

Figure 4.19: P removal percentage in a continuous treatment system for three different concentrations of diluted fish processing wastewaters at nine different HRT operating conditions.
4.3.4 Biomass Yield
Figure 4.20 shows the percentage of biomass yield obtained in the effluent after five
days of continuous system operation of the three different concentrations o
processing wastewaters at nine different operating HRTs. In the figure, three different
diluted concentrations of salt
The biomass yield decreased with the increasing dilution fold of the ori
processing wastewater. In the continuous system, the lowest biomass yield percentage
of 10.0% was found at the 2
highest biomass yield percentage of 65.0% was found in the 30
processing wastewater at the 8
P removal percentage in a continuous treatment system for three different concentrations of diluted fish processing wastewaters at nine different HRT operating conditions.
Biomass Yield
Figure 4.20 shows the percentage of biomass yield obtained in the effluent after five
days of continuous system operation of the three different concentrations o
processing wastewaters at nine different operating HRTs. In the figure, three different
diluted concentrations of salt-free fish processing wastewaters increased with the HRTs.
The biomass yield decreased with the increasing dilution fold of the ori
processing wastewater. In the continuous system, the lowest biomass yield percentage
of 10.0% was found at the 2-day HRT in the 100-fold diluted wastewater, while the
highest biomass yield percentage of 65.0% was found in the 30-fold diluted fis
processing wastewater at the 8-day HRT.
P removal percentage in a continuous treatment system for three different concentrations of diluted fish processing
Figure 4.20 shows the percentage of biomass yield obtained in the effluent after five
days of continuous system operation of the three different concentrations of fish
processing wastewaters at nine different operating HRTs. In the figure, three different
free fish processing wastewaters increased with the HRTs.
The biomass yield decreased with the increasing dilution fold of the original fish
processing wastewater. In the continuous system, the lowest biomass yield percentage
fold diluted wastewater, while the
fold diluted fish Univers
ity of
Mala
ya

82
Figure 4.20: Biomass yield percentage in a continuous treatment system for three different concentrations of diluted fish processing wastewaters with nine different operating HRT conditions.
4.4 Continuous Operation at Different Substrate and Salt Concentrations
4.4.1 Solids Removal
(a) Total Solids (TS)
Figure 4.21 shows the TS removal in the continuous system at continuous system
with various salt contents at the optimum HRT of 8-, 9-, and 10-day, respectively.
In continuous system operation with various salt contents at HRT of 8, 9 and 10
days, the highest percentage of TS removal, 32.0% was found in 50-fold diluted fish
processing wastewater at HRT 9 day with 7% salt content. The lowest percentage
removal of 4.0% was found in 30-fold diluted wastewater added with 1% salt content at
8 days of HRT.
0
10
20
30
40
50
60
70
0 2 4 6 8 10 12
HRT (day)
Biomass Yield (%)
30 x dilution
50 x dilution
100 x dilution
Univers
ity of
Mala
ya

83
Figure 4.21: TS removal percentage in a continuous treatment system for three different concentrations of diluted fish processing wastewaters with twelve different salt concentrations at HRT of 8, 9 and 10 days.
(b) Total Suspended solids (TSS)
The TSS removal percentages in the continuous system at 12 different salt contents
after five days of treatment operations are shown in Figure 4.22. The highest percentage
of TSS removal was 37.0% and was achieved at the 8-day HRT in the 100-fold diluted
fish processing wastewater that was added with 7% NaCl. The lowest percentage
removal of 6.0% was found in the 30- and 50-fold diluted fish processing wastewaters
with 1% salt concentration at the 8-day HRT and in the 30-fold diluted wastewater
without salt concentration at the 8- and 9-day HRTs.
0
5
10
15
20
25
30
35
0 1 2 3 4 5 6 7 8
Salt content (% NaCl)
TS
rem
ov
al
(%)
30 x dilution, 8 day HRT 50 x dilution, 8 day HRT
100 x dilution, 8 day HRT 30 x dilution, 9 day HRT
50 x dilution, 9 day HRT 100 x dilution, 9 day HRT
30 x dilution, 10 day HRT 50 x dilution, 10 day HRT
100 x dilution, 10 day HRT
Univers
ity of
Mala
ya

Figure 4.22: TSS removal percentage in a continuous treatment system for three different concentrations of diluted fish processing waste with 12 different salt concentrations at the HRTs of 8, 9 and 10 days.
(c) Total Dissolved Solids (TDS)
Figure 4.23 shows the percentage removal after 5
3 optimum operating HRT range from 10 to 8 days of HRT for the three different
concentration of fish processing wastewater at twelve different NaCl concentrations.
The lowest percentage of TDS removal was 8.0% found at 9
diluted fish processing wastewater with 1% salt content. While the highest percentage
of TDS removal, 35.0% was found at 8
wastewater with 7% salt content.
TSS removal percentage in a continuous treatment system for three different concentrations of diluted fish processing wastewith 12 different salt concentrations at the HRTs of 8, 9 and 10
(c) Total Dissolved Solids (TDS)
Figure 4.23 shows the percentage removal after 5-day continuous system operation at
imum operating HRT range from 10 to 8 days of HRT for the three different
concentration of fish processing wastewater at twelve different NaCl concentrations.
The lowest percentage of TDS removal was 8.0% found at 9-day HRT in 30
ng wastewater with 1% salt content. While the highest percentage
of TDS removal, 35.0% was found at 8-day HRT in 100-fold diluted fish processing
wastewater with 7% salt content.
TSS removal percentage in a continuous treatment system for three different concentrations of diluted fish processing wastewaters with 12 different salt concentrations at the HRTs of 8, 9 and 10
day continuous system operation at
imum operating HRT range from 10 to 8 days of HRT for the three different
concentration of fish processing wastewater at twelve different NaCl concentrations.
day HRT in 30-fold
ng wastewater with 1% salt content. While the highest percentage
fold diluted fish processing
Univers
ity of
Mala
ya

85
Figure 4.23: TDS removal percentage in a continuous treatment system for three different concentrations of diluted fish processing wastewaters with twelve different salt concentrations at HRTs of 8, 9 and 10 days.
(d) Volatile Suspended Solids (VSS)
Figure 4.24 shows the VSS increase percentage after five days of continuous system
operation with three different operating HRTs (10-, 9-, and 8-day HRTs) for the three
different concentrations of fish processing wastewaters at 12 different salt contents. In
the continuous reactor with various salt concentrations, the lowest VSS increase
percentage of 9.0% was found at the 9- and 10-day HRTs in the 100-fold diluted fish
processing wastewater with 7% salt content, while the highest VSS increase percentage
of 50.0% was found at the 8-day HRT in the 30-fold diluted fish processing wastewater
with 1% salt contents.
0
5
10
15
20
25
30
35
40
0 1 2 3 4 5 6 7 8
Salt content (% NaCl)
TD
S r
em
ov
al
(%)
30 x dilution, 8 day HRT 50 x dilution, 8 day HRT
100 x dilution, 8 day HRT 30 x dilution, 9 day HRT
50 x dilution, 9 day HRT 100 x dilution, 9 day HRT
30 x dilution, 10 day HRT 50 x dilution, 10 day HRT
100 x dilution, 10 day HRT
Univers
ity of
Mala
ya

Figure 4.24: VSS increase percentage in a continuous treatment system for three different concentra wastewaters with 12 different salt concentrations at the HRTs of 8, 9 and 10 days.
4.4.2 Organic Contents
(a) 5-day Biochemical Oxygen Demand (BOD
Figure 4.25 shows the BOD re
system operation with three different operating HRTs (10
three different concentrations of fish processing wastewaters at 12 different salt
contents. In the continuous treatment s
HRTs 8, 9 and 10 days in the 30
with 1% salt content were 80.3%, 65.0%, and 38.7%, respectively; at 7% salt content,
the average BOD removal rates of the th
20.3%, and 15.3%, respectively. The lowest BOD removal of 14.0% was found at the 8
day HRT in the 100-fold diluted wastewater with 7% NaCl content. The highest BOD
removal of 82.0% was achieved at the 10
VSS increase percentage in a continuous treatment system for three different concentrations of diluted fish processing wastewaters with 12 different salt concentrations at the HRTs of 8, 9 and 10 days.
Organic Contents Removal
day Biochemical Oxygen Demand (BOD5)
Figure 4.25 shows the BOD removal percentage after five days of continuous
system operation with three different operating HRTs (10-, 9-, and 8-day HRTs) for the
three different concentrations of fish processing wastewaters at 12 different salt
contents. In the continuous treatment system, the average BOD removal rates of the
HRTs 8, 9 and 10 days in the 30-, 50-, and 100-fold diluted fish processing wastewaters
with 1% salt content were 80.3%, 65.0%, and 38.7%, respectively; at 7% salt content,
the average BOD removal rates of the three operating HRT were down to 21.3%,
20.3%, and 15.3%, respectively. The lowest BOD removal of 14.0% was found at the 8
fold diluted wastewater with 7% NaCl content. The highest BOD
removal of 82.0% was achieved at the 10-day HRT in the 30-fold diluted wastewater
VSS increase percentage in a continuous treatment system for tions of diluted fish processing
wastewaters with 12 different salt concentrations at the HRTs of
moval percentage after five days of continuous
day HRTs) for the
three different concentrations of fish processing wastewaters at 12 different salt
ystem, the average BOD removal rates of the
fold diluted fish processing wastewaters
with 1% salt content were 80.3%, 65.0%, and 38.7%, respectively; at 7% salt content,
ree operating HRT were down to 21.3%,
20.3%, and 15.3%, respectively. The lowest BOD removal of 14.0% was found at the 8-
fold diluted wastewater with 7% NaCl content. The highest BOD
fold diluted wastewater
Univers
ity of
Mala
ya

with 1% NaCl content. The high bacteria growth rate in the reactor was able to remove
more biochemical oxygen demand in the reactor.
Figure 4.25: BOD5 removal percentage in a continuous treatment system for three different concentrations of diluted fish processing wastewaters with 12 different salt concentrations at HRTs of 8, 9 and 10 days.
(c) Chemical Oxygen Demand (COD)
Figure 4.26 shows the COD removal percentage after five da
system operation with three different operating HRTs (10
three different concentrations of fish processing wastewaters at 12 different salt
contents. In the continuous flow treatment system, the highest COD re
was observed at the 10
content. The lowest COD removal of 15.0% was found at the 9
fold diluted wastewater with 7% salt content. The 10
COD removal due to the longer contact time between the biomass and the substrate
with 1% NaCl content. The high bacteria growth rate in the reactor was able to remove
more biochemical oxygen demand in the reactor.
removal percentage in a continuous treatment systemfor three different concentrations of diluted fish processing wastewaters with 12 different salt concentrations at HRTs of 8, 9 and 10 days.
Chemical Oxygen Demand (COD)
Figure 4.26 shows the COD removal percentage after five days of continuous
system operation with three different operating HRTs (10-, 9-, and 8-day HRTs) for the
three different concentrations of fish processing wastewaters at 12 different salt
contents. In the continuous flow treatment system, the highest COD re
was observed at the 10-day HRT in the 30-fold diluted wastewater with 1% NaCl
content. The lowest COD removal of 15.0% was found at the 9-day HRT in the 100
fold diluted wastewater with 7% salt content. The 10-day HRT achieved the highest
D removal due to the longer contact time between the biomass and the substrate
with 1% NaCl content. The high bacteria growth rate in the reactor was able to remove
removal percentage in a continuous treatment system for three different concentrations of diluted fish processing wastewaters with 12 different salt concentrations at HRTs of
ys of continuous
day HRTs) for the
three different concentrations of fish processing wastewaters at 12 different salt
contents. In the continuous flow treatment system, the highest COD removal of 86.0%
fold diluted wastewater with 1% NaCl
day HRT in the 100-
day HRT achieved the highest
D removal due to the longer contact time between the biomass and the substrate
Univers
ity of
Mala
ya

value. The COD removal rate increased with the increase in HRT. COD was the most
affected parameter by the increase in salt concentrations in the fish processing
wastewater. The average COD removal rates of the HRTs 8, 9, and 10 days for the 30
50-, and 100-fold diluted fish processing wastewaters dropped from 84.0% to 23.3%,
68.3% to 21.7%, and 38.7% to 16.0%, respectively, when the salinity increased from 1
to 7%. The low COD removal efficiency might be due to the adverse effect of salt on
microbial activity. High salinity is generally known to cause plasmolysis and loss of cell
activity (Campos et al., 2002; Rene
Figure 4.26: COD removal percen different concentrations of diluted fish processing wastewater with 0-7.0% of salt concentrations at the HRTs of 8, 9 and
10 days.
value. The COD removal rate increased with the increase in HRT. COD was the most
affected parameter by the increase in salt concentrations in the fish processing
average COD removal rates of the HRTs 8, 9, and 10 days for the 30
fold diluted fish processing wastewaters dropped from 84.0% to 23.3%,
68.3% to 21.7%, and 38.7% to 16.0%, respectively, when the salinity increased from 1
removal efficiency might be due to the adverse effect of salt on
microbial activity. High salinity is generally known to cause plasmolysis and loss of cell
2002; Rene et al., 2008).
COD removal percentage in a continuous system for three different concentrations of diluted fish processing wastewater
7.0% of salt concentrations at the HRTs of 8, 9 anddays.
value. The COD removal rate increased with the increase in HRT. COD was the most
affected parameter by the increase in salt concentrations in the fish processing
average COD removal rates of the HRTs 8, 9, and 10 days for the 30-,
fold diluted fish processing wastewaters dropped from 84.0% to 23.3%,
68.3% to 21.7%, and 38.7% to 16.0%, respectively, when the salinity increased from 1
removal efficiency might be due to the adverse effect of salt on
microbial activity. High salinity is generally known to cause plasmolysis and loss of cell
tage in a continuous system for three different concentrations of diluted fish processing wastewater
7.0% of salt concentrations at the HRTs of 8, 9 and Univers
ity of
Mala
ya

4.4.3 Nutrients Removal
(a) Ammoniacal Nitrogen (NH
Figure 4.27 shows the percentage of NH
days of continuous system operation of the three different concentrations of fish
processing wastewaters with 11 different salt concentrations
the control at three different optimum HRT operating conditions. After five days of
continuous flow operation, the highest percentage of NH
found at the 10-day HRT in the 30
NaCl, while the lowest percentage of NH
fold diluted fish processing wastewater with 7% salt content at the 8
Figure 4.27: NH3-N removal percentage in continuous treatm three different concentrations of diluted fish processing wastewaters with 12 different salt concentrations at the HRTs of 8,
9, and 10 days.
4.4.3 Nutrients Removal
Ammoniacal Nitrogen (NH3-N)
shows the percentage of NH3-N removal found in the effluent after five
days of continuous system operation of the three different concentrations of fish
processing wastewaters with 11 different salt concentrations and without salt content as
the control at three different optimum HRT operating conditions. After five days of
continuous flow operation, the highest percentage of NH3-N removal of 73.0% was
day HRT in the 30-fold diluted fish processing wastewater with 1%
NaCl, while the lowest percentage of NH3-N removal of 15.0% was found in the 100
fold diluted fish processing wastewater with 7% salt content at the 8-day HRT.
N removal percentage in continuous treatment system for three different concentrations of diluted fish processing wastewaters with 12 different salt concentrations at the HRTs of 8,
and 10 days.
N removal found in the effluent after five
days of continuous system operation of the three different concentrations of fish
and without salt content as
the control at three different optimum HRT operating conditions. After five days of
N removal of 73.0% was
wastewater with 1%
N removal of 15.0% was found in the 100-
day HRT.
ent system for three different concentrations of diluted fish processing wastewaters with 12 different salt concentrations at the HRTs of 8,
Univers
ity of
Mala
ya

(b) Nitrate Nitrogen (
Figure 4.28 shows the percentage of
days of continuous flow operation of the three different concentrations of fish
processing wastewaters with 11 different salt concentrations and without salt content as
the control at three different optimum HRT operating conditions. After five days of
continuous flow operation, the highest percentage of
found at the 9-day HRT in the 30
NaCl, while the lowest percentage of
fold diluted fish processing wastewater with 7% salt contents at the 9
Figure 4.28: NO3−-N
three different concentrations of diluted fish processing wastewaters with 12 different salt concentrations at HRTs of 8, 9 and 10 days.
(c) Phosphorus (P)
Figure 4.29 shows the
of continuous operation of the three different concentrations of fish processing
Nitrate Nitrogen (NO3−-N)
Figure 4.28 shows the percentage of NO3−-N removal found in the effluent after five
days of continuous flow operation of the three different concentrations of fish
processing wastewaters with 11 different salt concentrations and without salt content as
he control at three different optimum HRT operating conditions. After five days of
continuous flow operation, the highest percentage of NO3−-N removal of 72.0% was
day HRT in the 30-fold diluted fish processing wastewater with 1%
the lowest percentage of NO3−-N removal of 12.0% was found in the 100
fold diluted fish processing wastewater with 7% salt contents at the 9-day HRT.
N removal percentage in a continuous treatment system for three different concentrations of diluted fish processing wastewaters with 12 different salt concentrations at HRTs of 8, 9 and 10 days.
Figure 4.29 shows the percentage of P removal found in the effluent after five days
of continuous operation of the three different concentrations of fish processing
emoval found in the effluent after five
days of continuous flow operation of the three different concentrations of fish
processing wastewaters with 11 different salt concentrations and without salt content as
he control at three different optimum HRT operating conditions. After five days of
removal of 72.0% was
fold diluted fish processing wastewater with 1%
removal of 12.0% was found in the 100-
day HRT.
removal percentage in a continuous treatment system for three different concentrations of diluted fish processing wastewaters with 12 different salt concentrations at HRTs of 8, 9
percentage of P removal found in the effluent after five days
of continuous operation of the three different concentrations of fish processing
Univers
ity of
Mala
ya

wastewaters with 11 different salt concentrations and without salt content as the control
at three different optimum HRT operating conditions. The results demonstrated that
phosphate removal was severely affected by the increase in salt concentrations from
3.0%, particularly in the 30
salt content increased from 2.5% to 7.0%,the highest drops of P removal efficiency rates
was found in the 30-fold diluted fish processing wastewater, with 45.0% at 8
43.0% at 9-day HRT and 42.0% at 10
rates was found in the 50
HRT, 40.0% at 9 day-HRT and 40.0% at 10
of P was observed in the 100
day HRT, 19.0% at 9-day HRT
Figure 4.29: P removal percentage in a continuous system treatment for three different concentrations of diluted fish processing wastewaters with 12 different salt concentrations at the HRTs of 8, 9 and 10 days.
After five days of continuous operation, the highest percentage of P removal of
62.0% was found at the 8
wastewaters with 11 different salt concentrations and without salt content as the control
imum HRT operating conditions. The results demonstrated that
phosphate removal was severely affected by the increase in salt concentrations from
3.0%, particularly in the 30- and 50-fold diluted fish processing wastewater. When the
rom 2.5% to 7.0%,the highest drops of P removal efficiency rates
fold diluted fish processing wastewater, with 45.0% at 8
day HRT and 42.0% at 10-day HRT. The second highest drops of P removal
50-fold diluted wastewater with removal rates of 43.0% at 8
HRT and 40.0% at 10-day HRT. While the lowest removal rates
of P was observed in the 100-fold diluted fish processing wastewater with 21.0% at 8
day HRT and 21.0% at 10-day HRT.
P removal percentage in a continuous system treatment for three different concentrations of diluted fish processing wastewaters with
erent salt concentrations at the HRTs of 8, 9 and 10 days.
After five days of continuous operation, the highest percentage of P removal of
62.0% was found at the 8-day HRT in the 30-fold diluted fish processing wastewater
wastewaters with 11 different salt concentrations and without salt content as the control
imum HRT operating conditions. The results demonstrated that
phosphate removal was severely affected by the increase in salt concentrations from
fold diluted fish processing wastewater. When the
rom 2.5% to 7.0%,the highest drops of P removal efficiency rates
fold diluted fish processing wastewater, with 45.0% at 8-day HRT,
day HRT. The second highest drops of P removal
fold diluted wastewater with removal rates of 43.0% at 8-day
day HRT. While the lowest removal rates
fold diluted fish processing wastewater with 21.0% at 8-
P removal percentage in a continuous system treatment for three different concentrations of diluted fish processing wastewaters with
erent salt concentrations at the HRTs of 8, 9 and 10 days.
After five days of continuous operation, the highest percentage of P removal of
fold diluted fish processing wastewater
Univers
ity of
Mala
ya
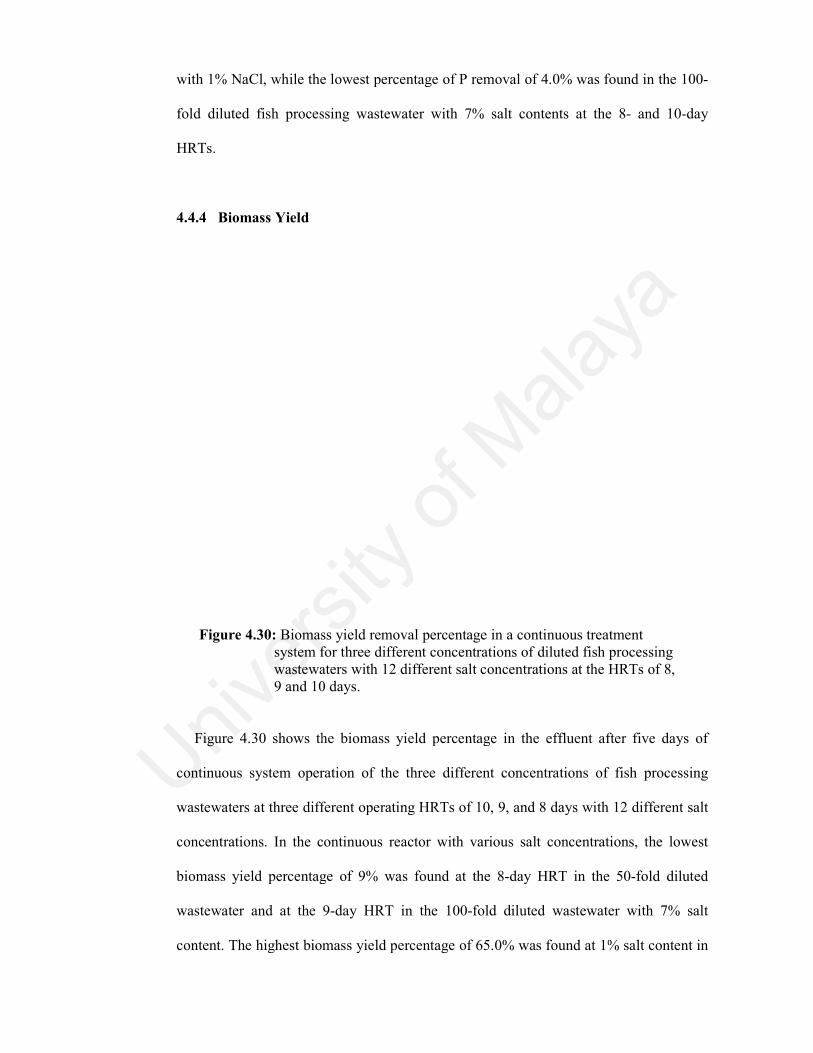
with 1% NaCl, while the lowest p
fold diluted fish processing wastewater with 7% salt contents at the 8
HRTs.
4.4.4 Biomass Yield
Figure 4.30: Biomass yield removal percentage in a continuous tre system for three different concentrations of diluted fish processing wastewaters with 12 different salt concentrations at the HRTs of 8, 9 and 10 days.
Figure 4.30 shows the biomass yield percentage in the effluent after five days of
continuous system operation of the three different concentrations of fish processing
wastewaters at three different operating HRTs of 10, 9, and 8 days with 12 different salt
concentrations. In the continuous reactor with various salt concentrations, the lowest
biomass yield percentage of 9% was found at the 8
wastewater and at the 9
content. The highest biomass yield percentage of 65.0% was found at 1% salt content in
with 1% NaCl, while the lowest percentage of P removal of 4.0% was found in the 100
fold diluted fish processing wastewater with 7% salt contents at the 8
Biomass yield removal percentage in a continuous treatment system for three different concentrations of diluted fish processing wastewaters with 12 different salt concentrations at the HRTs of 8,
and 10 days.
4.30 shows the biomass yield percentage in the effluent after five days of
continuous system operation of the three different concentrations of fish processing
wastewaters at three different operating HRTs of 10, 9, and 8 days with 12 different salt
ntrations. In the continuous reactor with various salt concentrations, the lowest
biomass yield percentage of 9% was found at the 8-day HRT in the 50
wastewater and at the 9-day HRT in the 100-fold diluted wastewater with 7% salt
highest biomass yield percentage of 65.0% was found at 1% salt content in
ercentage of P removal of 4.0% was found in the 100-
fold diluted fish processing wastewater with 7% salt contents at the 8- and 10-day
atment system for three different concentrations of diluted fish processing wastewaters with 12 different salt concentrations at the HRTs of 8,
4.30 shows the biomass yield percentage in the effluent after five days of
continuous system operation of the three different concentrations of fish processing
wastewaters at three different operating HRTs of 10, 9, and 8 days with 12 different salt
ntrations. In the continuous reactor with various salt concentrations, the lowest
day HRT in the 50-fold diluted
fold diluted wastewater with 7% salt
highest biomass yield percentage of 65.0% was found at 1% salt content in
Univers
ity of
Mala
ya

93
the 30-fold diluted fish processing wastewater at the 8-day HRT. As the salt content in
the 30-, 50-, and 100-fold diluted fish processing wastewaters increased to 7%, the
average biomass growth rates of HRTs 8, 9 and 10 days were decreased to 11.0%,
10.3%, and 10.7%, respectively.
Univers
ity of
Mala
ya

94
CHAPTER 5
DISCUSSION
5.1 Introduction
The treatment system performances in this research project were studied by
evaluating the data of the influent feed into the reactor and the daily effluent from day
one to day five treatment on the temperature and pH value, biomass accumulated, solids
removal, organic degradation of BOD and COD, and nutrients removal of NH3-N,
NO3−-N and P for analyzing the biomass yield and the efficiency of microorganisms in
treating fish processing wastewater in batch operation with the variables of different
substrate concentrations (30-, 50-, and 100-fold diluted fish processing wastewater) and
different salt concentrations (0.0% - 7.0%), and in continuous operation with the
variables of different substrate concentrations, different HRT (ten to 2 days), and
different salt concentrations. Batch operation was performed in three different
concentration of fish processing wastewater at 12 different salt concentrations (0.0%,
0.05%, 0.10%, 0.15%, 0.20%, 0.25%, 0.30%, 0.35%, 0.40%, 0.50%, 0.60%, 0.70%
NaCl w/v NaCl), while continuous operation was operated in three different
concentration of fish processing wastewater without salt content at nine different HRT
(ten to two days) in the first phase of the experiments, and the second phase of
experiments was performed in three different concentration of fish processing
wastewater added with 11 different salt concentrations varying from 0.05% to 0.70% at
the optimal HRT obtained from 8-day, 9-day, and 10-day HRTs. On the basis of the
results of the laboratory investigation, the occurrence and effectiveness of the natural
aerobic biodegradation processes were confirmed.
Univers
ity of
Mala
ya

95
5.2 pH Observation during Batch and Continuous Operation
Generally, wastewater microorganisms in biological treatment systems function best
in pH values from 6.5 to 7.5 for optimal biological growth although growth will occur
over the range of pH 4.0 to 9.5 (Metcalf & Eddy, 1991). In this study, the pH of the
fish processing wastewater in reactor of the batch and continuous operation increasing
along the treatment processes, at the range of pH 7.33 to pH 8.86.
In batch operation, the highest increase percentage of pH was 19.3% found in the
effluent of 30-fold diluted fish processing wastewater with 1.0% NaCl after five days
operation. While the lowest increase percentage of pH value of 9.6% was found in the
100-fold diluted fish processing effluent with 7.0% salt content.
In continuous flow operation at nine different HRT, the highest pH increase
percentage of 19.5% was observed at 8-day HRT in the effluent of 30-fold diluted fish
processing wastewater. The lowest increase percentage of 10.0% was found at the 2-day
HRT in the 100-fold diluted fish processing wastewater.
In continuous flow operation at 11 different salt concentrations, the pH value
increased along the 5-day treatment operation. The highest pH percentage increase of
19.6% was observed at the 8-day HRT in the effluent of 30-fold diluted fish processing
wastewater with 1.0% salt content. The lowest percentage increase of 8.0% was found
at the 8-day HRT in the 100-fold diluted fish processing wastewater with 7.0% salt
content. The increase of pH value indicated that the wastewater has high biomass
growth rate of the naturally occurring microorganisms (Tay et al., 2006; Lefebvre &
Moletta, 2006; Zhu et al., 2008; Bassin et al., 2012; Sherly et al., 2015).
Univers
ity of
Mala
ya

96
5.3 Effects of Substrate and Salt Concentrations on Batch Operation Efficiency
After 5 day aerobic batch treatment system with natural biodegradation, the three
different diluted concentration of salt free fish processing wastewater were found to
have higher percentage of biomass growth and substrate removal compared to the
wastewater added with salt content range from 2.5 to 7% in batch system. However, the
wastewater added until 2.0% salt concentration was found to have a positive to no effect
on the biomass growth and substrates removal rates. Inhibition process was found in the
wastewater added with salt concentrations of 2.5 to 7% NaCl. The biomass growth and
the substrate removal of BOD, COD, NH3-N, NO3--N and P show significant reduction
rate from 3 to 7% salt concentrations. It has been found that the addition of salt, in the
form of NaCl, increases the respiration rate of microorganisms until a specific salt
concentration is reached, thereafter a decrease is observed (Hamoda & Al-Attar, 1995).
5.4 Effects of HRT and Substrate Concentrations on Continuous Operation
Efficiency
In this study, the effect of nine different hydraulic retention times (HRT) on biomass
growth and pollutants removal in the fish processing wastewater were studied. The
experiments’ results showed that the pH value, biomass growth, biomass yield, TSS
concentration, and pollutant removal rates of BOD, COD, NH3-N, NO3−-N and P in the
reactor were decreased with lower concentration of fish processing wastewater influent,
and showed significant linear decreases in HRT from 7-day HRT to 2-day HRT. The
optimal pH value, biomass growth, biomass yield, TSS concentration, and pollutant
removal rates condition were found at HRTs of 8-day, 9-day, and 10-day HRT. The
optimum pH value, TSS concentration, biomass growth, and biomass yield were found
at 8-day HRT in 30-fold diluted wastewater, and the lowest were verified in the 100-
fold diluted wastewater at 2-day HRT. While the optimum removal percentages of
Univers
ity of
Mala
ya

97
pollutants were found at 10-day HRT in 30-fold diluted wastewater, and the lowest were
observed at 2-day HRT in 100-fold diluted wastewater. According to Zhu et al. (2008),
the increase in HRT increases the wastewater contact time in the reactor and improves
the removal efficiency of organic matter by promoting the growth of aerobic
microorganisms.
5.5 Effects of Salt and Substrate Concentrations on Continuous Operation
Efficiency
After five days of aerobic continuous flow treatment system operation with natural
biodegradation at the optimal HRT of 8-day, 9-day, and 10-day HRT, the results
obtained for this study have shown that the three different concentrations (30-, 50-, and
100-fold diluted) of salt-free fish processing wastewater had higher percentages of pH
value, biomass growth, biomass yield, TSS concentration, and substrate removal of
BOD5, COD, NH3-N, NO3−-N, and P than the wastewater with 3.0% to 7.0% salt
content. However, the wastewater with ≤ 2.5% salt concentration had a positive to no
effect on the pH value, biomass growth, biomass yield, TSS concentration and the
substrate removal rates. Inhibition was observed in the wastewater added with salt
concentrations of 3.0% to 7.0%.
The pH value, biomass growth, biomass yield, TSS concentration, and the substrate
removal showed significant linear reduction rates from 3.0% to 7.0% salt concentrations
and decreased with the increasing influent’s dilution fold of the original fish processing
wastewater. The lowest substrates removal efficiencies, pH value, biomass growth,
biomass yield, and TSS concentration were found in the greatest dilution of 100-fold
diluted wastewater containing 7.0% NaCl, while the highest percentage was verified in
the 30-fold diluted wastewater containing 1.0% NaCl. The reduced efficiencies with salt
additions could have been caused by the adverse effect of salt on microbial flora and the
Univers
ity of
Mala
ya

98
plasmolysis of organisms resulting in the loss of metabolic activity. The addition of salt
increased the respiration rate of microorganisms until it reached a specific salt
concentration; thereafter, a decrease was observed ( Vallero et al. 2003).
5.6 Effects of Salt Concentrations on the Solids, Organic and Nutrients
Removal in Batch and Continuous Operation
The TSS concentration decreased when the salt concentration increased from 1.0% to
7.0% NaCl. The decrease in TSS concentration indicates the death and washout of
biomass. Elevated salt concentrations are known to increase water density, which can
potentially cause the washout of small and poor settling sludge flocs. According to
Woolard and Irvine (1995b), biological systems subjected to salt shock loads respond
with increased effluent suspended solids and loss of volatile suspended solids, which are
similar to those observed in this work. Panswad and Anan (1993b) also observed a
decrease in TSS with the salt concentration increase. These authors observed a TSS
reduction of 60.0% with the increase in salinity from 0 g/L to 30g/L.
Among the ten analyzed parameters in this study, COD was the most affected
parameter with the increase in salt concentrations in the fish processing wastewater,
followed by BOD. The results show that the batch system can be effectively used to
treat high salinity fish processing wastewater to 586 conform to effluent standards of
COD lower than 80 mg/L and BOD lower than 20 mg/L. The results show that
phosphorus-accumulating bacteria are more sensitive to the high salinity than nitrifiers
and denitrifiers. The foul wastewater odor was completely removed, and the strong
reddish-brown color of the wastewater was reduced after five days of treatment.
When salt concentration was increase from 3.0 to 7%, there was a significant
decrease in NH3-N removal efficiency. This result demonstrates the effect of high salt
Univers
ity of
Mala
ya

99
concentration on nitrification. This finding is accordance with the findings of previous
study (Münch et al., 1996; Chen et al., 2003; Lyssenko & Weaton, 2006; Moussa et al.,
2006; Sharrer et al., 2007; Yogalakshmi & Josep, 2010; Bassin et al., 2012).
Yogalakshmi and Joseph (2010) have reported lower removal of ammonia at high salt
concentration. They found that the ammonia removal rate was 64.0% to 84.0% at the
NaCl loading of 5–30 g/L. The decrease in nitrification efficiency can be related to the
more sensitive short- and long-term salt stresses of nitrite and ammonia oxidizers, to the
repression of the synthesis of enzymes that utilize nitrate and nitrite as electron
acceptor, and to the significant changes in osmotic pressure. Decrease in removal of
NH4-N at high salt concentration could be due to the effect of plasmolysis or lower
availability of saline-resistant nitrifiers (Chen et al., 2003). The decrease in nitrification
efficiency can be related to the more sensitive short- and long-term salt stresses of
nitrite and ammonia oxidizers (Moussa et al., 2006; Rene et al., 2008), to the repression
of the synthesis of enzymes that utilize nitrate and nitrite as electron acceptor (Munch et
al., 1996), and to the significant changes in osmotic pressure (Zhao et al., 2013).
The NO3−-N removal efficiency generally decreased with the gradual increase in salt
concentration from 3% to 7% NaCl. This means that the gradual increment of salt
concentration above 3% NaCl showed inhibitory effect on NO3−-N removal efficiency
in continuous flow reactor. Chen et al. (2003) reported that nitrification was good up to
Cl concentration of 2.5 g/L and beyond that the nitrification rate started to decrease. The
decrease in NO3−-N removal efficiency with the increase in salt concentration was due
to the washed out dead biomass and lysed cell constituents (Lefebvre & Moletta, 2006),
the nitrification inhibition (Lefebvre and Moletta, 2006; Rene et al., 2008; Zhu et al.,
2008), and the denitrification process (Zhao et al., 2013).
Univers
ity of
Mala
ya

100
The high salt concentration was clearly seen as having an adverse impact on P
removal. The effect of salt on phosphorus removal was also reported by Uygur and
Kargi (2004), who described a decrease in P removal from 84% to 22% when the NaCl
concentration increased from 0% to 6% (w/v).
5.7 Summary
In summary, the results from this study reveal that the fish processing wastewater
with 0.5–7.0% NaCl and without salt content in a well-stirred aerobic continuous flow
reactor system of batch and continuous operation could be biodegraded by the natural
microorganisms in the wastewater without seeded with sludge (a well-grown sediment
sample) taken from the fish or food processing effluent for process startup. Pollutants in
the fish processing wastewater could be biodegraded by natural microbial populations in
the wastewater under an aerobic condition with the supplement of sufficient oxygen
using an aquarium air pump.
Univers
ity of
Mala
ya

101
CHAPTER 6
CONCLUSIONS AND RECOMMENDATIONS
6.1 Conclusions
The fish processing sector contributes serious organic pollution loads and high
salinity to receiving waters. This project study the effect of various salt concentrations
in three different concentration of fish processing wastewater (30-, 50-, and 100-fold
diluted wastewater concentration) in batch, and in continuous flow system at the
optimal HRT obtained. The performance of the systems were studied based on the
efficiency of pollutants removal and the biomass yield in the wastewater containing
0.0% to 7.0% w/v NaCl with the aid of the natural microorganisms in the wastewater
and the microorganisms developed inside the reactors. A better understanding of the
potential inhibitory effect of salt content on biological treatment processes is necessary
to consider the feasibility of fish processing saline wastewater disposal in the treatment
systems.
In summary, the experimental results showed that the biomass accumulated and the
removal of 5-day BOD (BOD5), COD, NH3-N, NO3--N, and P substrates in both of the
batch and continuous flow system were increased with higher concentration of influent
feed into the bioreactor. The evaluation of system performance at nine different
operating hydraulic retention times (HRT) that range from 2–10 days indicated that the
substrate removal rates increase with the increase in HRT along with the increasing
wastewater concentration. The optimum biomass yield was found at the 8-day HRT, and
the highest substrate removal was obtained at 10-day HRT.
Univers
ity of
Mala
ya

102
The analyzed results have shown that the highest percentage for biomass growth and
substrate removal are verified in the wastewater contained 1% NaCl in batch and
continuous systems. Experimental results showed that the biomass growth and substrate
removal rates in batch system were not affected up to 2.0% salt concentration, while the
continuous system results show the existence of inhibition effects at salt concentration
from 3.0%. This means that the biomass is able to reduce the organic load on the
biological batch system with a salt concentration as high as 2.0% w/v (20 g/L), and
beyond that started to decrease; while continuous flow system can successfully treat the
wastewater with a salt concentration as high as 2.5% (25 g/L) without inhibition by the
salt.
It was also found that the stinky odour of the wastewater was completely removed,
and the strong reddish-brown colour of the wastewater was reduced after 5 days
treatment. The treated wastewater without offensive odor and remained with the
nitrogen, protein and phosphorus content is feasible for reutilization as an
environmental friendly liquid fertilizer.
Univers
ity of
Mala
ya
103
6.2 Recommendations
As future works, the following ideas are proposed:
Results from this study could potentially increase effluent handling and its reuse.
Wastewater from fish processing industries has high potential to be reused as a liquid
fertilizer in agriculture since the main constituents are organic substance. Hence, the
potential of using fish processing treated effluent as an organic fertilizer to enhance
growth of plants need to be further confirmed through further analysis. Further studies
should involve the investigation for the impacts on the soil, the plants and the different
yields of the crops when irrigated with the treated fish processing saline wastewater of
different salt content.
It is also believed that the the main constituents in fish processing wastewater are
organic substance and do not contain known toxic or carcinogenic materials. However,
there is still a series of characterization tests are required in future works to determine
the substances are free from any toxic or carcinogenic elements. The analysis works in
this direction is a must to confirm the potential use of fish processing treated effluent as
an organic fertilizer to enhance growth of plants.
Research work also needs to be carried out to determine the potential of the effluent
to serve as nutrient source to the plant and develop the cells of the plants. It is believed
that using effluent as a feed source to the plant can reduce the demand of water resource
in agriculture. It is targeted that the effluents can substitute the fertilizer usage upon
plant. The success of effluent to serves as nutrient source can help the farmer to reduce
the cost of synthetic fertilizer periodically and less pollution will take place on land and
in stream due to short term usage of synthetic fertilizer.
Univers
ity of
Mala
ya

104
Closing the loop for nutrients in wastewater is a necessary sustainable
development objective to reduce resource consumption and greenhouse gas emissions.
A new paradigm is emerging, globally. Commercial marketing of recovered nutrients as
“green” fertilisers, and recycling of nutrients through biomass production to new outlets
such as biofuels, are taking off.
Univers
ity of
Mala
ya

105
REFERENCES
Abbasi, M., Dehghani, M., Moussavi, G., & Azhdarpoor, A. (2015). Degradation of organic matter of municipal sewage sludge using ultrasound treatment in shiraz wastewater treatment plant. Health Scope, 4(1), e23507.
Ali, H.M., Yusoff, N.H.N., Daud, A.D., Musa, C.U.C. & Othman, M.F. (2008). Status and prospects of grouper aquaculture in Malaysia. In I.C. Liao and E.M. Leano (Eds.), The aquaculture of groupers (pp. 155-175). Manila, Philippines: World Aquaculture Society.
Alrumman, S.A., El-kott, A.F., & Keshk, S.M.A.S. (2016). Water Pollution: Source & Treatment. American Journal of Environmental Engineering, 6(3), 88–98.
Amir, H.M., Vali, A., & Leila, R. (2013). Atmospheric moisture condensation to water recovery by home air conditioners. American Journal of Applied Sciences, 10(8), 917–923.
Andreas, N.A., & Shane, A.S. (2015). Wastewater Treatment and Reuse: Past, Present, and Future. Water, 7(9), 4887-4895.
APHA. (1995). Standard methods for the examination of water and wastewater (19th ed.). Washington, DC: American Public Health Association (APHA), American Water Works Association (AWWA), and Water Pollution Control Federation (WPCF).
APHA. (1998). Standard methods for the examination of water and wastewater (20th ed.). Washington, DC: American Public Health Association (APHA).
APHA–AWWA. (2005). Standard methods for water and wastewater examinations (21st ed.). Washington, DC: American Public Health Association, American Water Works Association.
Aquametrix Research. (1993). Environmental and surimi wastewater monitoring program at Pacific Coast Processors. (Ucluelet). A report to Pacific Coast Processors. Sidney, British Columbia: Aquametrix Research Ltd.
Artigaa, P., García-Torielloa, G., Méndezb, R., & Garridob, J.M. (2008). Use of a hybrid membrane bioreactor for the treatment of saline wastewater from a fish canning factory. Desalination, 221(1-3), 518–525.
Avasan, M.Y. & Rao, R.S. (2001). Effect of sugar mill effluent on organic resources of fish. Pollution Research, 20(2), 167-171.
Univers
ity of
Mala
ya

106
Balslev, O.P., Lynggaard, J.A., & Nickelsen, C. (1990). Pilot-scale experiments on anaerobic treatment of wastewater from a fish processing plant. Water Science and Technology, 22(1-2), 463–474.
Bassin, J.P., Kleerebezem, R., Muyzer, G., Rosado, A.S., Van Loosdrecht, M.C.M., & Dezotti, M. (2012). Effect of different salt adaptation strategies on the microbial diversity, activity, and settling of nitrifying sludge in sequencing batch reactors. Applied Microbiology and Biotechnology, 93(3), 1281–1294.
Battistoni, P. & Fava, G. (1995). Fish processing wastewater: production of internal carbon source for enhanced biological nitrogen removal. Water Science and Technology, 32 (9-10), 293-302.
Boopathy, R., Bonvillain C., Fontenot Q., & Kilgen M. (2006). Biological treatment of low-salinity shrimp aquaculture wastewater using sequencing batch reactor. USA: Department of Biological Sciences, Nicholls State University, P.O. Box 2021, Thibodaux, LA 70310, USA.
Bouchra, L., Latifa, B., & Noureddine, E. (2014). Biological treatment of liquid effluent resulting from the dairy industry by exogenous fungi. International Journal of Innovation and Applied Studies, 7(4), 1551-1559.
Brazil, B. (2004). Application of denitrification in aquaculture. Aquaculture Magazine, 30(4), 44–47.
Burnett, W.E. (1974). The effect of salinity variations on the activated sludge process. Water & Sewage Works, 121, 37-55.
Campos, J.L., Mosquera-Corral, A., Sanchez, M., Mendez, R., & Lema, J.M. (2002). Nitrification in saline wastewater with high ammonia concentration in an activated sludge unit. Water Research, 36(10), 2555–2560.
North Carolina Agricultural Extension Service (1979). Seafood water and wastewater management. Raleigh, North Carolina: Carawan, R.E., Chambers, J.V., & Zall, J.V.
Carawan, R.E. (1991). Processing plant waste management guidelines for aquatic fishery products. Food and the environment. Retrieved from http://www.p2pays.org/ref/02/01796.pdf
Chapman, D. (1996). Water quality assessment. UK: Chapman & Hall.
Univers
ity of
Mala
ya
107
Chen, G.H., Wong, M.T., Okabe, S., & Watanabe, Y. (2003). Dynamic response of nitrifying activated sludge batch culture to increased chloride concentration. Water Research, 37(13), 3125–3135.
Cho, K.S., Cho, K.J., Park, H.D., Jeong, S.W., Nam, S.J., & Lee, T. (2006). Characteristics of immobilized PVA beads in nitrate removal. Journal of Microbiology and Biotechnology, 16(3), 414–422.
Chowdhury, P., Viraraghavan, T., & Srinivasan, A. (2010). Biological treatment processes for fish processing wastewater – a review. Bioresource Technology, 101(2), 439–449.
COWI. (1999). Industrial sector guide. Cleaner production assessment in fish processing industry. Paris, France: UNEP DTIE; Copenhagen, Denmark: Danish Environmental Protection Agency.
Cristovao, R., Botelho, C.M., Martins, R.J.E., Loureiro, J.M., & Boaventura, R.A.R. (2015). Fish canning industry wastewater treatment for water reuse - a case study. Journal of Cleaner Production, 87, 603-612.
Cui, Y.W., Zhang, H.Y., Ding, J.R., & Peng, Y.Z. (2016). The effects of salinity on nitrification using halophilic nitrifiers in a Sequencing Batch Reactor treating hypersaline wastewater. Scientific Reports, 6, 24-25.
Dan, N. P., Visvanathan, C., & Basu, B. (2003). Comparative evaluation of yeast and bacterial treatment of high salinity wastewater based on biokinetic coefficients. Bioresource Technology, 87, 51-56.
Danh, L.T., Han, L.N., Triet, N.D.A., Zhao, J., Mammucari, R., & Foster, N. (2013) Comparison of chemical composition, antioxidant and antimicrobial activity of Lavender (Lavandula angustifolia L.) essential oils extracted by supercritical CO2, hexane and hydrodistillation. Food and Bioprocess Technology, 6, 3481–3489.
Daniels, S.M., Evans, M.G., & Agnew, C.T. (2012). Ammonium release from a blanket peatland into headwater stream systems. Environmental Pollution, 163, 261-272.
Del Valle, J. M., & Aguilera, J. M. (1990). Recovery of liquid by-products from fish meal factories: a review. Process Biochemistry International, 25, 122-131.
Department of Statistics Malaysia. (2017). Selected agricultural indicators, Malaysia, 2016: Production of agriculture sector increased in 2015. Putrajaya, Malaysia: The Office of Chief Statistician Malaysia.
Univers
ity of
Mala
ya

108
Department of Fisheries Malaysia. (2017). Status of the fisheries sector in Malaysia, 2016: Fisheries profile. Putrajaya, Malaysia: Data Collection Unit, Fisheries Information Management Division, Department of Fisheries Malaysia.
Department of Environment Malaysia. (1974). Environmental quality acts 1974 (pp. 111-135). Malaysia: Department of Environment Malaysia, compiled by Legal Research Board, International Law Book Services, Petaling Jaya, Selangor.
Russian Federation. (2006). Immobilized biocatalyst for biological purification of fat-containing wastewaters and the method of biocatalyst production (Patent Proposal, No.2: 006). Moscow, Russian: Efremenko, E.N., Senko, O.V., Spiricheva, O.V., Lozinsky, V.I., & Varfolomeyev, S.D.
Elena, E., Olga, S., Dinara, Z., Elena, P., & Vladimir, L. (2007). New biocatalyst with multiple enzymatic activities for treatment of complex food wastewaters. Chemical Enzymology Department, Chemistry Faculty, The M.V. Lomonosov Moscow State University, Lenin’s Hills 1/11, RU-119991 Moscow, Russia: The A.N. Nesmeyanov Institute of Organoelement Compounds, Russian Academy of Sciences.
EPA. (1993). Nitrogen control manual. Washington, DC: Office of Research and Development, Office of Water, U.S. Environmental Protection Agency.
Eric, S.L., & Ronald, A.R. (2014). Continuous bioprocessing and perfusion: Wider adoption coming as bioprocessing matures. BioProcessing, 13(1), 50-55.
FAO. (2002). FAO Fisheries statistical yearbook 2002. Rome, Italy: Food and Agricultural Organization of the United Nations (FAO).
FAO. (2014). The state of world fisheries and aquaculture 2014: Opportunities and challenges (pp. 3-69). Rome, Italy: Food and Agricultural Organization of the United Nations (FAO).
FAO. (2016). The state of world fisheries and aquaculture 2016: Contributing to food security and nutrition for all (pp. 1-79). Rome, Italy: Food and Agriculture Organization of the United Nations (FAO).
Ferraro, V., Cruz, I. B., Jorge, R. F., Xavier Malcata, F., Castro, P. M. L., & Pintado, M. E. (2011). Characterisation of high added value compounds in wastewater throughout the salting process of codfish (Gadus morhua). Food Chemistry, 124, 1363–1368.
Figueroa, M., A. Mosquera-Corral, J. L. Campos, & R. Me ́ndez. (2008). Treatment of saline wastewater in SBR aerobic granular reactors. Water Science and Technology, 58(2), 479–485.
Univers
ity of
Mala
ya

109
Garibaldi, L. (2012). The FAO global capture production database: a six-decade effort to catch the trend. Marine Policy, 36(3), 760–768.
Green, D., Tzou, L., Chiao, A.C., & Lanier, T.C. (1984). Strategies for handling soluble wastes generated during minced fish (surimi) production. Proceedings of the 39th Industrial Waste Conference Purdue University, Indiana (pp.627-636). Indiana, USA: Purdue University.
Gumisiriza, R., Anthony, M. M., Mugassa, S. T., Rubindamayugi, F. K. and Amelia, K. K. (2009). Enhancement of anaerobic digestion of Nile perch fish processing wastewater. African Journal of Biotechnology, 8(2), 328-333, 19 January.
HACH. (1996). DR/2000 Spectrophotometer instrument manual (3rd ed., Rev. 2). USA: Hach Company.
HACH. (1998). BODTrak™ instrument manual (1st ed., Rev. 5). USA: Hach Company.
HACH. (1999). Wastewater and biosolids analysis manual: Digestion and selected methods for determining metals, minerals, and other related parameters. U.S.A.: HACH Company.
HACH. (2001). DR/2000 Spectrophotometer procedures manual, (2nd ed.). U.S.A.: HACH Company.
HACH. (2002). DR/2000 Spectrophotometer instrument manual (4th ed.). U.S.A.: HACH Company.
Hall, G. M., & Ahmad, N. H. (1992). Surimi and fish mince products. In G.M. Hall (Eds.), Fish processing technology (pp. 72-86). New York: Chapman & Hall.
Hammer, J. (2005). Wastewater Flows and Characteristics. In Water and wastewater technology. Singapore: Prentice Hall Person Education South Asia Pte Ltd.
Hamoda, M. F., & Al-Attar, M. S. (1995). Effects of high sodium chloride concentrations on activated sludge treatment. Water Science Technology, 31(9), 61-72.
Huidobro, A., Montero, P. & Borderias, A. J. (1998). Emulsifying properties of an ultrafiltered protein from minced fish wash water. Food chemistry, 61(3), 339-343.
Univers
ity of
Mala
ya

110
Hwang, S., & Hansen, C. L. (1998). Formation of organic acids and ammonia during acidogenesis of trout-processing wastewater. Transactions of the ASAE, 41(1), 151–156.
Igbinosa, E. O., & Okoh, A. I. (2009). Impact of discharge wastewater effluents on the physico-chemical qualities of a receiving watershed in a typical rural community. International Journal of Environmental Science & Technology, 6(2), 175–182.
Ismail, I., Huda, N., & Fazilah, A. (2011). Surimi-like material from poultry meat and its potential as a surimi replacer. Asian Journal of Poultry Science, 5(1), 1–12.
Jemli, M., Karray, F., Feki, F., Loukil, S., Mhiri, N., Aloui, F., & Sayadi, S. (2015). Biological treatment of fish processing wastewater: a case study from Sfax City (Southeastern Tunisia). Journal of Environmental Sciences, 30, 102-112.
Joong, K. K., Jeong, B. K., Kyoung, S. C. & Yong, K. H. (2007). Isolation and identification of microorganisms and their aerobic biodegradation of fish-meal wastewater for liquid-fertilization. International Biodeterioration &
Biodegradation, 59 (2), 156-165.
Kargi, F., & Uygur, A. (1996). Biological treatment of saline wastewater in an aerated percolator unit utilizing halophilic bacteria. Environmental Technology, 17, 320-325.
Kargi, F., & Dincer, A. R. (1999). Salt inhibition of nitrification and denitrification in saline wastewater. Environmental Technology, 20, 1147-1153.
Kargi, F. (2002). Enhanced biological treatment of saline waste-water by using halophilic bacteria. Biotechnology Letters, 24, 1569-1572.
Kavitha, R.V., Krishna Murthy, V., Makam, R., & Asith, K .A. (2012). Physico-chemical analysis of effluents from pharmaceutical industry and its efficiency study. International Journal of Engineering Research and Applications, 2(2), 103-110.
Knapp, L.A. (2014). Study of process control strategies for biological nutrient removal in an oxidation ditch. Master’s Thesis, Tampa, FL, USA: University of South Florida, June 2014.
Kuhn, D.D., Boardman, G.D., Craig, S.R., McLean E., & Flick, Jr. (2007). Biological treatment of fish wastewater to generate microbial flocs (biomass) for shrimp culture. Aquaculture, 296, 51-57.
Univers
ity of
Mala
ya
111
Lawton, G. W., & Eggert, E. (1957). Effects of high sodium chloride concentrations on trickling filter slimes. Sewage and Industrial Wastes, 29, 1228-1237.
Lee, D., & Jean, D. (1999). Effects of salinity on expression dewatering of waste activated sludge. Journal of Colloid and Interface Science, 215, 443-445.
Len, R. G., Michael, D. P., & Pomeroy, R. S. (2008). Fisheries in Southeast Asia: challenges and opportunities. In A. Pandya, & E. Laipson (Eds.), Transnational trends: Middle Eastern and Asian Views (pp. 171-322). Washington: The Henry L. Stimson Center.
Lefebvre, O. & Moletta, R. (2006). Treatment of organic pollution in industrial saline wastewater: A literature review. Water Reasearch, 40(20), 3671–3682.
Lim, P. E., Y. K. Leong & Teng, Evelyn (1996). Environmental impacts of industries in Malaysia. In Proceedings of the state of the environment in Malaysia Conference, Consumer Association of Penang. (pp. 332).
Liu, S.X. (2007). Food and agricultural wastewater utilization and treatment. Ames, IA, USA: Blackwell Publishing Professional.
Lliyasu, A.H., Onu, J.I., Midau, A. & Fintan, J.S. (2011). Economics of smoked and dried fish marketing in Yola North and South local Government areas of Adamawa State, Nigeria. Journal of Agriculture & Social Sciences, 7, 13-16.
Luo X., Yang, R., Zhao, W., Cheng, Z., & Jiang, X. (2010). Gelling properties of Spanish mackerel (Scomberomorus niphonius) surimi as affected by washing process and high pressure. International Journal of Food Engineering, 6(4), Article 3, 1–16.
Lyssenko, C., & Wheaton, F. (2006). Impact of rapid pulse operating disturbances on ammonia removal by trickling and submerged upflow biofilters for intensive recirculating aquaculture. Aquacultural Engineering, 35, 38–50.
Melbourne Water. (2004). Recycling water for a greener future. Retrieved from http://www.waterrecycling.net.au/content/other.asp, accessed Jan/Feb 2004.
Mendez, R., Omil F., Soto M., & Lema J.M. (1992). Pilot plant studies on the anaerobic treatment of different wastewaters from a fish-canning factory. Water Science and Technology, 5, 37-44.
Metcalf & Eddy, Inc. (1991). Wastewater engineering: Treatment, disposal, and reuse (3rd ed.). New York, NY: McGraw-Hill, Inc.
Univers
ity of
Mala
ya
112
Mettler Toledo. (2005). Delta 320 pH meter operation manual. Shanghai, China : Mettler-Toledo Instruments (Shanghai) Co. Ltd.
MIDA. (2017). Food industry in Malaysia-ideal prospects, immense opportunities. Kuala Lumpur, Malaysia : Food Technology and Sustainable Resources Industries Division, Malaysia Investment Development Authority (MIDA).
Middlebrooks, E.J. (1965). A nomograph for solution of the BOD equation. Water and Sewage Works Journal, 112, R230.
Mitchell, R. (1974). Introduction to environmental microbiology. Englewood Cliffs, NJ, USA: Prentice-hall, Inc.
Mojiri, A., Aziz, H.A., Zaman, N.Q., Aziz, S.Q., & Zahed, M.A. (2014). Powdered ZELIAC augmented sequencing batch reactors (SBR) process for co-treatment of landfill leachate and domestic wastewater. Journal of Environmental Management, 139, 1–14.
Moussa, M.S., Sumanasekera, D.U., Irahim, S.H., Lubberding, H.J., Hooijmans, C.M., Gijzen, H.J., & Loosdrecht, M.C.M. (2006). Long term effects of salt on activity, population structure and floc characteristics in enriched bacterial cultures of nitrifiers. Water Research, 40, 377–388.
Mostafa, F. H., Surabhi, S., Loring, F. N., & James, E. A. (2006). Study of salt wash water toxicity on wastewater treatment. (Final Report). Purdue University, West Lafayette, IN, USA.
Mueller, D. K., & Spahr, N. E. (2005). Water-quality, streamflow, and ancillary data for nutrients in streams and rivers across the nation, 1992–2001. In U.S. Geological Survey Data Series 152. Reston, USA: U.S. Geological Survey.
Muthukumaran, S., & Baskaran, K. (2013). Organic and nutrient reduction in a fish processing facility-a case study. International Biodeterioration and Biodegradation, 85, 563–570.
Noukeu, N.A., Gouado, I., Priso, R.J.,Ndongo,D., Taffouo, V. D., Dibong, S.D., & Ekodeck, G. E. (2016). Characterization of effluent from food processing industries and stillage treatment trial with Eichhornia crassipes (Mart.) and Panicum maximum (Jacq.). Water Resources and Industry, 16, 1–18.
Neha, S., Sreemoyee, C., & Pradeep, B. (2013). An evaluation of physicochemical properties to assess quality of treated effluents from Jaipur dairy. International Journal of Chemical, Environmental and Pharmaceutical Research, 4(2-3), 54-58.
Univers
ity of
Mala
ya

113
Nadiah, K. (2012, September 7). Klang Valley, Johor river polluters to be identified. New straits Times, pp. 1A.
NovaTec Consultants Incorporation and EVS Environment Consultants. (1994). Wastewater Characterization of Fish Processing Plant Effluents - a Report to Water Quality/Waste Management Committee, Fraser River Estuary Management Program. Vancouver, B.C., Canada: NovaTec Consultants Incorporation and EVS Environment Consultants.
Olivier, L., & René M. (2006). Treatment of organic pollution in industrial saline wastewater: A literature review. France: INRA, UR050, Laboratoire de Biotechnologie de l’Environnement, Avenue des Etangs, Narbonne, F-11100.
Okumura, A., & Uetana, K. (1992). Treatment of fish processing wastes in Japan. Industry and Environment 15(1-2), 34-39.
Oren, A., Gurevich, P., Malkit, A., & Henis, Y. (1992). Microbial degradation of pollutants at high salt concentrations. Biodegradation, 3, 387–398.
Painter, H.A. (1977). Microbial Transformations of Inorganic Nitrogen. Progress in Water Technology, 8, 3-29.
Pankaj, C., Viraraghavan, T., & Srinivasan, A. (2010). Biological treatment processes for fish processing wastewater – A review. Bioresource Technology, 101, 439-449.
Panswad, T., & Anan, C. (1999a). Specific oxygen, ammonia and nitrate uptake rates of a biological nutrient removal process treating elevated salinity wastewater. Biosource Technology, 70, 237-243.
Panswad, T., & Anan, C. (1999b). Impact of high chloride wastewater on an anaerobic/anoxic/aerobic process with and without inoculation of chloride acclimated seeds. Water Research, 33, 1165–1172.
Porntip, C.S., Kaiman, J., Pottier, A., & Wisniewski, C. (2014). Benefits of MBR in seafood wastewater treatment and water reuse: study case in Southern part of Thailand. Desalination, 200, 712-714.
Porwal, H. J., Mane, A. V., & Velhal, S. G. (2015). Biodegradation of dairy effluent by using microbial isolates obtained from activated sludge. Water Resources and Industry, 9, 1-1.
Univers
ity of
Mala
ya
114
Pramanic, B.K., Fatihah, S., Sharom, Z., & Ahmed, E. (2012). Biological aerated filter (BAFs) for carbon and nitrogen removal. A review. Journal of Engineering Science and Technology, 7, 428-446.
Qasim, W., & Mane, A.V. (2013). Characterization and treatment of selected food industrial effluents by coagulation and adsorption techniques. Water Resources and Industry, 4, 1-12.
Radojevic, M., & Bashkin, V. N. (1999). Practical environmental analysis. Cambridge: The Royal Society of Chemistry.
Rene, E. R., Kim, S. J., & Park, H. S. (2008). Effect of COD/N ratio and salinity on the performance of sequencing batch reactors. Bioresource Technology, 99, 839–846.
Riddle, M. J., & Shikaze, K. (1973). Characterization and treatment of fish processing plant effluents in Canada. Proceedings of the 4th National Symposium on Food Processing Wastes (pp. 400). Washington, DC: National Environmental Research Center.
Rittmann, B. E., & McCarty, P. L. (2001). Environmental biotechnology: Principles and applications. New York, USA: McGraw-Hill.
Rosso, D., Lothman, S. E., Jeung, M. K., Pitt, P., Gellner, W.J., Stone, A. L., & Howard, D. (2011). Oxygen transfer and uptake, nutrient removal, and energy footprint of parallel full-scale IFAS and activated sludge processes. Water Research, 45(18), 5987 – 5996.
Ruiz, G., Jeison D., & Chamy, R. (2006). Development of denitrifying and methanogenic activities in USB reactors for the treatment of wastewater: Effect of COD/N ratio. Process Biochemistry, 41, 1338–1342.
Ruttanagosrigit, W., & Boyd, C. E. J. (1989). Measurement of Chemical Oxygen Demand in Waters of High Chloride Concentration. World Aquaculture Society, 20 (3), 170-172.
Sagar, T. S., & Pratap. V. N. (2012). Physicochemical analysis of effluent discharge of fish processing Industries in Ratnagiri India. Bioscience Discovery, 3(1),107-111.
Sandberg, M., & Ahring, B. K. (1992). Anaerobic treatment of fish meal process wastewater in a UASB reactor at high pH. Applied Microbiology and Biotechnology, 36, 800-804.
Univers
ity of
Mala
ya

115
Sharrer, M. J., Tal, Y., Ferrier, D., Hankins, J. A., & Summerfelt, S.T. (2007). Membrane biological reactor treatment of a saline backwash flow from a recirculating aquaculture system. Aquacultural Engineering, 36, 159-176.
Sherly, T. M. V., Harindranathan, N., & Bright, S. I. S. (2015). Physicochemical analysis of seafood processing effluents in Aroor Gramapanchayath, Kerala. IOSR Journal of Environmental Science, Toxicology and Food Technology, 9, 38-44.
Sirianuntapiboon & Nimnu. (1999). Management of water consumption and wastewater of seafood processing industries in Thailand. Suranaree Journal of Science and Technology, 6(3), 158-167.
Stone, E. F., Barnett, H.J., Hunter, P.J., Roberts G.C., & Nelson, R.W. (1981). Processing wastewater from two mechanized salmon canneries. Marine Fisheries Review, 43, 1.
Sunny, N., & Mathai, L. (2013). Physicochemical process for fish processing wastewater. International Journal of Innovative Research in Science, Engineering and Technology, 2(4), 901-905.
Susquehanna River Basin Commission. (1991). Loads and yields of nutrients and suspended sediment transported in the Susquehanna river basin. pp. 141-143.
Suzuki, T. (1981). Fish and krill protein: Processing technology. London, UK: Applied Science.
Tay, J. H., Show, K.Y., & Hung, Y.T. (2004). Seafood processing wastewater treatment. In L. Wang, Y.T. Hung, H. Lo, & C. Yapijakis (Eds.), Handbook of industrial and hazardous wastes treatment (2nd ed., pp.694-737). New York: Marcel Dekker Inc.
Tay, J. H., Show, K. Y., & Hung, Y. T. (2006). Seafood processing wastewater treatment. In L. K. Wang, Y. T., Hung, H. H. Lo, & C. Yapijakis (Eds.), Waste treatment in the food processing industry (pp. 29-66). Boca Raton, FL, USA: RC Press Taylor & Francis Group.
Terayut, B., & Choniatee, C. (2007). The utilization of fish meal effluents for the cultivation of Chlorella sp. Proceedings of the 33rd Congress on Science and Technology of Thailand.
USEPA. (2010). Report to Congress: Study of discharges incidental to normal operation of commercial fishing vessels and other non-recreational vessels less
than 79 feet (Report No. 833-R-10-005). Washington, DC: Office of Water, United States Environmental Protection Agency (EPA).
Univers
ity of
Mala
ya

116
UNEP. (1999). Industrial sector guide. Cleaner production assessment in fish processing industry. Paris, France: Danish Environmental Protection Agency in Co-operation with COWI Consulting Engineering and Planners AS.
U.S. Environmental Protection Agency. (1993). Nitrogen Control. Lancaster, U.S.: Technomic Publishing Company, PA.
Uygur, A., & Kargi, F. (2004). Salt inhibition on biological nutrient removal from saline wastewater in a sequencing batch reactor. Enzyme and Microbial Technology, 34, 313–318.
Vymazal, J. (2014). Constructed wetlands for treatment of industrial wastewaters: a review. Ecological Engineering, 73, 724-751.
Vanerkar, A. P., Sanjeev, S., & Shanta, S. (2013). Treatment of food processing industry wastewater by a coagulation/flocculation process. International Journal of Chemical and Physical Sciences, 2, 63-72.
Vallero, M. V. G., Hulshoff Pol, L. W., Lettinga, G., Lens, P. N. L. (2003). Effect of NaCl on thermophilic (55 PoPC) methanol degradation in sulfate reducing granular sludge reactors. Water Research, 37, 2269–2280.
Water Pollution Control Federation. (1994). Wastewater. U.S. Washington DC: WPCF.
Wayne, B. (1997). The science of chemical oxygen demand (Technical Information Series, Booklet No. 9). USA: Hach Company.
Witmayer, G., Froula, D., and Shell, G. (1985). Effect of salinity on a rendering-meat packing hide curing wastewater activated sludge process. Proceedings of the 40th Industrial Waste Conference Purdue University, West Lafayertte, Indiana
(pp. 79-86). West Lafayertte, Indiana: Purdue University.
WHO. (2006). WHO guidelines for the safe use of wastewater, excreta and greywater excreta and greywater use in Agriculture (2nd ed.). Geneva, Switzerland: World Health Organization (WHO).
WMO. (1988). Manual on water quality monitoring: Planning and implementation of sampling and field testing. Geneva: Operational Hydrology Report No. 27, World Meteorological Organization.
Woolard, C. R., & Irvine R. L. (1995a). Response of a periodically operated halophilic biofilm reactor to changes in salt content. Water Science & Technology, 31(1), 41-50.
Univers
ity of
Mala
ya

117
Woolard, C. R., & Irvine, R. L. (1995b). Treatment of hypersaline wastewater in the sequencing batch reactor. Water Research, 29, 1159–1168.
Yogalakshmi, K. N., & Joseph, K. (2010). Effect of transient sodium chloride shock loads on the performance of submerged membrane bioreactor. Bioresource Technology, 101, 7054–7061.
Zeinaddine, H.R., Ebrahimi, A., Alipour, V., & Rezaei, L. (2013). Removal of nitrogen and phosphorous from wastewater of seafood market by intermittent cycle extended aeration system (ICEAS). Journal of Health Sciences and Surveillance System, 1(2), 89-93.
Zhao,W.,Wang, Y., Liu, S., Pan, M.; Yang, J., & Chen, S. (2013). Denitrification activities and NR2RO production under salt stress with varying COD/N ratios and terminal electron acceptors. Chemical Engineering Journal, 215–216, 252–260.
Zhu, G. F., Li, Z., Wu, P., Jin, H. Z., and Wang, Z. (2008). The performance and phase separated characteristics of an anaerobic baffled reactor treating soybean protein processing wastewater. Bioresource Technology, 99, 8027–8033.
Ziminska, H. (1985). Protein recovery from fish wastewaters. Proceedings of the Fifth International Symposium on Agricultural Wastes (pp. 379-388). St. Joseph, MI., USA: American Society of Agricultural Engineering.
Univers
ity of
Mala
ya

118
LIST OF PUBLICATIONS AND PAPERS PRESENTED
ISI Paper publication: Ching, Y. C. & Redzwan, G. (2017). Biological Treatment of Fish Processing Saline Wastewater for Reuse as Liquid Fertilizer. Sustainability, 9(7), 1062. Paper presented at conference: Title: Biomass Growth and Substrate Removal in Fish Processing Saline Wastewater by Aerobic Biodegradation Ching Yun Chen and Ghufran Redzwan Proceedings of the 2015 International Conference on Clean Water, Air & Soil (CleanWAS), Armada Hotel, Petaling Jaya, Malaysia. 28-30 August 2015. Published conference paper: Ching Y. C. & Redzwan, G. (2017). Biomass Growth and Substrate Removal in Fish Processing Saline Wastewater by Aerobic Biodegradation. In M. A. Ashraf & W. S. Aqma (Eds.), Environmental Conservation, Clean Water, Air & Soil (CleanWAS) International Conference Proceedings, China. (pp.102-105). China: IWA publishing.
Univers
ity of
Mala
ya

119
APPENDIX A
Fish Processing Wastewater Treatment Operation in Lab
Appendix A-1 Operation of fish processing wastewater treatment in two identical laboratory scale reactor.
Appendix A-2 The reactor was operated continuously with agitation speed set at 250 rpm and have supplied with air aeration using aquarium air pump. Temperature of the reactor was set at 30oC for operation.
Univers
ity of
Mala
ya

120
Appendix A-3 Aerobic biodegradation of fish processing wastewater were examined in a 2 liter reactor with 1800 mL working volume. (wastewater treatment in day-1 operation).
Appendix A-4 Measure pH value of treated fish processing effluent using Mettler Toledo Delta 320 pH meter.
Univers
ity of
Mala
ya

121
APPENDIX B
Analysis Methods for Wastewater Parameter of
pH, TS, TSS, TDS, VSS, BOD5, and COD
Appendix B-1 : pH Meter Calibration and Measurement Procedure:
1. Take out the pH ATC electrode probe from the 3 mol/L KCL (Potassium Chloride) storage solution.
2. Rinse pH electrode with distilled water.
3. Start a two-point calibration by put the electrode in pH 7 buffer solution, press Cal, the display shows Cal 1, 7.00 pH, 25.0
oC, ATC.
4. Rinse electrode with distilled water; put the electrode in pH 4 buffer solution,
press Cal, the display shows Cal 2, 4.01 pH, 98 % slope, ATC, press Read,
4.01pH, 25.0oC, ATC.
5. Rinse pH electrode with distilled water.
6. Measure distilled water sample, record the pH value and temperature.
7. Measure wastewater sample, record the pH value and temperature.
Univers
ity of
Mala
ya

122
Appendix B-2 : TS Measurement Procedure
1. Clean evaporating (porcelain) dish with distilled water and heat in oven at 105oC for 1 hour.
2. Take out the porcelain dish from oven, store in desiccators and weigh immediately before use using analytical balance.
3. Measure accurately a volume of well mixed sample using cylinder.
4. Pour the measured sample into the pre-weighed evaporating porcelain dish.
5. Put in a preheated drying oven set at 105oC, evaporate to dryness overnight one
or two days.
6. Take the dish out of the oven and cool in a desiccators.
7. Weigh the dish with dried residue on an analytical balance (4 decimal points).
8. Calculate the Total Solids using Equation (3.2): TS (mg/L) = {Weight of the dish + dried residue (mg)} – Weight of the dish (mg)
Sample Volume (mL)
X 1000 (3.2)
Weight of the residue in mg (to convert W (g) to (mg), multiply w (g) with 1000)
Multiply the weight of the dry solids (in mg) by 1,000 mL/L to convert the sample size
from mL to L.
Univers
ity of
Mala
ya

123
Appendix B-3: TSS Measurement Procedure
1. Wash GFC filter paper in filter holder under suction with successive small volumes of laboratory water. 2. Remove filter paper from assembly, place in a petri dish that have cover with
aluminium foil and dry in oven at 105oC for 1 hour. Cool in desiccators and weigh.
3. Put the dried filter paper in the filtration assembly, and pour the prepared well-
mixed sample (100 - 500 mL) into the filter holder on vacuum pump for filter the sample.
4. Remove the filter; put the filter paper with nonfilterable residue in a petri dish
that has covered with aluminium foil. Dry in oven at 105oC for 1 hour or overnight. Cool in desiccator and weigh until constant weight is obtained (+/- 0.5 mg).
5. Calculate the TSS using Equation (3.3) as follow:
TSS (mg/L) = (A – B)/C x 1000 (3.3)
Where A = Mass of nonfilterable residue on Whatman GF/C filter after evaporation at 105oC (mg) B = Mass of the filter paper prior to sample filtration (mg)
C = volume of the sample used for filtration (mL)
Univers
ity of
Mala
ya

124
Appendix B-4: TDS Measurement Procedure
1. Dry the GFC filter paper and a porcelain dish that will be using for filtration in an oven at temperature of 180oC for 1 hour.
2. Cool down the filter paper and the porcelain dish in a desiccators after take out from oven.
3. Weigh the tare mass of the filter paper and the porcelain.
4. Filter the wastewater sample (100 – 500 mL) by using the weighed filter paper and vaccum filtration set on vacuum pump for filter the sample.
5. After the filtration process is completed, take the vacuum filter flask with filtrate (filterable) and pour it into the pre-weighed evaporating porcelain dish and dry at 180oC in oven for at least 1 hour or overnight.
6. Take the porcelain dish with filtrate from oven and cool down in desiccators.
7. Weigh the mass of porcelain with filtrate by using electronic weighing balance after take out from desiccators.
8. Calculate the TDS using Equation (3.4):
TDS (mg/L) = (A – B)/C x 1000 (3.4)
Where A = Mass of dried porcelain plus filtrate after evaporation at 180oC (mg) B = Weight of the porcelain dish (mg)
C = volume of the sample used for filtration (mL)
Univers
ity of
Mala
ya

125
Appendix B-5: VSS Measurement Procedure
1. Dry the filter paper and a beaker that will be using for filtration in an oven at temperature 105oC overnight.
2. Cool down the filter paper and the beaker in desiccators after take out from oven.
3. Weigh the tare mass of the filter paper.
4. Filter wastewater sample (according to the sample size required, 100 – 500 mL) by using the weighed filter paper, vaccum filtration set, a vacuum pump, and the beaker.
5. After the filtration process is completed, carefully take out the filter paper that have nonfilterable residue on it from vacuum pump.
6. Dry the filter paper with nonfilterable residue in an oven at temperature of 105oC overnight.
7. After overnight, take the filter paper with nonfilterable residue from the oven and cool down in a desiccators.
8. Weigh the mass of filter paper plus nonfilterable residue by using electronic weighing balance after take out from desiccators.
9. Have the muffle furnace up to temperature before inserting the sample (usually, 15 to 20 min ignition are required).
10. Ignite the filter paper with nonfilterable residue produced to constants weight in a muffle furnace at temperature of 550 +/- 50oC for at least one hour.
11. Allow the filter paper with nonfilterable residue to cool partially in air until most of the heat has been dissipated and transfer to desiccators for final cooling in a dry atmosphere.
12. Weigh the filter paper with nonfilterable residue as soon as it has cooled completely.
13. Report the loss of weight on ignition as total volatile suspended residue and the weighed residue as total fixed residue.
14. Calculate the VSS using Equation 3.5 as below:
VSS (mg/L) = (A – B)/C x 1000 (3.5)
Where A = Mass of nonfilterable residue on Whatman GF/C filter after evaporation at 550oC (mg)
B = Mass of nonfilterable residue on Whatman GF/C filter after ignition at 150oC (mg)
C = Sample size that have used (mL) for filtration.
Univers
ity of
Mala
ya

126
Appendix B-6: Operation of Hach BOD Trak™ Apparatus, 115/230 Vac, 50/60 Hz.
A measured sample of wastewater is placed in one of the amber bottles on the
apparatus and the bottle is connected to the instrument. Above the water sample is a
quantity of air, which contains 21 percent oxygen. Over a period of time, bacteria in the
wastewater consume dissolved oxygen to oxidize organic matter present in the sample.
The air in the closed sample bottle replenishes the used oxygen, resulting in a drop in air
pressure in the sample bottle. The BOD Trak Apparatus measures the drop in pressure
and displays results directly as mg/L BOD. During the test period (usually five days) the
sample is continually agitated by a magnetic stirring bar. Carbon dioxide is produced by
the oxidation of organic matter and must be removed from the system so that the
pressure difference observed is proportional only to the amount of oxygen used. This is
accomplished by the addition of a few crystals of lithium hydroxide in the seal cup of
each sample bottle. The electromagnetic stirring mechanism provides adequate agitation
to effectively maintain rapid transfer of oxygen from the liquid sample to the air above.
The BOD Trak Apparatus is free of leaks and has an effective carbon dioxide absorption
system. The instrument also has accurate pressure sensors for reading pressure changes.
The BOD Trak Apparatus is a practical, convenient and economical answer to BOD
testing.
Univers
ity of
Mala
ya

127
Appendix B-7: COD Measurement Procedure
i. For blank – pipette 2 mL distilled water into a Hach COD Digestion Reagent Vial (High Range or High Range Plus). Prepare 3 sample tubes, each fill with 2 mL sample for triplicate study.
ii. For standard solution – pipette 2 mL 500 mg/L COD standard solution into a
Hach COD Digestion Reagent Vial (High Range), or pipette 0.2 mL 10,000 mg/L COD standard solution into a Hach COD Digestion Reagent Vial (High Range Plus). Prepare 3 sample tubes, each fill with 2 mL sample for triplicate study.
Preparation of COD standard solution, for control and accuracy check
1. Prepare 500 mg/L standard solution for check the accuracy of the 0 to 1500 mg/L range. Prepare a 500 mg/L Phthalic acid solution by dissolving 0.425 g of dried (120oC, overnight) potassium acid phthalate (KHP) in some distilled water, pour the dissolved KHP solution into a 1000 mL volumetric flask, add distilled water into the volumetric flask until the solution level. Close the cap of volumetric flask and shake it evenly. Ready for use.
2. Prepare 10,000 mg/L standard solution for check the accuracy of the 0 to 15000 mg/L range. Prepare a 10,000 mg/L Phthalic acid solution by dissolving 8.500 g of dried (120oC, overnight) potassium acid phthalate (KHP) in some distilled water, pour the dissolved KHP solution into a 1000 mL volumetric flask, add distilled water into the volumetric flask until the solution level. Close the cap of volumetric flask and shake it evenly. Ready for use.
3. For sample measurement – pipette 2 mL wastewater sample (diluted wastewater sample) into a Hach COD Digestion Reagent Vial (High Range), or 0.2 mL wastewater sample (diluted wastewater sample) into a Hach COD Digestion Reagent Vial (High Range Plus). Prepare 3 sample tubes, each fill with 2 mL sample for triplicate study.
4. Closed the prepared sample digestion reagent vial with the vial screw cap tightly.
Mix the contents in the vial by shaking and invert the vial several times.
5. Placed the prepared vial into the reactor block, set at 150oC, refluxed for 2 hours.
6. Cooled to room temperature. (if titration will not be done immediately, keep the digested sample vial in dark condition).
7. Add 1 or 2 drops ferroin indicator solution (add the same drops for all the sample
tube) into the digested solution, pour the solution into a shake flask, rinse the sample tube with distilled water, and add the rinsed distilled water into the shake flask.
8. Titrated with Standard Ferrous Ammonium Sulphate (FAS) titrant, 0.01 M.
Univers
ity of
Mala
ya

128
Prepared by dissolve 3.92 g FAS (MW = 392.13) in distilled water, add 20 mL concentrated H2SO4 (Merck Sulfuric Acid 95 - 97%, M = 98.08 g/mol), made up to 1000 mL with distilled water.
9. The end point for titration is a sharp colour change from blue-green to reddish
brown. Calculation using Equation (3.9): mg/L COD = (A – B) X M X 8000 X Dilution factor (3.9) mL sample
where: A = volume of FAS titrant used for blank, mL B = volume of FAS titrant used for sample, mL M = Molarity of FAS solution; 0.01 M was used 8000 = milliequivalent weight of oxygen × 1000 ml/L.
Univers
ity of
Mala
ya

129
APPENDIX C
Analysis Methods for Wastewater Parameter of
BOD5, NH3-N, NO3--N, PO4
3-
Appendix C-1 Analysis method for BOD test - according to the Wastewater and Biosolids Analysis Manual: Oxygen Demand, Biochemical. Dilution Method Test Procedure, pp. 281-296. (1998). (page 1 of 16)
Source: HACH. (1999). Wastewater and Biosolids Analysis Manual: Digestion and Selected Methods for Determining Metals, Minerals, and Other Related
Parameters (1st ed.). U.S.A.: Hach Company.
Univers
ity of
Mala
ya

130
Appendix C-1 Analysis method for BOD test - according to the Wastewater and Biosolids Analysis Manual: Oxygen Demand, Biochemical. Dilution Method Test Procedure, pp. 281-296. (1998). (page 2 of 16)
Univers
ity of
Mala
ya

131
Appendix C-1 Analysis method for BOD test - according to the Wastewater and Biosolids Analysis Manual: Oxygen Demand, Biochemical. Dilution Method Test Procedure, pp. 281-296. (1998). (page 3 of 16)
Univers
ity of
Mala
ya

132
Appendix C-1 Analysis method for BOD test - according to the Wastewater and Biosolids Analysis Manual: Oxygen Demand, Biochemical. Dilution Method Test Procedure, pp. 281-296. (1998). (page 4 of 16)
Univers
ity of
Mala
ya

133
Appendix C-1 Analysis method for BOD test - according to the Wastewater and Biosolids Analysis Manual: Oxygen Demand, Biochemical. Dilution Method Test Procedure, pp. 281-296. (1998). (page 5 of 16)
Univers
ity of
Mala
ya

134
Appendix C-1 Analysis method for BOD test - according to the Wastewater and Biosolids Analysis Manual: Oxygen Demand, Biochemical. Dilution Method Test Procedure, pp. 281-296. (1998). (page 6 of 16)
Univers
ity of
Mala
ya

135
Appendix C-1 Analysis method for BOD test - according to the Wastewater and Biosolids Analysis Manual: Oxygen Demand, Biochemical. Dilution Method Test Procedure, pp. 281-296. (1998). (page 7 of 16)
Univers
ity of
Mala
ya

136
Appendix C-1 Analysis method for BOD test - according to the Wastewater and Biosolids Analysis Manual: Oxygen Demand, Biochemical. Dilution Method Test Procedure, pp. 281-296. (1998). (page 8 of 16)
Univers
ity of
Mala
ya

137
Appendix C-1 Analysis method for BOD test - according to the Wastewater and Biosolids Analysis Manual: Oxygen Demand, Biochemical. Dilution Method Test Procedure, pp. 281-296. (1998). (page 9 of 16)
Univers
ity of
Mala
ya

138
Appendix C-1 Analysis method for BOD test - according to the Wastewater and Biosolids Analysis Manual: Oxygen Demand, Biochemical. Dilution Method Test Procedure, pp. 281-296. (1998). (page 10 of 16)
Univers
ity of
Mala
ya

139
Appendix C-1 Analysis method for BOD test - according to the Wastewater and Biosolids Analysis Manual: Oxygen Demand, Biochemical. Dilution Method Test Procedure, pp. 281-296. (1998). (page 11 of 16)
Univers
ity of
Mala
ya

140
Appendix C-1 Analysis method for BOD test - according to the Wastewater and Biosolids Analysis Manual: Oxygen Demand, Biochemical. Dilution Method Test Procedure, pp. 281-296. (1998). (page 12 of 16)
Univers
ity of
Mala
ya
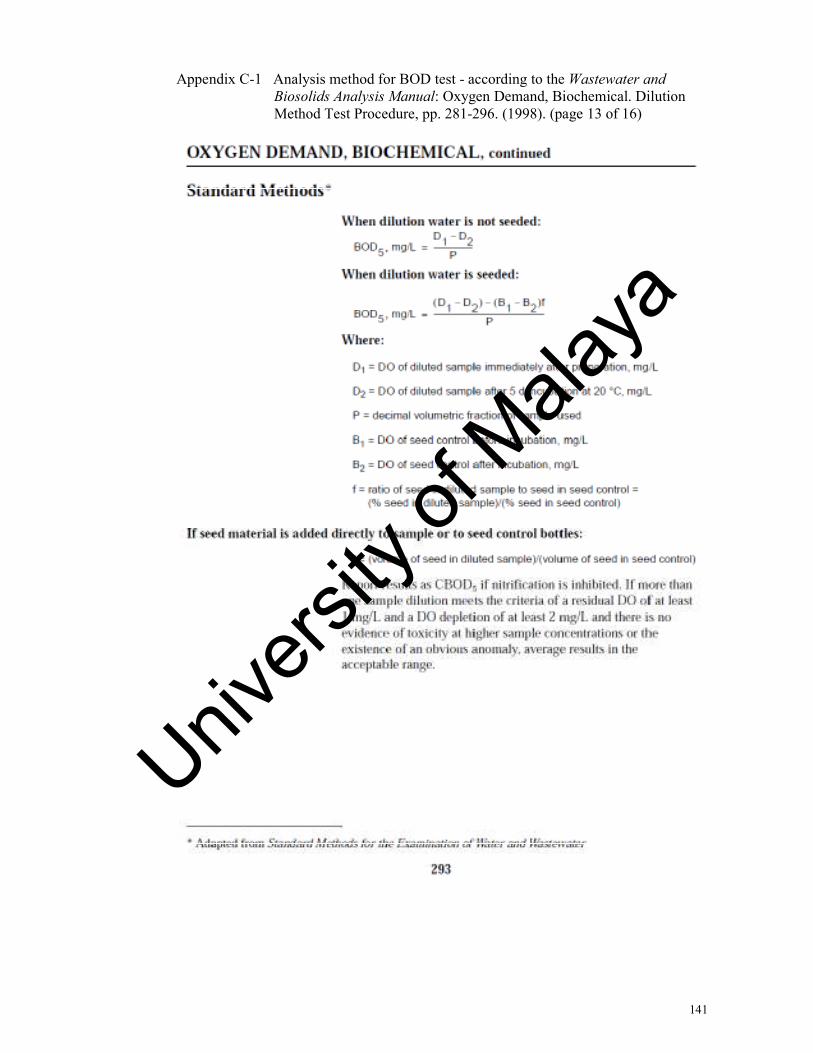
141
Appendix C-1 Analysis method for BOD test - according to the Wastewater and Biosolids Analysis Manual: Oxygen Demand, Biochemical. Dilution Method Test Procedure, pp. 281-296. (1998). (page 13 of 16)
Univers
ity of
Mala
ya

142
Appendix C-1 Analysis method for BOD test - according to the Wastewater and Biosolids Analysis Manual: Oxygen Demand, Biochemical. Dilution Method Test Procedure, pp. 281-296. (1998). (page 14 of 16)
Univers
ity of
Mala
ya
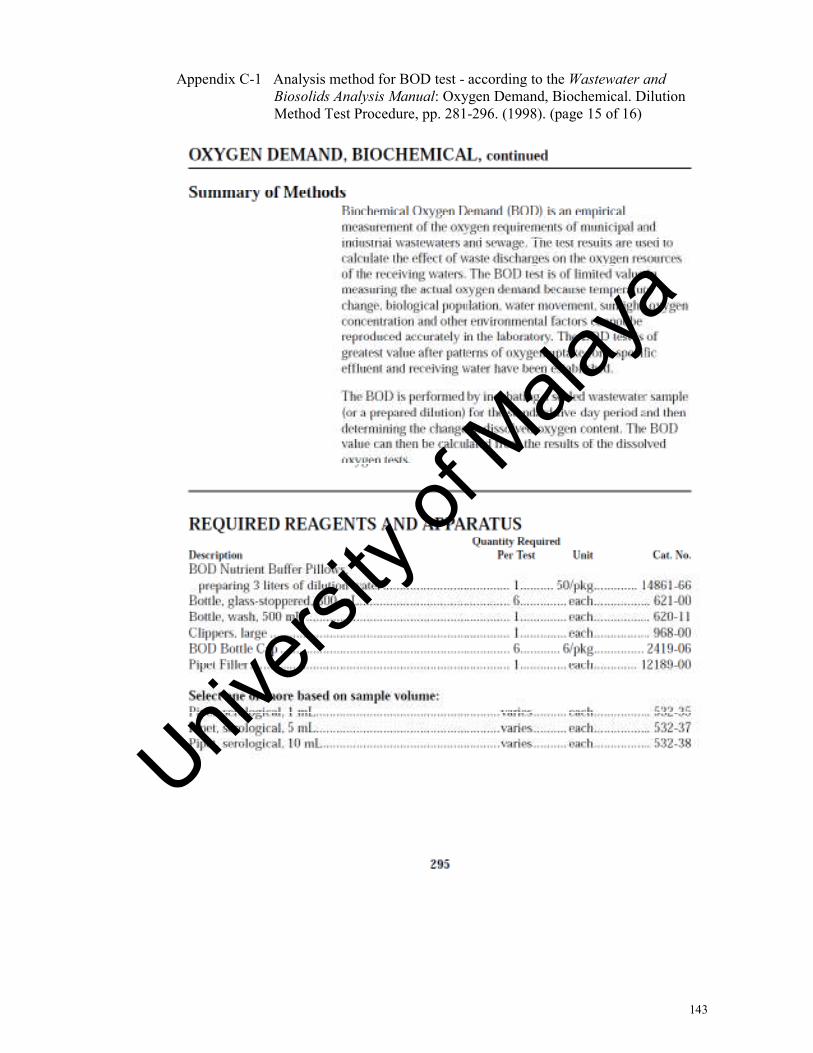
143
Appendix C-1 Analysis method for BOD test - according to the Wastewater and Biosolids Analysis Manual: Oxygen Demand, Biochemical. Dilution Method Test Procedure, pp. 281-296. (1998). (page 15 of 16)
Univers
ity of
Mala
ya

144
Appendix C-1 Analysis method for BOD test - according to the Wastewater and Biosolids Analysis Manual: Oxygen Demand, Biochemical. Dilution Method Test Procedure, pp. 281-296. (1998). (page 16 of 16)
Univers
ity of
Mala
ya

145
Appendix C-2 Analysis method for BOD test - according to the Wastewater and Biosolids Analysis Manual: Oxygen Demand, Biochemical. Respirometric Method (using the BODTrak apparatus) Test Procedure, pp. 297-311. (1998). (page 1 of 15)
Source: HACH. (1999). Wastewater and Biosolids Analysis Manual: Digestion and Selected Methods for Determining Metals, Minerals, and Other Related
Parameters (1st ed.). U.S.A.: Hach Company.
Univers
ity of
Mala
ya

146
Appendix C-2 Analysis method for BOD test - according to the Wastewater and Biosolids Analysis Manual: Oxygen Demand, Biochemical. Respirometric Method (using the BODTrak apparatus) Test Procedure, pp. 297-311. (1998). (page 2 of 15)
Univers
ity of
Mala
ya

147
Appendix C-2 Analysis method for BOD test - according to the Wastewater and Biosolids Analysis Manual: Oxygen Demand, Biochemical. Respirometric Method (using the BODTrak apparatus) Test Procedure, pp. 297-311. (1998). (page 3 of 15)
Univers
ity of
Mala
ya

148
Appendix C-2 Analysis method for BOD test - according to the Wastewater and Biosolids Analysis Manual: Oxygen Demand, Biochemical. Respirometric Method (using the BODTrak apparatus) Test Procedure, pp. 297-311. (1998). (page 4 of 15)
Univers
ity of
Mala
ya

149
Appendix C-2 Analysis method for BOD test - according to the Wastewater and Biosolids Analysis Manual: Oxygen Demand, Biochemical. Respirometric Method (using the BODTrak apparatus) Test Procedure, pp. 297-311. (1998). (page 5 of 15)
Univers
ity of
Mala
ya

150
Appendix C-2 Analysis method for BOD test - according to the Wastewater and Biosolids Analysis Manual: Oxygen Demand, Biochemical. Respirometric Method (using the BODTrak apparatus) Test Procedure, pp. 297-311. (1998). (page 6 of 15)
Univers
ity of
Mala
ya
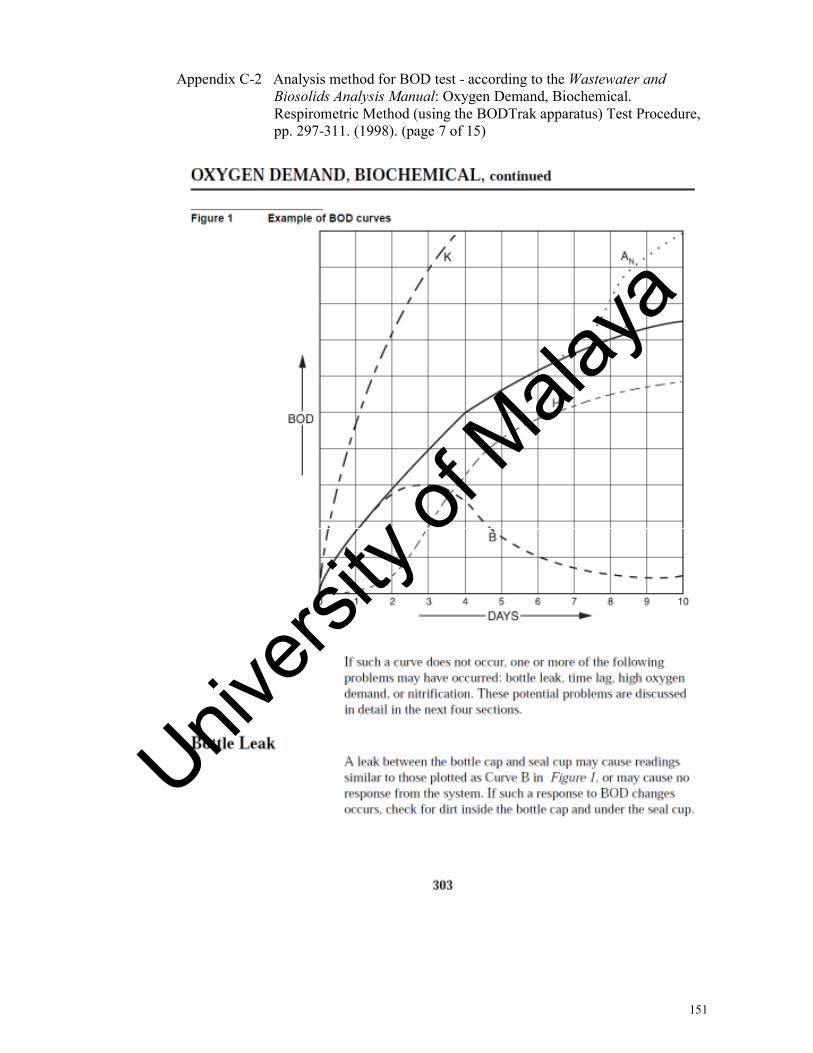
151
Appendix C-2 Analysis method for BOD test - according to the Wastewater and Biosolids Analysis Manual: Oxygen Demand, Biochemical. Respirometric Method (using the BODTrak apparatus) Test Procedure, pp. 297-311. (1998). (page 7 of 15)
Univers
ity of
Mala
ya

152
Appendix C-2 Analysis method for BOD test - according to the Wastewater and Biosolids Analysis Manual: Oxygen Demand, Biochemical. Respirometric Method (using the BODTrak apparatus) Test Procedure, pp. 297-311. (1998). (page 8 of 15)
Univers
ity of
Mala
ya

153
Appendix C-2 Analysis method for BOD test - according to the Wastewater and Biosolids Analysis Manual: Oxygen Demand, Biochemical. Respirometric Method (using the BODTrak apparatus) Test Procedure, pp. 297-311. (1998). (page 9 of 15)
Univers
ity of
Mala
ya

154
Appendix C-2 Analysis method for BOD test - according to the Wastewater and Biosolids Analysis Manual: Oxygen Demand, Biochemical. Respirometric Method (using the BODTrak apparatus) Test Procedure, pp. 297-311. (1998). (page 10 of 15)
Univers
ity of
Mala
ya

155
Appendix C-2 Analysis method for BOD test - according to the Wastewater and Biosolids Analysis Manual: Oxygen Demand, Biochemical. Respirometric Method (using the BODTrak apparatus) Test Procedure, pp. 297-311. (1998). (page 11 of 15)
Univers
ity of
Mala
ya

156
Appendix C-2 Analysis method for BOD test - according to the Wastewater and Biosolids Analysis Manual: Oxygen Demand, Biochemical. Respirometric Method (using the BODTrak apparatus) Test Procedure, pp. 297-311. (1998). (page 12 of 15)
Univers
ity of
Mala
ya
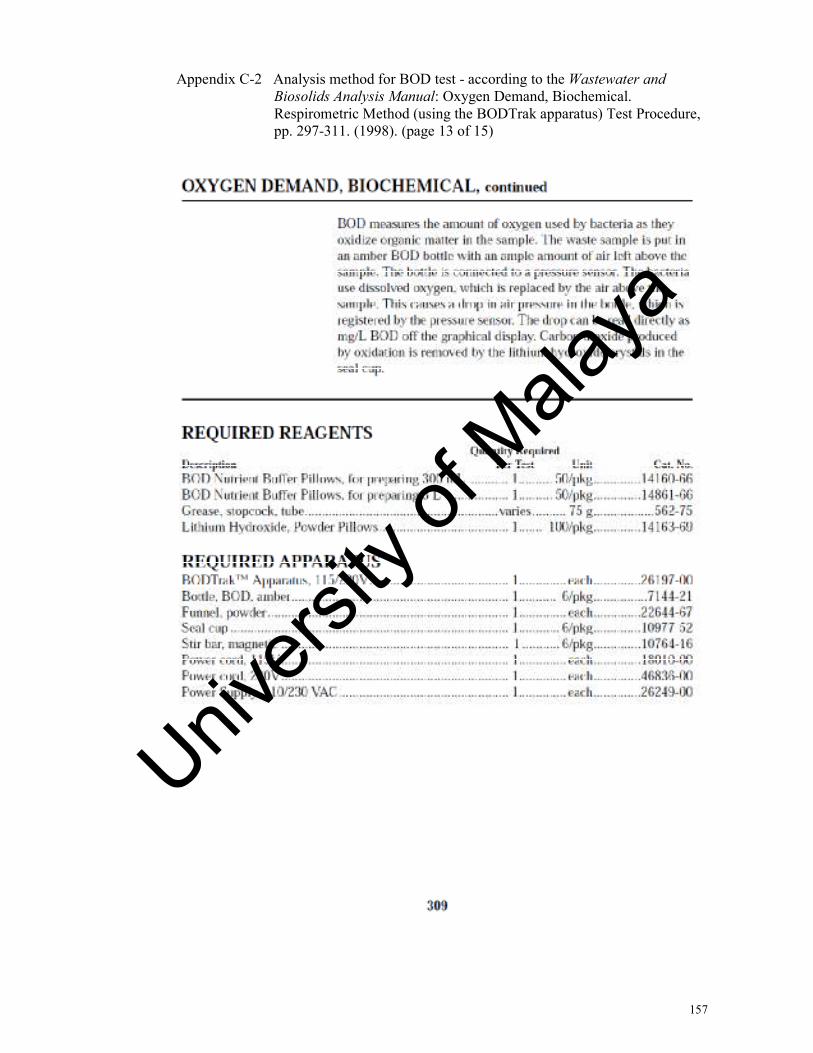
157
Appendix C-2 Analysis method for BOD test - according to the Wastewater and Biosolids Analysis Manual: Oxygen Demand, Biochemical. Respirometric Method (using the BODTrak apparatus) Test Procedure, pp. 297-311. (1998). (page 13 of 15)
Univers
ity of
Mala
ya

158
Appendix C-2 Analysis method for BOD test - according to the Wastewater and Biosolids Analysis Manual: Oxygen Demand, Biochemical. Respirometric Method (using the BODTrak apparatus) Test Procedure, pp. 297-311. (1998). (page 14 of 15)
Univers
ity of
Mala
ya

159
Appendix C-2 Analysis method for BOD test - according to the Wastewater and Biosolids Analysis Manual: Oxygen Demand, Biochemical. Respirometric Method (using the BODTrak apparatus) Test Procedure, pp. 297-311. (1998). (page 15 of 15)
Univers
ity of
Mala
ya

160
Appendix C-3 Analysis method for Nitrogen, Ammonia test - according to the DR/2000 Spectrophotometer Instrument Manual, pp. 343 – 346. (1996). (page 1 of 4) Source: HACH. (1996). DR/2000 Spectrophotometer Instrument Manual (7-21-95 3rd
ed., Rev. 2, 01/96).U.S.A.: Hach Company.
Univers
ity of
Mala
ya

161
Appendix C-3 Analysis method for Nitrogen, Ammonia test - according to the DR/2000 Spectrophotometer Instrument Manual, pp. 343 – 346. (1996). (page 2 of 4)
Univers
ity of
Mala
ya

162
Appendix C-3 Analysis method for Nitrogen, Ammonia test - according to the DR/2000 Spectrophotometer Instrument Manual, pp. 343 – 346. (1996). (page 3 of 4)
Univers
ity of
Mala
ya

163
Appendix C-3 Analysis method for Nitrogen, Ammonia test - according to the DR/2000 Spectrophotometer Instrument Manual, pp. 343 – 346. (1996). (page 4 of 4)
Univers
ity of
Mala
ya

164
Appendix C-4 Analysis method for Nitrate, High Range (HR) test - according to the DR/2000 Spectrophotometer Instrument Manual, pp. 293-301. (1996). (page 1 of 9) Source: HACH. (1996). DR/2000 Spectrophotometer Instrument Manual (7-21-95 3rd
ed., Rev. 2, 01/96).U.S.A.: Hach Company.
Univers
ity of
Mala
ya

165
Appendix C-4 Analysis method for Nitrate, High Range (HR) test - according to the DR/2000 Spectrophotometer Instrument Manual, pp. 293-301. (1996). (page 2 of 9)
Univers
ity of
Mala
ya

166
Appendix C-4 Analysis method for Nitrate, High Range (HR) test - according to the DR/2000 Spectrophotometer Instrument Manual, pp. 293-301. (1996). (page 3 of 9)
Univers
ity of
Mala
ya

167
Appendix C-4 Analysis method for Nitrate, High Range (HR) test - according to the DR/2000 Spectrophotometer Instrument Manual, pp. 293-301. (1996). (page 4 of 9)
Univers
ity of
Mala
ya

168
Appendix C-4 Analysis method for Nitrate, High Range (HR) test - according to the DR/2000 Spectrophotometer Instrument Manual, pp. 293-301. (1996). (page 5 of 9)
Univers
ity of
Mala
ya

169
Appendix C-4 Analysis method for Nitrate, High Range (HR) test - according to the DR/2000 Spectrophotometer Instrument Manual, pp. 293-301. (1996). (page 6 of 9)
Univers
ity of
Mala
ya

170
Appendix C-4 Analysis method for Nitrate, High Range (HR) test - according to the DR/2000 Spectrophotometer Instrument Manual, pp. 293-301. (1996). (page 7 of 9)
Univers
ity of
Mala
ya

171
Appendix C-4 Analysis method for Nitrate, High Range (HR) test - according to the DR/2000 Spectrophotometer Instrument Manual, pp. 293-301. (1996). (page 8 of 9)
Univers
ity of
Mala
ya

172
Appendix C-4 Analysis method for Nitrate, High Range (HR) test - according to the DR/2000 Spectrophotometer Instrument Manual, pp. 293-301. (1996). (page 9 of 9)
Univers
ity of
Mala
ya

173
Appendix C-5: Analysis method for Phosphorus, Reactive test - according to the DR/2000 Spectrophotometer Instrument Manual, pp. 511-522. (1996). (page 1 of 12) Source: HACH. (1996). DR/2000 Spectrophotometer Instrument Manual (7-21-95 3rd
ed., Rev. 2, 01/96).U.S.A.: Hach Company.
Univers
ity of
Mala
ya

174
Appendix C-5: Analysis method for Phosphorus, Reactive test - according to the DR/2000 Spectrophotometer Instrument Manual, pp. 511-522. (1996). (page 2 of 12)
Univers
ity of
Mala
ya

175
Appendix C-5: Analysis method for Phosphorus, Reactive test - according to the DR/2000 Spectrophotometer Instrument Manual, pp. 511-522. (1996). (page 3 of 12)
Univers
ity of
Mala
ya

176
Appendix C-5: Analysis method for Phosphorus, Reactive test - according to the DR/2000 Spectrophotometer Instrument Manual, pp. 511-522. (1996). (page 4 of 12)
Univers
ity of
Mala
ya

177
Appendix C-5: Analysis method for Phosphorus, Reactive test - according to the DR/2000 Spectrophotometer Instrument Manual, pp. 511-522. (1996). (page 5 of 12)
Univers
ity of
Mala
ya

178
Appendix C-5: Analysis method for Phosphorus, Reactive test - according to the DR/2000 Spectrophotometer Instrument Manual, pp. 511-522. (1996). (page 6 of 12)
Univers
ity of
Mala
ya

179
Appendix C-5: Analysis method for Phosphorus, Reactive test - according to the DR/2000 Spectrophotometer Instrument Manual, pp. 511-522. (1996). (page 7 of 12)
Univers
ity of
Mala
ya

180
Appendix C-5: Analysis method for Phosphorus, Reactive test - according to the DR/2000 Spectrophotometer Instrument Manual, pp. 511-522. (1996). (page 8 of 12)
Univers
ity of
Mala
ya

181
Appendix C-5: Analysis method for Phosphorus, Reactive test - according to the DR/2000 Spectrophotometer Instrument Manual, pp. 511-522. (1996). (page 9 of 12)
Univers
ity of
Mala
ya

182
Appendix C-5: Analysis method for Phosphorus, Reactive test - according to the DR/2000 Spectrophotometer Instrument Manual, pp. 511-522. (1996). (page 10 of 12)
Univers
ity of
Mala
ya

183
Appendix C-5: Analysis method for Phosphorus, Reactive test - according to the DR/2000 Spectrophotometer Instrument Manual, pp. 511-522. (1996). (page 11 of 12)
Univers
ity of
Mala
ya

184
Appendix C-5: Analysis method for Phosphorus, Reactive test - according to the DR/2000 Spectrophotometer Instrument Manual, pp. 511-522. (1996). (page 12 of 12)
Univers
ity of
Mala
ya

185
APPENDIX D
Maintenance for Spectrophotometer
Appendix D-1: Maintenance – Cleaning for Spectrophotometer, Sample Cells, and Pour-Thru Sample Cell; Replacement Instructions: Battery Replacement, and Lamp Replacement; Lamp Calibration Adjustment - according to the DR/2000 Spectrophotometer Instrument Manual, pp. 43-44. (1996). (page 1 of 2) Source: HACH. (1996). DR/2000 Spectrophotometer Instrument Manual (7-21- 95 3rded., Rev. 2, 01/96).U.S.A.: Hach Company.
Univers
ity of
Mala
ya

186
Appendix D-1: Maintenance – Cleaning for Spectrophotometer, Sample Cells, and Pour-Thru Sample Cell; Replacement Instructions: Battery Replacement, and Lamp Replacement; Lamp Calibration Adjustment - according to the DR/2000 Spectrophotometer Instrument Manual, pp. 43-44. (1996). (page 2 of 2)
Univers
ity of
Mala
ya