Thesis Outline
98
New Life Thesis — The Birth Guide
-
Upload
stephanie-penland -
Category
Documents
-
view
214 -
download
0
description
What it's all about
Transcript of Thesis Outline

New Life Thesis — The Birth Guide


3
midwives Pregnancy and birth are normal and natural life processes.
wikipedia Birth is the act or process of bearing or bring-ing forth offspring from the uterus. The offspring is brought forth from the mother. The time of human birth is defined as the time at which the fetus comes out of the mother’s womb into the world.
obstetrics The branch of medicine that deals with the care of women during pregnancy, childbirth, and the recuperative period following delivery.
When a woman births without drugs…she learns that she is strong and powerful...She learns to trust herself, even in the face of powerful authority figures. Once she realizes her own strength and power, she will have a different attitude for the rest of her life, about pain, illness, disease, fatigue, and difficult situations. Polly Perez
What is Birth?
4
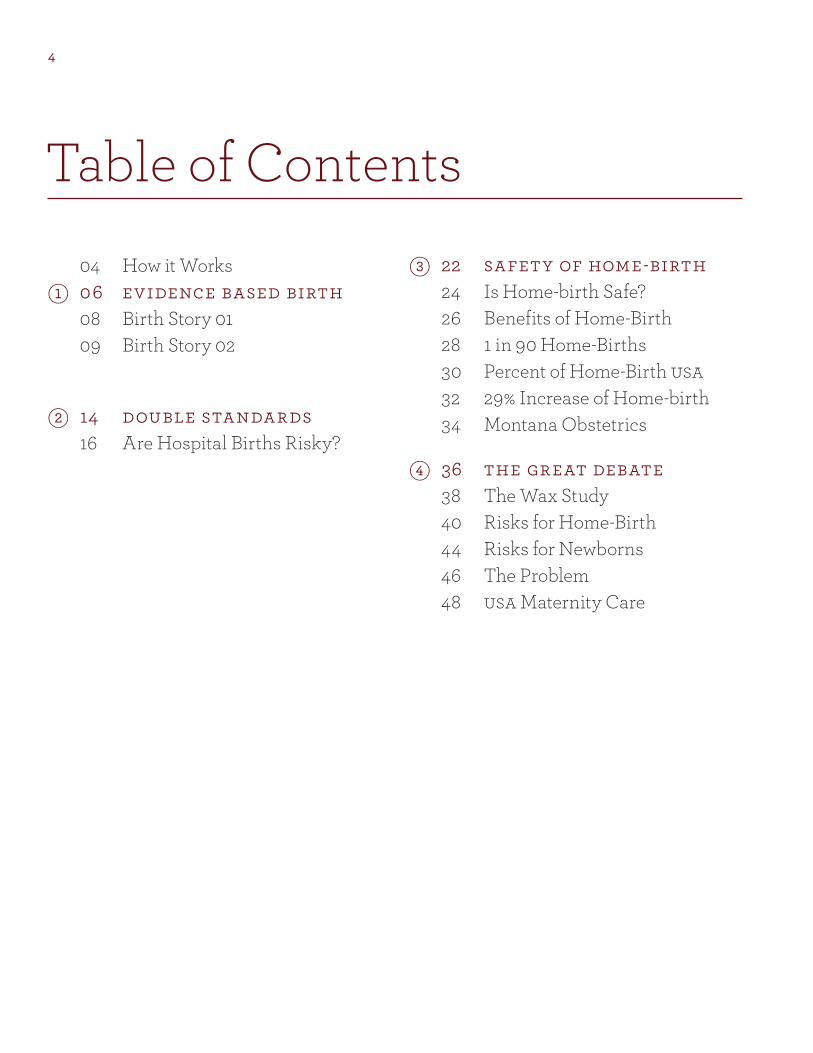
04 How it Works 1 06 evidence based birth 08 Birth Story 01 09 Birth Story 02
2 14 double standards 16 Are Hospital Births Risky?
3 22 safety of home-birth 24 Is Home-birth Safe? 26 Benefits of Home-Birth 28 1 in 90 Home-Births 30 Percent of Home-Birth usa 32 29% Increase of Home-birth 34 Montana Obstetrics
4 36 the great debate 38 The Wax Study 40 Risks for Home-Birth 44 Risks for Newborns 46 The Problem 48 usa Maternity Care
Table of Contents
5
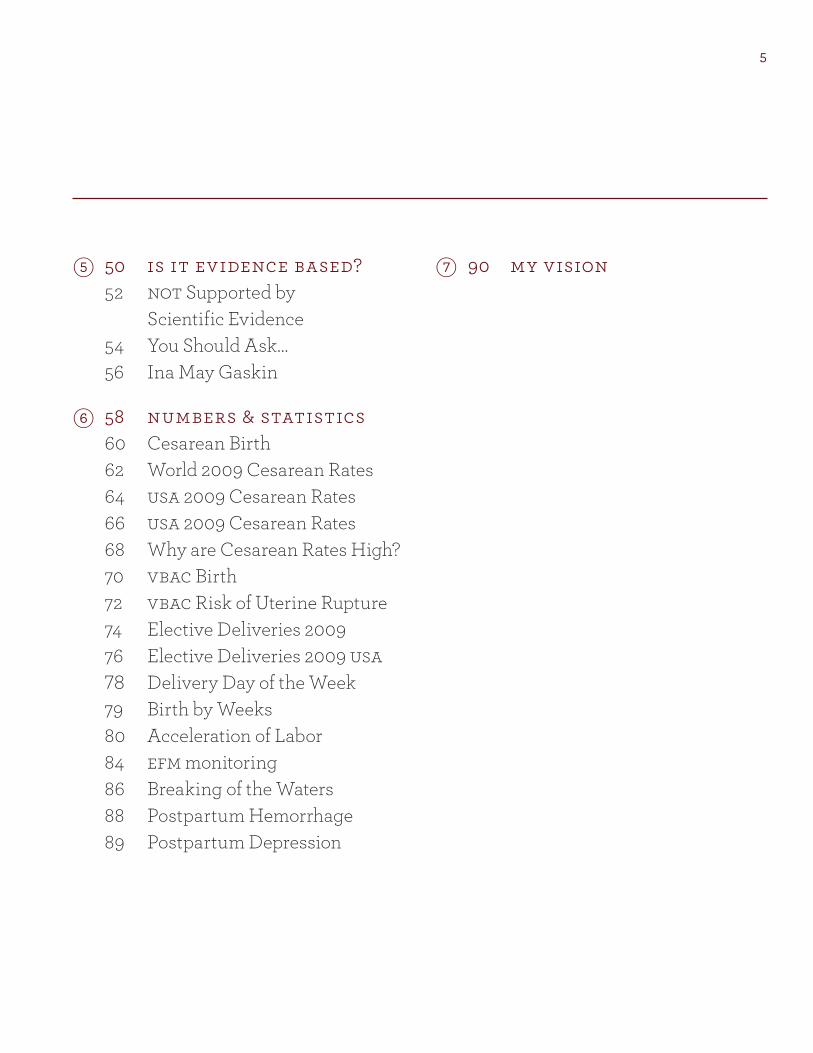
7 90 my visiono 50 is it evidence based? 52 not Supported by Scientific Evidence 54 You Should Ask... 56 Ina May Gaskin
p 58 numbers & statistics 60 Cesarean Birth 62 World 2009 Cesarean Rates 64 usa 2009 Cesarean Rates 66 usa 2009 Cesarean Rates 68 Why are Cesarean Rates High? 70 vbac Birth 72 vbac Risk of Uterine Rupture 74 Elective Deliveries 2009 76 Elective Deliveries 2009 usa 78 Delivery Day of the Week 79 Birth by Weeks 80 Acceleration of Labor 84 efm monitoring 86 Breaking of the Waters 88 Postpartum Hemorrhage 89 Postpartum Depression

6
How it Works01 the box Your box has 6 components to it. This guide will help you navigate the order in which to use all parts.
02 birth story catalog This catalog is an ongoing subscription that gives you personal stories of women who have given birth, both home-birth, hospital, and birth-centers. Every story is different and inspirational.
03 the folders There are four folders which represent the four trimesters of birth. The fourth trimester is the postpartum period after the baby is born. We call this the fourth trimester because it is just as important as the pregnancy if not more so. The first four months of the babies life is now considered part of the fourth trimester. If it wasn't for the way the bodies and heads develop in babies they would probably come out at 14 months instead of ten months. There are note booklets for each section so that you can take notes. Each booklet is designed to be removed and shared with friends, family, doctors or midwives. The booklets can be switched out as new statistics are available for purchase on the website and for the iPad.

7
04 ipad program This program allows you to take along the information in the folders in a digital way. I found it easier to share information or research on my iPad or iPhone while pregnant and during the postpar-tum. The folders are still there for easy reference and the ability to share the information with friends and family and take notes when needed.
05 birth game This game is designed to give the mother to be and her partner a chance to test out different scenarios as to what could happen.
06 workout cards Included a set of work out cards for both during pregnancy and postpartum.
07 website This online site gives you the chance to purchase the product and for you to access the digital information provided by in the folders. You can also purchase updates to the iPad and the folders, and link to helpful sites about birth.

8
1

9
evidence based birth
Your health care is based on up-to-date medical evidence about what works best.
10
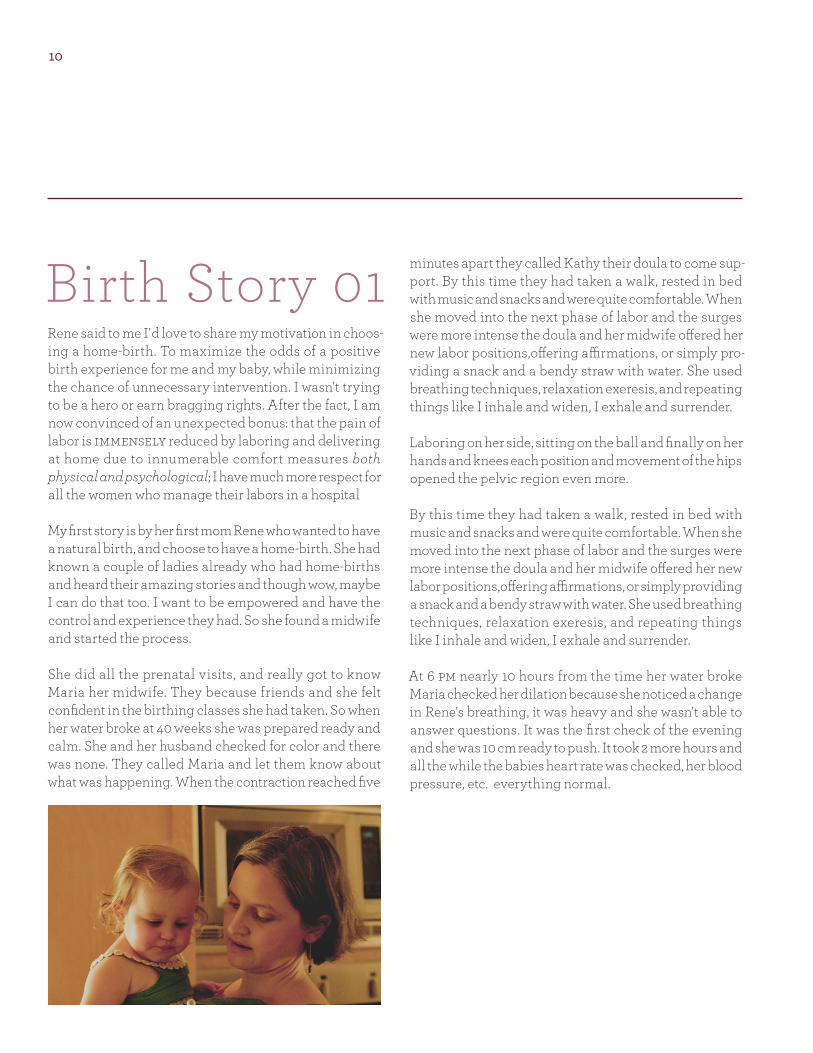
Birth Story 01 Rene said to me I'd love to share my motivation in choos-ing a home-birth. To maximize the odds of a positive birth experience for me and my baby, while minimizing the chance of unnecessary intervention. I wasn't trying to be a hero or earn bragging rights. After the fact, I am now convinced of an unexpected bonus: that the pain of labor is immensely reduced by laboring and delivering at home due to innumerable comfort measures both physical and psychological; I have much more respect for all the women who manage their labors in a hospital
My first story is by her first mom Rene who wanted to have a natural birth, and choose to have a home-birth. She had known a couple of ladies already who had home-births and heard their amazing stories and though wow, maybe I can do that too. I want to be empowered and have the control and experience they had. So she found a midwife and started the process.
She did all the prenatal visits, and really got to know Maria her midwife. They because friends and she felt confident in the birthing classes she had taken. So when her water broke at 40 weeks she was prepared ready and calm. She and her husband checked for color and there was none. They called Maria and let them know about what was happening. When the contraction reached five
minutes apart they called Kathy their doula to come sup-port. By this time they had taken a walk, rested in bed with music and snacks and were quite comfortable. When she moved into the next phase of labor and the surges were more intense the doula and her midwife offered her new labor positions,offering affirmations, or simply pro-viding a snack and a bendy straw with water. She used breathing techniques, relaxation exeresis, and repeating things like I inhale and widen, I exhale and surrender.
Laboring on her side, sitting on the ball and finally on her hands and knees each position and movement of the hips opened the pelvic region even more.
By this time they had taken a walk, rested in bed with music and snacks and were quite comfortable. When she moved into the next phase of labor and the surges were more intense the doula and her midwife offered her new labor positions,offering affirmations, or simply providing a snack and a bendy straw with water. She used breathing techniques, relaxation exeresis, and repeating things like I inhale and widen, I exhale and surrender.
At 6 pm nearly 10 hours from the time her water broke Maria checked her dilation because she noticed a change in Rene's breathing, it was heavy and she wasn't able to answer questions. It was the first check of the evening and she was 10 cm ready to push. It took 2 more hours and all the while the babies heart rate was checked, her blood pressure, etc. everything normal.
11
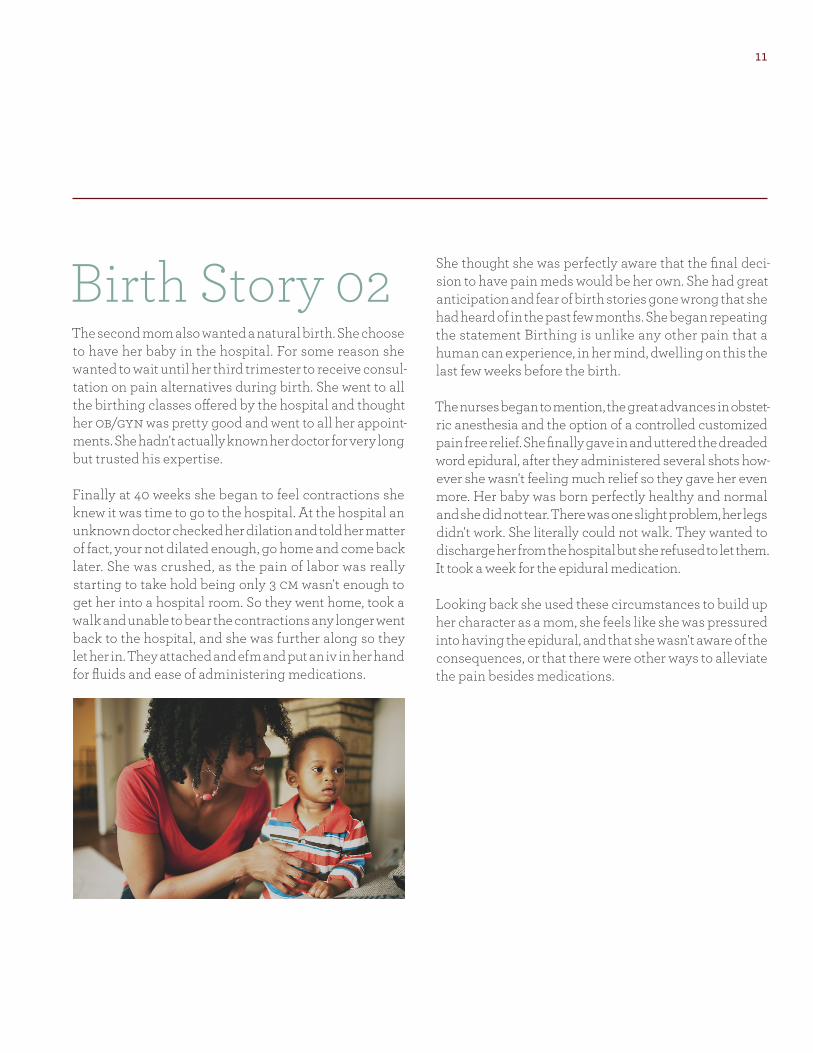
Birth Story 02The second mom also wanted a natural birth. She choose to have her baby in the hospital. For some reason she wanted to wait until her third trimester to receive consul-tation on pain alternatives during birth. She went to all the birthing classes offered by the hospital and thought her ob/gyn was pretty good and went to all her appoint-ments. She hadn't actually known her doctor for very long but trusted his expertise.
Finally at 40 weeks she began to feel contractions she knew it was time to go to the hospital. At the hospital an unknown doctor checked her dilation and told her matter of fact, your not dilated enough, go home and come back later. She was crushed, as the pain of labor was really starting to take hold being only 3 cm wasn't enough to get her into a hospital room. So they went home, took a walk and unable to bear the contractions any longer went back to the hospital, and she was further along so they let her in. They attached and efm and put an iv in her hand for fluids and ease of administering medications.
She thought she was perfectly aware that the final deci-sion to have pain meds would be her own. She had great anticipation and fear of birth stories gone wrong that she had heard of in the past few months. She began repeating the statement Birthing is unlike any other pain that a human can experience, in her mind, dwelling on this the last few weeks before the birth.
The nurses began to mention, the great advances in obstet-ric anesthesia and the option of a controlled customized pain free relief. She finally gave in and uttered the dreaded word epidural, after they administered several shots how-ever she wasn't feeling much relief so they gave her even more. Her baby was born perfectly healthy and normal and she did not tear. There was one slight problem, her legs didn't work. She literally could not walk. They wanted to discharge her from the hospital but she refused to let them. It took a week for the epidural medication.
Looking back she used these circumstances to build up her character as a mom, she feels like she was pressured into having the epidural, and that she wasn't aware of the consequences, or that there were other ways to alleviate the pain besides medications.
12
True Line
Supporting a Woman-Centered Birth relying on Evidence Based Practices for Women During Pregnancy


A women who labors at home and comes into hospital
Fully dilated and pushing is praised.
— She did a great job.
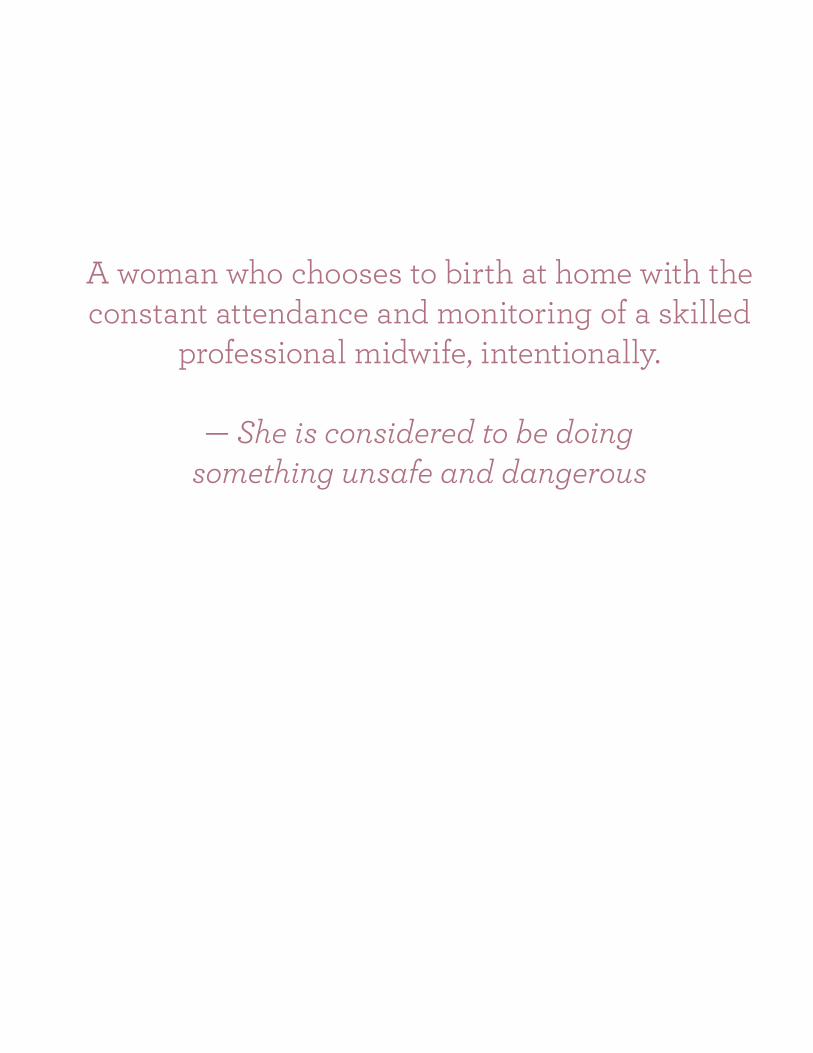
A woman who chooses to birth at home with the constant attendance and monitoring of a skilled
professional midwife, intentionally.
— She is considered to be doing something unsafe and dangerous

16
2
17
double standards
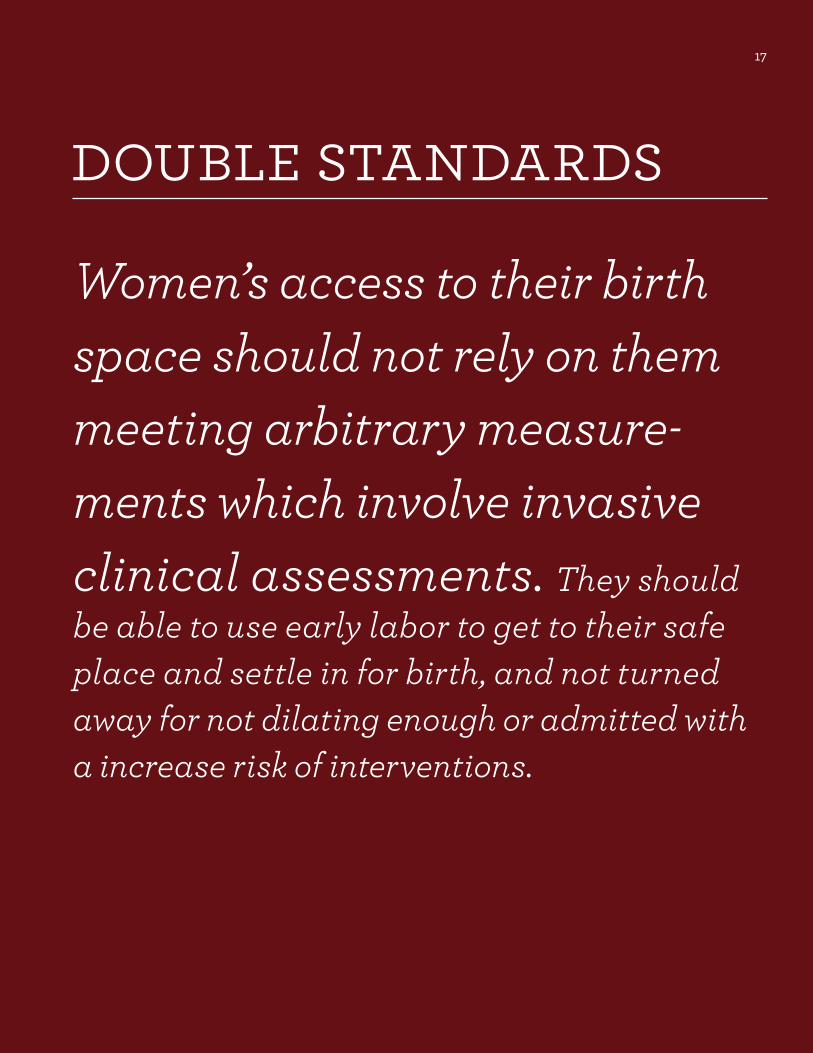
Women’s access to their birth space should not rely on them meeting arbitrary measure-ments which involve invasive clinical assessments. They should be able to use early labor to get to their safe place and settle in for birth, and not turned away for not dilating enough or admitted with a increase risk of interventions.
18
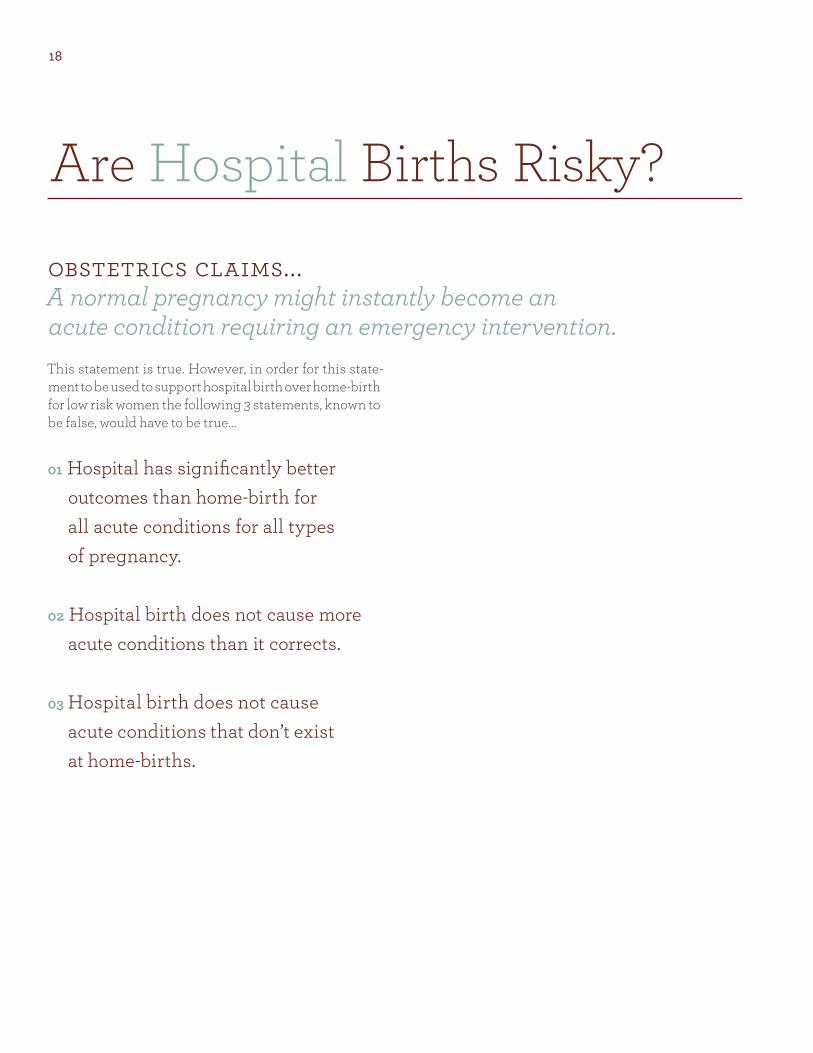
This statement is true. However, in order for this state-ment to be used to support hospital birth over home-birth for low risk women the following 3 statements, known to be false, would have to be true...
01 Hospital has significantly better outcomes than home-birth for all acute conditions for all types of pregnancy.
02 Hospital birth does not cause more acute conditions than it corrects.
03 Hospital birth does not cause acute conditions that don’t exist at home-births.
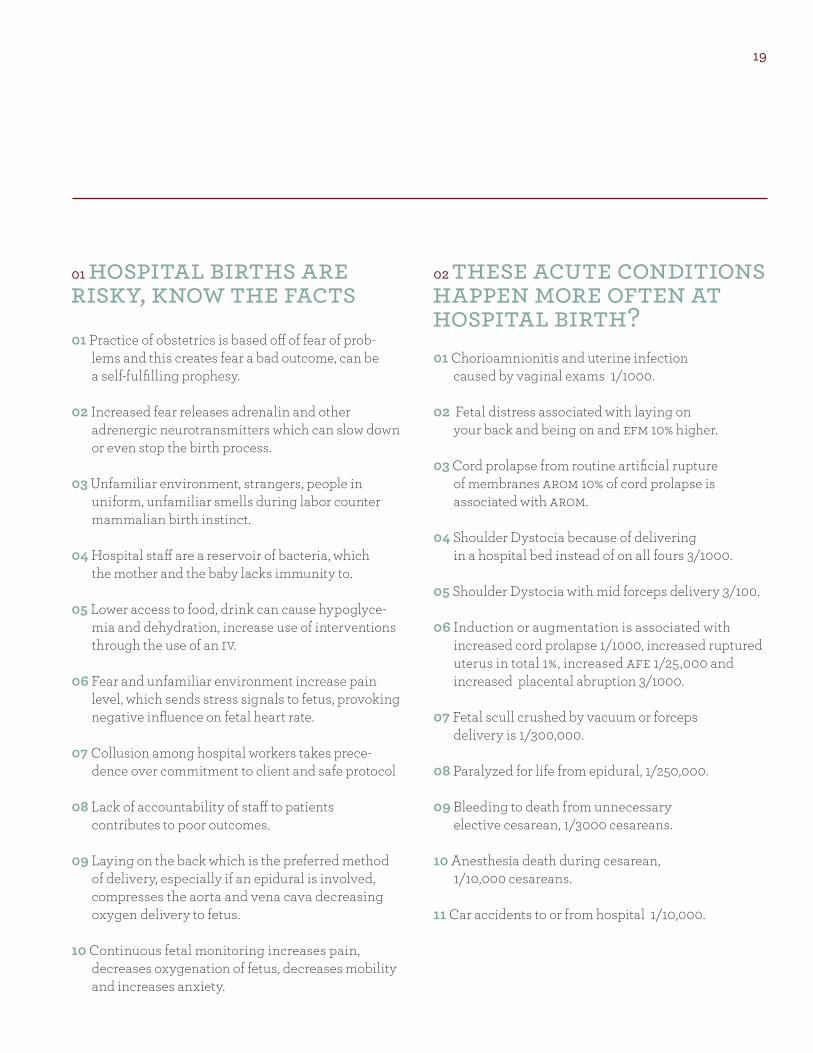
Are Hospital Births Risky?
obstetrics claims... A normal pregnancy might instantly become an acute condition requiring an emergency intervention.
19
01 hospital births are risky, know the facts 01 Practice of obstetrics is based off of fear of prob- lems and this creates fear a bad outcome, can be a self-fulfilling prophesy.
02 Increased fear releases adrenalin and other adrenergic neurotransmitters which can slow down or even stop the birth process.
03 Unfamiliar environment, strangers, people in uniform, unfamiliar smells during labor counter mammalian birth instinct.
04 Hospital staff are a reservoir of bacteria, which the mother and the baby lacks immunity to.
05 Lower access to food, drink can cause hypoglyce- mia and dehydration, increase use of interventions through the use of an iv.
06 Fear and unfamiliar environment increase pain level, which sends stress signals to fetus, provoking negative influence on fetal heart rate.
07 Collusion among hospital workers takes prece- dence over commitment to client and safe protocol
08 Lack of accountability of staff to patients contributes to poor outcomes.
09 Laying on the back which is the preferred method of delivery, especially if an epidural is involved, compresses the aorta and vena cava decreasing oxygen delivery to fetus.
10 Continuous fetal monitoring increases pain, decreases oxygenation of fetus, decreases mobility and increases anxiety.
02 these acute conditions happen more often at hospital birth?01 Chorioamnionitis and uterine infection caused by vaginal exams 1/1000.
02 Fetal distress associated with laying on your back and being on and efm 10% higher.
03 Cord prolapse from routine artificial rupture of membranes arom 10% of cord prolapse is associated with arom.
04 Shoulder Dystocia because of delivering in a hospital bed instead of on all fours 3/1000.
05 Shoulder Dystocia with mid forceps delivery 3/100.
06 Induction or augmentation is associated with increased cord prolapse 1/1000, increased ruptured uterus in total 1%, increased afe 1/25,000 and increased placental abruption 3/1000.
07 Fetal scull crushed by vacuum or forceps delivery is 1/300,000.
08 Paralyzed for life from epidural, 1/250,000.
09 Bleeding to death from unnecessary elective cesarean, 1/3000 cesareans.
10 Anesthesia death during cesarean, 1/10,000 cesareans.
11 Car accidents to or from hospital 1/10,000.


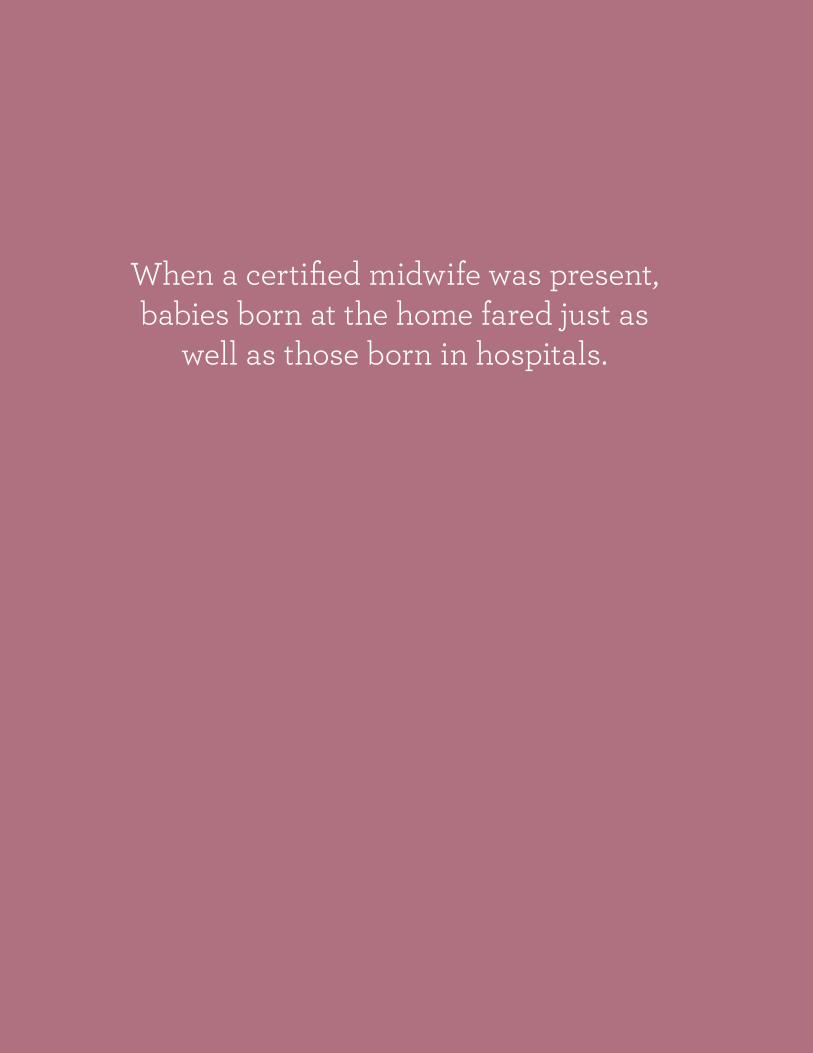
When a certified midwife was present, babies born at the home fared just as
well as those born in hospitals.

If not attended by a certified researchers found that, in general,
babies born at home were more likely to have seizures and low apgar scores.
Dr. Yvonne Cheng, obstetrician and gynecologist at the University of California, San Francisco

24
3
25
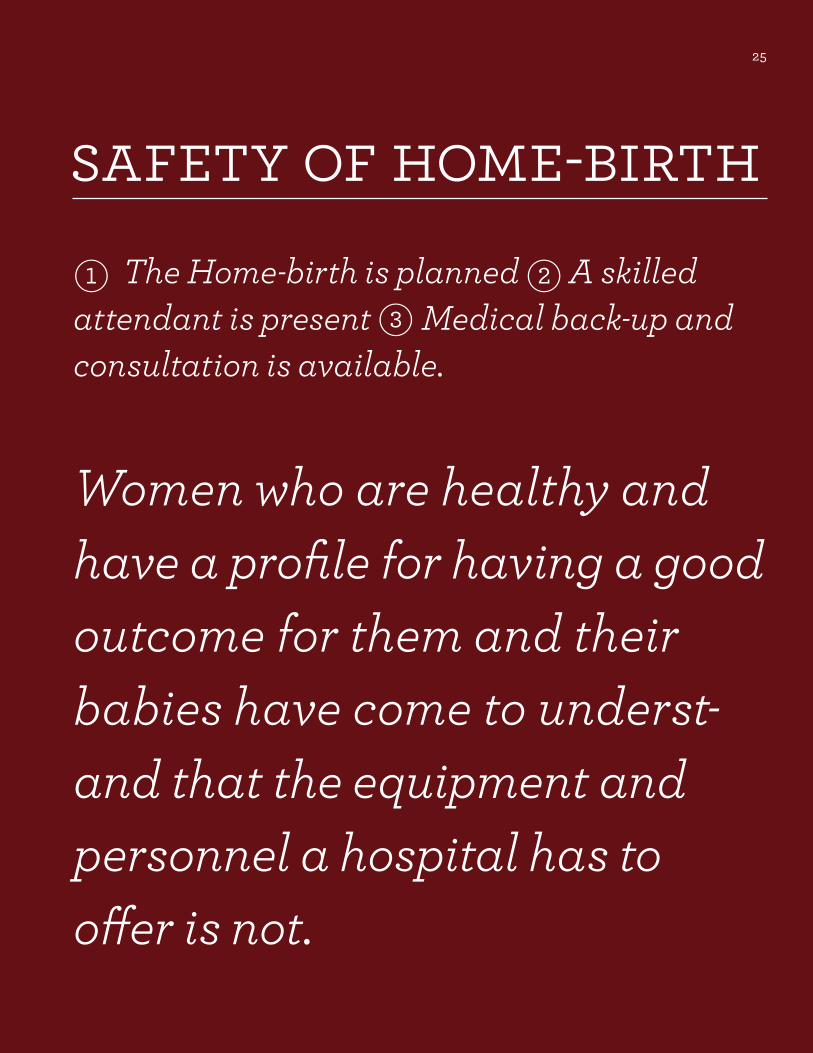
safety of home-birth1 The Home-birth is planned 2 A skilled attendant is present 3 Medical back-up and consultation is available.
Women who are healthy and have a profile for having a good outcome for them and their babies have come to underst-and that the equipment and personnel a hospital has to offer is not.
26
Is Home-birth Safe?
The absolute risk of planned home-births is low. acog 2011, http://www.medscape.com
27
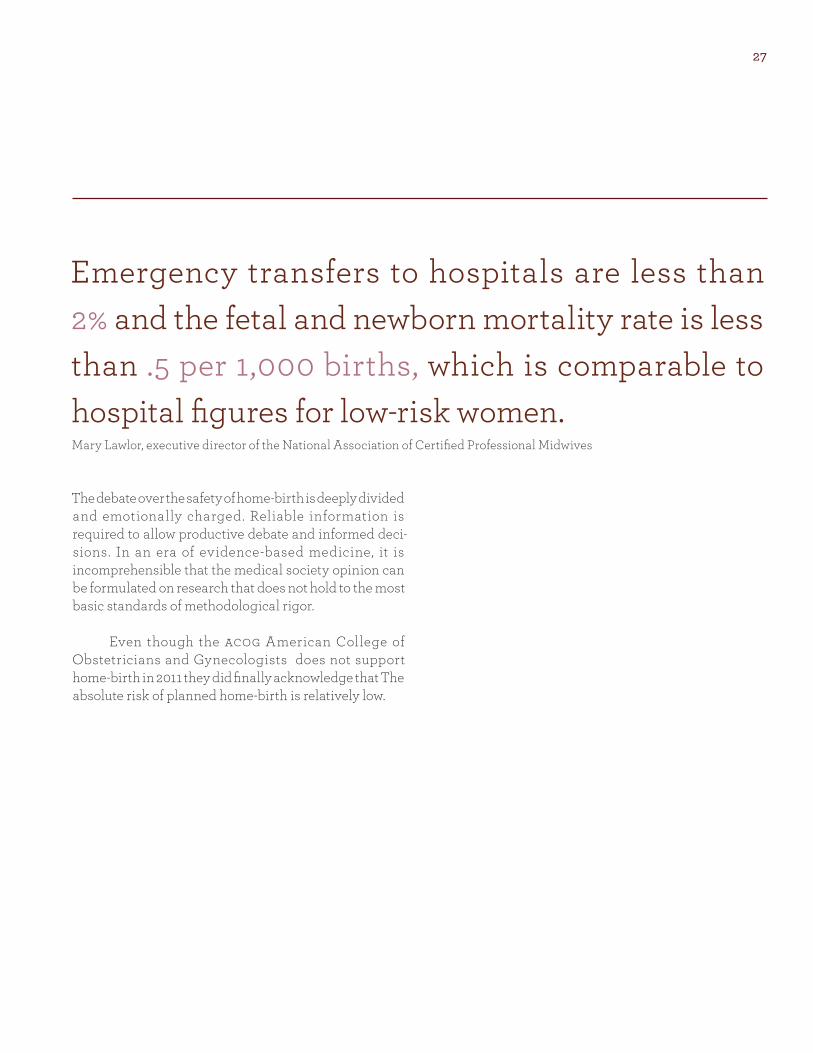
The debate over the safety of home-birth is deeply divided and emotionally charged. Reliable information is required to allow productive debate and informed deci-sions. In an era of evidence-based medicine, it is incomprehensible that the medical society opinion can be formulated on research that does not hold to the most basic standards of methodological rigor.
Even though the acog American College of Obstetricians and Gynecologists does not support home-birth in 2011 they did finally acknowledge that The absolute risk of planned home-birth is relatively low.
Emergency transfers to hospitals are less than 2% and the fetal and newborn mortality rate is less than .5 per 1,000 births, which is comparable to hospital figures for low-risk women.Mary Lawlor, executive director of the National Association of Certified Professional Midwives
28
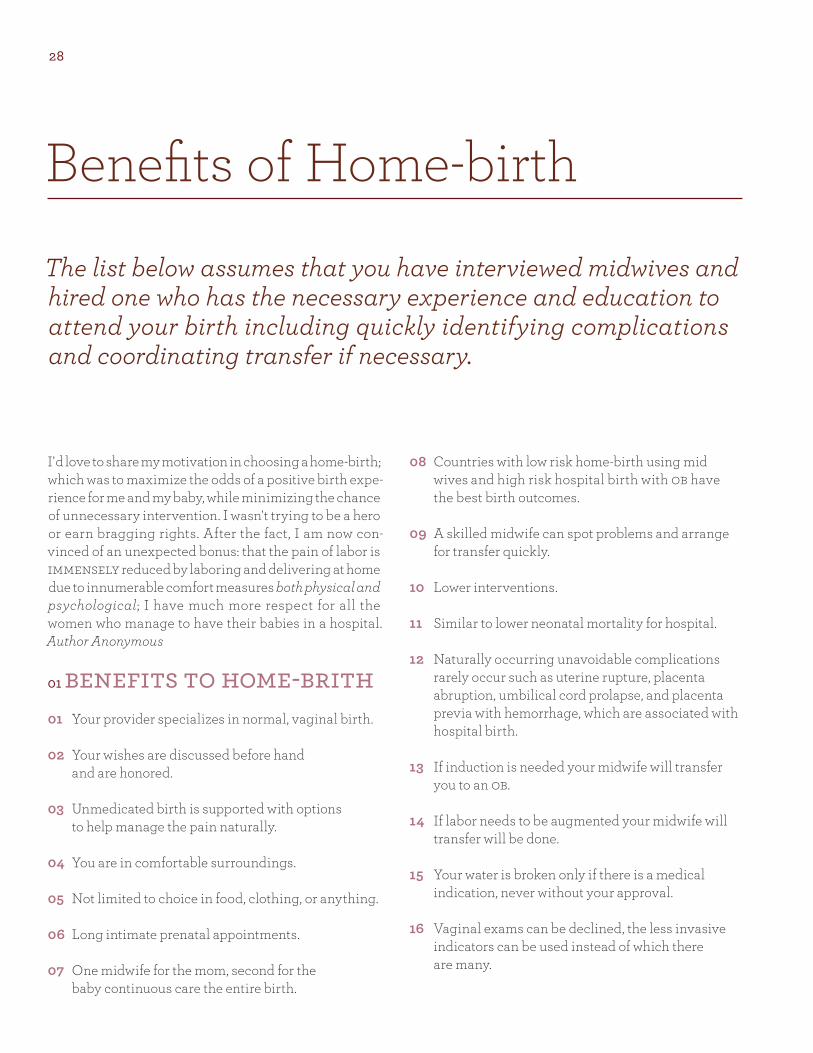
I'd love to share my motivation in choosing a home-birth; which was to maximize the odds of a positive birth expe-rience for me and my baby, while minimizing the chance of unnecessary intervention. I wasn't trying to be a hero or earn bragging rights. After the fact, I am now con-vinced of an unexpected bonus: that the pain of labor is immensely reduced by laboring and delivering at home due to innumerable comfort measures both physical and psychological; I have much more respect for all the women who manage to have their babies in a hospital. Author Anonymous
01 benefits to home-brith 01 Your provider specializes in normal, vaginal birth.
02 Your wishes are discussed before hand and are honored.
03 Unmedicated birth is supported with options to help manage the pain naturally.
04 You are in comfortable surroundings.
05 Not limited to choice in food, clothing, or anything.
06 Long intimate prenatal appointments.
07 One midwife for the mom, second for the baby continuous care the entire birth.
08 Countries with low risk home-birth using mid wives and high risk hospital birth with ob have the best birth outcomes.
09 A skilled midwife can spot problems and arrange for transfer quickly.
10 Lower interventions.
11 Similar to lower neonatal mortality for hospital.
12 Naturally occurring unavoidable complications rarely occur such as uterine rupture, placenta abruption, umbilical cord prolapse, and placenta previa with hemorrhage, which are associated with hospital birth.
13 If induction is needed your midwife will transfer you to an ob.
14 If labor needs to be augmented your midwife will transfer will be done.
15 Your water is broken only if there is a medical indication, never without your approval.
16 Vaginal exams can be declined, the less invasive indicators can be used instead of which there are many.
Benefits of Home-birth
The list below assumes that you have interviewed midwives and hired one who has the necessary experience and education to attend your birth including quickly identifying complications and coordinating transfer if necessary.

29
17 Stalled labor is fine as long as you and baby are ok, this is normal and gives you a chance to relax.
18 Eating & Drinking what you want when you want.
19 iv's are very rarely needed.
20 Episiotomies, very rarely needed.
21 Fetal Monitoring, periodic monitoring is utilized, even underwater doplers are used.
22 Home-birth model allows for a 42 week and one day as over due, not as strict as hospitals.
23 Big babies are considered normal, ultrasounds are very unreliable, other positions are allowed to help babies out if it's suspected to be big.
24 Weight gain, the focus is on what you eat, not necessarily how much weight you gain, keeping a food diary and giving health alternatives.
25 Breech birth is viewed as a variation of normal, Some midwifes attend breech births make sure your is an expert in this area as they are complicated.
26 Time Limits on labor. There usually isn't a time limit as each woman will dilate differently and the arbitrary dilation of 2 cm an hour is evidenced- based and not used. As long as you are laboring well, and all health signs are normal you are fine.
27 Movement, not restricted or incumbered by machines, iv's or people around you.
28 Noise, you are allowed to make any sound or noise you deem necessary.
29 Private Room, you are in your house.
30 Clothing is optional.
31 Travel, your midwife comes to you.
32 Shower, you can labor in the shower, not all hospitals have one to labor in.
33 Labor in water, you can use your bathtub or a birthing tub to labor and delivery in.
34 Deliver in the position that feels right for you. You can even catch your own baby if you wish.
35 Nothing happens with out your consent to the baby.
36 Routine Testing for medications will be discussed pros and cons before hand.
37 Nursery, there is none, you are at home, baby stays with you the whole time.
38 Skin to skin, it is expected that once the baby is born they will immediately be placed on you.
39 Breast-feeding, midwife can assist as necessary, no pacifiers or sugar water or formula will be pushed on your baby by anyone.
40 Babies born at home have the highest number of bifidobacteria good bacteria and the lowest number of c. difficile and e. Coli bad bacteria.
41 If you do transfer to a hospital which is about 12 – 20% for non emergency first time mom's you will have your midwife there to work on your behalf, she can keep doctors or nurses from entering, especially ones that can derail your wishes. She is a great advocate and has been with you so knows your cues and gives you full attention which is something that you will not get from the nurses or doctors who have other patients to care for.
30
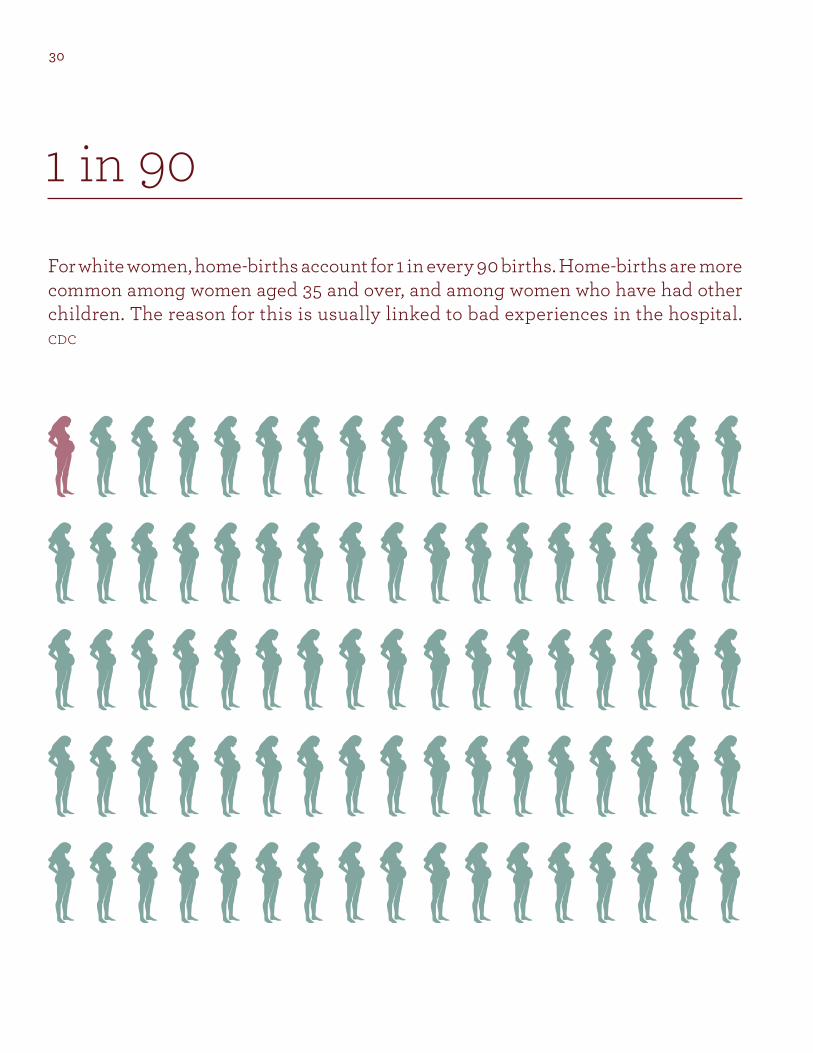
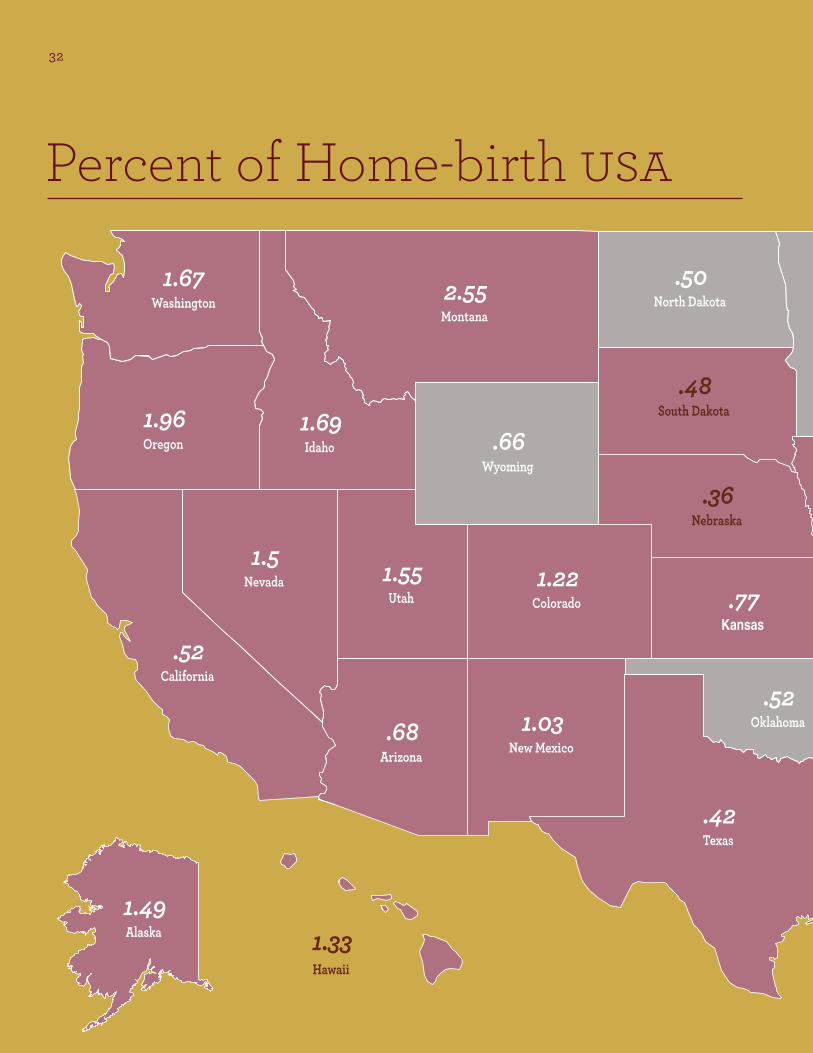
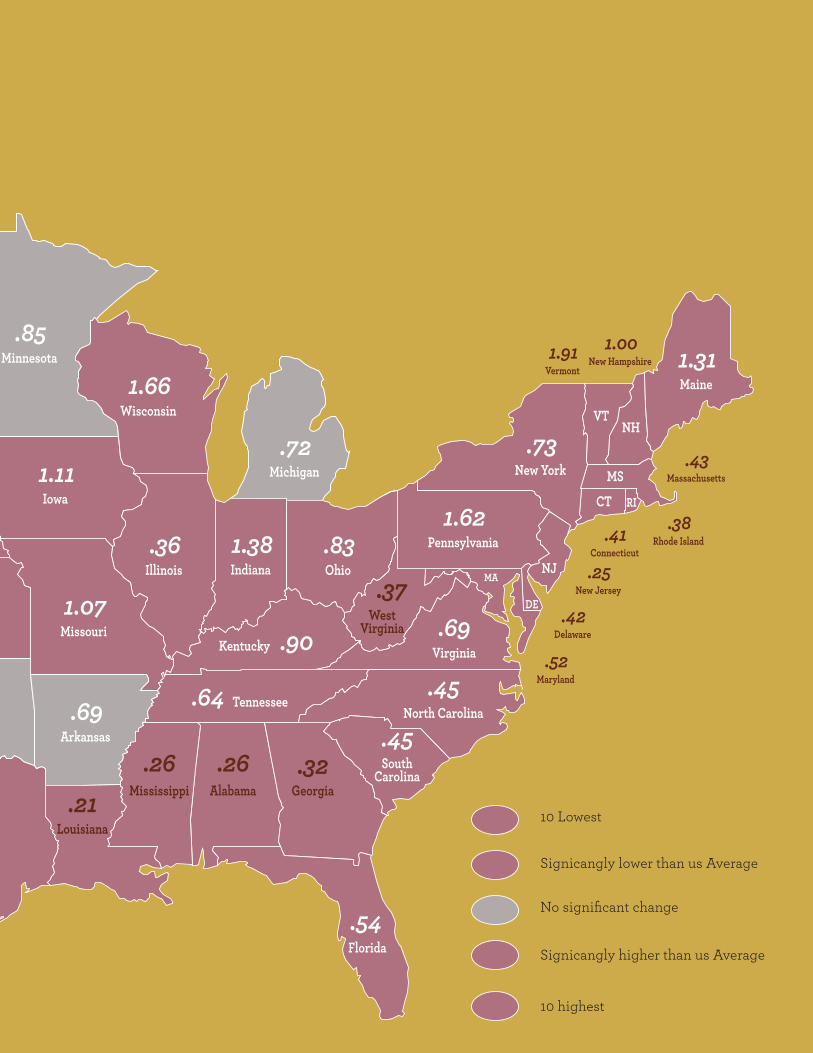
For white women, home-births account for 1 in every 90 births. Home-births are more common among women aged 35 and over, and among women who have had other children. The reason for this is usually linked to bad experiences in the hospital. CDC
1 in 90
31
If women are considering a home-birth, it’s important to make sure they select an
American Midwifery Board Certified Midwife, and have a low-risk pregnancy.
CT
DE
Kentucky
MA
MS
NH
NJ
RI
Tennessee
VT
Washington
Oregon
California
Alaska
Hawaii
Nevada
Idaho
Montana
Wyoming
Colorado
New Mexico
Texas
Oklahoma
Kansas
Nebraska
South Dakota
Iowa
Wisconsin
Illinois Ohio
Pennsylvania
Michigan
Indiana
Maine
New York
Missouri
Arkansas
North Dakota
Minnesota
Louisiana
Mississippi Alabama Georgia
Florida
Arizona
Utah
1.67
.64
.90
1.96
.52
1.491.33
1.5
1.69
2.55
.66
1.22
1.03
.42
.52
.77
.36
.48
1.11
1.66
.36 .831.62
.72
1.38
1.31
.73
1.07
.69
.50
.85
.21.26 .26
WestVirginia
.37
Virginia.69
.32
North Carolina.45
SouthCarolina
.45
.54
.68
1.55Rhode Island.38
Connecticut.41
New Jersey.25
Maryland.52
Delaware.42
New Hampshire1.00
Vermont1.91
Massachusetts.43
10 Lowest
Signicangly lower than us Average
No significant change
Signicangly higher than us Average
10 highest
32
Percent of Home-birth usa
CT
DE
Kentucky
MA
MS
NH
NJ
RI
Tennessee
VT
Washington
Oregon
California
Alaska
Hawaii
Nevada
Idaho
Montana
Wyoming
Colorado
New Mexico
Texas
Oklahoma
Kansas
Nebraska
South Dakota
Iowa
Wisconsin
Illinois Ohio
Pennsylvania
Michigan
Indiana
Maine
New York
Missouri
Arkansas
North Dakota
Minnesota
Louisiana
Mississippi Alabama Georgia
Florida
Arizona
Utah
1.67
.64
.90
1.96
.52
1.491.33
1.5
1.69
2.55
.66
1.22
1.03
.42
.52
.77
.36
.48
1.11
1.66
.36 .831.62
.72
1.38
1.31
.73
1.07
.69
.50
.85
.21.26 .26
WestVirginia
.37
Virginia.69
.32
North Carolina.45
SouthCarolina
.45
.54
.68
1.55Rhode Island.38
Connecticut.41
New Jersey.25
Maryland.52
Delaware.42
New Hampshire1.00
Vermont1.91
Massachusetts.43
10 Lowest
Signicangly lower than us Average
No significant change
Signicangly higher than us Average
10 highest
+66+34
+28+72+29+7129%
66.3%
28.1%
34
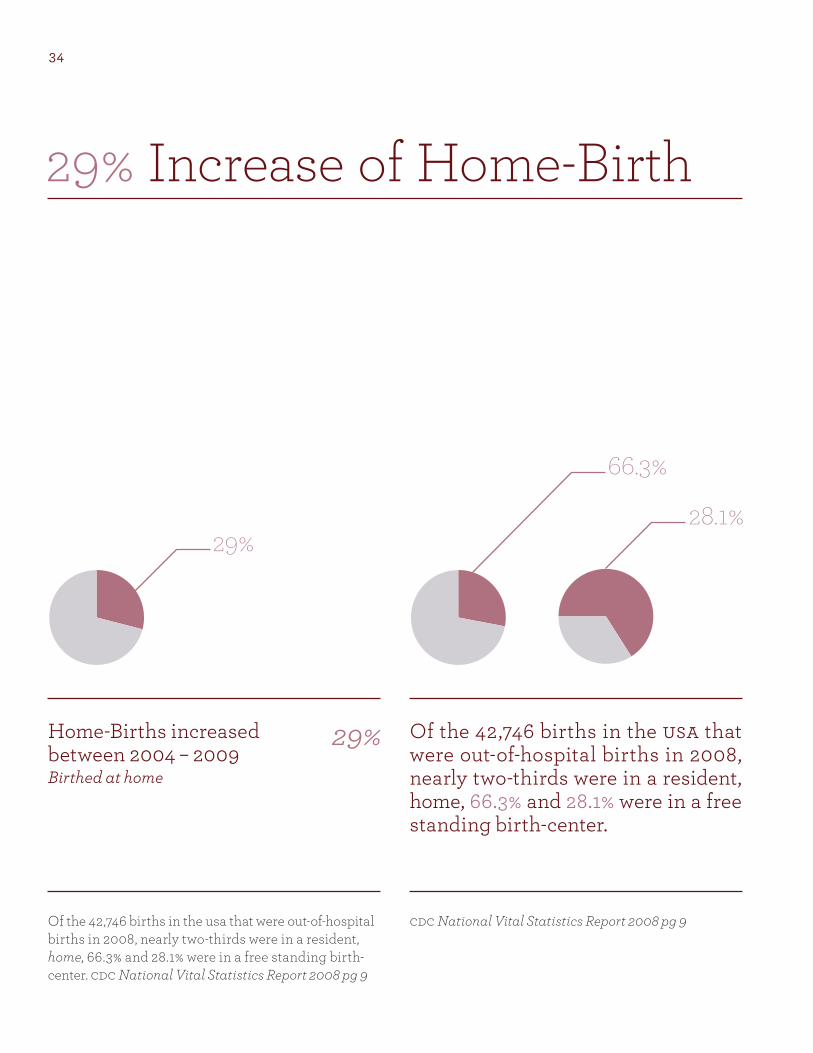
29% Increase of Home-Birth
Of the 42,746 births in the usa that were out-of-hospital births in 2008, nearly two-thirds were in a resident, home, 66.3% and 28.1% were in a free standing birth- center. cdc National Vital Statistics Report 2008 pg 9
cdc National Vital Statistics Report 2008 pg 9
Home-Births increased between 2004 – 2009 Birthed at home
Of the 42,746 births in the usa that were out-of-hospital births in 2008, nearly two-thirds were in a resident, home, 66.3% and 28.1% were in a free standing birth-center.
29%
+66+34 62%
35
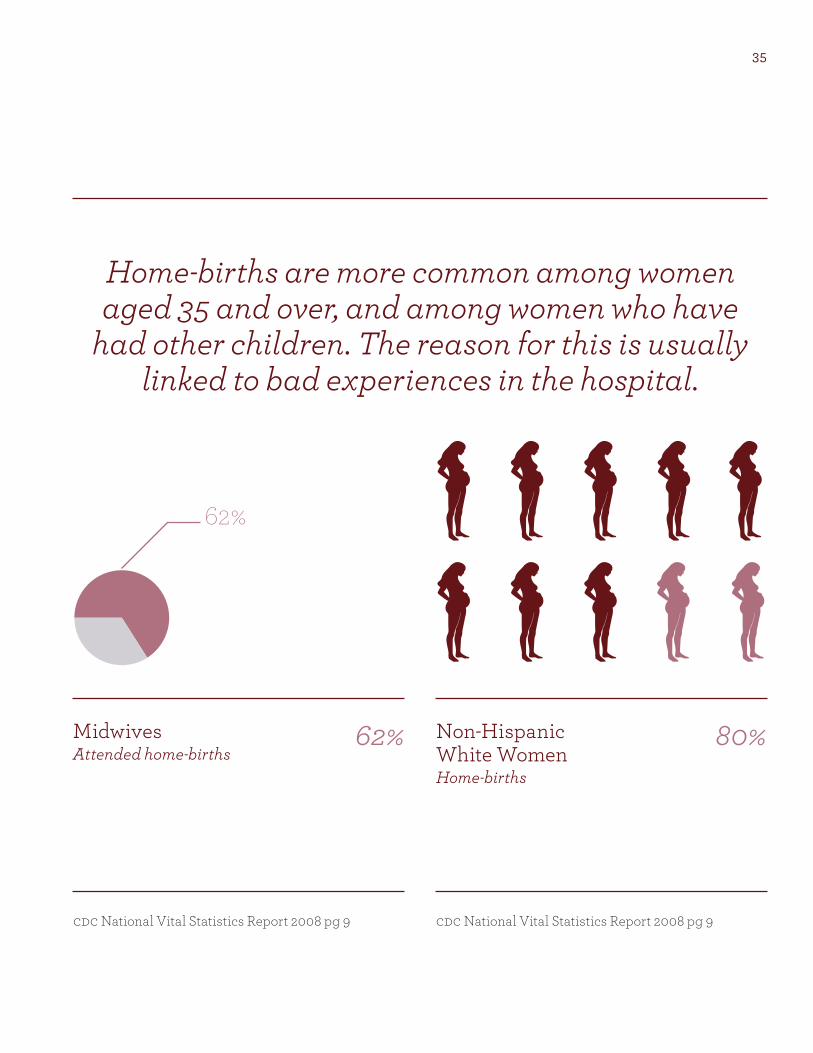
Home-births are more common among women aged 35 and over, and among women who have
had other children. The reason for this is usually linked to bad experiences in the hospital.
Midwives Attended home-births
cdc National Vital Statistics Report 2008 pg 9
Non-Hispanic White Women Home-births
cdc National Vital Statistics Report 2008 pg 9
62% 80%
36
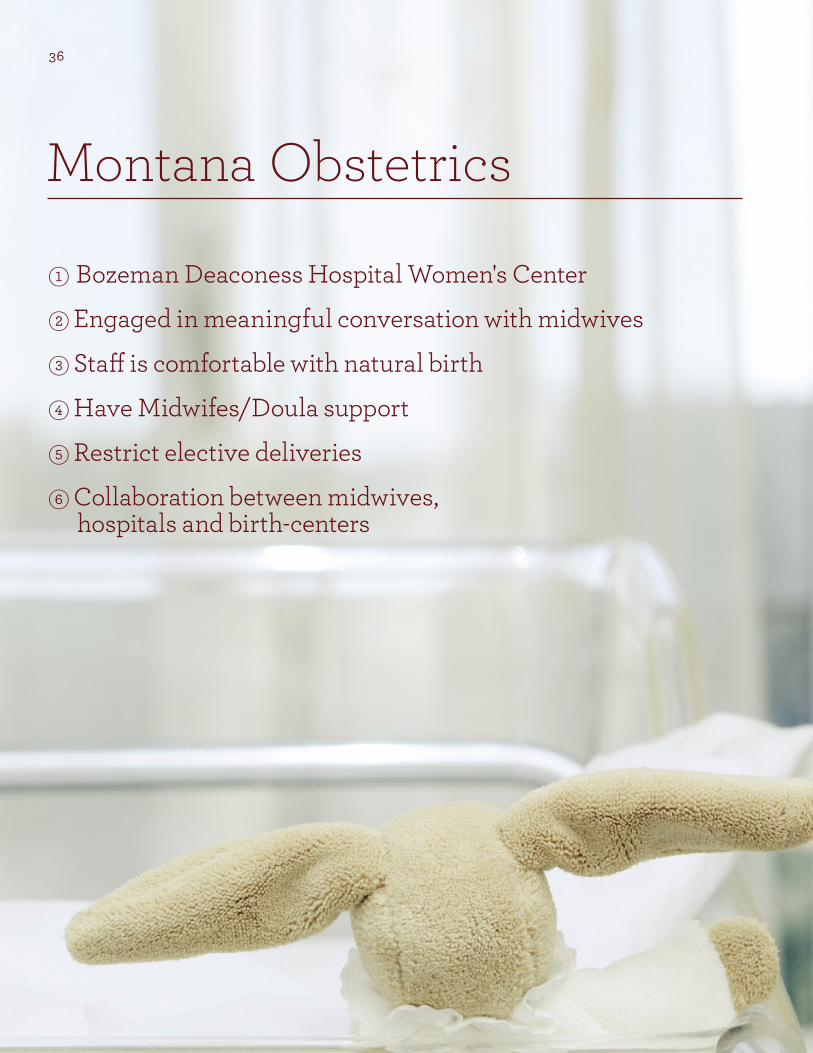
Montana Obstetrics
1 Bozeman Deaconess Hospital Women's Center
2 Engaged in meaningful conversation with midwives
3 Staff is comfortable with natural birth
n Have Midwifes/Doula support
o Restrict elective deliveries
p Collaboration between midwives, hospitals and birth-centers
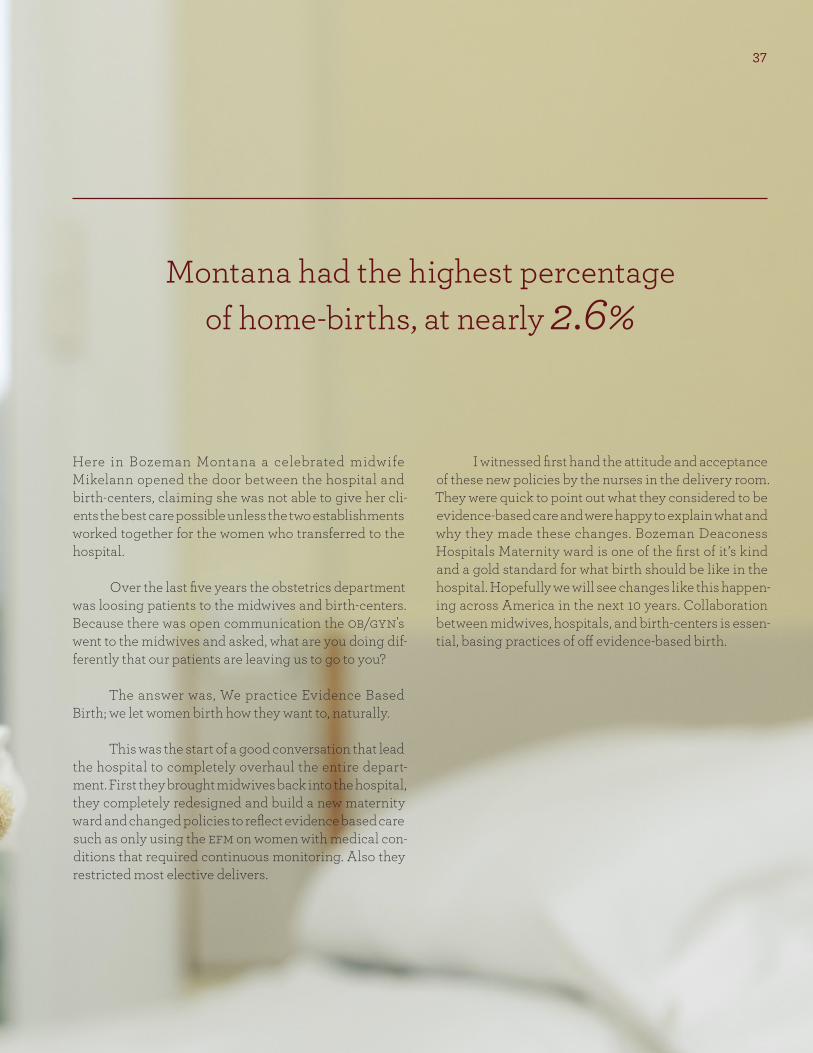
Montana had the highest percentage of home-births, at nearly 2.6%
37
Here in Bozeman Montana a celebrated midwife Mikelann opened the door between the hospital and birth-centers, claiming she was not able to give her cli-ents the best care possible unless the two establishments worked together for the women who transferred to the hospital.
Over the last five years the obstetrics department was loosing patients to the midwives and birth-centers. Because there was open communication the ob/gyn's went to the midwives and asked, what are you doing dif-ferently that our patients are leaving us to go to you?
The answer was, We practice Evidence Based Birth; we let women birth how they want to, naturally.
This was the start of a good conversation that lead the hospital to completely overhaul the entire depart-ment. First they brought midwives back into the hospital, they completely redesigned and build a new maternity ward and changed policies to reflect evidence based care such as only using the efm on women with medical con-ditions that required continuous monitoring. Also they restricted most elective delivers.
I witnessed first hand the attitude and acceptance of these new policies by the nurses in the delivery room. They were quick to point out what they considered to be evidence-based care and were happy to explain what and why they made these changes. Bozeman Deaconess Hospitals Maternity ward is one of the first of it’s kind and a gold standard for what birth should be like in the hospital. Hopefully we will see changes like this happen-ing across America in the next 10 years. Collaboration between midwives, hospitals, and birth-centers is essen-tial, basing practices of off evidence-based birth.
Montana had the highest percentage of home-births, at nearly 2.6%
Montana Obstetrics

38
4
39
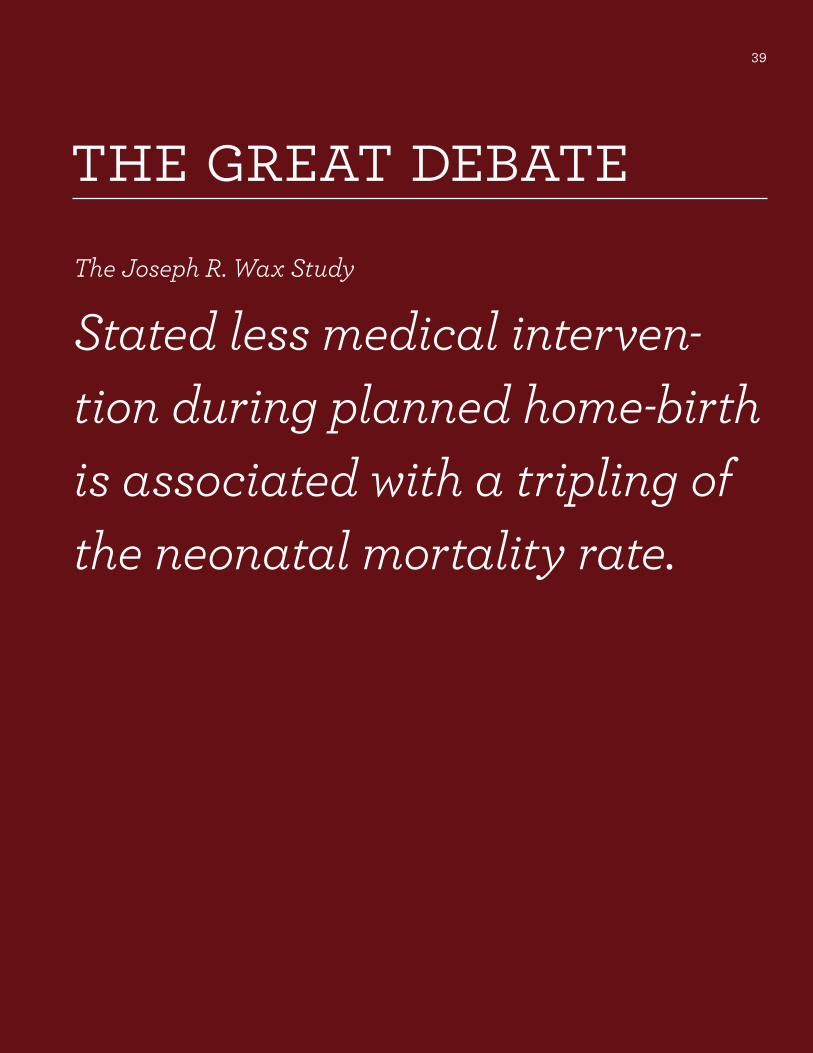
the great debate The Joseph R. Wax Study
Stated less medical interven-tion during planned home-birth is associated with a tripling of the neonatal mortality rate.

41
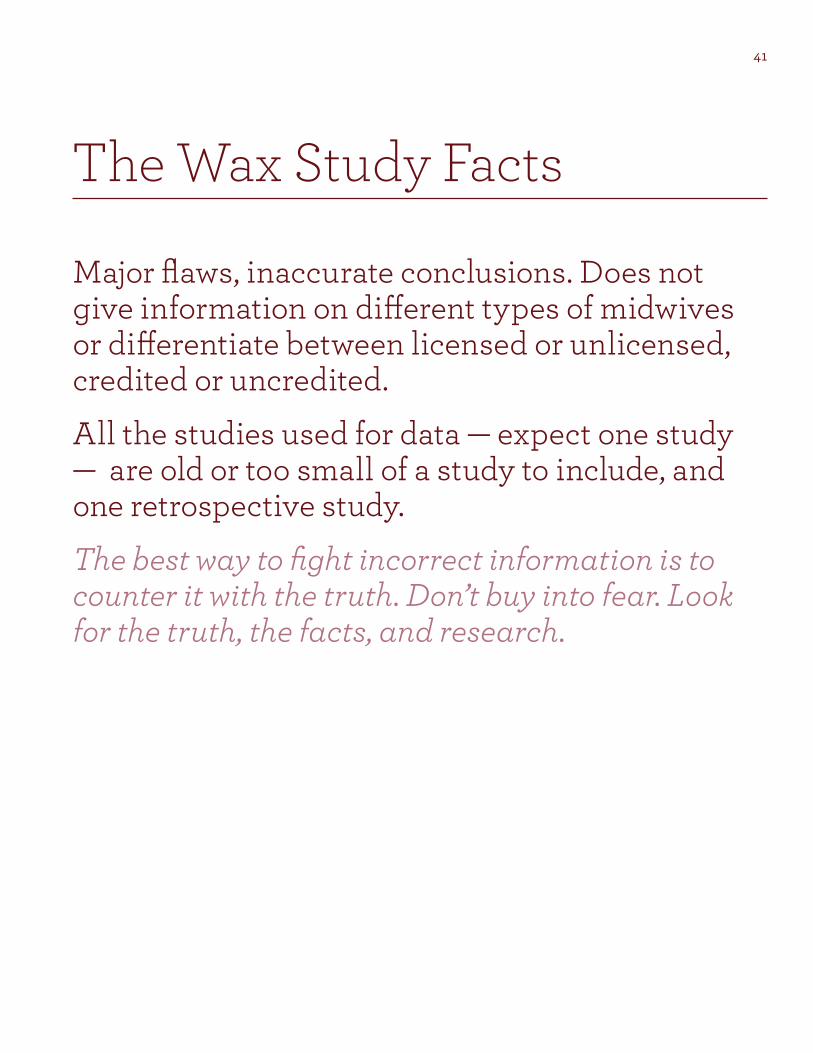
The Wax Study Facts
Major flaws, inaccurate conclusions. Does not give information on different types of midwives or differentiate between licensed or unlicensed, credited or uncredited.
All the studies used for data — expect one study — are old or too small of a study to include, and one retrospective study.
The best way to fight incorrect information is to counter it with the truth. Don’t buy into fear. Look for the truth, the facts, and research.
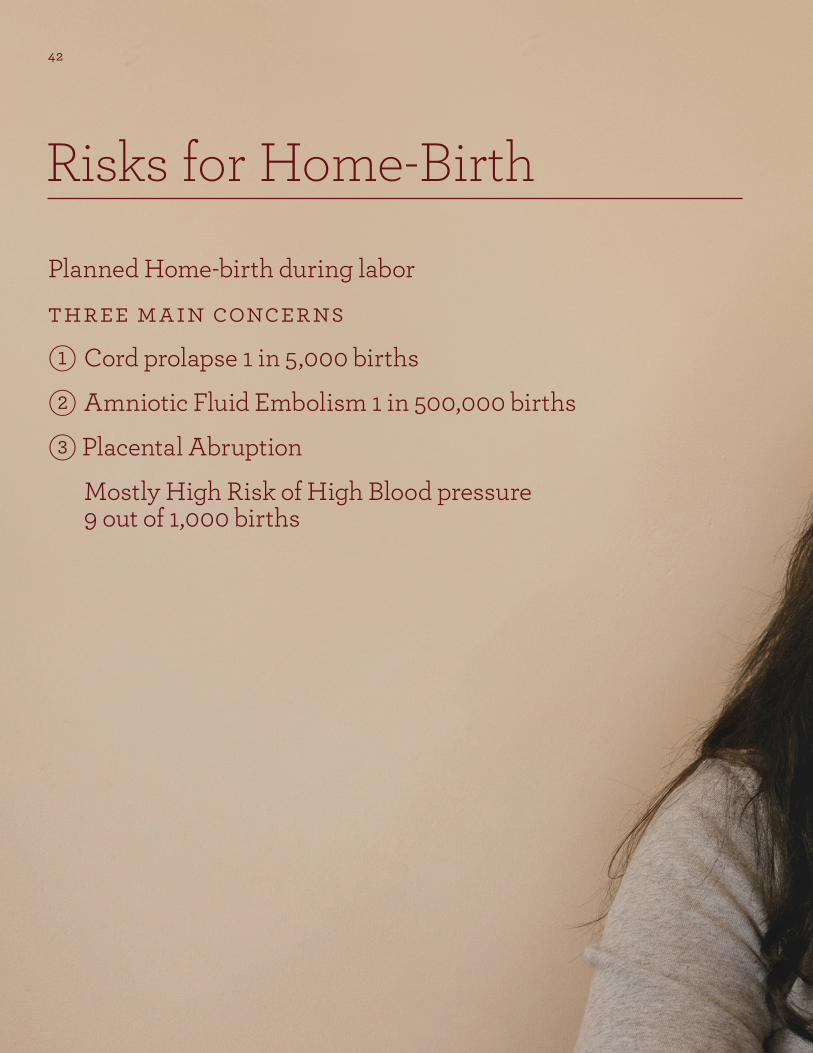
42
Planned Home-birth during labor
three main concerns
1 Cord prolapse 1 in 5,000 births
2 Amniotic Fluid Embolism 1 in 500,000 births
3 Placental Abruption
Mostly High Risk of High Blood pressure 9 out of 1,000 births
Risks for Home-Birth
Risks for Home-Birth
44
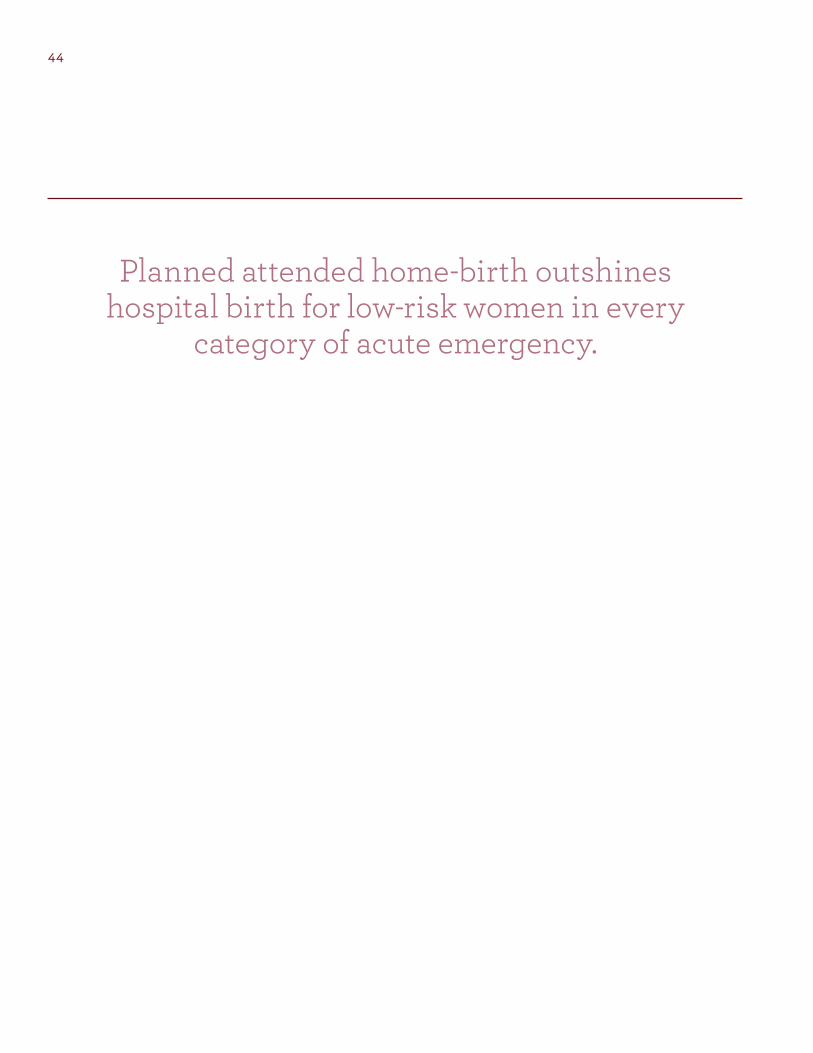
Planned attended home-birth outshines hospital birth for low-risk women in every
category of acute emergency.
45
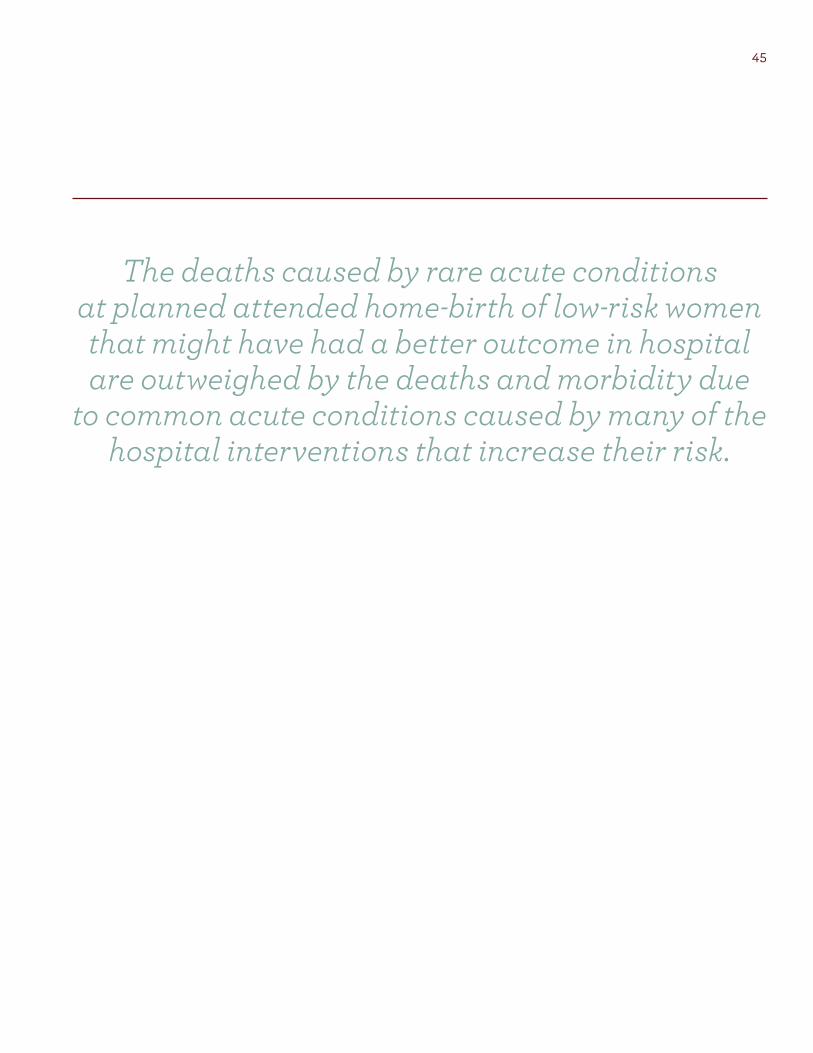
The deaths caused by rare acute conditions at planned attended home-birth of low-risk women that might have had a better outcome in hospital are outweighed by the deaths and morbidity due
to common acute conditions caused by many of the hospital interventions that increase their risk.
46
Risks for Newborns
The main causes of newborn deaths are prematurity and low-birth-weight, infections, asphyxia lack of oxygen at birth and birth trauma. These causes account for nearly 80% of deaths in this age group, mostly associated with high-risk preg-nancies, and hospitals. Home-birth outcomes are better partly because the mothers are arguably healthier and more engaged than your average hospital patient; they also have better out-comes because it would be unethical to practice many standard hospital interventions at home.
Therefore, even accounting for transports, there are lower Cesarean rates, lower numbers of forceps deliveries, and fewer mothers requiring induction or anesthesia among mothers who planned to birth their babies at home. Although each intervention was created for a good reason, with each one offered, the morbidity and mortality rates rise, especially when used on low-risk pregnancies.

47
Obstetrics Opinion
1 Society of Obstetricians and Gynecologists of Canada States Home-birth & birth-centers should coexist as a viable option.
2 Royal College of Obstetricians & Gynecologists United Kingdom States Home-birth & birth-centers should coexist as a viable option.
3 American College of Obstetricians and Gynecologists usa States Home-birth places the process of giving birth ahead of the goal of having a healthy baby and does not support it.
cmaj Canadian Medical Association Journal
48
For many people, surviving birth is the goal and the only thing that matters is having a healthy baby.
When we reduce birth to the extraction of a fetus from a womb, without regard to the physical, emotional, and mental implications of how it happens, it can be seriously detrimental to the postpartum period after the birth. This includes how women recover from birth, parent their newborns, relate to their partners, and make decisions about future births.
The Problem
49
Part of the problem is public perception of birth. For many people, surviving birth is the goal.
50
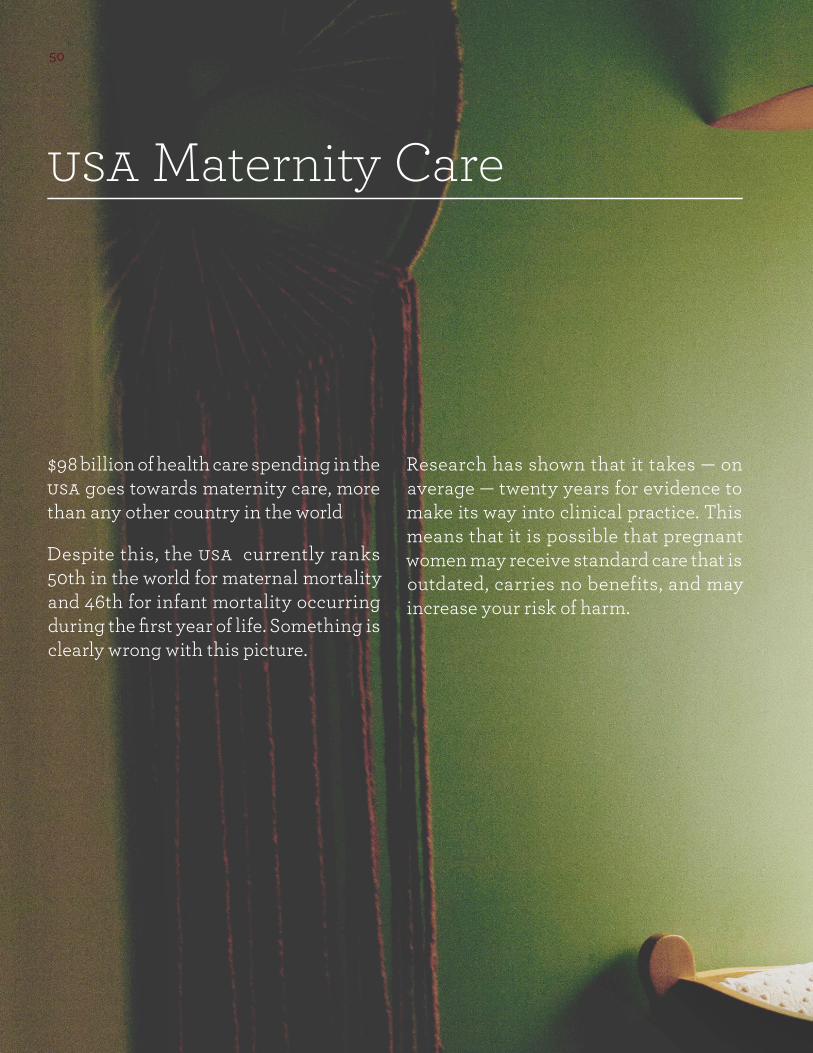
$98 billion of health care spending in the usa goes towards maternity care, more than any other country in the world
Despite this, the usa currently ranks 50th in the world for maternal mortality and 46th for infant mortality occurring during the first year of life. Something is clearly wrong with this picture.
Research has shown that it takes — on average — twenty years for evidence to make its way into clinical practice. This means that it is possible that pregnant women may receive standard care that is outdated, carries no benefits, and may increase your risk of harm.
usa Maternity Care

usa Maternity Care

52
5
53
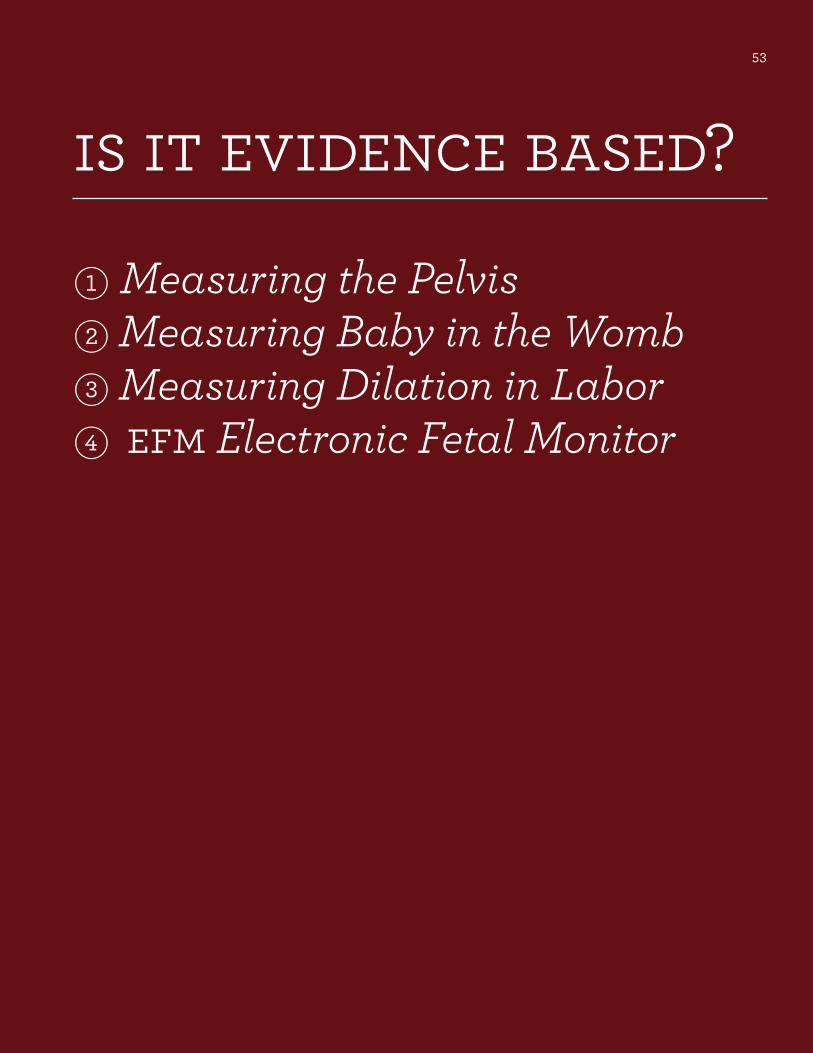
is it evidence based?
1 Measuring the Pelvis 2 Measuring Baby in the Womb3 Measuring Dilation in Labor 4 efm Electronic Fetal Monitor
54
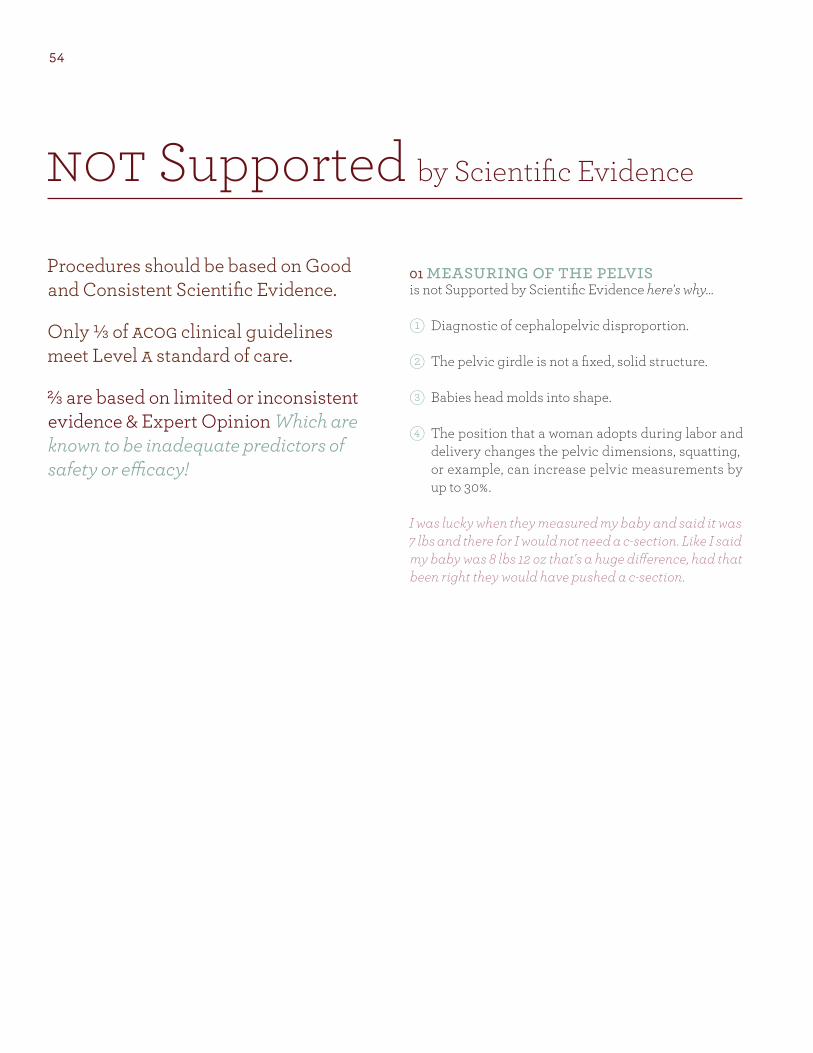
Procedures should be based on Good and Consistent Scientific Evidence.
Only L of acog clinical guidelines meet Level a standard of care.
M are based on limited or inconsistent evidence & Expert Opinion Which are known to be inadequate predictors of safety or efficacy!
01 measuring of the pelvis is not Supported by Scientific Evidence here's why...
1 Diagnostic of cephalopelvic disproportion.
2 The pelvic girdle is not a fixed, solid structure.
3 Babies head molds into shape.
4 The position that a woman adopts during labor and delivery changes the pelvic dimensions, squatting, or example, can increase pelvic measurements by up to 30%.
I was lucky when they measured my baby and said it was 7 lbs and there for I would not need a c-section. Like I said my baby was 8 lbs 12 oz that's a huge difference, had that been right they would have pushed a c-section.
not Supported by Scientific Evidence
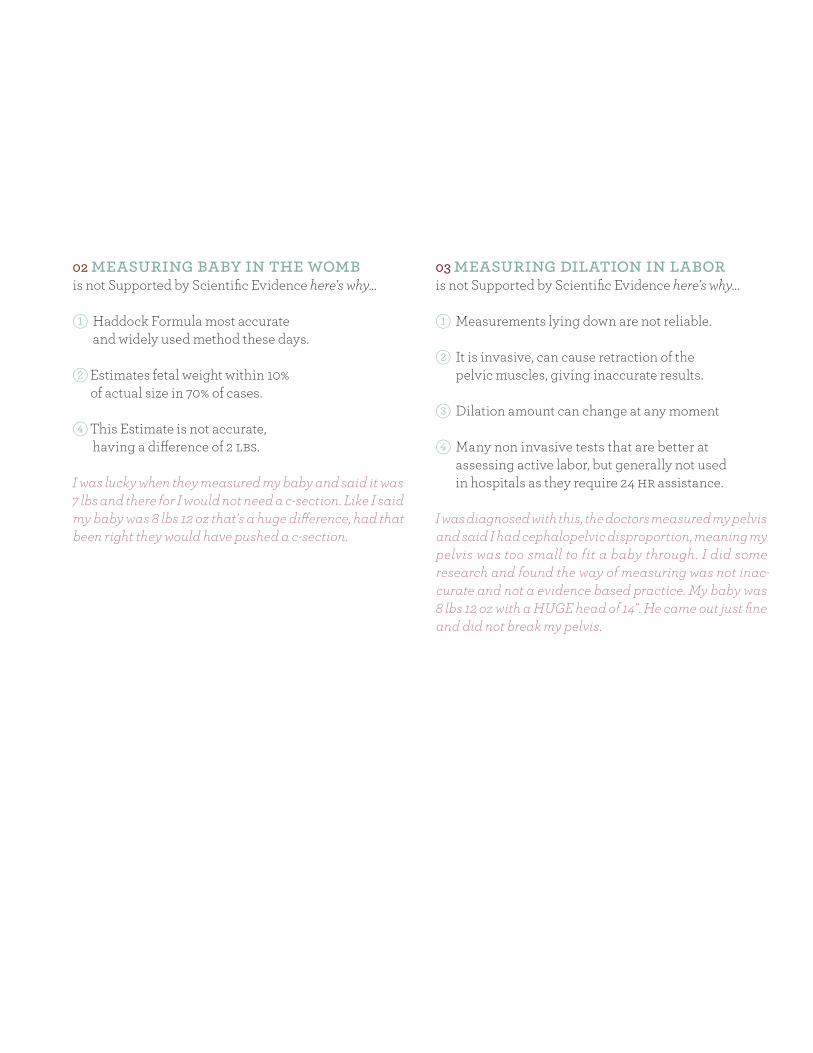
02 measuring baby in the womb is not Supported by Scientific Evidence here's why...
1 Haddock Formula most accurate and widely used method these days.
2 Estimates fetal weight within 10% of actual size in 70% of cases.
4 This Estimate is not accurate, having a difference of 2 lbs.
I was lucky when they measured my baby and said it was 7 lbs and there for I would not need a c-section. Like I said my baby was 8 lbs 12 oz that's a huge difference, had that been right they would have pushed a c-section.
03 measuring dilation in labor is not Supported by Scientific Evidence here's why...
1 Measurements lying down are not reliable.
2 It is invasive, can cause retraction of the pelvic muscles, giving inaccurate results.
3 Dilation amount can change at any moment
4 Many non invasive tests that are better at assessing active labor, but generally not used in hospitals as they require 24 hr assistance.
I was diagnosed with this, the doctors measured my pelvis and said I had cephalopelvic disproportion, meaning my pelvis was too small to fit a baby through. I did some research and found the way of measuring was not inac-curate and not a evidence based practice. My baby was 8 lbs 12 oz with a HUGE head of 14". He came out just fine and did not break my pelvis.
56
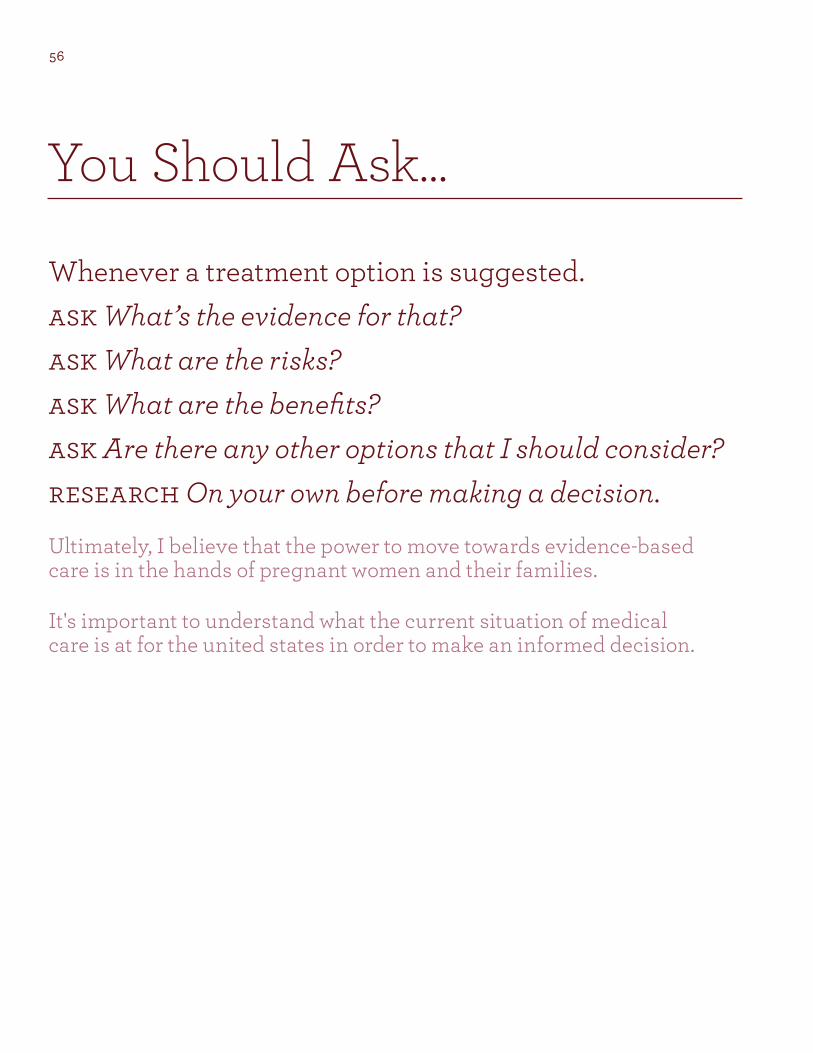
You Should Ask...
Whenever a treatment option is suggested.ask What’s the evidence for that? ask What are the risks? ask What are the benefits? ask Are there any other options that I should consider?research On your own before making a decision.
Ultimately, I believe that the power to move towards evidence-based care is in the hands of pregnant women and their families.
It's important to understand what the current situation of medical care is at for the united states in order to make an informed decision.

58
In May Gaskin
The mother of authentic MidwiferyLess intervention is better care.
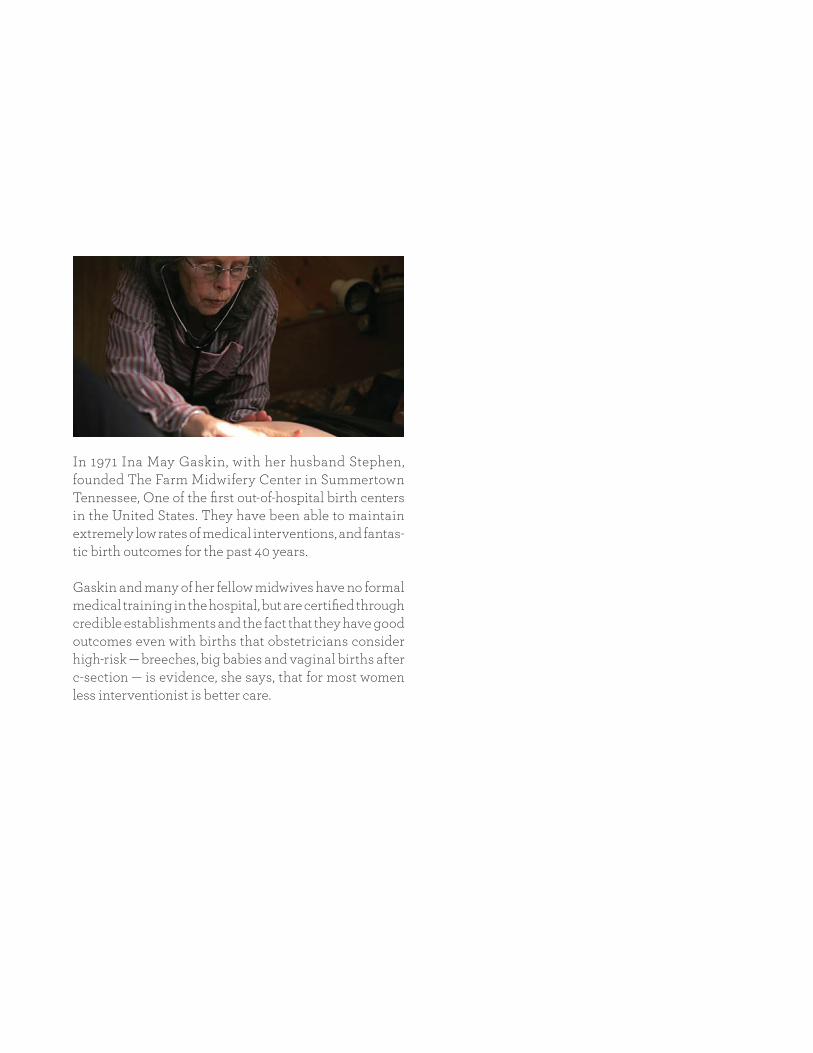
In 1971 Ina May Gaskin, with her husband Stephen, founded The Farm Midwifery Center in Summertown Tennessee, One of the first out-of-hospital birth centers in the United States. They have been able to maintain extremely low rates of medical interventions, and fantas-tic birth outcomes for the past 40 years.
Gaskin and many of her fellow midwives have no formal medical training in the hospital, but are certified through credible establishments and the fact that they have good outcomes even with births that obstetricians consider high-risk — breeches, big babies and vaginal births after c-section — is evidence, she says, that for most women less interventionist is better care.

60
6

61
numbers & statisticsThe numbers say it all
+1.4+2.4+6.4+6+32.862
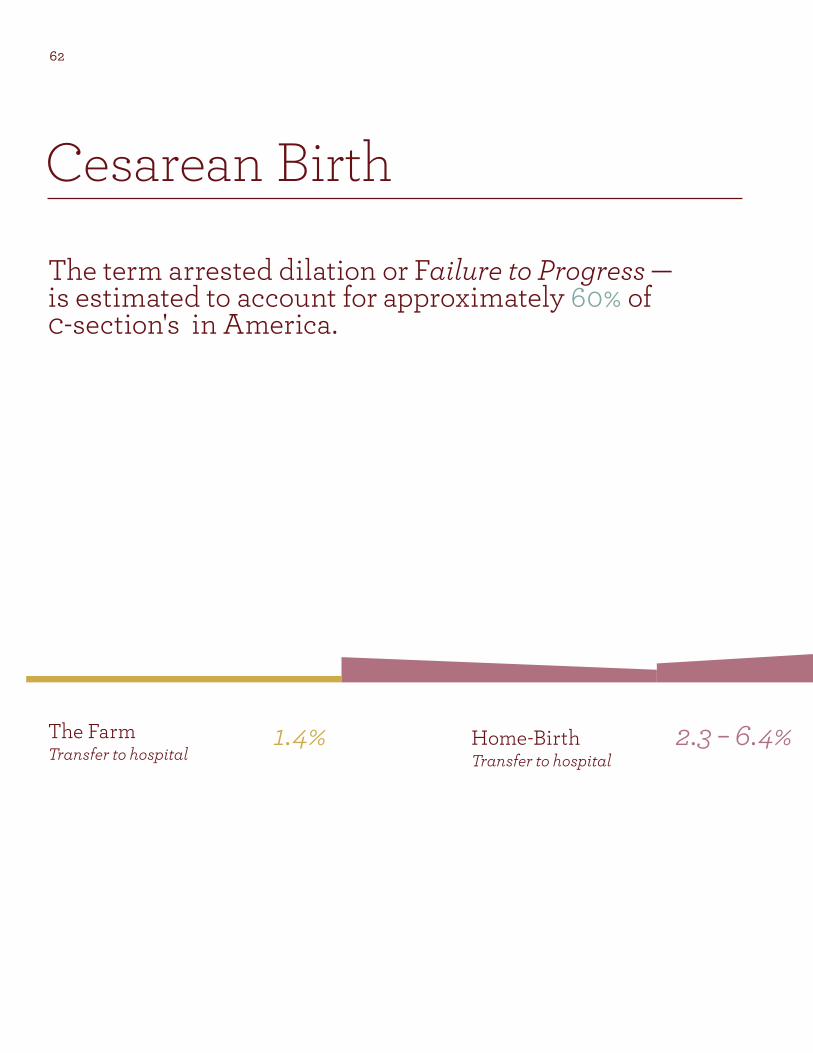
The term arrested dilation or Failure to Progress — is estimated to account for approximately 60% of c-section's in America.
Cesarean Birth
The Farm Transfer to hospital
Home-Birth Transfer to hospital
1.4% 2.3 – 6.4%
+1.4+2.4+6.4+6+32.863
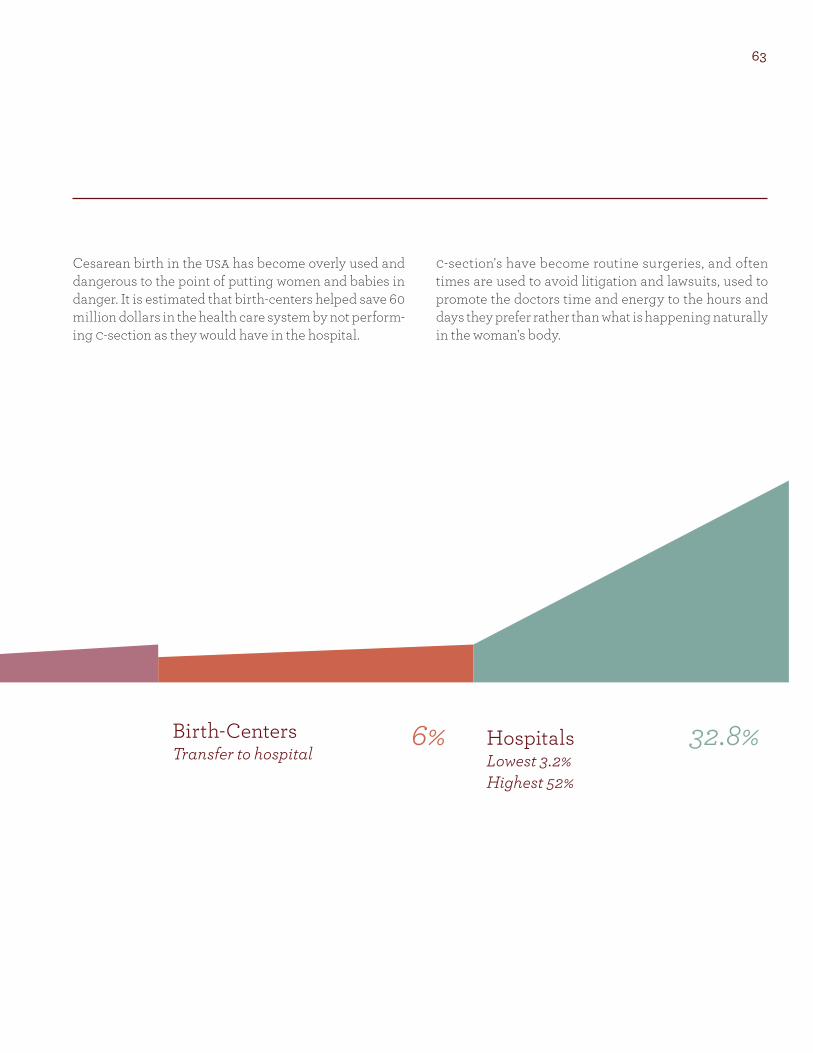
Cesarean birth in the usa has become overly used and dangerous to the point of putting women and babies in danger. It is estimated that birth-centers helped save 60 million dollars in the health care system by not perform-ing c-section as they would have in the hospital.
c-section's have become routine surgeries, and often times are used to avoid litigation and lawsuits, used to promote the doctors time and energy to the hours and days they prefer rather than what is happening naturally in the woman's body.
Birth-Centers Transfer to hospital
Hospitals Lowest 3.2% Highest 52%
6% 32.8%
Cesarean Birth
United States
32.8%Australia
31.2%Israel
31.2%Italy
38.4%
New Zeland
23.5%Norway
16.8%Sweden
16.8%Netherlands
14.8%France
20.3%
Canada
28.2%Germany
30.0%Germany
31.4%
United Kingdom
23.9%Findland
16.1%
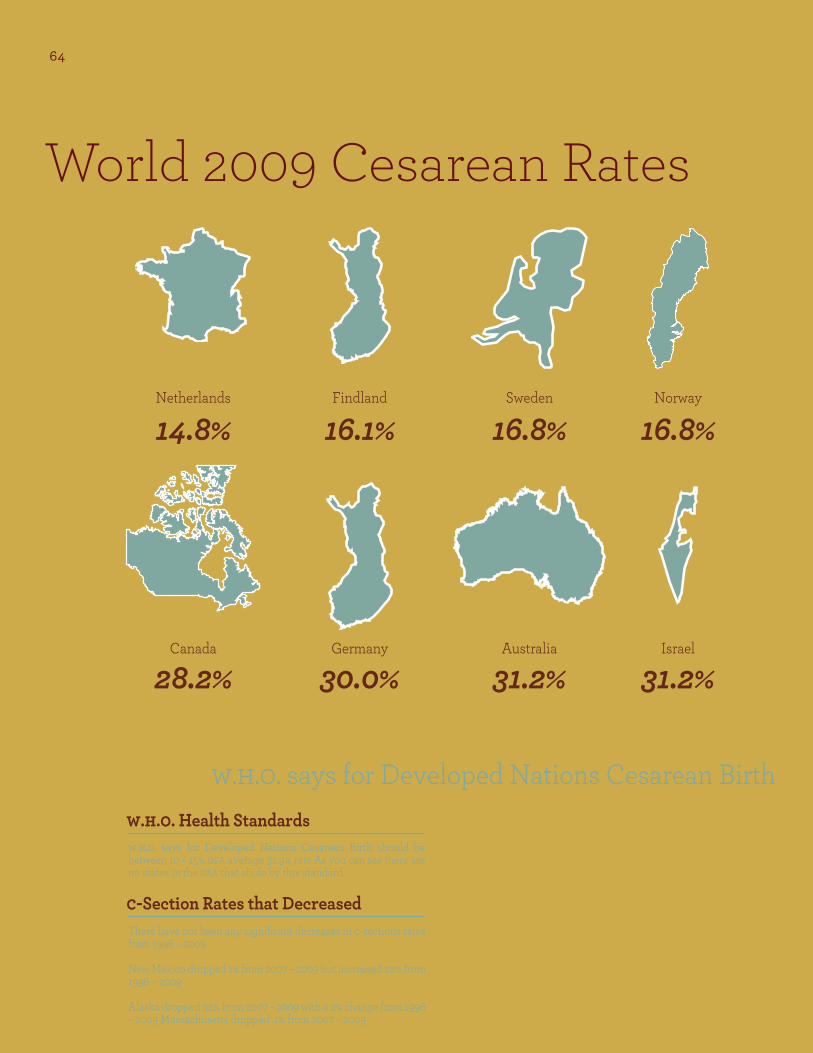
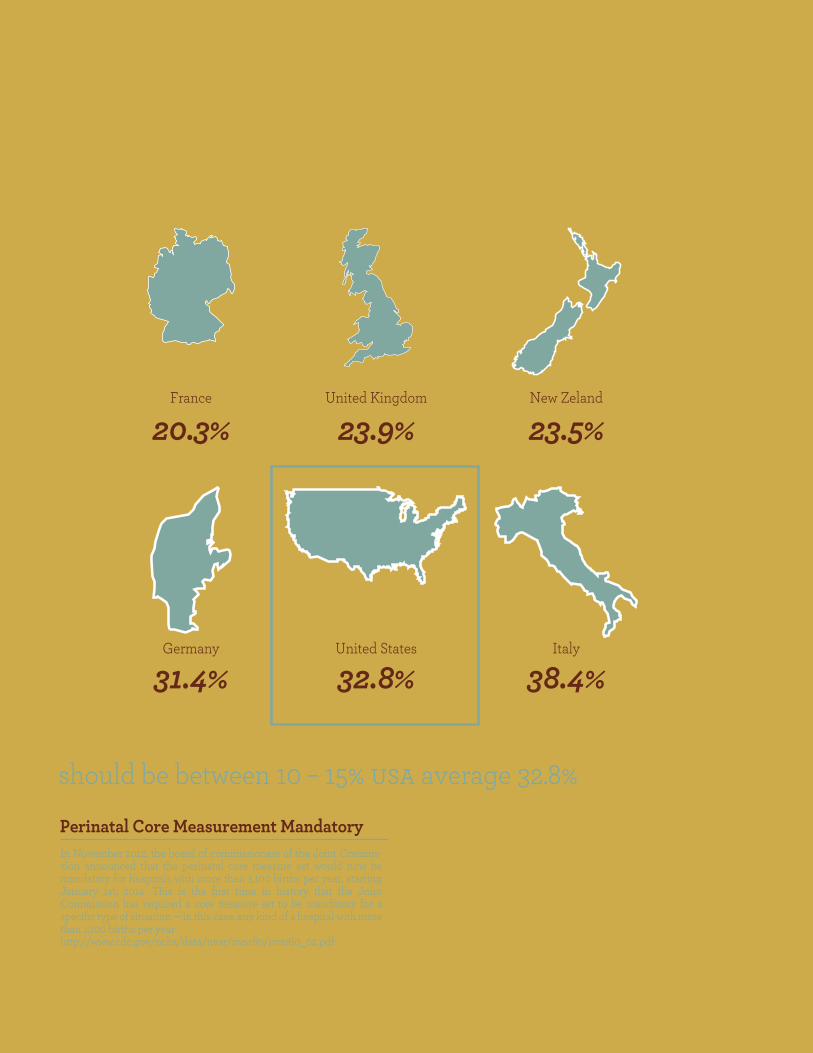
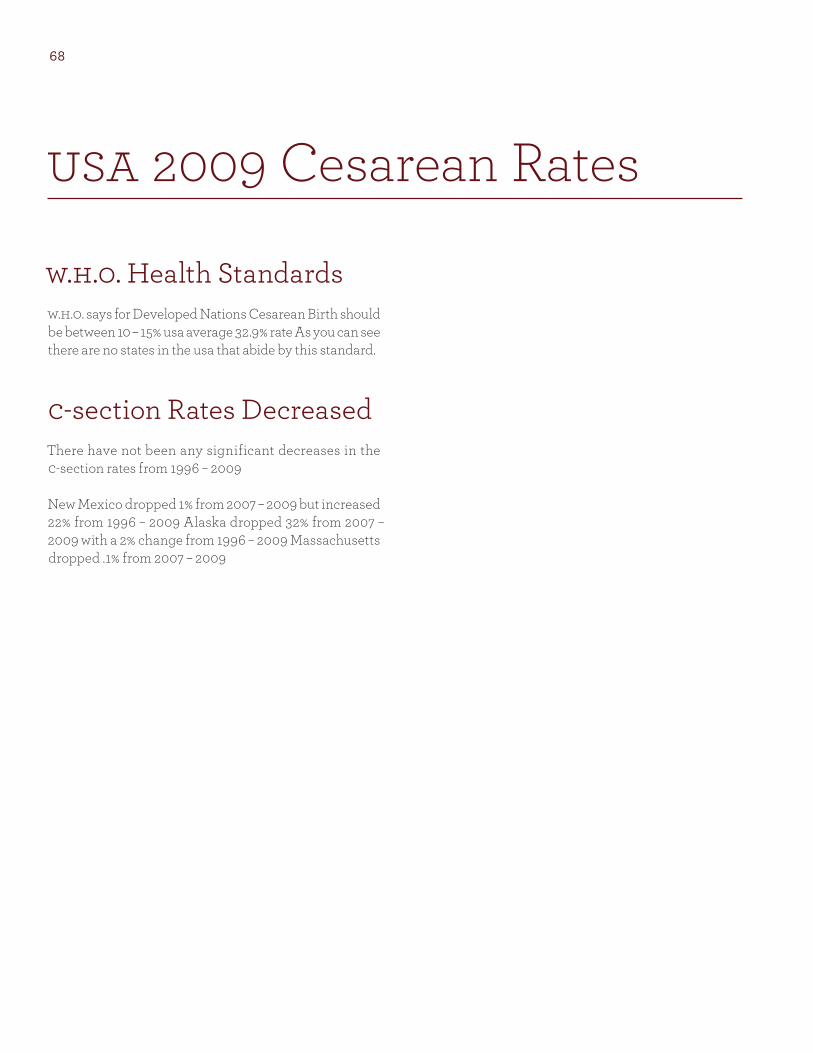
w.h.o. says for Developed Nations Cesarean Birth should be between 10 – 15% usa average 32.9% rate As you can see there are no states in the usa that abide by this standard.
w.h.o. says for Developed Nations Cesarean Birth should be between 10 – 15% usa average 32.8%
There have not been any significant decreases in c-sections rates from 1996 – 2009
New Mexico dropped 1% from 2007 – 2009 but increased 22% from 1996 – 2009
Alaska dropped 32% from 2007 – 2009 with a 2% change from 1996 – 2009 Massachusetts dropped .1% from 2007 – 2009
w.h.o. Health StandardsIn November 2012, the board of commissioners of the Joint Commis-sion announced that the perinatal core measure set would now be mandatory for hospitals with more than 1,100 births per year, starting January 1st, 2014. This is the first time in history that the Joint Commission has required a core measure set to be mandatory for a specific type of situation — in this case, any kind of a hospital with more than 1,100 births per year.http://www.cdc.gov/nchs/data/nvsr/nvsr60/nvsr60_02.pdf
Perinatal Core Measurement Mandatory
c-Section Rates that Decreased
64
World 2009 Cesarean Rates
United States
32.8%Australia
31.2%Israel
31.2%Italy
38.4%
New Zeland
23.5%Norway
16.8%Sweden
16.8%Netherlands
14.8%France
20.3%
Canada
28.2%Germany
30.0%Germany
31.4%
United Kingdom
23.9%Findland
16.1%
w.h.o. says for Developed Nations Cesarean Birth should be between 10 – 15% usa average 32.9% rate As you can see there are no states in the usa that abide by this standard.
w.h.o. says for Developed Nations Cesarean Birth should be between 10 – 15% usa average 32.8%
There have not been any significant decreases in c-sections rates from 1996 – 2009
New Mexico dropped 1% from 2007 – 2009 but increased 22% from 1996 – 2009
Alaska dropped 32% from 2007 – 2009 with a 2% change from 1996 – 2009 Massachusetts dropped .1% from 2007 – 2009
w.h.o. Health StandardsIn November 2012, the board of commissioners of the Joint Commis-sion announced that the perinatal core measure set would now be mandatory for hospitals with more than 1,100 births per year, starting January 1st, 2014. This is the first time in history that the Joint Commission has required a core measure set to be mandatory for a specific type of situation — in this case, any kind of a hospital with more than 1,100 births per year.http://www.cdc.gov/nchs/data/nvsr/nvsr60/nvsr60_02.pdf
Perinatal Core Measurement Mandatory
c-Section Rates that Decreased
World 2009 Cesarean Rates
CT
DE
Kentucky
MA
MS
NH
NJ
RI
Tennessee
VT
Washington
Oregon
California
Alaska
Hawaii
Nevada
Idaho
Montana
Wyoming
Colorado
New Mexico
Texas
Oklahoma
Kansas
Nebraska
South Dakota
Iowa
Wisconsin
Illinois Ohio
Pennsylvania
Michigan
Indiana
Maine
New York
Missouri
Arkansas
North Dakota
Minnesota
Louisiana
Mississippi Alabama Georgia
Florida
Arizona
Utah
29.2
33.8
35.9
29.4
33.0
23.827.0
33.8
24.5
29.6
28.1
26.4
22.8
35.3
34.6
30.1
31.7
26.3
30.3
25.8
31.5 31.131.8
32.1
30.5
29.6
39.4
31.7
34.6
29.3
27.4
39.637.8 35.6
WestVirginia
36
Rhode Island32.8
Connecticut35.6
New Jersey39.4
Maryland33.5
Delaware35.7
New Hampshire30.8
Vermont27.9
Massachusetts33.4
Virginia34.6
33.6
North Carolina31.2
SouthCarolina
35.3
38.1
27.4
22.9
0 – 15%
15 – 20%
20 – 30%
30 – 40%
66
usa 2009 Cesarean Rates
CT
DE
Kentucky
MA
MS
NH
NJ
RI
Tennessee
VT
Washington
Oregon
California
Alaska
Hawaii
Nevada
Idaho
Montana
Wyoming
Colorado
New Mexico
Texas
Oklahoma
Kansas
Nebraska
South Dakota
Iowa
Wisconsin
Illinois Ohio
Pennsylvania
Michigan
Indiana
Maine
New York
Missouri
Arkansas
North Dakota
Minnesota
Louisiana
Mississippi Alabama Georgia
Florida
Arizona
Utah
29.2
33.8
35.9
29.4
33.0
23.827.0
33.8
24.5
29.6
28.1
26.4
22.8
35.3
34.6
30.1
31.7
26.3
30.3
25.8
31.5 31.131.8
32.1
30.5
29.6
39.4
31.7
34.6
29.3
27.4
39.637.8 35.6
WestVirginia
36
Rhode Island32.8
Connecticut35.6
New Jersey39.4
Maryland33.5
Delaware35.7
New Hampshire30.8
Vermont27.9
Massachusetts33.4
Virginia34.6
33.6
North Carolina31.2
SouthCarolina
35.3
38.1
27.4
22.9
0 – 15%
15 – 20%
20 – 30%
30 – 40%
68
usa 2009 Cesarean Rates
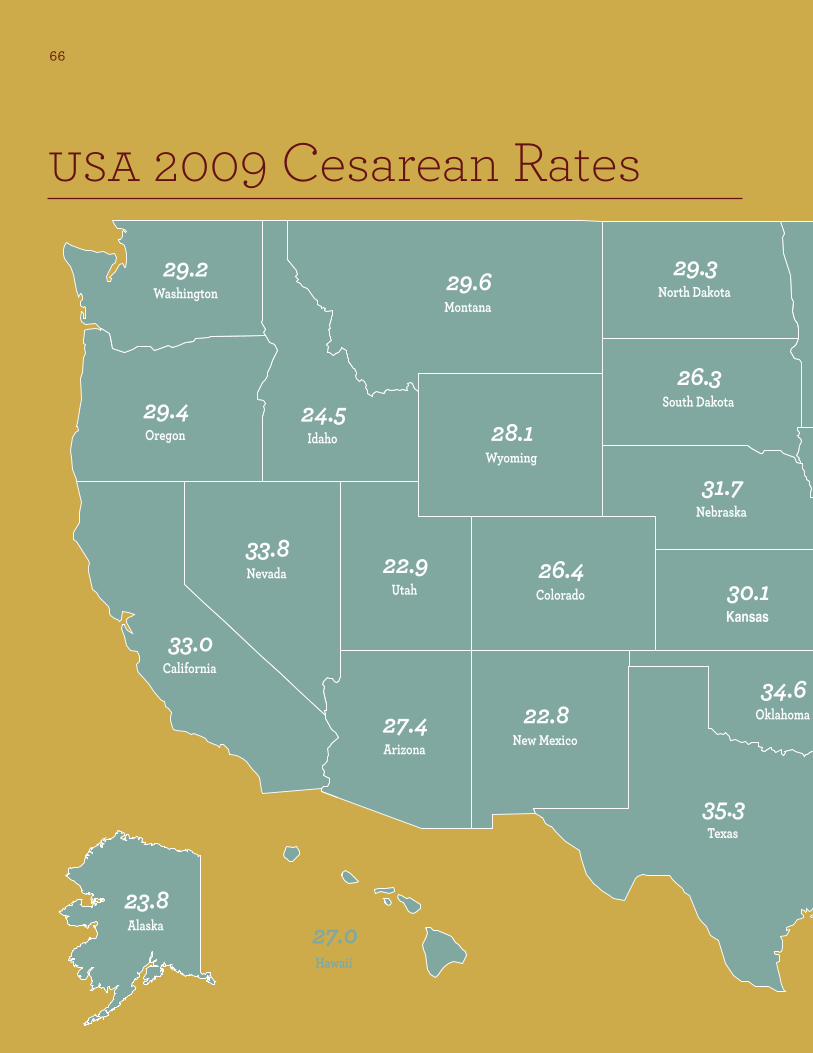
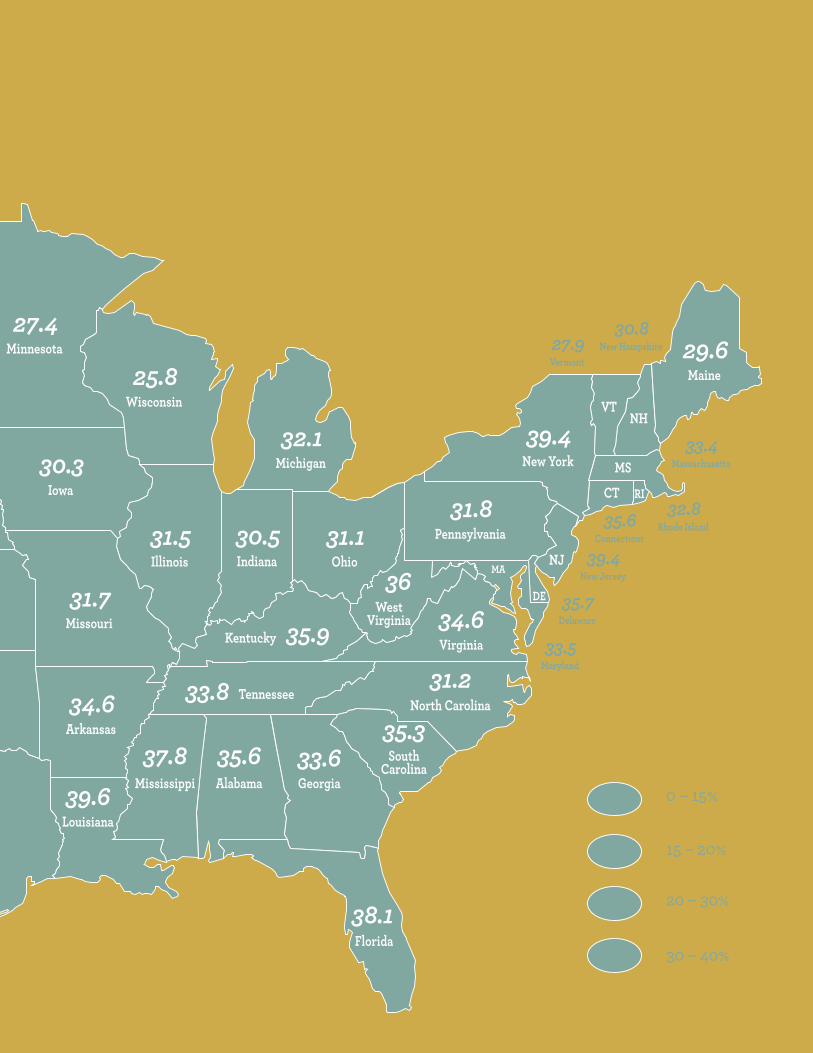
w.h.o. Health Standardsw.h.o. says for Developed Nations Cesarean Birth should be between 10 – 15% usa average 32.9% rate As you can see there are no states in the usa that abide by this standard.
c-section Rates Decreased There have not been any significant decreases in the c-section rates from 1996 – 2009
New Mexico dropped 1% from 2007 – 2009 but increased 22% from 1996 – 2009 Alaska dropped 32% from 2007 – 2009 with a 2% change from 1996 – 2009 Massachusetts dropped .1% from 2007 – 2009

w.h.o. says for Developed Nations Cesarean Birth should be between 10 – 15% usa average 32.9% rate As you can see there are no states in the usa that abide by this standard.
There have not been any significant decreases in c-sections rates from 1996 – 2009
New Mexico dropped 1% from 2007 – 2009 but increased 22% from 1996 – 2009 Alaska dropped 32% from 2007 – 2009 with a 2% change from 1996 – 2009 Massachusetts dropped .1% from 2007 – 2009
Current usa Cesarean Rates 2009
1996 2007 2009 %Change Alabama 20.7 31.8 35.6 41%Alaska 23.3 33.8 23.8 2.0%Arizona 16.7 22.6 27.4 39%Arkansas 16.1 26.2 34.6 53%California 20.6 32.1 33.0 38%Colorado 15.1 25.8 26.4 43%Connecticut 19.8 34.6 35.6 44%Delaware 20.1 32.1 35.7 41%Florida 21.6 37.2 38.1 43%Georgia 20.9 32.0 33.6 38%Hawaii 17.5 26.4 27.0 26%Idaho 16.0 24.0 24.5 24%Illinois 19.3 30.3 31.5 31%Indiana 20.3 29.4 30.5 33%Iowa 18.6 29.4 30.3 29%Kansas 19.2 29.8 30.1 30%Kentucky 21.3 34.6 35.9 35%
1996 2007 2009 %Change Louisiana 26.4 35.9 39.6 39%Maine 20.8 30.0 29.6 29%Maryland 21.6 33.1 33.5 33%Massachusetts 19.8 33.5 33.4 33%Michigan 20.2 30.4 32.1 32%Minnesota 16.9 26.2 27.4 27%Mississippi 26.6 36.2 37.8 37%Missouri 20.4 30.3 31.7 31%Montana 19.1 29.4 29.6 29%Nebraska 19.8 30.9 31.7 31%Nevada 19.3 33.1 33.8 33%New Hampshire 20.3 30.8 30.8 30%New Jersey 24.0 38.8 39.4 39%New Mexico 17.2 23.3 22.8 22%New York 22.9 33.7 39.4 39%North Carolina 21.1 30.7 31.2 31%North Dakota 18.9 28.4 29.3 29%
1996 2007 2009 %Change Oklahoma 22.5 33.6 34.6 34%Oregon 16.9 28.2 29.4 29%Pennsylvania 19.4 30.1 31.8 31%Rhode Island 17.7 32.2 32.9 32%South Carolina 22.6 33.4 35.3 35%South Dakota 20.8 26.6 26.3 26%Tennessee 21.7 33.3 33.8 35%Texas 23.1 33.7 35.3 35%Utah 15.9 22.2 22.9 22%Vermont 16.5 26.6 27.9 27%Virginia 21.1 35.5 34.3 34%Washing ton 16.8 29.0 29%West Virginia 22.8 35.2 36.0 35%Wisconsin 15.6 25.0 25.8 25%Wyoming 18.3 26.9 28.1 28%
w.h.o. Health Standards
c-Section Rates that Decreased
CT
DE
Kentucky
MA
MS
NH
NJ
RI
Tennessee
VT
Washington
Oregon
California
Alaska
Hawaii
Nevada
Idaho
Montana
Wyoming
Colorado
New Mexico
Texas
Oklahoma
Kansas
Nebraska
South Dakota
Iowa
Wisconsin
Illinois Ohio
Pennsylvania
Michigan
Indiana
Maine
New York
Missouri
Arkansas
North Dakota
Minnesota
Louisiana
Mississippi Alabama Georgia
Florida
Arizona
Utah
29.2
33.8
35.9
29.4
33.0
23.827.0
33.8
24.5
29.6
28.1
26.4
22.8
35.3
34.6
30.1
31.7
26.3
30.3
25.8
31.5 31.131.8
32.1
30.5
29.6
39.4
31.7
34.6
29.3
27.4
39.637.8 35.6
WestVirginia
36
Rhode Island32.8
Connecticut35.6
New Jersey39.4
Maryland33.5
Delaware35.7
New Hampshire30.8
Vermont27.9
Massachusetts33.4
Virginia34.6
33.6
North Carolina31.2
SouthCarolina
35.3
38.1
27.4
22.9
0 – 15%
15 – 20%
20 – 30%
30 – 40%
w.h.o. says for Developed Nations Cesarean Birth should be between 10 – 15% usa average 32.8%
w.h.o. says for Developed Nations Cesarean Birth should be between 10 – 15% usa average 32.9% rate As you can see there are no states in the usa that abide by this standard.
There have not been any significant decreases in c-sections rates from 1996 – 2009
New Mexico dropped 1% from 2007 – 2009 but increased 22% from 1996 – 2009 Alaska dropped 32% from 2007 – 2009 with a 2% change from 1996 – 2009 Massachusetts dropped .1% from 2007 – 2009
Current usa Cesarean Rates 2009
1996 2007 2009 %Change Alabama 20.7 31.8 35.6 41%Alaska 23.3 33.8 23.8 2.0%Arizona 16.7 22.6 27.4 39%Arkansas 16.1 26.2 34.6 53%California 20.6 32.1 33.0 38%Colorado 15.1 25.8 26.4 43%Connecticut 19.8 34.6 35.6 44%Delaware 20.1 32.1 35.7 41%Florida 21.6 37.2 38.1 43%Georgia 20.9 32.0 33.6 38%Hawaii 17.5 26.4 27.0 26%Idaho 16.0 24.0 24.5 24%Illinois 19.3 30.3 31.5 31%Indiana 20.3 29.4 30.5 33%Iowa 18.6 29.4 30.3 29%Kansas 19.2 29.8 30.1 30%Kentucky 21.3 34.6 35.9 35%
1996 2007 2009 %Change Louisiana 26.4 35.9 39.6 39%Maine 20.8 30.0 29.6 29%Maryland 21.6 33.1 33.5 33%Massachusetts 19.8 33.5 33.4 33%Michigan 20.2 30.4 32.1 32%Minnesota 16.9 26.2 27.4 27%Mississippi 26.6 36.2 37.8 37%Missouri 20.4 30.3 31.7 31%Montana 19.1 29.4 29.6 29%Nebraska 19.8 30.9 31.7 31%Nevada 19.3 33.1 33.8 33%New Hampshire 20.3 30.8 30.8 30%New Jersey 24.0 38.8 39.4 39%New Mexico 17.2 23.3 22.8 22%New York 22.9 33.7 39.4 39%North Carolina 21.1 30.7 31.2 31%North Dakota 18.9 28.4 29.3 29%
1996 2007 2009 %Change Oklahoma 22.5 33.6 34.6 34%Oregon 16.9 28.2 29.4 29%Pennsylvania 19.4 30.1 31.8 31%Rhode Island 17.7 32.2 32.9 32%South Carolina 22.6 33.4 35.3 35%South Dakota 20.8 26.6 26.3 26%Tennessee 21.7 33.3 33.8 35%Texas 23.1 33.7 35.3 35%Utah 15.9 22.2 22.9 22%Vermont 16.5 26.6 27.9 27%Virginia 21.1 35.5 34.3 34%Washing ton 16.8 29.0 29%West Virginia 22.8 35.2 36.0 35%Wisconsin 15.6 25.0 25.8 25%Wyoming 18.3 26.9 28.1 28%
w.h.o. Health Standards
c-Section Rates that Decreased
CT
DE
Kentucky
MA
MS
NH
NJ
RI
Tennessee
VT
Washington
Oregon
California
Alaska
Hawaii
Nevada
Idaho
Montana
Wyoming
Colorado
New Mexico
Texas
Oklahoma
Kansas
Nebraska
South Dakota
Iowa
Wisconsin
Illinois Ohio
Pennsylvania
Michigan
Indiana
Maine
New York
Missouri
Arkansas
North Dakota
Minnesota
Louisiana
Mississippi Alabama Georgia
Florida
Arizona
Utah
29.2
33.8
35.9
29.4
33.0
23.827.0
33.8
24.5
29.6
28.1
26.4
22.8
35.3
34.6
30.1
31.7
26.3
30.3
25.8
31.5 31.131.8
32.1
30.5
29.6
39.4
31.7
34.6
29.3
27.4
39.637.8 35.6
WestVirginia
36
Rhode Island32.8
Connecticut35.6
New Jersey39.4
Maryland33.5
Delaware35.7
New Hampshire30.8
Vermont27.9
Massachusetts33.4
Virginia34.6
33.6
North Carolina31.2
SouthCarolina
35.3
38.1
27.4
22.9
0 – 15%
15 – 20%
20 – 30%
30 – 40%
w.h.o. says for Developed Nations Cesarean Birth should be between 10 – 15% usa average 32.8%w.h.o. says for Developed Nations Cesarean Birth should be between 10 – 15% usa average 32.9% rate As you can see there are no states in the usa that abide by this standard.
There have not been any significant decreases in c-sections rates from 1996 – 2009
New Mexico dropped 1% from 2007 – 2009 but increased 22% from 1996 – 2009 Alaska dropped 32% from 2007 – 2009 with a 2% change from 1996 – 2009 Massachusetts dropped .1% from 2007 – 2009
Current usa Cesarean Rates 2009
1996 2007 2009 %Change Alabama 20.7 31.8 35.6 41%Alaska 23.3 33.8 23.8 2.0%Arizona 16.7 22.6 27.4 39%Arkansas 16.1 26.2 34.6 53%California 20.6 32.1 33.0 38%Colorado 15.1 25.8 26.4 43%Connecticut 19.8 34.6 35.6 44%Delaware 20.1 32.1 35.7 41%Florida 21.6 37.2 38.1 43%Georgia 20.9 32.0 33.6 38%Hawaii 17.5 26.4 27.0 26%Idaho 16.0 24.0 24.5 24%Illinois 19.3 30.3 31.5 31%Indiana 20.3 29.4 30.5 33%Iowa 18.6 29.4 30.3 29%Kansas 19.2 29.8 30.1 30%Kentucky 21.3 34.6 35.9 35%
1996 2007 2009 %Change Louisiana 26.4 35.9 39.6 39%Maine 20.8 30.0 29.6 29%Maryland 21.6 33.1 33.5 33%Massachusetts 19.8 33.5 33.4 33%Michigan 20.2 30.4 32.1 32%Minnesota 16.9 26.2 27.4 27%Mississippi 26.6 36.2 37.8 37%Missouri 20.4 30.3 31.7 31%Montana 19.1 29.4 29.6 29%Nebraska 19.8 30.9 31.7 31%Nevada 19.3 33.1 33.8 33%New Hampshire 20.3 30.8 30.8 30%New Jersey 24.0 38.8 39.4 39%New Mexico 17.2 23.3 22.8 22%New York 22.9 33.7 39.4 39%North Carolina 21.1 30.7 31.2 31%North Dakota 18.9 28.4 29.3 29%
1996 2007 2009 %Change Oklahoma 22.5 33.6 34.6 34%Oregon 16.9 28.2 29.4 29%Pennsylvania 19.4 30.1 31.8 31%Rhode Island 17.7 32.2 32.9 32%South Carolina 22.6 33.4 35.3 35%South Dakota 20.8 26.6 26.3 26%Tennessee 21.7 33.3 33.8 35%Texas 23.1 33.7 35.3 35%Utah 15.9 22.2 22.9 22%Vermont 16.5 26.6 27.9 27%Virginia 21.1 35.5 34.3 34%Washing ton 16.8 29.0 29%West Virginia 22.8 35.2 36.0 35%Wisconsin 15.6 25.0 25.8 25%Wyoming 18.3 26.9 28.1 28%
w.h.o. Health Standards
c-Section Rates that Decreased
CT
DE
Kentucky
MA
MS
NH
NJ
RI
Tennessee
VT
Washington
Oregon
California
Alaska
Hawaii
Nevada
Idaho
Montana
Wyoming
Colorado
New Mexico
Texas
Oklahoma
Kansas
Nebraska
South Dakota
Iowa
Wisconsin
Illinois Ohio
Pennsylvania
Michigan
Indiana
Maine
New York
Missouri
Arkansas
North Dakota
Minnesota
Louisiana
Mississippi Alabama Georgia
Florida
Arizona
Utah
29.2
33.8
35.9
29.4
33.0
23.827.0
33.8
24.5
29.6
28.1
26.4
22.8
35.3
34.6
30.1
31.7
26.3
30.3
25.8
31.5 31.131.8
32.1
30.5
29.6
39.4
31.7
34.6
29.3
27.4
39.637.8 35.6
WestVirginia
36
Rhode Island32.8
Connecticut35.6
New Jersey39.4
Maryland33.5
Delaware35.7
New Hampshire30.8
Vermont27.9
Massachusetts33.4
Virginia34.6
33.6
North Carolina31.2
SouthCarolina
35.3
38.1
27.4
22.9
0 – 15%
15 – 20%
20 – 30%
30 – 40%
w.h.o. says for Developed Nations Cesarean Birth should be between 10 – 15% usa average 32.8%
w.h.o. says for Developed Nations Cesarean Birth should be between 10 – 15% usa average 32.9% rate As you can see there are no states in the usa that abide by this standard.
There have not been any significant decreases in c-sections rates from 1996 – 2009
New Mexico dropped 1% from 2007 – 2009 but increased 22% from 1996 – 2009 Alaska dropped 32% from 2007 – 2009 with a 2% change from 1996 – 2009 Massachusetts dropped .1% from 2007 – 2009
Current usa Cesarean Rates 2009
1996 2007 2009 %Change Alabama 20.7 31.8 35.6 41%Alaska 23.3 33.8 23.8 2.0%Arizona 16.7 22.6 27.4 39%Arkansas 16.1 26.2 34.6 53%California 20.6 32.1 33.0 38%Colorado 15.1 25.8 26.4 43%Connecticut 19.8 34.6 35.6 44%Delaware 20.1 32.1 35.7 41%Florida 21.6 37.2 38.1 43%Georgia 20.9 32.0 33.6 38%Hawaii 17.5 26.4 27.0 26%Idaho 16.0 24.0 24.5 24%Illinois 19.3 30.3 31.5 31%Indiana 20.3 29.4 30.5 33%Iowa 18.6 29.4 30.3 29%Kansas 19.2 29.8 30.1 30%Kentucky 21.3 34.6 35.9 35%
1996 2007 2009 %Change Louisiana 26.4 35.9 39.6 39%Maine 20.8 30.0 29.6 29%Maryland 21.6 33.1 33.5 33%Massachusetts 19.8 33.5 33.4 33%Michigan 20.2 30.4 32.1 32%Minnesota 16.9 26.2 27.4 27%Mississippi 26.6 36.2 37.8 37%Missouri 20.4 30.3 31.7 31%Montana 19.1 29.4 29.6 29%Nebraska 19.8 30.9 31.7 31%Nevada 19.3 33.1 33.8 33%New Hampshire 20.3 30.8 30.8 30%New Jersey 24.0 38.8 39.4 39%New Mexico 17.2 23.3 22.8 22%New York 22.9 33.7 39.4 39%North Carolina 21.1 30.7 31.2 31%North Dakota 18.9 28.4 29.3 29%
1996 2007 2009 %Change Oklahoma 22.5 33.6 34.6 34%Oregon 16.9 28.2 29.4 29%Pennsylvania 19.4 30.1 31.8 31%Rhode Island 17.7 32.2 32.9 32%South Carolina 22.6 33.4 35.3 35%South Dakota 20.8 26.6 26.3 26%Tennessee 21.7 33.3 33.8 35%Texas 23.1 33.7 35.3 35%Utah 15.9 22.2 22.9 22%Vermont 16.5 26.6 27.9 27%Virginia 21.1 35.5 34.3 34%Washing ton 16.8 29.0 29%West Virginia 22.8 35.2 36.0 35%Wisconsin 15.6 25.0 25.8 25%Wyoming 18.3 26.9 28.1 28%
w.h.o. Health Standards
c-Section Rates that Decreased
CT
DE
Kentucky
MA
MS
NH
NJ
RI
Tennessee
VT
Washington
Oregon
California
Alaska
Hawaii
Nevada
Idaho
Montana
Wyoming
Colorado
New Mexico
Texas
Oklahoma
Kansas
Nebraska
South Dakota
Iowa
Wisconsin
Illinois Ohio
Pennsylvania
Michigan
Indiana
Maine
New York
Missouri
Arkansas
North Dakota
Minnesota
Louisiana
Mississippi Alabama Georgia
Florida
Arizona
Utah
29.2
33.8
35.9
29.4
33.0
23.827.0
33.8
24.5
29.6
28.1
26.4
22.8
35.3
34.6
30.1
31.7
26.3
30.3
25.8
31.5 31.131.8
32.1
30.5
29.6
39.4
31.7
34.6
29.3
27.4
39.637.8 35.6
WestVirginia
36
Rhode Island32.8
Connecticut35.6
New Jersey39.4
Maryland33.5
Delaware35.7
New Hampshire30.8
Vermont27.9
Massachusetts33.4
Virginia34.6
33.6
North Carolina31.2
SouthCarolina
35.3
38.1
27.4
22.9
0 – 15%
15 – 20%
20 – 30%
30 – 40%
w.h.o. says for Developed Nations Cesarean Birth should be between 10 – 15% usa average 32.8%
69
w.h.o. says for Developed Nations Cesarean Birth should be between 10 – 15% usa average 32.8%
70
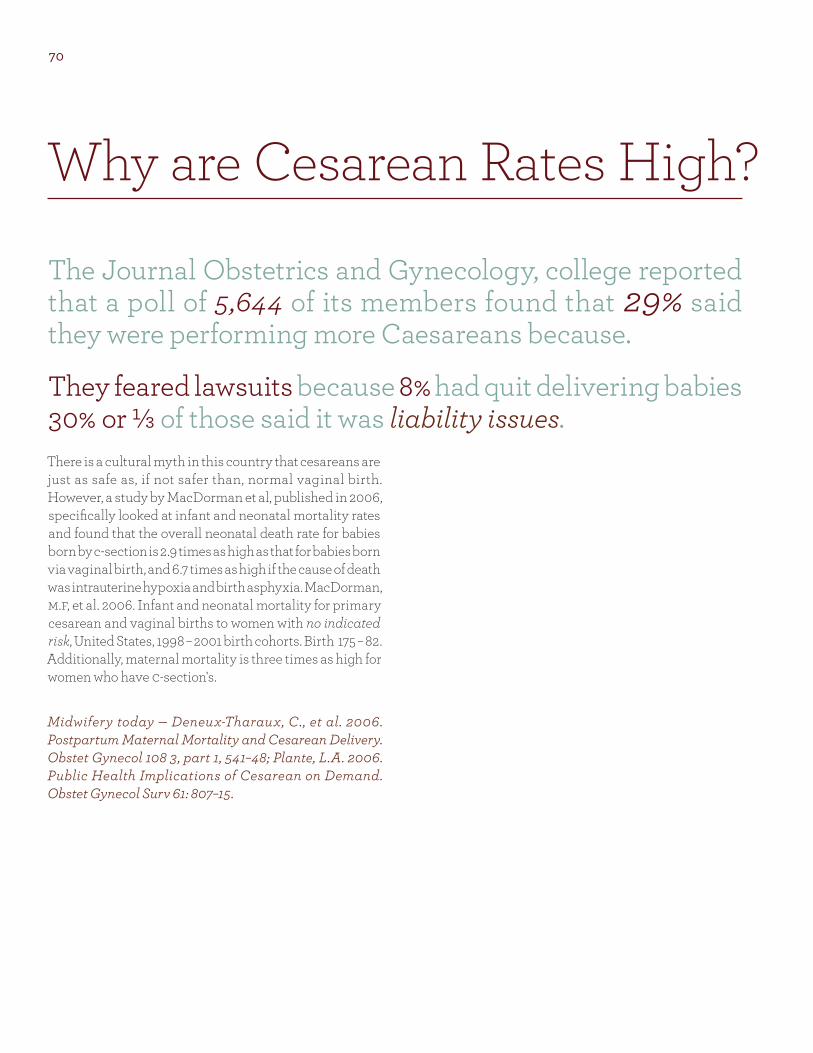
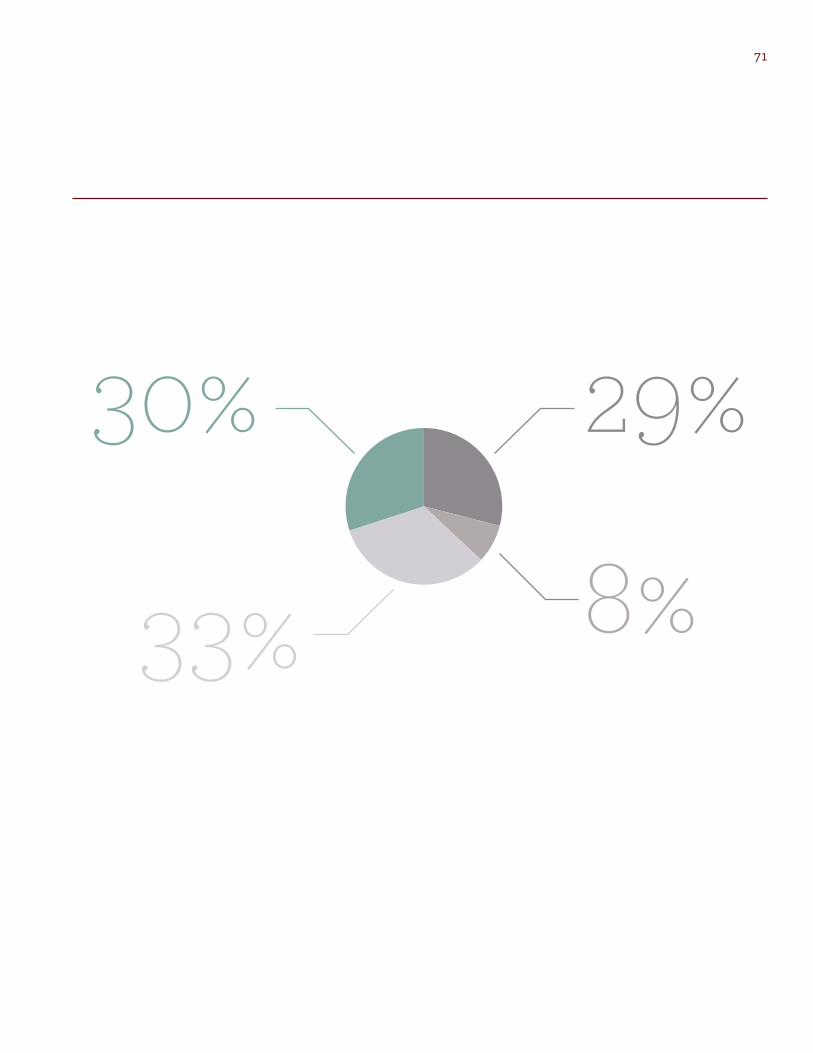
The Journal Obstetrics and Gynecology, college reported that a poll of 5,644 of its members found that 29% said they were performing more Caesareans because.
They feared lawsuits because 8% had quit delivering babies 30% or L of those said it was liability issues.
Why are Cesarean Rates High?
There is a cultural myth in this country that cesareans are just as safe as, if not safer than, normal vaginal birth. However, a study by MacDorman et al, published in 2006, specifically looked at infant and neonatal mortality rates and found that the overall neonatal death rate for babies born by c-section is 2.9 times as high as that for babies born via vaginal birth, and 6.7 times as high if the cause of death was intrauterine hypoxia and birth asphyxia. MacDorman, m.f, et al. 2006. Infant and neonatal mortality for primary cesarean and vaginal births to women with no indicated risk, United States, 1998 – 2001 birth cohorts. Birth 175 – 82. Additionally, maternal mortality is three times as high for women who have c-section's.
Midwifery today — Deneux-Tharaux, C., et al. 2006. Postpartum Maternal Mortality and Cesarean Delivery. Obstet Gynecol 108 3, part 1, 541–48; Plante, L.A. 2006. Public Health Implications of Cesarean on Demand. Obstet Gynecol Surv 61: 807–15.
+29+8+33+3029%
8%33%
30%
71
+98+2 +82+18
72
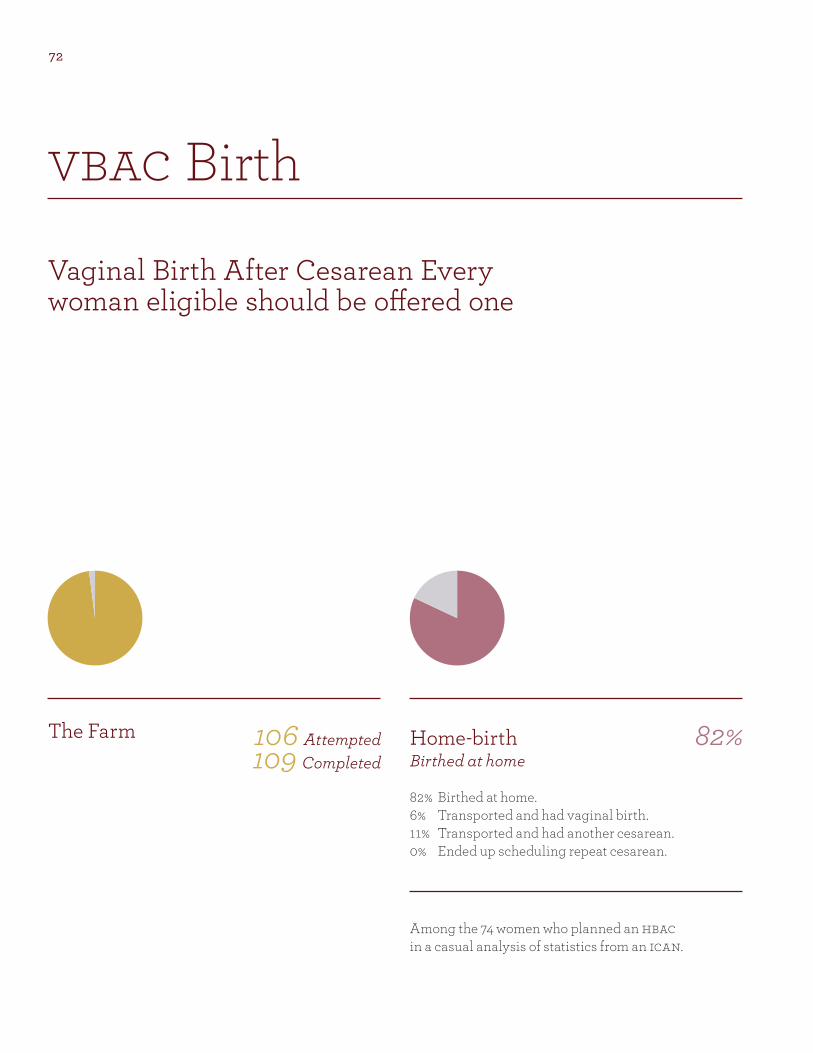
The Farm Home-birth Birthed at home
82% Birthed at home. 6% Transported and had vaginal birth. 11% Transported and had another cesarean. 0% Ended up scheduling repeat cesarean.
Vaginal Birth After Cesarean Every woman eligible should be offered one
vbac Birth
Among the 74 women who planned an hbac in a casual analysis of statistics from an ican.
106 Attempted 109 Completed
82%
+87+13 +92+8 +35+65
73
Birth-Centers allowed or appropriate for home-birth
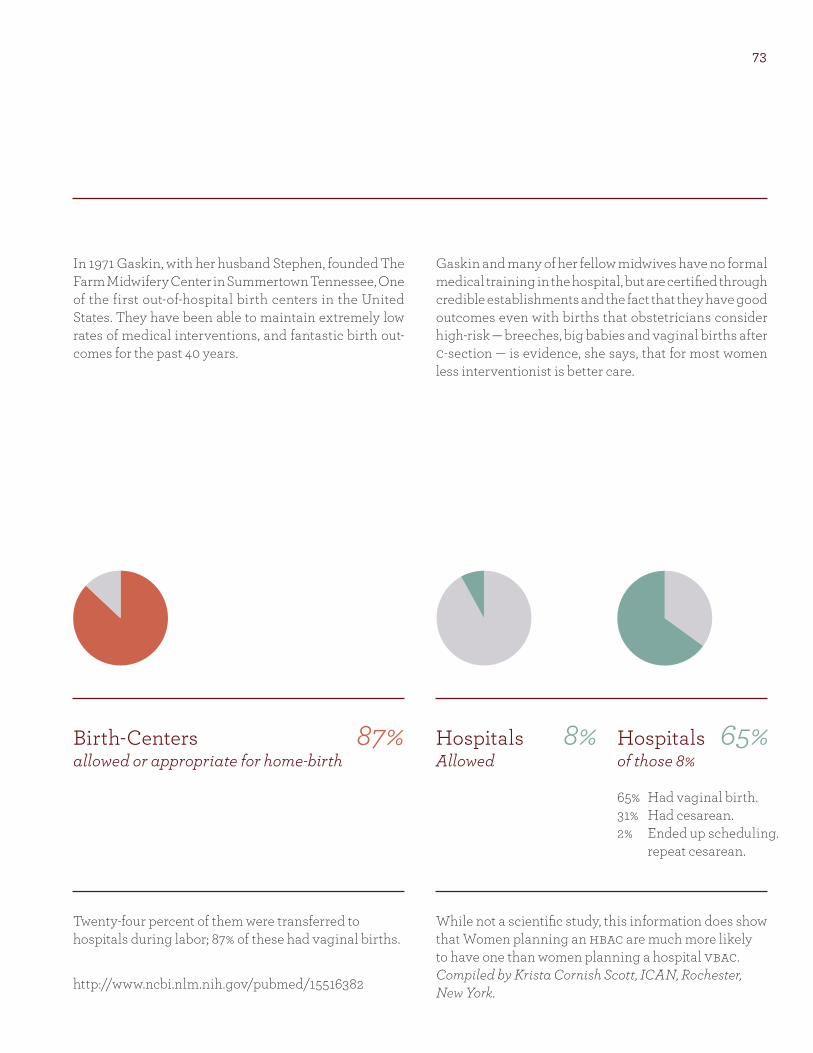
Twenty-four percent of them were transferred to hospitals during labor; 87% of these had vaginal births.
http://www.ncbi.nlm.nih.gov/pubmed/15516382
Hospitals 8% Allowed
Hospitals 65% of those 8%
65% Had vaginal birth. 31% Had cesarean. 2% Ended up scheduling. repeat cesarean.
In 1971 Gaskin, with her husband Stephen, founded The Farm Midwifery Center in Summertown Tennessee, One of the first out-of-hospital birth centers in the United States. They have been able to maintain extremely low rates of medical interventions, and fantastic birth out-comes for the past 40 years.
Gaskin and many of her fellow midwives have no formal medical training in the hospital, but are certified through credible establishments and the fact that they have good outcomes even with births that obstetricians consider high-risk — breeches, big babies and vaginal births after c-section — is evidence, she says, that for most women less interventionist is better care.
While not a scientific study, this information does show that Women planning an hbac are much more likely to have one than women planning a hospital vbac. Compiled by Krista Cornish Scott, ICAN, Rochester, New York.
87%
vbac Birth
74
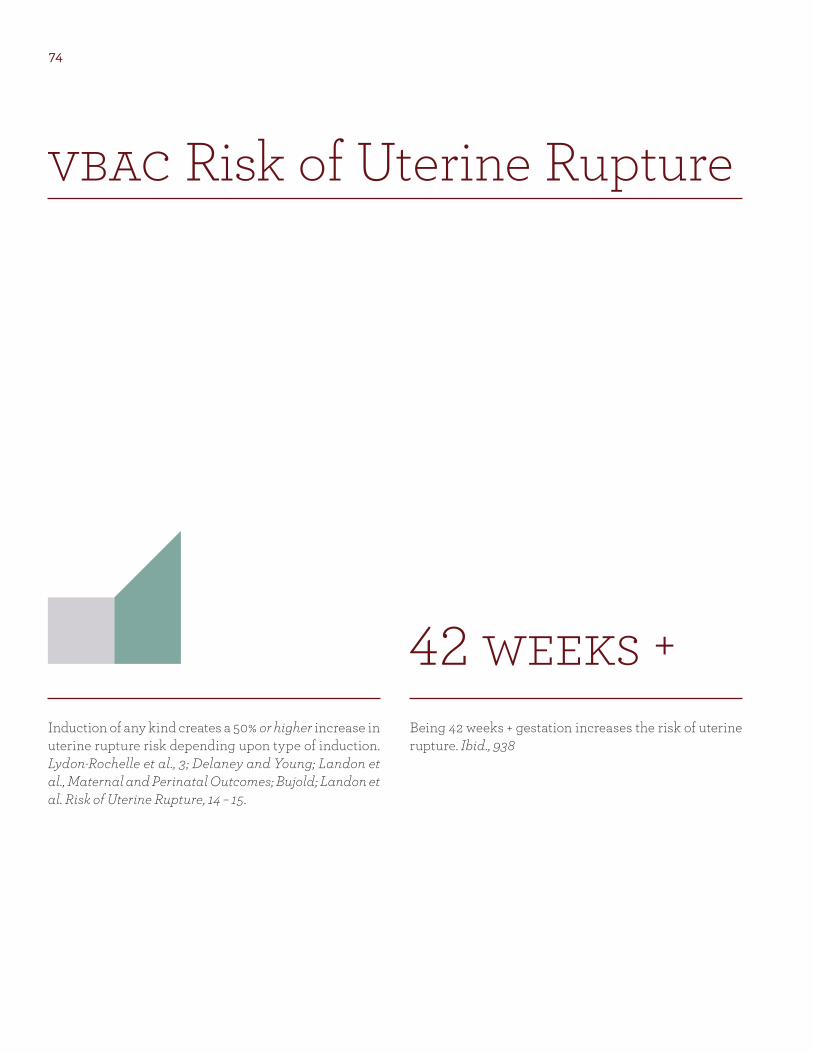
vbac Risk of Uterine Rupture
42 weeks ++50+100Induction of any kind creates a 50% or higher increase in uterine rupture risk depending upon type of induction. Lydon-Rochelle et al., 3; Delaney and Young; Landon et al., Maternal and Perinatal Outcomes; Bujold; Landon et al. Risk of Uterine Rupture, 14 – 15.
Being 42 weeks + gestation increases the risk of uterine rupture. Ibid., 938
75
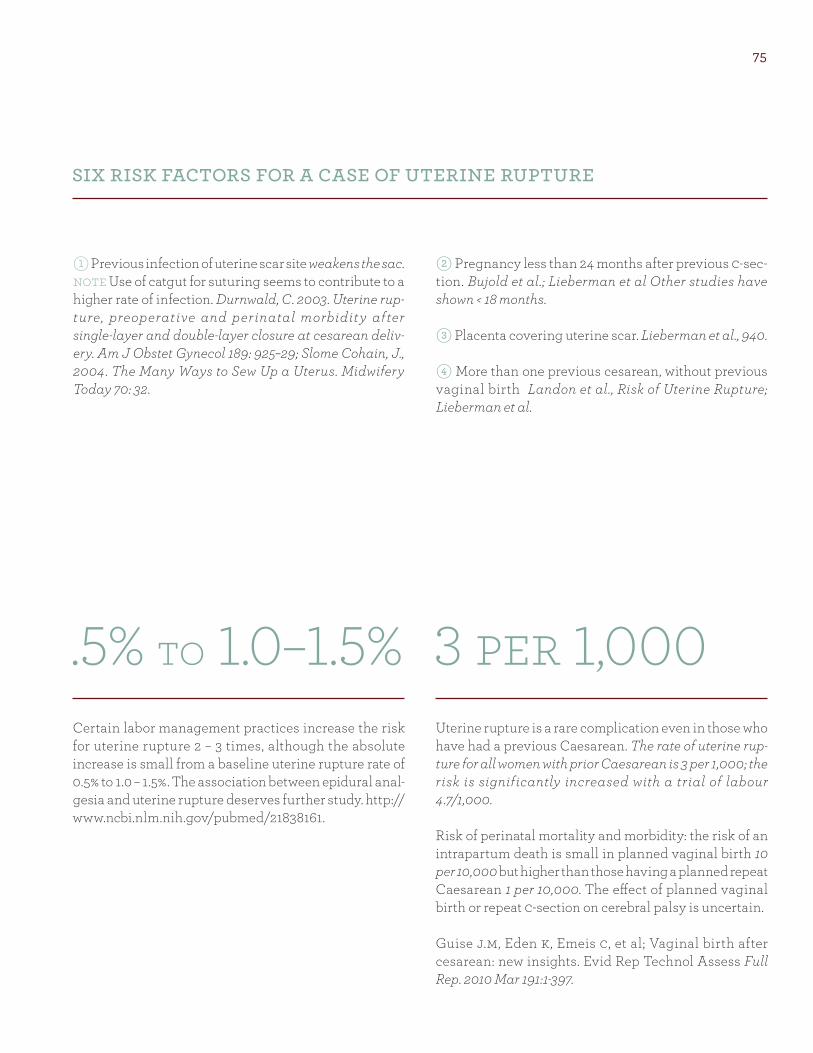
.5% to 1.0–1.5% 3 per 1,000Certain labor management practices increase the risk for uterine rupture 2 – 3 times, although the absolute increase is small from a baseline uterine rupture rate of 0.5% to 1.0 – 1.5%. The association between epidural anal-gesia and uterine rupture deserves further study. http://www.ncbi.nlm.nih.gov/pubmed/21838161.
Uterine rupture is a rare complication even in those who have had a previous Caesarean. The rate of uterine rup-ture for all women with prior Caesarean is 3 per 1,000; the risk is significantly increased with a trial of labour 4.7/1,000.
Risk of perinatal mortality and morbidity: the risk of an intrapartum death is small in planned vaginal birth 10 per 10,000 but higher than those having a planned repeat Caesarean 1 per 10,000. The effect of planned vaginal birth or repeat c-section on cerebral palsy is uncertain.
Guise j.m, Eden k , Emeis c, et al; Vaginal birth after cesarean: new insights. Evid Rep Technol Assess Full Rep. 2010 Mar 191:1-397.
six risk factors for a case of uterine rupture
1 Previous infection of uterine scar site weakens the sac. note Use of catgut for suturing seems to contribute to a higher rate of infection. Durnwald, C. 2003. Uterine rup-ture, preoperative and perinatal morbidit y after single-layer and double-layer closure at cesarean deliv-ery. Am J Obstet Gynecol 189: 925–29; Slome Cohain, J., 2004. The Many Ways to Sew Up a Uterus. Midwifery Today 70: 32.
2 Pregnancy less than 24 months after previous c-sec-tion. Bujold et al.; Lieberman et al Other studies have shown < 18 months.
3 Placenta covering uterine scar. Lieberman et al., 940.
4 More than one previous cesarean, without previous vaginal birth Landon et al., Risk of Uterine Rupture; Lieberman et al.
+1+99 +1+99
76
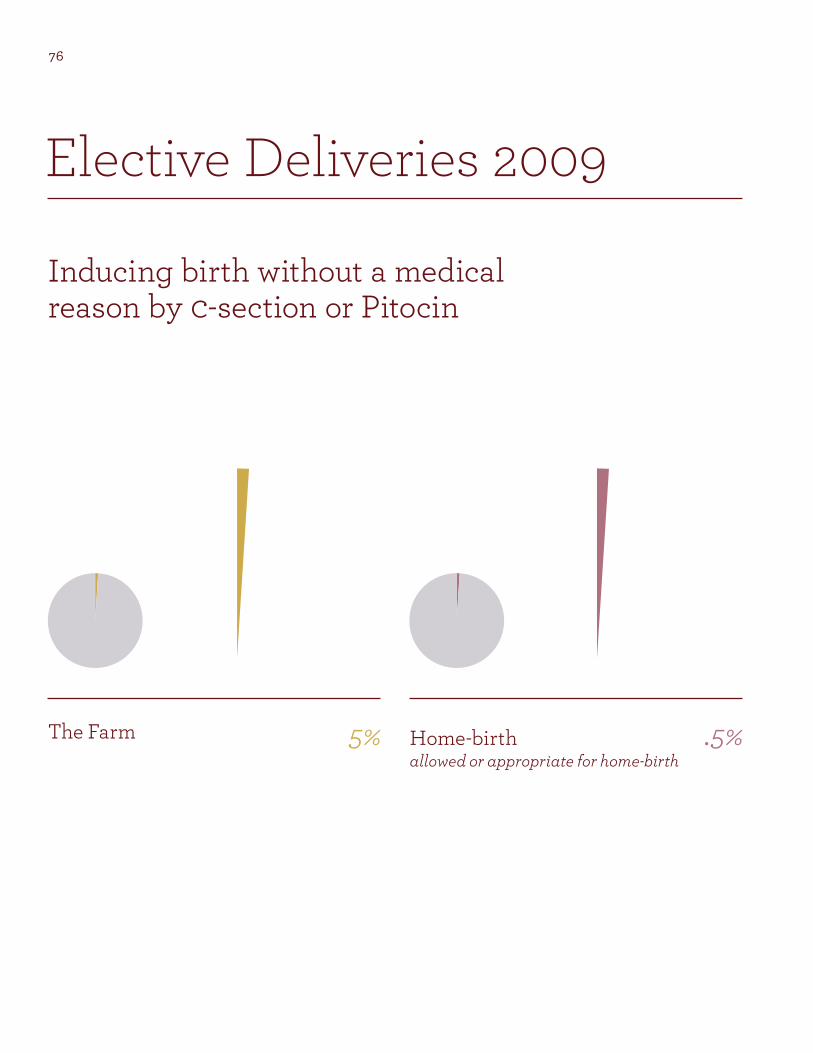
The Farm Home-birth allowed or appropriate for home-birth
Inducing birth without a medical reason by c-section or Pitocin
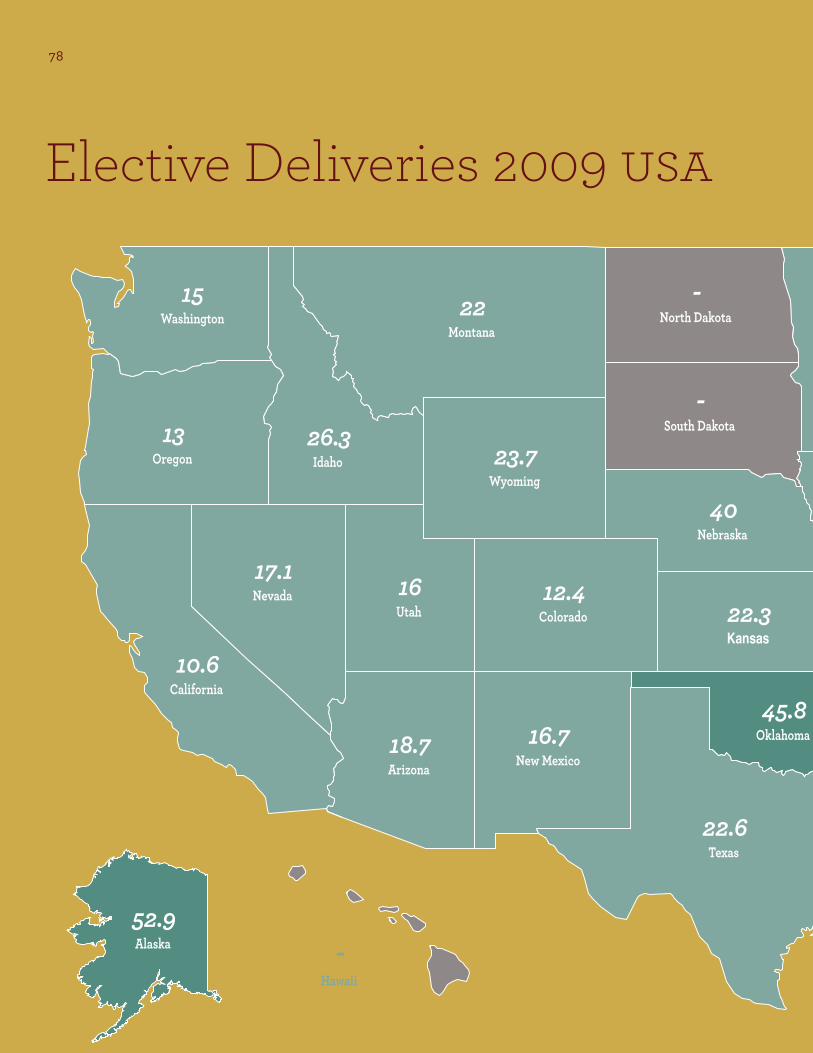
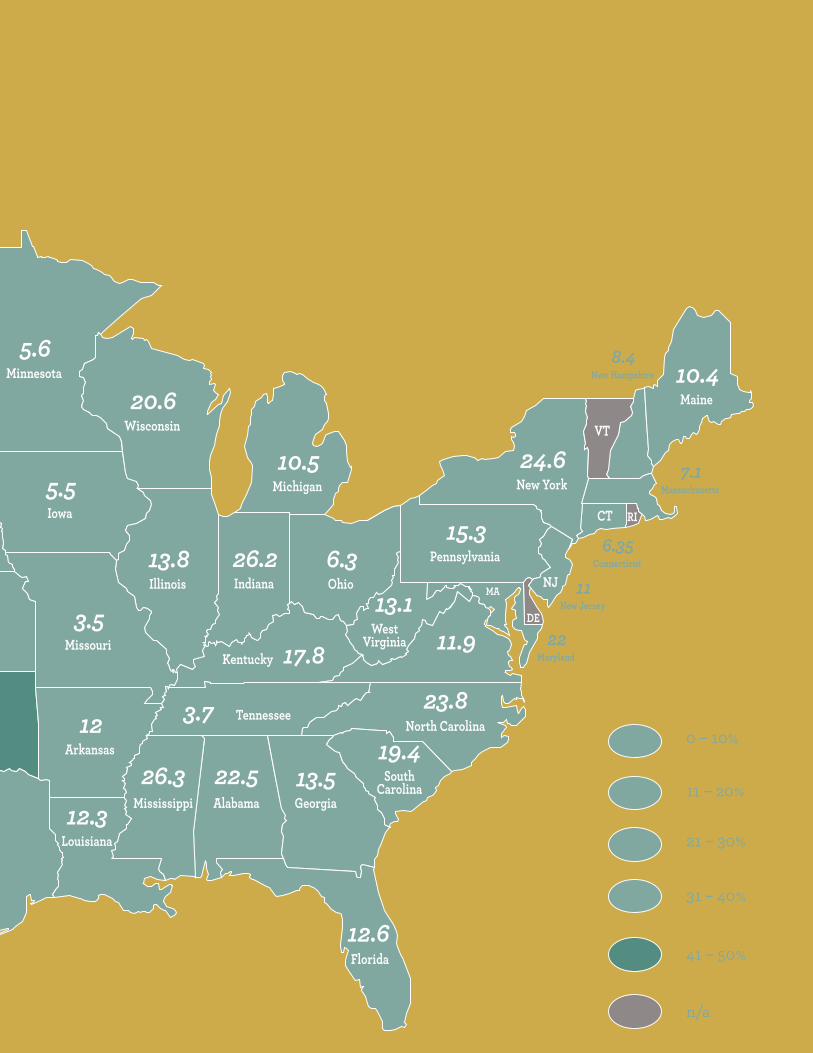
Elective Deliveries 2009
5% .5%
+15+85+1+99
77
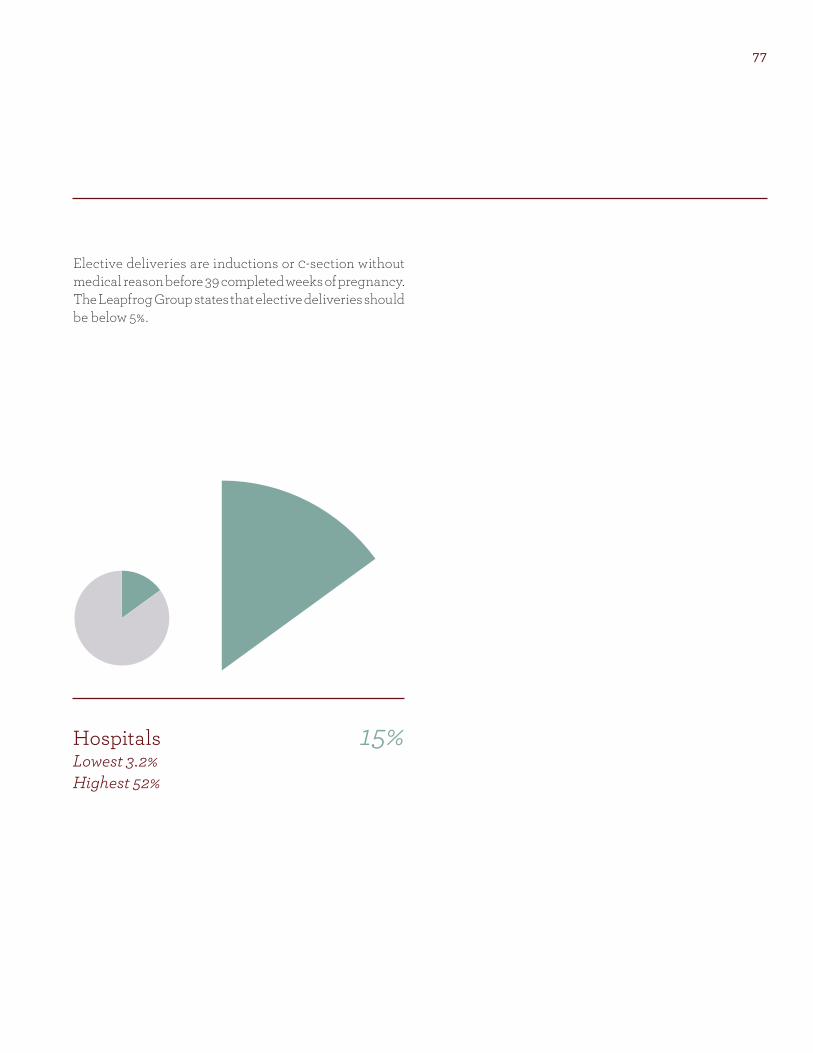
Hospitals Lowest 3.2% Highest 52%
Elective deliveries are inductions or c-section without medical reason before 39 completed weeks of pregnancy. The Leapfrog Group states that elective deliveries should be below 5%.
15%
CT
DE
Kentucky
MA
MS
NH
NJ
RI
Tennessee
VT
Washington
Oregon
California
Alaska
Hawaii
Nevada
Idaho
Montana
Wyoming
Colorado
New Mexico
Texas
Oklahoma
Kansas
Nebraska
South Dakota
Iowa
Wisconsin
Illinois Ohio
Pennsylvania
Michigan
Indiana
Maine
New York
Missouri
Arkansas
North Dakota
Minnesota
Louisiana
Mississippi Alabama Georgia
Florida
Arizona
Utah
15
3.7
17.8
13
10.6
52.9-
17.1
26.3
22
23.7
12.4
16.7
22.6
45.8
22.3
40
-
5.5
20.6
13.8 6.315.3
10.5
26.2
10.4
24.6
3.5
12
-
5.6
12.326.3 22.5
WestVirginia
13.1
Connecticut6.35
New Jersey11
Maryland22
New Hampshire8.4
Massachusetts7.1
Virginia11.9
13.5
North Carolina23.8
SouthCarolina
19.4
12.6
18.7
16
0 – 10%
11 – 20%
21 – 30%
31 – 40%
41 – 50%
n/a
78
Elective Deliveries 2009 usa
CT
DE
Kentucky
MA
MS
NH
NJ
RI
Tennessee
VT
Washington
Oregon
California
Alaska
Hawaii
Nevada
Idaho
Montana
Wyoming
Colorado
New Mexico
Texas
Oklahoma
Kansas
Nebraska
South Dakota
Iowa
Wisconsin
Illinois Ohio
Pennsylvania
Michigan
Indiana
Maine
New York
Missouri
Arkansas
North Dakota
Minnesota
Louisiana
Mississippi Alabama Georgia
Florida
Arizona
Utah
15
3.7
17.8
13
10.6
52.9-
17.1
26.3
22
23.7
12.4
16.7
22.6
45.8
22.3
40
-
5.5
20.6
13.8 6.315.3
10.5
26.2
10.4
24.6
3.5
12
-
5.6
12.326.3 22.5
WestVirginia
13.1
Connecticut6.35
New Jersey11
Maryland22
New Hampshire8.4
Massachusetts7.1
Virginia11.9
13.5
North Carolina23.8
SouthCarolina
19.4
12.6
18.7
16
0 – 10%
11 – 20%
21 – 30%
31 – 40%
41 – 50%
n/a
80
80% of births in the usa that happen in hospitals are born m – f before 4pm.cdc 2008
Delivery Day of the Week
81
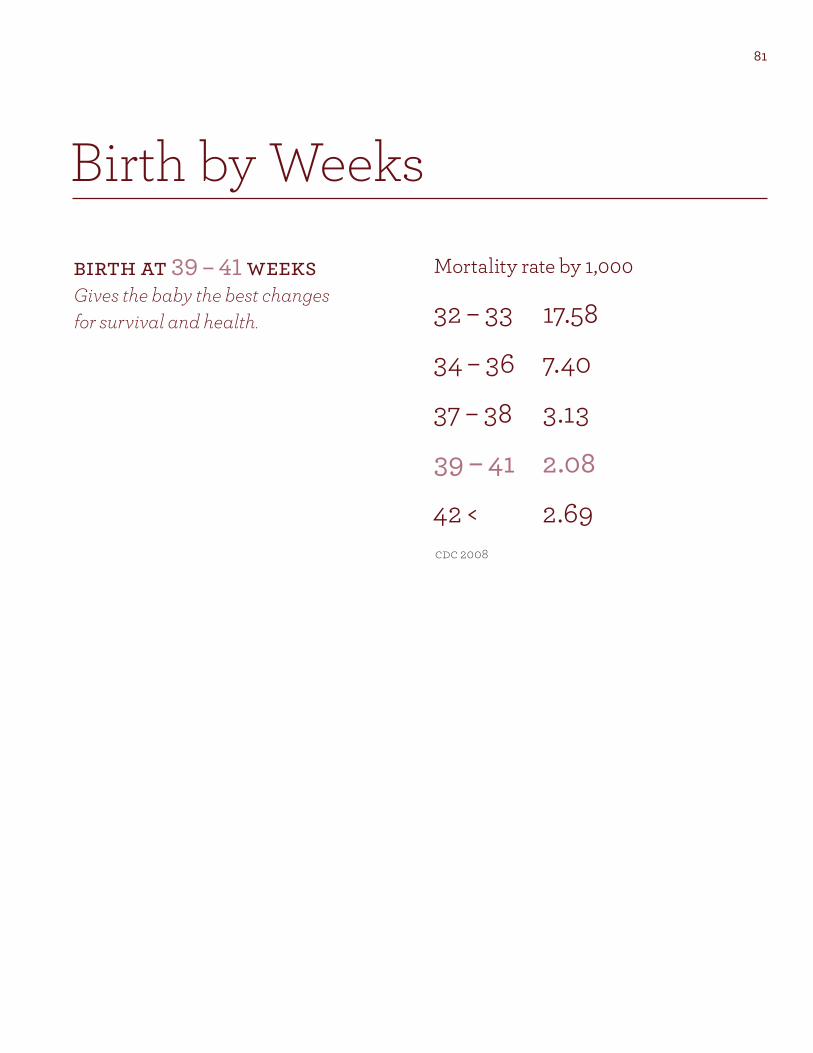
Birth by Weeks
birth at 39 – 41 weeks Gives the baby the best changes for survival and health.
Mortality rate by 1,000
32 – 33 17.58
34 – 36 7.40
37 – 38 3.13
39 – 41 2.08
42 < 2.69cdc 2008
+1+99 +12+88
82
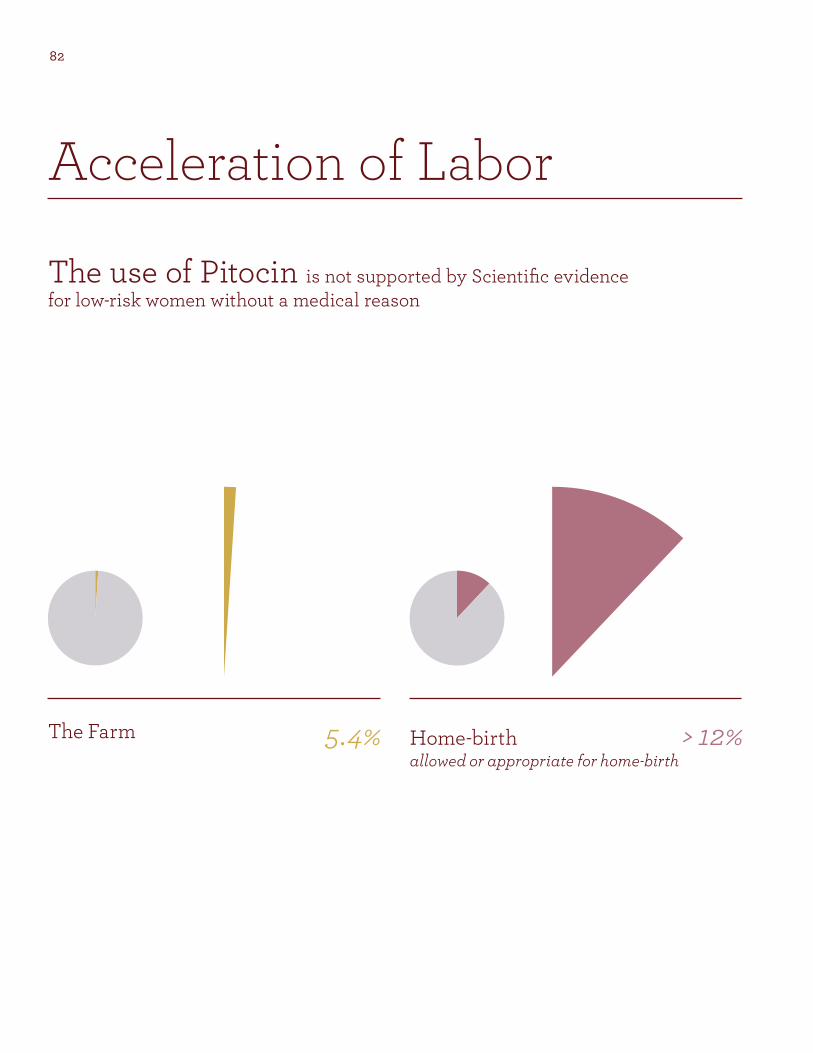
The Farm Home-birth allowed or appropriate for home-birth
The use of Pitocin is not supported by Scientific evidence for low-risk women without a medical reason
Acceleration of Labor
5.4% > 12%
+7+93 +47+53 +
83
Birth-Centers allowed or appropriate for home-birth
Hospitals Lowest 3.2% Highest 52%
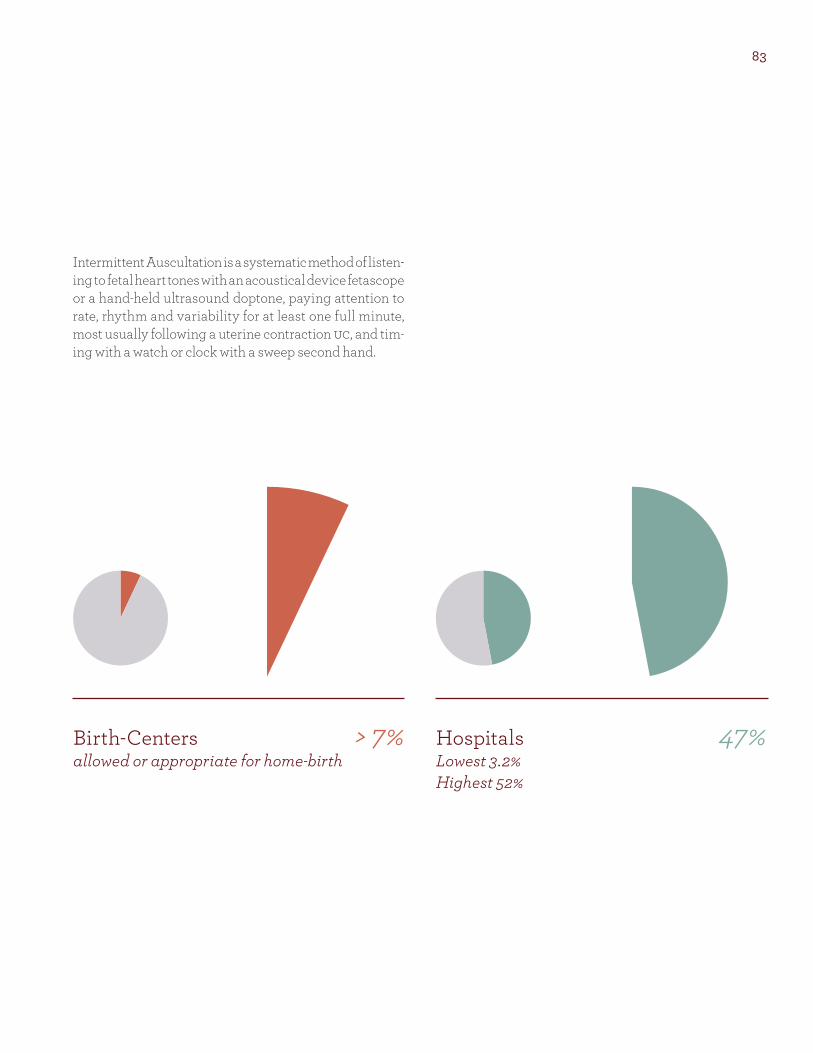
> 7% 47%
Intermittent Auscultation is a systematic method of listen-ing to fetal heart tones with an acoustical device fetascope or a hand-held ultrasound doptone, paying attention to rate, rhythm and variability for at least one full minute, most usually following a uterine contraction uc, and tim-ing with a watch or clock with a sweep second hand.

Birth
All things birth should be Evidence Based


86
The Farm Home-birth allowed or appropriate for home-birth
Not supported by Scientific Evidence
efm monitoring
> 0% > 0%
+94+6
87
Birth-Centers allowed or appropriate for home-birth
Hospitals Lowest 3.2% Highest 52%
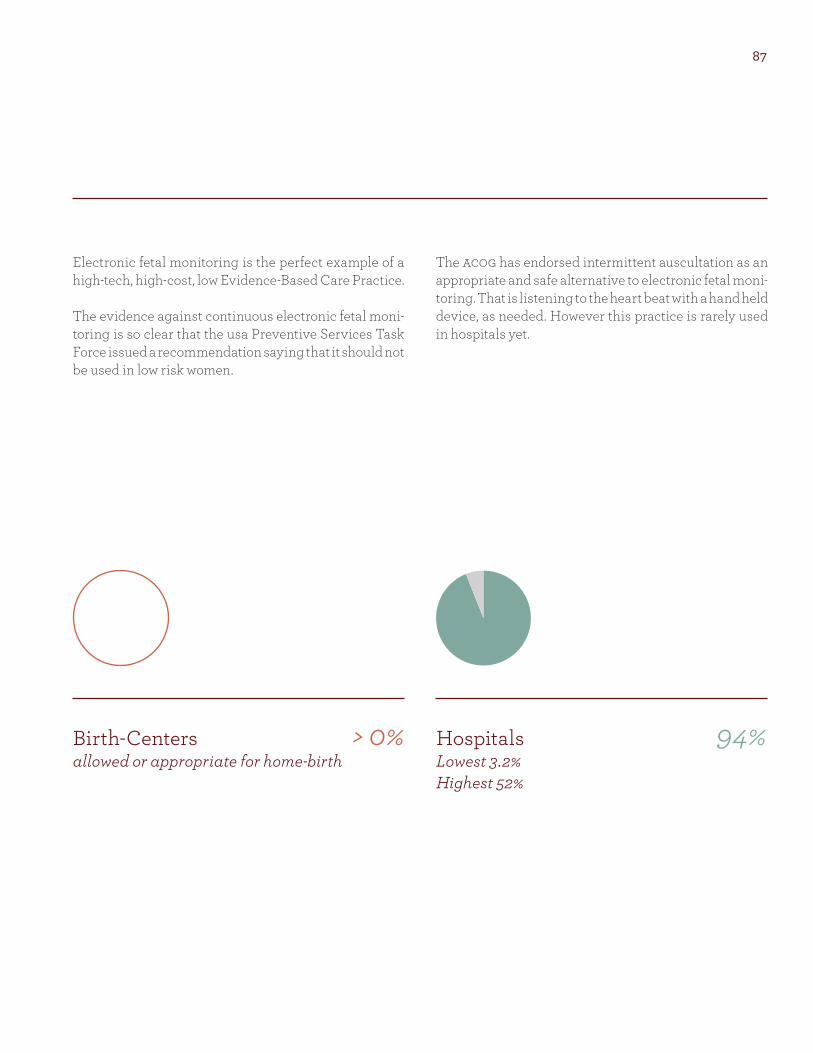
Electronic fetal monitoring is the perfect example of a high-tech, high-cost, low Evidence-Based Care Practice.
The evidence against continuous electronic fetal moni-toring is so clear that the usa Preventive Services Task Force issued a recommendation saying that it should not be used in low risk women.
The acog has endorsed intermittent auscultation as an appropriate and safe alternative to electronic fetal moni-toring. That is listening to the heart beat with a hand held device, as needed. However this practice is rarely used in hospitals yet.
> 0% 94%

+1+99 +1+99
88
The Farm Home-birth allowed or appropriate for home-birth
Not supported by Scientific Evidence
Breaking of the Waters
.5% > .5%
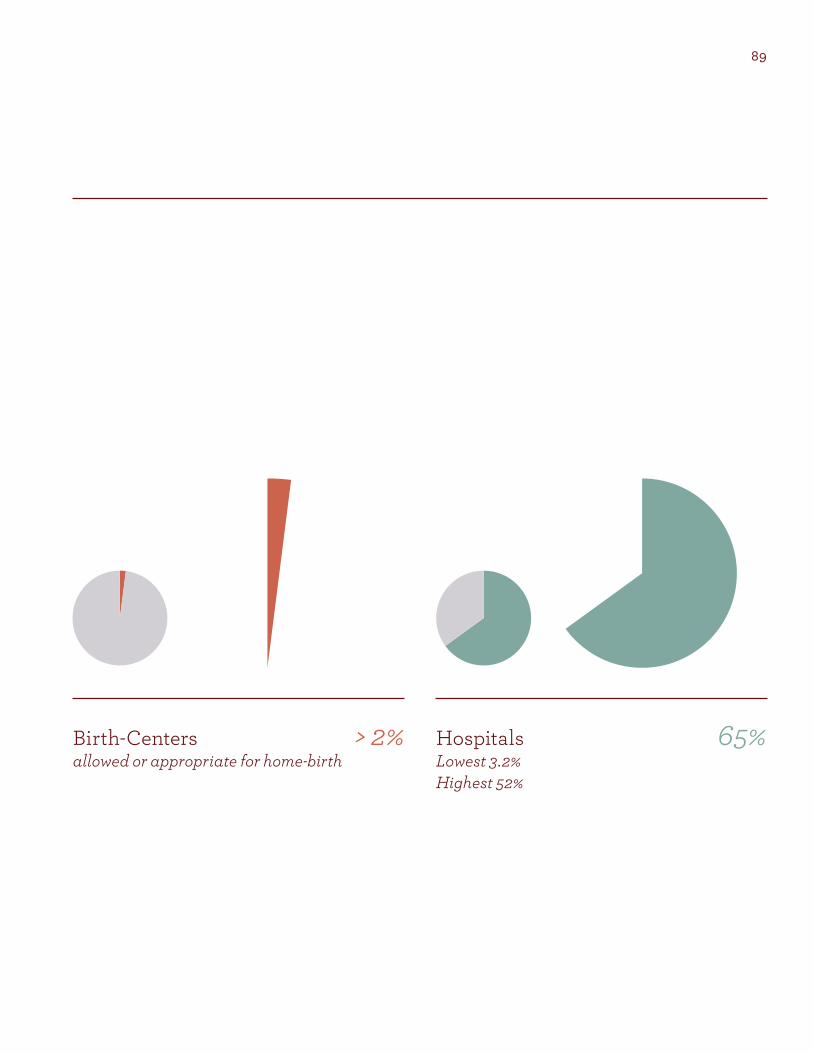
2+98 +65+35
89
Birth-Centers allowed or appropriate for home-birth
Hospitals Lowest 3.2% Highest 52%
> 2% 65%
Breaking of the Waters
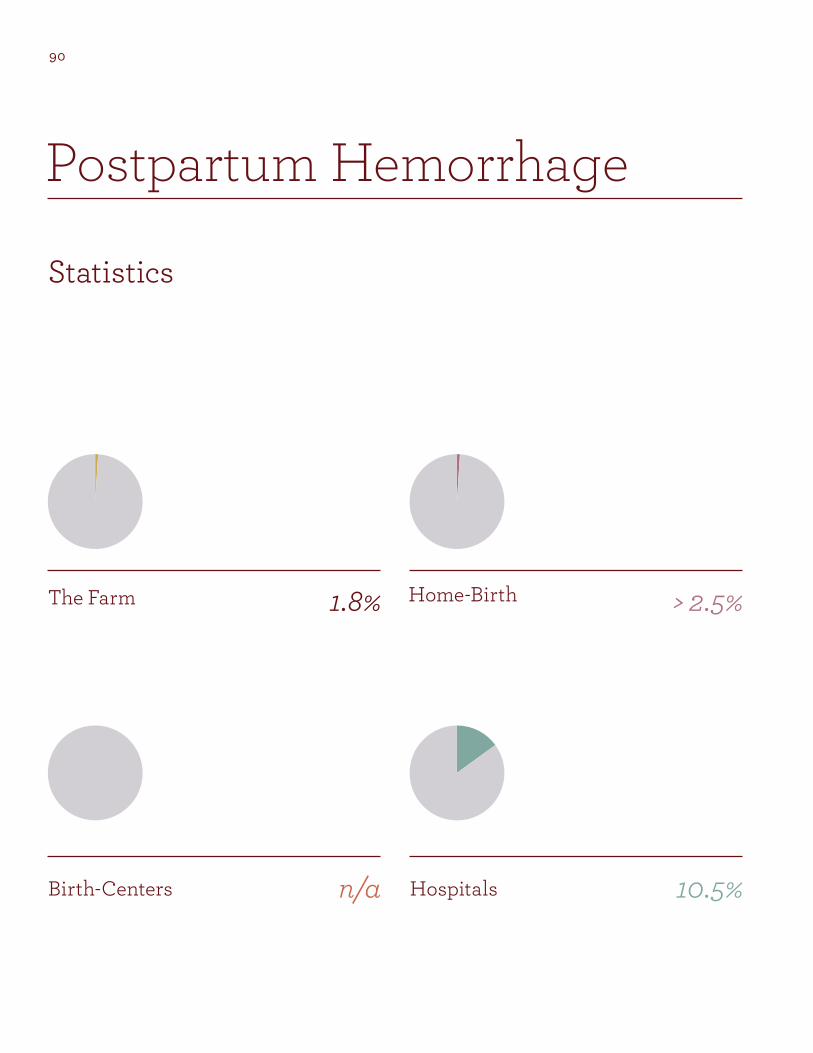
+1+99 +1+99
+100 +15+85
90
The Farm Home-Birth
Birth-Centers Hospitals
Statistics
Postpartum Hemorrhage
n/a
1.8%
10.5%
> 2.5%
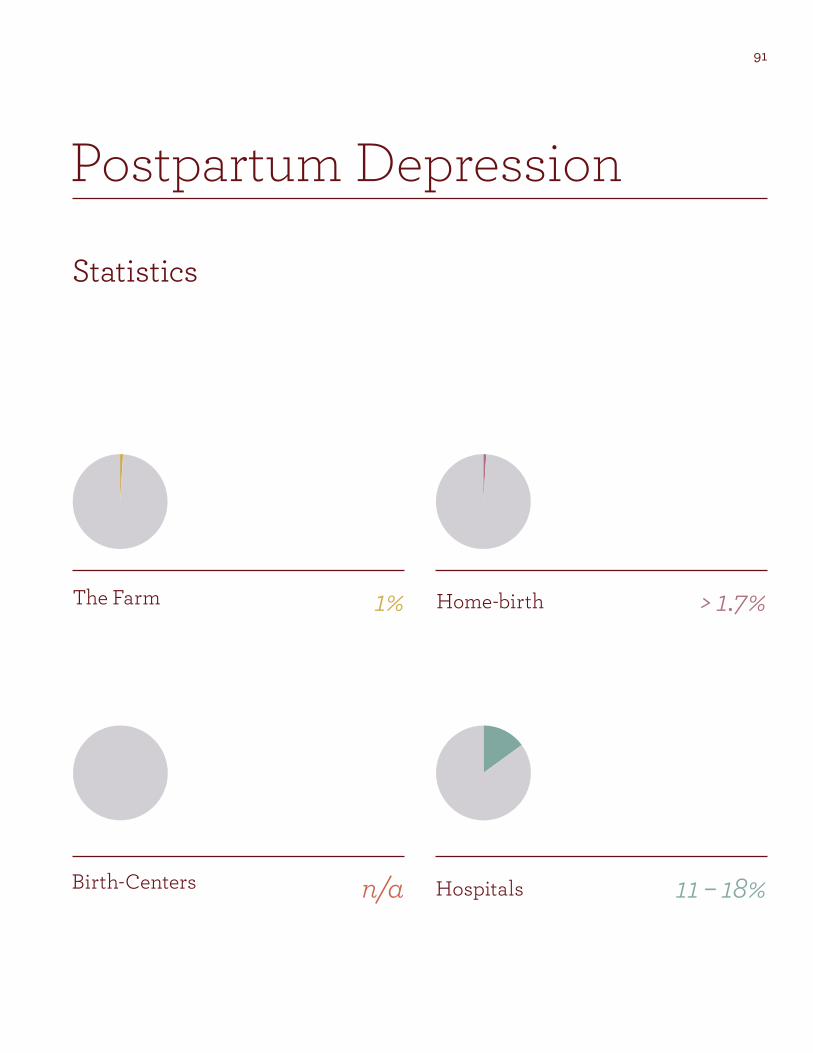
+1+99 +1+99
+100 +15+85
+1+99
91
The Farm Home-birth
Birth-Centers Hospitals
Statistics
Postpartum Depression
n/a
1%
11 – 18%
> 1.7%

92
7
93
my visionHome-birth is a viable option for 60 – 80% of low-risk women.
L of births should be at Home.
L of births should be at a Birth-Center.
L of births at the Hospital.
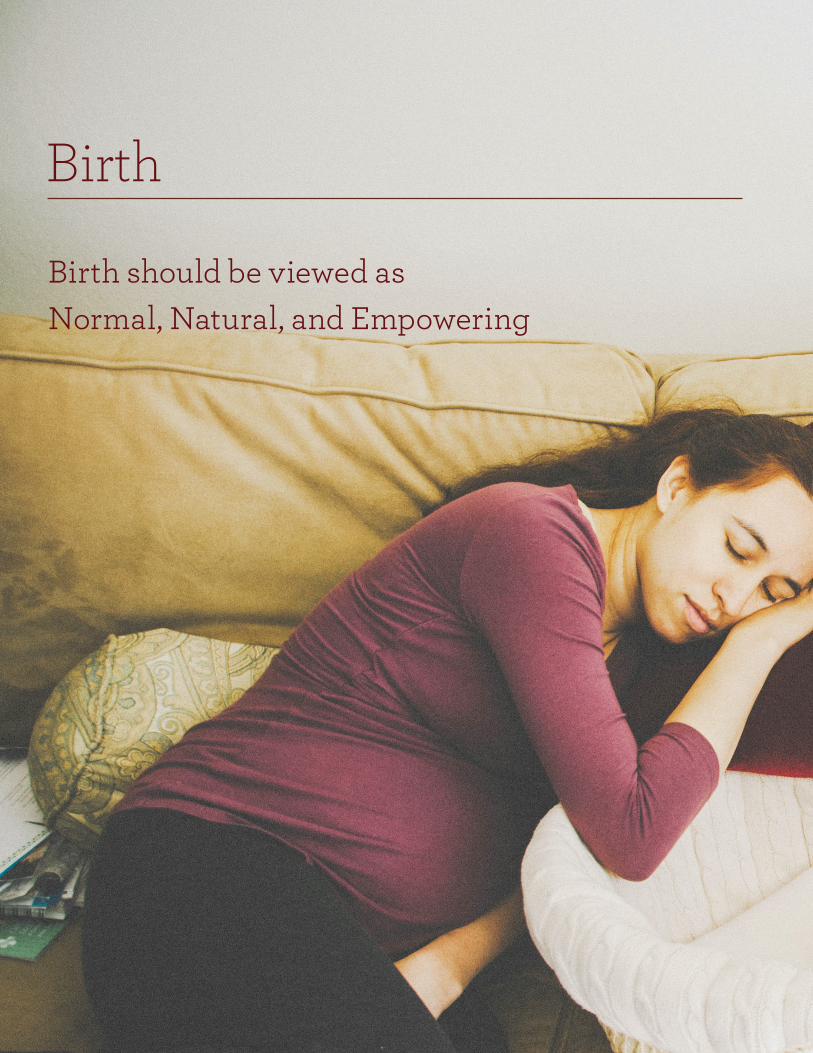
Birth
Birth should be viewed as Normal, Natural, and Empowering


colo
pho
n k Designer Stephanie Penland
l Photographers 01 Isaiah Beiser Photography 02 Tres Photography 03 Stephanie Penland 04 Catherine Byrd 05 Istock Photography
m Writers 01 Stephanie Penland 02 Crystal Wolf 03 Illana Pearlman
n Printer 01 Blurb Magazine
o Details 01 Font Archer Pro 02 Chartwell


![Critical Study of the Concept of International Arbitration ...repository.essex.ac.uk/18812/1/Hassan Arab- Final Thesis[890].pdf1.3 Thesis Outline 4 1.4 Structure of the Thesis 9 1.5](https://static.fdocuments.in/doc/165x107/5f212cf84164827593399200/critical-study-of-the-concept-of-international-arbitration-arab-final-thesis890pdf.jpg)