Thesis Office Draft - FINAL - Repository - Texas A&M University
48
CROSS-CULTURAL VALIDATION OF THE MARITAL SATISFACTION INVENTORY-REVISED: A CONFIRMATORY FACTOR ANALYTIC STUDY A Thesis by MOLLY FAITHE GASBARRINI Submitted to the Office of Graduate Studies of Texas A&M University in partial fulfillment of the requirements for the degree of MASTER OF SCIENCE August 2010 Major Subject: Psychology
Transcript of Thesis Office Draft - FINAL - Repository - Texas A&M University
CROSS-CULTURAL VALIDATION OF THE MARITAL SATISFACTION
INVENTORY-REVISED: A CONFIRMATORY FACTOR ANALYTIC STUDY
A Thesis
by
MOLLY FAITHE GASBARRINI
Submitted to the Office of Graduate Studies of Texas A&M University
in partial fulfillment of the requirements for the degree of
MASTER OF SCIENCE
August 2010
Major Subject: Psychology

Cross-Cultural Validation of the Marital Satisfaction Inventory-Revised: A
Confirmatory Factor Analytic Study
Copyright 2010 Molly Faithe Gasbarrini

CROSS-CULTURAL VALIDATION OF THE MARITAL SATISFACTION
INVENTORY-REVISED: A CONFIRMATORY FACTOR ANALYTIC STUDY
A Thesis
by
MOLLY FAITHE GASBARRINI
Submitted to the Office of Graduate Studies of Texas A&M University
in partial fulfillment of the requirements for the degree of
MASTER OF SCIENCE
Approved by:
Chair of Committee, Douglas K. Snyder Committee Members, Victor Willson William Rae Head of Department, Leslie Morey
August 2010
Major Subject: Psychology

iii
ABSTRACT
Cross-Cultural Validation of the Marital Satisfaction Inventory-Revised: A
Confirmatory Factor Analytic Study. (August 2010)
Molly Faithe Gasbarrini, B.A., State University of New York at Buffalo
Chair of Advisory Committee: Dr. Douglas K. Snyder
This study examined issues of measurement equivalence in a cross-national study
using the Marital Satisfaction Inventory-Revised (MSI-R). Overall findings supported
cross-cultural similarities across the Spain, Germany, Korea, and the U.S.
standardization samples. The Spanish, German, and Korean translations of the MSI-R
demonstrated moderate to strong internal consistency, inter-scale correlations, and
discriminative validity overall. Confirmatory factor analyses revealed configural and
metric invariance across the original measure and the German, Spanish, and Korean
translations. Mean profile comparisons between the current German, Spanish, and
Korean samples and the original standardization sample revealed significant differences
on several scales. Test characteristic similarities between the U.S. and the Spanish,
German, and Korean clinical samples suggest the clinical utility of the MSI-R for
identifying couples for secondary prevention or intervention protocols, and treatment
planning in Spain, Germany, and Korea. Implications for cross-national clinical and
research applications of the MSI-R are discussed.

iv
ACKNOWLEDGEMENTS
I would like to thank my committee members, Dr. Willson and Dr. Rae, for their
guidance and support throughout the course of this research. Thanks also go to Dr.
Antonio Cepeda-Benito for his guidance throughout the course of this work.
I also thank Profesor Kurt Hahlweg of the University of Braunschweig, Dr.
Abilio Reig-Ferrer of the University of Alicante, and Dr. Jung-Hye Kwon of the
University of Seoul for their excellent contributions to this project.
Thanks also go to my mother, who instilled in me the value of education above
all other pursuits, to my father, whose advice led me to finally pursue this degree, and to
Bryan Burrets who did not give up on me.
Finally, I would like to thank my major advisor and committee chair, Dr.
Douglas K. Snyder, who exemplifies the gifted mentor, teacher, clinician, and
researcher.
v
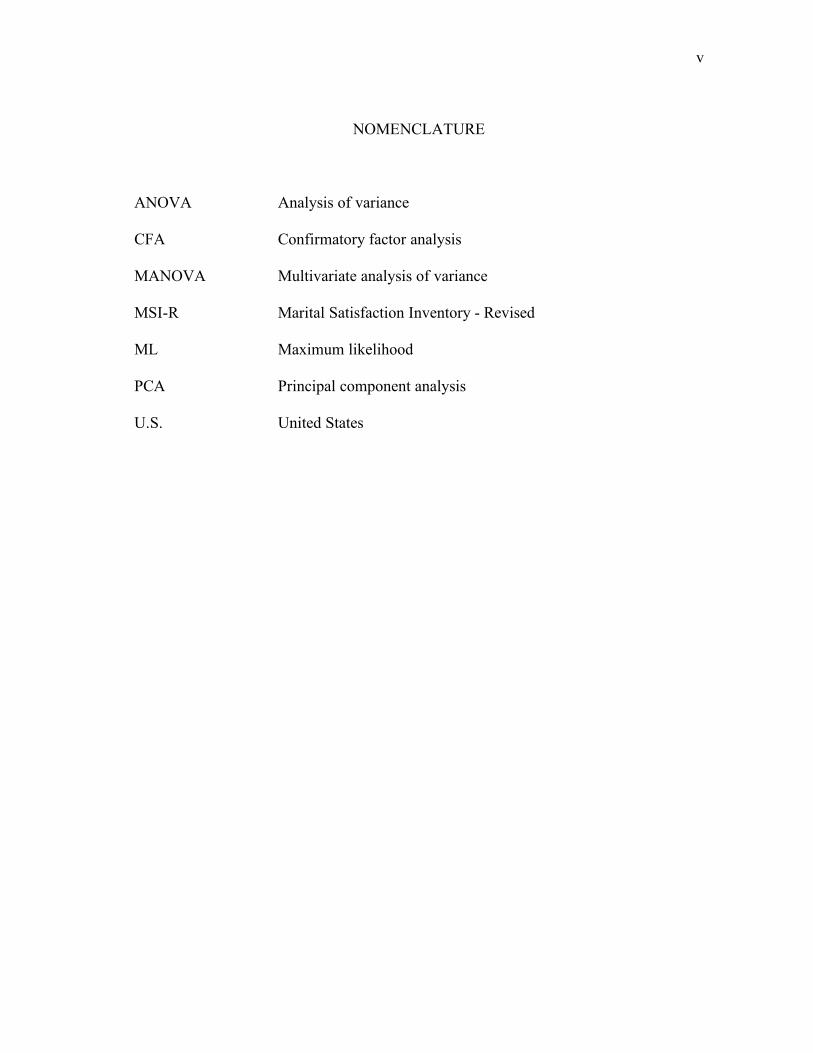
NOMENCLATURE
ANOVA Analysis of variance
CFA Confirmatory factor analysis
MANOVA Multivariate analysis of variance
MSI-R Marital Satisfaction Inventory - Revised
ML Maximum likelihood
PCA Principal component analysis
U.S. United States

vi
TABLE OF CONTENTS
Page
ABSTRACT.......................................................................................................... iii
ACKNOWLEDGEMENTS................................................................................... iv
NOMENCLATURE .............................................................................................. v
TABLE OF CONTENTS....................................................................................... vi
LIST OF TABLES................................................................................................. vii
INTRODUCTION ................................................................................................ 1
METHODS ........................................................................................................... 5
Participants........................................................................................ 5 Measures ........................................................................................... 8 Procedures......................................................................................... 12
RESULTS ............................................................................................................. 14 Internal Consistency .......................................................................... 14 Correlational Analyses ...................................................................... 14 Confirmatory Factor Analyses (CFA).................................................. 15 Analysis of Scalar Nonequivalence.................................................... 18 Discriminative Validity ..................................................................... 20 DISCUSSION AND SUMMARY ......................................................................... 22
REFERENCES...................................................................................................... 29
APPENDIX........................................................................................................... 32
VITA..................................................................................................................... 40

vii
LIST OF TABLES
Page Table 1 Internal Consistency Coefficients for MSI-R Profile Scales.................... 32
Table 2 Intercorrelations Among MSI-R Scales for Spanish Men and Women .... 34
Table 3 Intercorrelations Among MSI-R Scales for German Men and Women.... 35
Table 4 Intercorrelations Among MSI-R Scales for Korean Men and Women..... 36
Table 5 Tests of Invariance Across U.S., Spanish, German, and Korean Community Men and Women................................................................. 37 Table 6 Mean Scale Comparisons in Community Samples Across Nationality .... 38
Table 7 Mean Scale Comparisons in Clinical Samples Across Nationality .......... 39
1
INTRODUCTION
Men and women in virtually all cultures across the globe share a common
experience: their lives are profoundly affected by marriage and similar intimate adult
relationships (Buss, 1995). Developing assessment strategies specific to couples and
families has been a focus gaining considerable attention over the past 25 years.
Researchers have adopted a variety of observational and self-report methods toward this
end (Snyder & Abbott, 2002). Indeed, psychometrically reliable, valid, and relevant
tools for assessing couple and families comprise the foundation for both research and
clinical intervention targeting adult intimate relationships.
Despite a recent trend toward increased internationalization of couple and family
research (Walsh, 2003), few studies have examined the cross-national relevance of
couple or family assessment techniques. The absence of such research precludes cross-
cultural comparisons of couple or family processes that may moderate the relevance or
validity of clinical assessment and intervention strategies developed primarily within one
country when transported to alternative national or cultural applications. An unfortunate
side effect of the lack of empirical evidence examining cross-cultural validity of these
assessment tools is that researchers and clinicians working with non-Anglo populations
commonly use invalid translations and adaptations of assessment instruments developed
in Anglo countries (and, predominantly, within the United States (U.S.)).
______________________ This thesis follows the style of Assessment.
2
The adaptation of assessment instruments is generally required when “the new
target population differs appreciably from the original population with which the
assessment device is used in terms of culture, cultural background, country, and
language” (Geisinger, 1994). Most of the time, test translation is necessary for test
adaptation. But translation of the test items is only the beginning of an extensive and
compulsory effort to demonstrate the validity of the adapted test. Researchers seeking to
demonstrate evidence for the test’s validity are concerned with issues of internal
consistency, relevance of item content to the target culture, and discriminative validity as
demonstrated by clinical data.
Along with the benefits potentially afforded through wider availability of
assessment instruments comes the responsibility to focus efforts on examining
measurement invariance for assessment tools used with diverse cultures and ethnicities
by comparing a representative sample from the target nation to the normative culture or
country. Measurement equivalence or invariance refers to an instrument’s construct
comparability and lack of measurement bias across different groups. Establishing
measurement equivalence allows one to make meaningful cross-group comparisons on a
common metric by providing evidence that the latent constructs are similar across
groups. When an instrument is not comparable across groups, observed differences in
mean scores or in the pattern of correlations of the instrument with other measures
within any given group can be misleading (Reise, Widaman, & Pugh, 1993).
Evidence of invariance may generally be pursued in two forms: structural or
construct equivalence and measurement equivalence (Byrne, Oakland, Leong, van de

3
Vijver, Hambleton, Cheung, & Bartram, 2009). Structural equivalence refers to
invariance among the latent psychological constructs (for this study, dimensions of
relational discord), wherein the test has the same meaning and dimensional structure for
both the target nation and the test nation (van de Vijver & Leung, 1997). Measurement
equivalence requires the empirical evaluation of item content and psychometric
properties such as validity and reliability.
The Marital Satisfaction Inventory-Revised (Snyder, 1997) is a 150-item self-
report measure of relationship functioning designed to identify the nature and intensity
of distress in distinct areas of partner interaction. Recent research examining cross-
cultural applications of the MSI-R suggests that this measure may be useful for assessing
couples’ functioning across a wide variety of cultures. Preliminary evidence of reliability
and validity has been garnered for translations of the MSI-R into Spanish, German,
Arabic, and Korean and, to a lesser extent, for Bosnian and Russian adaptations.
The present study is a cross-cultural investigation of the Spanish, German, and
Korean translations of the MSI-R. Such research is critical as a prelude to incorporating
the translated MSI-R for both clinical and research purposes within these populations.
Specifically, the present study addresses the following questions: First, do the Spanish,
German, and Korean MSI-R translations retain comparable psychometric properties
identified in previous research in terms of the scales’ internal consistency and factor
structure when used with couples in these populations? Second, does gender of the
respondent impact measurement equivalence for the Spanish, German, and Korean
translations of the MSI-R? And third, do Spanish, German, and Korean couples’

4
relationship profiles on the MSI-R differ from mean profiles derived from English-
speaking respondents sampled in the United States? Providing evidence of measurement
invariance would lend support to the clinical utility of the MSI-R among those couples
for whom Spanish, German, or Korean is their first or preferred language. MSI-R
profiles are interpreted according to norms developed based on the U.S. standardization
sample. Findings pertaining to couples’ mean profiles would inform interpretation of
respondents’ profiles from other countries based on group norms.
5
METHODS
Participants
Community and clinical samples were gathered over a 10-year period in four
different countries: (a) the United States (U.S.), (b) Germany, (c) Spain, and (d) Korea.
The MSI–R standardization sample of 1,020 couples was recruited by Western
Psychological Services (WPS), which contacted approximately 200 potential data
collection sites, of which 53 sites participated. An experienced testing professional (e.g.,
a psychologist) managed each site, and sites were distributed throughout the U.S. and
across different states within each major geographic region. Each site director
approached local school systems, churches, and other community groups with the goal
of collecting a cross-section of couples in their community to avoid oversampling from
any one source. Participants were told they were contributing to a national study
investigating community couples’ relationships, that their responses would be
anonymous, and that they would not receive feedback regarding their test results. In both
the U.S. and Spain, where couples were sampled conjointly, interviewers provided the
rationale for the study, obtained informed consent, and instructed participants to
complete the measures separately and without collaboration. The community sample in
the U.S. consisted of 1,020 heterosexual couples, sampled conjointly. Participants in this
sample ranged in age from 16 to 92 years (M = 39.8, SD = 13.7). Men were slightly
older (M = 40.7, SD = 14.0) than women (M = 38.8, SD = 13.4). The couples had been

6
married from 0 to 67 years (M = 14.9, SD = 13.2), and about 70% of the couples had at
least one child (M = 1.9, SD = 1.6).
A U.S. sample of 50 couples in marital therapy was obtained from a southwestern
community of 160,000; half of the couples were seen in private practice settings, and the
others at the community's largest HMO clinic. Partners completed the MSI-R separately
and returned materials to their therapist, who in turn submitted the completed measures
to the investigator. The investigator scored the MSI-R and provided interpretive
guidelines to the therapist, who in turn provided feedback to the couple. Participants in
this sample ranged in age from 21 to 53 years (M = 35.6, SD = 7.7). Men were slightly
older (M = 36.5, SD = 7.9) than women (M = 34.7, SD = 7.5). The couples had been
married from 0 to 29 years (M = 9.4, SD = 7.2), and about 78% of the couples had at
least one child (M = 1.9, SD = 1.4).
The procedures for collecting Spanish data were similar to those used in previous
studies of the MSI-R across culturally and linguistically diverse samples. Specifically,
graduate students in psychology recruited married couples from the community as partial
credit for a measurement and assessment class. Students were instructed not to recruit
members of their own family but were otherwise allowed to draw from their own
personal contacts within the community. Couples received neither compensation nor
feedback about their responses but were informed they could contact the senior
investigator for that study if they had questions or concerns.
The community sample collected in Spain consisted of 649 heterosexual couples
(648 men; 649 women), sampled conjointly. Participants in this sample ranged in age
7
from 18 to 86 years (M = 40.0, SD = 13.1). Men were slightly older (M = 41.2, SD =
13.4) than women (M = 38.7, SD = 12.7). The couples had been married from 0 to 60
years (M = 16.8, SD = 12.2), and about 60% of the couples had at least one child (M =
1.4, SD = 1.4). The Spanish clinical sample, also assessed conjointly, consisted of 25
heterosexual couples. Participants in this sample ranged in age from 25 to 55 years (M =
36.2, SD = 6.3). Men were slightly older (M = 37.5, SD = 6.3) than women (M = 35.0,
SD = 6.3). The couples had been married from 1 to 36 years (M = 11.6, SD = 8.2), and
about 70% of the couples had at least one child (M = 1.2, SD = 0.8).
Korean and German community and clinical samples were not sampled as couples,
but rather as individuals. The Korean community sample included 440 married men and
539 married women. About 77% of men and 78% of women reported having at least one
child. Participants in this sample ranged in age from 20 to 66 years (M = 38.8,
SD = 9.7). Men were slightly older (M = 39.9, SD = 9.8) than women (M = 38.6, SD =
9.6). The Korean clinical sample consisted of 40 married men and 38 married women,
about 70% of whom reported having at least one child. Participants in this sample ranged
in age from 27 to 61 years (M = 36.4, SD = 7.5). Men were slightly older (M = 37.9, SD
= 7.7) than women (M = 34.8, SD = 7.1).
The German community sample consisted of 82 married men and 126 women
(about 75% of whom reported having at least one child). Participants in this sample
ranged in age from 20 to 60+ years (M = 45.3, SD = 9.4). The German clinical sample
consisted of 93 married men and 111 married women. About 85% of men and 83% of
women reported having at least one child. Participants in this sample also ranged in age
8
from 20 to 60+ years (M = 41.0, SD = 8.8).
Measures
The Marital Satisfaction Inventory–Revised (MSI-R) (Snyder, 1997) is
administered to both partners separately and requires approximately 25 minutes to
complete. The measure is composed of 13 profile scales: two validity scales, one global
distress scale, and 10 additional scales assessing specific dimensions of the relationship.
Individuals’ responses to each item are scored along these scales and are plotted on a
standard profile sheet based on gender-specific norms using normalized T-scores. MSI-R
scale names, abbreviations, and brief descriptions are as follows:
Inconsistency (INC): A validity scale assessing the individual’s consistency in
responding to item content (20 item pairs with high scores reflecting greater
inconsistency).
Conventionalization (CNV): A validity scale assessing individuals’ tendencies to distort
the appraisal of their relationship in a socially desirable direction (10 items with
high scores reflecting denial of common relationship shortcomings).
Global Distress (GDS): This measures individuals’ overall dissatisfaction with the
relationship (22 items).
Affective Communication (AFC): This evaluates individuals’ dissatisfaction with the
amount of affection and understanding expressed by their partner (13 items).
Problem-Solving Communication (PSC): This assesses the couple’s general
ineffectiveness in resolving differences (19 items).

9
Aggression (AGG): This measures the level of intimidation and physical aggression
experienced by respondents from their partners (10 items).
Time Together (TTO): This evaluates the couple’s companionship as expressed in time
shared in leisure activity (10 items).
Disagreement About Finances (FIN): This measures relationship discord regarding the
management of finances (11 items).
Sexual Dissatisfaction (SEX): This assesses dissatisfaction with the frequency and
quality of intercourse and other sexual activity (13 items).
Role Orientation (ROR): This evaluates the respondent’s advocacy for a traditional
versus nontraditional orientation toward marital and parental gender roles (12
items with high scores reflecting a nontraditional, more egalitarian orientation).
Family History of Distress (FAM): This reflects the disruption of relationships within
the respondent’s family of origin (9 items).
Dissatisfaction with Children (DSC): This assesses the relationship quality between
respondents and their children as well as parental concern regarding the emotional
and behavioral well being of their children (11 items).
Conflict Over Child Rearing (CCR): This evaluates the extent of conflict between
partners regarding child rearing practices (10 items).
The MSI-R was standardized in the U.S. based on a sample of 1,020 intact
heterosexual, geographically diverse couples. The sample ensured representation of
persons in their late teens through those in their 70’s and was also representative of the
10
U.S. population for such demographic characteristics as ethnicity, educational level, and
occupation. Snyder (1997) provided evidence that supports the internal consistency and
temporal stability of MSI-R scales as well as their convergent and discriminant validity.
Specifically, the U.S. combined standardization and clinical samples yielded coefficients
of internal consistency for the MSI-R scales ranging from .65 to .93 (M = .81); 6-week
temporal stability coefficients ranged from .74 to .88 (M = .79). A comparison of 50
clinic couples and 77 community couples matched on demographic indices provided
evidence that each of the MSI-R scales discriminated between the community and clinic
couples, with moderate to large effect sizes (Cohen’s d) ranging from .43 to 2.35 (M =
1.07) (Cohen, 1992). Actuarial tables linking scale scores to descriptors of the
relationship provided by clinicians and both spouses showed the MSI-R scales to relate
to a broad range of external criteria consistent with their interpretive intent (Snyder,
1997).
The Spanish, German, and Korean translations of the MSI-R were each
developed through an iterative process of back translations by a team of bilingual
psychologists with expertise in both relationship functioning and test translation. A study
examining psychometric characteristics of the Spanish translation of the Marital
Satisfaction Inventory–Revised (MSI-R) in a community sample of 205 couples from
Spain generated support for the scales’ internal consistency and factor structure, lending
further support to using the MSI-R with couples from diverse cultural backgrounds
whose sole or preferred language is Spanish. However, mean profile comparisons
11
between the Spanish sample and the original standardization sample revealed significant
differences on several scales (Reig-Ferrer, Cepeda-Benito, & Snyder, 2004).
Results from a previous validation study of the Korean MSI-R (Kwon & Choi,
1999) suggested the high internal consistency of individual scales (α = .71 to .92) and
test-retest reliability (coefficients ranging from .70 to .96); a factor analysis using
principal component analysis (PCA) suggested the existence of a single factor in this
sample, explaining 43.37% of total variance.
Klann, Hahlweg, and Hank (1992) developed a German translation of the MSI
(unrevised) and examined psychometric properties of this adaptation in a German
sample of 240 individuals from the community and 240 individuals from a clinical
population. Following revision of the MSI in the United States, Abbott, Snyder, Gleaves,
Hahlweg, and Klann (2000) reanalyzed the data from Klann et al. (1992). Alpha
coefficients of internal consistency on the MSI-R scales rescored from the original
Klann et al. (1992) data ranged from .74 to .92 (M = .83); similarly, mean interitem
correlations for the scales ranged from .22 to .41 (M = .31). In each case, these indices of
internal consistency were comparable to those for the MSI-R standardization sample.
Results from a confirmatory factor analysis used to assess factorial invariance across the
German and U.S. standardization samples indicated that the factor structure was very
similar across groups (Abbott et al., 2000). Further research with a published German
adaptation of the MSI-R has garnered support for its reliability and ability to
discriminate between community and clinic samples (Klann, Hahlweg, Limbird, &
Snyder, 2006).
12
Procedures
A series of analyses was conducted to assess the psychometric and structural qualities
of the Spanish, German, and Korean translations of the MSI-R. Internal consistency was
examined using Cronbach’s alpha (α) and mean inter-item correlations. Additionally,
correlational analyses examined structural and construct similarity for the 13 MSI-R
scales across the three community samples. The internal consistency and correlational
analyses were performed for men and women separately.
To assess structural and measurement equivalence, confirmatory factor analysis
(CFA) was performed and goodness-of-fit indexes were examined to evaluate the
equality of relationships between observed variables (scale scores) and the latent
constructs across eight groups (Cheung & Rensvold, 2002; Vandenberg & Lance, 2000).
The analyses were conducted at the scale level because of inadequate sample size needed
for item-level analyses. Recommendations from Vandenberg and Lance (2000) were
applied to contrast the models using a sequence of “stacked” measurement models,
thereby sequentially testing the equivalence across groups of (a) factor form (number of
factors), (b) factor structure (loadings or LX matrix), (c) regressions on the latent
variables, (d) unique variances, (e) factor variances, and (f) factor covariances. CFA was
conducted using LISREL 8.51 for Windows with the maximum likelihood (ML) method.
Finally two sets of multivariate analysis of variance (MANOVA) were
conducted. The first set examined group mean profile differences between the U.S.
standardization sample and each of the Spanish, German, and Korean community
samples. The second set of MANOVAs examined the discriminative validity of the MSI-

13
R by contrasting community and clinical samples with Spain, Germany, and Korea,
respectively.

14
RESULTS
Internal Consistency
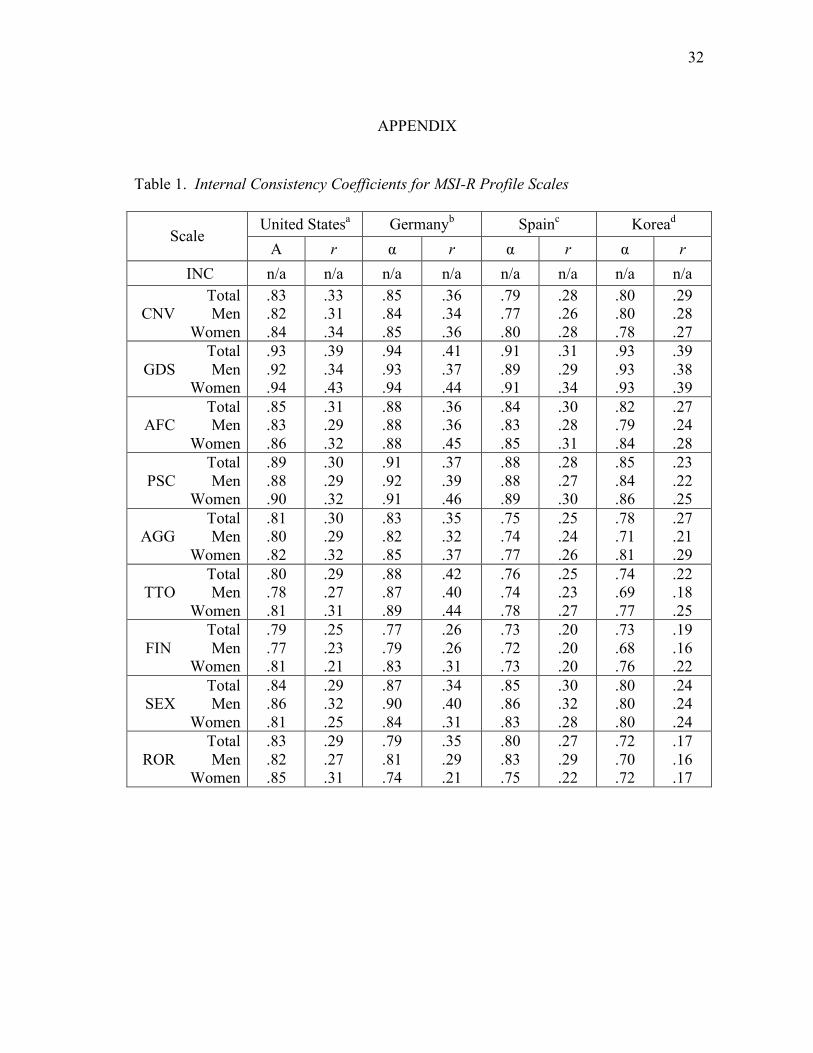
Results of internal consistency analyses for the MSI-R scales are presented for
men and women separately in Table 1. The α coefficient is not applicable to the INC
scale, which is composed of 20 item pairs of varied content designed to identify
inconsistencies in an individual’s pattern of reporting. The α coefficients for remaining
scales ranged from .69 to .91 (M = .79) in the Spanish sample, from .70 to .94 (M = .84)
in the German sample, and from .72 to .93 (M = .78) in the Korean sample. Mean inter-
item correlations for the Spanish sample ranged from .19 to .31 (M = .26), from .20 to
.42 for the German sample (M = .34), and from .17 to .39 (M = .24) for the Korean
sample. All scales in each of the four samples retained moderate to strong internal
consistency for both genders (α ≥ .62; mean inter-item r ≥ .14; Clark & Watson, 1995).
These findings parallel scale internal consistency findings for the U.S. standardization
sample (.65 to .93, M = .81).
Correlational Analyses
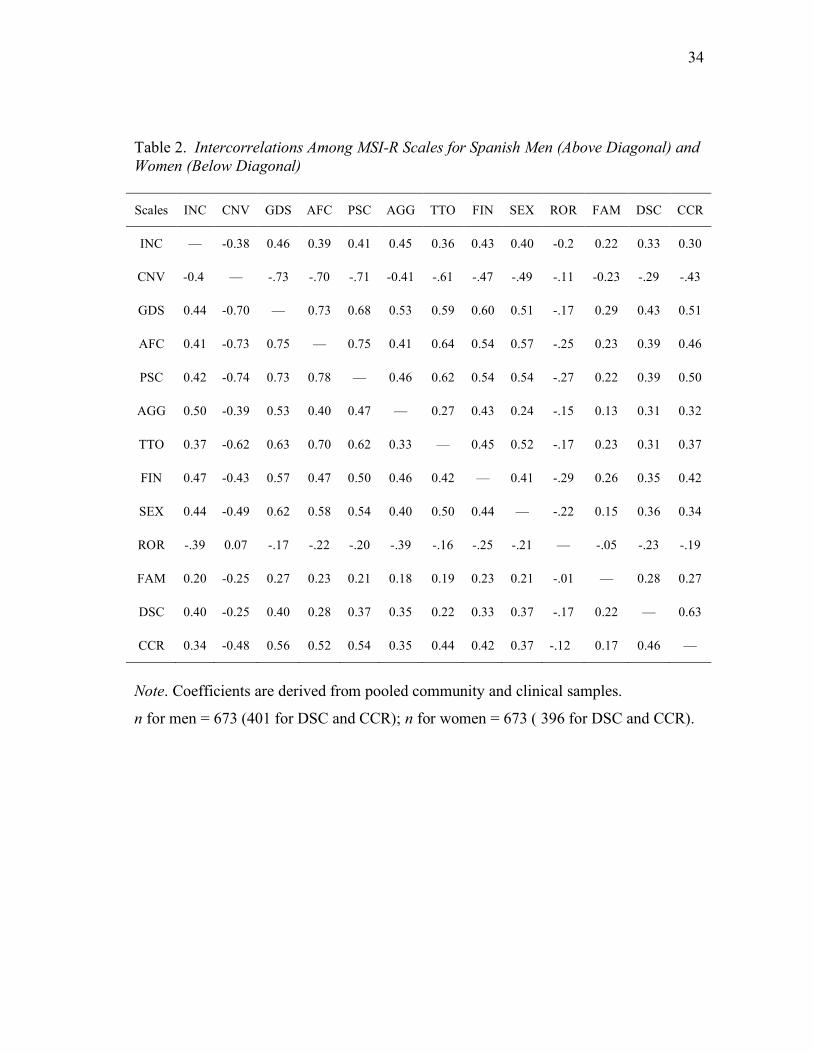
Scale intercorrelations were examined separately for men and women in each
international sample (see Tables 2 to 4). With few exceptions, the Spanish, German, and
Korean correlational patterns were consistent with that of the U.S. standardization
sample, suggesting considerable structural similarity. For both husbands and wives in
each sample, the GDS (global distress) scale was positively and highly related to
measures of specific relationship distress (AFC, PSC, AGG, TTO, FIN, SEX, and CCR)

15
– with r’s ranging from .51 to .75 (M = .61) in the Spanish sample, from .49 to .83
(M = .63) in the German sample, and from .47 to .77 (M = .63) in the Korean sample.
Confirmatory Factor Analyses (CFA)
A preliminary CFA examined the theoretical 3-factor structure proposed for U.S.
couples by Snyder (1997), based on exploratory principal-axis factor analysis with
varimax rotation. Factor 1 included eight scales that measure overall relationship
satisfaction and the couple’s functioning in specific domains of spousal interactions
(CNV, GDS, AFC, PSC, AGG, TTO, FIN, and SEX). Factor 2 included two scales that
assess respondents’ satisfaction with their children and with each other in their role as
parents (DSC and CCR). Factor 3 included two scales that evaluate each individual’s
gender-role views within the marriage and levels of distress in the family of origin (ROR
and FAM). To assess the factor structure across all scales, these analyses were restricted
to couples with children. In the present study, CFA failed to generate adequate fit for a
3-factor model, yielding phi for the correlation matrix that was not positive definite. Phi
refers to the correlation between factors in the model; when one or more of the
correlations between factors approaches 1.00 or -1.00 or exceeds these values, phi is
considered not positive definite. This can result from a variety of data characteristics and
model specifications including small sample sizes, a small number of indicator variables
for one or more factors, or small factor loadings for indicator variables (Wothke, 1993).
In the present study, the low factor loading for ROR on Factor 3 was determined to be a
primary determinant of the nonpositive definite matrix resulting from the 3-factor model.
16
Thus, the data suggested that there are fewer factors in the model than originally
hypothesized.
Hence, a second CFA was conducted to examine factor invariance across each of
four community samples testing a 1-factor structure defined by 8 MSI-R scales explicitly
linked to a hypothesized latent factor of relationship discord (GDS, AFC, PSC, AGG,
TTO, FIN, SEX, and CCR). Factor invariance was examined across eight groups (U.S.
men, U.S. women, Spanish men, Spanish women, German men, German women,
Korean men, and Korean women) using maximum likelihood estimation and tests of
invariance across five levels.1
Consistent with recommendations set forth in the literature (Bentler, 1990;
Cheung & Rensvold, 2002; Vandenberg & Lance, 2000), several different indices of fit
robust to large sample sizes were examined, including the Tucker-Lewis index (also
known as the Non-Normed Fit Index; NNFI) (Tucker & Lewis, 1973), the comparative
fit index (CFI) (Bentler, 1990), the standardized root mean square residual (SRMR) (Hu
& Bentler, 1995), and the root mean square error of approximation (RMSEA) (Steiger,
1990). Because large sample sizes will almost always result in a statistically significant
chi-square difference even if the differences are trivial, Cheung and Rensvold (2002)
recommended instead calculating the change in CFI to evaluate the relative fit of nested
models. A significant change in CFI is one that is greater than .01, and is an indicator of
variance between models (Cheung & Rensvold, 2002; Vandenberg & Lance, 2000).
Following Cheung and Rensvold’s (1999) recommendation, the loading of the first item 1 The sixth test assessing for invariance across factor variance-covariances was not applicable to a 1-factor model.

17
was fixed to 1.0 to identify the model. Guidelines proposed by Bollen and Long (1993)
were used to examine RMSEA, with values < .05 suggesting good fit, and values > .10
suggesting poor fit.
First, the model was tested for configural invariance. The fit indices for the CFA
1-factor model demonstrated acceptable model fit across the eight groups of U.S.,
Spanish, German, and Korean men and women at the configural level – with RMSEA
values of < .10 (see Table 5). This is evidence that factor loadings (λ) had a similar
pattern across groups. That is, all groups associated the same set of scales with the same
construct. For this measure, evidence of configural invariance supported a model in
which the eight identified scales load onto the same single latent factor (couple
relationship distress) for each of the eight groups.
The model was then reestimated simultaneously across groups with an equality
constraint on the matrix of factor loadings (λ) to determine whether the strength of the
relationship between each scale and the latent construct was invariant across groups. The
equality constraint in this case did not substantially affect the fit of the model. An
RMSEA of .0976 indicated moderate fit, and the change in CFI was less than .01,
suggesting that the MSI-R demonstrates adequate invariance across the eight groups at
the metric level.
Given evidence of configural and metric invariance, group mean differences
were assessed by conducting a test of scalar invariance. This step evaluated how
similarly each scale reflects the latent construct of relationship distress across groups. As
parameters were further constrained to include item-level intercepts, the model fit less
18
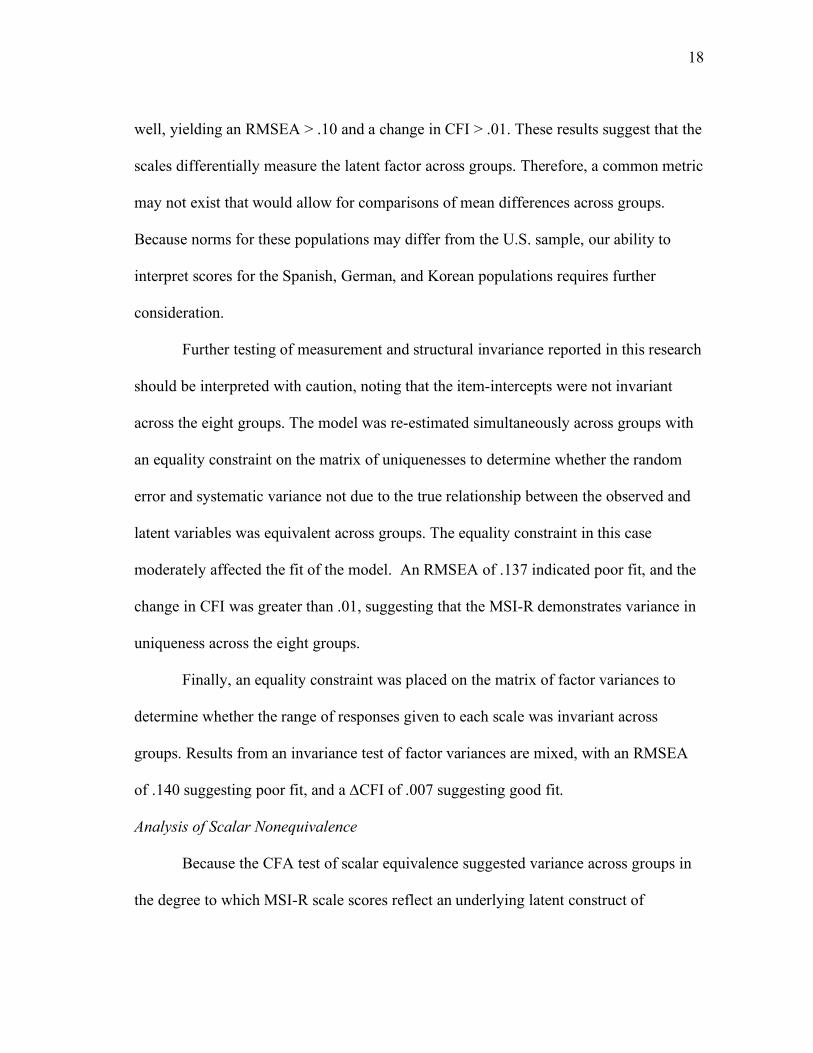
well, yielding an RMSEA > .10 and a change in CFI > .01. These results suggest that the
scales differentially measure the latent factor across groups. Therefore, a common metric
may not exist that would allow for comparisons of mean differences across groups.
Because norms for these populations may differ from the U.S. sample, our ability to
interpret scores for the Spanish, German, and Korean populations requires further
consideration.
Further testing of measurement and structural invariance reported in this research
should be interpreted with caution, noting that the item-intercepts were not invariant
across the eight groups. The model was re-estimated simultaneously across groups with
an equality constraint on the matrix of uniquenesses to determine whether the random
error and systematic variance not due to the true relationship between the observed and
latent variables was equivalent across groups. The equality constraint in this case
moderately affected the fit of the model. An RMSEA of .137 indicated poor fit, and the
change in CFI was greater than .01, suggesting that the MSI-R demonstrates variance in
uniqueness across the eight groups.
Finally, an equality constraint was placed on the matrix of factor variances to
determine whether the range of responses given to each scale was invariant across
groups. Results from an invariance test of factor variances are mixed, with an RMSEA
of .140 suggesting poor fit, and a ∆CFI of .007 suggesting good fit.
Analysis of Scalar Nonequivalence
Because the CFA test of scalar equivalence suggested variance across groups in
the degree to which MSI-R scale scores reflect an underlying latent construct of
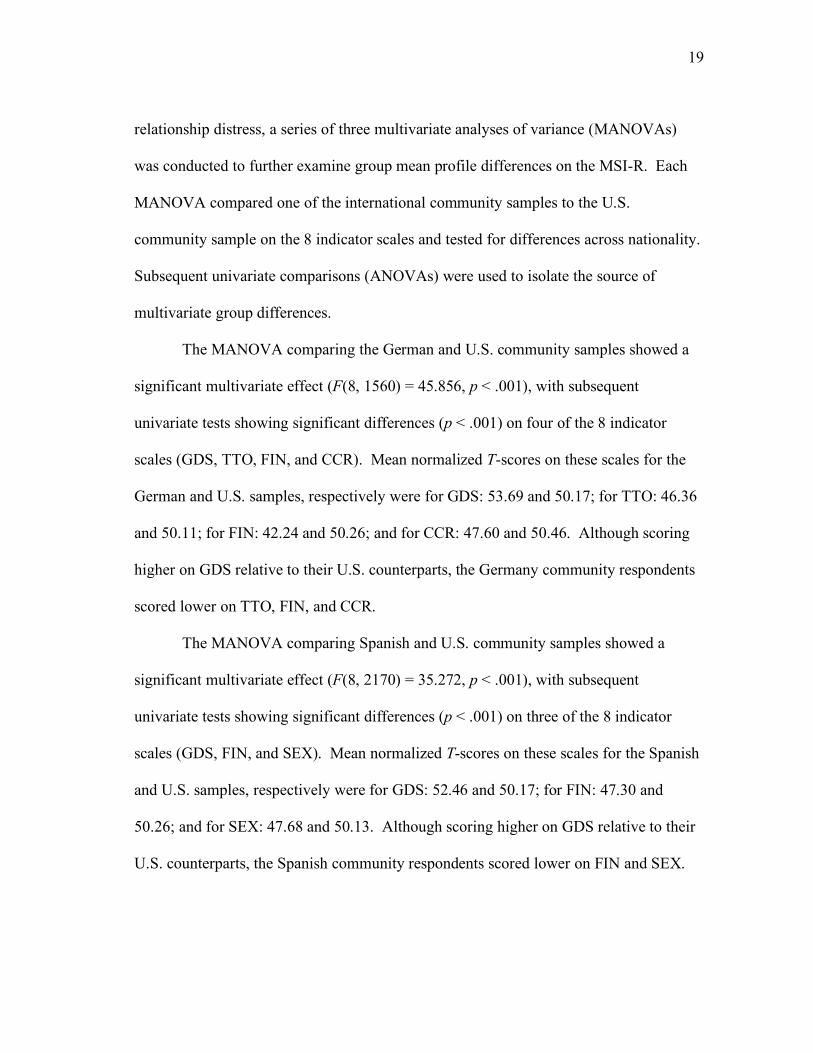
19
relationship distress, a series of three multivariate analyses of variance (MANOVAs)
was conducted to further examine group mean profile differences on the MSI-R. Each
MANOVA compared one of the international community samples to the U.S.
community sample on the 8 indicator scales and tested for differences across nationality.
Subsequent univariate comparisons (ANOVAs) were used to isolate the source of
multivariate group differences.
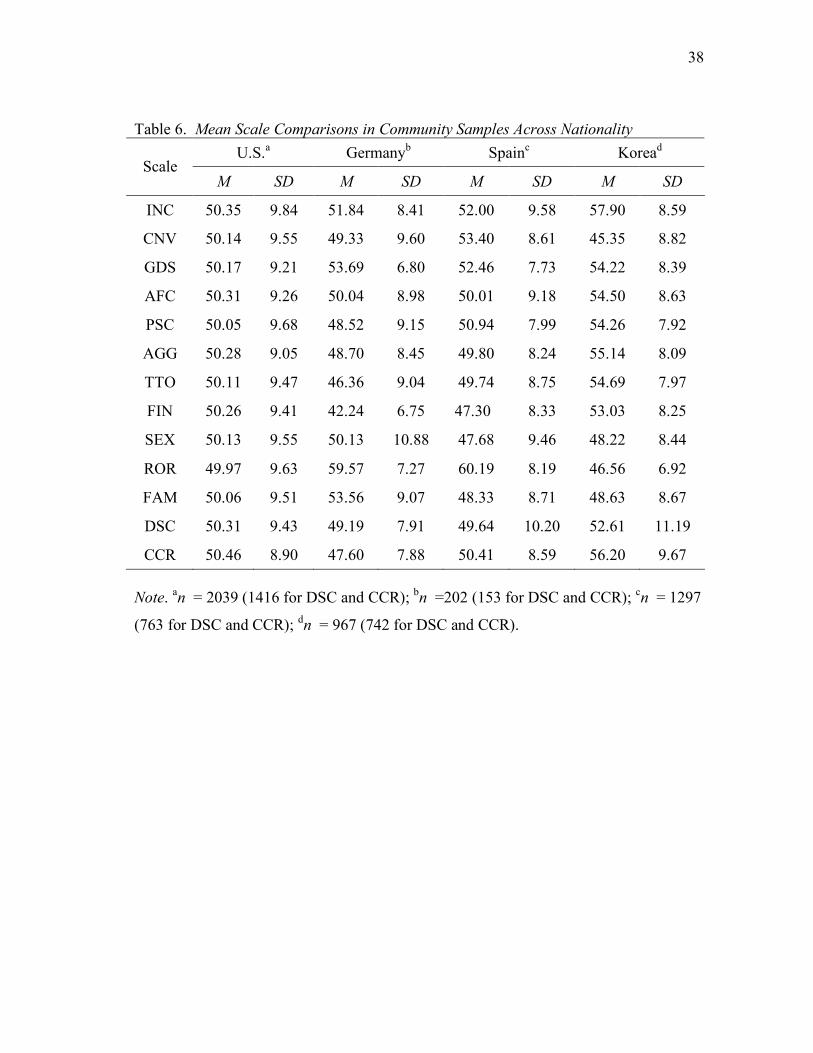
The MANOVA comparing the German and U.S. community samples showed a
significant multivariate effect (F(8, 1560) = 45.856, p < .001), with subsequent
univariate tests showing significant differences (p < .001) on four of the 8 indicator
scales (GDS, TTO, FIN, and CCR). Mean normalized T-scores on these scales for the
German and U.S. samples, respectively were for GDS: 53.69 and 50.17; for TTO: 46.36
and 50.11; for FIN: 42.24 and 50.26; and for CCR: 47.60 and 50.46. Although scoring
higher on GDS relative to their U.S. counterparts, the Germany community respondents
scored lower on TTO, FIN, and CCR.
The MANOVA comparing Spanish and U.S. community samples showed a
significant multivariate effect (F(8, 2170) = 35.272, p < .001), with subsequent
univariate tests showing significant differences (p < .001) on three of the 8 indicator
scales (GDS, FIN, and SEX). Mean normalized T-scores on these scales for the Spanish
and U.S. samples, respectively were for GDS: 52.46 and 50.17; for FIN: 47.30 and
50.26; and for SEX: 47.68 and 50.13. Although scoring higher on GDS relative to their
U.S. counterparts, the Spanish community respondents scored lower on FIN and SEX.
20
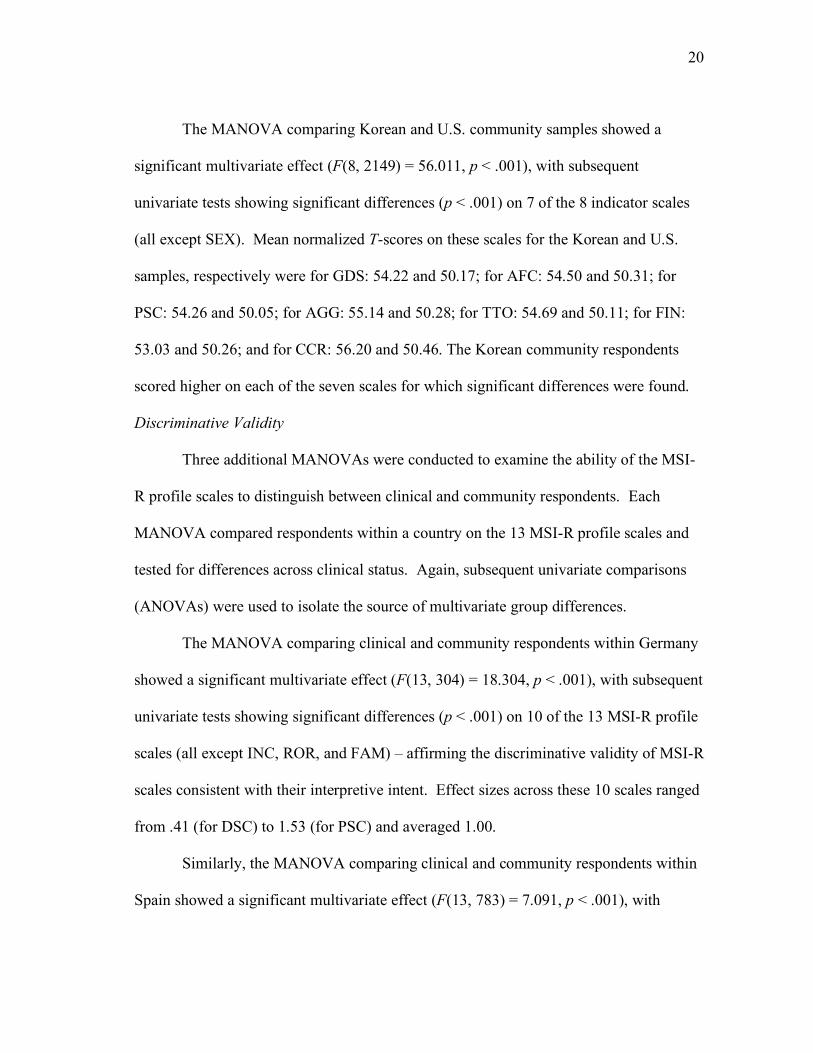
The MANOVA comparing Korean and U.S. community samples showed a
significant multivariate effect (F(8, 2149) = 56.011, p < .001), with subsequent
univariate tests showing significant differences (p < .001) on 7 of the 8 indicator scales
(all except SEX). Mean normalized T-scores on these scales for the Korean and U.S.
samples, respectively were for GDS: 54.22 and 50.17; for AFC: 54.50 and 50.31; for
PSC: 54.26 and 50.05; for AGG: 55.14 and 50.28; for TTO: 54.69 and 50.11; for FIN:
53.03 and 50.26; and for CCR: 56.20 and 50.46. The Korean community respondents
scored higher on each of the seven scales for which significant differences were found.
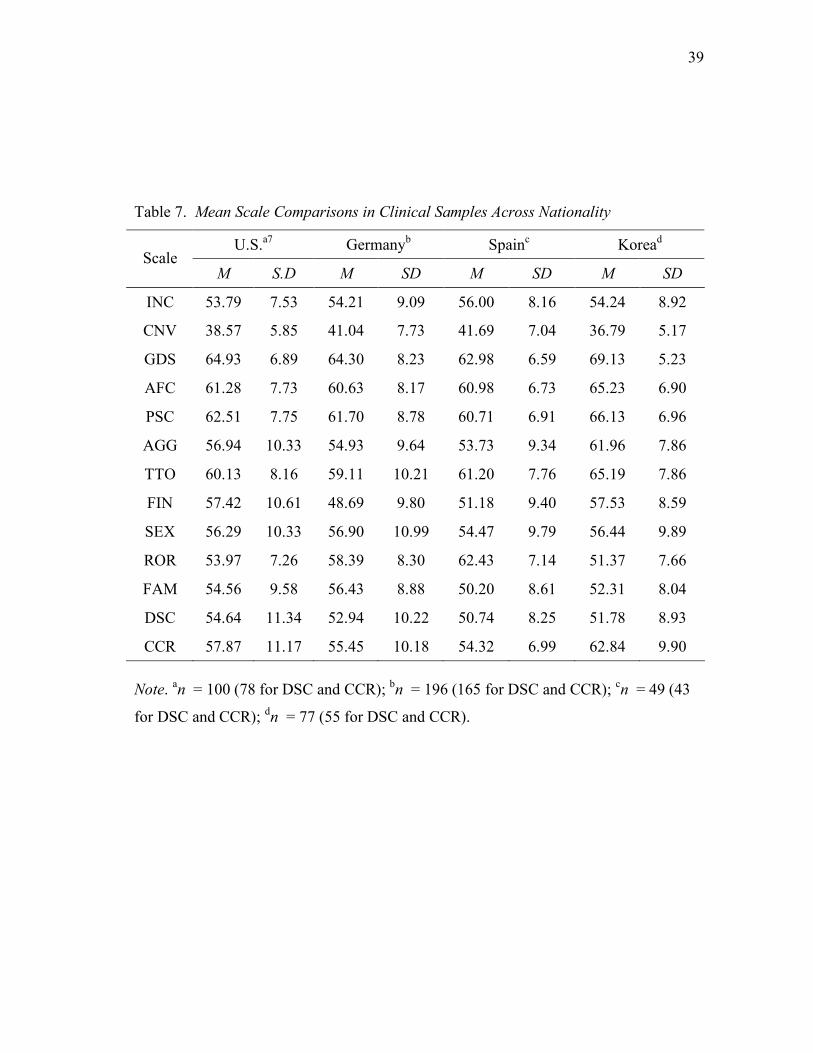
Discriminative Validity
Three additional MANOVAs were conducted to examine the ability of the MSI-
R profile scales to distinguish between clinical and community respondents. Each
MANOVA compared respondents within a country on the 13 MSI-R profile scales and
tested for differences across clinical status. Again, subsequent univariate comparisons
(ANOVAs) were used to isolate the source of multivariate group differences.
The MANOVA comparing clinical and community respondents within Germany
showed a significant multivariate effect (F(13, 304) = 18.304, p < .001), with subsequent
univariate tests showing significant differences (p < .001) on 10 of the 13 MSI-R profile
scales (all except INC, ROR, and FAM) – affirming the discriminative validity of MSI-R
scales consistent with their interpretive intent. Effect sizes across these 10 scales ranged
from .41 (for DSC) to 1.53 (for PSC) and averaged 1.00.
Similarly, the MANOVA comparing clinical and community respondents within
Spain showed a significant multivariate effect (F(13, 783) = 7.091, p < .001), with

21
subsequent univariate tests showing significant differences (p < .001) on 6 of the 13
MSI-R profile scales (CNV, GDS, AFC, PSC, AGG, TTO) – affirming the
discriminative validity of these MSI-R scales consistent with their interpretive intent.
Effect sizes across these 6 scales ranged from .64 (for AGG) to 1.32 (for GDS) and
averaged 1.10.
The final test of MANOVA comparing clinical and community respondents
within Korea showed a significant multivariate effect (F(13, 783) = 25.803, p < .001),
with subsequent univariate tests showing significant differences (p < .001) on 11 of the
13 MSI-R profile scales (all except FAM and DSC) – affirming the discriminative
validity of MSI-R scales consistent with their interpretive intent. Effect sizes across
these 11 scales ranged from .59 (for INC) to 1.79 (for GDS) and averaged 1.08.
22
DISCUSSION AND SUMMARY
Despite a recent trend toward increased internationalization of couple and family
research, few studies have examined the cross-national relevance of couple or family
assessment techniques. This study involved a cross-cultural investigation of the Spanish,
German, and Korean translations of the MSI-R, examining the internal consistency,
discriminative validity, and factor structure of the measure for each country and across
gender. Findings from such investigations are essential for cross-cultural comparisons of
couple or family processes that may moderate the relevance or validity of clinical
assessment and intervention strategies developed primarily within one country when
transported to alternative national or cultural applications.
Findings for the Spanish, German, and Korean samples parallel scale internal
consistency findings for the U.S. standardization sample, with all scales in each of the
four samples retaining moderate to strong internal consistency for both genders.
Evidence of scales’ internal consistency suggests that item-level indicators of
relationship constructs within scales largely retained their relevance to scales’
interpretive intent across cultures. An exception to this general trend was a modest
tendency for ROR interitem r to be lower in other countries – especially Korea. The
latter suggests that subgroups of items within the ROR scale previously identified in the
U.S. normative sample (e.g., attitudes toward division of household and child care
responsibilities, equality of status and influence across gender, and equal importance of
career opportunities across gender) relate differently to one another for Spanish,
23
German, and especially Korean populations, than they relate to one another in the U.S.
population. In other words, the constructs that are pre-supposed to underlie a traditional
or non-traditional schema for a marriage in the U.S. may not be related to one another in
the same way in other countries.
It also bears noting that both alphas and mean inter-item correlations for DSC
were generally lower in each country, including the standardization sample, than
measures of internal consistency for the other scales. This suggests that across
populations, items measuring disagreements with children may be less strongly related
to one another than items assessing other factors contributing to marital distress.
Previous research with U.S. samples suggests four dimensions to the DSC scale,
including (a) concerns regarding children’s emotional and behavioral well-being, (b)
disappointments with the parenting role, (c) lack of interaction with children, and (d)
conflicts with children (Snyder, 1997). Differences between the Spanish, German, and
Korean and U.S. samples both in internal consistency and group means may reflect
cultural variations in parenting roles and expectations for children’s behavior.
Differences between samples could also be attributable to lack of cultural equivalence
for this scale.
Initial confirmatory factor analyses failed to support a three-factor model for the
13 MSI-R profile scales suggested by original exploratory factor analysis with U.S.
community and clinical couples. Several features may have contributed to this failure to
confirm a three-factor model – including a small number of indicators for both the
second and third proposed factors (only two indicators each), as well as the

24
heterogeneous nature of indicators for the third factor (defined by role orientation and
family history of distress) – each of which also differs substantively from other MSI-R
scales more closely linked to couple relationship distress.
By contrast, confirmatory factor analysis proposing a single underlying factor of
relationship distress for the eight MSI-R scales most highly linked conceptually to this
construct provided evidence for test invariance for each of the test translations at the
configural and metric levels. Configural and metric invariance suggests that for each of
the Spanish, German, and Korean translations, the eight identified scales load onto the
same single latent factor (couple relationship distress) for each of the eight groups, and
the strength of the relationship between each scale and the latent construct was invariant
across groups. However, confirmatory factor analysis failed to support scalar invariance
across international samples, suggesting that scales differentially measure the latent
factor across groups. Therefore, a common metric may not exist that would allow for
comparisons of mean differences across groups.
Additional analyses of community couple mean profiles across countries
indicated significant differences on several scales. In general, significant differences
tended to reflect mean scale score differences ranging from 5-8 T-score points –
exceeding the standard error of difference for these scales cited in the MSI-R manual
(Snyder, 1997). However, the direction of differences varied across scales and across
samples. In each of the three contrast samples, respondents scored higher on average on
GDS than did respondents in the U.S., but Spanish and German respondents scored
lower on more narrow-band measures of marital distress such as FIN than did their U.S.

25
counterparts. This finding suggests that these narrow band measures of distress may
have less impact on overall relationship satisfaction in Spain and Germany than they do
for American couples. It is especially noteworthy than the Korean sample yielded higher
mean scores on every indicator scale except SEX. There are several possible
explanations for this trend. It may be that SEX on the Korean MSI-R is psychometrically
stronger than the other Korean MSI-R scales, and therefore a smaller group mean
difference exists for this scale than for the other scales of the Korean MSI-R. It is also
possible that on average Koreans are less likely to experience sexual dissatisfaction than
they are to experience other areas of distress, resulting in scores on SEX that are more
similar to scores from U.S. respondents– whereas scores on other scales indicate greater
distress compared to the U.S. sample. Another more likely explanation is, given cultural
norms, that Eastern populations such as this one are less likely to report sexual
dissatisfaction than they are to report other less stigmatized and private components of
relationship distress.
Analyses of discriminative validity provided strong evidence of the MSI-R
scales’ ability to distinguish distressed from nondistressed couples in each of the
international samples – with moderate-to-strong effect sizes ranging from an absolute
value of .41 to 1.79. Such strong evidence of discriminative validity has implications for
clinical research and clinical intervention, as well as for basic research examining
potential causes and consequences of relationship dysfunction. Evidence of
discriminative validity provides support for the use of the MSI-R for (a) identifying
couples for secondary prevention or intervention protocols, and (b) planning and

26
evaluating specific interventions for couples in treatment. Moreover, evidence of
discriminative validity lends support to the use of the MSI-R for evaluating the
characteristics of couples in therapy versus those not seeking treatment.
Several limitations of the study should be considered. Of primary importance is
the matter of non-independence of data from men and women. In the future, efforts in
data collection should be made to sample all participants conjointly so that data analytic
techniques such as hierarchical linear modeling may be used to address the issue of non-
independence for men and women. In the present study, only participants from the U.S.
and Spain were sampled conjointly.
Second, this study did not make use of the clinical data sets for CFA analyses
due to limitations in sample size. Larger clinical samples would permit analyses
examining whether MSI-R scales relate to an underlying latent factor of relationship
distress similarly for community and clinical respondents, and similarly within clinical
samples across country. Such additional findings would be useful because the MSI-R is
most commonly administered in clinical settings. Therefore, evidence of test validity
specifically within clinical populations is most meaningful. Moreover, because research
concerning relationship distress informs the development of applied techniques to treat
couples in a clinical setting, it is imperative that findings generalize to clinical
populations across diverse cultures.
A third area warranting attention concerns pre-testing of samples. Harkness
(2003) describes a process of collaborative translation that would likely capture even
minute discrepancies in meaning from one language to another. The process involves

27
five basic stages: translation, review, adjudication, pretesting, and documentation. Pre-
testing occurs once the measure is translated. The test is administered to groups of
monolingual and bilingual respondents who are asked for direct feedback about their
understanding of the meaning of the questions. It is important to include both groups
because bilinguals may differ in terms of their use, vocabulary, and interpretation.
Harkness notes that in the case of bilinguals, half should be given the test in one
language, half in the other, and results should be compared. More quantitative pre-
testing data can be collected when a test is created using concepts of item response
theory. When translating a measure, care must be taken to ensure equivalence not only
of the items, but also of the response set. A strength of the MSI-R is its simplicity in
response. However, it is crucial to examine further the potential impact of writing
questions with a dichotomous (“yes/no”) response format, especially concerning
attitudinal data. Harkness suggests the addition of an “indifferent,” “no opinion,” or “I
don’t know” category. Although this method may capture more true variance in
underlying constructs targeted by items, for questions concerning attitudes such
expanded response options have the potential to generate more ambiguous scores,
especially for those respondents reluctant to “choose sides.” In the case of the MSI-R, it
would potentially require the creation of an additional IND (Indifference) scale,
measuring participants’ willingness, or unwillingness, to embrace a dichotomous
response.
Despite these limitations, the current study expands the empirical literature on
cross-cultural couple assessment. Providing evidence of measurement invariance lends
28
support to the clinical utility of the MSI-R among those couples for whom Spanish,
German, or Korean is their first or preferred language. Overall, findings demonstrate
considerable similarity of experiences in adult intimate relationships across Spain,
Germany, Korea, and the U.S., and suggest the clinical utility of the Spanish, German,
and Korean translations of the MSI-R in assessing the nature and severity of couple
distress in those countries. Future data collection efforts should focus on other non-
Western countries, which have largely been ignored in this area of research, and where
cultural differences may significantly influence couple assessment. Additionally, future
analyses should be conducted at the item-level to further investigate the validity of test
items as a supplement to the research conducted at the scale level.
29
REFERENCES
Abbott, B.V., Snyder, D.K., Gleaves, D.H., Hahlweg, K., & Klann, N. (2000, August).
Cross-cultural reliability and validity of the German Marital Satisfaction Inventory-
Revised. Paper presented at the meeting of the American Psychological Association,
Washington, DC.
Bentler, P.M. (1990). Comparative indexes in structural models. Psychological Bulletin,
107, 238-246.
Bollen, K.A. & J.S. Long (1993) Testing structural equation models. Newbury Park,
CA: Sage Publications.
Buss, D.H. (1995). Psychological sex differences: Origins through sexual selection.
American Psychologist, 50, 164-168.
Byrne, B. M., Oakland, T., Leong, F. T. L., van de Vijver, F. J. R., Hambleton, R. K.,
Cheung, F.M., & Bartram, D. (2009). A critical analysis of cross-cultural research
and testing practices: Implications for improved education and training in
psychology. Training and Education in Professional Psychology, 3, 94-105.
Cheung, G. W., & Rensvold, R. B. (2002). Evaluating goodness-of-fit indexes for testing
measurement invariance. Structural Equation Modeling, 9, 233-255.
Cheung, G.W., & Rensvold, R.B. (1999). What constitutes significant differences in
evaluating measurement invariance? Paper presented at the Conference of the
Academy of Management, Chicago.
Clark, L. A., & Watson, D. (1995). Constructing validity: Basic issues in objective scale
development. Psychological Assessment, 7, 309-319.
30
Cohen, J (1992). A power primer. Psychological Bulletin, 112, 155–159.
Geisinger, K.F. (1994). Cross-cultural normative assessment: Translation and adaptation
issues influencing the normative interpretation of assessment instruments.
Psychological Assessment, 6, 304-312.
Harkness, J. A. (2003). Questionnaire translation. In J. A. Harkness, F. J. R. Van de
Vijver, & P. P. Mohler (Eds.), Cross-cultural survey methods (pp. 35-56). Hoboken,
NJ: John Wiley & Sons, Inc.
Hu, L.-T., & Bentler, P. (1995). Evaluating model fit. In R. H. Hoyle (Ed.), Structural
equation modeling: Concepts, issues, and applications (pp. 76-99). London: Sage.
Klann, N., Hahlweg, K., & Hank, G. (1992). Deutsche validierung des “Marital
Satisfaction Inventory” (MSI) von Snyder (1981). System Familie, 5, 10-21.
Klann, N., Hahlweg, K., Limbird, C., & Snyder, D.K. (2006). Einschätzung von
Partnerschaft und Familie: Deutchse Form des Marital Satisfaction Inventory –
Revised (MSI-R) von Douglas K. Snyder. Göttingen: Hogrefe Verlag GmbH & Co.
Kwon, J.H., & Choi, K.M. (1999). A validation study of the Korean Marital Satisfaction
Inventory. Korean Journal of Clinical Psychology, 18, 123-139.
Reig-Ferrer, A., Cepeda-Benito, A., & Snyder, D.K. (2004). Utility of the Spanish
Translation of the Marital Satisfaction Inventory-Revised in Spain. Assessment, 11,
17-26.
Reise, S.P., Widaman, K.F., & Pugh, R.H. (1993). Confirmatory factor analysis and item
response theory: Two approaches for exploring measurement invariance.
Psychological Bulletin, 114, 552-566.

31
Snyder, D.K. (1997). Manual for the marital satisfaction inventory–revised. Los
Angeles: Western Psychological Services.
Steiger, J.H. (1990). Structural model evaluation and modification: An interval estimate
approach. Multivariate Behavioral Research, 25, 173-180.
Tucker, L.R., & Lewis, C. (1973). A reliability coefficient for maximum likelihood
factor analysis. Psychometrika, 38, 1-10.
van de Vijver, F. J. R., & Leung, K. (1997). Methods and data analysis for cross-
cultural research. Thousand Oaks, CA: Sage.
Vandenberg, R., & Lance, C. (2000). A review and synthesis of the measurement
invariance literature: Suggestions, recommendations, and practices for organizational
research. Organizational Research Methods, 3, 4-70.
Walsh, F. (Ed.). (2003). Normal family processes: Growing diversity and complexity (3rd
ed.). New York: Guilford.
Wothke, W. (1993). Nonpositive definite matrices in structural modeling. In K.A. Bollen
& J.S. Long (Eds.) Testing structural equation models (pp. 256
-
293). Newbury Park, CA:
Sage Publications.
32
APPENDIX
Table 1. Internal Consistency Coefficients for MSI-R Profile Scales
United Statesa Germanyb Spainc Koread Scale
Α r α r α r α r INC n/a n/a n/a n/a n/a n/a n/a n/a
Total CNV Men
Women
.83
.82
.84
.33
.31
.34
.85
.84
.85
.36
.34
.36
.79
.77
.80
.28
.26
.28
.80
.80
.78
.29
.28
.27 Total
GDS Men Women
.93
.92
.94
.39
.34
.43
.94
.93
.94
.41
.37
.44
.91
.89
.91
.31
.29
.34
.93
.93
.93
.39
.38
.39 Total
AFC Men Women
.85
.83
.86
.31
.29
.32
.88
.88
.88
.36
.36
.45
.84
.83
.85
.30
.28
.31
.82
.79
.84
.27
.24
.28 Total
PSC Men Women
.89
.88
.90
.30
.29
.32
.91
.92
.91
.37
.39
.46
.88
.88
.89
.28
.27
.30
.85
.84
.86
.23
.22
.25 Total
AGG Men Women
.81
.80
.82
.30
.29
.32
.83
.82
.85
.35
.32
.37
.75
.74
.77
.25
.24
.26
.78
.71
.81
.27
.21
.29 Total
TTO Men Women
.80
.78
.81
.29
.27
.31
.88
.87
.89
.42
.40
.44
.76
.74
.78
.25
.23
.27
.74
.69
.77
.22
.18
.25 Total
FIN Men Women
.79
.77
.81
.25
.23
.21
.77
.79
.83
.26
.26
.31
.73
.72
.73
.20
.20
.20
.73
.68
.76
.19
.16
.22 Total
SEX Men Women
.84
.86
.81
.29
.32
.25
.87
.90
.84
.34
.40
.31
.85
.86
.83
.30
.32
.28
.80
.80
.80
.24
.24
.24 Total
ROR Men Women
.83
.82
.85
.29
.27
.31
.79
.81
.74
.35
.29
.21
.80
.83
.75
.27
.29
.22
.72
.70
.72
.17
.16
.17

33
Table 1 continued.
United States Germany Spain Korea Total
FAM Men Women
.79
.77
.80
.29
.27
.31
.79
.76
.81
.30
.26
.32
.74
.72
.76
.24
.23
.26
.75
.72
.78
.25
.22
.27 Total
DSC Men Women
.65
.66
.64
.16
.16
.15
.70
.72
.68
.20
.21
.19
.69 .70
.68
.19
.19
.18
.72
.73
.71
.19
.20
.19 Total
CCR Men Women
.76
.72
.78
.24
.20
.26
.81
.81
.81
.30
.28
.31
.73
.67
.75
.21
.16
.24
.74
.72
.76
.22
.20
.24 Note. Coefficients are derived from pooled community and clinical samples. α = Cronbach’s alpha, and r = mean inter-item correlation.
antotal = 2139 (1494 for DSC and CCR); nmen = 1069 (744 for DSC and CCR); nwomen =
1070 (750 for DSC and CCR). bntotal = 401 (323 for DSC and 325 CCR); nmen = 167 (136 for DSC and CCR); nwomen =
231 ( 185 for DSC and CCR). cntotal = 1346 (797 for DSC and CCR); nmen = 673 (401 for DSC and CCR); nwomen = 673
(396 for DSC and CCR). dntotal = 1063 ( 817 for DSC and CCR); nmen = 474 (359 for DSC and CCR); nwomen = 571
(444 for DSC and CCR).
34
Table 2. Intercorrelations Among MSI-R Scales for Spanish Men (Above Diagonal) and Women (Below Diagonal) Scales INC CNV GDS AFC PSC AGG TTO FIN SEX ROR FAM DSC CCR
INC — -0.38 0.46 0.39 0.41 0.45 0.36 0.43 0.40 -0.2 0.22 0.33 0.30
CNV -0.4 — -.73 -.70 -.71 -0.41 -.61 -.47 -.49 -.11 -0.23 -.29 -.43
GDS 0.44 -0.70 — 0.73 0.68 0.53 0.59 0.60 0.51 -.17 0.29 0.43 0.51
AFC 0.41 -0.73 0.75 — 0.75 0.41 0.64 0.54 0.57 -.25 0.23 0.39 0.46
PSC 0.42 -0.74 0.73 0.78 — 0.46 0.62 0.54 0.54 -.27 0.22 0.39 0.50
AGG 0.50 -0.39 0.53 0.40 0.47 — 0.27 0.43 0.24 -.15 0.13 0.31 0.32
TTO 0.37 -0.62 0.63 0.70 0.62 0.33 — 0.45 0.52 -.17 0.23 0.31 0.37
FIN 0.47 -0.43 0.57 0.47 0.50 0.46 0.42 — 0.41 -.29 0.26 0.35 0.42
SEX 0.44 -0.49 0.62 0.58 0.54 0.40 0.50 0.44 — -.22 0.15 0.36 0.34
ROR -.39 0.07 -.17 -.22 -.20 -.39 -.16 -.25 -.21 — -.05 -.23 -.19
FAM 0.20 -0.25 0.27 0.23 0.21 0.18 0.19 0.23 0.21 -.01 — 0.28 0.27
DSC 0.40 -0.25 0.40 0.28 0.37 0.35 0.22 0.33 0.37 -.17 0.22 — 0.63
CCR 0.34 -0.48 0.56 0.52 0.54 0.35 0.44 0.42 0.37 -.12 0.17 0.46 —
Note. Coefficients are derived from pooled community and clinical samples.
n for men = 673 (401 for DSC and CCR); n for women = 673 ( 396 for DSC and CCR).

35
Table 3. Intercorrelations Among MSI-R Scales for German Men (Above Diagonal) and Women (Below Diagonal) Scales INC CNV GDS AFC PSC AGG TTO FIN SEX ROR FAM DSC CCR
INC — -0.22 0.09 0.12 0.13 0.11 0.17 0.12 0.21 -.13 -.01 -.12 -.12
CNV -.27 — -.72 -.67 -.64 -.45 -.58 -.31 -.48 -.01 -0.19 -.16 -0.41
GDS 0.14 -0.78 — 0.80 0.81 0.52 0.80 0.49 0.53 -.03 0.24 0.30 0.54
AFC 0.17 -0.71 0.83 — 0.79 0.39 0.80 0.46 0.60 -.11 0.15 0.27 0.45
PSC 0.16 -0.70 0.83 0.80 — 0.54 0.76 0.48 0.47 -.09 0.18 0.30 0.48
AGG 0.16 -0.42 0.51 0.41 0.51 — 0.40 0.37 0.31 0.02 0.20 0.04 0.30
TTO 0.10 -0.61 0.78 0.76 0.69 0.34 — 0.45 0.62 -.17 0.14 0.23 0.42
FIN 0.13 -0.38 0.49 0.37 0.44 0.41 0.44 — 0.27 -.09 0.21 0.26 0.40
SEX 0.06 -0.56 0.61 0.59 0.49 0.29 0.50 0.21 — -.05 0.13 0.03 0.18
ROR -.09 -0.17 0.03 0.02 -.06 0.04 -.07 -.01 -.03 — 0.19 -.16 -.03
FAM -.03 -0.24 0.26 0.23 0.22 0.15 0.14 0.16 0.24 0.00 — 0.21 0.23
DSC -.13 -0.19 0.27 0.24 0.29 0.14 0.28 0.22 0.07 -.03 0.28 — 0.53
CCR -.09 -0.47 0.63 0.50 0.55 0.39 0.58 0.41 0.31 -.03 0.16 0.38 —
Note. Coefficients are derived from pooled community and clinical samples.
n for men = 167 (134 for DSC and CCR); n for women = 231 (184 for DSC and CCR).

36
Table 4. Intercorrelations Among MSI-R Scales for Korean Men (Above Diagonal) and Women (Below Diagonal) Scales INC CNV GDS AFC PSC AGG TTO FIN SEX ROR FAM DSC CCR
INC — -0.26 0.25 0.25 0.26 0.24 0.12 0.31 0.18 0.02 0.17 0.10 0.16
CNV -.31 — -.64 -.67 -.72 -0.38 -.54 -.45 -.47 0.07 -0.22 -.23 -.42
GDS 0.10 -.65 — 0.77 0.75 0.47 0.66 0.52 0.56 -.04 0.40 0.35 0.55
AFC 0.11 -0.65 0.75 — 0.71 0.37 0.65 0.46 0.57 -.11 0.35 0.39 0.53
PSC 0.17 -0.68 0.75 0.72 — 0.54 0.60 0.54 0.51 -.14 0.29 0.27 0.42
AGG 0.14 -0.43 0.54 0.40 0.59 — 0.31 0.40 0.25 0.00 0.19 0.11 0.29
TTO 0.06 -0.52 0.69 0.71 0.58 0.35 — 0.44 0.50 -.10 0.28 0.34 0.45
FIN 0.17 -0.47 0.62 0.51 0.57 0.47 0.50 — 0.33 -.12 0.32 0.27 0.39
SEX 0.15 -0.45 0.62 0.58 0.53 0.30 0.51 0.41 — -.07 0.24 0.33 0.31
ROR 0.01 -0.18 0.14 0.04 -.00 -.07 0.07 -.04 0.00 — -.06 -.05 0.00
FAM 0.17 -0.21 0.36 0.25 0.28 0.20 0.26 0.26 0.28 -.00 — 0.26 0.35
DSC 0.12 -0.25 0.26 0.30 0.28 0.16 0.26 0.17 0.30 -.16 0.26 — 0.53
CCR .08 -.50 0.55 0.57 0.58 0.41 0.50 0.40 0.45 0.07 0.23 0.51 —
Note. Coefficients are derived from pooled community and clinical samples.
n for men = 474 (357 for DSC and CCR); n for women = 571 (440 for DSC and CCR).

37
Table 5. Tests of Invariance Across U.S., Spanish, German, and Korean Community Men and Women
Invariance Test χ2 df RMSEA NNFI CFI ΔCFI
Configural Invariance 715.646 160 .0952 .969 .978 ---
Metric Invariance 972.073 209 .0976 .967 .970 .008
Scalar Invariance 2051.922 258 .135 .934 .924 .046
Uniqueness Invariance 2575.930 314 .137 .937 .912 .012
Invariant Factor Variances 2743.42 321 .140 .934 .905 .007
Note. n for U.S. men = 705; n for U.S. women = 711; n for Spanish men = 383; n for
Spanish women = 380; n for German men = 59; n for German women = 94; n for
Korean men = 329; n for Korean women = 413.
RMSEA = root mean square error of approximation; NNFI = non-normed fit index; CFI
= comparative fit index.
38
Table 6. Mean Scale Comparisons in Community Samples Across Nationality U.S.a Germanyb Spainc Koread
Scale M SD M SD M SD M SD
INC 50.35 9.84 51.84 8.41 52.00 9.58 57.90 8.59
CNV 50.14 9.55 49.33 9.60 53.40 8.61 45.35 8.82
GDS 50.17 9.21 53.69 6.80 52.46 7.73 54.22 8.39
AFC 50.31 9.26 50.04 8.98 50.01 9.18 54.50 8.63
PSC 50.05 9.68 48.52 9.15 50.94 7.99 54.26 7.92
AGG 50.28 9.05 48.70 8.45 49.80 8.24 55.14 8.09
TTO 50.11 9.47 46.36 9.04 49.74 8.75 54.69 7.97
FIN 50.26 9.41 42.24 6.75 47.30 8.33 53.03 8.25
SEX 50.13 9.55 50.13 10.88 47.68 9.46 48.22 8.44
ROR 49.97 9.63 59.57 7.27 60.19 8.19 46.56 6.92
FAM 50.06 9.51 53.56 9.07 48.33 8.71 48.63 8.67
DSC 50.31 9.43 49.19 7.91 49.64 10.20 52.61 11.19
CCR 50.46 8.90 47.60 7.88 50.41 8.59 56.20 9.67 Note. an = 2039 (1416 for DSC and CCR); bn =202 (153 for DSC and CCR); cn = 1297
(763 for DSC and CCR); dn = 967 (742 for DSC and CCR).
39
Table 7. Mean Scale Comparisons in Clinical Samples Across Nationality
U.S.a7 Germanyb Spainc Koread Scale
M S.D M SD M SD M SD
INC 53.79 7.53 54.21 9.09 56.00 8.16 54.24 8.92
CNV 38.57 5.85 41.04 7.73 41.69 7.04 36.79 5.17
GDS 64.93 6.89 64.30 8.23 62.98 6.59 69.13 5.23
AFC 61.28 7.73 60.63 8.17 60.98 6.73 65.23 6.90
PSC 62.51 7.75 61.70 8.78 60.71 6.91 66.13 6.96
AGG 56.94 10.33 54.93 9.64 53.73 9.34 61.96 7.86
TTO 60.13 8.16 59.11 10.21 61.20 7.76 65.19 7.86
FIN 57.42 10.61 48.69 9.80 51.18 9.40 57.53 8.59
SEX 56.29 10.33 56.90 10.99 54.47 9.79 56.44 9.89
ROR 53.97 7.26 58.39 8.30 62.43 7.14 51.37 7.66
FAM 54.56 9.58 56.43 8.88 50.20 8.61 52.31 8.04
DSC 54.64 11.34 52.94 10.22 50.74 8.25 51.78 8.93
CCR 57.87 11.17 55.45 10.18 54.32 6.99 62.84 9.90 Note. an = 100 (78 for DSC and CCR); bn = 196 (165 for DSC and CCR); cn = 49 (43
for DSC and CCR); dn = 77 (55 for DSC and CCR).
40
VITA
Molly Faithe Gasbarrini received her B.A. in psychology and music from The
State University of New York at Buffalo in 2001. She entered the Clinical Psychology
program at Texas A&M University in September 2007 and received her M.S. in 2010.
Her research interests include marital satisfaction and couple therapy.
Ms. Gasbarrini may be reached at Texas A&M University, Department of
Psychology, Mailstop 4235, College Station, TX, 77843. Her email is