Thesis Final Report - elib.dlr.de · Bachelor Thesis Final Report 09 June 2008 Markus Kunde II...
97
Bachelor Thesis Final Report 09 June 2008 Markus Kunde 1 Bachelor Thesis Final Report Markus Kunde 09 June 2008
-
Upload
phungnguyet -
Category
Documents
-
view
216 -
download
0
Transcript of Thesis Final Report - elib.dlr.de · Bachelor Thesis Final Report 09 June 2008 Markus Kunde II...

Bachelor Thesis
Final Report 09 June 2008
Markus Kunde
1
Bachelor Thesis Final Report Markus Kunde 09 June 2008

Bachelor Thesis
Final Report 09 June 2008
Markus Kunde
I
Title
Visualization-Panel for Provenance Data
Institute: Fontys Hogeschool Techniek en Bedrijfsmanagement Postbus 141, 5900 AC Venlo, Netherlands
Name of student: Markus Kunde
Matriculation number: 2057085
Degree course: Informatics – Software Engineering
Period of bachelor thesis: 02.2008 – 06.2008
Name of employer: Deutsches Zentrum fuer Luft- und Raumfahrt e.V.
German Aerospace Center
Address: Linder Hoehe
Zip code, City: 51147 Cologne
Country: Germany
Telephone: +49 2203 601 0
Company tutor: Andreas Schreiber
University lecturer: Uwe van Heesch
External assessor N. Roelofs
Nondisclosure: No

Bachelor Thesis
Final Report 09 June 2008
Markus Kunde
II
Declaration I hereby declare that the work presented in this thesis is solely my work and that to the best of my knowledge this work is original, except where indicated by references to other authors. No part of this work has been submitted for any other degree or diploma.
Markus Kunde, 09.06.2008

Bachelor Thesis
Final Report 09 June 2008
Markus Kunde
III
Abstract Today’s IT-systems are becoming more difficult. Their relationship together grows as well as their complexity. Currently a main requirement is for people to trust more in the results and have a better understanding of the functionality. Provenance as a technical idea is a good approach for comprehending the operation of an IT-system. It will record every occurring event and its associated parts. With understanding it is possible to have a way for tracing decisions and data transformation in the system to understand the outcome of it. The Provenance idea is currently a research field. One of the involved institutes is the German Aerospace Center. The department “Simulation and Software Technology” is interested in the ongoing Provenance approach. A present research theme, covered by this bachelor thesis, is the visualization of the Provenance data and therefore the evaluation of possible interpretation approaches. Additionally, the software architecture for this Visual Information Seeking System is questioned. The bachelor thesis is divided into three main phases. The first one is an analysis the Provenance data itself as well as the user and their requirements regarding the Provenance system. The second deals with the creation of visualization-concepts for the Provenance data. The complete software architecture was developed in the last main phase. The final results consist of the outcome of all three main phases of the project as well as a final evaluation of them. At first, the analysis of the fundamental data and the user requirements were made to create an initial assertion about visualization possibilities. The analysis is divided between different intentions of the user regarding the Provenance data and their allocation to general visualization types. These general first assertions were the basis for the final visualization-concepts, developed in main phase 2. A visualization map, dividing the concepts into different detail level and scope size, gives the overall view about the visualization possibilities. The concepts describe the transformation of the raw data to the final view with respect to the reference model for visualization. General concepts like the representation legend, system-wide techniques or the concept of the mental map are considered as well as the elaboration of each individual one depending on its place in the visualization map. The individual build-up, its behavior and its behind algorithm is shown. Finally, the concepts were evaluated to have a first statement of their profitability, but also their limitations. In main phase 3, the developed system architecture of the visualization-panel is developed in a component-based approach. The architecture is independent of the programming-language and describes a general implementation strategy. Just as well as the visualization-concepts, it is also a kind of generic nature. A concrete implementation of both results forces the need for the evaluation of concrete properties of the field of application.

Bachelor Thesis
Final Report 09 June 2008
Markus Kunde
IV
Zusammenfassung In der heutigen Zeit wird die Situation von IT-Systemen immer unübersichtlicher. Die Beziehungen der einzelnen Systeme untereinander wachsen genauso wie deren Komplexität. Eine wichtige Anforderung an heutige IT-Systeme ist die Nachvollziehbarkeit von berechneten Ergebnissen und somit das gesteigerte Vertrauen in diese sowie das bessere Verständnis der Funktionalität im Allgemeinen. Provenance, als ein technisches Konzept, scheint ein guter Ansatz für die Nachvollziehbarkeit der Prozesse innerhalb eines IT-Systems zu sein. Jedes auftretende Ereignis und die zugehörigen Informationen werden aufgezeichnet. Mit dieser Nachvollziehbarkeit ist es möglich einen Weg durch die Entscheidungsfindung und Datentransformation in dem System zu erstellen, um das Resultat zu verstehen. Das Konzept von Provenance ist ein momentan laufendes Forschungsfeld. Eines der involvierten Institute ist das Deutsche Zentrum für Luft- und Raumfahrt e. V.. Die Einrichtung „Simulations- und Softwaretechnik“ ist interessiert an der Weiterentwicklung des Provenance Ansatzes. Ein aktuelles Thema, welches mit dieser Bachelor Thesis abgedeckt wird, ist die Visualisierung von Provenance Daten und damit die Evaluation von möglichen Interpretationsansätzen. Des Weiteren wird eine Softwarearchitektur für dieses so genannte „Visual Information Seeking System“ gewünscht. Die vorliegende Bachelor Thesis ist in drei Hauptphasen aufgeteilt. Die erste Projektphase beinhaltet die Analyse der Provenance Daten, der Benutzer und deren Anforderungen hinsichtlich des Provenance Visualisierungssystems. Die zweite Phase befasst sich mit der Erstellung der Visualisierungskonzepte für die Provenance Daten. Die komplette Softwarearchitektur wurde in der letzten Hauptphase entwickelt. Die in diesem Bericht beschriebenen Endresultate bestehen aus den Ergebnissen aller drei Projektphasen und deren Evaluation. Als erstes wurde die Analyse der Ausgangsdaten und der Benutzeranforderungen durchgeführt, um eine erste Aussage über Visualisierungsmöglichkeiten zu erstellen. Die Analyse unterscheidet zwischen den verschiedenen Intentionen der Benutzer hinsichtlich der Provenance Daten und der Zuordnung zu generellen Visualisierungstypen. Diese generellen ersten Aussagen über eine Visualisierung waren die Basis für die endgültigen Visualisierungskonzepte, welche in Hauptphase 2 entwickelt wurden. Eine Visualisierungskarte, die einzelne Konzepte in verschiedene Detaillevel und Wertebereiche aufteilt, gibt einen Überblick über die Visualisierungsmöglichkeiten. Die Konzepte beschreiben hierbei die Transformation der Rohdaten zu der finalen „Sicht“ (engl.: View) in Übereinstimmung mit dem Referenzmodell für Visualisierung. Generelle Konzepte wie die Repräsentationslegende, systemweite Techniken oder das Konzept der „Mental Map“ wurden genauso berücksichtigt wie die Ausarbeitung der jeweiligen individuellen Konzepte hinsichtlich ihrer Einordnung in die Visualisierungskarte. Der individuelle Aufbau einer Visualisierung, das Verhalten und der dahinterliegende Algorithmus werden ebenfalls erwähnt. Im Anschluss an die Erstellung wurden die Konzepte in Bezug auf ihre Nützlichkeit und auf ihre Grenzen hin evaluiert. In der Hauptphase 3 wurde die entwickelte Systemarchitektur des Visualisierungs-Panels als komponentenbasierter, in verschiedene Schichten aufgeteilter Ansatz entwickelt. Die Architektur ist hierbei programmiersprachen-unabhängig und beschreibt eine generelle Implementierungs-Strategie. Genauso wie die Visualisierungskonzepte ist die Systemarchitektur von allgemeiner Natur. Eine konkrete Implementierung beider Resultate erfordert eine erneute Evaluation der konkreten spezifischen Eigenschaften des Einsatzgebietes.

Bachelor Thesis
Final Report 09 June 2008
Markus Kunde
V
Preface This report describes the creation of visualization-concepts for Provenance data and the development of the system architecture for a Visual Information Seeking System. The system depends on the Information Seeking Process of an information seeker and includes cognition within different visualization branches and implements the created visualization-concepts. Regarding the widely unknown topic “Provenance” a short analysis and evaluation of this domain is undertaken in respect to the visualization-concepts and the system architecture. The paper is the final report of the degree course “Informatics – Software Engineering” at the Fontys Hogeschool Techniek en Bedrijfsmanagement (FHTBM) in Venlo, Netherlands, for the purpose of obtaining the Bachelor Degree. The results acquired in this report describe visualization possibilities within Provenance data and gives a recommendation about the build-up for a Visual Information Seeking System. As this project is done in a research context for the German Aerospace Center, a concrete implementation within a concrete application domain leads to a specific evaluation of the domain. Perhaps it gives the impulse for changing the concepts. As well as this, the report provides a basis for the mentoring tutors for judging the performance of the degree candidate. For better understanding, Information Technology knowledge as well as fundamental visualization technique knowledge is necessary. A very brief introduction about Provenance as a topic is given as well as the concepts used for the visualization techniques. I would like to specifically thank my company tutors Andreas Schreiber, Henning Bergmeyer, who supported me in all phases of the project. The time they dedicated to any concerns I had was not taken for granted and was particularly helpful in the early stages. I would also like to thank all the other employees who supported me and gave me advice on a number of occasions. I would like to thank my family as well as my partner for their guidance and encouragement. I would also like to thank those who proofread the text. From my University, I would like to thank Mr. van Heesch for his professional and friendly assistance, which helped me prepare this report. Finally much of the credit must go to Mr. Roelofs who gives me recommendation during the intermediate presentation. Cologne, 09 June 2008 Markus Kunde

Bachelor Thesis
Final Report 09 June 2008
Markus Kunde
VI
Index of Contents
Title I
Declaration II
Abstract III
Zusammenfassung IV
Preface V
Index of Contents VI
Index of Figures VIII
Index of Tables IX
Index of Appendixes X
Glossary XI
Index of Abbreviations XIII
1. Introduction 1
2. Company Profile 2 2.1. Facts 2 2.2. Department 2
3. Project 3 3.1. Project Description and Problem Definition 3 3.2. Objectives and Results 3 3.3. Procedural Method in the Project 3 3.4. Scope of the Project 7
4. Theoretical Background 8
4.1. Provenance in General 8 4.1.1. Intention 8 4.1.2. Functionality 8 4.1.3. Technical 9
4.2. Applied Visualization Techniques 10 4.2.1. Visualization 10 4.2.2. Visualization Approaches 10 4.2.3. Information Seeking Process 11 4.2.4. Mental Model 12 4.2.5. Color, Form and Property of Elements 13 4.2.6. Layout Algorithms and Aesthetics 14
5. Results 17
5.1. Provenance Architecture Analysis 17 5.1.1. Tabular Collection of Useful Information 17

Bachelor Thesis
Final Report 09 June 2008
Markus Kunde
VII
5.2. User and User Requirements Analysis 19 5.2.1. Identified User 19 5.2.2. Application Area 19 5.2.3. User Groups 20 5.2.4. Generalized User Requirements 20 5.2.5. Visualization Possibility 22 5.2.6. First Visualization Examples for Evaluation 23 5.2.7. Non-Functional Requirements 23
5.3. Visualization-concepts 23 5.3.1. General Visualization-concept 23 5.3.2. Concrete Visualization-concept Example “Process Landscape” 27
5.4. System Architecture 30 5.4.1. System Requirements 30 5.4.2. System Build-Up 31
6. Conclusion and Evaluation 34
References 36
Appendix 39

Bachelor Thesis
Final Report 09 June 2008
Markus Kunde
VIII
Index of Figures Figure 1: Reference Model for Visualization; Source: slightly modified model for visualization adapted from (Card, Mackinlay, Shneiderman, 1999); Source: (Mann, 2002) .............................................................................. 4 Figure 2: Visualization Process of Ben Fry; Source: (Fry, 2007) ............................................................................... 6 Figure 3: Overall Timeline; Source: own illustration................................................................................................ 6 Figure 4: Structure of the Provenance Functionality; Source: own illustration ....................................................... 8 Figure 5: Simplified diagram of the standard model of the Information Seeking Process according to (Hearst, 1999); Source: (Mann, 2002)................................................................................................................................. 11 Figure 6: High Level Tasks by (Hearst 1999; Shneiderman 1998); Source: (Mann, 2002) ..................................... 12 Figure 7: Impact of different intended Mental Models; Source (Khella, 2002) ..................................................... 13 Figure 8: Visualization Map; Source: own illustration........................................................................................... 24 Figure 9: Presentation Legend; Source: own illustration....................................................................................... 24 Figure 10: Sketch Process Landscape Visualization‐concept; Source: own illustration ......................................... 28 Figure 11: Color Hexagon with six selected colors; Source (Crüger, 2008)............................................................ 29 Figure 12: System Architecture of VISS; Source: own illustration.......................................................................... 31

Bachelor Thesis
Final Report 09 June 2008
Markus Kunde
IX
Index of Tables Table 1: Visualization Approach of Ben Fry; Source: own illustration..................................................................... 5 Table 2: Low level tasks; Source: (Shneiderman, 1998) ........................................................................................ 12 Table 3: Types of Layout Algorithms; Source: own illustration ............................................................................. 15 Table 4: Sugiyama algorithm; Source: (Kaufmann, Wagner, 2001)...................................................................... 15 Table 5: Aesthetics criteria of graphs; Source: (Kaufmann, Wagner, 2001) ......................................................... 16 Table 6: Description of each Provenance element; Source: own illustration ........................................................ 19 Table 7: Types of the user requirements; Source: own illustration ....................................................................... 21 Table 8: Classification of the user requirements; Source: (Kloss, 2006) ................................................................ 22 Table 9: Visualization assertions; Source: own illustration ................................................................................... 22 Table 10: Color Codes for Visual Elements; Source: own illustration .................................................................... 25 Table 11: System‐wide manipulation techniques; Source: own illustration.......................................................... 26 Table 12: Additional Interest; Source: own illustration ......................................................................................... 27 Table 13: Data Table “Actor‐states” of Visualization‐concept; Source: own illustration ...................................... 28 Table 14: Data Table “Interactions” of Visualization‐concept; Source: own illustration ...................................... 28 Table 15: Data Table “Relationship” of Visualization‐concept; Source: own illustration...................................... 28 Table 16: Data Table “Connection” of Visualization‐concept; Source: own illustration........................................ 29 Table 17: Manipulation Technique of Visualization‐concept; Source own illustration ......................................... 30 Table 18: System Requirements of VISS; Source: own illustration ........................................................................ 31
Bachelor Thesis
Final Report 09 June 2008
Markus Kunde
X
Index of Appendixes
1. Appendix: Provenance XML Structure 40
2. Appendix: Functional Requirements 41
3. Appendix: Non-Functional Requirements 45
4. Appendix: Standard Visualization Examples 46
5. Appendix: Visualization-concept “ResultSet” 49
6. Appendix: Visualization-concept “Process Overview” 50
7. Appendix: Visualization-concept “System Context” 53
8. Appendix: Visualization-concept “Combined Flow Chart” 59
9. Appendix: Visualization-concept “Process Aerial” 62
10. Appendix: Visualization-concept “Interaction Stretch” 66
11. Appendix: Visualization-concept “Actor Detail” 69
12. Appendix: Visualization-concept “Interaction Detail” 72
13. Appendix: Visualization-concept “Spreadsheet” 74
14. Appendix: Visualization-concept “Compare/Difference” 76
15. Appendix: Requirements Coverage 80
16. Appendix: System Sequence Diagrams of VISS 82

Bachelor Thesis
Final Report 09 June 2008
Markus Kunde
XI
Glossary Term Description
Actor-State P-Assertion “An actor state p-assertion is an assertion, by an actor, of data received
from an (unspecified) internal component of the actor just before, during or just after a message is sent or received. It can, therefore, be viewed as documenting part of the state of the actor at an instant, and may be the cause, but not effect, of other events in a process.” (Groth et al. B, 2006)
Columbus Control Center “Columbus is a multi-purpose laboratory for multi-disciplinary research into weightlessness. It is 6.9 meters long with a diameter of 4.5 meters. It is equipped for material and life sciences research, fluid research and the development of new technologies… The laboratory is operated by the European Columbus control centre within the German aerospace control centre of the German Aerospace Agency (DLR) in Oberpfaffenhofen.” (German Aerospace Center_c, published on internet [Query: 18/03/2008 15:00h])
Client Side Library The client side library is the only connection point (interface) of the client-side to a server component. It encapsulates all connection details and it gives a standardized way for communication.
Distributed systems “A collection of (probably heterogeneous) automata whose distribution is transparent to the user so that the system appears as one local machine. This is in contrast to a network, where the user is aware that there are several machines, and their location, storage replication, load balancing and functionality is not transparent. Distributed systems usually use some kind of client-server organization. Distributed systems are considered by some to be the "next wave" of computing.“ (Datasegment, published on internet [Query: 18/03/2008 15:00h])
Fundamental research “…Investigation conducted for the primary purpose of discovering new facts about natural phenomena, or to elaborate or test theories about natural phenomena, is called basic research or fundamental research…” (Datasegment, published on internet [Query: 18/03/2008 15:00h])
Grid computing “Grid is a type of parallel and distributed system that enables the sharing, selection, and aggregation of geographically distributed "autonomous" resources dynamically at runtime depending on their availability, capability, performance, cost, and users' quality-of-service requirements.” (Gridcomputing, published on internet [Query: 18/03/2008 15:00h])
Interaction P-Assertion “An interaction p-assertion is an assertion of the contents of a message by an actor that has sent or received that message; the message must include information that allows it to be identified uniquely.” (Groth et al. B, 2006)

Bachelor Thesis
Final Report 09 June 2008
Markus Kunde
XII
Term Description
Lazy-Loading In this design-pattern data will only be fetched if needed. (cp. Fowler, 2003). Its paradigm is “Load-On-Demand”.
P-Assertion “A p-assertion is an assertion that is made by an actor and pertains to a process.” (Groth et al. B, 2006)
Point of Interest The fact or item, which is in the focus of users’ view.
Process A process or workflow is defined as a named initial- and ending point of an action-chain and the complete involved interaction steps. More detailed, a process is the result of the evaluation of all relationships between the interactions and represents the connected graph of them.
Provenance “The Provenance of a piece of data is the process that led to that piece of data.” (Groth et al. B, 2006)
Provenance Store “A Provenance store is a repository dedicated for purpose of storing p-assertions created by asserting actors, and subsequently retrievable by querying actors.” (Groth et al. B, 2006)
Relationship P-Assertion “A relationship p-assertion is an assertion by an actor that the sending of a message would not be occurring or a data item it is sending would not be as it is (the effect), if it had not received other messages or data items had not been as they are (the causes), and that this relationship is due to its own action, expressible as the function applied to the causes to produce the effect.” (Groth et al. B, 2006)
Sink The address to which an interaction message was sent. (Groth et al., 2006)
Source “The address from which an interaction message was sent.” (Groth et al. B, 2006)
Visual Information Seeking System
A Visual Information Seeking System is an IT-system that supports the user in formulating his information needs and gives visual representation possibilities of the search results.
XQuery “XQuery is the language for querying XML data” (w3schools, published on internet [Query: 18/03/2008 15:00h])

Bachelor Thesis
Final Report 09 June 2008
Markus Kunde
XIII
Index of Abbreviations Abbreviation Long Text
CSL Client Side Library cp. compare DLR Deutsches Zentrum fuer Luft- und Raumfahrt e.V.
German Aerospace Center
e.g. For example
incl. including IPAW 2008 Second International Provenance and Annotation Workshop POI Point of Interest VISS Visual Information Seeking System WSDL Web Services Description Language XML Extensible Markup Language

Bachelor Thesis
Final Report 09 June 2008
Markus Kunde
1
1. Introduction In today’s simulation environments in aviation and aerospace business, complex simulation workflows are executed in distributed systems. In order to understand the more and more unmanageable evolution of results in such environments, detailed process information, Provenance data, has to be recorded and analyzed. Provenance is, in general, recorded data about the action sequence in an IT-system for reconstructing and understanding these action sequences. Good approaches for implementation of the recording of Provenance data are available, but the analysis and evaluation of Provenance data is still a current research theme. Provenance can hereby assigned onto all cogitable business sections. The idea of Provenance is that a process is completely understood, analyzable and therefore confidential with Provenance data. The fundamental idea comes originally from the field of art or archaeology where traceability of an item without interruption is needed. This principle was pioneered by the University of Southampton and adapted to the field of informatics as a research subject. Among others, the German Aerospace Center was highly involved in this research. The target of the bachelor thesis is to develop and evaluate a collection of visualization-concepts for Provenance data according to its need of interpretation. These generalized concepts deal with the field of interpretation of Provenance data. Besides the visualization techniques, an instruction for the development of concrete software implementations must be developed. Therefore, the system architecture will be evolved and evaluated. The aim of this report is to present the final findings of the bachelor thesis project as well as giving an overview about the project in general. Therefore, the final results will be presented and a conclusion will give a brief evaluation of the project steps. As the project phase will last longer than the closing date for this report, the subsequent results will be presented during the final presentation. The rest of this paper is organized as follows. Chapter 2 presents the German Aerospace Center as a company and gives a short overview about the department. In chapter 3 the project assignment is presented as well as the procedural method used in the project or the expected end-result. Also the scope of the project will be outlined. Chapter 4 gives a brief overview about the idea of Provenance in general as well as a rough functionality description. A brief introduction in the applied visualization techniques is given in this chapter, too. The results of this project are covered in chapter 5. The 6th chapter is a short conclusion about the project including a brief evaluation.

Bachelor Thesis
Final Report 09 June 2008
Markus Kunde
2
2. Company Profile This chapter introduces the German Aerospace Center as the employer for the bachelor thesis. A brief description of the company and the department is given.
2.1. Facts The German Aerospace Center, DLR, is the research facility of the federal republic of Germany regarding for aviation and aerospace. It acts in cooperation with national and international establishments in the field of aviation, aerospace, energy and traffic. Besides having a research function, the DLR is responsible for the planning and execution of the German aerospace activities. The mission includes:
• The discovering and study of the earth and the solar-system • Undertaking research for conservation of nature and natural resources • The development of ecological technologies for improving mobility, communication and
security
The research includes fundamental research as well as the developing of applications and products of tomorrow. Perhaps one best known product is the Columbus Control Center (Control Center for the space labor at the International Space Station), located in Oberpfaffenhofen near Munich. Besides the research assignment, the DLR works as a service provider for customers or partners. The DLR has about 5.600 employees in 28 institutes in 13 locations and acts as a registered association, represented by the chairman Prof. Dr.-Ing. Johann-Dietrich Wörner (German Aerospace Center_a, published on internet [Query: 18/03/2008 15:00h]).
2.2. Department The DLR is split up into several institutes. The bachelor thesis is processed in the institute “Simulation and Software Technology”, which is divided into two departments. The responsible department “Distributed Systems and Component Software”, headed by Andreas Schreiber, is doing research and development on several topics, including grid computing, software integration, the management of scientific data and knowledge, graphical user interfaces as well as software engineering in general. Broadly speaking, the department is responsible for all software-related tasks in DLR in the field of research like the graphical representation for simulations or other analysis software. The department works therefore on several national or international projects with many partners and customers. An exemplary project is the C3-Grid (AWI Bremerhaven, published on internet [Query: 18/03/2008 15:00h]). The main goal of this project is to do research about the earth system for understanding the behavior and dynamic of the whole and each subsystem. This system is currently under development. Besides the projects, the department develops software regarding its own needs. The software “DataFinder” e.g. is a light-weight tool for managing scientific data (German Aerospace Center_b, published on internet [Query: 18/03/2008 15:00h]).

Bachelor Thesis
Final Report 09 June 2008
Markus Kunde
3
3. Project This chapter covers the definition of the problem and the description of the project as well as the objectives and the expected outcome of the project. Additionally, the procedural method of the project is given as well as the scope of the project.
3.1. Project Description and Problem Definition The accomplishment of the project “Visualization-Panel for Provenance Data” will be done in the German Aerospace Center, located in cologne, Germany. This project deals with the development of visualization-concepts for Provenance data and the evolution and conception of a visualization system architecture. As Provenance is currently an active research field, the specification of Provenance data may be altered at the moment and the evaluation of possible application domains, which is still ongoing. During the development of Provenance the University of Southampton, UK, had a key-player role, but the Provenance community is represented and located all over the world. The German Aerospace Center was highly involved in the development of the Provenance concept. The main intention of the DLR in the Provenance project is currently to develop a first application, which is conductive to the Provenance concept. This application is located in the field of grid computing, computing several simulations regarding to the earth. As there are good appendages for recording Provenance, there is a need in the community for analyzing the Provenance data and interpreting it. Therefore, general visualization possibilities are needed. The project “Visualization-Panel for Provenance Data” is located at this point. It will identify the general needs for visualization and put them together with visualization recommendations for these general requirements. This project represents one of several steps in the whole Provenance community of the interpretation of Provenance data in a general way for having concepts for visualization and analyzing possibilities. These concepts will be evaluated and subsequent a concrete approach for the implementation of these concepts will be given.
3.2. Objectives and Results The objectives of the project are to develop visualization-concepts for the interpretation of Provenance data and to give a concrete recommendation for the implementation of a visualization-panel. These concepts consist of a proposal of a visualization technique and the evaluation of it, regarding to (dis-) advantages, limitations and their possible field of application. In principle, every intention of a possible end-user must be covered with these visualization-concepts. The concepts are settled on an abstract level, to have a universal approach for visualization techniques with the possibility of usage in several application domains. Besides the development of these visualization-concepts, a draft for the implementation will be made. The system architecture will be developed to have a fundamental instruction for implementation of a software visualization-panel. The concrete timeline of the results is shown in the following subsection.
3.3. Procedural Method in the Project The initial procedure for the project is described in the work plan. This subsection refers to it (Kunde, 2008) and will subsequently only present the main approaches as well as changes regarding this plan. In the whole project there are two independent main tasks in relation to the expected outcome of the project. On one hand the development as well as the evaluation of the visualization-concepts (“main phase 2”) is the first one, on the other hand the description of a concrete software implementation (“main phase 3”) is the second one. Both tasks are planned and performed independent of each other, their connection is the constructiveness of the software concept to the visualization-concepts, which is regarded in the overall time planning. The precursor of both phases is a general analysis phase (“main phase 1”), where the fundamentals of the successive phases are discovered and analyzed. This analysis

Bachelor Thesis
Final Report 09 June 2008
Markus Kunde
4
consists of the understanding of the Provenance architecture as well as the user requirements behind this architecture. In main phase 1 the fundamental analysis was made. The current, complete architecture document (Groth et al., 2006) of the Provenance data was studied. This step is not primary allocated within the outcome of the project, but a detailed understanding of the Provenance architecture is necessary for each individual subsequent step. Subsequently, the user requirements of the complete Provenance project were analyzed and an abstract classification was made. This abstract division represents the fundamental of the idea, that user requirements of the Provenance project only represent a specific hidden intention of a user. The forming of the specific intention into a more abstract one assists by the matching of general visualization-concepts. Finally, a connection from a specific user requirement to a general visualization-concept was discovered. In main phase 2 the visualization-concepts were developed. This, among other things, was done regarding the “reference model for visualization” (Card, Mackinlay, Shneiderman, 1999) with respect to the approach of Ben Fry, described in (Fry, 2007). The reference model for visualization describes the transformation of origin non-interpreted data to a final visualization possibility. The following illustration shows the build-up of the reference model:
Data
Raw Data Data Tables
Visual Form
Visual Structures Views
Human Interaction
Data Transformation Visual Mapping
View Transformation
Figure 1: Reference Model for Visualization; Source: slightly modified model for visualization adapted
from (Card, Mackinlay, Shneiderman, 1999); Source: (Mann, 2002) As illustrated, the process of transformation of data to a visual form is described. Both rectangles at the top represent the process of transforming data to visualization. The transforming direction is from left (“raw data”) to right (“views”), with respect to the outside affects onto the workflow. Human interaction can have an impact to the process, as an end-user can define which data will be transformed and which manipulations are processed on the view. Therefore, the process itself is of an automatic nature, but the end-user has an effect onto this process (illustrated with three arrows, acting from human interaction to the process of transformation). There are small changes in each step in contrast to the origin definition of each step (cp. Mann, 2002). The reason for this is that the raw data is already defined in a hierarchical structure as well as the research context with no concrete application where a precisely defined user interface is not common regarding individual changes and requirements in each specific domain. During the current project this concept was used with respect to the following process-step definitions: Raw data The raw data consists of the unchanged result of a query to the Provenance store(s). This dialogue will be fulfilled with the help of the Client Side Library (official interface to one or more Provenance store(s)) and its definitions of the query (“xquery”) and result interface (“XML-Schema”; http://www.pasoa.org/schemas/version025/PStruct.xsd).

Bachelor Thesis
Final Report 09 June 2008
Markus Kunde
5
Data Table The data table describes the adjacency list or matrix for the graph for a faster drawing. Key components (usually point of interest) are contained in the data tables as well as the connection-description of them. Additional information, e.g. process related statistical data asked by the user, with a complex generating is stored there too. The data table in combination with the raw data describes all relevant data. As a clue, the interaction key of the initial interaction will be stored to have a clear global identifier of each process. Visual Structures The visual structure describes the spatial substrate of a data item as well as the marks and the graphical properties. (The general visual items are defined in paragraph 5.3.1). The general build-up of the graph as well as the general intention and functionality are described. The algorithm for the drawing of the graph will be defined. View The view is the concrete graphical representation of a visual structure. The interaction or manipulation of the user will be described as well as the interplay with other views. As the current project does not describe a concrete application, special graphical parameters like position, scaling, or the like will not be mentioned as this depends highly on the application domain and the number of Provenance elements. In the following the effects in the illustration are defined: Data Transformation The data transformation describes the step (algorithm, or the like) of the metamorphosis of the raw data to the data table in detail. Visual Mapping The visual mapping describes the mapping of a data table item to the visual structure in detail. View Transformation The transformation of the view describes the manipulation path of the static visual structure to the concrete view. As the reference model for visualization is the main approach, Fry’s approach was used as an additional hint. The approach of Ben Fry (Fry, 2007) consists of a seven-step process for the development of visualization-concepts. In general, the process of understanding data begins with a collection of data and one question, related to the end-user who wants to interpret this data. The central point is hereby not to visualize the data, but answer users’ questions. Following a very brief description of each process step (a more detailed description can be found in the work plan (Kunde, 2008)): Phase Description 1 Acquire Collecting input-data sources 2 Parse Forming the data into a useful format 3 Filter Rejecting unused data and summarizing them into needed formats 4 Mine Transforming data regarding visualization-concepts and other basic conditions 5 Represent Representing the data with a basic form of visualization for further evaluation 6 Refine Doing adjustments on the previous step-outcome to have a better fitting outcome 7 Interact The interaction of the end-user with the data will be developed
Table 1: Visualization Approach of Ben Fry; Source: own illustration

Bachelor Thesis
Final Report 09 June 2008
Markus Kunde
6
This process can be cyclical. Further phases can influence previous ones. It is possible, that one or more phases must be repeated (for more details please see the work plan (Kunde, 2008)). The following illustration shows Ben Frys approach and the theoretical possible cyclical activities:
Acquire Parse Filter Mine Represent Refine Interact
Figure 2: Visualization Process of Ben Fry; Source: (Fry, 2007)
In main phase 3 the development of a concrete software concept was made. This concept represents concrete planning for the implementation of the visualization-concepts as software. As there is no realization of a prototype any more (it is skipped because there is no further need for it; discussed in 1st progress meeting 14.03.2008), the planned prototyping process is transformed into one complete planning phase, the software concept. The software concept consists of the classical designing approach of developing software as software architecture (cp. Sommerville, 2004; Fowler, 2004) in a component-based way. Besides these three main phases, in the beginning of the project an orientation phase was planned as well as an evaluation phase at the end of the project. The following illustration shows the general timeline regarding each of the phases:
Phase Name
Orientation Phase
Main Phase 1
Main Phase 2
Main Phase 3
Begin
04.02.2008
18.02.2008
17.03.2008
19.05.2008
End
15.02.2008
15.03.2008
16.05.2008
06.06.2008
Evaluation Phase 09.06.2008 20.06.2008
6 7 8 9 10 11 12 13 14 15 16 17 18 19 20 21
10d
20d
35d
22 23 24 25
15d
10d
Calendar Week - 2008
Figure 3: Overall Timeline; Source: own illustration
As it is obvious, this illustration only represents a brief division of the main phases. Each phase was planned in detail at the beginning of the particular phase. Any deviations that happened to the initial time plan will be mentioned in chapter 6.

Bachelor Thesis
Final Report 09 June 2008
Markus Kunde
7
3.4. Scope of the Project To outline the project scope and to point out the limitations of the project results, the following section describes the border of the project. The context of the project is conducting research about the visualization possibility of Provenance data in a general way, without having a concrete assignment or system planned. Nevertheless, the results of this project are intended to be a good mixture of concrete and generic approaches. In this project, Provenance will be used as a given technology, but as the concept of Provenance is far away from being well known, section 4.1 will describe the general idea and functionality. This project uses a well-described interface to the whole Provenance architecture, the “Client Side Library”. The library represents the only interface to Provenance systems. Its input and output are documented in detail and will be used for getting the source data for the visualization-concepts. The visualization-concepts are equated to other similar visualization technologies. In general, four different visualization approaches can be used to describe different needs for visualization. The approaches are: Query Visualization, Information Visualization, Scientific Visualization and Knowledge Visualization. The visualization-concepts being developed in this project will be allocated to the Information Visualization. A very short outline will be given in the paragraph 4.2.2 for each of them. The system architecture for a Visual Information Seeking System (the concrete implementation system for the visualization-concepts) will be described in a general way. The purpose of the usage, the developed components of the software as well as their description will be present.

Bachelor Thesis
Final Report 09 June 2008
Markus Kunde
8
4. Theoretical Background In this chapter, the ideas behind the decisions and results (described in chapter 5) are allegorized. Provenance, as a general concept, is introduced. The intention and the functionality are outlined and a brief technical representation of the main concept is shown. Besides Provenance, the visualization techniques applied in this project are introduced giving a general idea and a hint for traceability of the project outcome.
4.1. Provenance in General This section gives a brief overview of Provenance as a new technology. It will describe the main intention and functionality. A detailed technical description is located in (Groth et al., 2006; Provenance Consortium, published on internet [Query: 18/03/2008 15:00h]; Pasoa Consortium, published on internet [Query: 18/03/2008 15:00h]). As already mentioned in section 3.4, the scope of the project does not cover the challenge of the Provenance technology as well as any change in its behavior, appearance and the interface to it. All Provenance related parts will be used in a specification-like way, the only contact point is the “Client Side Library” (described in paragraph 4.1.2). The aim of this chapter is to give the reader a general understanding of the idea and concept of the Provenance technology.
4.1.1. Intention Today’s worlds IT-systems are becoming more and more complex. Their number is rising as well as their connections with each other. Comprehending their function, trusting their results or the authenticity of these are only extracts regarding the requirements business users have from their IT-systems. Understanding and also retracing the results, the involved actors or their connection to other parts is today a must for formulating a high quality assertion regarding the results of the used IT-system. These demands are among others in today’s financial or insurance business as well as in the industrial or research sector for evaluating results of tests or simulations. These demands can be found in any other business sector as well. The technical approach of Provenance represents one possibility to fulfill these requirements. Provenance means recording every event, their cause-and-effect chain and its associated actors to be able to fully understand the things happening in an IT-system. It is a kind of logging mechanism with a hidden integration into the IT-system.
4.1.2. Functionality
Visual Information Seeking System
Client Side Library
Provenance ArchitectureOrigin IT-System
Process QueryRecord
Store N
Result
Human Interaction
Que
ry
Res
ult
Figure 4: Structure of the Provenance Functionality; Source: own illustration

Bachelor Thesis
Final Report 09 June 2008
Markus Kunde
9
The general build-up of an IT-architecture with Provenance is shown schematically. On the server-side, the blue boxes represent the origin IT-system. There, several processes will be executed. The light green boxes represent the Provenance system architecture. The provenance system, briefly described, consists of data stores (called Provenance stores; one or more distributed stores are possible) for storing all process related data, which will be recorded in the origin IT-system. The origin system itself gives the impulse to the Provenance system for storing the process data. Besides the recording-interface, it is possible to ask the Provenance system for the recorded process data (called Provenance data). On the client side, the so-called “Client Side Library”, green, is the only officially documented and public interface to this Provenance data. It will hide the direct handling to the Provenance architecture. To point out the objectives of the project, the dark green colored elements show them. The “Visual Information Seeking System” represents the system architecture (main phase 3), which has to be developed. As shown, it uses the Client Side Library as the only interface to the Provenance data. The visualization-concepts (main phase 2) are located in the Visual Information Seeking System. These represent the connection points to the end-user to answer his questions. As shown, human interaction can take place in combination with the origin IT-system as well as the Visual Information Seeking System. The recording of Provenance data is lucent to the observer.
4.1.3. Technical This section gives a very brief overview about the technical implementation of the Provenance functionality. It is not intended as a full detailed description, but to give a general connection between the functionality described above and the technical architecture of Provenance described in sections 5.1 and 5.2. For further information, please refer to the literature mentioned at the beginning of this section. The functionality of Provenance is based on the idea that everything that happens (every process) in an IT-system can be described in an assertion about the system. These assertions are called “p-assertion” in the context of Provenance (cp. section 5.1). As a process is composed of actors and their interactions with each other, the p-assertion picks up these paradigms and enlarges them with the possibility of describing the relationship of the interactions. This means, one interaction is the effect of other interactions (cause-and-effect chain). Therefore, three different types of p-assertions exist (actor-state; interaction; relationship). As in an interaction two actors are involved, the interaction must be described from the view of both. As a consequence, the Provenance of a system, every process, can be fully described. Interaction P-Assertion The “interaction p-assertion” represents one interaction from exact one actor (sender/source) to exact one other (receiver/sink). This interaction is globally unique. Besides the two involved actors, the content of the interaction is also recorded. Actor-State P-Assertion The “actor-state p-assertion” describes the state of an actor at one exactly moment. It is not linked to a specific interaction, but can be the cause (but not the effect) of other events. The transformation of an actor and consequently, its behavior is therefore comprehensible. Relationship P-Assertion The “relationship p-assertion” describes the cause-and-effect chain of one interaction to another. The assumption is that an interaction is caused by one or more other interactions. With this information, the complete process can be retraced. Client Side Library “The Client Side Library, CSL, is a collection of functions, which allows Provenance-aware applications to communicate with Provenance store services. It also provides functionality to help application developers enforce architecture rules or organize Provenance relevant data items easier in

Bachelor Thesis
Final Report 09 June 2008
Markus Kunde
10
their Provenance-aware applications.” (Jiang, 2006) This interface also has defined query and result methods (documented via “wsdl”).
4.2. Applied Visualization Techniques This section deals with the brief introduction to important visualization cognitions, showing the applied parts of the techniques to get an overview of the ideas behind the visualization-concepts. For further information, references to the full descriptions of each topic are given.
4.2.1. Visualization For describing visualization-concepts, first a definition of visualization as a general term has to be made to establish a common starting point for each reader. Visualization is defined as follows: “…Visualization is a synonym for the graphical representation, illustration and communication of information as well as for the visual perception (vision) and imagination. The term encompasses all types of graphical representation and the process of making observable.” (Meyers Lexikonverlag, 2007, translated from German). Therefore visualization is used for a striking illustration of circumstances.
4.2.2. Visualization Approaches In respective literature, several different concepts about the general visualization approaches can be found. In general, all authors distinguish between at least Scientific and Information Visualization. As this represents only a very abstract approach and for classification of this project a more detailed distinction is necessary, this project is divided into four different visualization approaches. As already mentioned in section 3.4, this project takes place in the field of Information Visualization. Query Visualization In correlation with the Information Seeking Process (described in next section), the interaction of the user with the IT-system is always a dialogue in a query/response way. As the three other visualization approaches describe the response visualization, the Query Visualization covers the first part of the dialogue. Query Visualization tries to visualize boolean queries automatically derived from natural language queries. As there are several approaches which are excellently described in literature (a collection can be found e.g. in Mann, 2002, Chapter 3.3.3.1), a reference to them is given. The Query Visualization is not described and not a part in the development of the Visual Information Seeking System. Scientific Visualization Scientific Visualization deals with the visualization of numerical data or the non-interpreted visualization of a correlation. Ludwig (Ludwig, 2004; according to Card, Mackinlay, Shneiderman, 1999) describes Scientific Visualization as follows. “Physical data, e.g. human body, the earth, nature phenomena, buildings, technical constructions or molecule forms the basis of Scientific Visualization.” This means, data will be displayed as it is. There is no interpretation of it to form information. (cp. Boisot, Canals, 2004). The Scientific Visualization is not described and not a part in the development of the Visual Information Seeking System. Information Visualization Visualization of information means that abstract data will be visualized with the help of a metaphor to amplify cognition. Card, Mackinlay and Shneiderman (Card, Mackinlay, Shneiderman, 1999) defines it as “The use of computer-supported, interactive, visual representations of abstract data to amplify cognition”. Information Visualization tries therefore to interpret fundamental data to information, as it will be set into context with each other. This means, Information Visualization is involved in selecting, transforming and the representation of data for facilitating users interaction for exploration and

Bachelor Thesis
Final Report 09 June 2008
Markus Kunde
11
understanding. Inside Information Visualization as a topic (in opposite to Knowledge Visualization) there is no special approach for identifying new knowledge from the data. As the field of Information Visualization is the main part of the visualization-concepts, Information Visualization means the formulation of data to representation-views for a faster information evaluation. Knowledge Visualization Knowledge Visualization can be seen as a special field of Information Visualization. The approach will also interpret abstract data into information, but the intention behind is to transfer insights and create new knowledge. Burkhard (Burkhard, 2004) defines Knowledge Visualization as follows: “The use of visual representations to transfer knowledge between at least two persons”. At the moment, a data mining system about Provenance data is being planned in relation to Knowledge Visualization which is contrary to the theme of this bachelor thesis. Data mining represents one approach to the Knowledge Visualization concept. Knowledge Visualization is not part of the Visual Information Seeking System. In this project, the interpretation of the data leads to the end-user.
4.2.3. Information Seeking Process The Information Seeking Process depends on the procedure of humans’ practices in the Information Retrieval. Many interpretations of this process exist (e.g. Marchionini 1992 & 1997; Hearst 1999). For presentation, the simplified diagram of the standard model of the information access processes according to (Mann, 2002; according to Hearst 1999) will be used:
Information Need Query Send to
SystemReceive Results
Evaluate Results
Reformulate
StopDone?
Figure 5: Simplified diagram of the standard model of the Information Seeking Process according to
(Hearst, 1999); Source: (Mann, 2002) In general, the process shows the iteratively method of defining a question, evaluating the results and refining the question. The Information Seeking Process is the central component of the Visual Information Seeking System. Each visualization-concept within its classification of the Information Visualization approach can be put into this scheme. Besides the Information Seeking Process itself, there are several high level goals, tasks and strategies as well as low level goals, tasks and strategies affecting the procedure of the human (cp. Mann, 2002). High level goals, tasks and strategies As Thomas M. Mann accurately points out “The common starting point of nearly all interaction-process- or phase-models of the Information Seeking Process is that there is always a user information need at the beginning.” (Mann, 2002, p. 20). These needs always have a concrete background and can be formulated as an explicit goal, but they can also be arranged into high level task actions. Shneiderman (Shneiderman, 1998) categories his collection of high level tasks as well as Hearst (Hearst, 1999) from a more open to a closer formulation, shown in the following illustration:

Bachelor Thesis
Final Report 09 June 2008
Markus Kunde
12
Figure 6: High Level Tasks by (Hearst 1999; Shneiderman 1998); Source: (Mann, 2002)
The illustration shows the open to close formulation and the categories of both authors. Therefore, closed questions can be categorized in “Data Presentation” in a visualization context, while open questions belong to “Data Exploration”. Low level goals, tasks and strategies Besides the high level tasks showing the query-formulation-way of a human, low level tasks deal with the actions the human might execute within the result of the query. As there are several divisions, the task taxonomy according to Shneiderman (Shneiderman, 1998) shows a concrete division: Task Description Overview Gain an overview of the entire collection Zoom Zoom in on items of interest Filter Filter out uninteresting items Details-on-demand Select an item or group and get details when needed Relate View relationships among items History Keep a history of actions to support undo, replay, and progressive refinement Extract Allow extraction of subcollections and of the query parameters Table 2: Low level tasks; Source: (Shneiderman, 1998) These tasks are the basis of the manipulation techniques, described in the general visualization-concept as well as a fundamental description of the general implemented action-possibilities in the Visual Information Seeking System. The development of the Visual Information Seeking System has to take into consideration the high as well as the low-level tasks cognitions.
4.2.4. Mental Model A mental model is the internal scale-model representation of an external reality. This means that humans represent the world they interact with through mental models. A mental model explains thereby all the aspects of the phenomenon the individual is interacting with (cp. Davidson et al., 1999; Khella, 2002; Kaufmann, Wagner, 2001).

Bachelor Thesis
Final Report 09 June 2008
Markus Kunde
13
The effectiveness of visualization strongly depends on its accordance with users’ mental model. The aspect that a representation on the one hand should represent a model similar to the fundamental phenomenon shows the importance of mental models. On the other hand, the designer has to take care of his intention regarding to the users’ model of the phenomenon. (cp. Khella, 2002). The following sketch represents the impact of the different intended models:
DesignerDesigner
Model User Model
Designer's model of
user's model
UserInterface
Conceptual Model
Figure 7: Impact of different intended Mental Models; Source (Khella, 2002)
As illustrated, there is interplay between designers’ and users’ model, the central “conflict-dissolving” part is the system-interface that depends on the general conceptual model, chosen by the designer of the system. Besides the general idea of a mental model, metaphors can be used for conducting the imagination of the user to designers’ mental model (cp. Mann, 2002). These metaphors represent real world interaction-objects (e.g. a bookshelf for documents) and help the designer to arrange the information presented to the user, as the behavior of these metaphors is trivial to the user. The mental model is considered in the visualization-concepts and is described as mental maps (which is the concrete model-implementation the designer tries to build-up).
4.2.5. Color, Form and Property of Elements Using color or forms for elements in visualizations is critical due to the effect the visualization has on the viewer (cp. Crüger, 2008). Cognitions out of the field of psychology are considered to ensure the correct impression is received by the user. Although the chromatics gives several hints and recommendations, it is still a subjective field of sensation and underlies individual differences between each viewer. Nevertheless, there are several surveys regarding this topic. The chromatics defines several practical guidelines. The following were used for the visualization-concepts:
• Usage of coloring in a publication should be consistent • Same facts should be colored with the same color. Inside one circumstance, differences should
be visualized with different nuances • Dark and strong colors should be used for texts or lines • Small areas should make use of saturated or clean colors
The differences in the impression between different colors are considered too. As each color has its own effect on the viewer, the combination of different colors can have a different effect. Following the color combinations chosen with its impressions they represent:

Bachelor Thesis
Final Report 09 June 2008
Markus Kunde
14
Green Green gives the impression of anodyne, certitude and harmony. The color supports the concentration to the essence. White White portrays pureness and clearness. Green and white As green is the color of the foreground, the color white represents the background of the visualization. Both colors in combination represent the perception of honesty and objectivity (also in combination with blue or grey, which represent the first choices of a separation color if needed). Green and different cultures The application domain of the visualization-concepts is all over the world. Therefore colors have to consider different intentions of different cultures. A very general estimation about the impression of the colors used is made at this point. In several religions, green represents a hopeful circumstance, rehabilitation, live giving or unity of belief (Christianity, Islam, etc.). However, different ethnicities differ in their interpretation of the color. In many countries, green represents a political engagement (environmental protection), the human right for freedom, unity of humans, power or sageness (Western, Arabian world, Asia). Black as Line color There are two reasons for the usage of black as a line color. On one hand, black represents a good contrast to green or white without deflecting from green essential parts. On the other hand, black represents the impression of irreversibility just as the connection between two visual elements does. The thickness of the „connection“ should be as small as possible (without losing visibility) because of the fact that the line does not represent the element observed. The second reason is the high presence of many connections between elements and the coherence of thickness and hiding important information. If the line is in the focus of the viewer, its thickness should be variable for the observation of the connection. Forms of elements According to guidelines, the same facts should be represented in the same way. Therefore, each type of element gets the same form. There are four different types of elements, therefore four different forms have to be chosen. Choosing different form, under another perception, has a big advantage, with respect to achromates. The following cognitions are the basis for the form decisions:
• The process represents an abstract layer. Therefore a neutral representation should be chosen, representing details of the other forms
• The actor represents the main element, as interactions with its data occur between them. Therefore, a form must be chosen with respect to a large graph visualization technique. In the context of a (non) hierarchical, (non) directed, (a) cyclic graph this form must be neutral
• The interaction form should represent its nature of having a flow direction • The property of each element represents the “golden ratio” of harmonics (~ 1.618:1) or
alternatively 5:3 (simplification). The golden ratio represents a natural phenomenon and can be found in several natural forms (Stelzner, 2003).
4.2.6. Layout Algorithms and Aesthetics Drawing the graph of Provenance-described processes is one part of the visualization-concepts. In the following a brief introduction to the field of layout algorithms and a short outline regarding to the aesthetics of graph sketches is given. The aesthetics is critical due to users understanding of the graph.

Bachelor Thesis
Final Report 09 June 2008
Markus Kunde
15
Types There are several different layout algorithms available. They differ from each other in their algorithmic approaches as well as their application domain. A full collection of the different layout algorithms and their exact implementation can be found in (Kaufmann, Wagner, 2001; Di Battista et al., 1998; Sugiyama, 2002). In general, the following distinction of the different types of layout algorithms can be made: Type of Algorithm Description Planarization Drawing a planar graph improves its readability. Planar means that there is
no crossing of the edges. Therefore, planarization is an approach several algorithms want to reach.
Physical Analogies Physical analogies use the connection properties between edges and nodes. Drawing with physical attributes mean having an intuitive, every day experience of the physical world. Using the physical property of springs for drawing the correct map of the graph is a widely used approach. The assertion is that every connection between nodes depends on different physical behavior and the system as a whole tries to find the best fitting solution on its own. The paradigm is therefore: different complementary forces balancing each other (e.g. “spring-embedder algorithm” as a popular implementation of this approach).
Layered Drawing Drawing a graph in a layered structure means using the assertion of having directions or flows in a graph. Dividing cycles in a graph is a widely known technique. This approach can be used for describing processes or hierarchical dependencies (e.g. “Sugiyama algorithm” as a popular implementation of this approach).
Orthogonal Drawing Another approach for improving the readability is drawing the graph orthogonal (in opposite to Planarization, which cannot be guaranteed with orthogonal drawing). Bending minimization is a key fact of this approach (e.g. “Tamassia algorithm” as a popular implementation of this approach).
3D Drawing On the one hand, using the third dimension of the view has some advantages like giving greater flexibility for placing nodes and edges. Also crossing can be avoided. On the other hand, this approach has a higher claim on the algorithm and forces better view-manipulation techniques (cp. section 5.3).
Table 3: Types of Layout Algorithms; Source: own illustration As in most cases of the visualization-concepts the Sugiyama-Algorithm will be used, following a general description of the four algorithm stages:
1. Make the graph acyclic 2. Assign vertices to layers, e.g., partition the vertices of the directed graph
into an ordered sequence of subsets in such a way that the edges have directions consistent with the subset ordering. Introduce dummy vertices to avoid “long edges”, e.g., edges which traverse one or more layers
3. Permute the vertices within the layers to reduce the number of crossings 4. Reduce the number of bends by readjusting the position of vertices on each
layer Table 4: Sugiyama algorithm; Source: (Kaufmann, Wagner, 2001)

Bachelor Thesis
Final Report 09 June 2008
Markus Kunde
16
Static vs. Dynamic Layouts The static representation of a graph layout depends on the fact that a graph is drawn exact one time. If there is a need to restructure the graph, the whole graph is redrawn, while in a dynamic layout environment only the changes in the graph are considered. The main problem of dynamic layout algorithms for the graphical visualization and their afterwards manipulation is not loosing the mental map of the end user, regarding the recognition value of the graph. A mental map is the users’ embossed position of the nodes and edges of the graph. The universal approach is to change only the addicted points without touching the other ones or having changes only in a delimited area. Further information can be found in (Kaufmann, Wagner, 2001; Sugiyama, 2002). Aesthetics of Graph Sketches The aesthetics of the sketch depends primary on the beauty of the graph as well as the beauty of the defined elements (the appearance of the elements is already defined above). At this point the aesthetics of the graph will be considered. The general problem is that the definition of the aesthetics of the graph consists of several points, which may stay in contrast to each other. This means, fulfilling one of the criteria always causes the non-satisfying of another criteria. A full collection of aesthetics of graphs can be found in (Kaufmann, Wagner, 2001). Aesthetics criteria Description Angle minimization The edges have to be as far apart as possible for discovering the
differences. Area minimization The sketch of a graph looks much better if the nodes and edges fill the
space with homogenous density. Bend minimization The human eye can much more easily follow the line of an edge in a
drawing with no or less bends than in a sketch with zig-zagging edges. Clustering In large graphs it is necessary to cluster the nodes to reveal some of the
graph’s structure. Crossing minimization The crossing of edges causes the difficult identification of nodes-
connections for the human eye. Layered drawings Hierarchical or sequential structures usually require a layered layout where
node positions are restricted to distinct layers. Length minimization As edges represent connections between nodes and represent information
(e.g. wire-length in integrated circuits), the length should be a short as possible.
Symmetries If a graph contains symmetrical information then it is important to reflect this symmetry in its layout.
Table 5: Aesthetics criteria of graphs; Source: (Kaufmann, Wagner, 2001) The aesthetics of graphs is considered by the selection of the concrete layout algorithm.

Bachelor Thesis
Final Report 09 June 2008
Markus Kunde
17
5. Results This chapter presents the acquired results. The first two sections cover the analysis phase (main phase 1), the following two sections cover main phase 2 and 3.
5.1. Provenance Architecture Analysis The section represents the first task of main phase 1. At this point, a description of the Provenance architecture with a brief introduction to the technical structure will be given. Provenance is able to relate to a workflow and designate the possibility of recording and analyzing the elements of a concrete workflow in order to have a full understanding of it. The architectural data of Provenance is defined in the Provenance architecture specification. An analysis of this specification was carried out in order to obtain a clear overview of all possible data that can be clustered into the Provenance data. The current section describes the complete possible content of the Provenance data. As the Provenance data is still under development, future changes are not considered at this moment.
5.1.1. Tabular Collection of Useful Information The result of querying the Provenance stores is represented as an XML structure (appendix 1). As this outcome is related to the Provenance architecture specification, it is referred to it at this point (Groth et al., 2006). The following table describes briefly the information content for each element of the XML structure (presented in appendix 1) of Provenance data.
Element Information pstruct This element is for grouping the interactionRecords belonging
together to a useful package. The application decides the division into different or the same pstructs. It is possible that a complete workflow is merged into one pstruct, as well as having each step in a workflow as a separate pstruct element. A pstruct contains numbers of zero to unbound interactionRecords.
interactionRecord An interactionRecord encapsulates all p-assertions made about an interaction between two actors at one moment. Interactions are the core-actions in a process, which consists of one or more interactions. An actor always activates an interaction.
actorStatePAssertion An actor always has a state at a specific moment. This state can be recorded on demand. An actorStatePAssertion may be the cause, but not the effect, of an interaction.
interactionPAssertion An interactionPAssertion is an assertion of an actor about the content of a message, who sent or received it. The message-involved actors as well as the content of the message are recorded.
relationshipPAssertion With a relationshipPAssertion the connection between two or more interactions will be described. An outcome of an interaction always depends on its input. This input is the output of another interaction. This relationship can be described in a relationshipPAssertion. It is a formulation of the cause-and-effect chain.
interactionKey The interactionKey identifies globally (the whole Provenance information of the monitored system in the whole Provenance store landscape) unique an interactionRecord.
messageSource The messageSource is the sender (actor) of an interaction. The messageSource must be uniquely assigned to an actor.

Bachelor Thesis
Final Report 09 June 2008
Markus Kunde
18
Element Information messageSink The messageSink is the receiver (actor) of an interaction. The
messageSink must be uniquely assigned to an actor. interactionId This is the unique identifier of a message sent from the
messageSource to the messageSink. sender This element represents a view of the sender to an interaction. A
view is hereby a collection of p-assertions. It is possible, that the receiver’s view is different to an interaction in the context of having different rights to the data or other reasons.
receiver This element represents a view of the receiver to an interaction. A view is hereby a collection of p-assertions. It is possible, that the sender’s view is different to an interaction in the context of having different rights to the data or other reasons.
asserter The asserter is a unique identified producer or system user (in context of receiver: message consumer) who produces the interaction.
localPAssertionId A localPAssertionId is a unique identifier of a p-assertion in an interactionRecord.
documentationStyle The documentationStyle is a representation of the transformation of the content of a message or actor’s state. An interaction will be transformed into a p-assertion according to one of nine schemes. These schemes are called documentationStyle.
content The content of a p-assertion is connected to the individual field of the monitored system. The data of a message can be recorded here. It depends fully on each individual application.
subjectId The subjectId identifies the subject of a relation in combination with the “relation”-field. The data element obtains to a localPAssertionId, which describes the element guessed.
objectId The objectId identifies the objects of a relation in combination with the “relation”-field. The data element obtains to a localPAssertionId, which describes the element guessed.
relation There is no limitation how the relationship between interactions is defined. For simplification, a “wasCausedBy” relationship is defined, with the behind cause and effect in relation to the parameterName.
viewKind A viewKind denotes, for a p-assertion, whether the actor making that p-assertion was the sender or receiver in the interaction to which the p-assertion refers.
objectLink At this point the address of a Provenance store can be recorded, where the p-assertion is originally stored.
dataAccessor The dataAccessor is a reference to a location of a p-assertion data item with the connected p-assertion content. This is used, if a p-assertion with its content is released from bin. DataAccessor is a reference to it.
parameterName A parameterName is the identifier for a data-item role in a relationship, where this item is documented with the p-assertion. The subject depends on the output of an operation. The parameterName references to the output of the according operation.
exposedInteractionMetaData ExposedInteractionMetaData allows an asserter to indicate that inside some application data there is some useful information (belong to the pstructure schema). This is to avoid the Provenance to be aware of application schemas. All belonging information can be brought together at a high level.

Bachelor Thesis
Final Report 09 June 2008
Markus Kunde
19
Element Information globalPAssertionKey This key identifies a p-assertion regarding to the interactionRecord
and the behind p-assertion. any This field is used as an extensibility point. At the moment it is
unspecified. interactionMetaData interactionMetaData are Provenance-related data about an
interaction. It can be used to create so called “view links” (link to another Provenance store with a related p-assertion). Used to create the whole Provenance record in sender and receiver’s view, if they are stored in different Provenance stores.
tracer This represents an address to another Provenance store, where the p-assertion in the view of the respective other (sender or receiver) is stored.
Table 6: Description of each Provenance element; Source: own illustration
5.2. User and User Requirements Analysis In this section, the results of the user and user requirements analysis are presented with the classification of these requirements as well as the invention of a short forecast of possible visualization-concepts. Additionally, standard visualization techniques represent the ideas and a first claim regarding possible visualization proposals. The results of this phase were presented as a submission paper to the Provenance program committee of the IPAW 2008 (IPAW Program Committee, published on internet [Query: 12/05/2008 10:00h]). Their feedback as well as the ongoing research in the project leave a mark on the final visualization-concepts, covered in the next section. There is currently no existing end user for the Provenance visualization-panel. In context to have a direction and some allegations, the user requirements of the Provenance project were examined (appendix 2). These results were incorporated into the requirements of a visualization-panel. As a next step, these user requirements were divided into types, which represent the basis for the first collection of building up a visualization strategy.
5.2.1. Identified User The identification of possible end-users is, comparing the fact that no concrete application exists, not definitely (there are only potential fields of application defined). As a consequence, a general approach was used to encircle a generic user-group. First of all, the application area, where Provenance information and visualization can be used, had to be identified. Secondly, a consequence of the user requirements analysis of the Provenance project itself, possible abstract user groups are identified and evaluated in order to identify different roles and angle of visions.
5.2.2. Application Area The definition of Provenance makes the identification of the application area straightforward, because of the fact that one of the targets of Provenance is having a general approach of recording Provenance data and making it available and useful for a wide range of different business domains. In general, Provenance can be used in the complete field of information technology, whereby the creation of the data as well as the end-result of a workflow is important and has to be proven. As a consequence, all areas where a workflow influences other outcomes can make use of Provenance. The corollary is whereby the application area cannot be divided into a concrete list of business domains, as in theory there is no explicit limitation of the application area.

Bachelor Thesis
Final Report 09 June 2008
Markus Kunde
20
5.2.3. User Groups The intent for analyzing Provenance information is dependant on several factors as well as on the application area of the concrete implementation and the individual task of the user of this application. One approach to evaluate these different intentions is identifying general user roles in the manner of different views to data and information and grouping them together into generic user classes. For evaluating a possible division, the identified user types are derived from the user requirements document of the Provenance project (WorkPackage2, 2005). The distinction between different user types is necessary. On the one hand, there is a collection of security reasons depending on access rights, privacy of information as well as other security relevant rules. On the other hand, the division of the user types fulfills the aspect of different information needs of the user. As users have different information scopes, a distinction between different user types has to be made for pre-selecting their working environment depending to data. In the context of user types and user desired Provenance information, a division between user and system Provenance data is made. User Provenance is hereby workflow related Provenance information. The interaction itself and the involved user, the intermediate and end results as well as other workflow related information is important. As the opposite, system Provenance is related to system internal components and their relationship together. The exact relationship between IT-system specific components and the message exchange is mentioned (cp. also “Scientific Visualization” vs. “Information Visualization” in paragraph 4.2.2). The following listing represents the identified abstract user roles and gives a brief explanation of each classification: General user The general user should only see the user Provenance information that is connected to workflows. The general user is involved in the configuration of the workflow. Only Provenance information directly related to the own work-surrounding field is needed. The main intention is to rely on the outcome of a workflow and to check the authentically of these results. Designer The designer role has main access to all user related Provenance data, independent of the origin, which appears in the context of the monitored system. The designer is interested in the behavior of the workflow itself as well as the interaction between services or the connection with the outside world. Manager A manager can see the owned user and system Provenance data. The manager monitors the Provenance usage on a whole to ensure the correctness of the individual services. This role is intended to support the interpretation steps and to ensure the quality of the Provenance system. Administrator/Developer The role of the administrator or developer is designed to capture the whole Provenance data, which is available in the connected Provenance stores. The purpose of this role is to build-up the Provenance architecture and to ensure the correctness of the Provenance system itself.
5.2.4. Generalized User Requirements A clear understanding of the users view of the Provenance as well as an understanding of the user is mandatory for the development of the Provenance visualization-concepts. The user requirements from the Provenance project are understood to process a fundamental collection of users needs. For evaluating a general visualization-concept, a derivation of user requirements for a special application must be made in order to have a universal assertion as a fundamental for these concepts. This is achieved through adding abstract types to the identified user requirements. These types shows the very general intent of a user in relation to the Provenance visualization and the Provenance data behind it. On top of the types of user requirements there is a need for defining an abstract layer of all Provenance questions in relation to their point of interest.

Bachelor Thesis
Final Report 09 June 2008
Markus Kunde
21
Types of user requirements The identification of types of user requirements into a more abstract view in order to display an increased general division of non-concrete user requirements is formed in the context of what element is the basis for visualization. Visualization is based on one element, the point of interest with additional information with respect to the Provenance data. In a second step, these types can be assigned to general visualization types, which were used as an essential for developing concrete visualization-concepts. The following table shows the abstract types of user requirements in which a user requirement can be arranged with a very brief denotation of each type. Type Denotation Process In the center of the users view the process itself plays the central role. The approach
of a workflow has to be evaluated. Involved actors as well as their connection are important. The sequence of the process steps is in the center of inspection.
Results The intermediate or end results of interactions are in the center of user’s view. The outcome as well as the input has to be evaluated.
Relationship In this case the relationship of interactions or actors is important and has to be evaluated. It is mandatory to reconstruct the evolution process of a result for reliance, in order to evaluate the results properly.
Timeline If the time is important to observe, finding bottlenecks or trying of improvement of the workflow is one of the targets. Reconstructing the evolution of results or the behavior of actors to each other can be evaluated.
Participation The evaluation of the correctness of the participants is important in the context of trust of the data. This type is very similar to the type ”Relationship”, but there is another intention behind it. The reconstructing of evolution processes is less important than the trust of all participated actors, which is mentioned with this type.
Compare The comparison of two subjects deals with the differences between them. In the case of a comparison between one subject and a reference subject, the correctness of the subject can be proven.
Interpretation This type represents a collection of individual questions, which cannot be classified into one of the other types. This type is represented with an individual visualization view depending on the special question of the end-user. Typical examples for this types are user requirements tend to develop new cognitions onto existing information.
Table 7: Types of the user requirements; Source: own illustration Classification As the division into types of user requirements is made to have an abstract division for assigning to basic visualization possibilities, a classification of the user requirements in the context of the beyond questions can be made. A classification of user requirements represents a functional division of user requirements. This division can be used to evaluate the fundamental Provenance data, which is needed in order to give an answer to the user questions. The following table lists each classification and gives the abstract question behind it. Each user requirement related to the interpretation of the Provenance should belong to this classification.

Bachelor Thesis
Final Report 09 June 2008
Markus Kunde
22
Classification Denotation Question of origin What data was used in the generation of a data item? Question of inheritance What data items and information were generated using a given data
item? Question for participants Which actors (users, applications, versions of tools, etc.) were employed
in the generation of a data item? Question for dependencies Which resources from other projects/processes have been used in the
generation of a data item? Question for progress In what stage of a processing chain is a given data item (for data items
of the same type)? Has the process the data item is part of been finalized?
Question for quality Did the process the data item is part of reach a satisfactory conclusion by some given regulations or criteria?
Table 8: Classification of the user requirements; Source: (Kloss, 2006) At first glance, there is interference between the classification and the division into types of the user requirements. The division into these two fields is made because of the different view of each field. The division into types is made in context of a possible visualization-panel in opposition to the classification, which context is the beyond intention of the users question.
5.2.5. Visualization Possibility At this point a rough assertion of visualization-concepts is displayed. This listing is made with the intention to have contrasting visualization domains, which are asserted to standard visualization-concepts. These were fundamental for the ongoing project. The following table lists generic visualization types and briefly describes them. The relationship of the types of user requirements is made. The type ”Interpretation” is missing in the below table. It is arguable if interpretation is carried out in every visualization type but primarily interpretation is completed by the user. Visualization type Description Related type Process diagram The process diagram highlights the workflow with its
actors, interactions and results into the center. Process Results Participation
Difference diagram The difference diagram shows the difference between the compared objects (process, actor, interaction).
Compare
Dependency diagram The dependency diagram shows the connection of the chosen elements (e.g. actors, interactions). It presents the behavior and the relation between income and outcome to each other.
Results Relationships Participation
Timeline diagram The timeline diagram shows all interactions between actors in the context of their relationship in a timeline. This diagram is similar to the process diagram, but in this diagram qualified connections were shown.
Process Results Relationships Timeline Participation
Spreadsheet representation
The spreadsheet representation gives the most space for doing interpretation of the data. In order to have full freedom for sorting and filtering elements, this is the most flexible but also the most unclear representation strategy.
Process Results Relationships Timeline Participation Compare
Table 9: Visualization assertions; Source: own illustration

Bachelor Thesis
Final Report 09 June 2008
Markus Kunde
23
5.2.6. First Visualization Examples for Evaluation At this point a few visualization examples will be given, contrasting to the final ones presented in next section. They depend on the beyond division of visualization assertions and represents a first assertion of Provenance information and their representation in standard visualization types, which will be compared to final visualization-concepts. Each visualization example, representing only a first abstract sketch, evaluates the visualization technique in the context of the point of interest. After the development of the final concepts, a complete evaluation of each visualization proposal is made. The summarizing of information (e.g. zoom function of detail depth, filtering or sorting) is not considered in the sketches, but will be considered in the final visualization-concepts. Concrete developed first general visualizations are shown in appendix 4.
5.2.7. Non-Functional Requirements A non-functional requirement defines the property of the software. Even though they belong to the analysis phase, they will be examined in the context of the development of the system architecture. The list in appendix 3 represents all non-functional requirements extracted from the user requirements of the Provenance project (WorkPackage2, 2005).
5.3. Visualization-concepts This section represents the results of the main phase 2 of the project. At first, the general visualization-concept will be presented. This concept is superior due to the individual concepts. It represents the general approach and has a universal validity. The second paragraph represents one selected individual visualization-concept based on the reference model for visualization (cp. section 3.3)). As the concepts are similarly constructed (based on the placement in the Visualization Map (cp. paragraph 5.3.1)) the other ones can be found in appendix 5-14. Besides the development of concrete visualization-concepts, the fundamental for all concepts are the first visualization examples (covered in section above) and the evaluation of standard visualization techniques described in (Meyer, 1999; Mann, 2002; Ludwig, 2004).
5.3.1. General Visualization-concept The general visualization-concept describes the system-wide-valid visualization approaches. It gives a general idea of the behavior of one concept to the others as well as a global definition of several assertions. Definition A visualization-concept describes each step of transformation of raw data to concrete views in correlation with the reference model for visualization (cp. section 3.3). One visualization-concept applies to exact one visualization possibility and their mutation possibilities. Assertion The raw data is already defined in a fixed structure and will be available during runtime. The data tables represent the concrete implementation for a faster graphical drawing. Additional information of a process, if needed, can be fetched during runtime (cp. “Lazy-loading” paradigm). In detail, the result of a query to the Provenance store(s) consists of all information. This information is stored as well, but an “adjacency list” (or matrix) is designed for a faster drawing of the graph. If needed, the additional information can be extracted from the origin result of the query.

Bachelor Thesis
Final Report 09 June 2008
Markus Kunde
24
Visualization Map
ResultSet
Process Overview
Process Landscape
POI Overview
POI Detail
Spr
eads
heet
Com
pare
/Diff
eren
ce
System Context
Process Aerial Interaction Stretch Combined Flow Chart
Actor Detail & Context Interaction Detail & Context
Det
ail L
evel
Scop
e S
ize
Figure 8: Visualization Map; Source: own illustration
The visualization map above describes the classification of the visualization-concepts onto the data regarding to the detail level and scope size of the visualized information (Mann, 2002). In the sketch, the detail level will increase from bottom to top in combination with hooking up context information (scope size decreases from bottom to top). Each light blue rectangle represents one visualization-concept, the dark blue ones describes a general aggregation of similar ones. The spreadsheet and the compare/difference visualization-concepts do not differ in different levels because of their representation-type nature. The visualization map only consists of the visualization path of Information Visualization and is dissociated from the Query Visualization, Scientific Visualization und Knowledge Visualization, as mentioned in section 3.4. Presentation Legend
Sel
ecte
d
Interaction Actor
Process Connections
ActorState
Interaction"View"
Actor
ActorState
Figure 9: Presentation Legend; Source: own illustration
The sketch represents the assertion about the graphical representation of each provenance element. In general, the elements are divided into a single item and the elements of these items. The element is identifiable by a darker color as well as a thicker border. Single or multiple selecting is shown with a clear visual other color. The process is a subsumption of process steps (interactions between actors) with the target to summarize or hide several non-relevant steps to gain more overview about complex structures. This means, the process always consists of one or more process steps. The graphical representation of the process element is a rectangle (rounded corners).

Bachelor Thesis
Final Report 09 June 2008
Markus Kunde
25
The actor is a component or user of the IT-system who is either the sender of receiver of an interaction. An actor can have a state at a defined moment. An actor is connected via interactions to other actors and therefore sends or receives data. The graphical representation of the actor element is an ellipse. An interaction always takes place between two actors (sender and receiver). It always has one subject and usually one or more objectives. The graphical representation of the interaction element is a hexagon. An interaction can be described in the view of the sender or the receiver. A “connection” represents the connection between two other elements. Therefore, it can represent an interaction as well as a result or an actor, depending on visualization-concept. The “connection” can be one or two way direction. The graphical representation of the “connection” element is a line (directed: arrowhead). Color, Form and Property Element Color-code RGB Additional Information Element item 204;255;128 Element item selected 204;255;255 Element 115;230;0 Element selected 27;65;206 Selection Box 183;183;183 Connection 0;0;0 Thickness: (Element-Width in mm)/50 Table 10: Color Codes for Visual Elements; Source: own illustration The property of all above-mentioned elements is 5:3 as an approximation regarding to the “golden ratio” (~ 1.618:1) of harmonics (cp. paragraph 4.2.6). System-wide manipulation techniques In today’s world it is a cognition that effective data representation means, with respect to other things as well, the hiding of non-interesting information, but showing only important information. Of course, if the information seeker needs more detailed information, the system must support the dynamical addition of requested additional information. Also the manipulation of the data is mandatory for interaction between the information seeker and data for his fully understanding. Therefore, manipulation techniques have to be developed. Following the general system-wide manipulation techniques are described (cp. Mann, 2002 for a full collection). Specific visualization-concept manipulation techniques are not mentioned here. Technique Functionality Animation All changes in a view must be shown to the end-user in a motion way. The
drawing of the graph itself must be done without any animation, but any changes within the techniques (undo; grasp & release; (de-) grouping; invisible; panning & zooming) must be traceable via an animation. The animation itself should be selectable between 0.5 and 1.5 seconds (default 1.0 second) total system response time (cp. Bederson, Boltman, 1998).
Brushing & Linking Multiple views can be produced via request. The different views can be addicted to each other or be independent one another. Being addicted means that the views can depend on other views. The same content will be shown (depending on the detail level and scope size). The connection between the views can be set or unset. The behavior will be described in each visualization-concept via a separate section.
(De-) Grouping Selected elements can be grouped into a more abstract level, called a “process” (cp. Presentation Legend). This step can be done in the other direction via de-grouping of the “process” element. Other points are not affected in their position except the connection-lines to or from the specific element (depending on dynamic layout algorithm).

Bachelor Thesis
Final Report 09 June 2008
Markus Kunde
26
Go to another level The visualization map describes the general approach in browsing towards the levels of the different visualization-concepts. Step-by-step eradication of each concept (depending on select) is recommended, but a free selectable level is possible. The detailed function is described in each visualization-concept.
Grasp & Release Each element can be re-arranged in the view. One element can be grasped and released at another point on the canvas. Other points are not affected in their position except the connection-lines to or from the specific element (depending on dynamic layout algorithm).
Invisible State Selected elements can be set into an invisible state (blank). The elements can be set visible afterwards. Being set invisible draws a new connection-line to both connected partners. Other points are not affected in their position except the connection-lines to or from the specific element (depending on dynamic layout algorithm).
Panning & Zoom Moving the viewpoint in all 2D/3D (depending on visualization technique) directions is possible. Free zooming into or from a specific graph detail is possible. A “home”-button for coming back to the origin position will be supported. The default viewpoint is having the mid of the graph in the mid of the canvas and the default zoom level is the flat representation and visibility of all nodes and edges in the default view.
Search Searching a special element is supported via a simple text input. If present, the element searched for is marked.
Selecting An element or a group of elements can be selected or unselected. The marking-rectangle will show the selection-radius. Selected elements will be drawn in an eye-catching way.
Undo A manipulation or navigation step can be undone or being retry. Table 11: System-wide manipulation techniques; Source: own illustration General mental map A division between two main mental map categories is made. At first, the general mental map represents an internal scale-model of the external reality. Second, the concrete mental map describes the behavior of the representation for achieving users’ mental map (cp. Bederson, Boltman, 1998; Khella, 2002; Davidson et al., 1999). The general mental map of the provenance data is a process flow and its representation from one beginning point to one or more ending point(s). The different main connotations exist in the Provenance paradigm; each one (“actor”, “interaction” [and its relation]) (cp. section 4.1) is represented by a separate view possibility or a combined one. It will be possible to explore the result of the query from a summarized top view of the processes to the detailed single element of a process. Besides the general mental map of the provenance data represented as processes, there will one more mental map (compare/difference concept). There, two subjects will be opposed to each other and the differences will be shown. Aesthetics of Sketch The view should support at least the following criteria of aesthetics (sorting in downward priority) (cp. paragraph 4.2.6):
• Minimal edge crossing • Layered drawings • Edges: Orthogonal

Bachelor Thesis
Final Report 09 June 2008
Markus Kunde
27
5.3.2. Concrete Visualization-concept Example “Process Landscape” At this point only one concrete representative visualization-concept will be described. The other ones can be found in appendix 5-14. Field of Application In this visualization-concept, two or more processes and their connection points will be analyzed and all actors will be shown. Discovering these facts will give a first insight of where the processes have their connections and which actors are the critical ones (depending on multiple-connections) in the whole process landscape. Identifying these components in the landscape can support the decision of improving the performance and quality of given components. Also assertions about possible bottlenecks can be made. The “Landscape” visualization describes the processes and their connections in a first insight. At this moment the end-user can decide whether a more detailed view to one specific process or component is necessary or not. The advantage of this concept is the fast overview of the process landscape without a time consuming tracking of the evolution each process. Point of Interest and Additional Interest All actors of two or more processes with their position in the whole process landscape are displayed. The additional interest information is not the primary desired information, but nevertheless can be asked by the end-user. Process related information Actor Name Actor States number
Table 12: Additional Interest; Source: own illustration Behavior in Visualization Map The behavior and interaction of the concept within the bordering concepts will be described at this point (cp. “Brushing & Linking” manipulation technique, Table 11). Higher level - Process Overview The connection between the visualization-concept “Process Landscape” (A) and the “Process Overview” (B) concept is defined as following: A ⊆ B ⇔ (x ∈ A ⇔ x ∈ B). The processes in the visualization-concept ‘A’ are equal to the one selected in the other level ‘B’, although it is possible that there are more than ‘x’ shown processes in the level ‘B’. Equal level – System Context The connection between the visualization-concept “Process Landscape” (A) and the “System Context” (B) concept is defined as following: A ⊇ B ⇔ (x ∈ A ⇔ x ∈ B). The process in the visualization-concept ‘A’ is equal to the one selected in the other level ‘B’, although it is possible that there are more than ‘x’ shown processes in the level ‘A’. Lower level - POI Overview The connection between the visualization-concept “Process Landscape” (A) and the “POI Overview” (B) concept is defined as following: A ⊇ B ⇔ (x ∈ A ⇔ x ∈ B). The process in the visualization-concept ‘A’ is equal to the one selected in the other level ‘B’, although it is possible that there are more than ‘x’ shown processes in the level ‘A’. Concrete Mental Map/Metaphor The concrete representation of this visualization-concept is similar to the tube map, e.g. used at the London Underground or any other train or bus station. Starting and end actors of a process are connected within their process-involved actors. As there is more than one process sketched, actors that

Bachelor Thesis
Final Report 09 June 2008
Markus Kunde
28
depend to more than one process are shown as connection-points (similar to nodes in a network graph). Every process line is sketched as an undirected individual line. Example Sketch
GUI
Calc
GNUPlot
Collector
Action-Java
ParVar
Cell BoxNast2D
Figure 10: Sketch Process Landscape Visualization-concept; Source: own illustration
As shown, the different colors of the connection-lines represent different processes. Raw Data The raw data consists of the un-interpreted result of the query to the Provenance store(s). The output of the Client Side Library is defined via XML-scheme (currently: version 25). Data Table and Transformation The data table consists of all relevant information of the processes. It is build up as follows: Data Table element Type Description ActorAddress Address One actor in the process. CollectionOfStates Collection (interactionKey,
viewType[S|R], documentationStyle, content)
This collection represents all actor-state related information. The states of each actor can be extracted.
Table 13: Data Table “Actor-states” of Visualization-concept; Source: own illustration Data Table element Type Description InteractionKey InteractionKey The interactionKey represents the global
unique identifier of an interaction. CollectionOfInteractionPAssertion
Collection (InteractionPAssertion, viewType[S|R])
This collection represents all interaction related information. All p-assertions regarding interactions are stored
Table 14: Data Table “Interactions” of Visualization-concept; Source: own illustration Data Table element Type Description InteractionKey InteractionKey The interactionKey represents the global
unique identifier of an interaction. CollectionOfRelationshipPAssertion
Collection (RelationshipPAssertion)
This collection represents all relationships related to an interaction. All p-assertions regarding relationships are stored
Table 15: Data Table “Relationship” of Visualization-concept; Source: own illustration

Bachelor Thesis
Final Report 09 June 2008
Markus Kunde
29
Data Table element Type Description InteractionKey InteractionKey The interactionKey represents the global
unique identifier of an interaction. CollectionOfrelatedInteractions
Collection (InteractionKey, relationName)
This collection represents an effective description of the connections of one interaction to other interactions.
Table 16: Data Table “Connection” of Visualization-concept; Source: own illustration The general algorithm for filling the relations is to traverse the complete raw data for filtering the above elements. These relations can be used for drawing a graph with any layout algorithm. During the traverse of the raw data, the data about all information is collected. Visual Structure and Mapping The visual structure draws all actors of each process as an undirected acyclic graph (this structure is similar to the tube map of the London Underground). The starting- and endpoints are the same size while the size of the connection points varies with the number of connections. The graph can either be horizontal or vertical. Layout Algorithm The general aim of drawing the graph is to create as much angle as possible between each edge for improving the readability of the complex graph. Additional, every bend of an edge increases the complexity of the graph. A strong hierarchical structure is not mandatory. The dynamical orthogonal graph drawing described in (Kaufmann, Wagner, 2001, p. 237) is a good approach, as this approach implements the above requirements (“Fößmeier improved” or “Biedl and Kaufmann” algorithm). The result of the orthogonal layout algorithm is shown in the above example sketch (Figure 10). View and Transformation The view consists of only one element group, the actors. The actor-elements consist of the name, showing in the elements drawing. This view is the only graph drawing, where the connection-lines have several colors. This color division depends on the fact, that in a collection high-contrast colors are pitted against each other in the “Color Hexagon”. Therefore, in accordance with the number of different processes, a geometrical form (same side length) has to be put over this “Color Hexagon”. Each color touched by the corner of the form represents exact one color chosen for the line-color. The illustration shows exemplary six selected colors:
Figure 11: Color Hexagon with six selected colors; Source (Crüger, 2008)
The size of the node depends on the number of clinging edges. The node with the highest number of clinging edges becomes 300% greater than the lowest one, including nuances between, depending on the number of edges of a node. Besides the techniques mentioned in the general visualization-concept, the transformation of the concrete view follow the following manipulation techniques:

Bachelor Thesis
Final Report 09 June 2008
Markus Kunde
30
Technique Description Magic Lenses The Magic Lenses technique increases the detail of one selected element. In
general, a window (e.g. popup) appears in the foreground and displays additional information. The following content will displayed: Composed Actor:
• Name • States no.
Table 17: Manipulation Technique of Visualization-concept; Source own illustration Aesthetics of Concept The view should support the following criteria of aesthetics (supplement or unlike the ones defined in the general visualization-concept):
• Edges: Only horizontal, vertical; undirected • Edges can be colored • Edges thicker than normal, depending on the frequency of process-way (edge) usage • Nodes thicker than normal, depending on the frequency of process-way (node) usage
Dis-/Advantages and Limitations Besides its intention and classifying onto the visualization map, its main disadvantage is the complexity of the graph, depending on the complexity of the query result. The concept is intended as giving a first overview and getting a first assertion about the processes, but it is limited to general processed information, which does no possess an assertion about the process chain. In combination with the manipulation technique “Brushing & Linking”, this concept can be used excellent for discovering process behavior in the context of the whole system (process landscape).
5.4. System Architecture The developing of the system architecture of the Visual Information Seeking System is the third phase of the project. The requirements regarding the technical structure, the general function and the build-up of the system are discussed.
5.4.1. System Requirements Already discovered in the main phase 1, the requirements regarding the VISS are dependent on several ideas. These ideas are based on the discovery of non-functional requirements (paragraph 5.2.7) and internal inquiries. The following list displays the requirements of the system architecture. The listing is complementary regarding the already identified non-functional requirements. System Requirement Description Supporting Information Seeking Process
The cyclical process of information seeking has to be considered. The results (data extract) of one research pass may be the basis for a new pass.
Support different views on Provenance data regarding different detail levels
There is no perfect visualization technique, but there are several that fulfill the needs of the end-user (cp. Mann, 2002).
Views can be displayed integrated
The views can be used in an integrated, parallel way instead of in an alternative way.
Resultset is storable High volume data is possible. The result of a request regarding the Provenance architecture must be storable locally in order to decrease network load.

Bachelor Thesis
Final Report 09 June 2008
Markus Kunde
31
Architecture must be flexible due to changing circumstances
There could be changes in several parts affecting the VISS. The visualization-concepts with visual-query-concepts (not subject of this bachelor thesis; cp. Query Visualization paragraph 4.2.2) and the Provenance Architecture can be changed.
Architecture must be maintainable
There are many application domains for this VISS. As changes in every domain are possible, the architecture should have a general focus onto the maintainability apart from its flexible nature.
Architecture has to take into consideration the distributed character of Provenance data
The Provenance data may be located in several Provenance stores, which could be located in several places. Therefore, requesting the data can take a while. The VISS should be usable even in such a case.
System should have a good Performance
High volume data and processing is possible. The VISS should be usable even in such a case.
Table 18: System Requirements of VISS; Source: own illustration
5.4.2. System Build-Up With respect to the system requirements, the system architecture of the VISS was developed. In general, the system will be loosely coupled to the Provenance architecture. As displayed in the illustration below, the VISS communicates via the Client Side Library with the Provenance architecture while the end-user is interacting with the Presentation Layer of the VISS. The system architecture itself is therefore independent of both affecting environments. The architecture is build-up in a modular and component-based way. The advantage of such a structure is having the possibility of independent parts interacting through defined interfaces. This makes the structure flexible and maintainable. In the case of the visualization-concepts, the visual-query-concepts, the graph algorithms and manipulation techniques the architecture will provide a plug-in technology to enlarging the functionality of the VISS.
Figure 12: System Architecture of VISS; Source: own illustration

Bachelor Thesis
Final Report 09 June 2008
Markus Kunde
32
As displayed, the communication between the different components follows defined interfaces (displayed as a layered architecture; the upper level can only make use of the lower level while the lower level provides functionality to the upper level). The layered architecture represents the three-tier architecture. This architecture gives the opportunity of developing a client-server architecture. This flexible build-up can be used for developing a central data table or graph-designing component (in special cases useful). The layered architecture provides a component-based build-up of the system with well-defined interfaces. Reutilization in case of an abstract system architecture is one of the advantages in such a structure. In the following each component of the VISS will be described briefly. In appendix 16 sequence diagrams display the general process (and not a concrete implementation of method headers) used in the system architecture. They point out the functionality according to the reference model for visualization (cp. Figure 1), which represents the fundamental of this architecture. Presentation Layer (GUI) The Presentation Layer is the connection element to the end-user. It represents the graphical user interface. Besides other functionality, the Presentation Layer has two main tasks. On the one hand it is the graphical representation of Provenance on the screen (displaying the graphs described in the visualization-concepts) and a support in the selection process of Provenance data (Query visualization). On the other hand, the user-manipulations on the graphical representation are caught. Dialog Handler The Dialog Handler represents the manager of occurring events. User inputs are caught and transformed to system-internal commands. The Dialog Handler is therefore the event handler of the system regarding user input. In the case of graphical output of the system, the dialog handler is transparent to these graphical representations. Logical Controller The Logical Controller represents the logic-component of the system. Its tasks are the processing of the user inputs and the execution of the process-steps behind them. It is a central component in the architecture. The Logical Controller is the connection to the graphical user interface level. It hides the system-internal components and provides therefore an interface to the abstract level of visualization or query-internal processing. Visualization Component The visualization component represents the central component regarding the visualization-concepts, developed in main phase 2. The task of this component depends on the processing of the visualization-concepts. A plug-in possibility for new concepts is given. Therefore this component describes a general interface to the upper and lower level regarding the visualization concepts. Graph Drawing Component The computation of the graph of the visual structure (regarding visualization-concepts) and its manipulation possibilities are covered here. This component represents a library-functionality regarding the Visualization Component. A plug-in possibility for new layout algorithms and manipulation technologies is given. Visual Query This component is responsible for processing the visual-query-concepts. These concepts use a defined interface of the Query Language Component. A plug-in possibility for new concepts is given. Therefore this component describes a general interface to the upper and lower level regarding the visual-query-concepts. Query Language Component The Query Language Component provides a defined interface for the query-visualization-concepts. Its task is hereby the translation into an internal query language (the reasons are covered in the description of the Query Translator Component).

Bachelor Thesis
Final Report 09 June 2008
Markus Kunde
33
Resource Manager The Resource Manager hides the data retrieving tasks of the VISS. The task of the Resource Manager is to decide, whether data is already in the Data Cache (caching the data table; cp. visualization-concepts) or has to be fetched from the Provenance architecture. The Resource Manager manages the Data Cache too. Data Transformation Component This component receives the data from the Client Side Library. The raw data is transformed into the data tables (cp. visualization-concepts). The Data Transformation Component hides the Client Side Library from the rest of the VISS. The reason for this abstraction step is the possibility of changes due to the Provenance Architecture or the Client Side Library. Query Translator Component The Query Translator Component hides the Client Side Library from the rest of the VISS. The VISS-internal query language (this query language represents the language between Query Language Component and Query Translator Component) is translated into the query-interface of the Client Side Library. The reason for this abstraction step is the possibility of changes due to the Provenance Architecture or the Client Side Library. Client Side Library The Client Side Library component represents the supplied library of the Provenance developers for interacting with the Provenance Architecture. It has defined interfaces.

Bachelor Thesis
Final Report 09 June 2008
Markus Kunde
34
6. Conclusion and Evaluation This chapter is the conclusion of the project and the estimation of the results including a personal evaluation of the project. The aims of the bachelor thesis are the creation of visualization-concepts regarding Provenance data and the development of an adequate system architecture with respect to the requirements of Provenance users. The initial planning consists of the implementation of the system architecture as a third task, but this step was skipped and an adjustment of the time planning was made. The central concept (approach of Ben Fry) was replaced with the reference model for visualization. The reason for this decision is the improved compatibility to the visualization-concepts and the system architecture. The reference model describes a more general approach. This approach supports therefore the general nature of the concepts and the architecture. The results of the project were discussed in several meetings. An approach similar to the prototyping-concept was used for the improvement of the visualization-concepts and the system architecture. Therefore the initial visualization-concepts changed during the project. Several visualization possibilities evolved from the origin visualization types and dismissed over the time. The current collection of visualization-concepts represents the final concepts that were discussed and improved several times. The second approach of improving the visualization-concepts was handing in a proposal paper about requirements for a Provenance visualization-panel and visualization possibilities of this data. The remarks of the IPAW 2008 program committee was used to rethink and improve the concepts. The third approach for a validation of the concepts was the comparison of the concepts with the identified user requirements to find matching solutions. The result of the comparison is displayed in appendix 15. The visualization-concepts and the system architecture are general in nature. If a concrete implementation of the system is necessary in the future, special user requirements and the concrete background of the application should be analyzed. Probably changes, improvements or enlargements regarding the visualization-concepts may occur; especially the content at the bottom of interactions may appear in the graphical representation. Besides the general nature of the concepts all decisions regarding aesthetics of visualizations have to be handled with care. The decisions represent the result of a journey into the field of psychology or, in an information technology context, in the field of human computer interaction. Just as the applied knowledge during the development of the visualization-concepts, the experience and cognitions extracted from these fields were used for achieving the outcome of the project. These cognitions represent the result of current researches in these fields, but they are always debatable. Therefore the implementation of a concrete system has to take into account ethical or cultural varieties. This final paragraph is my personal evaluation of the bachelor thesis. This project was a big challenge for me. In general, the project consists of two unknown subjects in combination with tight time planning. Provenance, as a technical idea, was an absolutely unknown field. Among the fact that Provenance is currently a research field, its specification is even today voluminous and not conclusive. The field of visualization technologies and its combination with the field of psychology and human computer interaction is the second unknown subject. As in the field of Provenance, the field of visualization technologies claims a need for a fast and complete investigation. In combination with the preparation of this bachelor thesis and the creation of the proposal paper (submitted in mid of March), the time plan of four months allowed by the university is very tight. A lot of effort was required due to the fact that both subjects were unknown to me. My first dive into the field of visualizations and human computer interaction may help me a lot in the future, as this field becomes one of my professional skills (and even a field that I would be personally interested in). For these reasons, working on the field of Provenance visualization was the right decision for me.

Bachelor Thesis
Final Report 09 June 2008
Markus Kunde
35
I would like to conclude this bachelor thesis with a citation that best reflect my thoughts on the project:
“In theory, there is no difference between theory and practice, but in practice there is” – unknown

Bachelor Thesis
Final Report 09 June 2008
Markus Kunde
36
References The following listing represents the sources used for this document. AWI Bremerhaven, C3 Grid Homepage, published on internet, URL: http://www.c3grid.de (Query: 18/03/2008 15.00h). Bederson B., Boltman A., Does Animation Help Users Build Mental Maps of Spatial Information?, HCIL Technical Report, 1998. Boisot M., Canals A., Data, information and knowledge: have we got it right?, Internet Interdisciplinary Institute, Working Paper Series WP04-002, 2004. Burkhard, R., Learning from architects: The difference between Knowledge Visualization and Information Visualization, Proc: Eigth International Conference on Information Visualization (IV04), London, July, 2004. Card S., Mackinlay J., Shneiderman B., Readings in Information Visualization. Using visions to think, San Francisco, 1999. Crüger, I. Fraunhofer Institut für integrierte Publikations- und Informationssysteme Darmstadt, Farbentheorie und Farbgestaltung, published on internet, URL: http://www.ipsi.fraunhofer.de/~crueger/farbe/index.html (Query: 21/05/2008 14:00h). Datasegment, Onlinedictionary Homepage, published on internet, URL: http://onlinedictionary.datasegment.com/ (Query: 18/03/2008 15:00h). Davidson M. J., Dove L., Weltz J., Mental Models and Usability, published on internet, URL: http://www.lauradove.info/reports/mental%20models.htm (Query: 05/05/2008 15:00h). Eiglsperger M., Siebenhaller M., Kaufmann M., An Efficient Implementation of Sugiyama’s Algorithm for Layered Graph Drawing, Journal of Graph Algorithms and Applications, 2005. Fowler M., Patterns of Enterprise Application Architecture, Addison-Wesley, 2003. Fowler, M., UML Distilled, 3rd Edition, Massachusetts, 2004. Fry, B., Visualizing Data, 1st Edition, 2007. German Aerospace Center_a, DLR Company description Homepage, published on internet, URL: http://www.dlr.de/desktopdefault.aspx/tabid-636//1065_read-1465/ (Query: 18/03/2008 15:00h). German Aerospace Center_b, DLR DataFinder Homepage, published on internet, URL: http://www.dlr.de/sc/desktopdefault.aspx/tabid-1189/1650_read-3140/ (Query: 18/03/2008 15:00h). German Aerospace Center_c, DLR Columbus Laboratory Homepage, published on internet, URL: http://www.dlr.de/iss/en/desktopdefault.aspx/tabid-4410/7315_read-4019/ (Query: 18/03/2008 15:00h). Giuseppe di Battista et al., Graph Drawing: Algorithms for the visualization of graphs, Pearson US, 1998.

Bachelor Thesis
Final Report 09 June 2008
Markus Kunde
37
Gridcomputing, Gridcomputing Homepage, published on internet, URL: http://www.gridcomputing.com/gridfaq.html (Query: 18/03/2008 15:00h). Groth et al., An architecture for Provenance systems, 2006. Hearst, Marti A., User Interfaces and Visualization. In: Baeza-Yates, Ricardo A., Ribeiro-Neto, Bethier (Eds.), Modern Information Retrieval. Reading, MA (Addison Wesley Longman),1999. IPAW Committee, IPAW 2008 Homepage, published on internet, URL: http://www.ipaw.info (Query: 12/05/2008 10:00h). Jiang, S., Client Side Library Design and Implementation, 2006. Kaufmann M., Wagner D., Drawing graphs: Methods and models (Lecture notes in computer science), 1st Edition, Springer Berlin, 2001. Khella, A., Knowledge and Mental Models in HCI, published on internet, URL: www.cs.umd.edu/class/fall2002/cmsc838s/tichi/printer/knowledge.html (Query: 05/05/2008 15:00h). Kloss et al., DataFinder: An EU Provenance Case Study, not for distribution, 2006. Kunde, M., Bachelor thesis Arbeitsplan, 2008. Langreiter, C., Comparing Google and Yahoo! Search results, published on internet, URL: http://www.langreiter.com/exec/yahoo-vs-google.html (Query: 06/06/2008 15:00h). Ludwig, K., STAR – Visualisierung von Daten, Universität Konstanz, April 2004. Mann, M., T., Visualization of Search Results from the World Wide Web, Diss. Freiburg im Breisgau 2002. Marchionini, G., Interfaces for end-user information seeking, In: Journal of the American Society for Information Science (JASIS), 1992. Marchionini, G., Information Seeking in Electronic Environments, Cambridge University Press, 1997. Meyer J. A., Visualisierung von Informationen, Gabler Verlag, Wiesbaden, 1999. Meyers Lexikonverlag, Visualisierung, Bibliographisches Institut & F. A. Brockhaus AG, Side ID: 126733, published on internet, URL: http://lexikon.meyers.de/index.php?title=Visualisierung&oldid=126733 (Query: 15/05/2008 10:00h). Pasoa Consortium, Pasoa Homepage, published on internet, URL: http://www.pasoa.org (Query: 18/03/2008 15:00h). Provenance Consortium, EU Grid Provenance Homepage, published on internet, URL: http://www.gridprovenance.org (Query: 18/03/2008 15:00h). Shneiderman, B., Designing the user interface, Strategies for effective human computer interaction, 3rd Edition, MA, Addison-Wesley, 1998.

Bachelor Thesis
Final Report 09 June 2008
Markus Kunde
38
Sommerville, I., Software Engineering, 7th Edition, 2004. Stelzner, R., Der goldene Schnitt – Das Mysterium der Schönheit, Disputation Diss. Essay, Witten/ Herdecke, 2003. Sugiyama K., Graph Drawing and Applications for Software and Knowledge Engineers (Series on Software Engineering & Knowledge Engineering), World Scientific Pub Co, 2002. W3Schools, W3Schools Homepage, published on internet, URL: http://www.w3schools.com/xquery/xquery_intro.asp (Query: 18/03/2008 15:00h). WorkPackage2, Grid Provenance user requirements document, 2005.

Bachelor Thesis
Final Report 09 June 2008
Markus Kunde
39
Appendix The following pages represent the appendix the document refers to.

Bachelor Thesis
Final Report 09 June 2008
Markus Kunde
40
1. Appendix: Provenance XML Structure <pstruct>
<interactionRecord> <interactionKey>
<messageSource/> <messageSink/> <interactionId/>
</interactionKey> <sender>
<asserter/> <interactionPAssertion>
<localPAssertionId/> <documentationStyle/> <content/>
</interactionPAssertion> <relationshipPAssertion>
<localPAssertionId/> <subjectId>
<localPAssertionId/> <dataAccessor/> <parameterName/>
</subjectId> <relation/> <objectId>
<interactionKey> <messageSource/> <messageSink/> <interactionId/>
</interactionKey> <viewKind/> <localPAssertionId/> <dataAccessor/> <parameterName/> <objectLink/>
</objectId> </relationshipPAssertion> <actorStatePAssertion>
<localPAssertionId/> <documentationStyle/> <content/>
</actorStatePAssertion> <exposedInteractionMetaData>
<globalPAssertionKey> <interactionKey>
<messageSource/> <messageSink/> <interactionId/>
</interactionKey> <viewKind/> <localPAssertionKey/> <any/>
</globalPAssertionKey> <interactionMetaData>
<tracer/> <any/>
</interactionMetaData> </exposedInteractionMetaData> <any/>
</sender> <receiver>
Similar to “sender” </receiver> <any/>
</interactionRecord> </pstruct>

Bachelor Thesis
Final Report 09 June 2008
Markus Kunde
41
2. Appendix: Functional Requirements Annotation: The classification allocation is: No. Classification
A Question of origin B Question of inheritance C Question for participants D Question for dependencies E Question for progress F Question for quality
The Grouping allocation is: No. Group
1 Process 2 Results 3 Relationship 4 Timeline 5 Participation 6 Compare 7 Interpretation
User requirements
Abstract Dimension
Abstract view
Abstract intention Class. Group
AR-1-1 Interaction Relationship
Sequence Check workflow against rules F 1, 6
AR-1-2 Interaction Relationship
Sequence Understand decision tree A, D 1, 2
AR-1-3 All Point Derive aggregate information of a workflow
F 1, 7
AR-1-4 Interaction Sequence Pre-calculate related end result A, F 1, 2 AR-1-5 All Sequence Collection of all related information A, B, C 1, 2, 3 AR-1-6 Interaction Sequence Identify all involved users C 3 AR-1-7 Interaction
Relationship Sequence Check workflow against templates
(see also AR-1-1) F 1, 6
AR-1-8 Interaction Relationship
Sequence Checking derivation process of the result with standardized view (see also AR-1-2)
E 1, 7
AR-2-1 Interaction Relationship
Sequence Tracing back the process of data transformation
A, D 1, 2, 3
AR-2-2 All Sequence Rerun workflow E 1 AR-2-3 Interaction Sequence Follow data access of users (only
authorized?) C 1, 5
AR-2-4 Interaction Relationship
Sequence Follow data access of any actor (only authorized?) (see also AR-2-3)
C 5
AR-3-1 Interaction Sequence Check workflow against policies (see also AR-1-1)
E, F 1, 6
AR-3-2 Interaction Relationship
Sequence Check if a data item was used before as an object (input) and discover the end results of these workflows
B 1, 2, 3
AR-3-3 Interaction Sequence Identify bottlenecks in the processes using timestamps
E 1, 4, 6

Bachelor Thesis
Final Report 09 June 2008
Markus Kunde
42
User requirements
Abstract Dimension
Abstract view
Abstract intention Class. Group
AR-4-1 Interaction Relationship
Sequence Check workflow against rules (see also AR-1-1)
E, F 1, 3, 4, 5, 6
AR-4-2 All Sequence Check if result has not being tampered
C, E, F 2, 3, 5, 7
AR-5-1 All Sequence Show complete workflow A 1, 2, 3 AR-5-2 Interaction Point Checking if a workflow is done E 1, 2, 4 AR-5-3 Interaction
Relationship Sequence Check workflow against rules (see
also AR-1-1) F 1, 2, 5,
6, 7 AR-5-4 Interaction
Relationship Sequence Check workflow against rules and
particular services were used correct (see also AR-1-1)
F 1, 3, 5, 6, 7
AR-5-5 Interaction Actor state
Point Check if services used were working correct
F 1, 2, 3
AR-5-6 All Point Check if results of workflow were due to interesting features of the objects or nuances of the experiment
B, D 7
AR-5-7 Interaction Relationship
Point Linking workflow and Provenance results together to provide extra context
A, B, C, D, E
1, 6, 7
AR-5-8 Interaction Relationship
Sequence Tracing back a result (see also AR-2-1)
A, D 1, 3, 5
AR-5-9 Interaction Relationship
Sequence Tracing back a result and forward to a result (see also AR-2-1)
A, D 2, 3
AR-5-10 Interaction Relationship
Sequence Extract process information to a process (see also AR-1-5 and AR-5-1
A, C, D 1, 2
AR-5-11 Interaction Relationship
Sequence Checking derivation of process and rerun it (see also AR-1-8 and AR-2-2)
E, F 1, 7
AR-5-12 All Sequence Compare old results with new results of a workflow
E, E 2, 6
AR-5-13 All Sequence Evaluation of results (see also AR-5-6)
E, F 2, 7
AR-6-1 Interaction Relationship
Sequence Check workflow against templates (see also AR-1-7)
F 1, 6
AR-6-2 Interaction Sequence Check workflow against policies (see also AR-1-1)
F 2, 6
AR-7-1 Interaction Relationship
Sequence Evaluation of results (see also AR-5-6)
A 2, 3
AR-7-2 Interaction Sequence Follow data access of users (only authorized?) (see also AR-2-3)
C 5
TR-1-1-A-1 Interaction Point Data access of a service from any actor
A, B, C, D
2, 3, 5
TR-1-1-A-2 Interaction Relationship
Point Show workflow of subject and objects in a particular point
A, B, C, D
1, 3, 5
TR-1-1-A-3 Action state Point State of a particular actor at a given time
E 1, 2, 4
TR-1-1-A-4 Interaction Sequence Capturing side effects (interactions not direct to the monitored IT-system)
A, C, D 3, 5
TR-1-1-B-1 Interaction Sequence Versions of the used code that generates a particular outcome
C 1, 3, 5
TR-1-1-B-2 Interaction Sequence Identify all involved objects A 2, 3 TR-1-1-B-3 Interaction Sequence Identify all involved objects. A 2, 3 TR-1-1-B-4 Interaction Sequence Check workflow against job-rejection E, F 1, 4, 7 TR-1-1-B-5 Interaction Sequence Follow data access of users (only
authorized?) (see also AR-2-3) C 5
TR-1-1-C-1 Interaction Relationship
Sequence Complete Workflow with subject and objects of each interaction (see also AR-5-1)
A, B, D 2, 3, 5

Bachelor Thesis
Final Report 09 June 2008
Markus Kunde
43
User requirements
Abstract Dimension
Abstract view
Abstract intention Class. Group
TR-1-1-C-2 Interaction Sequence Identify all involved users. (see also AR-1-6)
C 4, 5
TR-1-1-C-3 Interaction Sequence Identify bottlenecks in the processes using timestamps (see also AR-3-3)
E 4
TR-1-1-C-4 Interaction Sequence Versions and timestamp of the used code that generates a particular outcome (see also TR-1-1-B-1)
E, F 1, 2, 5
TR-1-1-C-5 Interaction Relationship
Sequence Show workflow of subject and objects in a sequence
A, B 2, 3, 5
TR-1-1-C-6 Interaction Relationship
Point Additional information about a service/ interaction/ actor
E, F 2, 3, 5, 7
TR-1-1-D-1 Interaction Point Identify the source/ object/ asserter of each interaction
A 2, 3, 5
TR-1-1-D-2 Interaction Point Identify timestamp of each interaction E 2, 3, 4 TR-1-1-D-3 Relationship Point Referring material of each interaction
(object/ subject) (see also AR-2-1 and TR-1-1-A-4)
C, D 2, 3, 5
TR-1-1-E-1 Interaction Sequence Versions of the used code that generates a particular outcome (see also TR-1-1-B-1)
E, F 2, 3, 5
TR-1-1-E-2 All Sequence Show complete workflow (see also AR-5-1)
A, B, C, D, E
1, 2, 3, 5
TR-1-1-E-3 Interaction Sequence Quality of service metrics, additional information of workflow
E, F 4, 7
TR-1-1-F-1 Interaction Sequence Versions and timestamp of the used code that generates a particular outcome (see also TR-1-1-B-1)
E, F 2, 3, 5
TR-1-1-F-2 Interaction Sequence Identify all involved users. (see also AR-1-6)
C 5
TR-1-1-F-3 Interaction Point Identify timestamp of each interaction (see also TR-1-1-D-2)
E 4
TR-1-1-F-4 Interaction Sequence Analysis of “ambient conditions” (additional information) (see also TR-1-1-C-6)
E, F 3, 5, 7
TR-1-1-F-5 Interaction Relationship
Sequence Evaluation of results (see also AR-5-6)
A, B 1, 2, 3
TR-1-1-G-1 Interaction Point Identify timestamp of each interaction (see also TR-1-1-D-2)
E 4
TR-1-1-G-2 Interaction Sequence Versions of the used code that generates a particular outcome (see also TR-1-1-B-1)
F 2, 3
TR-1-1-G-3 Interaction Relationship
Sequence Show workflow of subject and objects in a sequence (see also TR-1-1-C-5)
A 2, 3
TR-1-1-H-1 Interaction Relationship
Sequence Show workflow of subject and objects in a sequence (see also TR-1-1-C-5) Versions of the used code that generates a particular outcome (see also TR-1-1-B-1)
A 2, 3
TR-1-1-H-2 Interaction Relationship
Sequence Show workflow of subject and objects in a sequence (see also TR-1-1-C-5)
A 1, 2, 3
TR-1-1-i-1 Interaction Relationship
Sequence Show workflow of subject and objects in a sequence (see also TR-1-1-C-5) Versions and timestamp of the used code that generates a particular outcome (see also TR-1-1-B-1)
A, B 2, 3, 5
TR-1-2 All Point Provide a way for annotate the data F 7

Bachelor Thesis
Final Report 09 June 2008
Markus Kunde
44
User requirements
Abstract Dimension
Abstract view
Abstract intention Class. Group
TR-6-4-B All All Information users would found useful (Votes in percentage):
• Details of all service invocations (40%)
• The services that were selected for execution (50%)
• Statistics of execution of services invoked (50%)
• Information on services invoked (50%)
• Motivational/ contextual information for the execution: why this was run, by whom (60%)
• Higher-level information on the execution not explained in terms of low service description but “scientific terms” such as sequence alignment, etc. (80%)
A, B, C, D, E, F
1, 2, 3, 5, 7

Bachelor Thesis
Final Report 09 June 2008
Markus Kunde
45
3. Appendix: Non-Functional Requirements Requirement Description TR-4-2 Dynamic processing of Provenance data
Data should be queriable even if the record session is still in progress TR-6-2 Human-computer interfaces designed for multilingual support TR-6-3 Human-computer interfaces designed for usage of non computer scientists TR-6-5-A Provenance information should be trackable on human-computer interfaces presented by
the system at set level (e.g. Database table or spreadsheet) TR-6-5-B Provenance information should be trackable on human-computer interfaces presented by
the system at individual data items (e.g. record in database or cell in spreadsheet) TR-6-5-C The granularity of the Provenance information displayed should be configurable based on
policies TR-6-6-A Provenance information displayed should be updateable via user request TR-6-6-B Provenance information displayed should be updated automatic on every change (e.g.
continuous monitoring) TR-6-6-C Provenance information displayed should be updated on each execution session TR-6-6-D The update frequency of Provenance information displayed should be configurable based
on policies TR-7-1 (partly) Detailed description of human-computer interfaces. CR-4-4-A Provenance information has different (based on policy of concrete Provenance
application) access rights. CR-4-4-B See also CR-4-4-A CR-4-5 The security infrastructure should have single sign-on CR-4-6 The security infrastructure should be the same as the one of the application (particularly
for any end-user client) CR-5-6 The whole architecture (application, Provenance store and end-user client) should be
loosely coupled and independent to each other CR-5-7 The tool should be based on published APIs and not on hidden internal APIs. DLR-internal-NF-1 The visualization-panel should be based on Eclipse view (Plug-in) DLR-internal-NF-2 Java 1.5 has to be used DLR-internal-NF-3 Eclipse Version 3.3 has to be used DLR-internal-NF-4 Usage of SWT Version 3.3 DLR-internal-NF-5 DLR internal Code Conventions has to be followed DLR-internal-NF-6 The flexibility of the software in the meaning of future extensions has to be kept in mind DLR-internal-NF-6 Documentation of the visualization-panel has to be produced DLR-internal-NF-8 Maintainability of the software is important

Bachelor Thesis
Final Report 09 June 2008
Markus Kunde
46
4. Appendix: Standard Visualization Examples System Context Diagram (related to Dependency Diagram)
Brainstorm Diagram (related to Dependency Diagram)
Data Flow Diagram (related to Process Diagram)
Difference Diagram (related to Difference Diagram)

Bachelor Thesis
Final Report 09 June 2008
Markus Kunde
47
Fishbone Diagram (related to Dependency Diagram)
Flow Chart (related to Process Diagram)

Bachelor Thesis
Final Report 09 June 2008
Markus Kunde
48
Sequence Diagram (related to Timeline Diagram)
Spreadsheet (related to Spreadsheet Diagram)
State Chart Diagram (Related to Dependency and Timeline Diagram)

Bachelor Thesis
Final Report 09 June 2008
Markus Kunde
49
5. Appendix: Visualization-concept “ResultSet” Field of Application In this visualization-concept, the result of the query within the Client Side Library will be shown. As this do not represents any kind of interpretation, it is discussable if this is already a full visualization-concept. To have a full collection of every level (cp. Visualization map), this concept represents the first presentation of the result. This concept represents an allusion to a Scientific Visualization possibility, which can be developed in the Visual Information Seeking System context. Point of Interest and Additional Interest The original un-interpreted textual data (hierarchical data) is shown in this concept. Behavior in Visualization Map The behavior and interaction of the concept within the bordering concepts will be described at this point (cp. “Brushing & Linking” manipulation technique). Lower Level – Process Overview The connection between the visualization-concept “ResultSet” (A) and the “Process Overview” (B) concept is defined as A = B ⇔ (x ∈ A ⇔ x ∈ B). All processes described in this concept are equal to the one shown in the lower concept. Concrete Mental Map/ Metaphor There is no concrete mental map or metaphor used in this concept except a hierarchical structure, which depends already on the structure of the fundamental data. The tree-structure with its folding elements will be used for representation of the data. Example Sketch No sketch. Referring to graphical XML-hierarchical structure viewer. Raw Data The raw data consists of the un-interpreted result of the query of the Provenance Store(s). The output of the Client Side Library is defined via XML-scheme (currently: version 25). Data Table and Transformation No interpretation will be done. The hierarchical structure will be represented one to one. Visual Structure and Mapping No interpretation will be done. The hierarchical structure will be represented one to one. View and Transformation Besides the techniques mentioned in the general visualization-concept, the transformation of the concrete view follow the following manipulation technique: Technique Description Folding The hierarchical structure of the data is put into a tree-view and can be folded one by
one at any node layer. The underlying elements are hidden (or presented) in this case Aesthetics of Concept There is no additional aesthetics available regarding the fact that no graph structure is given. Dis-/Advantages and Limitations The structure is extremely complex and hardly to read, although every Provenance information is covered in this concept.

Bachelor Thesis
Final Report 09 June 2008
Markus Kunde
50
6. Appendix: Visualization-concept “Process Overview” Field of Application In this visualization-concept the processes are listened for a first overview. This concept represents the highest visualization possibility of the provenance data. Only the distinction between different processes is made. A first insight about the complexity of the result set and a first distinction between interesting or non-interesting processes and can be made. This concept represents the number of different processes in the query result. The end-user can decide whether a group of processes should be evaluated in the context of each other or the analysis of a single process should be more promising. Point of Interest and Additional Interest The number of the involved processes is important. The additional interest information is not the primary desired information, but nevertheless can be asked by the end-user.
Process related information Actors no. Interactions no.
Behavior in Visualization Map The behavior and interaction of the concept within the bordering concepts will be described at this point (cp “Brushing & Linking” manipulation technique). Higher Level – ResultSet The connection between the visualization-concept “Process Overview” (A) and the “ResultSet” (B) concept is defined as A = B ⇔ (x ∈ A ⇔ x ∈ B). All processes described in this concept are equal to the one shown in the lower concept. Lower Level – Process Landscape & System Context The “Landscape” visualization-concept is the first direct lower level (multiple processes selected) and the “system-context” visualization-concept represents the second direct lower level (one process selected). The connection between this concept (A) and the “Landscape”-concept (B) concept is defined as following: A ⊇ B ⇔ (x ∈ A ⇔ x ∈ B). The processes in the visualization-concept ‘A’ are equal to the one selected in the other level ‘B’, although it is possible that there are more than ‘x’ shown processes in the level ‘A’. The connection (cp. “Brushing & Linking” manipulation technique) between this concept (A) and the “System Context”-concept (B) is defined as following: A ⊇ B ⇔ (x ∈ A ⇔ x ∈ B). The process selected in the visualization-concept ‘A’ is equal to the one selected in the other level ‘B’, although it is possible that there are more than ‘x’ shown processes in the level ‘A’. Concrete Mental Map/ Metaphor There is no concrete mental map or Metaphor used in this concept, as the concept only represents non-coupled process elements. No graph or another representation fits at this point.

Bachelor Thesis
Final Report 09 June 2008
Markus Kunde
51
Example Sketch
As displayed, every process is sketched independent to each other. General information (“additional information”) can be shown via the manipulation technique “magic lenses”. Raw Data The raw data consists of the un-interpreted result of the query of the Provenance store(s). The output of the Client Side Library is defined via XML-scheme (currently: version 25). Data Table and Transformation The data table consists of all relevant information of the processes. It is build up as follows: Data Table element Type Description ActorAddress Address One actor in the process. CollectionOfStates Collection (interactionKey,
viewType[S|R], documentationStyle, content)
This collection represents all actor-state related information. The states of each actor can be extracted.
Data Table element Type Description InteractionKey InteractionKey The interactionKey represents the global
unique identifier of an interaction. CollectionOfInteractionPAssertion
Collection (InteractionPAssertion, viewType[S|R])
This collection represents all interaction related information. All p-assertions regarding interactions are stored
Data Table element Type Description InteractionKey InteractionKey The interactionKey represents the global
unique identifier of an interaction. CollectionOfRelationshipPAssertion
Collection (RelationshipPAssertion)
This collection represents all relationships related to an interaction. All p-assertions regarding relationships are stored
Data Table element Type Description InteractionKey InteractionKey The interactionKey represents the global
unique identifier of an interaction. CollectionOfrelatedInteractions
Collection (InteractionKey, relationName)
This collection represents an effective description of the connections of one interaction to other interactions.
The general algorithm for filling the relations is to traverse the complete raw data for filtering the above elements. These relations can be used for drawing a graph with any layout algorithm. During the traverse of the raw data, the data about all information is collected.

Bachelor Thesis
Final Report 09 June 2008
Markus Kunde
52
Visual Structure and Mapping The visual structure of this visualization-concept is designed simple. Each is represented as exact one process element (cp. Presentation Legend; cp. Example-sketch). The intention is to see individual processes and to decide whether a specific process will be studied (“System-context”) or the processes will be evaluated in combination with each other (“Landscape”). Layout Algorithm There is no need for using a complex graph algorithm. The implementation of the dynamical orthogonal algorithm, “Fößmeier improved” or “Biedl and Kaufmann” algorithm, (Kaufmann M., Wagner D., 2001) can be used. It will draw the process in a rectangle-format without any overcutting. View and Transformation The view consists of only one element group, the processes. The processes are not labeled. Besides the techniques mentioned in the general visualization-concept, the transformation of the concrete view follow the following manipulation technique: Technique Description Magic Lenses The Magic Lenses technique increases the detail of the selected element. In general,
a window (pop-up) appears in the foreground and displays the additional information of the process. The following content will displayed:
• All additional process information Aesthetics of Concept There is no additional aesthetics needed. Dis-/Advantages and Limitations The main disadvantage in this concept is its extremely rough representation of the query result. This concept could only rarely give a first assertion about the processes. The concept is therefore only useful for an introduction into the next lower visualization-concepts regarding the visualization map. At the same time this rough detail level is intended to create an overview about the possible complexity of the query result.
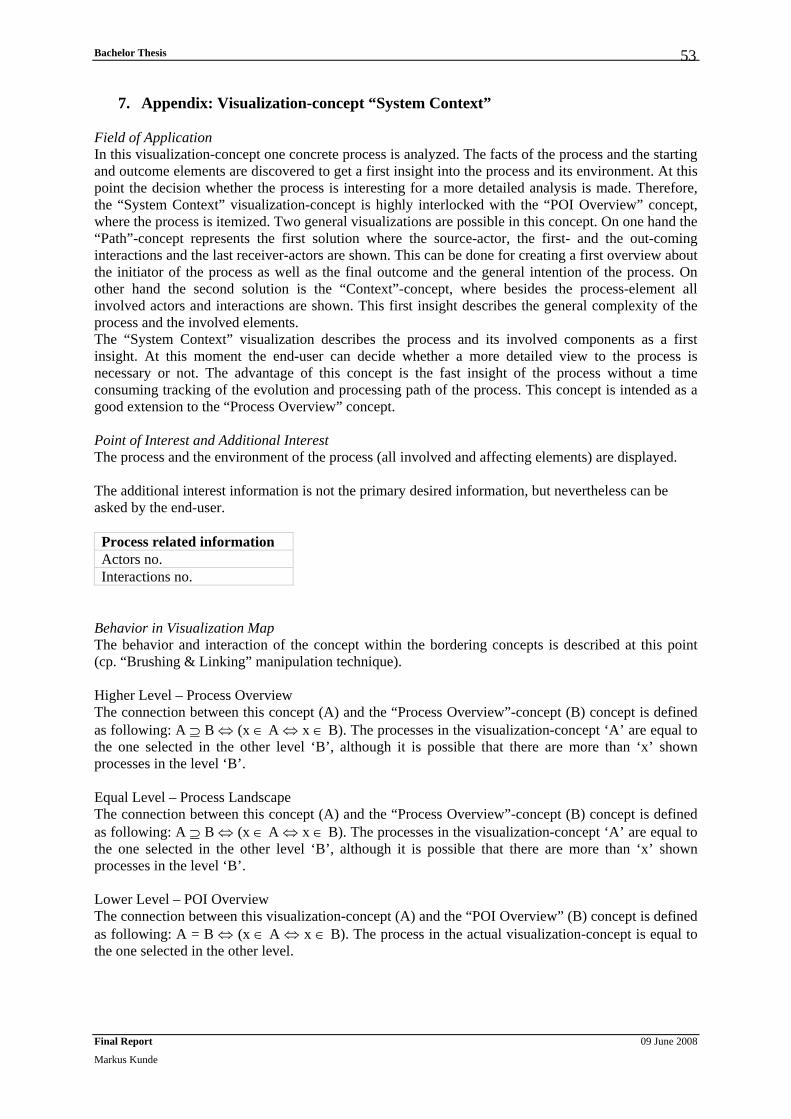
Bachelor Thesis
Final Report 09 June 2008
Markus Kunde
53
7. Appendix: Visualization-concept “System Context” Field of Application In this visualization-concept one concrete process is analyzed. The facts of the process and the starting and outcome elements are discovered to get a first insight into the process and its environment. At this point the decision whether the process is interesting for a more detailed analysis is made. Therefore, the “System Context” visualization-concept is highly interlocked with the “POI Overview” concept, where the process is itemized. Two general visualizations are possible in this concept. On one hand the “Path”-concept represents the first solution where the source-actor, the first- and the out-coming interactions and the last receiver-actors are shown. This can be done for creating a first overview about the initiator of the process as well as the final outcome and the general intention of the process. On other hand the second solution is the “Context”-concept, where besides the process-element all involved actors and interactions are shown. This first insight describes the general complexity of the process and the involved elements. The “System Context” visualization describes the process and its involved components as a first insight. At this moment the end-user can decide whether a more detailed view to the process is necessary or not. The advantage of this concept is the fast insight of the process without a time consuming tracking of the evolution and processing path of the process. This concept is intended as a good extension to the “Process Overview” concept. Point of Interest and Additional Interest The process and the environment of the process (all involved and affecting elements) are displayed. The additional interest information is not the primary desired information, but nevertheless can be asked by the end-user. Process related information Actors no. Interactions no.
Behavior in Visualization Map The behavior and interaction of the concept within the bordering concepts is described at this point (cp. “Brushing & Linking” manipulation technique). Higher Level – Process Overview The connection between this concept (A) and the “Process Overview”-concept (B) concept is defined as following: A ⊇ B ⇔ (x ∈ A ⇔ x ∈ B). The processes in the visualization-concept ‘A’ are equal to the one selected in the other level ‘B’, although it is possible that there are more than ‘x’ shown processes in the level ‘B’. Equal Level – Process Landscape The connection between this concept (A) and the “Process Overview”-concept (B) concept is defined as following: A ⊇ B ⇔ (x ∈ A ⇔ x ∈ B). The processes in the visualization-concept ‘A’ are equal to the one selected in the other level ‘B’, although it is possible that there are more than ‘x’ shown processes in the level ‘B’. Lower Level – POI Overview The connection between this visualization-concept (A) and the “POI Overview” (B) concept is defined as following: A = B ⇔ (x ∈ A ⇔ x ∈ B). The process in the actual visualization-concept is equal to the one selected in the other level.

Bachelor Thesis
Final Report 09 June 2008
Markus Kunde
54
Concrete Mental Map/ Metaphor The concrete representation of this visualization-concept is similar to the build-up of the “Fish-eye” view, where the focus to one element is in front of the user and the bordering elements are only shown at the sides for having context-information. Example Sketch
Actors#: 5Interactions#: 13ID: 4327Actor-Java
GUI
GNUPlot
Above: Path concept. The sketch displays the initial actor and the end actors in a workflow. The interaction “4327” can be stretched just as the actors (see “Actor Detail” and “Interaction Detail” concepts).
Actors#: 5Interactions#: 13
ID: 4327
Nast2D
ParVar
Actor-Java
GUI
GNUPlot
ID: n
ID: m
ID: o
ID: p
Above: Context concept. The sketch displays on the left all involved actors and on the right all interactions involved in the process. Raw Data The raw data consists of the un-interpreted result of the query to the Provenance store(s). The output of the Client Side Library is defined via XML-scheme (currently: version 25). Path concept Data Table and Transformation The data table consists of all relevant information of the processes. It is build up as follows: Data Table element Type Description ActorAddress Address One actor in the process. CollectionOfStates Collection (interactionKey,
viewType[S|R], documentationStyle, content)
This collection represents all actor-state related information. The states of each actor can be extracted.

Bachelor Thesis
Final Report 09 June 2008
Markus Kunde
55
Data Table element Type Description InteractionKey InteractionKey The interactionKey represents the global
unique identifier of an interaction. CollectionOfInteractionPAssertion
Collection (InteractionPAssertion, viewType[S|R])
This collection represents all interaction related information. All p-assertions regarding interactions are stored
Data Table element Type Description InteractionKey InteractionKey The interactionKey represents the global
unique identifier of an interaction. CollectionOfRelationshipPAssertion
Collection (RelationshipPAssertion)
This collection represents all relationships related to an interaction. All p-assertions regarding relationships are stored
Data Table element Type Description InteractionKey InteractionKey The interactionKey represents the global
unique identifier of an interaction. CollectionOfrelatedInteractions
Collection (InteractionKey, relationName)
This collection represents an effective description of the connections of one interaction to other interactions.
The general algorithm for filling the relations is to traverse the complete raw data for filtering the above elements. These relations can be used for drawing a graph with any layout algorithm. During the traverse of the raw data, the data about all information is collected. Visual Structure and Mapping The visual structure displays the process as a central component in the middle of end-users view. The graph can be drawn from left to right or from top to bottom. The process is placed in the middle of the screen and is sized 300% bigger than the other elements. Inside the process element the most important additional information take place (Actors#; Interactions#). On the left (top) side, the initial actor and the initial interaction are displayed in connection with the process element. On the right (bottom) side, all final actors are displayed. They are connected to the process element in a vertical (horizontal) hierarchical way. In general the whole sketch shows a simple directed acyclic graph. Layout Algorithm The general approach for drawing the graph is to create a hierarchy in the graph representation. The dynamical hierarchical graph drawing described in (Kaufmann, Wagner, 2001, p. 237) is a good approach. The result of the hierarchical layout algorithm is shown in the example sketch above. View and Transformation The view consists of the central process-element. The additional interest information is drawn. On the left side (or on top; depends on graph drawing direction) the initial actor and the initial interaction are shown. On the right side (or at bottom; depends on graph drawing direction) the ending actors are shown. All elements (except “process” element) can be manipulated regarding the visualization concepts “Actor Detail” and “Interaction Detail”. The transformation of the concrete view follows the following manipulation techniques (in combination with the system-wide manipulation techniques):

Bachelor Thesis
Final Report 09 June 2008
Markus Kunde
56
Technique Description Magic Lenses The Magic Lenses technique increases the detail of one element. In
general, a window (popup) appears in the foreground and displays additional information. The following content will displayed: Process:
• Intimation of the process chain (involved actors and involved interactions similar to the “Combined Flow Chart” concept)
Overview plus Detail This technique increases the elements in the view. There are two elements affected by this technique: Actor: See “Actor Detail” visualization concept Interaction: See “Interaction Detail” visualization concept
Connection to Context-concept Both “system-context” concepts describe the equal process in a different view; switching between both concepts is simple and can be done via request of the end-user.
Aesthetics of Concept In addition to the general aesthetics concepts the view has to take care of the independent resolution (space) of the concrete canvas. Dis-/Advantages and Limitations The advantage of the concept displays a first overview about the selected process and presents general information about the workflow. Additionally, the initial actor with the initial interaction and the final actors are displayed. The main disadvantage is the non-showing of dependency-information of the interactions. The concept is therefore intended as an extension to the “Process Overview” concept, showing additional information to each process. Context concept Data Table and Transformation The data table consists of all relevant information of the processes. It is build up as follows: Data Table element Type Description ActorAddress Address One actor in the process. CollectionOfStates Collection (interactionKey,
viewType[S|R], documentationStyle, content)
This collection represents all actor-state related information. The states of each actor can be extracted.
Data Table element Type Description InteractionKey InteractionKey The interactionKey represents the global
unique identifier of an interaction. CollectionOfInteractionPAssertion
Collection (InteractionPAssertion, viewType[S|R])
This collection represents all interaction related information. All p-assertions regarding interactions are stored

Bachelor Thesis
Final Report 09 June 2008
Markus Kunde
57
Data Table element Type Description InteractionKey InteractionKey The interactionKey represents the global
unique identifier of an interaction. CollectionOfRelationshipPAssertion
Collection (RelationshipPAssertion)
This collection represents all relationships related to an interaction. All p-assertions regarding relationships are stored
Data Table element Type Description InteractionKey InteractionKey The interactionKey represents the global
unique identifier of an interaction. CollectionOfrelatedInteractions
Collection (InteractionKey, relationName)
This collection represents an effective description of the connections of one interaction to other interactions.
The general algorithm for filling the relations is to traverse the complete raw data for filtering the above elements. These relations can be used for drawing a graph with any layout algorithm. During the traverse of the raw data, the data about all information is collected. Visual Structure and Mapping The visual structure displays the process as a central component in the middle of end-users view. The graph can be drawn from left to right or from top to bottom. The process is placed in the middle of the screen and is sized 300% bigger than the other elements. Inside the process element the most important additional information take place (Actors#; Interactions#). On the left (top) side, all involved actors are displayed in connection with the process element. On the right (bottom) side, all involved interactions are displayed. They are connected to the process element in a vertical (horizontal) hierarchical way. In general the whole sketch shows a simple directed acyclic graph in a layered structure. Layout Algorithm The general approach for drawing the graph is to create a hierarchy in the graph representation. The dynamical hierarchical graph drawing described in (Kaufmann, Wagner, 2001, p. 237) is a good approach. The result of the hierarchical layout algorithm is shown in the example sketch above. View and Transformation The view consists of the central process-element. The additional interest information is drawn. On the left side (or on top; depends on graph drawing direction) all involved actors are displayed. On the right side (or at bottom; depends on graph drawing direction) all involved interactions are displayed. All elements (except “process” element) can be manipulated regarding the visualization concepts “Actor Detail” and “Interaction Detail”. The transformation of the concrete view follows the following manipulation techniques (in combination with the system-wide manipulation techniques):

Bachelor Thesis
Final Report 09 June 2008
Markus Kunde
58
Technique Description Overview plus Detail This technique increases the elements in the view. There are two
elements affected by this technique: Actor: See “Actor Detail” visualization concept Interaction: See “Interaction Detail” visualization concept
Connection to Path-concept Both “system-context” concepts describe the equal process in a different view; switching between both concepts is simple and can be done via request of the end-user.
Aesthetics of Concept In addition to the general aesthetics concepts the view has to take care of the independent resolution (space) of the concrete canvas. Dis-/Advantages and Limitations The advantage of the concept displays a first overview about the selected process and presents general information about the workflow. Additionally, all involved actors and all involved interactions are displayed. The main disadvantage is the non-showing of dependency-information of the interactions. The concept is therefore intended as an extension to the “Process Overview” concept, showing additional information to each process.

Bachelor Thesis
Final Report 09 June 2008
Markus Kunde
59
8. Appendix: Visualization-concept “Combined Flow Chart” Field of Application In this visualization-concept one process is shown for a first overview. At this point the end-user has chosen exact one process for evaluation in detail. This concept represents the first step into the deeper analysis of a process. In the “Combined Flow Chart” concept actors and the interactions between them are displayed. The intention of the concept is representing all involved actors with their interactions to other actors. The structure of the process is outlined. Point of Interest and Additional Interest Actors of a process and their interactions to each other are displayed. Behavior in Visualization Map Higher Level – Process Landscape & System Context The connection between this concept (A) and the “Process Landscape” concept (B) concept is defined as following: A ⊇ B ⇔ (x ∈ A ⇔ x ∈ B). The process in the visualization-concept ‘A’ is equal to the one selected in the other level ‘B’, although it is possible that there are more than ‘x’ shown processes in the level ‘B’. The connection between this concept (A) and the “System Context” concept (B) is defined as following: A = B ⇔ (x ∈ A ⇔ x ∈ B). The process in the visualization-concept ‘A’ is equal to the one selected in the other level ‘B’. Equal Level – Process Aerial & Interaction Stretch The concept represents a connection of both concepts of the same level. The connection between this concept (A) and other concepts on the same level (B) concept is defined as following: A = B ⇔ (x ∈ A ⇔ x ∈ B). The process in the visualization-concept ‘A’ is equal to the one selected in the other level ‘B’. Lower Level – POI Detail In the lower level each element is considered in a single view. Therefore the two element-types of this concept have a direct connection to the “Actor Detail” or “Interaction Detail” concept. Concrete Mental Map/ Metaphor The concrete representation of this visualization-concept is the flow chart diagram. The involved actors are shown in a chain with their interactions to each other (hierarchical directed structure). Example Sketch
Action-Java ParVar Nast2D
GNUPlot
GUI
ID: 4327
ID: 7873
ID: 3930
ID: 3368
ID: 1778
ID: 1266
ID: 0888
ID: 9474
ID: 9261
ID: 7856
ID: 5207
ID: 5791
ID: 5552

Bachelor Thesis
Final Report 09 June 2008
Markus Kunde
60
Raw Data The raw data consists of the un-interpreted result of the query to the Provenance store(s). The output of the Client Side Library is defined via XML-scheme (currently: version 25). Data Table and Transformation The data table consists of all relevant information of the processes. It is build up as follows: Data Table element Type Description ActorAddress Address One actor in the process. CollectionOfStates Collection (interactionKey,
viewType[S|R], documentationStyle, content)
This collection represents all actor-state related information. The states of each actor can be extracted.
Data Table element Type Description InteractionKey InteractionKey The interactionKey represents the global
unique identifier of an interaction. CollectionOfInteractionPAssertion
Collection (InteractionPAssertion, viewType[S|R])
This collection represents all interaction related information. All p-assertions regarding interactions are stored
Data Table element Type Description InteractionKey InteractionKey The interactionKey represents the global
unique identifier of an interaction. CollectionOfRelationshipPAssertion
Collection (RelationshipPAssertion)
This collection represents all relationships related to an interaction. All p-assertions regarding relationships are stored
Data Table element Type Description InteractionKey InteractionKey The interactionKey represents the global
unique identifier of an interaction. CollectionOfrelatedInteractions
Collection (InteractionKey, relationName)
This collection represents an effective description of the connections of one interaction to other interactions.
The general algorithm for filling the relations is to traverse the complete raw data for filtering the above elements. These relations can be used for drawing a graph with any layout algorithm. During the traverse of the raw data, the data about all information is collected. Visual Structure and Mapping The visual structure draws the initial actor on the left side (or on top, depending on drawing direction of the layout algorithm). Every direct connection with other actors in combination with the involved interactions is drawn one hierarchical layer beneath. This step is repeated until all involved actors and interactions in all connections to each other are drawn. Layout Algorithm The general approach for drawing the graph is to create a hierarchy in the graph representation. The dynamical hierarchical graph drawing described in (Kaufmann, Wagner, 2001, p. 237) is a good approach. The result of the hierarchical layout algorithm is shown in the example sketch above.

Bachelor Thesis
Final Report 09 June 2008
Markus Kunde
61
View and Transformation The view consists of all involved actors and interactions in a process in connection with each other. The transformation of the concrete view follows the following manipulation techniques (in combination with the system-wide manipulation techniques): Technique Description Overview plus Detail This technique increases the elements in the view. There are two
elements affected by this technique: Actor: See “Actor Detail” visualization concept Interaction: See “Interaction Detail” visualization concept
Aesthetics of Concept The view should support the following criteria of aesthetics (supplement or unlike the ones defined in the general visualization-concept):
• Edges: Orthogonal drawing Dis-/Advantages and Limitations The concept gives an overview about the structure of a process. Involved actors and their interactions to each other are displayed. The main disadvantage is that no relationships between the interactions or the interaction-chain are displayed.

Bachelor Thesis
Final Report 09 June 2008
Markus Kunde
62
9. Appendix: Visualization-concept “Process Aerial” Field of Application In this visualization-concept, one process is explored. The process itself is important within its different actor-states and involved interactions with their relationship together. This concept represents a central component of the visualization-concepts as several combinations of focused elements can be displayed. Point of Interest and Additional Interest The involved actors and their states in one process and the interactions with its relationships are important. Behavior in Visualization Map Higher Level – Process Landscape & System Context The connection between this concept (A) and the “Process Landscape” concept (B) concept is defined as following: A ⊇ B ⇔ (x ∈ A ⇔ x ∈ B). The process in the visualization-concept ‘A’ is equal to the one selected in the other level ‘B’, although it is possible that there are more than ‘x’ shown processes in the level ‘B’. The connection between this concept (A) and the “System Context” concept (B) is defined as following: A = B ⇔ (x ∈ A ⇔ x ∈ B). The process in the visualization-concept ‘A’ is equal to the one selected in the other level ‘B’. Equal Level –Interaction Stretch & Combined Flow Chart The connection between this concept (A) and other concepts on the same level (B) concept is defined as following: A = B ⇔ (x ∈ A ⇔ x ∈ B). The process in the visualization-concept ‘A’ is equal to the one selected in the other level ‘B’. Lower Level – POI Detail In the lower level each element is considered in a single view. Therefore the two element-types of this concept have a direct connection to the “Actor Detail” or “Interaction Detail” concept. Concrete Mental Map/ Metaphor The concrete representation of this visualization-concept is similar to the process flow chart, but it has an extended character. An actor can be expanded in an additional dimension into its states. In this dimension the interactions between the actors can be displayed too. In a second step these interactions can be brought into a relationship with each other. The extended structure is similar to a process sequence diagram where interactions of a sequence can displayed in a dependency context.

Bachelor Thesis
Final Report 09 June 2008
Markus Kunde
63
Example Sketch
Action-Java ParVar Nast2D GNUPlot
GUI"no state"
Nast2D"no state"
GUI
ID:5791
Nast2D"no state"
GNUPlot"no state"
ID:9261
ID:3930
Nast2D"no state"
ParVar"no state"
S1
S1
S2
S3
S4
S1
S2
S3
S4
S1
S2
S3
S4
S1
S2
S3
S4
Interactions partly shown
This example represents the enlargement of a process. The states of each actor and exemplary interactions are displayed.
Action-Java ParVar Nast2D GNUPlot
GUI"no state"
Nast2D"no state"
GUI
ID:5791
Nast2D"no state"
GNUPlot"no state"
ID:9261
ID:3930
Nast2D"no state"
ParVar"no state"
S1
S1
S2
S3
S4
S1
S2
S3
S4
S1
S2
S3
S4
S1
S2
S3
S4
Interactions partly shown
causedBy
causedBy
This sketch represents the same content as in the sketch above, but in this case the relationship of interactions is in the focus of the user.

Bachelor Thesis
Final Report 09 June 2008
Markus Kunde
64
Raw Data The raw data consists of the un-interpreted result of the query to the Provenance store(s). The output of the Client Side Library is defined via XML-scheme (currently: version 25). Data Table and Transformation The data table consists of all relevant information of the processes. It is build up as follows: Data Table element Type Description ActorAddress Address One actor in the process. CollectionOfStates Collection (interactionKey,
viewType[S|R], documentationStyle, content)
This collection represents all actor-state related information. The states of each actor can be extracted.
Data Table element Type Description InteractionKey InteractionKey The interactionKey represents the global
unique identifier of an interaction. CollectionOfInteractionPAssertion
Collection (InteractionPAssertion, viewType[S|R])
This collection represents all interaction related information. All p-assertions regarding interactions are stored
Data Table element Type Description InteractionKey InteractionKey The interactionKey represents the global
unique identifier of an interaction. CollectionOfRelationshipPAssertion
Collection (RelationshipPAssertion)
This collection represents all relationships related to an interaction. All p-assertions regarding relationships are stored
Data Table element Type Description InteractionKey InteractionKey The interactionKey represents the global
unique identifier of an interaction. CollectionOfrelatedInteractions
Collection (InteractionKey, relationName)
This collection represents an effective description of the connections of one interaction to other interactions.
The general algorithm for filling the relations is to traverse the complete raw data for filtering the above elements. These relations can be used for drawing a graph with any layout algorithm. During the traverse of the raw data, the data about all information is collected. Visual Structure and Mapping The visual structure shows the process (actors and its connections) on the top of the view in two dimensions. The vertical dimension is used for representing the actor states. Expanding each actor-state chain causes the creation of a new dimension. All occurred interactions between these actors (On the one side of the dimension arm the sender, on the other side the receivers view) are displayed. In a second step the relationship of the interactions can be displayed by drawing arrows representing these relationships. Additionally, in this step all actor-states are made achromatic regarding the readability of the graph. The relationships of the interactions are displayed with arrows. These arrows (RGB-color: “102; 0; 255”) includes the relation-type definition.

Bachelor Thesis
Final Report 09 June 2008
Markus Kunde
65
Layout Algorithm The general approach for drawing the process on top of the graph is to create a hierarchy in the graph representation. The dynamical hierarchical graph drawing described in (Kaufmann, Wagner, 2001, p. 237) is a good approach. The result of the hierarchical layout algorithm is shown on top in the above example sketch. The further dimensions do not underlie a special layout algorithm because of the fact that this represents a graticule (coordinate system) with free drawn points. No edge comes into conflict with another and therefore a free painting can be used. View and Transformation The view consists of all element groups, the actor with their states and the interactions of these actors with the relationship of these interactions. Besides the techniques mentioned in the general visualization-concept, the transformation of the concrete view follow the following manipulation techniques: Technique Description Overview plus Detail This technique increases the elements in the view. There are two elements
affected by this technique: Actor:
• See “Actor Detail” visualization concept Interaction:
• See “Interaction Detail” visualization concept Aesthetics of Concept The view should support the following criteria of aesthetics (supplement or unlike the ones defined in the general visualization-concept):
• Edges: Orthogonal drawing Dis-/Advantages and Limitations There are many advantages in this concept. The main advantage is the combination of different point of interest of the viewer in the same view. The main problem of this representation type is the complexity. A conservative usage of exploration and manipulation methods is recommended to the end-user. A static representation of this concept is barely possible.

Bachelor Thesis
Final Report 09 June 2008
Markus Kunde
66
10. Appendix: Visualization-concept “Interaction Stretch” Field of Application In this visualization-concept, one process is shown for a first overview about the interactions occurred. The relationship of the interactions is shown. At this point, the end-user has chosen exact one process for evaluation in detail. Point of Interest and Additional Interest The occurring interactions in one process as well as their cause-and-effect chain are important. Behavior in Visualization Map The behavior and interaction of the concept within the bordering concepts will be described at this point (cp. “Brushing & Linking” manipulation technique). Higher Level – Process Landscape & System Context The connection between this concept (A) and the “Process Landscape” concept (B) concept is defined as following: A ⊇ B ⇔ (x ∈ A ⇔ x ∈ B). The process in the visualization-concept ‘A’ is equal to the one selected in the other level ‘B’, although it is possible that there are more than ‘x’ shown processes in the level ‘B’. The connection between this concept (A) and the “System Context” concept (B) is defined as following: A = B ⇔ (x ∈ A ⇔ x ∈ B). The process in the visualization-concept ‘A’ is equal to the one selected in the other level ‘B’. Equal Level – Process Aerial & Combined Flow Chart The connection between this concept (A) and other concepts on the same level (B) concept is defined as following: A = B ⇔ (x ∈ A ⇔ x ∈ B). The process in the visualization-concept ‘A’ is equal to the one selected in the other level ‘B’. Lower Level – POI Detail In the lower level each element is considered in a single view. Therefore the element-type of this concept have a direct connection to the “Interaction Detail” concept. Concrete Mental Map/ Metaphor The concrete representation of this visualization-concept is the flow chart diagram. The occurring interactions are shown in a chain (hierarchical directed structure). Example Sketch
ID: 7873
ID: 4327
ID: 1778
ID: 9474
ID: 5207
ID: 3930
ID: 5791
ID: 1266
ID: 9261
ID: 3368
ID: 5552
ID: 7856
ID: 0888
Raw Data The raw data consists of the un-interpreted result of the query to the Provenance store(s). The output of the Client Side Library is defined via XML-scheme (currently: version 25).

Bachelor Thesis
Final Report 09 June 2008
Markus Kunde
67
Data Table and Transformation The data table consists of all relevant information of the processes. It is build up as follows: Data Table element Type Description ActorAddress Address One actor in the process. CollectionOfStates Collection (interactionKey,
viewType[S|R], documentationStyle, content)
This collection represents all actor-state related information. The states of each actor can be extracted.
Data Table element Type Description InteractionKey InteractionKey The interactionKey represents the global
unique identifier of an interaction. CollectionOfInteractionPAssertion
Collection (InteractionPAssertion, viewType[S|R])
This collection represents all interaction related information. All p-assertions regarding interactions are stored
Data Table element Type Description InteractionKey InteractionKey The interactionKey represents the global
unique identifier of an interaction. CollectionOfRelationshipPAssertion
Collection (RelationshipPAssertion)
This collection represents all relationships related to an interaction. All p-assertions regarding relationships are stored
Data Table element Type Description InteractionKey InteractionKey The interactionKey represents the global
unique identifier of an interaction. CollectionOfrelatedInteractions
Collection (InteractionKey, relationName)
This collection represents an effective description of the connections of one interaction to other interactions.
The general algorithm for filling the relations is to traverse the complete raw data for filtering the above elements. These relations can be used for drawing a graph with any layout algorithm. During the traverse of the raw data, the data about all information is collected. Visual Structure and Mapping The visual structure draws the initial interaction on the left side (or on top, depending on drawing direction of the layout algorithm). Every direct connection within other interactions is drawn one hierarchical layer beneath. This step is repeated until all interactions within all connections to each other are drawn. Every composed interaction can hereby be expanded to senders and receivers view regarding “Interaction Detail” concept. Layout Algorithm The general approach for drawing the graph is to create a hierarchy in the graph representation. The dynamical hierarchical graph drawing described in (Kaufmann, Wagner, 2001, p. 237) is a good approach. The result of the hierarchical layout algorithm is shown in the example sketch above.

Bachelor Thesis
Final Report 09 June 2008
Markus Kunde
68
View and Transformation The view consists of all interactions in a process in connection with each other. The transformation of the concrete view follows the following manipulation techniques (in combination with the system-wide manipulation techniques): Technique Description Mouse Over This technique increases the detail of the arrows. In general, a
window (popup) appears in the foreground and displays additional information. The following content will displayed: Arrows:
• Relationship type Overview plus Detail This technique increases the elements in the view. There is one
element affected by this technique: Interaction: See “Interaction Detail” visualization concept
Aesthetics of Concept The view should support the following criteria of aesthetics (supplement or unlike the ones defined in the general visualization-concept):
• Edges: Orthogonal drawing Dis-/Advantages and Limitations This concept represents an alternative way for visualizing a process. The involved interactions with its relationships are in the foreground. The flow in a workflow can be audited very good. The main disadvantage is the non-displaying of actors. Interactions belonging together to specific actors are not displayed side by side.

Bachelor Thesis
Final Report 09 June 2008
Markus Kunde
69
11. Appendix: Visualization-concept “Actor Detail” Field of Application In this visualization-concept exact one actor is displayed on a high detail level. All states belonging to an actor are displayed. Information about each state is given too. At this point, the end-user has a good understanding of the process and wants to get into detail with the behavior of the process. Point of Interest and Additional Interest The actor and its states (documentationStyle; content) are in context of users’ focus. Behavior in Visualization Map This concept is connected with other visualization-concepts in a special way. It is not intended as a stand-alone concept, but it represents a manipulation technique in other concepts. As in other concepts an actor is displayed, this actor can be extended into its states and state-information. The view of the responsible concept is drawn achromatic for controlling the focus of the end-user to the “Actor Detail” concept. Concrete Mental Map/ Metaphor The concrete representation of this concept is a vertical alignment of the actor and its states. Each state is expanded to state-information (documentationStyle; content). Example Sketch
documentationStyle
Content (depends on specific application)
documentationStyle
Content (depends on specific application)
documentationStyle
Content (depends on specific application)
documentationStyle
Content (depends on specific application)
Composed Actor
S1
S2
S3
S4
Raw Data The raw data consists of the un-interpreted result of the query to the Provenance store(s). The output of the Client Side Library is defined via XML-scheme (currently: version 25).

Bachelor Thesis
Final Report 09 June 2008
Markus Kunde
70
Data Table and Transformation The data table consists of all relevant information of the processes. It is build up as follows: Data Table element Type Description ActorAddress Address One actor in the process. CollectionOfStates Collection (interactionKey,
viewType[S|R], documentationStyle, content)
This collection represents all actor-state related information. The states of each actor can be extracted.
Data Table element Type Description InteractionKey InteractionKey The interactionKey represents the global
unique identifier of an interaction. CollectionOfInteractionPAssertion
Collection (InteractionPAssertion, viewType[S|R])
This collection represents all interaction related information. All p-assertions regarding interactions are stored
Data Table element Type Description InteractionKey InteractionKey The interactionKey represents the global
unique identifier of an interaction. CollectionOfRelationshipPAssertion
Collection (RelationshipPAssertion)
This collection represents all relationships related to an interaction. All p-assertions regarding relationships are stored
Data Table element Type Description InteractionKey InteractionKey The interactionKey represents the global
unique identifier of an interaction. CollectionOfrelatedInteractions
Collection (InteractionKey, relationName)
This collection represents an effective description of the connections of one interaction to other interactions.
The general algorithm for filling the relations is to traverse the complete raw data for filtering the above elements. These relations can be used for drawing a graph with any layout algorithm. During the traverse of the raw data, the data about all information is collected. Visual Structure and Mapping The visual structure is a vertical alignment. The newest state is located closed to the actor while the oldest one is located far away. Layout Algorithm The general approach for drawing the graph is to create an independent layer in the graph representation. The dynamical hierarchical graph drawing described in (Kaufmann, Wagner, 2001, p. 237) is a good approach. The result of the hierarchical layout algorithm is shown in the example sketch above.

Bachelor Thesis
Final Report 09 June 2008
Markus Kunde
71
View and Transformation The view consists of all states of an actor in connection with each other. The transformation of the concrete view follows the following manipulation techniques (in combination with the system-wide manipulation techniques): Technique Description Mouse Over This technique increases the detail of a state. In general, a textbox
appears at the right side and displays additional information (see grey box in sketch). The following content will displayed: State:
• documentationStyle • Content
Aesthetics of Concept The view should support the following criteria of aesthetics (supplement or unlike the ones defined in the general visualization-concept):
• Edges: No Bend drawing Dis-/Advantages and Limitations This concept represents a very detailed but limited scope of Provenance Data. There are two disadvantages. In the case the actor has many states, an identification of a special state is time-consuming. The second disadvantage is the abstract presentation of the “Content”-field of Provenance data. In a concrete application, a better visualization technique must be identified.

Bachelor Thesis
Final Report 09 June 2008
Markus Kunde
72
12. Appendix: Visualization-concept “Interaction Detail” Field of Application In this visualization-concept exact one interaction is displayed on a high detail level. Both views belonging to this interaction are displayed. Information about each P-Assertion (more than one InteractionP-Assertion about an interaction is possible) is given too. At this point, the end-user has a good understanding of the process and wants to get into detail with the behavior of the process. Point of Interest and Additional Interest The interaction and its views (documentationStyle; content) are in context of users’ focus. Behavior in Visualization Map This concept is connected with other visualization-concepts in a special way. It is not intended as a stand-alone concept, but it represents a manipulation technique in other concepts. As in other concepts an interaction is displayed, this interaction can be extended into both views and their information. The view of the responsible concept is drawn achromatic for controlling the focus of the end-user to the “Interaction Detail” concept. Concrete Mental Map/ Metaphor The concrete representation of this concept is the abstract information expanded into both views. Each view represents the content of the InteractionP-Assertions about this interaction (documentationStyle; content). Example Sketch
ID:3930
View of this connected actor:
localPAssertionIDdocumentationStyle
Content (depends on specific application)
View of this connected actor:
localPAssertionIDdocumentationStyle
Content (depends on specific application)
Raw Data The raw data consists of the un-interpreted result of the query to the Provenance store(s). The output of the Client Side Library is defined via XML-scheme (currently: version 25). Data Table and Transformation The data table consists of all relevant information of the processes. It is build up as follows:

Bachelor Thesis
Final Report 09 June 2008
Markus Kunde
73
Data Table element Type Description ActorAddress Address One actor in the process. CollectionOfStates Collection (interactionKey,
viewType[S|R], documentationStyle, content)
This collection represents all actor-state related information. The states of each actor can be extracted.
Data Table element Type Description InteractionKey InteractionKey The interactionKey represents the global
unique identifier of an interaction. CollectionOfInteractionPAssertion
Collection (InteractionPAssertion, viewType[S|R])
This collection represents all interaction related information. All p-assertions regarding interactions are stored
Data Table element Type Description InteractionKey InteractionKey The interactionKey represents the global
unique identifier of an interaction. CollectionOfRelationshipPAssertion
Collection (RelationshipPAssertion)
This collection represents all relationships related to an interaction. All p-assertions regarding relationships are stored
Data Table element Type Description InteractionKey InteractionKey The interactionKey represents the global
unique identifier of an interaction. CollectionOfrelatedInteractions
Collection (InteractionKey, relationName)
This collection represents an effective description of the connections of one interaction to other interactions.
The general algorithm for filling the relations is to traverse the complete raw data for filtering the above elements. These relations can be used for drawing a graph with any layout algorithm. During the traverse of the raw data, the data about all information is collected. Visual Structure and Mapping The visual structure consists of three interaction elements located in a triangle over the screen. On the same side as the asserting actor the corresponding view is located. Layout Algorithm There is no need for a graph layout algorithm as there is no graph displayed. All three elements are distributed over the screen in three equal areas. View and Transformation The view consists of one interaction with its both views. A transformation onto the view is not necessary. Aesthetics of Concept No assertion needed. Dis-/Advantages and Limitations This concept represents a very detailed but limited scope of Provenance Data. There are two disadvantages. In the case the view of an interaction consists of several InteractionP-Assertion, the displaying of all information must be fulfilled with a list in the specific element. The aesthetic may disease. The second disadvantage is the abstract presentation of the “Content”-field of Provenance data. In a concrete application, a better visualization technique must be identified.

Bachelor Thesis
Final Report 09 June 2008
Markus Kunde
74
13. Appendix: Visualization-concept “Spreadsheet” Field of Application The “Spreadsheet” concept is a special case of a visualization concept regarding the visualization map. There are no limitations in the detail level or the scope size. All data collections can be displayed in a spreadsheet representation. The intention of the concept is the flexibility of a spreadsheet (e.g. filtering of data, sorting, etc.) in combination with an alternative representation technique with respect to several user requirements. Especial in case of a failure in the Provenance data (technical failure in Provenance or a failure in the origin IT-system) a detailed analysis should be done. A spreadsheet representation gives the end-user the opportunity of having all data related to his query in one visualization technique. Among other reasons, some end-users prefer this visualization technique (cp. user requirements). Point of Interest and Additional Interest All Provenance related data. Behavior in Visualization Map The spreadsheet concept is separated from the division into detail levels in the visualization map. Each source data can be displayed in this visualization possibility. The connection between this concept (A) and the data table (B) is defined as following: A = B ⇔ (x ∈ A ⇔ x ∈ B). The data in the visualization-concept ‘A’ is equal to the data in the data table ‘B’. Concrete Mental Map/ Metaphor This concept is similar to any spreadsheet representation. The data basis for this visualization technique is the data table. Example Sketch No sketch. Referring to standard spreadsheet implementations. Raw Data The raw data consists of the un-interpreted result of the query to the Provenance store(s). The output of the Client Side Library is defined via XML-scheme (currently: version 25). Data Table and Transformation The data table consists of all relevant information of the processes. It is build up as follows: Data Table element Type Description ActorAddress Address One actor in the process. CollectionOfStates Collection (interactionKey,
viewType[S|R], documentationStyle, content)
This collection represents all actor-state related information. The states of each actor can be extracted.
Data Table element Type Description InteractionKey InteractionKey The interactionKey represents the global
unique identifier of an interaction. CollectionOfInteractionPAssertion
Collection (InteractionPAssertion, viewType[S|R])
This collection represents all interaction related information. All p-assertions regarding interactions are stored

Bachelor Thesis
Final Report 09 June 2008
Markus Kunde
75
Data Table element Type Description InteractionKey InteractionKey The interactionKey represents the global
unique identifier of an interaction. CollectionOfRelationshipPAssertion
Collection (RelationshipPAssertion)
This collection represents all relationships related to an interaction. All p-assertions regarding relationships are stored
Data Table element Type Description InteractionKey InteractionKey The interactionKey represents the global
unique identifier of an interaction. CollectionOfrelatedInteractions
Collection (InteractionKey, relationName)
This collection represents an effective description of the connections of one interaction to other interactions.
The general algorithm for filling the relations is to traverse the complete raw data for filtering the above elements. These relations can be used for drawing a graph with any layout algorithm. During the traverse of the raw data, the data about all information is collected. Visual Structure and Mapping The visual structure consists of a spreadsheet implementation. The records are defined through the definition of the data table. Each row can be the basis for sorting the data. The filtering of data is also possible. Layout Algorithm There is no need for a graph layout algorithm as there is no graph displayed. View and Transformation The view consists of a spreadsheet implementation. The transformation of the concrete view follows the following manipulation techniques (in combination with the system-wide manipulation techniques): Technique Description Sorting Each attribute (column) can be the basis for a sorting in an
ascending or descending sequence. Filtering A filtering method similar to regular expressions is used for
narrowing the data basis down. Fish-eye The data record in the focus is spread up in its attributes (composed
attributes are divided into its elements). These elements are displayed in a horizontal row.
Aesthetics of Concept No assertion needed. Dis-/Advantages and Limitations A spreadsheet represents a visualization possibility most users are trained with. Therefore fast results can be produced. The main disadvantage is the non-connection between two data records. A huge data basis is intractable.

Bachelor Thesis
Final Report 09 June 2008
Markus Kunde
76
14. Appendix: Visualization-concept “Compare/Difference” Field of Application The “Compare/Difference” concept is a special case of a visualization concept regarding the visualization map. There are no limitations in the detail level or the scope size. All data collections can be displayed in a comparing representation. The intention of the concept is the confrontation of data in combination with a graphical presentation of the differences. Especial in case of a failure in the Provenance data (technical failure in Provenance or a failure in the origin IT-system) a detailed analysis should be done. A comparison representation gives the end-user the opportunity of having data related to a process in one visualization technique with the possibility of comparison with reference data (Reference data has to be defined in the concrete application). Among other reasons, some end-users prefer this visualization technique (cp. user requirements) for validating their system. The idea of this visualization technique is borrowed by (Langreiter, 2008). Point of Interest and Additional Interest All Provenance related data. Behavior in Visualization Map The compare/difference concept is separated from the division into detail levels in the visualization map. Each source data can be displayed in this visualization possibility. The connection between this concept (A) and the data table (B) is defined as following: A = B ⇔ (x ∈ A ⇔ x ∈ B). The data in the visualization-concept ‘A’ is equal to the data in the data table ‘B’. The desired data has to be selected. Concrete Mental Map/ Metaphor This concept depends on confrontation of two participants. The differences are displayed in terms of color and a connection with a description of the type of this difference. Example Sketch
Action-Java ParVar Nast2D GUI GNUPlot
Action-Java ParVar Nast2D GUI GNUPlot
Diff
eren
ce
Diff
eren
ce
Calculator
The sketch above displays the comparison of a workflow with a reference workflow. As shown, there are differences in two actors and a third actor does not exist in the other process.

Bachelor Thesis
Final Report 09 June 2008
Markus Kunde
77
ID:4327
ID: 9474
ID:7873
ID:5207
ID:1778
ID:4327
ID: 7873
ID:9474
ID:5207
ID:1778
ID:3930
Diff
eren
ceWrong orderwrong order
In the sketch above two chains of interactions are compared. As shown, there are differences in one interaction while other interactions are in the wrong order. Another interaction is missing in the other process.
Action-Java S1 S2 S3 S4
Action-Java S1 S2 S3 S4
Diff
eren
ce
Diff
eren
ce
S5
In this sketch an actor with its states is compared. There are differences in this comparison. The state “S3” represents not the same content and the state “S5” does not exist in the reference actor. Raw Data The raw data consists of the un-interpreted result of the query to the Provenance store(s). The output of the Client Side Library is defined via XML-scheme (currently: version 25). Data Table and Transformation The data table consists of all relevant information of the processes. It is build up as follows: Data Table element Type Description ActorAddress Address One actor in the process. CollectionOfStates Collection (interactionKey,
viewType[S|R], documentationStyle, content)
This collection represents all actor-state related information. The states of each actor can be extracted.
Data Table element Type Description InteractionKey InteractionKey The interactionKey represents the global
unique identifier of an interaction. CollectionOfInteractionPAssertion
Collection (InteractionPAssertion, viewType[S|R])
This collection represents all interaction related information. All p-assertions regarding interactions are stored

Bachelor Thesis
Final Report 09 June 2008
Markus Kunde
78
Data Table element Type Description InteractionKey InteractionKey The interactionKey represents the global
unique identifier of an interaction. CollectionOfRelationshipPAssertion
Collection (RelationshipPAssertion)
This collection represents all relationships related to an interaction. All p-assertions regarding relationships are stored
Data Table element Type Description InteractionKey InteractionKey The interactionKey represents the global
unique identifier of an interaction. CollectionOfrelatedInteractions
Collection (InteractionKey, relationName)
This collection represents an effective description of the connections of one interaction to other interactions.
The general algorithm for filling the relations is to traverse the complete raw data for filtering the above elements. These relations can be used for drawing a graph with any layout algorithm. During the traverse of the raw data, the data about all information is collected. Visual Structure and Mapping The visual structure consists of two confronted collection of elements (on top and on bottom). The elements are compared in three ways. On one hand both partners are compared in their content. In case of diversity, the elements are displayed in color and a connection line describing the “difference” paradigm is drawn. On other hand concurrent partners that are not faced to each other are displayed in color and a connection line describing the “wrong order” paradigm is drawn. The third option describes the state that on the one side an element is given, but there is no congruent partner. In this case the element is displayed in color. Layout algorithm The general approach for drawing the graph is to create a hierarchy in the graph representation. The dynamical hierarchical graph drawing described in (Kaufmann, Wagner, 2001, p. 237) is a good approach. The result of the hierarchical layout algorithm is shown in the example sketch above. View and Transformation The view consists of all selected elements regarding the Provenance structure. Two or more elements are compared with this concept. The transformation of the concrete view follows the following manipulation techniques (in combination with the system-wide manipulation techniques): Technique Description Overview plus Detail This technique increases the elements in the view. There are two
elements affected by this technique: Actor:
• See “Actor Detail” visualization concept Interaction:
• See “Interaction Detail” visualization concept

Bachelor Thesis
Final Report 09 June 2008
Markus Kunde
79
Aesthetics of Concept The view should support the following criteria of aesthetics (supplement or unlike the ones defined in the general visualization-concept):
• Edges: no bend drawing • Nodes: One element source is exact one row
Dis-/Advantages and Limitations The advantages for this visualization concept are the simple and flexible build-up for a comparison mechanism. The main disadvantage is the non-displaying of any connections between the elements.

Bachelor Thesis
Final Report 09 June 2008
Markus Kunde
80
15. Appendix: Requirements Coverage Legend: Color Degree Description Green 1 – 2 The requirement is fulfilled. The differences between the Degree consist on the fact that a concept directly supports the
requirement or fulfills it as a side effect Yellow 3 – 4 The requirement can be fulfilled but not with a very good approach Red 5 – 6 The requirement is not fulfilled Grey - The requirement is disregarded or cannot be fulfilled (regarding weak points in Provenance architecture) Blue - No assertion possible at the moment
Non-Functional Requirements
Grade of success (in context of result visualization)
Annotation
TR-4-2 2 Depending on provenance server side TR-6-2 1 TR-6-3 2 TR-6-5-A 2 Scientific visualization TR-6-5-B 1 Scientific visualization & Spreadsheets TR-6-5-C 1 Depends on the level of the visualization map TR-6-6-A 2 TR-6-6-B 2 TR-6-6-C 2 TR-6-6-D 2 TR-7-1 (partly) 6 As an implemented prototype is not planned, an end-user documentation is not planned CR-4-4-A 1 Depending on the individual access rights (SSO) CR-4-4-B See CR-4-4-A CR-4-5 See CR-4-4-A CR-4-6 See CR-4-4-A CR-5-6 1 Depending on loose coupling of provenance store CR-5-7 1 VISS uses official Client Side Library DLR-internal-NF-1 No assertion possible at the moment DLR-internal-NF-2 No assertion possible at the moment DLR-internal-NF-3 No assertion possible at the moment DLR-internal-NF-4 No assertion possible at the moment DLR-internal-NF-5 No assertion possible at the moment DLR-internal-NF-6 1 DLR-internal-NF-7 No assertion possible at the moment DLR-internal-NF-8 1
User requirements Grade of success
(in context of result visualization)
Annotation
AR-1-1 4 A comparing mechanism is available, but “references” has to be implemented by the specific application AR-1-2 2 Covered with POI Overview & POI Section AR-1-3 6 knowledge engineering vs. information visualization AR-1-4 6 Feed a given process with new data is not planned yet. AR-1-5 1 Depends on Query; actual visualization-concepts are adequate AR-1-6 1 Depends on Query; actual visualization-concepts are adequate (actor view) AR-1-7 4 A comparing mechanism is available, but “references” has to be implemented by the specific application AR-1-8 1 Covered with POI Overview & POI Section AR-2-1 1 AR-2-2 6 The VISS is only an analysis system. This feature is not planned AR-2-3 2 Within the actors or interaction view it is possible AR-2-4 4 The access of users can be traced with the actors view. Showing unauthorized access depends on manual analysis AR-3-1 4 The following of a policy can only be showed by comparing the actual process with a reference process AR-3-2 2 Depends on the Query AR-3-3 5 The recorded provenance data do not have any timestamp or duration. E.g. Landscape visualization supports this AR-4-1 3 A comparing mechanism is available, but “references” has to be implemented by the specific application AR-4-2 2 The actors can be identified with the actors view. The whole process is traceable. AR-5-1 1 AR-5-2 2 The Process overview shows the execution of a process AR-5-3 4 A comparing mechanism is available, but “references” has to be implemented by the specific application AR-5-4 2 The process can be followed. The correctness has to be proven manually. AR-5-5 2 The process can be followed. The correctness has to be proven manually. AR-5-6 6 knowledge engineering vs. information visualization AR-5-7 1 All actual VCs support this AR-5-8 1 All actual VCs support this AR-5-9 1 All actual VCs support this AR-5-10 2 A summarized (spreadsheet, etc.) visualization is useable AR-5-11 5 Deriving the process will not be supported; Only information visualization tool. AR-5-12 1 Comparing processes is be done AR-5-13 5 knowledge engineering vs. information visualization AR-6-1 4 A comparing mechanism is available, but “references” has to be implemented by the specific application AR-6-2 4 A comparing mechanism is available, but “references” has to be implemented by the specific application AR-7-1 1 All actual VCs support this AR-7-2 1 All actual VCs support this TR-1-1-A-1 1 All actual VCs support this TR-1-1-A-2 1 All actual VCs support this TR-1-1-A-3 1 All actual VCs support this TR-1-1-A-4 1 If the provenance system records this, all actual VCs support this TR-1-1-B-1 1 If the provenance system records this, all actual VCs support this TR-1-1-B-2 1 All actual VCs support this

Bachelor Thesis
Final Report 09 June 2008
Markus Kunde
81
User requirements Grade of success (in context of result visualization)
Annotation
TR-1-1-B-3 1 All actual VCs support this TR-1-1-B-4 5 The VISS is only an analysis system. This feature is not planned, but can be done manually. TR-1-1-B-5 See CR-4-4-A TR-1-1-C-1 1 All actual VCs support this TR-1-1-C-2 6 All actual VCs support this. A timestamp or duration is not recorded TR-1-1-C-3 6 A timestamp or duration is not recorded TR-1-1-C-4 1 If the provenance system records this, all actual VCs support this TR-1-1-C-5 1 All actual VCs support this TR-1-1-C-6 2 This is only additional information. If the provenance system records this, all actual VCs support this TR-1-1-D-1 1 All actual VCs support this TR-1-1-D-2 6 A timestamp or duration is not recorded TR-1-1-D-3 5 This is the content-element (only additional information). It will be mentioned, but no content is shown (Specific application) TR-1-1-E-1 1 If the provenance system records this, all actual VCs support this TR-1-1-E-2 1 All actual VCs support this TR-1-1-E-3 6 A timestamp or duration is not recorded. Other quality metrics are not recorded as well TR-1-1-F-1 1 All actual VCs support this TR-1-1-F-2 1 All actual VCs support this TR-1-1-F-3 6 A timestamp or duration is not recorded. TR-1-1-F-4 2 This is only additional information. If the provenance system records this, all actual VCs support this TR-1-1-F-5 2 TR-1-1-G-1 6 A timestamp or duration is not recorded TR-1-1-G-2 2 This is only additional information. If the provenance system records this, all actual VCs support this TR-1-1-G-3 1 All actual VCs support this TR-1-1-H-1 2 If the provenance system records this, all actual VCs support this TR-1-1-H-2 1 All actual VCs support this TR-1-1-i-1 2 This is only additional information. If the provenance system records this, all actual VCs support this TR-1-2 6 The VISS is only an visualization system. This feature is not planned (in composed visualizations it is also not possible). TR-6-4-B See CR-4-4-A

Bachelor Thesis
Final Report 09 June 2008
Markus Kunde
82
16. Appendix: System Sequence Diagrams of VISS Data Fetch action
Use
rD
ialo
g H
andl
erLo
gica
l Con
trol
ler
Visu
al Q
uery
Spec
ified
Vis
ual Q
uery
1Q
uery
Lan
guag
e C
ompo
nent
Res
sour
ce M
anag
erQ
uery
Tra
nsla
tor
Com
pone
ntC
lient
Sid
e Li
brar
yD
ata
Tran
sfor
mat
ion
Com
pone
ntG
UI
1 :
Inse
rtin
g Q
uery
()
2 :
Inse
rtin
g Q
uery
()
3 :
exec
uteV
isua
lQue
ry()
4 :
exec
uteV
isua
lQue
ry()
5 :
exec
uteV
isua
lQue
ry()
6 :
bool
eanQ
uery 7
: bo
olea
nQue
ry()
8 :
bool
eanQ
uery
_fet
chD
ata(
)
9 :
Dat
a A
vaila
ble
in D
ata
Stor
e?()
10 :
Que
ry_f
etch
New
Dat
a()
11 :
XQ
uery
()
12 :
fet
chD
ataF
rom
Prov
enan
ceA
rchi
tect
ure(
)
13 :
tra
nsfo
rmD
ata(
)
14 :
new
Tran
sfor
med
Dat
a
15 :
sto
reD
ataI
nDat
aCac
he()

Bachelor Thesis
Final Report 09 June 2008
Markus Kunde
83
Graph drawing and manipulation
Use
rG
UI
Dia
log
Han
dler
Logi
cal C
ontr
olle
rVi
sual
izat
ion
Com
pone
ntSp
ecifi
ed V
isua
lizat
ion
Con
cept
1G
raph
Dra
win
g C
ompo
nent
Spec
ified
Gra
ph B
ehav
ior
Res
sour
ceM
anag
er
1 :
Show
Dat
aInV
isC
once
pt()
2 :
Show
Dat
aInV
isC
once
pt()
3 :
Dra
wD
ata_
VisC
once
pt()
4 :
Exec
uteV
isC
once
pt()
5 :
Proc
essD
ata(
)
6 :
Dra
wGra
phO
nDat
a()
7 :
fetc
hDat
a()
8 :
proc
essD
ata(
)
9 :
data
10 :
Pro
cess
Gra
phBe
havi
orO
nDat
a()
11 :
fin
alG
raph
12 :
fin
alGra
ph
13 :
dra
wGra
ph
14 :
dra
wG
raph
15 :
dra
wG
raph
16 :
dis
play
Gra
ph
17 :
man
ipul
ateG
raph
()18
: m
anip
ulat
eGra
ph()
19 :
Man
ipul
atio
nOnG
raph
()
20 :
Man
ipul
atio
nOnV
isC
once
pt()
21 :
pro
cess
Man
ipul
atio
n()
22 :
cal
cula
teM
anip
ulat
edG
raph
()23
: f
etch
New
Nee
dedD
ata(
)
24 :
pro
cess
Dat
a()
25 :
dat
a
26 :
Pro
cess
Gra
phBe
havi
orO
nDat
a()
27 :
fin
alG
raph
28 :
fin
alG
raph
29 :
dra
wGra
ph
30 :
dra
wG
raph
31 :
dra
wG
raph
32 :
dis
play
Gra
ph()