Thesis - final - Oregon State University
86
AN ABSTRACT OF THE THESIS OF Stephanie Heckert for the degree of Master of Science in Botany and Plant Pathology presented on November 29, 2011 Title: Ascospore Viability and Dispersal from Pruned Branches Infected with Anisogramma anomala Abstract approved: Jay W. Pscheidt Ascospore viability and dispersal from pruned branches infected with Anisogramma anomala Viability and dispersal of ascospores of Anisogramma anomala, the cause of eastern filbert blight (EFB) on European hazelnut, from diseased branches pruned from trees were measured. In each of two years, branches bearing stromata of A. anomala were cut in mid-December and compared to branches cut near budbreak in March, when trees became susceptible to infection. The experiment was replicated three times at separated locations. At each location, 125 diseased branches (source) were piled loosely in a 1 x 1 m area. From March to June, spore traps (rain sampling-type) as well as 2-year-old potted hazelnut trees were placed next to each source, 6.4 m upwind and downwind, and 20 m downwind from each source. During seven significant major rain events over the two seasons, hazelnut seedlings (3-month-old) were placed adjacent to the spore traps. Near sources significantly higher (P. < 0.01) ascospores counts were obtained for branches cut near budbreak compared to those pruned in December in the first season; no significant difference in counts of ascospores were observed in the
Transcript of Thesis - final - Oregon State University

AN ABSTRACT OF THE THESIS OF Stephanie Heckert for the degree of Master of Science in Botany and Plant Pathology presented on November 29, 2011 Title: Ascospore Viability and Dispersal from Pruned Branches Infected with Anisogramma anomala Abstract approved:
Jay W. Pscheidt Ascospore viability and dispersal from pruned branches infected with Anisogramma anomala
Viability and dispersal of ascospores of Anisogramma anomala, the cause of eastern filbert
blight (EFB) on European hazelnut, from diseased branches pruned from trees were measured.
In each of two years, branches bearing stromata of A. anomala were cut in mid-December and
compared to branches cut near budbreak in March, when trees became susceptible to infection.
The experiment was replicated three times at separated locations. At each location, 125
diseased branches (source) were piled loosely in a 1 x 1 m area. From March to June, spore
traps (rain sampling-type) as well as 2-year-old potted hazelnut trees were placed next to each
source, 6.4 m upwind and downwind, and 20 m downwind from each source. During seven
significant major rain events over the two seasons, hazelnut seedlings (3-month-old) were
placed adjacent to the spore traps. Near sources significantly higher (P. < 0.01) ascospores
counts were obtained for branches cut near budbreak compared to those pruned in December
in the first season; no significant difference in counts of ascospores were observed in the

second season between pruning treatments. For both seasons significantly higher (P < 0.05)
counts of ascospores were observed at 6.4 m downwind compared to 6.4 m upwind or 20 m
downwind of a source. Ascospore viability, as assessed by staining with trypan blue, was
similar for both pruning times at all distances and averaged 50%. At least one infected
seedling was obtained for 5 of 7 major rain events regardless of pruning time at sources and 3
of 7 major rain events 6.4 m downwind of a source. All of the 2-year-old potted trees for both
pruning treatments at the source and 6.4 m downwind became diseased and > 50% of trees at
20 m downwind became diseased in the 2010 season. Similar to ascospores counts, disease
incidence was significantly higher (P < 0.01) in 2-year-old potted trees observed 6.4 m
downwind compared to 6.4 m upwind or 20 m downwind in the 2010 season. Significantly
higher (P < 0.01) disease incidence in 2-year-old potted trees was observed 20 m downwind
compared to 6.4 m upwind in the 2010 season. Downwind disease gradients for both pruning
treatments were shallow with slopes that were not significantly different than zero (p > 0.05)
for the 2010 season. Based on these results, ascospores from diseased branches pruned from
trees in both pruning treatments remained viable, infectious and were dispersed downwind of
each treatment.

©Copyright by Stephanie Heckert November 29, 2011 All Rights Reserved

Ascospore Viability and Dispersal from Pruned Branches Infected with Anisogramma anomala
by Stephanie Heckert
A THESIS
submitted to
Oregon State University
in partial fulfillment of the requirements for the
degree of
Master of Science
Presented November 29, 2011 Commencement June 2012

Master of Science thesis of Stephanie Heckert presented on November 29, 2011 APPROVED: Major Professor, representing Botany and Plant Pathology Chair of the Department of Botany and Plant Pathology Dean of the Graduate School I understand that my thesis will become part of the permanent collection of Oregon State University libraries. My signature below authorizes release of my thesis to any reader upon request.
Stephanie Heckert, Author

ACKNOWLEDGEMENTS
The Oregon Hazelnut Committee provided funding for this research. I would like to express
my sincere thanks to Dr. Jay Pscheidt for his support, guidance, and taking the time to meet
with me and help me throughout my time here at OSU. I would also like to thank Dr. Jeff
Stone for his expertise and guidance in vital staining and microtechnique used in this research.
A special thanks to Dr. Ken Johnson and Dr. Jennifer Parke for their time and help with
manuscript reviews and statistical advice. I would also like to acknowledge and thank Steve
Cluskey for his technical support and assistance with this research as well as John Bassinette
and Jade Florence. I am also grateful for my friends and family for their love and support.

TABLE OF CONTENTS
Page Chapter 1. Introduction………………………………………….. 1 Chapter 2. Literature Review......................................................... 4 Introduction…………………………………………. 5 Biology of Anisogramma anomala…………………. 6 Epidemiology of Anisogramma anomala………....... 9 Dispersal of Fungal Spores…………………………. 9 Viability…………………………………………….. 12 Disease Management…………………………….. … 14 Chapter 3. Materials and Methods…...…………………….......... 17 Field Study………………………………………….. 18 Collection of Ascospores in Rain Water……………. 20 Hazelnut Tree and Seedling Samples.………………. 22 Data Analysis………………………………………... 24 Chapter 4. Results……………...………………………………… 28 Major Rain Events…………………………………… 29 Ascospore Counts...…………………………………. 29 Ascospore Viability…………………………………. 31 Seedling Disease…………………………………. … 31 Two-Year-Old Tree Disease……………………........ 32 Chapter 5. Discussion………………..………………………….. 45 Chapter 6. Conclusion……………………………………........... 52 Bibliography……………………………………………………… 54 Appendices……………………………………………………….. 57 Appendix A Detecting Ascospore Viability with Trypan Blue… 58 Appendix B Additional Spore Traps and Nursery Trees North of Source………………………………………….. 67
LIST OF FIGURES Figure Page 3.1 Aerial photograph of the Oregon State University Botany and Plant Pathology Field Laboratory near Corvallis, OR where the field study was conducted…. 26 3.2 Photo of an experimental unit that consisted of a pile of pruned hazelnut branches bearing mature stromata of Anisogramma. anomala, the causal agent of eastern filbert blight and spore traps at locations away from those pruned branches at the Oregon State University Botany and Plant Pathology Field Laboratory near Corvallis, OR………………………………………. 27 4.1 Total number of Anisogramma anomala ascospores captured in 2010 spring major rain events in spore traps located at the Oregon State University Botany and Plant Pathology Field Laboratory near Corvallis, OR ……………………………………………........... 34 4.2 Total number of Anisogramma anomala ascospores captured in 2011 spring major rain events in spore traps located at the Oregon State University Botany and Plant Pathology Field Laboratory near Corvallis, OR.…………………………………………………… 35 4.3 A scatter plot of the average counts of ascospores of Anisogramma anomala for each pruning treatment at the traps near the source piles over the 12 major rain events in 2010. ……………………………………… 36 4.4 A scatter plot of the average counts of ascospores of Anisogramma anomala for each pruning treatment at the traps near the source piles over the 13 major rain events in 2011. ……………………………………… 37 4.5 Incidence of eastern filbert blight in 2-year-old potted European hazelnut trees placed adjacent to the different spore trap locations at the Oregon State University Botany and Plant Pathology Field Laboratory near Corvallis, OR for the entire spring 2010 season from March to June. …………………... 38 4.6 Severity of eastern filbert blight (average number of cankers per tree) in 2-year-old potted European

LIST OF FIGURES (Continued) Figure Page hazelnut trees placed adjacent to the different spore trap locations at the Oregon State University Botany and Plant Pathology Field Laboratory near Corvallis, OR for the entire spring 2010 season from March to June………………………………………………….. 39 4.7 Severity of eastern filbert blight (log average number of cankers +1) in 2-year-old European hazelnut trees positioned downwind from source piles of cut hazelnut branches bearing mature stromata Anisogramma anomala………………………………………………. 40

LIST OF TABLES Table Page 4.1 Number of ascospores of Anisogramma anomala
captured at source traps for the ‘seedling rain events’ during the spring of 2010 and 2011……… 41
4.2 Number of ascospores of Anisogramma anomala
captured at upwind and downwind traps for the ‘seedling rain events’ during the spring of 2010 and 2011.……………………………………….. 42
4.3 Viability of ascospore of Anisogramma anomala
captured at source traps for all spring major rain events combined and individual ‘seedling rain events’ for 2010 and 2011……………………….. 43
4.4 Incidence of eastern filbert blight in European
hazelnut seedlings placed adjacent to spore trap locations on the seven ‘seedling rain events’ during the spring of 2010 and 2011…………….. 44

LIST OF APPENDIX FIGURES Figure Page A.1 A photo of a light blue viable ascospore and a dark blue dead ascospore of Anisogramma anomala, the causal agent of eastern filbert blight on hazelnuts………………………………. 62 A.2 Counts of non-stained ascospores of Anisogramma anomala with trypan blue and germination of ascospores counts on A.C. (activated charcoal) culture media in various ascospore solutions.………………………………. 63 A.3 Viability of ascospores of Anisogramma anomala in two solutions was evaluated at 0, 3 and 6 days with trypan blue a vital stain. …………………... 64 A.4 Viability of ascospores Anisogramma anomala in three different copper sulfate solutions. ………… 65 A.5 Duration of the viability of ascospores of Anisogramma anomala in trypan blue a vital stain. 66 B.1 A layout of spore traps in Sections C or D for the 2010 season at the Oregon State University Botany and Plant Pathology Field Laboratory near Corvallis, OR………..................................... 70 B.2 Incidence of eastern filbert blight in 2-year-old European hazelnut trees planted in nursery rows north of section C’s source pile.…………………. 72 B.3 Disease severity (average number of cankers per tree) of eastern filbert blight on 2-year-old European hazelnut trees planted in nursery rows north of section C’s source pile at 5m increments.. 73 B.4 Severity of eastern filbert blight in 2-year-old European hazelnut trees planted downwind in nursery rows north of section C’s source pile.…. 74

LIST OF APPENDIX TABLES
Table Page B.1 Monthly Anisogramma anomala counts of ascospores in additional spore traps in sections C and D for the 2010 season……………………. 75

Chapter 1
Introduction

2
The fungus, Anisogramma anomala (Peck) E. Müller in E. Müller & Arx
(Diaporthales), is the causal agent of eastern filbert blight (EFB) on European hazelnut,
(Corylus avellana L.) in the Pacific Northwest (20). A perennial canker, that has a sunken
appearance on the branch due to the death of the cambium, is a symptom of the disease (20).
Within a canker are stromata of the pathogen containing perithecia (26), ascospores within the
perithecia mature in the fall and are released beginning in late December with rain events (38).
Hazelnut trees in contrast are not susceptible to infection by ascospores during winter
dormancy (44). Ascospores infect only juvenile hazelnut tissue during budbreak and early
shoot expansion (44). Evidence to date indicates that ascospores from diseased trees are
actively discharged and dispersed with the prevailing storm track (39). Hazelnut is susceptible
to infection by ascospores from budbreak (March) until the onset of the typical Pacific
Northwest dry summer season, ascospore depletion and/or cessation of terminal shoot growth
(44, 37).
Growers in infested areas with susceptible cultivars of hazelnuts are advised to scout
for disease in their orchards (28). Scouting is done principally in winter, when cankers are
easy to see without the obstruction of leaves. It is recommended that growers prune 0.6 to 0.9
m below the visible canker and remove infected branches out of the orchard before budbreak
in the spring (28). For sanitation reasons it was advised to destroy the infected branches that
were pruned from the orchard (28). However, no data were presented on whether infected
branches were sources of inoculum and needed to be destroyed. There are strict regulations
on agricultural burning in Oregon (12) and more restrictive laws are possible in the future,
which may lead to the discontinuing of agricultural burning in certain areas. The level of risk
associated with inoculum originating in pruned brush piles is unknown.

3
In laboratory studies ascospore release rates from cut branches infected with A.
anomala were greatly reduced in alternating wet/dry cycles compared to continuous wet
cycles (38). The results also showed that diseased branches cut in November had lower
release rates at colder temperatures, while having higher release rates at warmer temperatures
(38). It was concluded that because the study was conducted in November when perithecia
were not fully mature, warmer temperatures caused perithecia to mature faster allowing them
to release ascospores at a greater rate than under typical winter conditions (38).
Inoculum studies with diseased cut branches < 1 m from hazelnut trees has resulted in
consistent and multiple infections (35). However this distance is within the rain splash
dispersal range of spores (16) and there has been no investigations on whether A. anomala
ascospores in cut diseased branches are infectious outside of this range.
This research dealt with pruned hazelnut branches bearing mature stromata of A.
anomala and addressed whether the timing of pruning diseased branches affected inoculum
release and ascospore dispersal. It was hypothesized that diseased branches pruned from
hazelnut trees several months before budbreak and put into brush piles would not be a
significant source of inoculum compared to diseased branches pruned immediately before
budbreak. The objective of this thesis was to look for differences between early and late
timings of pruning in number, viability, and dispersal of ascospores from piles of pruned
diseased branches. An additional objective was to observe disease incidence and severity in
hazelnuts trees at specified distances away from these piles.

4
Chapter 2
Literature Review

5
Introduction
Anisogramma anomala (Peck) E. Müller in E. Müller & Arx is an obligate parasite
that is the casual agent of eastern filbert blight (EFB) on several species of hazelnuts. The
genus Anisogramma is a fungus in the phylum Ascomycota. This fungus has been classified
in the Gnomoniaceae family in the order of the Diaporthales (10). The fungus A. anomala is a
parasite of the American hazelnut, Corylus americana Marchsh (44). The American hazelnut
is an understory shrub common in the forests of the eastern United States (39) and A. anomala
is thought to be endemic to this region. EFB has not been shown to cause infection on the
Pacific Northwest native hazelnut Corylus cornuta Marchsh var. californica (6).
Eastern filbert blight is an important disease on the European hazelnut, Corylus
avellana L., with disease severity differing among cultivar (39, 35). European hazelnuts could
not be established as a commercial crop on the east coast of the United States due to EFB (35).
Commercial orchards however were established in Oregon, Washington and British Columbia,
where the pathogen was not present initially. Through exclusion of the pathogen (4) the
hazelnut industry in the Pacific Northwest thrived and by the early 1980’s produced 3% of the
world’s hazelnuts (41).
EFB was first reported in Washington in 1973 (9). Davison and Davidson (9)
reported that the orchard where it was first detected was 50% infected and that the grower first
noticed EFB in 1968. Subsequent studies determined that the fungus was probably introduced
in the early 1960’s. The first detection in Oregon occurred in the Columbia County during an
Oregon Department of Agriculture survey in 1974 (6). The Oregon Department of
Agriculture set up regulatory disease control areas in hopes of preventing the disease from
entering into the Willamette Valley, Oregon’s main hazelnut growing area (6,34). In October
of 1986, EFB was found in northern Clackamas County with surveys showing that disease

6
incidence and severity was greater in the NE of the Willamette Valley (34). This new main
focus was 25 km SW of where it was first detected in Washington (34). Disease distribution
patterns within orchards showed local spread to the N or NE, suggesting spread on the
prevailing winds of spring rains (34). Since then EFB has spread southward and has been
established throughout the Willamette Valley as far south as the Eugene area. EFB has also
been detected in hazelnut orchards in the Fraser Valley of British Columbia, Canada (40).
Biology of Anisogramma anomala
The disease is characterized by a perennial canker on European hazelnut. The canker
has a sunken appearance on the branch due to death of cambium tissue (20). Depending on
size of the canker, the number of stromata varies and can be in single or multiple rows (20).
The stroma contains the fruiting bodies of the pathogen: a perithecium with asci and
ascospores (26). The ascospore is the only known infectious propagule (22). Ascospores
have a 2 to 4 month maturation period before they are discharged, however not all ascospores
mature at once but instead mature over the late fall to early winter months (20). Gottwald and
Cameron (20) estimated that there were approximately 8,400 asci in a mature perithecium,
which would produce 67,200 ascospores. After the ascospores have matured in the asci they
are released into the environment. By December, 70% of the ascospores in the asci are
mature, with 90% by January (38). Ascospores are released with the start of the rainy season
in late fall (38), ascospore numbers start to decline in May and nearly all ascospores have been
discharged by June (37).
In laboratory studies of ascospore release from infected branches, ascospore release
rate was greatly reduced in a discontinuous-wetting treatment, using an intermittent mist
system that was on and off over a 5 day cycle, when compared to continuous wetting
treatment (38). Infected branches that were cut in November and were on discontinuous-

7
wetting treatment had greater ascospore release rate at 20° C than at 5° C (38). In field
studies, Pinkerton et al. (37) did not find a correlation between temperature and the release of
ascospores on diseased trees. They concluded that since the laboratory study, on cut diseased
branches, was conducted in November when perithecia were not fully mature; the higher
temperature caused perithecia to mature faster allowing them to release ascospores at a greater
rate than at lower temperatures (38).
The environmental factor that most greatly affected release of ascospores was
precipitation (37). Pinkerton et al. (37) used Burkhard traps and weather-monitoring
equipment for 12 weeks in the spring to study ascospore release in an orchard setting. A
strong correlation between precipitation and ascospore release was observed, however dew
alone was not enough to consistently result in the release of ascospores. Ascospores would
start to release after 1 to 2 hours of rainfall and would continue releasing up to 5 hours after
the last rain. The concentration of ascospores increased rapidly until the 5th hour and then held
constant until the 12th hour at which time the density started to decrease.
Stone et al. (44) studied the timing of infection in hazelnuts to determine when
hazelnuts were most susceptible. Experiments involved exposing 2-year-old European
hazelnuts in a diseased orchard at weekly intervals from February to May and inoculation
experiments on seedlings in the greenhouse. The orchard study showed 52% of the trees
exposed for a 7-day interval between March to May had symptoms after 15 months. During
this time, the 2-year-old trees were at the leaf tip emergence to shoot elongation stage. The
inoculation experiments also showed the host was susceptible at the same phenological stage
and needed a chilling period before symptom development.
Once an A. anomala ascospore landed on susceptible host tissue it adhered
irreversibly (34). Ascospores were found mostly at the base of trichomes nearest the apical

8
bud penetrating the epidermal cell wall in cross sectional studies (36). After infection hyphae
in the highly susceptible hazelnut cv. Ennis then colonized the cambium, phloem, and
secondary tissues (36). The fungus had haustoria-like cells present within phloem and
parenchyma cells of the xylem rays in the host (36). Pinkerton et al. (36) did find a
hypersensitive-like response of the host with continued colonization of the pathogen in the
formation of callose, cell necrosis, and a formation of a cicatricial layer. The host produces
the cicatricial layer to help contain the pathogen from further colonization (36). During this
time of colonization by A. anomala the only external signs of the pathogen was a series of
small bumps 0.5 x 2.0 mm in diameter (20).
Twelve to 14 months after infection, stromata start to form and rupture the bark of the
host. By Sep the process is complete and stromata are clearly visible on the host, the cambium
under the stromata dies and stromata mature into black carbonized bumps (20). The asci and
ascospores are undifferentiated at this point. They then mature and are ready for dispersal
with the late fall rains (28). The mature A. anomala ascospores are 8 to 12 μm long by 4 to 5
μm wide (20). The latent period from the time of infection to the maturation of the first
ascospores for dispersal is around 18 to 20 months (22).
Cankers of EFB increase in size perennial and will eventually girdle an infected
branch (22). An infection that started on the main scaffolding branch will take several years to
girdle, while a smaller branch may be girdled in the first or second season (22). Gottwald and
Cameron’s (22) experiments showed that the rate of canker expansion increased significantly
with canker age as long as there was susceptible tissue available. Cankers would continue to
expand onto secondary and tertiary branches. They estimated that a mature hazelnut cv.
‘Daviana’, would become commercially worthless within 5 to 15 years and a younger tree
would become commercially worthless within 4 to 7 years after infection.

9
Epidemiology of Anisogramma anomala
Pinkerton et al. (39) studied the disease gradient of EFB in controlled orchard settings.
They assessed disease gradients both by counting ascospores from spore traps as well as
determining disease incidence on European hazelnuts planted near a highly infested orchard.
The results showed that 76% of the planted trees to the north of the infected orchard were
infected with A. anomala. No significant difference between the number of diseased planted
trees near the edge of the orchard or > 5 m out was found indicating a shallow disease
gradient. In contrast, only 5% of the planted trees to the south of the orchard were infected,
with few trees infected beyond 10 m. Thus, upwind the disease gradient was very steep.
Weather data analyzed from the time EFB was introduced into the Willamette Valley
showed that during spring rainstorms the wind direction were from the SW majority of the
time (39). Pinkerton et al. (39) monitored disease spread in a mature orchard with 13 diseased
trees at the center. Subsequent increase of EFB into the N sector was at 30%, W sector 1%, E
sector 7%, and S sector 2% with distribution of the disease being highly contagious. It was
concluded that there was active dispersal in A. anomala, even though forcible discharge of
ascospores from the perithecium had not been observed. Ascospores were believed to be
carried on the prevailing wind during rainstorms in the springtime.
Dispersal of Fungal Spores
Early research indicated that A. anomala ascospores were rain splash dispersed, where
drops of water fall onto the fruiting body of the fungus causing spores to be carried away with
the splash (22). Gottwald and Cameron (21) experimented with ascospore release by putting
out petroleum jelly coated microscope slides 1 to 2mm over the stromata of cankered EFB
hazelnut branches in an orchard setting. Ten slides were exposed in 5 to 20 day intervals and
examined microscopically for ascospores. The whole process was repeated 10 times between

10
November to April (21). The majority of ascospores observed were typical of ascospores
dropping down in a rain droplet, though they did observe an octet of ascospores and a few
scattered ascospores, which is more typical with active discharge (21). Pinkerton et al. (38)
also showed rain splash dispersal of ascospores by using a spore traps to collect ascospores
beneath sporulating cankers in hazelnut orchard canopies. A correlation was made between
rainfall and ascospore release using this method and they concluded that rain splash dispersal
of ascospores may account for disease spread within the canopy (38,39).
The literature has several examples of experiments that were designed on how far rain
splashed inoculum would travel. Fitt et al. (19) reviewed data on dispersal of fungal plant
pathogens with rain. They observed that in still air only a few droplets go beyond 1m in
distance (19). In one experiment spore traps along with young wheat plants were set out to
evaluate splash dispersal of Pseudocercosporella herpotrichoides spores, 52 x 2 μm in
diameter and needle-like. The results showed that only 30% of the wheat plants outside of a
2.5 m radius from the inoculum source became infected (17). They concluded that the disease
gradient was steep in all directions from the source (17).
Fitt and Lysandrou (18) stated that splash dispersal of pathogens are affected
somewhat by the size of the droplet carrying the spore. The study measured where dyed
droplets containing Pseudocercosporella herpotrichoides spores landed as well as dye
droplets not containing spores landed. The resulting splash droplets were collected on fixed
photographic film. Positions, sizes of splash droplets and the numbers of spores they carried
were determined by microscopic examination. The results indicated that the number of
droplets, spore-carrying droplets and spores decreased with increasing distance from targets
(the point of impact). No splash droplets were collected at > 1 m from target and most of the
spore carrying droplets were between 4 to 5 mm in diameter. They did find evidence that 5

11
mm droplets dispersed more spores than the 4 mm droplets and that most spore carrying
droplets were between 200 to 400 μm. Splash droplets were observed up to a height of 70 cm,
with most between 15 and 20 cm.
Ntahimpera et al. (32) did an experiment determining if the size of rain droplets and
the differing intensities of rain affected the range of splash dispersal. In their experiments
they used Colletotrichum acutatum (11 x 5 μm) colony counts on media instead of spore
counts to detect the number of spores that were dispersed. They used varying nozzle sizes to
break the water into differing artificial raindrop sizes and varying water pressures to show
differing rain intensities. The results showed that largest artificial raindrops and lower
pressure of water had the higher amount of colonies. The lower amount of colonies came
from the small artificial raindrops and higher pressure of water. Most of the colonies were
within 30 cm of the source although there were “sufficient” spores at 60 cm that were able to
infect strawberries in a fruit disease incidence study. Their results showed that only the
treatment with the largest artificial raindrops and low water pressure had colonies at 72 cm
and then only at relatively small amounts.
Fitt and Nijman (16) also studied the effect of wind on rain splash dispersal. The
experiment used a raintower/wind tunnel complex to simulate wind and rain at the same time
with splash dispersal. Spores were deposited up to 1m upwind and 2.5 m downwind from the
source of inoculum. They detected water droplets that did not have spores further out
suggesting that the spores in the water droplets weighed more than droplets without spores.
Fatemi et al. (15) studied splash dispersal of Pseudocercosporella herpotrichoides (52
x 2 μm) and Pyrenopeziza brassicae (12 x 3 μm), conidia that differ both in shape and size.
The splash droplets were collected on photographic film. They found that the distance and the

12
distribution of spore carrying droplets and spores within droplet size categories were similar
for both fungi regardless of size and shape of spore.
Yang et al. (47) did an experiment on the effects of surface topography and rain
intensity on splash dispersal. The three surfaces were plastic, soil, and straw. They had two
different rain intensities: 15 mm/hr and 30 mm/hr and used Colletotrichum acutatum colony
counts on petri plates as their means of quantifying dispersal. Their study showed no
interaction between rain intensity and surface topography. The data also indicated that colony
counts were equal or close to zero at 60 cm from the source regardless of surface, occasionally
a colony, however, dispersed up to 120 cm away from the source. The change of rain
intensity caused more spores to be released therefore causing more colonies, however there
was no change in gradient steepness. The results also showed that dispersal of
Colletotrichum acutatum in the cross row direction was strongly affected by the presence and
density of the plant canopy they used.
Later research on ascospore dispersal of A. anomala indicated shallow spore and
disease gradients suggesting active dispersal of ascospores. Pinkerton et al. (38,39) has on
numerous occasions found A. anomala ascospores in Burkhard spore traps and in liquid
impinger air traps. Both of these spore traps actively sample the air. The large distances
between newly infected sites and sites of probable inoculum sources also gave evidence of
active dispersal of A. anomala ascospores (39). Pinkerton et al. (37) noticed that the
ascospores in the Burkhard collection tapes were usually found in clusters suggesting active
discharge of the intact ascus.
Viability
There are several stains that have been shown to indicate spore viability; some require
only a compound microscope while others require a compound microscope with fluorescence

13
filters. The fluorescence stains used for viability assays are based on membrane integrity or
intercellular enzyme activity of the cell or fungal spore (5). The literature is filled with
conflicting reports on which stains are the best for viability. There are three major
fluorescence stains: fluorescein diacetate (FDA), propidium iodide (PI), acridine orange (AO),
or FDA and PI combined.
Boyd et al. (5) evaluated three different stains; FDA, PI dyes alone, and a combination
of FDA/PI for assessing viability of cells in isolated islets of Langerhans (a region on the
mammalian pancreas). The results showed that with PI stain alone one could not
“unequivocably” determine cell viability. They concluded that fluorescent reagents could be
used to determine viability but to get consistent and reliable results depended on the cell and
tissue type being examined and the staining procedure being used.
In Yang et al.’s (48) studies on FDA stain showed they were able to discern between
viable and dead spores in two out of the four fungi species. They also noted that the stain
might be sensitive to the pH of the dissolving solution (48). Sincock and Robinson (43)
discounted FDA because the stain did not efficiently penetrate the membrane. They also
stated that the stain could leak out of the cell giving false results (43).
Hassan et al. (25) evaluated AO and FDA for viability of Trichoderma harzianum
hyphae. Their results showed that that FDA quickly faded and lost 50% of visibility within 20
seconds, while AO took 125 minutes for it to lose 50% of its visibility (25). However they
were unable to observe a reliable difference between viable and non-viable hyphae in AO
(25). The FDA stain was more reliable producing a bright green fluorescent, which indicated
viable hyphae, however researchers had to take pictures of viable hyphae to deal with the
quick fading of the FDA stain (25). Dittmer and Weltzein’s (11) research was also unable to
distinguish between living and dead cells with AO, however FDA gave them better results

14
throughout (11). Lauer et al. (30) liked AO when compared to the gram stain; yeast cells were
a brilliant orange from the stain and counting could be done under a lower magnification.
They also stated that they had no false positives with AO (30).
Trypan blue has been used for many years to determine cell viability (14). It is similar
to AO in that it uses membrane integrity to determine cell viability (29). Trypan blue is
advantageous because it requires only a compound microscope and several samples can be
processed in a short amount of time (46). The stain is versatile and has been used for viability
of plant, animal, and fungi cells with the majority vitality assays on mammalian cells
(33,29,31).
Disease Management
As described in Johnson et al., (28) a management plans have been developed to
control EFB in Oregon orchards. The plans include scouting, therapeutic pruning, sanitation,
replacement of susceptible pollenizer trees, fungicides, and resistant cultivars. The disease
management plan has helped the hazelnut industry in Oregon stay competitive in the global
market. Even after decades of EFB in the Willamette Valley, Oregon has consistently
contributed 3% of the world market (24).
Regular scouting of orchards is a high priority if growers are in an area where EFB is
prevalent. Scouting entails going through the orchard looking for symptoms of EFB cankers
and canopy dieback. Growers are encouraged to scout during the winter months when leaves
do not block the view of cankers and there is more time to allot for scouting (28). Growers
can also scout in late summer when EFB can be detected by looking for dead branches in the
canopy. After EFB has been identified in the orchard, growers should therapeutically prune
(pruning for the sake of disease) 0.6 to 0.9 m below the visible canker. The extra length of the
cut is due to the symptomless presence of the fungus within the infected tissue below the

15
visible canker. Therapeutic pruning is not particularly successful or cost effective in heavily
diseased orchards and is not feasible for growers who have extensive orchards to maintain.
One reason is that small cankers in the upper parts of the tree canopy are hard to detect and
can go undetected for years, building up inoculum and causing more disease. Also, once
cankers have been detected, it is likely the disease has been there for 3 to 5 years and probably
has infected neighboring trees. However when done correctly, pruning can be effective and
useful when disease incidence is light or moderate and combined with other tactics (28).
Susceptible pollenizer trees should be removed and replaced with more resistant
cultivars (28). The most widely planted cultivar in the Willamette Valley is the moderately
susceptible Barcelona (7). At the time of EFB detection, the widely used pollenizer tree for
Barcelona was the highly susceptible cv. ‘Daviana’ (39). It was noticed that the first detection
of EFB in orchards with this combination was on the cv. ‘Daviana’ trees and replanting the
pollenizer trees might extend the production life of Barcelona orchards (28).
Fungicide applications are recommended for the management of EFB (28). The first
application is applied at budbreak, when the period of host susceptibility begins in March and
is continued into Apr or May (28). There is an active hazelnut-breeding program at Oregon
State University that is breeding for quantitative as well as qualitative resistance against A.
anomala. There are now several cultivars of both traits available to growers for planting (28).
Sanitation is the destruction or removal of infected and infested plants or plant parts (8).
Removal of all volunteer hazelnuts or escaped hazelnut seedlings that have sprouted outside of
the orchards is recommended (28). These seedlings are susceptible and when infected could
be a potential inoculum source for orchards (28). It is also suggested to properly dispose of
pruned diseased branches by burning (28).

16
Pruned hazelnut branches bearing mature stromata of A. anomala, removed from trees
still have ascospores that can be dispersed (28). There has been no research to indicate
whether ascospores from diseased branches can be a source of inoculum outside of the rain
splash dispersal range once they have been removed from the tree and this is a concern for
growers. There are regulations on agriculture burning in Oregon (12) and there are concerns
of more restrictions in the future that may affect how growers are able to destroy their cut
diseased branches. These concerns lead to the important question: can diseased branches be
left lying on the ground throughout the spring months or are they a significant source of
inoculum outside the rain splash zone? The main objective of the current research was to look
at brush piles harboring ascospores of A. anomala to determine if the timing of pruning
diseased branches determined whether they were a significant source of inoculum outside the
rain splash zone of ascospores.

17
Chapter 3
Methods and Materials

18
Field Study
To investigate whether the timing of pruned diseased branches affected ascospore
release and infectivity from those branches, two different piles of diseased branches were set
out in a paired design. The two source piles were: hazelnut branches with mature stromata of
A. anomala cut 10 to 12 weeks before budbreak (old pruning treatment) and hazelnut branches
with mature stromata of A. anomala cut immediately before budbreak (fresh pruning
treatment).
For the 2010 old pruning treatment, diseased branches were cut on 16 Dec 09 and
stored in a shed until 30 Dec 09 when they were positioned outside. The fresh pruning
treatment of diseased branches were cut on 20 and 22 Feb 10 and stored in a shed until 2 Mar
10. The diseased branches of both the old and fresh pruning treatments were cut from the
same orchard located in Marion County. This mature hazelnut orchard was planted with the
cv. ‘Ennis’ and was severely diseased with A. anomala.
In 2011, the old pruning treatment diseased branches were cut on 16 and 17 Dec 10
and stored in a shed until 30 Dec 10 when they were positioned outside. The fresh pruning
treatment, diseased branches were cut on 2 and 4 Mar 11 and stored in a shed until 7 Mar 10.
The diseased branches of both old and fresh pruning treatments were cut from the North
Willamette Research and Extension Center located in Marion County. These hazelnut trees
were 4 to 5-year-olds of the cv. ‘Ennis’ and were infected with A. anomala. Only viable
branches that were cankered with mature stromata of A. anomala were cut for the experiment.
For both years the experimental units were positioned at six sites at the Botany and
Plant Pathology Field Laboratory near Corvallis, OR (A-F in Figure 3.1). The six locations
were spaced to keep cross contamination between experimental units to a minimum. The sites
varied in terrain from open fields, mature tree orchards, young tree orchards, open fields near

19
orchards (not on the side of the prevailing storm track) and rows of small shrubs. In each
replicate both pruning treatments were paired together and were within 75 to 250 m of each
other. The distance between replicates was within 150 to 400 m of each other, oriented in the
W to SE direction.
There were two other sources in the area but both were downwind of the prevailing
storm track. One source was a fungicide trial with infested branches that was 15 m E of D2010,
225 m N of F2010&11, 250 m E of C2010&11 and 225 m N of E2010&11. Another source was a
naturally infected mature cv. ‘Ennis’ orchard that was due N of the field laboratory. The
orchard was 150 m NE of B2010 and 275 m NW of D2010 and 200 m N of C2011 and 425 m NW of
E2010 (Figure 3.1).
Each treatment was replicated three times for a total of six experimental units. Each
treatment had 125 branches with mature stromata of A. anomala in a brush pile that was
approximately 1 x 1 m area and was considered a source (Figure 3.2). Each source pile had a
gravity-type spore trap in the middle of the brush pile. Another spore trap was placed upwind
of each source and was 6.4 m away in the SW direction at a 225° angle from a source pile.
The upwind trap was a control to monitor ascospores that may come from an unknown outside
source. Two additional spore traps were placed downwind of source piles to monitor
movement of ascospores. The 6.4 m downwind trap was 6.4 m away in the NE direction at a
45° angle from the source pile. The 20.1 m downwind spore trap was 20.1 m away in the NE
direction also at a 45° angle from the source pile (Figure 3.2). The spore traps were orientated
this way because of the prevailing storm track that mainly comes out of the SW in spring
rainstorms in the Pacific NW (39). The distance of 6.4 m was selected to be outside the range
of potential rain splash dispersal of ascospores from the source, and thus would not be a factor
in capture of ascospores at traps distal from source piles (16).

20
The spore traps were gravity-type traps, which collected ascospores that either landed
on the surface of the sampler or were scrubbed out during rainy periods. The spore traps were
constructed by using a ¾” PVC pipe leaving 20.3 cm intact on one end and sawing
longitudinally for 218.4 cm making a semi-circle shaped trough where the rainwater collected.
The surface area of the spore traps was 635.5 cm2 and the altered PVC pipe was fastened with
wire to a 2.5 x 15.2 cm board making a completed spore trap that was mounted onto metal
posts. The spore traps were orientated W to E with the W end at a height of 81.3 cm above
ground and the E end 48.3 cm from the ground at an angle of 65° to facilitate the run-off of
water into a bucket that collected the rainwater. The bucket was covered with a snap lid and
the PVC pipe connection to the container was caulked to seal it from the rainwater that landed
on the lid.
Rainwater collection and tree exposure ended on 9 Jun 10 and on 7 Jun 11. Weather
was monitored with an Adcon A730 weather station (Adcon Telemetry, Klosterneuburg,
Austria) for rainfall and wind directions for the two seasons.
Collection of Ascospores in Rain Water
Rainwater samples were collected from spore traps after each major rainstorm of 5
hours or more in duration (37). To collect ascospores each collection bucket was gently
shaken to homogenize the contents. Amount of rainwater was recorded for each spore trap
and a subsample was put into a screw top plastic container for transport back to the lab. The
bucket was then rinsed with water three times and re-positioned for the next rain events.
Thirty ml of a 0.5% CuSO4 solution was added to each collection bucket to inhibit ascospores
germination (38).
Samples from major rain events were brought back to the lab and stored at 6° C, until
filtered and evaluated using a compound microscope (Zeiss, Standard Series, Oberkochen,

21
Germany). All source traps were evaluated within 24 hours of collection, and the upwind and
downwind traps were generally evaluated within 2 to 4 days after collection.
The method for processing rainwater samples from spore traps was the same
procedure used by Pinkerton et al. (38). Rainwater samples from spore traps were filtered
through a 20 μm sieve, to remove any excess debris (still allowing the ascospores of A.
anomala, ~5 x 10 μm, to go through). Rainwater samples were then diluted depending on the
spore counts with each spore trap diluted to at least a 2 x dilution by adding equal parts of the
sample and deionized (DI) water. A 30 to 50 ml volume of this subsample was filtered
through a gridded, cellulose nitrate filter (Sartorius A.G., Goettingen, Germany), 25mm in
diameter with 0.8 μm pore size, held in a syringe holder (PALL Life Sciences, Ann Arbor,
MI). The subsample was pushed through the filter with a plastic syringe (B.D., Franklin
Lakes, NJ) pre-rinsed with the subsample. The filter was then placed on a glass microscope
slide and stained with a 0.05% trypan blue stain (MP Biomedicals LLC, Solon, OH) in
lactoglycerol (1:1:1 of water, lactic acid, and glycerol - Appendix A). A drop of the stain (~45
μL) was placed on the filter for one minute and then a coverslip was positioned on top of the
filter and the slide was put under a compound microscope (x100-400). The number of
ascospores in the four corners of the gridded filter and the middle grid were counted. Viability
was ascertained at the same time by counting the ascospores that were excluding the trypan
blue stain as viable, and the ascospores that took up the stain as dead (Appendix A). A set cut
off point for viability counting was determined to be ten minutes (Appendix A) at which time
a fresh subsample was filtered through a new cellulose nitrate filter and the procedure was
repeated.
Samples were also collected after light rain shower events that were less than five
hours in duration from source spore traps only. For the other spore traps, samples were only

22
collected before major rain events and kept until the end of the season. At the end of the
season, these rainwater samples were composited for each month (March, Apr, May, June),
and counted for ascospores. If spores were found in one of the composites, each individual
light shower event was then filtered for that month and counted for ascospores.
Hazelnut Trees and Seedling Samples
Five healthy, 2-year-old potted hazelnut trees of cv. ‘Ennis,’ were spaced along the
length of each spore trap. Trees were propagated by rooting basal water spouts in sawdust
around the base of mature trees. At the end of the season, the rooted sprouts were cut from the
mother tree transplanted into rows and allowed to grow an additional year in the field before
they were transplanted into 2-gallon pots with Sunshine Professional growing mix (Sun Grow
Horticulture, Vancouver, Canada). Experiment trees for the 2011 season were transplanted
into 2-gallon-pots straight from the stool beds and grown an additional year in the greenhouse
instead of in the field. During propagation, trees were protected from EFB with fungicide
(Year 1) or by exclusion in the greenhouse (Year 2) during the 2-year growth phase but were
not treated during the experiment. Budbreak of the 2-year-old trees was on 2 Mar 10 and on
21 Mar 11.
After the end of the experiment the 2-year-old potted trees were taken to an outside
greenhouse, for dormant season chilling (44), to incubate for symptoms of EFB at the end of
the experiment. The 2-year-old potted trees for both years were fertilized on 2 Jun 10 and 20
Jun 11 at a rate of 10 g per 2-gallon container with 14-14-14 of N-P-K (Scotts, Marysville,
OH). Herbicide was applied at a rate of 3 g per 2-gallon container (Hi-Yield, Bonham, TX)
both years on 3 Mar 11 and on the second year on 14 Jul 11. Disease readings were taken the
following summer after the 2-year-old potted trees had been exposed in the springtime (21-23

23
Jul 11 and summer 2012 pending). Each tree was examined for symptoms of EFB; canker
number and length were recorded.
During four major rainstorms in 2010 (30 Mar, 20 Apr, 28 Apr, and 20 May) and
three major rainstorms in 2011 (17 Apr, 12 May and 29 May), five seedlings were placed at
each of the four spore traps in each experimental unit (29 May 11 only four seedlings per
spore trap). These major rain events were referred to as ‘seedling rain events’. These
seedlings were grown from nuts of the highly susceptible cv. ‘Ennis’ pollinated with the cv.
‘Butler’. The nuts were encouraged to break dormancy by soaking them for 24 hours in a
0.08% solution of Pro Gibbs (Valent BioSciences Corp, Walnut Creek, CA) on 22 Dec 09 and
on 4 and 8 Jan 11. They were then put into a mist bed and kept continuously moist until the
radical emerged then transplanted into conetainers (Stuewe & Sons, Tangent, OR). They grew
for three to four months before placement outside to harden off.
Seedlings exposed in ‘seedling rain events’ were brought back to the greenhouse and
transplanted from conetainers to 1-gallon plastic container with Sunshine Professional
growing mix for the first year on 22-24 Jun 10 and on 19 May and12 Jul 11 for seedlings the
second year. The seedlings were fertilized at a rate of 6 g per 1-gallon container with 14-14-
14 of N-P-K on 2 Jul 10 (Year 1) and on 20 Jun and 19 Aug 11 (Year 2). Herbicide was
applied at a rate of 1.5 g per 1-gallon container and was put on seedlings of the second year on
12 and 22 Jul 11.
Seedlings were destructively sampled within 3 months of exposure (1 Nov 10 to 7 Jan
11 and 29 Aug to 2 Oct 11). Freehand sections of one to two cells thick were made from the
subperidermal stem tissue in the seedlings with a razor blade in the region of stem that was
susceptible to infection at the time of exposure (44). These sections were transferred to glass
slides and then stained with a drop (~60 μL) of 0.05% trypan blue (1:1 water to lactic acid). A
24
coverslip was added and the slides were allowed to sit overnight for the dye to soak into the
plant tissue. The slides were then examined microscopically (x100-400) for the presences of
A. anomala hyphae (44).
Data Analysis
Data were analyzed for only the major rain events (5 hours or more in duration) by the
rate of spores/m2/hr. Rain duration for each major rain event was calculated from first rainfall
until bark wetness was < 4 U (U = measures electrical resistance on a scale from 0, high
resistance (dry) to 10, low resistance (wet)) on the weather station’s readout or collection of
samples and was calculated for each rain event. Average temperature was determined for each
rain event as well as rainfall amounts. For each seedling rain event in 2010 and 2011, the
recorded wind direction for each event was tabulated into eight categories by compass
direction: S, SW, SE, N, NW, NE, W, and E and wind speed was categorized into: > 8 km/h or
< 8 km/h.
The difference in total ascospore counts for the major rain events (as measured in
spores/m2/hr) between the two pruning treatments at source traps were analyzed with
Satterthwaite’s two-sample t-test performed in SAS (SAS, Cary, NC). Total ascospore counts
were taken for each replicate over the season because of repeated measurements. T-tests were
also used to analyze differences in the two pruning treatments in counts of ascospores for the
‘seedling rain events’ at the source traps. The difference in the two pruning treatments for the
total ascospore count for the major rain events in the upwind and two downwind traps were
analyzed by difference of least square means using proc mix in SAS. Total ascospore counts
were taken for each replicate over the season because of repeated measurements. Difference
of least square means were also used to analyze differences in the two pruning treatments in
counts of ascospores for the ‘seedling rain events’ for spore traps distal to sources.

25
Differences in ascospore viability (as measured by number of viable ascospores divided by the
total ascospores) between the two pruning treatments were analyzed with Satterthwaite’s two-
sample t-test performed in SAS for the total season viability and the ‘seedling rain events’.
Differences in disease incidence in seedlings, 2-year-old potted trees and disease severity in 2-
year-old potted trees between the two pruning treatments was analyzed by difference of least
square means using proc mix in SAS. Disease gradient downwind from the source was
determined with polynomial regression model in Excel.

26
Figure 3.1. Aerial photograph of the Oregon State University Botany and Plant Pathology Field Laboratory near Corvallis, OR where the field study was conducted. A,C,E 2010&11 = sites for diseased EFB branches cut 10 to 12 weeks before budbreak (old pruning treatment) for respective year; B,D,F 2010&11 = sites for diseased branches cut immediately before budbreak (fresh pruning treatment) for respective year; Other Source1 – Diseased EFB cv. ‘Ennis’ orchard; Other Source2 – Fungicide Trial for EFB.
Other Source1
A2011
B2011
Other source2
C2010&11
E2010&11
F2010&11
D2010 D2011
A2010
B2010
100 m

27
Figure 3.2. Photo of an experimental unit that consisted of a pile of pruned hazelnut branches bearing mature stromata of A. anomala, the causal agent of eastern filbert blight and spore traps at locations away from those pruned branches at the Oregon State University Botany and Plant Pathology Field Laboratory near Corvallis, OR. Two-year-old hazelnut trees cv. ‘Ennis’ were placed adjacent to spore traps for the entire spring season (March to June). 6.4 m Upwind = spore trap 6.4 m SW of source; Source = trap near the pile of pruned hazelnut branches bearing mature stromata of A. anomala, the causal agent of eastern filbert blight; 6.4m Downwind = spore trap 6.4 m NE of source; 20.1 m Downwind = spore trap 20.1 m NE of source.
6.4 m Downwind
20.1 m Downwind
Source
6.4 m Upwind

28
Chapter 4
Results

29
Major Rain Events
In 2010 there were 12 major rain events with wet durations from 18 to 95 hours and in
2011 there were 13 major rain events with wet durations from 9 to 91 hours. Rainfall for the
major rain events in 2010 were from 0.8 to 6.1 cm with a total seasonal accumulation of 28.2
cm. Major rain events in 2011 were from 0.3 to 3.8 cm with a total seasonal accumulation of
22.1 cm. Greater than 80% of wind direction for 3 of the 4 ‘seedling rain events’ in 2010
where from of the SW to S directions. While in 2011, < 70% of wind direction in the ‘seedling
rain events’ where from the SW to S directions. Only in the ‘seedling rain events’ on 30 Mar
and 20 May 10 were 50% of the wind speeds > 8 km/h.
Ascospore Counts
In 2010, spore traps positioned near sources, hazelnut branches bearing mature
stromata of A. anomala, captured at least two orders of magnitude more ascospores than traps
placed at 6.4m upwind or downwind (Figure 4.1). The fresh pruning treatment (hazelnut
branches with mature stromata of A. anomala cut immediately before budbreak) had
significantly higher (P. ≤ 0.01, t-test) counts of ascospores for the entire season of major rain
events than the old pruning treatment (hazelnut branches with mature stromata of A. anomala
cut 10 to 12 weeks before budbreak). In 2011 there was also higher counts of ascospores at
source traps by at least two orders of magnitude compared to other traps (Figure 4.2). The
counts of ascospores for the two pruning treatments were not significantly different (P. > 0.05)
for the entire season of major rain events at source traps for the 2011 season. No significant
difference (P. > 0.05) in counts of ascospores between the two pruning treatments at any of
upwind or downwind traps for the 2010 or 2011 seasons was observed (Figures 4.1 and 4.2).
Ascospores were recovered from source traps after light shower events at lower counts than in

30
major rain events for both 2010 and 2011 seasons (data not shown). However, no ascospores
were captured in traps located upwind and downwind of sources in these light shower events.
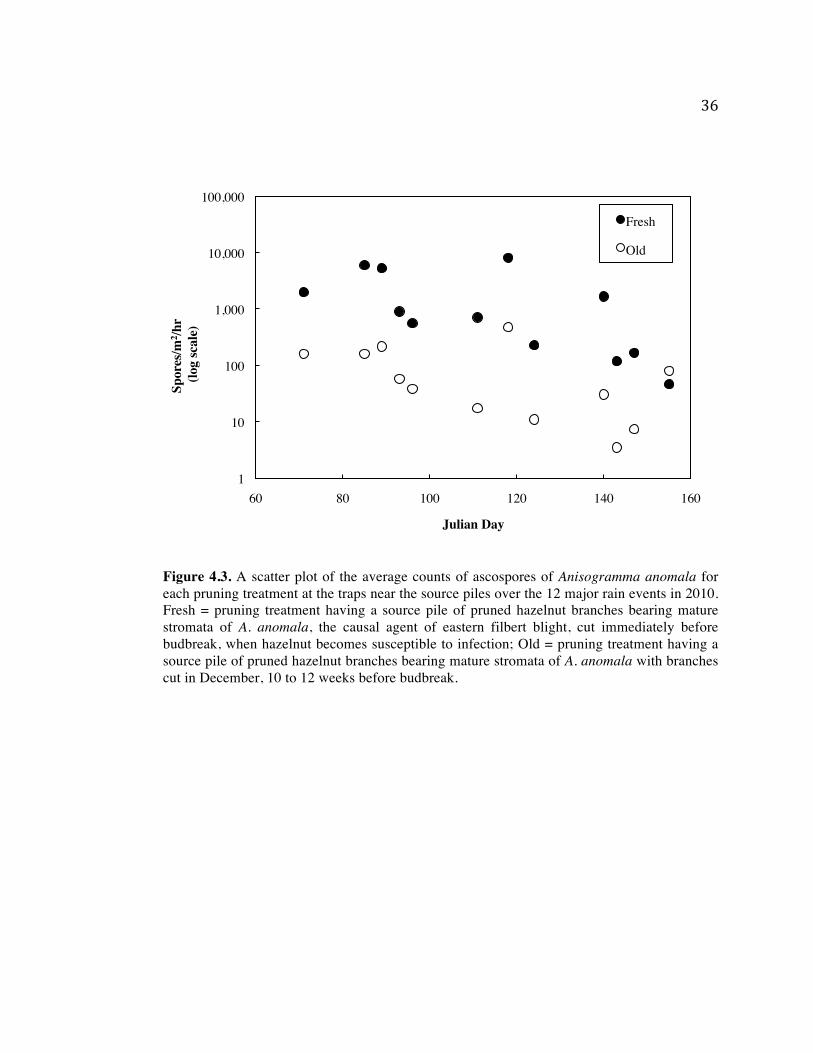
A decrease in counts of ascospores from the beginning of the 2010 season to the end
in both the fresh and old pruning treatments were observed (Figure 4.3). Counts of ascospore
from the fresh pruning treatment were always greater than counts from the old pruning
treatment except for the last rainwater sample collection. In 2011 no apparent decrease of
ascospores was observed throughout the season as seen in 2010 (Figure 4.4) and counts of
ascospore in both fresh and old pruning treatments were similar.
Counts of ascospores from source traps during ‘seedling rain events’ on 30 Mar 10
and 28 Apr 10 showed that the fresh pruning treatment released a significantly higher (P. ≤
0.04, t-test) number of ascospore than the old pruning treatment. In contrast, no significant
difference (P. > 0.05, t-test) between the two pruning treatments were detected at any of the
‘seedling rain events’ in the 2011 season (Table 4.1). Counts of ascospores at traps distal to
the source were consistently lower than source counts as they were for the entire season of
major rain events (Table 4.2). No significant difference (P. > 0.05, t-test) in counts of
ascospores between the two pruning treatments at any of upwind or downwind traps for either
the 2010 or 2011 seasons in the ‘seedling rain events’ was observed (Table 4.2).
As there was no difference in pruning treatments in the upwind and downwind traps
for counts of ascospores and no significant interactions (P. > 0.05, difference of least square
means) between pruning treatments and locations, pruning treatment data were pooled to look
for differences in ascospores counts between locations. For the 2010 major rain events, total
counts of ascospores in the 6.4 m downwind traps were significantly higher (P. < 0.001,
difference of least square means) than in the 20.1 m downwind or 6.4 m upwind traps (Figure
4.1). Likewise, for the 2011 major rain events, total counts of ascospores in the 6.4 m

31
downwind traps were also significantly higher (P. ≤ 0.04, difference of least square means)
than in the 20.1 m downwind or 6.4 m upwind traps (Figure 4.2). For ‘seedling rain events’,
only on 21 Apr 10 did the 6.4 m downwind traps have significantly higher (P. < 0.02,
difference of least square means) counts of ascospores than the 20.1 m downwind or 6.4 m
upwind traps(Table 4.2). In contrast, traps at 6.4 m upwind and 20.1 m downwind showed no
significant differences (P. > 0.05) in number of ascospores.
Ascospore Viability
The upwind and downwind traps had too few counts of ascospores to give reliable
viability results so data were only analyzed for source traps. However, viable ascospores were
observed in all six of the 6.4 m downwind traps, in two of the 20.1 m downwind traps and in
four of the 6.4 m upwind traps in 2010. For the 2011 season, viable ascospores were observed
in three of the 6.4 m downwind traps and in one of the 6.4 m upwind traps. In both the 2010
and 2011 seasons there were no significant differences (P. > 0.05, t-test) in ascospore viability
at the source traps between the two pruning treatments for all spring major rain events
combined or at any of the individual ‘seedling rain events’ (Table 4.3). Ascospore viability at
the source traps was significantly higher (P. < 0.001, t-test) in 2010 than in 2011.
Seedling Disease
No significant differences in disease incidence (P. > 0.05, difference of least square
means) between pruning treatments for seedlings near the source during the individual
‘seedling rain events’ in 2010 and 2011 were observed (Table 4.4). In addition, there were no
significant differences in disease incidence between pruning treatments for seedlings near
traps distal from the source for all events in both years. Since no differences were observed
between pruning treatments and no significant interactions (P. > 0.05, difference of least

32
square means) between pruning treatments and locations, pruning treatment data were pooled
to look for differences in disease incidence in seedlings between locations.
Distance from source had a significant effect (P. < 0.001 difference of least square
means) on disease incidence in seedlings (Table 4.4). Seedling disease incidence was greatest
at the ascospore source location than on seedlings at other locations on 30 Mar 10, 28 Apr 10
and 17 Apr 11 (Table 4.4). Seedling disease incidence was greater at 6.4 m downwind traps
than on seedlings at 20.1 m downwind traps (P. < 0.02, difference of least square means) or
6.4 m upwind traps (P. < 0.01, difference of least square means) on 30 Mar 10 and 17 Apr 11.
No significant difference (P. > 0.05, difference of least square means) in disease incidence on
seedlings at the 20.1 m downwind or 6.4 m upwind traps was observed. The other ‘seedling
rain events’ (21 Apr 10, 20 May 10, 12 May 11, and 29 May 11) had too few or no diseased
seedlings at the source location and no disease on seedlings at the other locations to detect
difference among locations (Table 4.4).
2-Year-Old Tree Disease
In 2010, no significant differences (P. > 0.05 difference of least square means) were
observed between pruning treatments for disease incidence (Figure 4.5) or canker number
(Figure 4.6) on 2-year-old potted hazelnut trees at any of the locations. Also, no significant
interactions (P. > 0.05, difference of least square means) between pruning treatments and
locations, so pruning treatment data were pooled to look for differences in disease incidence or
canker number on potted trees between locations.
All 2-year-old potted trees adjacent to the source and to the 6.4 m downwind traps
were infected (Figure 4.5). Disease incidence on potted trees adjacent to the source and the
6.4 m downwind traps were significantly higher (P. < 0.001, difference of least square means)
than on potted trees adjacent to other traps. Disease incidence on potted trees adjacent to the

33
20.1 m downwind traps were significantly higher (P. < 0.001, difference of least square
means) than on potted trees adjacent to the 6.4 m upwind traps.
For the 2010 season, average canker number per 2-year-old potted tree was
significantly (P. < 0.001, difference of least square means) affected by distance from the
source of ascospores (Figure 4.6). Disease severity (canker number) was highest on trees
located near the source compared to other potted tree locations (P. < 0.001, difference of least
square means). Disease severity on potted trees adjacent to the 6.4 m downwind traps was
significantly higher (P. < 0.001, difference of least square means) than potted trees adjacent to
the 20.1 m downwind or 6.4 m upwind traps. Significant higher (P. < 0.001, difference of
least square means) disease severity was detected between potted trees adjacent to the 20.1 m
downwind traps than at the 6.4 m upwind traps. The slopes of the disease gradients for both
pruning treatments (Figure 4.7) were not significantly different than zero (P. > 0.05).
Disease incidence and severity for 2-year-old potted trees for the 2011 season should
be determined during the summer of 2012. Results are expected to be similar to the 2010
season. However, I do not expect as many cankers on trees as 2010, especially away from
sources. Ascospore counts were lower in downwind traps compared to 2010, which may
translate into fewer infections in the downwind trap potted trees.

34
Figure 4.1. Total number of Anisogramma anomala ascospores captured in 2010 spring major rain events in spore traps located at the Oregon State University Botany and Plant Pathology Field Laboratory near Corvallis, OR. Trap Location: 6.4 m Upwind = spore trap 6.4 m SW of source; Source = trap near the pile of pruned hazelnut branches bearing mature stromata of A. anomala, the causal agent of eastern filbert blight; 6.4 m Downwind = spore trap 6.4 m NE of source; 20.1 m Downwind = spore trap 20.1 m NE of source; Fresh = pruning treatment having a source with branches cut immediately before budbreak, when hazelnut becomes susceptible to infection; Old = pruning treatment having a source with branches cut in December, 10 to 12 weeks before budbreak. The vertical line on each bar represents the standard error for each trap.
1
10
100
1,000
10,000
100,000
6.4 m Upwind Source 6.4 m Downwind 20.1 m Downwind
Spor
es/m
2 /hr
(log
scal
e)
Trap Location
Fresh Old

35
Figure 4.2. Total number of Anisogramma anomala ascospores captured in 2011 spring major rain events in spore traps located at the Oregon State University Botany and Plant Pathology Field Laboratory near Corvallis, OR. Trap Location: 6.4 m Upwind = spore trap 6.4 m SW of source; Source = traps near the pile of pruned hazelnut branches bearing mature stromata of A. anomala, the causal agent of eastern filbert blight; 6.4m Downwind = spore trap 6.4 m NE of source; 20.1 m Downwind = spore trap 20.1 m NE of source; Fresh = pruning treatment having a source with branches cut immediately before budbreak, when hazelnut becomes susceptible to infection; Old = pruning treatment having a source with branches cut in December, 10 to 12 weeks before budbreak. The vertical line on each bar represents the standard error for each trap.
1
10
100
1,000
10,000
100,000
6.4 m Upwind Source 6.4 m Downwind 20.1 m Downwind
Spor
es/m
2 /hr
(log
scal
e)
Trap Location
Fresh Old
36
Figure 4.3. A scatter plot of the average counts of ascospores of Anisogramma anomala for each pruning treatment at the traps near the source piles over the 12 major rain events in 2010. Fresh = pruning treatment having a source pile of pruned hazelnut branches bearing mature stromata of A. anomala, the causal agent of eastern filbert blight, cut immediately before budbreak, when hazelnut becomes susceptible to infection; Old = pruning treatment having a source pile of pruned hazelnut branches bearing mature stromata of A. anomala with branches cut in December, 10 to 12 weeks before budbreak.
1
10
100
1,000
10,000
100,000
60 80 100 120 140 160
Spor
es/m
2 /hr
(log
scal
e)
Julian Day
Fresh
Old

37
Figure 4.4. A scatter plot of the average counts of ascospores of Anisogramma anomala for each pruning treatment at the traps near the source piles over the 13 major rain events in 2011. Fresh = treatment having a source pile of pruned hazelnut branches bearing mature stromata of A. anomala, the causal agent of eastern filbert blight, cut immediately before budbreak, when hazelnut becomes susceptible to infection; Old = treatment having a source pile of pruned hazelnut branches bearing mature stromata of A. anomala with branches cut in December, 10 to 12 weeks before budbreak.
1
10
100
1,000
10,000
100,000
60 80 100 120 140 160
Spor
es/m
2 /hr
(log
scal
e)
Julian Day
Fresh
Old

38
Figure 4.5. Incidence of eastern filbert blight in 2-year-old potted European hazelnut trees placed adjacent to the different spore trap locations at the Oregon State University Botany and Plant Pathology Field Laboratory near Corvallis, OR for the entire spring 2010 season from March to June. Tree Location: 6.4 m Upwind = 2-year-old trees placed adjacent to spore trap 6.4 m SW of source; Source = 2-year-old trees placed adjacent to spore traps near the pile of pruned hazelnut branches bearing mature stromata of A. anomala, the causal agent of eastern filbert blight; 6.4m Downwind = 2-year-old trees placed adjacent to spore trap 6.4 m NE of source; 20.1 m Downwind = 2-year-old trees placed adjacent to spore trap 20.1 m NE of source; Fresh = pruning treatment having a source with branches cut immediately before budbreak, when hazelnut becomes susceptible to infection; Old = pruning treatment having a source with branches cut in December, 10 to 12 weeks before budbreak. The vertical line on each bar represents the standard error for each trap.
0
20
40
60
80
100
6.4 m Upwind Source 6.4 m Downwind 20.1 m Downwind
Disease Incidence (%)
Tree Location
Fresh
Old

39
Figure 4.6. Severity of eastern filbert blight (average number of cankers per tree) in 2-year-old potted European hazelnut trees placed adjacent to the different spore trap locations at the Oregon State University Botany and Plant Pathology Field Laboratory near Corvallis, OR for the entire spring 2010 season from March to June. Tree Location: 6.4 m Upwind = 2-year-old trees placed adjacent to spore trap 6.4 m SW of source; Source = 2-year-old trees placed adjacent to spore traps near the pile of pruned hazelnut branches bearing mature stromata of A. anomala, the causal agent of eastern filbert blight; 6.4 m Downwind = 2-year-old trees placed adjacent to spore trap 6.4 m NE of source; 20.1 m Downwind = 2-year-old trees placed adjacent to spore trap 20.1 m NE of source; Fresh = pruning treatment having a source with branches cut immediately before budbreak, when hazelnut becomes susceptible to infection; Old = pruning treatment having a source with branches cut in December, 10 to 12 weeks before budbreak. The vertical line on each bar represents the standard error for each trap.
0
2
4
6
8
6.4 m Upwind Source 6.4 m Downwind 20.1 m Downwind
Num
ber o
f Cna
kers
Tree Location
Fresh
Old

40
Figure 4.7. Severity of eastern filbert blight (log average number of cankers +1) in 2-year-old European hazelnut trees positioned downwind from source piles of cut hazelnut branches bearing mature stromata Anisogramma anomala. The experiment was conducted at the Oregon State University Botany and Plant Pathology Field Laboratory near Corvallis, OR for the entire spring 2010 season from March to June. Regression lines and points represent the two pruning treatments and their regression lines (b= -0.236) were not significantly (P > 0.05) different than zero. Fresh = pruning treatment having a source with branches cut immediately before budbreak, when hazelnut becomes susceptible to infection; Old = pruning treatment having a source with branches cut in December, 10 to 12 weeks before budbreak.
1
10
0.1 1 10
Log (canker number +1)
Log distance (m)

41
Table 4.1. Number of ascospores of Anisogramma anomala captured at source traps for the ‘seedling rain events’ during the spring of 2010 and 2011.
Sourcea Trap Ascospore Counts (Spores/m2/hr)
2010 Season
Treatmentb 30 March 21 Apr 28 Apr 20 May
Fresh 5,128.6 501.2 7,413.1 338.8 Old 125.9 7.1 269.2 24.0 p-valuec 0.04 0.06 0.03 0.20
2011 Season
Treatmentb 17 Apr 12 May 29 May Fresh 2,529.3 45.2 312.5 Old 3,146.3 111.8 301.7 p-valuec 0.79 0.63 0.24
a Source = spore trap near a pile of pruned hazelnut branches bearing mature stromata of A.aomala, the causal agent of eastern filbert blight.
b Treatment: Fresh = pruning treatment having a source with branches cut immediately before budbreak, when hazelnut becomes susceptible to infection; Old – pruning treatment having a source with branches cut in December, 10 to 12 weeks before budbreak, when hazelnut becomes susceptible to infection
c p-value of differences between the fresh and old pruning treatment from a t-test (SAS).
42
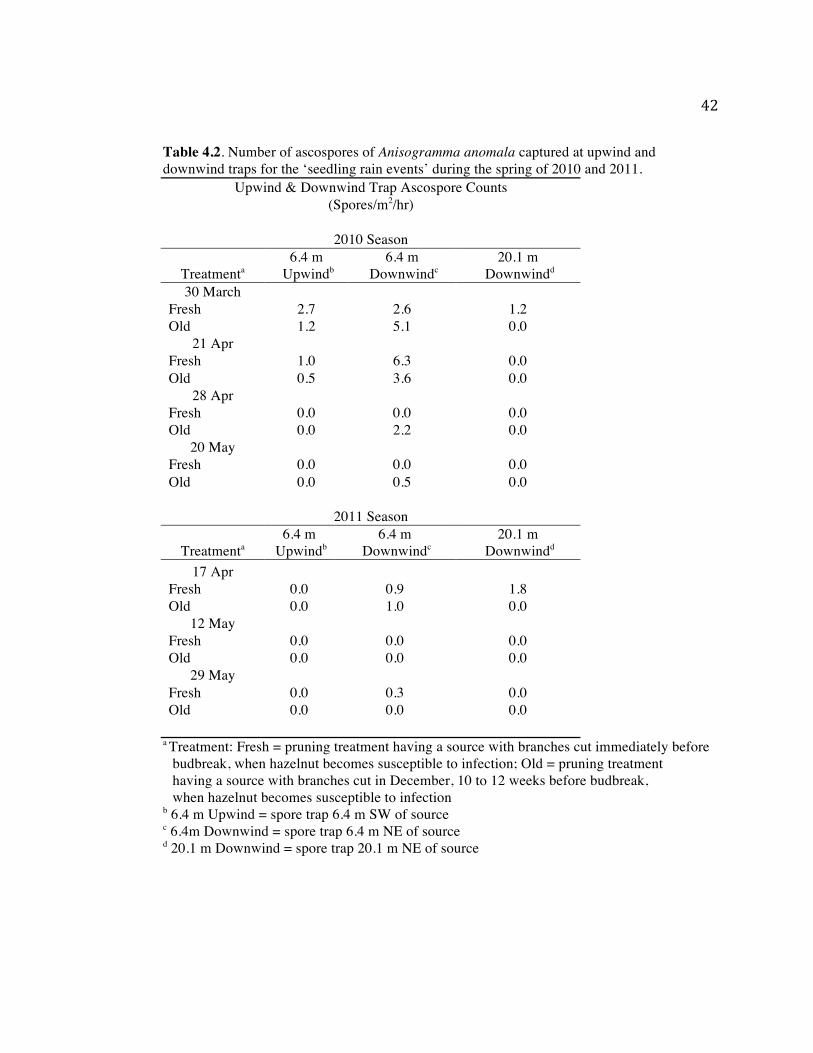
Table 4.2. Number of ascospores of Anisogramma anomala captured at upwind and downwind traps for the ‘seedling rain events’ during the spring of 2010 and 2011.
Upwind & Downwind Trap Ascospore Counts (Spores/m2/hr)
2010 Season
Treatmenta 6.4 m
Upwindb 6.4 m
Downwindc 20.1 m
Downwindd 30 March
Fresh 2.7 2.6 1.2 Old 1.2 5.1 0.0
21 Apr Fresh 1.0 6.3 0.0 Old 0.5 3.6 0.0
28 Apr Fresh 0.0 0.0 0.0 Old 0.0 2.2 0.0
20 May Fresh 0.0 0.0 0.0 Old 0.0 0.5 0.0
2011 Season
Treatmenta 6.4 m
Upwindb 6.4 m
Downwindc 20.1 m
Downwindd 17 Apr
Fresh 0.0 0.9 1.8 Old 0.0 1.0 0.0
12 May Fresh 0.0 0.0 0.0 Old 0.0 0.0 0.0
29 May Fresh 0.0 0.3 0.0 Old 0.0 0.0 0.0
a Treatment: Fresh = pruning treatment having a source with branches cut immediately before budbreak, when hazelnut becomes susceptible to infection; Old = pruning treatment having a source with branches cut in December, 10 to 12 weeks before budbreak, when hazelnut becomes susceptible to infection
b 6.4 m Upwind = spore trap 6.4 m SW of source c 6.4m Downwind = spore trap 6.4 m NE of source d 20.1 m Downwind = spore trap 20.1 m NE of source

43
Table 4.3. Viability of ascospore of Anisogramma anomala captured at source traps for all spring major rain events combined and individual ‘seedling rain events’ for 2010 and 2011.
Sourcea Trap Spore Viability (% of Viable Spores)
2010 Season
Treatmentb Seasonal Total 30 March 21 Apr 28 Apr 20 May
Fresh 55.9 68.6 70.0 65.6 55.2 Old 59.0 42.4 46.2 65.8 52.8 p-valuec 0.28 0.21 0.42 0.98 0.89
2011 Season
Treatmentb Seasonal Total 17 Apr 12 May 29 May Fresh 43.5 43.2 53.0 24.7 Old 39.3 45.4 36.5 27.4 p-valuec 0.32 0.83 0.28 0.81
a Source = spore trap near the pile of pruned hazelnut branches bearing mature stromata of A. aomala, the causal agent of eastern filbert blight
b Treatment: Fresh = pruning treatment having a source with branches cut immediately before budbreak, when hazelnut becomes susceptible to infection; Old = pruning treatment having a source with branches cut in December, 10 to 12 weeks before budbreak, when hazelnut becomes susceptible to infection
c p-value of differences between the fresh and old pruning treatment from a t-test (SAS).

44
Table 4.4. Incidence of eastern filbert blight in European hazelnut seedlings placed adjacent to spore trap locations on seven ‘seedling rain events’ during the spring of 2010 and 2011.
a Treatment: Fresh = pruning treatment having a source with branches cut immediately before budbreak; Old = pruning treatment having a source with branches cut in December, 10 to 12 weeks before budbreak
b 6.4 m Upwind = seedlings placed adjacent to spore trap 6.4 m SW of source a Source = seedlings placed adjacent to spore trap near the pile of pruned hazelnut branches
bearing mature stromata of A. aomala, the causal agent of eastern filbert blight c 6.4 m Downwind = spore trap 6.4 m NE of source d 20.1 m Downwind = spore trap 20.1 m NE of source g Dur(hr) = time in hours from beginning of rainfall event until bark wetness was < 4 U
(U - measurement of electrical resistance from the weather station’s readout) or collection of samples for each ‘seedling rain event’
h Temp(C°) = Average temperature for each ‘seedling rain event’ I Rainfall(cm) = Amount of rainfall for each ‘seedling rain event’
Disease Incidence of Seedlings (% diseased seedlings)
2010 Season
Date and Treatmenta
6.4 m Upwindb Sourcec
6.4 m Downwindd
20.1 m Downwinde
Dur (hr)f
Temp (C°)g
Rainfall (cm)h
30 March Fresh 0.0 93.3 13.3 6.7 57 7.8° 6.1 Old 0.0 93.0 46.7 0.0
21 Apr Fresh 0.0 6.7 0.0 0.0 18 9.6° 0.8 Old 0.0 6.7 0.0 0.0
28 Apr Fresh 0.0 86.7 6.7 0.0 40 9.2° 2.8 Old 6.7 73.3 13.3 0.0
20 May Fresh 0.0 0.0 0.0 0.0 25 10.1° 0.8 Old 0.0 6.7 0.0 0.0
2011 Season 17 Apr
Fresh 0.0 66.7 20.0 0.0 91 9.1° 2.8 Old 0.0 73.3 26.7 0.0
12 May Fresh 0.0 0.0 0.0 0.0 9 6.1° 0.3 Old 0.0 0.0 0.0 0.0
29 May Fresh 0.0 0.0 0.0 0.0 46 9.8° 2.1 Old 0.0 0.0 0.0 0.0

45
Chapter 5
Discussion

46
Pruning European hazelnut branches diseased with EFB at different times during the
dormant season did not influence release of A. anomala ascospores from these branches.
Diseased branches, regardless of time of pruning, were a source of viable ascospores that
infected hazelnut seedlings and 2-year-old potted hazelnut trees up to 20 m downwind from
their locations. In previous research, (27) diseased branches that were used as sources of
inoculum in fungicide trials were placed within the rain splash dispersal range of ascospores
and where less than 1 m away from ascospore sources. This thesis research, however,
indicated that diseased cut branches were a significant source of inoculum outside the rain
splash dispersal range of ascospores, at least 4 m away from ascospore sources. This is
consistent with Pinkerton et al. (39) who also observed the spread of disease from orchards to
young trees that were planted outside the range of rain splash dispersed ascospores. When
removed from diseased trees, cankers remained a source of viable, infective inoculum to
susceptible trees at least 6.4 m away from ascospore sources.
In 2010, counts of ascospore from the fresh pruning treatment at source piles were
significantly higher than the old pruning treatment. This difference was not observed during
the 2011 season. Pinkerton et al. (38) observed year-to-year variability of ascospore release
over a six-year period and concluded the variability was mainly due to variation in weather.
Weather pattern differences could also explain differences seen between 2010 and 2011. In
2010, it rained 6 cm more than in 2011 and on average individual major rain events had more
rainfall in 2010.
Viability of ascospores captured at source locations for either season was not affected
by pruning treatment. The overall viability for the 2010 season was 56% and 59% and for the
2011 season was 44% and 39% for fresh and old pruning treatments, respectively (Table 4.3).
Anisogramma anomala ascospores are encased in asci, which are surrounded by a viscous

47
ooze in the perithecium and are embedded in a carbonaceous stroma for protection (20).
Ascospores are not durable, are susceptible to desiccation and only survive a few days in the
environment when they have been released from the perithecium (38). In squash mounts with
trypan blue stain, ascospores that were outside the ascus but still within the viscous ooze
would stay viable for at least an hour (Heckert unpublished data). However, ascospores that
were extracted out of the viscous ooze, stained, and mounted on a slide would lose their
viability in 10 to 15 minutes (Appendix A). Ascospores from Calonectria crotalariae are also
surrounded by viscous ooze in a perithecium and in unfavorable environmental conditions
survive only a few minutes (42). It could be that the viscous ooze that surrounds the
ascospores in A. anomala caused them to stay viable until they were released from the
perithecium into the environment even when diseased branches had been detached from the
tree for several months.
Even though there was a significant difference in counts of ascospores between
pruning treatments at source traps during the 2010 season this difference did not result in
fewer infections on seedlings or 2-year-old potted trees in the old pruning treatment. In the
‘seedling rain events’ on 30 Mar 10 and 28 Apr 10, > 70% of seedlings in both pruning
treatments at source traps became infected (Table 4.4). On these two dates, however, counts
of ascospores from the old pruning treatment were only 102 spores/m2/hour compared to the
fresh pruning treatment that were 103 spores/m2/hour (Table 4.1). Likewise, all 2-year-old
potted trees for both pruning treatments at sources were infected despite a similar order of
magnitude difference in total ascospore counts. Johnson et al. (27) observed 52% infection
in hazelnut seedlings in their inoculated controls of greenhouse fungicide trials with an
ascospore suspension of 1 x 10⁵ spores/ml. It is possible that the inoculation rate of ascospores

48
for consistent infection of hazelnut seedlings or 2-year-old potted trees may be lower in field
settings.
Even though there was no difference in disease incidence in seedlings at source traps
for the two pruning treatments, there were certain ‘seedling rain events’ where more seedling
disease was observed. In three of the 7 ‘seedling rain events’ 60% or more of the seedlings at
the source traps became infected (Table 4.4). The weather during these specific ‘seedling rain
events’ had wet durations of > 40 hours and at least 2.8 cm of rainfall (Table 4.4). Stone et al.
(44) noted that longer wetness periods enhanced infection in hazelnut seedlings. Higher
disease incidence in seedlings at sources on 30 Mar 10, 28 Apr 10 and 17 Apr 11 for both
pruning treatments suggests counts of ascospores were high enough, ascospores were viable,
and environmental conditions were favorable for infection. On the other four ‘seedling rain
events’ weather conditions were not as conducive to infection, therefore leading to fewer
observed diseased seedlings at source traps (Table 4.4). Therefore the difference in seedling
disease in ‘seedling rain events’ was mostly like due to weather conditions at the individual
‘seedling rain events.’
Disease incidence and severity on 2-year-old potted trees located at the ascospore
source indicates that both the old and fresh pruning treatment piles in 2010 had enough viable
ascospores for consistent, multiple infections (Figures 4.5 and 4.6). These results are similar
to what Pinkerton et al. (35) observed in inoculation experiments where cut diseased branches
placed on mesh wire < 1 m above cv. ‘Ennis’ hazelnut clone trees that had > 90% infection.
No significant differences were observed between pruning treatments in either the 6.4
m and 20.1 m downwind or 6.4 m upwind traps with respect to counts of ascospores. Even
with significant difference in ascospores between the pruning treatments at the ascospore
source in 2010 there was no difference in counts of ascospores in either downwind traps.
49
When data were pooled for pruning treatment, significant differences were observed
in counts of ascospores between 6.4 m and 20.1 m downwind traps indicating a spore
dispersal gradient away from ascospore source piles for both seasons (Figures 4.1 and 4.2).
Most of the ascospores in the downwind traps were captured during major rain events when
the source traps also had larger number of captured ascospores, more than 2.5 cm of rainfall,
and more than 30 hours of wet duration. All of these conditions would be conducive to active
dispersal of ascospores away from the source (37). Most of the ascospores in the downwind
traps were captured before May (Table 4.2) suggesting that either the lack of major rain events
in May or ascospore depletion in the diseased branches (Table 4.1) was causing a decrease of
counts of ascospores observed away from the source (38).
Viable ascospores were found in upwind traps as well as downwind traps in both
seasons. However, the majority of viable ascospores were observed in spore traps 6.4 m
downwind of sources, suggesting that source piles were the origin of viable ascospores during
rain events. The viable ascospores observed upwind from source piles were most likely due to
shifting winds during rain events. Analysis of weather data showed that even though the
majority of the wind during rain events came from the SW, there were isolated times that wind
direction would come from the N to NE. This shift in wind direction was usually brief (≥ 15
minutes) and at the beginning or end of a rain event. It is possible, although unlikely, that the
viable ascospores that were collected from spore traps 6.4 m upwind from sources were from
unknown natural infestations that were upwind from the field site. Even so, the results of
disease incidence on 2-year-old potted trees downwind of source piles indicate a strong local
source (ie brush piles) than a potentially unknown source upwind from the field site.
No differences between the two pruning treatments in disease incidence on seedlings
or 2-year-old potted trees were observed at the different trap locations away from sources.

50
However, away from source piles, most seedling infections were at the 6.4 m downwind traps
regardless of treatment (Table 4.4). ‘Seedling rain events’ with infected seedlings at the 6.4 m
downwind traps corresponded with seedling infections at source piles on those same dates.
This indicates that ascospores were viable and environmental conditions conducive for
infection away from sources on those dates.
On 21 Apr 10 (Table 4.2) ascospores were found at the 6.4 m downwind traps,
however, no seedling infections were observed. Likewise, at sources little infection was
observed in seedlings on that date (Table 4.4). The wetness period for that ‘seedling rain
event’ was only 18 hours, which might not have been long enough for the pathogen to
successfully infect the host (44).
Only on 30 Mar 10 were infected seedlings detected at the 20.1 m downwind traps.
Weather conditions were conducive for infection with 6.1 cm of rainfall, wet duration of 57
hours, and a constant SW wind with speeds up to 18.5 km/h. For the remainder of the
‘seedling rain events’, little to no disease occurred suggesting that the rain events had too few
of ascospores and/or unfavorable weather conditions for reliable infection of seedlings at
locations away from sources.
Infection of 2-year-old potted trees was not limited to NE direction only but was also
seen in the N and NW directions as well (Appendix B). In these experiments, there were also
a significantly higher disease incidence and severity on downwind trap trees compared to the
upwind trap trees. The previous studies of Pinkerton et al. (34, 39) from heavily infested EFB
orchards, also observed disease spread in northward directions. Disease gradients downwind
for the 2-year old potted trees in 2010 were shallow for both treatments (Figure 4.7) as was
observed in previous research with infected EFB orchards (39). The high disease incidence
and severity downwind of source piles suggests that ascospores from sources in both pruning
51
treatments were being dispersed outside of the rain splash dispersal range downwind and were
infecting potted trees up to 20 m away.
Source piles were mostly in open areas where wind could blow through them during
rainstorms. Forcible discharge of ascospores has not been observed directly in A. anomala
and the mechanism behind the discharge of ascospores was not explored in this research.
Venturia inaequalis only needs to forcibly discharge its ascospores 4.1 mm from the leaf
surface for it to become dispersed on the wind (2). Fitt and Lysandrou (18) in experiments
with Pseudocercosporella herpotrichoides photographed splash droplets carrying spores
consistently 15 to 20 cm above splash surfaces. This height is enough for spores to break the
laminar boundary layer and have the potential to be caught and transported by the wind (23).
Aylor (1) noted a key to active dispersal was the access of spores to the wind. Whether the
mechanism for ascospore release in A. anomala is forcible discharge from the perithecium or
passive dispersal within splash droplets infected cut branches were a source of disease for
hazelnut trees at least 20 m away regardless of time of pruning.
It is recommended that growers continue to destroy all pruned diseased branches
before hazelnut budbreak in early March. Growers who are unable to destroy pruned diseased
branches are advised to at least put diseased brush piles downwind of their orchards. These
diseased brush piles, regardless of date cut, are significant sources of inoculum and can infect
susceptible hazelnut tissue at least 6.4 m away. It is suggested that further research be done
into chipping diseased branches to determine whether or not they remain significant sources of
inoculum.

52
Chapter 6
Conclusion

53
The timing of pruning branches infected with Anisogramma anomala, the causal agent
of EFB, in the spring before hazelnut budbreak did not make a difference in whether the cut
branches were a source of inoculum. Diseased branches that were cut in December were just
as much a source of viable ascospores as diseased branches cut immediately before hazelnut
budbreak in March. Inoculum from relatively small brush piles (1 x 1 m, with 125 diseased
branches) was able to infect 2-year-old cv. ‘Ennis’ hazelnut trees with multiple infections 6.4
m away. Shallow disease gradients away from sources for both treatments indicated that
ascospores were dispersed outside of the rain splash dispersal range downwind on springtime
prevailing storm tracks. These gradients also indicated that with favorable environmental
conditions these ascospores infected susceptible hazelnut trees > 20 m away. Further
investigation needs to be done on pruned hazelnut branches bearing mature stromata of A.
anomala to determine whether chipping these diseased branches causes them to remain
sources of inoculum.

54
Bibliography: 1. Aylor, D.E. 1986. A framework for examining inter-regional aerial transport
of Fungal Spores. Agricultural and Forest Meteorology 38:263-288 2. Aylor, D.E., and Anagnostakis, S.L. 1991. Active discharge distance of ascospores
of Venturia inaequalis. Phytopathology 81:548-551 3. Aylor, D.E. 1998. The areobiology of apple scab. Plant Disease 82:838-849 4. Barss, H.P. 1930. Eastern filbert blight. Calif. Dep. Agric. Bull. 19:489-490 5. Boyd, V., Cholewa, O.M., Papas, K.K. 2008. Limitations in the use of fluorescein
diacetate /propidium iodide (FDA/PI) and cell permeable nucleic acid stains for viability measurements of isolated islets of Langerhans. Current Trends in Biotechnology and Pharmacy 2:286-304
6. Cameron, H.R. 1976. Eastern filbert blight established in the Pacific Northwest. Plant Dis. Rep. 60:737-740
7. Clark, C. and Coba, K. 2009-2010 Oregon agriculture & fisheries statistics. NASS, USDA. Retrieved November 14, 2011. www.nass.usda.gov/Statistics_by_State/Oregon/Publications/Annual_Statistical_ Bulletin/2010%20Bulletin/stats0910.pdf
8. D’Arcy, C.G., Eastborn, D.M., and Schumaan, G.L. Illustrated glossary of plant pathology. American Phytopathological Society. Retrieved 19 Sept 2011. www.apsnet.org/edcenter/illglossary/Pages/S-V.aspx
9. Davison, A.D, and Davidson, R.M., Jr. 1973. Apioporthe and Monochaetia cankers reported in western Washington. Plant Dis. Rep. 57:522-523
10. De Silva, H., Castlebury, L.A., Green, S., Stone, J.K. 2009. Characterisation and phylogenetic relationships of Anisogramma virgultorum and A. anomala in the Diaporthales (Ascomycota). Mycological Research 113:73-81
11. Dittmer, U., and Weltzien, H.C. A rapid viability test for Sclerotia with fluorescein diacetate. 1990. J Phytopathology 130:59-64
12. Downing, K. Oregon open burning guide. Oregon Department of Agricultural. Retrieved September 19, 2011 www.deq.state.or.us/aq/factsheets/04-AQ-005-OpenBurnEng.pdf
13. El-Shatoury, S.A., El-Shenawy,N.S., Abd El-Salam, I.M. Antimicrobial, antitumor and in vivo cytotoxicity of actinomycetes inhabiting Marchine shellfish. 2009. World J Microbiol Biotechnol 25:1547–1555
14. Evans, H. M., Schulemann, W. The action of vital stains belonging to the benzidine group. 1914. Science 39:443-454
15. Fatemi, F. and Fitt et al., B. D. L. 1983. Dispersal of Pseudocercosporella herpotrichoides and Pyrenopeziza brassicae spores in splash droplets. Plant Pathology 32:401-404
16. Fitt, B.D.L. and Nijman, D.J. 1983. Quantitative studies on dispersal of Pseudocercosporella herpotrichoides spores from infected straw by simulated rain. Neth. J. Plant Path. 89: 198-202
17. Fitt, B.D.L. and Bainbridge, A. 1983. Dispersal of Pseudocercosporella herpotrichoides spores from infected wheat straw. Phytopath. Z. 106:214-225
18. Fitt, B.D.L and Lysandrou, M. 1984. Studies on the mechanisms of splash dispersal of spores, using Pseudocercosporella herpotrichoides spores. Phytopath. Z. 111:323-331
19. Fitt, B.D.L., and McCartney, H.A., and Walklate, P.J. 1989. The role of rain in

55
dispersal of pathogen inoculum. Annu. Rev. Phytopathol. 27:241-270 20. Gottwald, T.R., and Cameron, H.R. 1979. Studies in the morphology and life
history of Anisogramma anomala. Mycologia 71:1107-1126 21. Gottwald, T.R., and Cameron, H.R. 1980. Infection site, infection period, and
latent period of canker caused by Anisogramma anomala in European filbert. Phytopathology 70:1083-1087
22. Gottwald, T.R., and Cameron, H.R. 1980. Disease increase and the dynamics of spread of canker caused by Anisogramma anomala in European filbert in the Pacific Northwest. Phytopathology 70:1087-1092
23. Gregory, P.H. 1973. The microbiology of the atmosphere. 2nd ed. Halsted Press Books, New York, New York
24. Halstead, T. Tree Nuts: Walnuts and hazelnuts world markets and Trade. FAS, USDA. Retrieved 14 Nov 11. www.fas.usda.gov/htp/horticulture/Tree%20Nuts/2009_treenuts_WalnutsHazel. pdf
25. Hassan, M., Corkidi, G., Galindo, E., Flores, C., Serrano-Carreon, L. 2002. Accurate and rapid viability assessment of Trichoderma harzianum using Fluorescence-based digital image analysis. Biotechnology and Bioengineering 80:677-684
26. Hawksworth, D.L., Sutton, B.C., Ainsworth, G.C. 1983. Ainsworth & Bisby’s dictionary of the fungi. 7th ed. H. Charelsworth & Co Ltd, Huddersfield, England
27. Johnson, K.B., Pscheidt, J.W., Pinkerton et al., J.N. 1993. Evaluation of chlorothalonil, fenarimol, and flusilazole for control of eastern filbert blight. Plant Dis. 77:831-837
28. Johnson, K.B., Mehlenbacher, S.A., Steone et al., J.K., Pscheidt, J.W., Pinkerton et al., J.N. 1996. Eastern filbert blight of European hazelnuts: it’s becoming a manageable disease. Plant Dis. 80:1308-1316
29. King, D.W, Paulson, S.R., Puckett, N.L., Krebs, A.T. Cell death IV. The effect of injury on the entrance of vital dye in Ehrlich tumor cells. 1959. Am. J. Pathol. 35:1067-79.
30. Lauer, B.A., Reller, L.B., Mirrett, S. Comparison of Acridine Orange and gram stains for the detection of microorganisms in cerebrospinal fluid and other clinical specimens. 1981. Journal of Clinical Microbiology 14:201-205
31. Marchtinez,L.R., Ntiamoah,P., Casadevall, A., Nosanchuk, J.D. Caspofungin reduces the incidence of fungal contamination in cell culture. 2007. Mycopathologia 164:279–286
32. Ntahimpera, N., Madden, L.V., and Wilson, L.L. 1997. Effects of rain distribution alternation on splash dispersal Colletotrichum acutatum. Phytopathology 87:649-65
33. Pasqualini, S., Piccioni C., Reale, L., Ederli, L., Torre, G.D., Ferrant, F. Ozone-Induced Cell Death in Tobacco Cultivar Bel W3 Plants. The role of programmed cell death in lesion formation. 2003. Plant Physiol. Vol. 133:1122-1134
34. Pinkerton, J.N., Johnson, K.B., Theiling, K.M., Griesbach, J.A. 1992. Distribution and characteristics of the eastern filbert blight epidemic in western Oregon. Plant Dis. 76:1179-1182
35. Pinkerton, J.N., Johnson, K.B., Mehlenbacher, S.A., Pscheidt, J.W. 1993.

56
Susceptibility of European hazelnut clones to eastern filbert blight. Plant Dis. 77:261-266
36. Pinkerton, J.N., Stone, J.K., Nelson, S.J., and Johnson, K.B. 1995. Infection of European hazelnut by Anisogramma anomala: Ascospre adhesion, mode of penetration of immature shoots, and host response. Phytopathology 85:1260-1268
37. Pinkerton, J.N., Johnson, K.B., Stone, J.K., and Ivors, K.L. 1998. Factors affecting the release of ascospores of Anisogramma anomala. Phytopathology 88: 122-128
38. Pinkerton, J.N., Johnson, K.B., Stone, J.K., and Ivors, K.L. 1998. Maturation andseasonal discharge pattern of ascospores of Anisogramma
anomala. Phytopathology 88: 1165-1173 39. Pinkerton, J.N., Johnson, K.B., Aylor, D. E., and Stone, J.K. 2001. Spatial
and temporal increase of eastern filbert blight in European hazelnut orchards in the Pacific Northwest. Phytopathology 91:1214-1223
40. Pscheidt, J. W., Grimaldi, P, and Penhallegon, R. 2008. The eastern filbert blight epidemic in the Pacific Northwest: survey vs. biology. Proceedings of the Nut Growers Society of Oregon, Washington and British Columbia. 93:38-50.
41. Rosengarten, F. 1984. The book of edible nuts. Pages 94-116. Walker & Company New York
42. Rowe, R.C., and Beute, M.K. 1974. Ascospore formation and discharge by Calonectria crotalariae. Phytopathology 65:393-398 43. Sincock, S.A., and Robinson, J.P. 2001. Flow cytometric analysis of
microorganisms. Pages 511-536 in: Methods in Cell Biology, Vol. 64. Darzynkiewicz, Z., Crissman, H.A., Robinson, J.P., eds. Academic Press
44. Stone, J.K., Johnson, K.B., Pinkerton et al., J.N., Pscheidt, J.W. 1992. Natural infection period and susceptibility of vegetative seedlings of European hazelnut to Anisogramma anomala. Plant Dis. 76:348-352
45. Stone, J.K., Pinkerton et al., J.N., and Johnson, K.B. 1994. Axenic culture of Anisogramma anomala: Evidence for self-inhibition of ascospore germination and colony growth. Mycologia 86:674-683
46. Tolnai, S. A method for viable cell count. 1975. Tissue Culture Association. Procedure No. 7011
47. Yang. X., Madden, L.V., Wilson, L.L., and Elis, M.A. 1990 Effects of surface topography and rain intensity on splash dispersal of Colletotrichum acutatum. Phytopatholgy 80:1115-1120
48. Yang, H.C., Nemoto, Y., Homma, T., Matsuoka, H., Yamada, S., Sumita, O., Takatori, K., Kurata, H. Rapid viability assessment of spores of several fungi by an ionic intensified fluorescin diacetate method. 1995. Current Microbiology 30:173-176

57
Appendices
58
Appendix A Detecting Ascospore Viability with Trypan Blue Introduction:
Assessing the viability of cells using stains has been practiced since the early 1900’s (14). Samples, after proper preparation, are exposed to vital stains for a certain length of time and then examined microscopically for viability. A vital stain is a stain that is able to distinguish viable cells (cells that are capable of performing all cell functions necessary for survival) from dead cells (cells that have lost the ability of performing cell functions necessary for survival) through staining or non-staining of the cells (25).
These vital stains usually require evaluation with a compound microscope with or without fluorescence filters. Fluorescence stains used for viability assays are based on membrane integrity or intercellular enzyme activity to determine cell’s vitality (5). Trypan blue also uses membrane integrity to determine viability of a cell. For a viable cell, trypan blue stain is unable to accumulate within the cell so it is then non-stained. However for a dead cell, trypan blue stain does accumulate within the cell and stains it a dark blue (46). Trypan blue is versatile and has been used for assessing viability of plant, animal, and fungal cells with the majority on mammalian cells (33, 29, 31). It is advantageous because it requires only a compound microscope and several samples can be processed in a short amount of time (46). Results and procedural parameters of trypan blue stain vary between the different kingdoms and genera (46), therefore trypan blue stain was evaluated as a vital stain for the ascospores of the fungus Anisogramma anomala. Several experiments were conducted to determine its validity. Methods: Collecting Ascospores
Ascospores were collected from hazelnut branches bearing mature stromata of A. anomala. Branches had been cut during winter dormancy and stored frozen until needed. Upon removal from the freezer, branches were stored at room temperature for ten minutes. Perithecia were then physically extracted from stromata using a scalpel, hydrated in deionized (D.I.) water and crushed to liberate ascospores. Ascospores were collected with a pipette and diluted to 1x10⁶ spores/ml (43). Ascospores procured this way were known to result in eastern filbert blight (EFB) when inoculated on hazelnut trees (43). Trypan Blue vs. A.C. Media
Trypan blue staining of ascospores was compared with germination of ascospores on culture media. Trypan blue stain, 0.05% in lactoglycerol (1:1:1 of water, lactic acid, and glycerol), was used in all experiments. Half of an ascospore suspension was placed in boiling water for five minutes and allowed to cool to room temperature to heat kill ascospores (heated solution). The other half of the ascospore suspension remained unaltered (non-heated solution). A 1:10 ratio of trypan blue stain (30 μl) to ascospore suspension (290 μl) was made for the two solutions and each separate solution was allowed to stand for 1 minute. A drop of each solution was placed on a microscope slide with a cover slip and slides were examined to assess visible differences under a compound microscope (13). Ascospores with and without staining were counted and recorded using a hemocytometer (VWR, Radnor, PA). Each subsample of the two solutions was prepared and examined microscopically 3 times. The entire procedure was repeated a total of 3 times.

59
Subsamples (30 μl) of non-heated and heated solutions were also plated on a 0.05% activated charcoal (A.C.) agar media (BD, Franklin Lakes, NJ) to check for germination of ascospores (45). The fungus A. anomala is an obligate biotroph that does not grow well in standard culture, however, ascospores usually germinate by swelling (2 to 3x their normal size) and in some cases start making hyphal tubes before they lyse (die). This swelling was assessed after 3 to 5 days incubation at 20° C with a compound microscope (45). The number of germinated and non-germinated ascospores were counted and recorded for both solutions. Each subsample of the two solutions was plated out 3 times and later examined microscopically. The entire procedure was repeated a total of 3 times.
In another set of experiments, the non-heated and heated solutions were mixed together in various ratios. Two mixtures were prepared; one with 50% of the non-heated solution and 50% of the heated solution, and another with 25% of the non-heated solution and 75% of the heated solution. The two mixtures were homogenized, diluted and filtered through a gridded, cellulose nitrate filter and then stained with trypan blue and repeated twice for each mixture. A solution of 100% non-heated solution was treated similarly. The first 50 to 100 ascospores were counted for staining. The mixtures were also plated out on culture media (50 μL of each mixture) and then incubated for 3 to 5 days at 20° C and replicated twice for each mixture. The entire process was repeated 3 times. Viability in Copper Sulfate
The effect of copper sulfate on the viability of ascospores was also investigated. Copper sulfate has been used to inhibit ascospores from germinating in rainwater collection containers in the field (38). Half of an ascospore suspension had 1 ml of 0.5% CuSO4 added to 5 ml of the ascospore suspension while the other half remain unaltered. Trypan blue stain was added to a subsample of each solution as mentioned above and staining was assessed with a hemocytometer twice for both solutions. The two solutions were then kept at room temperature and read 3 and 6 days later. Ascospore suspensions in 1.0, 0.5, and 0.25% copper sulfate solutions were prepared. Trypan blue stain was added to a subsample of each solution and staining was read with a hemocytometer twice for each solution. The solutions were then kept at room temperature and read 3 days later. This experiment was completed twice. Duration of Viability in Stain The length of time that ascospores were able to exclude trypan blue stain was determined. An ascospore suspension was prepared, diluted and filtered through a gridded, cellulose nitrate filter. The filter was then placed on a slide and a drop of trypan blue stain (60 μl) was added and allowed to sit for 1 minute and then one grid of the filter was examined under a compound microscope. The ascospores with and without staining were counted and recorded as well as the time it took to read the first grid. A second grid was counted and recorded for stained ascospores as well as the time. The difference in staining between the first and second grid were compared. This whole procedure was repeated 5 different times. Results: Trypan Blue vs. A.C. Media
Most of the ascospores in the non-heated solution examined under the compound microscope excluded the stain and only had a slight shade of blue around their cell walls, these ascospores were considered viable (Figure A.1). The ascospores that were in the heated solution absorbed the stain and turned a dark blue, these were considered dead (Figure A.1).

60
The average percentage of non-stained ascospores in the non-heated solution was 74.3% (62.5 to 100%). The average percentage of germinated ascospores in the A.C. media was 79.5% (63.2 to 100%). The percentage of stained ascospores in the heated solution for the trypan blue stain and the non-germinated ascospores on A.C. media was 100%. The average percentage of non-stained ascospores for 100% non-heated solution was 86.3% (73.6 to 94.2%), 50% non-heated solution was 45% (38.7 to 49.2%), and 25% non-heated solution was 25.9% (18.9 to 33.59%). The average percentage of ascospore germination on A.C. media for 100% non-heated solution was 84.14% (82.23 to 85.05%), 50% non-heated solution was 36.28% (32.77 to 42.04%), and 25% non-heated solution was 20.69% (16.67 to 24.57% (Figure A.2)). Viability in Copper Sulfate The percentage of non-stained ascospores in the unaltered ascospore solution immediately after sample preparation was 88.9%, and the percentage of non-stained ascospores in the copper sulfate ascospore solution was 84.4%. The percentage of non-stained ascospores in the unaltered ascospore solution dropped to 42.9% after 3 days and the percentage of non-stained ascospores in the copper sulfate ascospore solution was 58.1%. The percentage of non-stained ascospores of unaltered ascospore solution dropped further to 3.1% after 6 days from sample preparation while the percentage of non-stained ascospores of the copper sulfate ascospore solution was 54.17% (Figure A.3). The average percentage of non-stained ascospores in the 1.0% copper sulfate solution was 87.7% (84.2 to 92.3%), in 0.5% copper sulfate solution was 85.7% (65.8 to 100%), and in 0.25% copper sulfate solution was 80.2% (71.4 to 84.6%). The average percentage of non-stained ascospores 3 days later in 1.0% copper sulfate solution was 69.0% (18.2 to 96%), in 0.5% copper sulfate solution was 63.4% (37.5 to 96.7%), and in 0.25% copper sulfate solution was 58.4% (25.0 to 100% (Figure A.4)). Duration of Viability The first grid on average was examined in 4 minutes and a second grid was read before 9 minutes had elapsed. The average similarity in the percentage of non-stained ascospores in first grid compared to second grid was 87.2% (73.4 to 97.3%). Each grid had around 100 total ascospores (Figure A.5). Discussion: The count of non-stained ascospores from the trypan blue stain solution was comparable to the germination count of the same ascospores solution in culture (Figure A.2). The slightly lower germination rates on the A.C. media may have been due to A. anomala ascospores germination inconsistencies. Germination rates were comparable to the results found by Stone et al. (45). Based on this evidence it was determined that trypan blue could be used as vital stain for A. anomala ascospores. Copper sulfate did not have an adverse effect on the viability of the ascospores. After 3 days, ascospores in copper sulfate had greater than 50% viability compared to the unaltered solution that was less than 50% (Figure A.3). The copper sulfate solution was still greater than 50% viability even on the 6th day while the unaltered solution ascospore viability was less than 10%. Little variation in the different copper sulfate solutions in regards to the viability of ascospores was observed (Figure A.4). The results in the 0.5% copper sulfate solution had the least variability among the experiments and this was the solution used in spore trapping

61
experiments of pruned branches bearing stromata of A. anomala. The viability recovery 3 days later was consistently lower in the different solutions so it was determined that collecting samples as soon as possible after major rain events had ended would provide the best viability results in the spore trapping experiments. The percentage of non-stained or viable ascospores 0 to 5 minutes after application of the vital stain was similar to the percentage of viable ascospores at 5 to 9 minutes (Figure A.5). Preliminary observation into the length that viable ascospores excluded the stain showed that ascospores initially viable after preparation were mostly dead after 20 minutes. Due to the high recovery percentage at 9 minutes an arbitrary 10-minute cut off point was set to ensure consistent results. Conclusion: The above studies provide good evidence that trypan blue stain can be used as a vital stain for A. anomala ascospores and present guidelines on how to use the stain to obtain accurate results.

62
Figure A.1. A photo of a light blue, viable ascospore (upper left-hand corner) and a dark blue, dead ascospore (middle bottom) of Anisogramma anomala, the causal agent of eastern filbert blight on hazelnuts. European hazelnut pollen (upper right-hand corner) added for reference (400x).
10μm

63
Figure A.2 - Counts of non-stained ascospores of Anisogramma anomala with trypan blue and germination of ascospores counts on A.C. (activated charcoal) culture media in various ascospore solutions. The % of non-heated ascospore solution: 100 = all non-heated ascospore suspension, 50 = 1:1 ratio of non-heated ascospore suspension to heated ascospore suspension, 25 = 1:4 ratio non-heated ascospore suspension to heated ascospore suspension.
0
20
40
60
80
100
0
20
40
60
80
100
100 100 50 50 25 25
% of Germinated Ascospores
% of Non-Stained Ascospores
% of Non-Heated Ascospore Suspension
Trypan Blue A.C. Media

64
Figure A.3. Viability of ascospores of Anisogramma anomala in two solutions was evaluated at 0, 3 and 6 days with trypan blue, a vital stain. Unaltered Solution: an ascospore suspension in deionized water; CuSO4 Solution: an ascospore suspension in a 0.5% copper sulfate solution (CuSO4).
0
20
40
60
80
100
0 3 6
% of Non-Stained Ascospores
Time (Days)
Unaltered Solution
CuSO Soultion

65
Figure A.4. Viability of Anisogramma anomala ascospores in three different copper sulfate solutions. Viability of ascospores in the three solutions was evaluated at 0 and 3 days after addition of trypan blue, a vital stain. 0.25%: an ascospore suspension in a 0.5% copper sulfate solution (CuSO4); 0.50%: an ascospore suspension in a 0.5% copper sulfate solution (CuSO4); 0.25%: an ascospore suspension in a 1.00% copper sulfate solution (CuSO4).
0
20
40
60
80
100
0 3
% N
on-S
tain
ed A
scos
pore
s
Time (Days)
0.25% 0.50% 1.00%
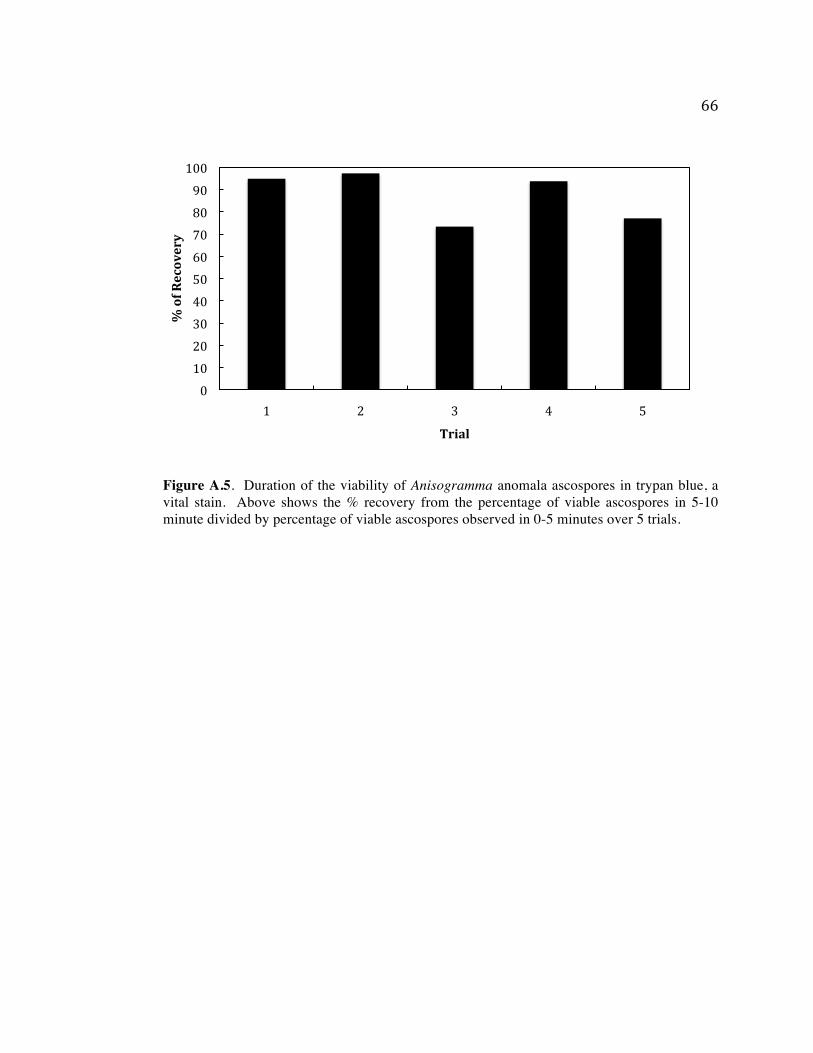
66
Figure A.5. Duration of the viability of Anisogramma anomala ascospores in trypan blue, a vital stain. Above shows the % recovery from the percentage of viable ascospores in 5-10 minute divided by percentage of viable ascospores observed in 0-5 minutes over 5 trials.
0 10 20 30 40 50 60 70 80 90 100
1 2 3 4 5
% of Recovery
Trial
67
Appendix B Additional Spore Traps and Nursery Trees North of a Source Introduction:
Inoculum of Anisogramma anomala, the casual agent of eastern filbert blight (EFB) on hazelnut is generally dispersed from the SW to the NE along with springtime storm tracks in the PNW (39). Pinkerton et al. (39) studied disease gradients of EFB in controlled and commercial orchard settings. Their results showed that > 75% of the trees to the north of a heavily infested orchard were infected with A. anomala (39). In contrast, only 5% of the trees planted to the south of the infested orchard were infected.
In two source locations additional spore traps were set-up to detect ascospore dispersal and disease incidence on European hazelnuts in directions other than NE during the 2010 season It was hypothesized that a pile of pruned hazelnut branches bearing mature stromata of A. anomala cut immediately before budbreak (fresh pruning treatment) would be a significant source of inoculum and would have more diseased hazelnut trees away from the source than cutting hazelnut branches 10 weeks before budbreak (old pruning treatment). Methods and Materials: Additional Spore Traps and Trees
Two experimental units, one for each pruning treatment (hereafter referred to as section C and D) in 2010 had four additional spore traps (Figure 3.1). Two spore traps were 6.4 m at right angles from each source pile in the N and S directions and two spore traps were at a 135° and 315° angles from source piles in the NW and SE directions at 6.4 m away (Figure B.1). Also, at each spore trap, five healthy 2-year-old potted hazelnut trees of cv. ‘Ennis’ were spaced out along the distance of the trap. The 2-year-old potted trees were grown from a stool bed and then allowed to grow an additional year in the field before they were transplanted into 2-gallon-pots with Sunshine Professional growing mix. Hazelnut trees were protected from EFB with fungicide during the 2-year growth phase but were not treated during the course of these experiments.
Rainwater from the additional spore traps from sections C (old pruning treatment) and D (fresh pruning treatment) was collected in March and April with major rain events and at the end of May and mid June. Water samples for March and April were composited and processed as mentioned previously. When ascospores were observed, individual major rain events for March and April were processed to ascertain which rain event the ascospores were captured. Viability was not determined for the additional spore traps.
The 2-year-old potted trees in the 2-gallon containers were fertilized on 2 Jun 10 at a rate of 10.0 g per 2-gallon container with 14-14-14 of N-P-K. Herbicide was applied at a rate 3.0 g per 2-gallon container for both years on 3 Mar 11 and on the 2-year-old potted trees on 14 Jul 11. Disease readings were taken the following summer after the 2-year-old potted trees had been exposed in the spring of 2010 (21-23 Jul 11). Each potted tree was examined for symptoms of EFB; canker number and canker length were recorded.
Nursery Trees North of a Source
Section C (old pruning treatment) source pile was placed due S of nursery rows of 2-year-old cv. ‘Ennis’ hazelnut trees (Figure B.2). The trees were 2 to 40 m away from the source pile. These nursery trees were not sprayed with fungicides during the 2010 season.

68
Disease readings were taken the following summer (20 Jul 11) after the 2-year-old trees had been exposed to the source pile the previous spring (2010).
There were known sources of EFB in the area but both were downwind of the prevailing storm track. One source was a fungicide trial with infested branches that was 15 m E of Section D and 250 m E of Section C. Another source was a natural infestation of a mature cv. ‘Ennis’ orchard that was due N of the field laboratory. The orchard was 275 m NW of section D and 200 m N of section C and section C was 215 m W of section D (Figure 3.1).
Data were analyzed by Satterthwaite’s two-sample t-test and proc mix difference of least square means in SAS for the additional traps in sections C and D. Disease gradient downwind from the source was determined with polynomial regression model preformed in Excel. For each seedling rain event in 2010 the recorded wind direction for each event was tabulated into eight categories by compass direction: S, SW, SE, N, NW, NE, W, & E and wind speed was categorized into: > 8 km/h or < 8 km/h. Results: Additional Spore Traps Counts of ascospores for the additional spore traps were low and no significant differences (P > 0.05, t-test) were found between pruning treatments. In section C no ascospores were found in the additional spore traps and in section D a few ascospores were found in March on trap #7 on Julian days 71 and 85 and in May on trap #6 (Table B.1). There were no significant differences (P > 0.05, difference of least square means) between old and fresh pruning treatments in disease incidence in 2-year-old potted trees at any of the additional traps. In section C all 5 of the trees located at trap #5 and #6 were infected, trap #7 had 2 infected trees and trap #8 had no infected trees. In section D all 5 trees in trap #5 were infected, trap #6 had 3 infected trees, trap #7 had 2 infected trees and trap #8 had one infected tree. As there was no difference in pruning treatments in the upwind and downwind traps in disease incidence in 2-year-old potted trees and no significant interactions (P > 0.05, difference of least square means) between pruning treatments and locations, pruning treatment data were pooled to look for differences in disease incidence in 2-year-old potted trees between locations. Significantly (P < 0.01, t-test) more infection on trees at trap #5 than at trap #7, significantly (P. < 0.01, t-test) more infection on trees at trap #6 than at trap #8, and significantly (P. < 0.01, t-test) more infection on trees at trap #5 than at trap #8 was observed. Nursery Trees N of a Source Figure B.2 shows a map of the infected (symptoms of EFB) and non-infected hazelnut trees in the nursery rows due north of section C. There were 134 trees in the nursery rows and 99 trees (74%) had EFB cankers by the summer of 2011. Infected trees were found as far as 36.8 m away from the source to the NE. Half of the trees 30 to 40 m from the source were diseased with one canker (Figure B.3). A disease gradient away from the source pile had a slope of b = -0.239 (Power law & R2=0.84 (Figure B.4)). Discussion: There were no ascospores captured in spore traps in section C and only a few were captured in section D. The few ascospores that were captured compared to the level of infection on potted trees at the various traps suggested that the spore traps used were not adequate for sampling all ascospores. The spore traps used in these experiments passively sampled the air by collecting rainwater. Ascospores either needed to land directly on the

69
spore traps in rain droplets or rain would “scrub out” (rain drops encounter and absorb ascospores as they fell through the air) the ascospores so that they landed on spore traps. This type of spore trap was more suited for splash dispersed spores (35). Spore traps that actively sample the air (37) would have been more appropriate, however these types of spore traps were expensive and impractical for the amount of traps that were needed for these experiments. No differences were found in diseased trees for downwind trap #5 (NW) and trap #6 (N) for both pruning treatments indicating that brush from either pruning treatment was capable of infecting trees downwind of sources. There were significant differences in disease incidence between trap #5 (NW) and trap #7 (SE) and between trap #6 (N) and trap #8 (S), when treatments were pooled and analyzed together. This suggests that disease was not due to rain splash dispersal of ascospores or both the upwind and downwind potted trees would have had similar disease incidence (39). Traps #7 and #8 were directly upwind of source piles at least 25% of time throughout the ‘seedling rain events’ and had significantly fewer diseased potted trees than downwind potted trees. This evidence suggests that there might be active dispersal of viable ascospores on the prevailing wind during rain events since trap #5 and trap # 6 were downwind from source piles and potted trees were outside rain splash dispersal zone of ascospores. These results are similar to what Pinkerton et al. (39) found in their research on ascospore movement in diseased orchards. Up to 35 m north of source pile C, 50% of the trees were infected. A shallow disease gradient existed north of this section (Figure B.4) as was observed NE of all sources (see main trial results) and with diseased cv. ‘Ennis’-‘Butler’ mini-orchards (39). These nursery rows were next to a source pile with infected branches from the old pruning treatment. Diseased branches cut any time during the dormant season were a source of viable, infective ascospores. Conclusion:
Diseased branches cut 10 weeks before budbreak and diseased branches cut immediately before budbreak are a significant source of Anisogramma anomala inoculum. Piles of diseased branches could disperse viable ascospores on the wind of the prevailing storm track and cause consistent infection in 2-year-old hazelnut trees at least 6.4 to 35 m away.

70
Figure B.2 Incidence of eastern filbert blight in 2-year-old European hazelnut trees planted in nursery rows north of section C’s source pile. Section C’s source pile of pruned hazelnut branches bearing mature stromata of Anisogramma anomala, the causal agent of eastern filbert blight, was cut in December, 10 weeks before budbreak, when hazelnut becomes susceptible to infection was located at the Oregon State University Botany and Plant Pathology Field Laboratory near Corvallis, OR for the entire spring season from March to June of 2010. * = source pile location.
0
5
10
15
20
25
30
35
40
0 2 4 6 8
Dist
ance
(m)
Distance (m)
Diseased Not Diseased
*

71
Figure B.3. Disease severity (average number of cankers per tree) of eastern filbert blight on 2-year-old European hazelnut trees planted in nursery rows north of section C’s source pile at 5m increments. Section C’s source pile consisting of cut hazelnut branches bearing mature stromata of Anisogramma anomala cut in December, 10 weeks before budbreak, when hazelnut becomes susceptible to infection. The nursery rows where at the Oregon State University Botany and Plant Pathology Field Laboratory near Corvallis, OR for the entire spring season from March to June of 2010. (The 5 potted trees near the source pile used in the main trial were included).
0
1
2
3
4
5
6
0-5 5-10 10-15 15-20 20-25 25-30 30-35 35-40
Num
ber o
f Can
kers
Distance form Source (m)

72
Figure B.4. Severity of eastern filbert blight in 2-year-old European hazelnut trees planted downwind in nursery rows north of section C’s source pile. Section’s C’s source pile consisted of cut hazelnut branches bearing mature stromata of Anisogramma anomala cut in December, 10 weeks before budbreak, when hazelnut becomes susceptible to infection. The experiment was conducted at the Oregon State University Botany and Plant Pathology Field Laboratory near Corvallis, OR for the entire spring season from March to June. Regression line b = (-0.239). (Source infection is included)
1
10
0.1 1 10 100
Log
(num
ber o
f can
kers
+1)
Log Distance (m)

73
Table B.1. Monthly Anisogramma anomala counts of ascospores in additional spore traps in sections C and D for the 2010 season.
Section C & D Ascospore Counts (Spores/ml)
Month #5a #6b #7c #8d
March
Ce 0.0 0.0 0.0 0.0 Df 0.0 0.0 1.2 0.0
Apr C 0.0 0.0 0.0 0.0 D 0.0 0.0 0.0 0.0
May C 0.0 0.0 0.0 0.0 D 0.0 0.6 0.0 0.0
June C 0.0 0.0 0.0 0.0 D 0.0 0.0 0.0 0.0
a #5 = spore trap 6.4 m from source in the NW direction b #6 = spore trap 6.4 m from source in the N direction c #7 = spore trap 6.4 m from source in the SE direction d #8 = spore trap 6.4 m from source in the S direction e C = old pruning treatment: having a source with branches cut in December, 10 weeks before
budbreak, when hazelnut becomes susceptible to infection f D = fresh pruning treatment: having a source with branches cut immediately before
budbreak, when hazelnut becomes susceptible to infection

74