Thesis Final
43
To examine the photoprotective properties of four native Irish plant extracts on human skin cells by Iain Conlon 2015 THIS PROJECT IS SUBMITTED IN PART FULFILLMENT OF THE HETAC REQUIREMENTS FOR THE AWARD OF BACHELOR OF SCIENCE (PHARMACEUTICAL SCIENCE) DEGREE. MAY, 2015 B.SC IN MEDICAL BIOTECHNOLOGY | SLIGO INSTITUTE OF TECHNOLOGY
-
Upload
iain-conlon -
Category
Documents
-
view
2 -
download
0
Transcript of Thesis Final
To examine the
photoprotective
properties of four native
Irish plant extracts on
human skin cells
by
Iain Conlon
2015
THIS PROJECT IS SUBMITTED IN PART FULFILLMENT OF
THE HETAC REQUIREMENTS FOR THE AWARD OF
BACHELOR OF SCIENCE (PHARMACEUTICAL SCIENCE)
DEGREE.
MAY, 2015
B.SC IN MEDICAL BIOTECHNOLOGY | SLIGO INSTITUTE OF TECHNOLOGY

Iain Conlon B.Sc in Medical Biotechnology
1
Declaration page
Title: To examine the photoprotective properties of four native Irish plant species on human skin
cells.
Name: Iain Conlon
ID Number: S00150397
Supervisor: James Murphy
“I hereby declare that this project is entirely my own work and that it has not been submitted for any
other academic award, or part therof, at this or any other education establishment”.
_____________________
Iain Conlon

Iain Conlon B.Sc in Medical Biotechnology
2
Acknowledgements
I would like to thank my supervisor, James Murphy, for the help he has given to me over the last four
months of work and the basis he has given me to get going on this project. I would also like to thank
Thomas Smith on the help he has given with regards to extract creation amongst other things. I also
want to acknowledge the help of James’ MBRR centre students and lab technicians in the science
block.

Iain Conlon B.Sc in Medical Biotechnology
3
Table of Contents ................................................................................................................................................................ 0
Declaration page ..................................................................................................................................... 1
Acknowledgements ................................................................................................................................. 2
Abstract ................................................................................................................................................... 6
1. Chapter 1: Introduction ................................................................................................................... 6
2 Literature Review ............................................................................................................................ 8
2.1 Sunlight radiation, free radicals & antioxidants ...................................................................... 8
2.1.1 Sunlight Radiation........................................................................................................... 8
2.1.1.1 UV-A, UV-B and UV-C ............................................................................................. 8
2.1.1.2 UV radiations effect on cells ..................................................................................... 10
2.1.2 Reactive Oxygen Species (Free radicals) ...................................................................... 10
2.1.3 Antioxidants .................................................................................................................. 10
2.1.3.1 Mechanisms of action ............................................................................................... 11
2.2 Plant Species ......................................................................................................................... 11
2.2.1 Bilberry ......................................................................................................................... 11
2.2.2 Himalayan knotweed..................................................................................................... 12
2.2.3 Great Willowherb .......................................................................................................... 12
2.2.4 Herb Robert ................................................................................................................... 12
2.3 HaCaT Skin Cells .................................................................................................................... 12
2.4 Methods for testing cell viability / antioxidant properties .................................................... 13
2.4.1 MTT .............................................................................................................................. 13
2.4.2 Neutral Red ................................................................................................................... 13
2.4.3 Direct ROS .................................................................................................................... 13
2.4.4 Total Glutathione Assay ................................................................................................ 14
2.4.4.1 Glutathione-Glo ........................................................................................................ 14
3 Chapter 3: Experimental Report ................................................................................................... 15
3.1 Introduction ........................................................................................................................... 15
3.2 Materials and methods .......................................................................................................... 15
3.2.1 Materials ....................................................................................................................... 15
3.2.2 Making up extracts ........................................................................................................ 15
3.2.2.1 Hot Water Extracts .................................................................................................... 15
3.2.2.2 Ethyl Acetate Extracts ............................................................................................... 15
3.2.3 Cell Culture ................................................................................................................... 15
3.2.3.1 Media preparation .................................................................................................... 15
3.2.3.2 Passaging ................................................................................................................... 16

Iain Conlon B.Sc in Medical Biotechnology
4
3.2.3.3 Seeding Density Test ................................................................................................ 16
3.2.3.4 Weekly seeding ......................................................................................................... 16
3.2.4 Exposure to extracts ..................................................................................................... 17
3.2.5 Exposure to Solar Simulated Irradiation (SSI) ............................................................... 17
3.2.6 MTT cell viability assay ............................................................................................... 17
3.2.7 Statistical Analysis ........................................................................................................ 18
3.2.8 Alterations in overall method ....................................................................................... 18
3.2.8.1 Test one ..................................................................................................................... 18
3.2.8.2 Test two..................................................................................................................... 18
3.2.8.3 Test three .................................................................................................................. 18
3.2.8.4 Test four .................................................................................................................... 18
3.3 Results ................................................................................................................................... 19
3.3.1 Seeding Density Test ..................................................................................................... 19
3.3.2 Effect of exposure time to SSI on HaCaT cells............................................................... 20
3.3.3 The effect of plant extracts on HaCaT cells ................................................................... 21
3.3.4 Test 1 (24h after 20 second solar exposure) ................................................................. 22
3.3.4.1 Himalayan Knotweed ................................................................................................ 22
3.3.4.2 Great Willowherb ...................................................................................................... 23
3.3.4.3 Bilberry ...................................................................................................................... 24
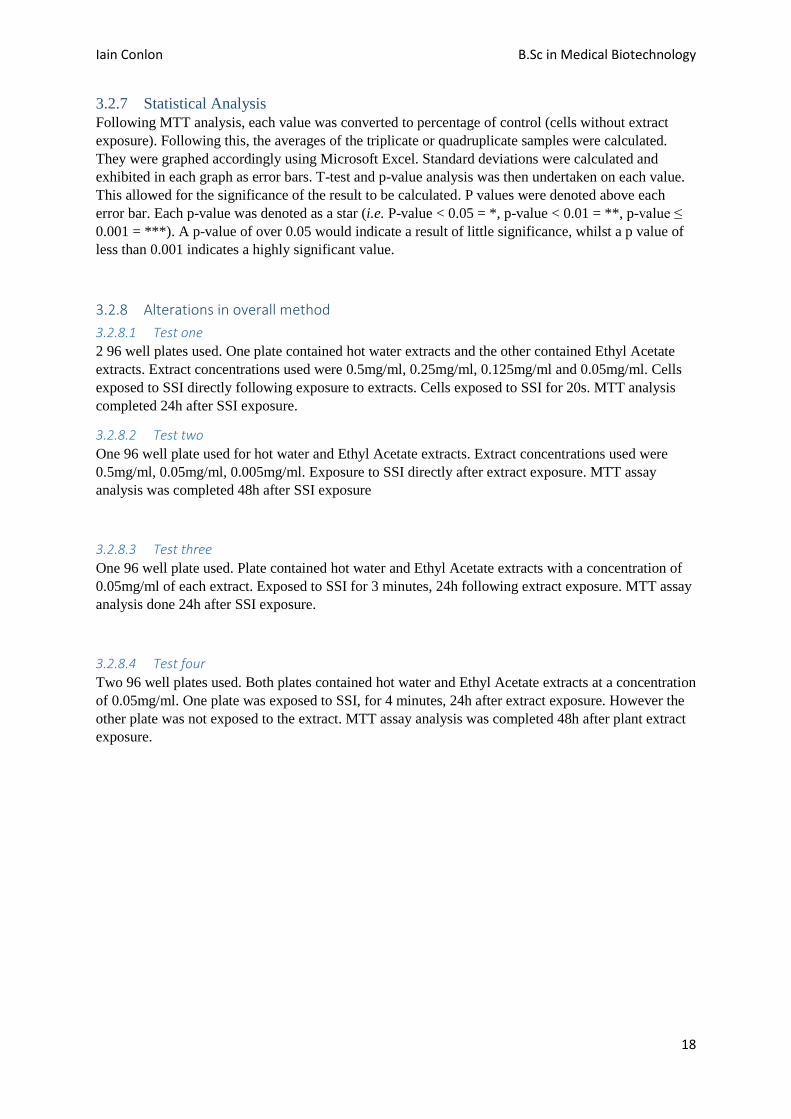
3.3.4.4 Herb Robert ............................................................................................................... 25
3.3.5 Test 2 ............................................................................................................................. 26
3.3.5.1 Himalayan Knotweed ................................................................................................ 26
3.3.5.2 Great Willowherb ...................................................................................................... 27
3.3.5.3 Bilberry ...................................................................................................................... 28
3.3.5.4 Herb Robert ............................................................................................................... 29
3.3.6 Test 3 (exposed to 0.05mg/ml extracts & exposed to SSI for 3m) ............................... 30
3.3.6.1 Himalayan Knotweed ................................................................................................ 30
3.3.6.2 Great Willowherb ...................................................................................................... 31
3.3.6.3 Bilberry ...................................................................................................................... 32
3.3.6.4 Herb Robert ............................................................................................................... 33
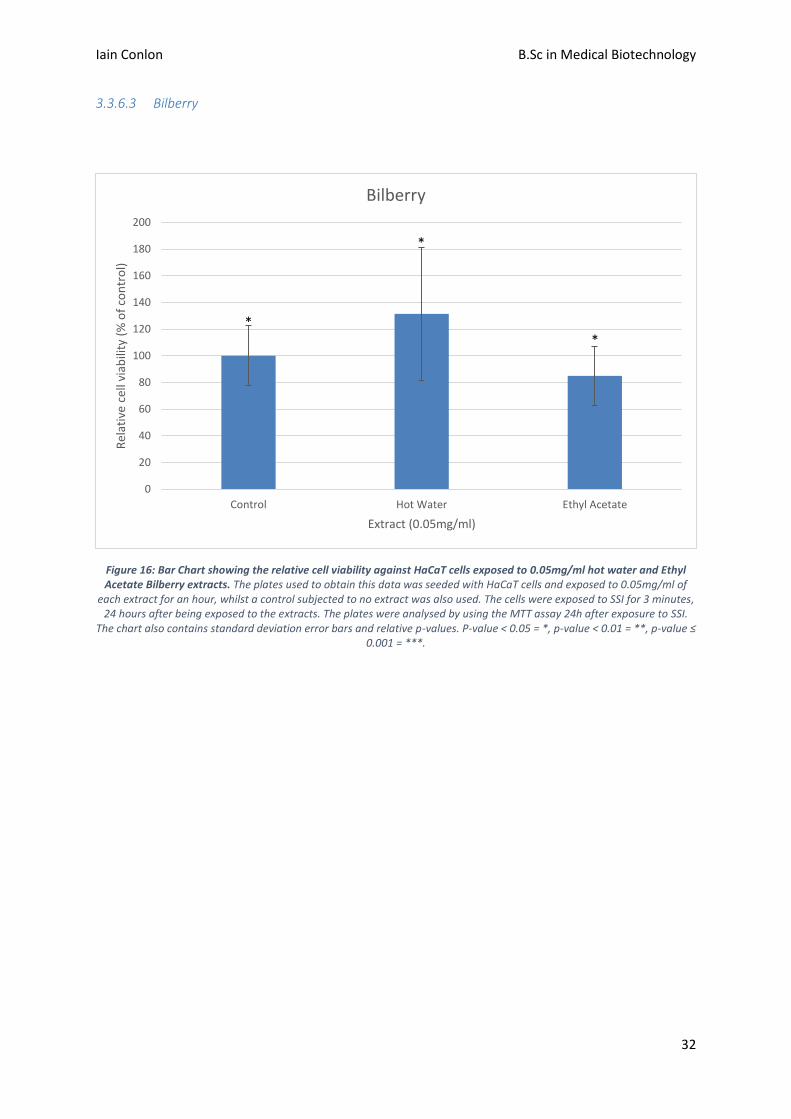
3.3.7 Test 4 (exposed to 0.05mg/ml extract & exposed to SSI for 4m) ................................. 34
3.3.8 Brief summary of results ............................................................................................... 35
3.4 Discussion ............................................................................................................................. 36
3.4.1 Seeding Density Test .................................................................................................... 36
3.4.2 Cellular exposure to SSI ............................................................................................... 36
3.4.3 Extract exposure to HaCaT cells ................................................................................... 36

Iain Conlon B.Sc in Medical Biotechnology
5
3.4.4 Exposure of cells to extracts and SSI ............................................................................ 36
3.5 Experimental summary ......................................................................................................... 38
4 Chapter 4: Overall Project Discussion and Conclusion ................................................................ 39
5 Bibliography ................................................................................................................................. 40

Iain Conlon B.Sc in Medical Biotechnology
6
Abstract The effect of solar irradiation, namely UV irradiation, can have a seriously detrimental effect on the
human skin. Problems can range from sunburn to the onset of skin cancer. In recent years, the
studying of plant species has determined that many botanicals contain protective properties that can
protect against damaging forms of solar irradiation. In this study, four native Irish plant species are
being examined for their effect on skin cells against solar irradiation. The species being looked at are
Bilberry, Great Willowherb, Herb Robert and Himalayan Knotweed. HaCaT keratinocytes were
cultured and exposed to different concentrations of hot water and ethyl acetate forms of these plant
extracts. Following exposure to extracts, the cells were then subjected to solar simulated irradiation
(SSI). The MTT assay, a cell viability assay, was used to determine the effect the plant extracts had on
cells after SSI treatment. This study has found that 0.05mg/ml of the Great Willowherb (hot water
extract) and Herb Robert (hot water and ethyl acetate extract) extracts each have cytoprotective
effects on HaCaT cells from SSI. It was also concluded that both of these extracts had some sort of
cytoproliferative effect on cells without exposure to SSI. This may indicate the presence of flavonoid
polyphenols in the plant extracts.
1. Chapter 1: Introduction This project was aimed at determining the photoprotective properties of 4 different plant extracts on
HaCaT cells. The plant extracts being studied are Himalayan Knotweed, Great Willowherb, Bilberry
and Herb Robert. To protect cells from solar irradiation, they would need to acquire an antioxidant to
prevent the damage from reactive oxygen species (ROS), or free radicals (Lobo, Patil, Phatak, &
Chandra, 2010). Reactive Oxygen Species are molecules that promote oxidative stress in cells.
Oxidative stress in cells promotes diseases such as cancer, diabetes and various neurodegenerative
diseases.
Antioxidants are known the have a protective effect in cells from free radicals, or ROS. However,
antioxidants which were synthetically created, are known to be toxic to cells in some cases (Lobo et
al., 2010) Naturally occurring antioxidants, such as vitamin C and carotenoids, are known to be
present in many plant types such as fruits and vegetables. They also provide more beneficial results
that synthetically created versions. Some of the extracts being studies, namely Bilberry, have been
known to contain antioxidants of their own.
HaCaT Keratinocyte cells were chosen for this project as they’re epidermal cells. These cells are often
used in testing that involves the biology of the skin. As the skin is the most exposed cells to solar
irradiation, it is easy to assume that these cells would be a perfect fit for this type of experiment.
The HaCaT cells are going to be kept alive through passaging throughout the experimental time for 10
weeks. In that time, cells are going to be exposed to the different extracts, both hot water and Ethyl
Acetate, giving ten extracts in total. After exposure to the extracts, the cells are going to be subjected
to solar irradiation by the use of a solar simulator (Q-Sun). Solar simulators are widely used to test
skin products on skin cells (e.g. Sun screen). The solar irradiation is expected to essentially kill the
HaCaT cells. Varying times of radiation exposure will be analysed to determine the amount of
irradiation taken to kill or inhibit untreated cells. So this experimentation is done to determine
whether the plant extracts have the ability to protect the cells from irradiation.
To determine the viability of cells following irradiation exposure, some assays can be done. Some
commonly used assays to establish cells viability would be the MTT assay, GSH assay, Neutral Red
assay and direct ROS (reactive oxygen species) determination assay (Riss et al., 2013). The MTT
assay is the cell viability assay that will be used during this experimentation. The results from the
experimentation should give information on whether the plant extracts exhibit photoprotective effects,

Iain Conlon B.Sc in Medical Biotechnology
7
or even cell growth promotion. This may indicate the presence of antioxidants such as flavonoids and
anthocyanins.
Many different variables could affect the results of this experimentation such as irradiation strength,
length of irradiation exposure, length of extract exposure, cell viability at the time of final analysis,
amongst others. These factors will be taken into account throughout the experimentation.
The overall aim of this experiment is to how much solar irradiation it takes to kill HaCaT cells and to
determine which extracts (at different concentrations) have a photoprotective effect on the cells. It
may also be determined which extract concentrations have a cytotoxic effect on the cells.

Iain Conlon B.Sc in Medical Biotechnology
8
2 Literature Review
2.1 Sunlight radiation, free radicals & antioxidants
2.1.1 Sunlight Radiation
2.1.1.1 UV-A, UV-B and UV-C
The sun emits radiation from many wave ranges in the electromagnetic spectrum including infrared
(IR), visible, gamma and ultraviolet (UV). However, only IR, UV and visible rays reach the surface
of the earth. The radiation that is relevant in this experiment is UV radiation.
Iain Conlon B.Sc in Medical Biotechnology
9
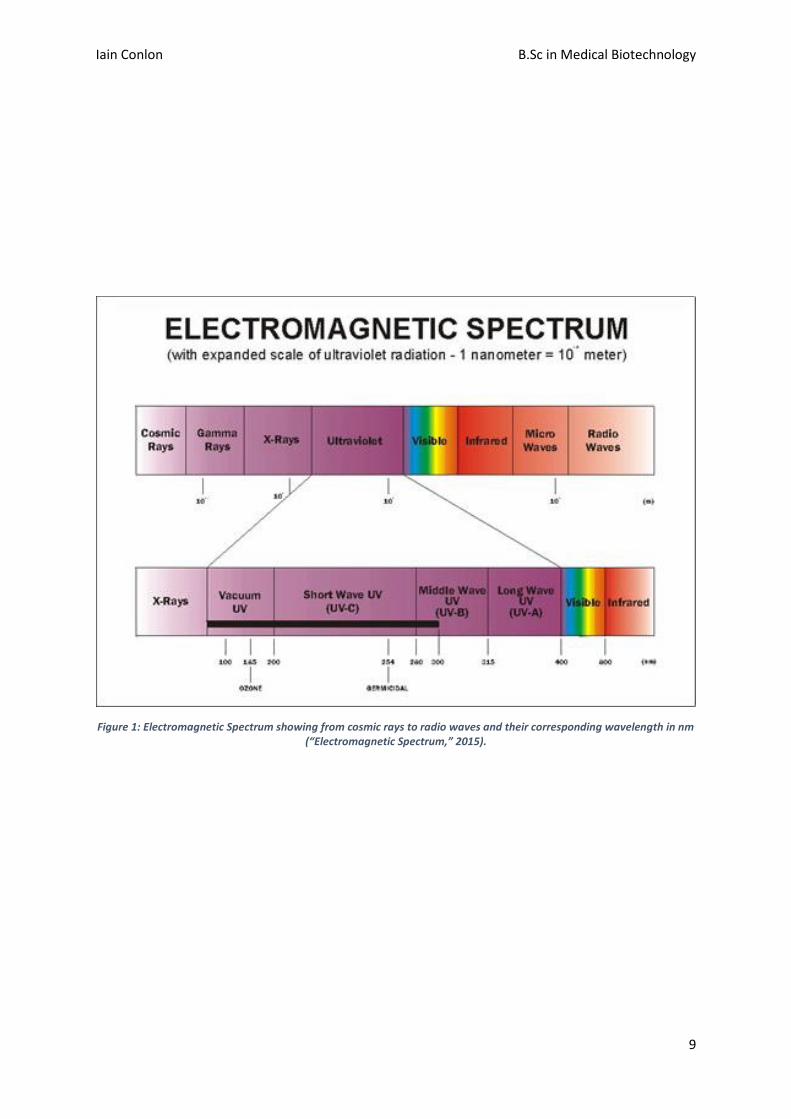
Figure 1: Electromagnetic Spectrum showing from cosmic rays to radio waves and their corresponding wavelength in nm (“Electromagnetic Spectrum,” 2015).

Iain Conlon B.Sc in Medical Biotechnology
10
As it can be seen in Figure 1, UV radiation is located between visible rays and x-rays. The UV
spectrum can be separated into four different regions including UV-A, UV-B, UV-C and vacuum UV.
The wavelength of the different UV rays decrease the further down the spectrum the go from visible
rays. UV-A radiation includes wavelengths between 315nm and 400nm. UV-B radiation is between
280nm and 315nm. UV-C radiation is between 200nm and 280nm (“Electromagnetic Spectrum,”
2015).
UV radiation is well known to help produce vitamin D in the body as mentioned by Holick (2008),
and is also used to treat certain diseases like jaundice and eczema (“WHO | Health effects of UV
radiation,” 2015). However, UV radiation also has many negative effects. It is well known that
overexposure to UV radiation can cause problems like sunburn, skin cancer (melanomas), and other
forms of problems related to skin cells (“WHO | Health effects of UV radiation,” 2015). This
radiation can also cause non-skin related problems like cataracts and eye inflammation.
2.1.1.2 UV radiations effect on cells
As the UV radiation wavelength is smaller than other forms of waves, the UV waves have the ability
to interact intracellular structures and molecules. The fact that these waves are extremely high in
energy poses a problem. UV radiation can damage DNA by interacting with it to cause an increase in
the amount of thymine dimers in the cell (SETLOW & SETLOW, 1962). This increase in thymine
dimers causes DNA to be much less efficient in transforming or performing self-repair. Another major
problem that UV radiation can cause skin cells is the formation of free radicals. Free radical formation
can occur from exposure to UV-A and UV-B radiation waves (Tyrrell, 1995).
2.1.2 Reactive Oxygen Species (Free radicals)
Free radicals are atoms that are highly reactive due to their lack of a paired electron. These interact
with molecules causing the molecules to lose an electron, and becoming a radical itself. This
interaction can keep occurring as molecules will keep losing electrons to the resulting free radicals,
like a domino effect. The effects of free radicals in cells cause an increase of oxidative stress (Lü, Lin,
Yao, & Chen, 2010), and ultimately will damage cellular DNA.
2.1.3 Antioxidants
Antioxidants are compounds that have the ability to neutralise free radical damage from reactive
oxygen species (ROS) or reactive nitrogen species (RNS). The neutralisation of the free radicals help
prevent them causing damage to cells. Antioxidants work on ROS and RNS in a variety of ways;
primary antioxidants have the ability to donate an electron to the free radical; Secondary antioxidants
can remove a ROS / RNS by quenching the chain initiating catalyst. Other mechanisms include metal
ion chelation, co-antioxidants, electron donation and gene expression regulation (Lobo et al., 2010).
Antioxidants may be synthetic (e.g. tert-butylhydroxyanisole) or natural in types. However, studies
have found that synthetic forms of antioxidants may be toxic to humans (Lobo et al., 2010). Because
of this, there has been a major interest in naturally occurring antioxidant-containing fruits and plants.
Plants or fruits containing vitamin C, vitamin E and glutathione are known to have high antioxidant
content due to the presence of these molecules. There is a huge degree of research being done into
plants with potential antioxidative properties in the scientific industry today.

Iain Conlon B.Sc in Medical Biotechnology
11
Each different antioxidant may exhibit a different method of protecting cells from free radical related
oxidative damage, as mentioned above. Two of the main mechanisms of antioxidant action are direct
free radical scavenging and metal ion chelating.
2.1.3.1 Mechanisms of action
Free radical scavenging involves the antioxidant locating and binding to the reactive oxygen species.
This antioxidant binding causes the previous free radical to be neutralised and therefore ineffective in
causing cellular damage. Free radical scavenging may entail superoxide radical scavenging, hydroxyl
radical scavenging, hydrogen peroxide scavenging and more (Sanchez-Moreno, 2002), depending on
the antioxidant involved. Some methods of detecting free radical scavenging include the oxygen
radical absorbance assay (ORAC), total antioxidant scavenging assay (TOSCA) and total radical
trapping antioxidant parameter assay (Hoelzl et al., 2005).
2.2 Plant Species Many plant species are known to have therapeutic effects to humans. Many popular foods are eaten
due to their antioxidant contents in them. In the scientific community, plant extracts are persistently
tested for their possible therapeutic and protective effects to humans and animals. The plants being
studied in this report are Bilberry, Great Willowherb, Himalayan Knotweed and Herb Robert.
2.2.1 Bilberry
The bilberry plant, also known as Vaccinium myrtillus L., is a berry-containing shrub which can be
located across northern parts of America, Europe (including Ireland) and Asia. The Bilberry plant is
well known for having a similarity in fruits to the American Blueberry.
Bilberry plants are well known to have a good polyphenolic content (Seeram, 2008). Polyphenols are
naturally occurring micronutrients that may act as antioxidants. They are secondary metabolites and
because of the polyphenolic properties, the bilberry plant has a high content of antioxidants, and
therefore may be helpful in protection against ultraviolet radiation. Bilberry is thought to have a
number of different positive effects to humans (Chu, Cheung, Lau, & Benzie, 2011). They have been
widely used to help improve eyesight, decrease blood glucose, and prevent inflammation and lower
oxidative stress. Studies also suggest that Bilberry may have cardio-protective effects (Žiberna,
Lunder, Može, Vanzo, & Drevenšek, 2009) and that bilberry also has antimicrobial properties (Vučić
et al., 2013).
Flavonoids and anthocyanins are the polyphenols that are most abundant in Bilberry plants.
Flavonoids are the polyphenols that are usually associated with Bilberry. They are seen to be present
in thousands of other fruits and plants. They not only act as antioxidants, but as photo-protectors and
antimicrobials too (Pietta, 2000). However, the anthocyanins are also highly potent antioxidants that
have the ability to scavenge free radicals and chelate metal ions (Pool-Zobel, Bub, Schröder, &
Rechkemmer, 1999). Anthocyanins are also known for their superior bioavailability due to their rapid
ability to be absorbed by without any needed structural changes (Prior & Wu, 2006). Chu et al.
(2011) mentions that the anthocyanins present in Bilberry protects apolipoprotein B, known for its
role in lipid transport and as lipid ligands, against oxidative UV damage as well as protects rat liver
cells again oxidation. A similar, but more relevant, study suggests that bilberry has cytoprotective
effects on HaCaT cells after exposure to UV-A irradiation (Svobodová, Rambousková, Walterová, &
Vostalová, 2008).

Iain Conlon B.Sc in Medical Biotechnology
12
These studies indicate that the Bilberry plant would be an ideal subject for this in-vitro analysis.
2.2.2 Himalayan knotweed
Himalayan Knotweed, also known as Persicaria wallichii, is a leaved plant which is natively found
growing in the Himalayan mountain range from Afghanistan to China. It may also be found in Ireland
but it is quite rare (“Himalayan knotweed | Invasive species list | Fisheries Research,” 2015). This
plant can grow up to 2m high in a bush formation. There is no known therapeutic properties
associated with Himalayan Knotweed.
2.2.3 Great Willowherb
The Great Willowherb plant, or Epilobium hirsutum, is a flowering herb that have a woolly stem and
leaf. They can grow up to 2m in height and are present as flora from Europe to temperate Asia. The
leaf of Great Willowherb plants are often drank in a tea for its believed anti-inflammatory
characteristics. The Epilobium spp. are known to contain anti-inflammatory, antimicrobial and
antioxidative characteristics. Kiss et al. (2011) states that the Willowherb is rich in flavonoid
Polyphenols. The amount of flavonoids found in Epilobium spp. is thought to be 25% of total
polyphenols (Tamas et al., 2009). This information indicates that the polyphenols act as free radical
scavengers. As these polyphenols have a good reputation of being an effective antioxidant, it is
considered to be a good candidate for this experiment.
2.2.4 Herb Robert
Herb Robert, also known as Geranium robertianum, comes from the cranesbill species of plant and is
native to most of Europe and some part of Asia. It contains a hairy fruit and pink or orange flowers
(TOFTS, 2004). Herb Robert is known to contain polyphenolic compounds such as flavonoids and
phenolic acids (Miliauskas et. al., 2004). A study carried out by Neagu, Paun, Constantin, & Radu
(2013) studied the antioxidant properties of Herb Robert via a DPPH assay (2,2-diphenyl-1-
picrylhydrazyl) and cellular tests on Hep-2p cells with a following MTT assays. They tested aqueous
Herb Robert extract samples for concentrations ranging from 100ug/ml to 2000ug/ml (0.2mg/ml). It
was determined that the higher concentrations of the extract exhibited high amounts of polyphenols
(DPPH assay) present with a high antioxidant effect, as well as having a positive impact on cell
viability (MTT assay).
The fact that polyphenols are present in many of these extracts indicates that they may have the ability
to be beneficial, depending on their bioavailability. Polyphenols have the ability to be photoprotectors
(protective screens from UV), antioxidants and even cytoproliferative. Overall, this information
makes these plant extracts seem like good candidates for the in-vitro testing of their photoprotective
and antioxidative effects on cells
2.3 HaCaT Skin Cells For in-vitro testing of skin cells, HaCaT cells are an ideal model. HaCaT Keratinocyte cells are an
immortal cell line which is often used in the experimentation of the skin (Wilson, 2014). These
epidermal cells have often been used in the past to test the effect of both extract exposure and solar
irradiation exposure to them.

Iain Conlon B.Sc in Medical Biotechnology
13
2.4 Methods for testing cell viability / antioxidant properties Cell viability assays are commonly used to determine whether external molecules or compounds have
a protective or toxic effect on cells. The assays test the viability of cells through determination of the
amount active cells present in a sample, and using a control of cells without treatment of compounds.
These assays are often done on 96 well plates, which allows for rapid testing of hundreds of samples.
Cell viability may be determined through the determination of the activity of organelles, expression of
genes and protein function (Riss et al., 2013). Different assays use varying pathways to determine
viability, and listed below are some methods.
2.4.1 MTT
The MTT, or 3-(4,5-dimethylthiazol-2-yl)-2,5-diphenyltetrazolium bromide, assay is a tetrazaolium
based assay along with MTS and XTT. The MTT assay is a very popular assay that is used quite
commonly. It is an assay used to determine cell viability. MTT is added to a sample and viable cells
have the ability to convert MTT into a purple product called formazan (SigmaAldrich, 2015). The
way in which formazan is created is not known, but it is thought that it has something to do with the
mitochondria. The amount of purple formazan is going to be directly proportional to the amount of
viable cells in the sample. Formazan concentration can be found by reading the absorbance in a
spectrophotometer between 540nm and 600nm. Background can also be tested at 630nm. (Riss et al.,
2013)
2.4.2 Neutral Red
The neutral red re-uptake assay is performed on cell samples to indirectly determine the amount of
viable cells in the sample. This assay is useful because it removes the need to do cell counting using a
haemocytometer or automated counter. This assay works by measuring the amount of vital dye
neutral red that was taken up by cells in a sample. The neutral red is taken up by active transport by
viable cells. Dead cells won’t be able to take up the NR due to no active transport being possible. The
cells are all then fixed and washed. The dye is then extracted from the cells using acidified ethanol
(solubilisation solution). The sample is then measured for its absorbance at 540nm (690nm is
reference point) to determine the amount of neutral red present (Riss et al., 2013).
2.4.3 Direct ROS
This kind of assay would be used to directly determine the amount of reactive oxygen species inside
cells. An example of a ROS kit is the DCFDA - Cellular Reactive Oxygen Species Detection Assay
Kit.
This kit uses dichlorofluorescin diacetate (DCFDA). This is a florescent dye that helps measure ROS
inside the cells. This chemical enters the cell and is deacetylated by esterases within the cell and is
then oxidized into dichlorofluorescein (DCF) by ROS within the cell. DCF is highly fluorescent and
can then be detected by spectroscopy. The amount of active ROS inside the cell is directly
proportional to the absorbance at lambdaMAX (Ross & Tabrizi, 2011) (Eruslanov & Kusmartsev,
2010).

Iain Conlon B.Sc in Medical Biotechnology
14
2.4.4 Total Glutathione Assay
The total glutathione, or GSH assay, is used to measure the total concentration of GSH, or
glutathione, in cells. This molecule is a primary non-protein sulfhydryl in aerobic organisms and it is
synthesized in most cells. GSH has many functions on the cell including acting as a co-factor
metabolic enzymes and acting as an antioxidant.
2.4.4.1 Glutathione-Glo
The GSH assay is a assay that uses luminescence to determine GSH levels in a sample. A change in
GSH levels may indicate oxidative stress. This assay works on the basis that a certain luciferin
derivative is converted in to luciferin in the presence of GSH, and this reaction is catalysed by the
enzyme glutathione S-transferase. The luciferin which is formed in the sample can be detected in a
coupled reaction that uses recombinant luciferinase. A luminescent glow is then formed. The amount
of luminescence is proportional to the concentration of GSH is the cell sample.

Iain Conlon B.Sc in Medical Biotechnology
15
3 Chapter 3: Experimental Report
3.1 Introduction This chapter of consists of the experimentation to determining the photoprotective properties of
bilberry, herb robert, great willowherb and Himalayan knotweed on HaCaT cells. These extracts were
exposed to the cells and were then exposed to simulated solar irradiation for a certain time. A cell
viability assay was then be used to determine the relative cell viability of cells exposed to extracts
were in comparison to cells which were not exposed to SSI. The results helped determine which cells
may be useful in the future as a therapeutic agent.
3.2 Materials and methods
3.2.1 Materials
Dulbecco’s Modified Eagle’s Medium (DMEM) media, Q-Sun test chamber – Model Xe1b (Q-Lab,
2015) (Settings: 0.55 w/m2 @ 340nm; 34oC), HaCaT Keratinocyte Cells derived from the
Mitochondrial Biology and Radiation Research Centre in IT Sligo (MBRR), hot water and ethyl
acetate plant extracts (Bilberry, Himalayan Knotweed, Great Willowherb, Herb Robert), 3-(4,5-
dimethylthiazol-2-yl)-2,5-diphenyltetrazolium (MTT) frozen salt, Phosphate Buffered Saline (PBS)
Trypsin EDTA, Dimethyl Sulfoxide (DMSO), 70% Isopropyl alcohol (IPA), plastic bottles (10ml,
20ml and 40ml), T-75 cell culturing flasks, 96 well plates, Disposable pipette and auto-pipette tips
(100ul, 1000ul, 10ml & 20ml), 10ml glass bottles, Sample concentrator.
3.2.2 Making up extracts
3.2.2.1 Hot Water Extracts
10mg of dried extract was weighed out in a 10ml glass bottle. The amount of sterile water needed to
make up a 2mg/ml solution of extract was then calculated. The correct volume of sterile water was
added to the extract in the 10ml glass bottle. The solution was then mixed. This process was repeated
for the remaining three extracts
3.2.2.2 Ethyl Acetate Extracts
The weight of a 10ml glass bottle was determined before the addition of 200 – 500ul of aqueous
extract was added to the bottle. The extract containing bottle was then put into a sample concentrator,
which added nitrogen to the solution and dried the sample completely. The bottle was weighed again
to determine the weight of extract in the bottle. The amount of water and DMSO to add to the extract,
to make a 2mg/ml solution with 1% DMSO, was then determined. The correct volume of DMSO was
added to the dried extract for 24h. After 24h, the correct volume of sterile water was then added to the
extract / DMSO mixture in the bottle. The solution was then mixed. This method was repeated for all
3 remaining extracts
3.2.3 Cell Culture
3.2.3.1 Media preparation
500 ml of DMEM media was supplemented with FBS, Pen-Strep and L-glutamine to contain 10%
FBS, 1% Pen-strep and 2mM L-glutamine. This solution was then mixed to ensure even mixture of
media and supplements. Media was refrigerated at 3oC when not being used and it was warmed up to
37oC using a water bath before its use with cells.

Iain Conlon B.Sc in Medical Biotechnology
16
3.2.3.2 Passaging
The laminar flow cabinet was cleaned well before its use using 70% IPA. All needed materials were
then sprayed with 70% IPA and moved into the laminar flow cabinet. The media in the cell containing
T-25 flask was poured into a waste beaker. The flask was then washed with 5ml of PBS to eliminate
any traces of media in the flask. The PBS was then poured out before the addition of 5ml of trypsin.
The flask was then mixed around to ensure the equal spread of trypsin and then placed in the
incubator for 10-15 minutes, to allow for detachment of cells from the surface of the flask. Once
detached, 5ml of DMEM media was added to the flask to inactivate the trypsin. The cell suspension
mixture was then placed into a 20ml plastic centrifugation tube. The cells were then centrifuged for 5
minutes at 3’000 RPM. After the centrifugation, the supernatant was poured off and the remaining
pellet was re-suspended in 1ml of DMEM media. About 200ul of the cell suspension was then added
to a T-75 flask and 20ml of DMEM media was added on top of that. The flask was then incubated.
This passaging technique was repeated every 4-5 days to prevent overgrowth of cells in the flask,
which would cause cell death.
3.2.3.3 Seeding Density Test
100ul of the cell suspension was diluted in 900ul of media to give a 1:10 dilution. This 1:10 cell
suspension was then mixed thoroughly. 12ul of this dilution was taken from the suspension and the
cells were counted via the haemocytometer method. The cell count per 1ml suspension was then
calculated using the following equation:
𝐶𝑒𝑙𝑙 𝑐𝑜𝑢𝑛𝑡 × 𝐷𝑖𝑙𝑢𝑡𝑖𝑜𝑛 𝑓𝑎𝑐𝑡𝑜𝑟 (10) × 10000 = 𝑁𝑜.𝑐𝑒𝑙𝑙𝑠
𝑚𝑙𝑜𝑓 𝑠𝑢𝑠𝑝𝑒𝑛𝑠𝑖𝑜𝑛
To determine the volume of cell suspension needed to seed a certain amount of cells in a well, the
following equation was then used:
1000𝑢𝑙
𝑛𝑜. 𝑐𝑒𝑙𝑙𝑠 𝑝𝑒𝑟 𝑚𝑙× 𝑁𝑜. 𝑐𝑒𝑙𝑙𝑠 𝑛𝑒𝑒𝑑𝑒𝑑 𝑡𝑜 𝑠𝑒𝑒𝑑 = 𝑉𝑜𝑙𝑢𝑚𝑒 𝑜𝑓 𝑐𝑒𝑙𝑙 𝑠𝑢𝑠𝑝𝑒𝑛𝑠𝑖𝑜𝑛 𝑡𝑜 𝑎𝑑𝑑
This formula was used to determine the volume of cell suspension needed to seed 30’000 cells/well,
20’000 cells/well, 15’000 cells/well, 10’000 cells/well, 5’000 cells/well, 4’000 cells/well and 2’000
cells/well. Each of these numbers of cells were done in quadruplicate. The plate was checked every
day to determine the confluence of cells in each well. The original seeding count of cells which had
60% - 80% confluence after 3 – 5 days (depends on when cell analysis was to be done) was the
seeding density used each week for the 96 well plates.
3.2.3.4 Weekly seeding
Each well was seeded with the correct seeding volume to ensure correct confluence on the day of
analysis (see seeding density equation above). All wells that were seeded were made up to 200ul with
DMEM media. 96-well plate was then incubated for 48h. After incubation, plates were removed from
the incubator and were ready to be exposed to extract.

Iain Conlon B.Sc in Medical Biotechnology
17
3.2.4 Exposure to extracts After incubation, the 96 well plate was taken to the laminar flow cabinet. 100ul of media was taken
from each well. 100ul of extracts solution was added to the cells. Control wells were also used which
contained Cells & media (added 100ul water). Plates were then placed back in the incubator for 1h.
Following incubation, all media and extract was removed from the cells and replaced with either PBS
(if cells were going to be exposed to solar simulated irradiation following extract exposure) or DMEM
media (if cells were going to be exposed to SSI the day following extract exposure).
3.2.5 Exposure to Solar Simulated Irradiation (SSI) Either directly after extract exposure or 24h after extract exposure, cells were taken from the
incubator. All media covering cells must be removed from the cells and replaced with 200ul PBS.
Plates were taken to the Q-Sun solar simulation chamber. The Q-Sun chamber had the following
settings:
Figure 2: Q-Sun Solar Irradiation Chamber settings. These settings (set) were used each time that cell-containing plates were to be exposed to solar simulated irradiation (SSI)
Q-Sun simulator was turned on and allowed to reach required irradiance and wavelength of 0.55w/m2
and 340nm (UV-A waves) respectively. Once the irradiance value had evened out at 0.55w/m2, cells
were put in to the chamber for a set time (20s, 180s or 220s). Cells were then taken from the chamber.
PBS was removed from the cells and replaced with 200ul DMEM media. Cells were then incubated
for 24h or 48h.
3.2.6 MTT cell viability assay Frozen MTT salts were dissolved in PBS. 5mg of MTT was added to each 1ml of PBS.
After previous incubation period, 96 well plate samples were taken to the laminar flow cabinet. 20ul
of MTT solution was then added to each 200ul well. The plates were returned to the incubator @
37oC for 4 hours. Following incubation, wells were emptied and washed with 200ul of PBS. PBS was
removed from the wells. 200ul DMSO was then added to each well to solubilize the formazan
crystals. Plates were covered with foil and placed on a mechanical shaker for 30 minutes. The plates
were then taken to the 96 well plate spectrophotometer and measured between 540nm and 590nm
(SigmaAldrich, 2015).
Iain Conlon B.Sc in Medical Biotechnology
18
3.2.7 Statistical Analysis
Following MTT analysis, each value was converted to percentage of control (cells without extract
exposure). Following this, the averages of the triplicate or quadruplicate samples were calculated.
They were graphed accordingly using Microsoft Excel. Standard deviations were calculated and
exhibited in each graph as error bars. T-test and p-value analysis was then undertaken on each value.
This allowed for the significance of the result to be calculated. P values were denoted above each
error bar. Each p-value was denoted as a star (i.e. P-value < 0.05 = *, p-value < 0.01 = **, p-value ≤
0.001 = ***). A p-value of over 0.05 would indicate a result of little significance, whilst a p value of
less than 0.001 indicates a highly significant value.
3.2.8 Alterations in overall method
3.2.8.1 Test one
2 96 well plates used. One plate contained hot water extracts and the other contained Ethyl Acetate
extracts. Extract concentrations used were 0.5mg/ml, 0.25mg/ml, 0.125mg/ml and 0.05mg/ml. Cells
exposed to SSI directly following exposure to extracts. Cells exposed to SSI for 20s. MTT analysis
completed 24h after SSI exposure.
3.2.8.2 Test two
One 96 well plate used for hot water and Ethyl Acetate extracts. Extract concentrations used were
0.5mg/ml, 0.05mg/ml, 0.005mg/ml. Exposure to SSI directly after extract exposure. MTT assay
analysis was completed 48h after SSI exposure
3.2.8.3 Test three
One 96 well plate used. Plate contained hot water and Ethyl Acetate extracts with a concentration of
0.05mg/ml of each extract. Exposed to SSI for 3 minutes, 24h following extract exposure. MTT assay
analysis done 24h after SSI exposure.
3.2.8.4 Test four
Two 96 well plates used. Both plates contained hot water and Ethyl Acetate extracts at a concentration
of 0.05mg/ml. One plate was exposed to SSI, for 4 minutes, 24h after extract exposure. However the
other plate was not exposed to the extract. MTT assay analysis was completed 48h after plant extract
exposure.

Iain Conlon B.Sc in Medical Biotechnology
19
3.3 Results
3.3.1 Seeding Density Test This test was done to determine cell growth rate and to observe the number of days it takes a cell
culture (of a specific starting density) to reach 60% - 80% confluence, Varying numbers of seeding
density were seeded in wells in quadruplicate on day 0. Each following day, each wells confluence
was measured. This was done for 6 days and the following graph was obtained.
Figure 3: Seeding density test scatter plot. HaCaT cell solutions of varying concentrations were made up and were seeded in quadruplicate into wells on a 96 well plate. The concentrations used were 2’000 cells/100ul, 4’000 cells/100ul, 5’000
cells/100ul, 10’000 cells/100ul, 15’000 cells/100ul, 20’000 cells/100ul and 30’000 cells/100ul. Each well consisting of 100ul of cell suspension solution was then made up to 200ul using DMEM media. Over 6 days following seeding, the percentage
confluency (%) of the cells in the wells were measured.
0
20
40
60
80
100
120
0 1 2 3 4 5 6 7
Per
cen
t C
on
flu
ency
(%
)
Time (days)
Seeding Density Scatter Plot
2k
4k
5k
10k
15k
20k
30k
Cells Seededper well

Iain Conlon B.Sc in Medical Biotechnology
20
3.3.2 Effect of exposure time to SSI on HaCaT cells This test was completed over the course of the experimental weeks, as exposure time of SSI increased
as the weeks passed. This graph was inserted to show the clear toxic effect that SSI has on HaCaT
keratinocytes.
Figure 4: Line graph showing the absorbance following MTT assay on cells against SSI exposure time of the cells. HaCaT cells were adequately seeded to allow for correct confluence on the day of viability determination via MTT assay. Cells were exposed to SSI for varying times to determine the cytotoxic effect of the SSI on the cells. The control was not exposed
to SSI. Control, 160s and 220s were measured at 584nm following MTT assay, whilst 20s was measured at 540nm. Error bars were included to show the standard deviation of the results. This was done in triplicate.
0
0.2
0.4
0.6
0.8
1
1.2
1.4
1.6
1.8
Control 20 sec 160 sec 220 sec
Ab
sorb
ance
(A
u)
Time of exposure to SSI
Line graph showing the effect of different SSI times on HaCaT cells

Iain Conlon B.Sc in Medical Biotechnology
21
3.3.3 The effect of plant extracts on HaCaT cells One 96 well plates used. Plate contained hot water and Ethyl Acetate extracts at a concentration of
0.05mg/ml. 48h after extract exposure. MTT assay analysis was completed 48h after plant extract
exposure.
Figure 5: Bar Chart showing the relative cell viability following an MTT assay on HaCaT cells that were exposed to 0.05mg/ml of each extract 48h prior to assay, without exposure to SSI. The plates used to obtain this data were seeded with 3’000 HaCaT cells per well and exposed to 0.05mg/ml of each extract for an hour, whilst a control subjected to no extract was also used. The plates were analysed by using the MTT assay 48h after exposure to extracts.. The chart also
contains standard deviation error bars and relative p-values. P-value < 0.05 = *, p-value < 0.01 = **, p-value ≤ 0.001 = ***.
0
100
200
300
400
500
600
700
800
900
Control HimalayanKnotweed
(hot water)
GreatWillowherb(hot water)
Bilberry(hot water)
HerbRobert (hot
water)
HimalayanKnotweed
(ethylacetate)
GreatWillowherb
(ethylacetate)
Bilberry(ethyl
acetate)
HerbRobert(ethyl
acetate)
% o
f co
ntr
ol
Extract samples (0.5mg/ml)
HaCaT cells exposed to extracts without exposure to SSI
**
**
*
**
** *** ****

Iain Conlon B.Sc in Medical Biotechnology
22
3.3.4 Test 1 (24h after 20 second solar exposure) 2 96 well plates used. One plate contained hot water extracts and the other contained Ethyl Acetate
extracts. Extract concentrations used were 0.5mg/ml, 0.25mg/ml, 0.125mg/ml and 0.05mg/ml. Cells
exposed to SSI directly following exposure to extracts. Cells exposed to SSI for 20s. MTT analysis
completed 24h after SSI exposure. Plates analysed at 540nm.
3.3.4.1 Himalayan Knotweed
0
20
40
60
80
100
120
Control 0.05 0.125 0.25 0.5
Rel
ativ
e ce
ll vi
abili
ty (
% o
f co
ntr
ol)
Concentration of extract (mg/ml)
Himalayan Knotweed (hot water)
**
0
20
40
60
80
100
120
140
160
Control 0.05 0.125 0.25 0.5
Rel
ativ
e ce
ll vi
abili
ty (
% o
f co
ntr
ol)
Concentration of extract (mg/ml)
Himalayan Knotweed (ethyl acetate)
***
*
Figure 6: Bar Charts showing the relative cell viability against HaCaT cells exposed to hot water and Ethyl Acetate Himalayan Knotweed extracts of varying concentrations. The plates used to
obtain this data were seeded with HaCaT cells and exposed to 0.05mg/ml, 0.125mg/ml, 0.25mg/ml and 0.5mg/ml of each extract for an hour, whilst a control, subjected to no extract, was also used. The cells were exposed to SSI for 20 seconds, 1 hour after being exposed to the
extracts. The plates were analysed by using the MTT assay 24h after exposure to SSI. The charts also contains standard deviation error bars and relative p-values. P-value < 0.05 = *, p-value < 0.01
= **, p-value ≤ 0.001 = ***.

Iain Conlon B.Sc in Medical Biotechnology
23
3.3.4.2 Great Willowherb
0
20
40
60
80
100
120
0 0.05 0.125 0.25 0.5
Rel
ativ
e ce
ll vi
abili
ty (
% o
f co
ntr
ol)
Concentration of extract (mg/ml)
Great Willowherb (hot water)
**
0
20
40
60
80
100
120
140
160
0 0.05 0.125 0.25 0.5
Rel
ativ
e ce
ll vi
abili
ty (
% o
f co
ntr
ol)
Concentration of extract (mg/ml)
Great Willowherb (ethyl acetate)
*
*
*
Figure 7: Bar Charts showing the relative cell viability against HaCaT cells exposed to hot water and Ethyl Acetate Great Willowherb extracts of varying concentrations. The plates used to
obtain this data were seeded with HaCaT cells and exposed to 0.05mg/ml, 0.125mg/ml, 0.25mg/ml and 0.5mg/ml of each extract for an hour, whilst a control, subjected to no extract, was also used. The cells were exposed to SSI for 20 seconds, 1 hour after being exposed to the
extracts. The plates were analysed by using the MTT assay 24h after exposure to SSI. The charts also contains standard deviation error bars and relative p-values. P-value < 0.05 = *, p-value < 0.01
= **, p-value ≤ 0.001 = ***.

Iain Conlon B.Sc in Medical Biotechnology
24
3.3.4.3 Bilberry
0
20
40
60
80
100
120
Control 0.05 0.125 0.25 0.5
Rel
ativ
e ce
ll vi
abili
ty (
% o
f co
ntr
ol)
Concentration of extract (mg/ml)
bilberry (hot water)
** *
*
0
50
100
150
200
250
Control 0.05 0.125 0.25 0.5
Rel
ativ
e ce
ll vi
abili
ty (
% o
f co
ntr
ol)
Concentration of extract (mg/ml)
Bilberry (ethyl acetate)
* *
**
Figure 8: Bar Charts showing the relative cell viability against HaCaT cells exposed to hot water and Ethyl Acetate Bilberry extracts of varying concentrations. The plates used to obtain this data were seeded with HaCaT cells and exposed to 0.05mg/ml, 0.125mg/ml, 0.25mg/ml and 0.5mg/ml of each extract for an hour, whilst a control, subjected to no extract, was also used. The cells were
exposed to SSI for 20 seconds, 1 hour after being exposed to the extracts. The plates were analysed by using the MTT assay 24h after exposure to SSI. The charts also contains standard deviation error
bars and relative p-values. P-value < 0.05 = *, p-value < 0.01 = **, p-value ≤ 0.001 = ***.
Iain Conlon B.Sc in Medical Biotechnology
25
3.3.4.4 Herb Robert
0
20
40
60
80
100
120
Control 0.05 0.125 0.25 0.5
Rel
ativ
e ce
ll vi
abili
ty (
of
tro
ntr
ol)
Concentration of extract (mg/ml)
Herb Robert (hot water)
**
*
0
50
100
150
200
250
300
Control 0.05 0.125 0.25 0.5
Rel
ativ
e ce
ll vi
abili
ty (
of
con
tro
l)
Concentration of extract (mg/ml)
Herb Robert (ethyl acetate)
* ** *
Figure 9: Bar Charts showing the relative cell viability against HaCaT cells exposed to hot water and Ethyl Acetate Herb Robert extracts of varying concentrations. The plates used to obtain this
data were seeded with HaCaT cells and exposed to 0.05mg/ml, 0.125mg/ml, 0.25mg/ml and 0.5mg/ml of each extract for an hour, whilst a control, subjected to no extract, was also used. The
cells were exposed to SSI for 20 seconds, 1 hour after being exposed to the extracts. The plates were analysed by using the MTT assay 24h after exposure to SSI. The charts also contains standard
deviation error bars and relative p-values. P-value < 0.05 = *, p-value < 0.01 = **, p-value ≤ 0.001 = ***.

Iain Conlon B.Sc in Medical Biotechnology
26
3.3.5 Test 2
One 96 well plate used for hot water and Ethyl Acetate extracts. Extract concentrations used were
0.5mg/ml, 0.05mg/ml, 0.005mg/ml. Exposure to SSI directly after extract exposure. MTT assay
analysis was completed 48h after SSI exposure
3.3.5.1 Himalayan Knotweed
0
20
40
60
80
100
120
140
160
Control 0.005 0.05 0.5
Rel
atid
ve c
ell v
iab
ility
(%
of
con
tro
l)
Concentration of extract (mg/ml)
Himalayan Knotweed (hot water)
**
*
*
0
20
40
60
80
100
120
140
160
Control 0.005 0.05 0.5
Rel
ativ
e C
ell v
iab
ility
(%
of
con
tro
l)
Concentration of extract (mg/ml)
Himalayan Knotweed (ethyl acetate)
*
**
***
Figure 10: Bar Charts showing the relative cell viability against HaCaT cells exposed to hot water and Ethyl Acetate Himalayan Knotweed extracts of varying concentrations. The
plates used to obtain this data were seeded with HaCaT cells and exposed to 0.005mg/ml, 0.05mg/ml and 0.5mg/ml of each extract for an hour, whilst a control subjected to no extract was also used. The cells were exposed to SSI for 3 minutes, 1 hour after being exposed to the
extracts. The plates were analysed by using the MTT assay 48h after exposure to SSI. The charts also contains standard deviation error bars and relative p-values. P-value < 0.05 = *, p-
value < 0.01 = **, p-value ≤ 0.001 = ***.

Iain Conlon B.Sc in Medical Biotechnology
27
3.3.5.2 Great Willowherb
Figure 11: Bar Charts showing the relative cell viability against HaCaT cells exposed to hot water and Ethyl Acetate Great Willowherb extracts of varying concentrations. The plates
used to obtain this data were seeded with HaCaT cells and exposed to 0.005mg/ml, 0.05mg/ml and 0.5mg/ml of each extract for an hour, whilst a control subjected to no extract was also used. The cells were exposed to SSI for 3 minutes, 1 hour after being exposed to the
extracts. The plates were analysed by using the MTT assay 48h after exposure to SSI. The charts also contains standard deviation error bars and relative p-values. P-value < 0.05 = *, p-
value < 0.01 = **, p-value ≤ 0.001 = ***.
-20
0
20
40
60
80
100
120
140
160
Control 0.005 0.05 0.5
Rel
ativ
e ce
ll vi
abili
ty (
% o
f co
ntr
ol)
Concentration of extract (mg/ml)
Great Willowherb (hot water)
*
0
20
40
60
80
100
120
140
160
180
Control 0.005 0.05 0.5
Rel
ativ
e ce
ll vi
abili
ty (
% o
f co
ntr
ol)
Concentration of extract (mg/ml)
Great Willowherb (ethyl acetate)
****
*

Iain Conlon B.Sc in Medical Biotechnology
28
3.3.5.3 Bilberry
0
20
40
60
80
100
120
140
160
Control 0.005 0.05 0.5
Rel
ativ
e ce
ll vi
abili
ty (
% o
f co
ntr
ol)
Concentration of extract (mg/ml)
Bilberry (hot water)
*
****
*
0
20
40
60
80
100
120
140
160
180
200
Control 0.005 0.05 0.5
Rel
ativ
e ce
ll vi
abili
ty (
% o
f co
ntr
ol)
Concentration of extract (mg/ml)
Bilberry (ethyl acetate)
**
*
Figure 12: Bar Charts showing the relative cell viability against HaCaT cells exposed to hot water and Ethyl Acetate Bilberry extracts of varying concentrations. The plates used to
obtain this data were seeded with HaCaT cells and exposed to 0.005mg/ml, 0.05mg/ml and 0.5mg/ml of each extract for an hour, whilst a control subjected to no extract was also used. The cells were exposed to SSI for 3 minutes, 1 hour after being exposed to the extracts. The
plates were analysed by using the MTT assay 48h after exposure to SSI. The charts also contains standard deviation error bars and relative p-values. P-value < 0.05 = *, p-value <
0.01 = **, p-value ≤ 0.001 = ***.

Iain Conlon B.Sc in Medical Biotechnology
29
3.3.5.4 Herb Robert
0
20
40
60
80
100
120
140
160
Control 0.005 0.05 0.5
Rel
ativ
e ce
ll vi
abili
ty (
% o
f co
ntr
ol)
Concentration of extract (mg/ml)
Herb Robert (hot water)
*
***
0
20
40
60
80
100
120
140
160
Control 0.005 0.05 0.5
Rel
ativ
e ce
ll vi
abili
ty (
% o
f co
ntr
ol)
Concentration of extract (mg/ml)
Herb Robert (ethyl acetate)
*
*
Figure 13: Bar Charts showing the relative cell viability against HaCaT cells exposed to hot water and Ethyl Acetate Herb Robert extracts of varying concentrations. The plates used to obtain this data were seeded with HaCaT cells and exposed to 0.005mg/ml, 0.05mg/ml and 0.5mg/ml of each extract for an hour, whilst a control subjected to no extract was also used. The cells were exposed to SSI for 3 minutes, 1 hour after being exposed to the extracts. The
plates were analysed by using the MTT assay 48h after exposure to SSI. The charts also contains standard deviation error bars and relative p-values. P-value < 0.05 = *, p-value <
0.01 = **, p-value ≤ 0.001 = ***.

Iain Conlon B.Sc in Medical Biotechnology
30
3.3.6 Test 3 (exposed to 0.05mg/ml extracts & exposed to SSI for 3m) One 96 well plate used. Plate contained hot water and Ethyl Acetate extracts with a concentration of
0.05mg/ml of each extract. Exposed to SSI for 3 minutes, 24h following extract exposure. MTT assay
analysis done 24h after SSI exposure.
3.3.6.1 Himalayan Knotweed
Figure 14: Bar Chart showing the relative cell viability against HaCaT cells exposed to 0.05mg/ml hot water and Ethyl Acetate Himalayan Knotweed extracts. The plates used to obtain this data was seeded with HaCaT cells and exposed to
0.05mg/ml of each extract for an hour, whilst a control subjected to no extract was also used. The cells were exposed to SSI for 3 minutes, 24 hours after being exposed to the extracts. The plates were analysed by using the MTT assay 24h after
exposure to Q-Sun simulator. The chart also contains standard deviation error bars and relative p-values. P-value < 0.05 = *, p-value < 0.01 = **, p-value ≤ 0.001 = ***.
0
20
40
60
80
100
120
140
160
Control Hot Water Ethyl Acetate
Rel
ativ
e ce
ll vi
abili
ty (
% o
f co
ntr
ol)
Extract (0.05mg/ml)
Himalayan Knotweed
*
****

Iain Conlon B.Sc in Medical Biotechnology
31
3.3.6.2 Great Willowherb
Figure 15: Bar Chart showing the relative cell viability against HaCaT cells exposed to 0.05mg/ml hot water and Ethyl Acetate Great Willowherb extracts. The plates used to obtain this data was seeded with HaCaT cells and exposed to
0.05mg/ml of each extract for an hour, whilst a control subjected to no extract was also used. The cells were exposed to SSI for 3 minutes, 24 hours after being exposed to the extracts. The plates were analysed by using the MTT assay 24h after
exposure to SSI. The chart also contains standard deviation error bars and relative p-values. P-value < 0.05 = *, p-value < 0.01 = **, p-value ≤ 0.001 = ***.
0
20
40
60
80
100
120
140
160
180
Control Hot Water Ethyl Acetate
Rel
ativ
e ce
ll vi
abili
ty (
% o
f co
ntr
ol)
Extract (0.05mg/ml)
Great Willowherb
**
**
**
Iain Conlon B.Sc in Medical Biotechnology
32
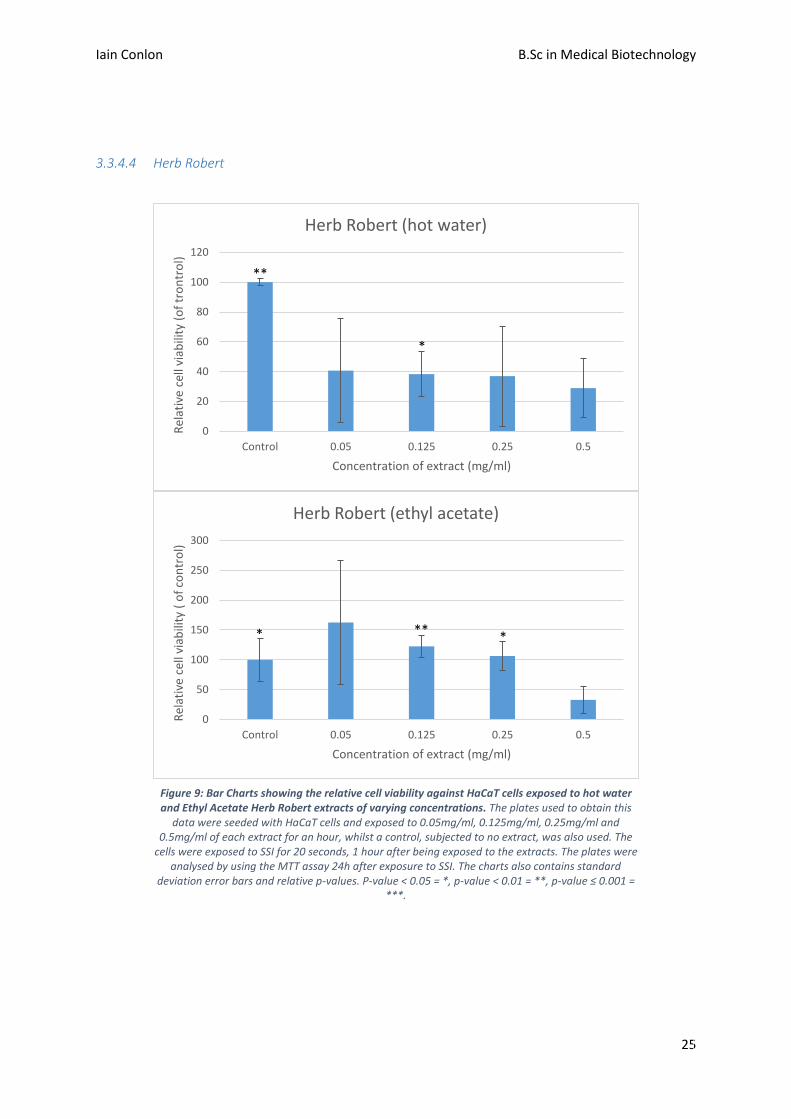
3.3.6.3 Bilberry
Figure 16: Bar Chart showing the relative cell viability against HaCaT cells exposed to 0.05mg/ml hot water and Ethyl Acetate Bilberry extracts. The plates used to obtain this data was seeded with HaCaT cells and exposed to 0.05mg/ml of
each extract for an hour, whilst a control subjected to no extract was also used. The cells were exposed to SSI for 3 minutes, 24 hours after being exposed to the extracts. The plates were analysed by using the MTT assay 24h after exposure to SSI.
The chart also contains standard deviation error bars and relative p-values. P-value < 0.05 = *, p-value < 0.01 = **, p-value ≤ 0.001 = ***.
0
20
40
60
80
100
120
140
160
180
200
Control Hot Water Ethyl Acetate
Rel
ativ
e ce
ll vi
abili
ty (
% o
f co
ntr
ol)
Extract (0.05mg/ml)
Bilberry
*
*
*

Iain Conlon B.Sc in Medical Biotechnology
33
3.3.6.4 Herb Robert
Figure 17: Bar Chart showing the relative cell viability against HaCaT cells exposed to hot water and Ethyl Acetate Herb Robert extracts. The plates used to obtain this data was seeded with HaCaT cells and exposed to 0.05mg/ml of each extract
for an hour, whilst a control subjected to no extract was also used. The cells were exposed to SSI for 3 minutes, 24 hours after being exposed to the extracts. The plates were analysed by using the MTT assay 24h after exposure to SSI. The chart also contains standard deviation error bars and relative p-values. P-value < 0.05 = *, p-value < 0.01 = **, p-value ≤ 0.001 =
***.
0
20
40
60
80
100
120
140
160
180
200
Control Hot Water Ethyl Acetate
Rel
ativ
e ce
ll vi
abili
ty (
% o
f co
ntr
ol)
Extract (0.05mg/ml)
Herb Robert
*
*
**
Iain Conlon B.Sc in Medical Biotechnology
34
3.3.7 Test 4 (exposed to 0.05mg/ml extract & exposed to SSI for 4m) One 96 well plates used. Plate contained hot water and Ethyl Acetate extracts at a concentration of
0.05mg/ml. Plate was exposed to SSI, for 4 minutes, 24h after extract exposure. MTT assay analysis
was completed 48h after plant extract exposure.
Figure 18: Graph showing the relative cell viability following an MTT assay on HaCaT cells that were exposed to 0.05mg/ml of each extract and then exposed to SSI. The plates used to obtain this data were seeded with 3’000 HaCaT
cells per well and exposed to 0.05mg/ml of each extract for an hour, whilst a control subjected to no extract was also used. The cells were exposed to SSI for 4 minutes, 24 hours after being exposed to the extracts. The plates were analysed by using
the MTT assay 24h after exposure to SSI. The chart also contains standard deviation error bars and relative p-values. P-value < 0.05 = *, p-value < 0.01 = **, p-value ≤ 0.001 = ***.
0
50
100
150
200
250
300
350
400
Control HimalayanKnotweed
(hot water)
GreatWillowherb(hot water)
Bilberry(hot water)
HerbRobert (hot
water)
HimalayanKnotweed
(ethylacetate)
GreatWillowherb
(ethylacetate)
Bilberry(ethyl
acetate)
HerbRobert(ethyl
acetate)
Ab
sorb
ance
@ 5
84
nm
Extract samples (0.5mg/ml)
HaCaT cells exposed to extract and SSI
*
*
*
* *
*
***
*

Iain Conlon B.Sc in Medical Biotechnology
35
3.3.8 Brief summary of results Figure 3 shows the results following a seeding density test of percent confluence of wells seeded with
different amounts of HaCaT cells, against time in days. It is clear that as the days progress, the
confluence of the cells increase too. It is ideal that cells are to be at 60% to 80% confluence on the
day of MTT analysis. Seeing as analysis was to be done either 3 or 4 days after seeding, wells seeded
with 4’000 and 5’000 cells are within this range.
The results shown in Figure 4 show a clear reduction in absorbance, following an MTT assay, as the
length of time exposed to SSI was increased.
These results shown in Figure 5 shows the effect of 0.05mg/ml of extracts on HaCaT cells without
any exposure to SSI. The absorbances were compared to that of control, which was not exposed to
any extract, nor SSI. It shows a 590% and 570% increase in relative cell viability of the hot water
extracts of great willowherb and herb robert, respectively.
Following test 1, seen from Figure 6 to Figure 9, it is clear that there is no substantial increase in
relative cell viability following exposure to 4 different concentrations of extract. Figure 6 shows that
the 0.05mg/ml ethyl acetate Himalayan knotweed extract has a 45% increase in relative cell viability.
All other extracts show a general decrease in relative cell viability as extract concentrations increase.
Test 2, shown from Figure 10 to Figure 13, showed results indicating little variation between control
and extracts. Hot water bilberry extract has shown rapid decrease in relative cell viability, as well as
hot water and ethyl acetate herb robert extracts.
Test 3, shown from Figure 14 to Figure 17, has shown the 0.05mg/ml great willowherb (ethyl acetate)
and herb robert (hot water) extracts shown a 40% and 60% increase in relative cell viability. These
can be seen in figures 15 and 17 respectively. No other significant change in relative cell viability was
seen.
Following test 4, there is a 290% increase in relative cell viability seen to be cause by the 0.05mg/ml
herb robert (hot water) extract (see Figure 18). The rest of the extracts had no effect on relative cell
viability.

Iain Conlon B.Sc in Medical Biotechnology
36
3.4 Discussion
3.4.1 Seeding Density Test
The seeding density test was an critical element to this study, as cells are needed to be between 60% -
80% confluence in the wells to allow for accurate viability tests (SigmaAldrich, 2015).
Following the seeding density test it was determined that the amount of cells to be seeded if the
viability assay was to be performed 3 days after seeding was 4’000 cells per well. This was due to
there being 63% confluence in the wells that were seeded with 4’000 cells on day 3 (Figure 3). If the
viability assay was to be performed 4 days after seeding, the amount of cells needed to adequately
seed the wells was 3’000 cells. This was due to 2’000 cells/well having too low confluence after 4
days and 4’000 cells/well having slightly too much confluence after 4 days.
3.4.2 Cellular exposure to SSI
Over the course of the experimentation, controls were used which did not contain any concentration
of extract. HaCaT cells and their corresponding media was just used. This allowed for the analysis of
how the SSI effected the cells when exposed for different times. This can be seen as a graph in Figure
4. As absorbance is an indicator to cell viability, it can clearly be seen that cell viability decreases as
the time exposed to SSI increases. The result for the cells exposed for 20 seconds was recorded at
540nm in comparison to the others which were 584nm. This was due to the correct plate reader being
unavailable at the time of analysis. Therefore, it can be speculated that the result for 20 second
exposure would be much closer to the control result, resulting in a more linear decreases in
absorbance (viability). Ideally, the use of 220 second exposure would have been used over the course
of the experimentation but as this test was done over the course of the experimentation so it was not
possible.
3.4.3 Extract exposure to HaCaT cells
The effect of the hot water and ethyl acetate extracts was determined by exposing the cells to the
various extracts, at a concentration of 0.05mg/ml, and performing MTT analysis on the cells. The
results seen in Error! Reference source not found. show the difference in cell viability when
compared to a control which was not exposed to any extract. It is clear that both the hot water extracts
for Great Willowherb and Herb Robert have a major proliferative effect on the cells, as both of them
contained about 700% relative cell viability to the control. This indicates the presence of phenolic
compound presence in these extracts. This result also shows that these extracts would possibly ideal to
use as a template for use against SSI.
The ethyl acetate bilberry extract shows a 30% increase in cell viability with great significance. A
high level of phenolic compounds may be present in this extract.
Many of the other extracts such as both Himalayan knotweed extracts, hot water bilberry and ethyl
acetate great Willowherb and ethyl acetate herb Robert don’t show a great degree in significant
different to the control.
3.4.4 Exposure of cells to extracts and SSI
The determination of the effect of SSI on cells which were exposed to plant extracts was one of the
main aims behind this experimentation. These tests were performed over the period of a few weeks
and there were variations on the methods along the way. Variations included concentration of extract,
time of SSI exposure, time after extract exposure in which SSI was exposed to cells, and amount of

Iain Conlon B.Sc in Medical Biotechnology
37
time after extract exposure MTT assay was done. All of these variations causes slight differences in
results.
Firstly, cells were exposed to SSI for 20 seconds directly after being exposed to the extracts (at 4
different concentrations) for an hour. In the 0.05mg/ml Himalayan knotweed ethyl acetate extract, a
significant increase in in cell viability (by about 45%) was seen. There was no significant increase in
viability seen in any other hot water or ethyl acetate extracts from this test. In fact, many of the
extracts seemed to be cytotoxic, as major decreases in cell viability were seen in the hot water
Himalayan Knotweed, great Willowherb, Bilberry and Herb Robert extracts and the ethyl acetate
Great Willowherb extracts. However, this could be due to the fact that cells were exposed to SSI
whilst in DMEM media, which contains phenol red. It is known that phenol red may be cytotoxic
when in the presence of UV radiation. Because of this, in the following experiments the media was
removed from the cells and replaced with PBS for the exposure to SSI.
The next test done was to test the viability of cells following the exposure to SII for 3 minutes
following the exposure to 3 different concentrations of each extract. The concentrations used were
0.005mg/ml, 0.05mg/ml and 0.5mg/ml. Lower concentrations of extract use used due to higher
concentrations of the extracts having a toxic effect on cells from the first SSI exposure test. However,
no significant results were found from this test apart from significantly low relative viability results
from Bilberry (hot water extract) and Herb Robert (hot water and ethyl acetate extracts). Following
these results, it was thought that exposing to SSI directly after extract exposure might not allow
adequate time for the potential antioxidants from the extracts to be sufficiently intergraded into the
cellular metabolism.
Subsequently, a similar test was done to the previous test, except only one concentration of each
extract was used (0.05mg/ml) and cells were exposed to SSI 24 hours after being subjected to
extracts. This time in between extract exposure and SSI exposure may have allowed time for the cells
to successfully integrate the potential antioxidative compounds into their metabolism successfully.
The resulting test showed that the hot water great willowherb extract and the ethyl acetate herb robert
extracts showed an increase in relative cell viability by 40% and 60% respectively. This indicates
presence of polyphenols in these extracts.
A final test was done on the HaCaT cells, which was similar to the previous test apart from the
exposure time to SSI being 4 minutes. SSI exposure was done 24h after extract exposure. The
increase in exposure time to SSI was done to make sure the viability of cells in the control wells
would significantly decrease. The results, shown in Figure 18, show the relative absorbance of the
cells subjected to 0.05mg/ml of the extract to the control. It is clear that the hot water herb robert
extract has a significant increase in viability relative to the control. This increased viability is similar
to the hot water herb robert control result from Error! Reference source not found.. Both of these
results not only that the extract has a cytoproliferative effect on the cells, but also a photoprotective
effect. It is unclear why the herb robert hot water extract had a negative effect on cells in tests 1 and 2
(Figure 13 and Figure 17). It may be due to cells being exposed to SSI directly after extract exposure,
or may even be due to the fact that the cell seeding technique was not as up accurate as was in later
tests. Overall, from this it is clear from tests 3 and 4 that Herb Robert extracts have a positive effect
on HaCaT cells.
There are many ways in which this experiment could be improved in the future. First off, the SSI
exposure time could be increased to make sure that most, if not all, of the cells in the control wells are
killed off. A range of other cell viability assays may be used also, such as GSH assay, direct ROS
analysis assays, neutral red and even assays that could directly analyse the antioxidants present in the
extracts. This would allow for a clearer view of which extracts work best as a photo-protectant.

Iain Conlon B.Sc in Medical Biotechnology
38
3.5 Experimental summary It was clear from this experimentation that exposure to simulated solar irradiation has a toxic effect on
HaCaT cells. It was seen that an increase in exposure time to SSI decreased the amount of viable
cells. 0.05mg/ml Great Willowherb (hot water) and Herb Robert (hot water and ethyl acetate) extracts
were both shown to have a photoprotective effect on cells after SSI exposure, which was shown by
their high relative cell viability in later tests. The hot water extracts of Great Willowherb and Herb
Robert have shown that they effect cell proliferation even without exposure to SSI. This indicates the
presence of polyphenols which cause cytoproliferation.

Iain Conlon B.Sc in Medical Biotechnology
39
4 Chapter 4: Overall Project Discussion and Conclusion This section is aimed at comparing results found in this study versus information already known by
previous experiments, which was discussed in Chapter 2.
The literature review section (Chapter 2) started off by mentioning the dangers and problems with
sunlight, specifically UV radiation. It can cause much problems ranging from sunburn to cancer. This
was evident after analysing the cells following exposure to varying times of simulated solar
irradiation. As there was an increase in time exposed, there was a decrease in viable cells. This lead to
the examination of the four different plant extracts on the cells. Some of these plants were previously
known to exhibit therapeutic features such as polyphenols (such as flavonoids) and anthocyanins.
These micronutrients, as mentioned before, help cells by being good antioxidants and by being
photoprotective.
Studies examining herb robert polyphenolic properties and its effects of on cell viability have been
done previously (See section 2.2.4) (Neagu et al., 2013). It was shown that Herb Robert from an
aqueous extract has a high polyphenolic content and has a positive effect on cell viability, mainly at
the extract concentration of 0.2mg/ml (Neagu et al., 2013). This is coincides with the results of Herb
Robert found in this experiment as there was a high relative viability count shown on the cells
exposed to 0.05mg/ml of a hot water extract. This high relative viability is present in cells both
exposed to SSI and not exposed to SSI. This indicates that the polyphenolic compounds found in this
extract has a large cytoproliferative effect.
The great willowherb studies also have shown similarities with the results found from this experiment.
Great willowherb is also a known antioxidant-containing plant. It is shown in section 3.3.3 that the
great willowherb hot water extract showed about 690% relative viability in comparison to control
cells. This indicates that the polyphenols present are cytoproliferative, similar to the hot water herb
robert extract. Even after exposure to SSI, the great willowherb hot water extract had a positive effect
on the cells as can be seen in section 3.3.6.2 (Figure 15) by the 40% increase in viability in
comparison to the control cells.
Bilberry was another plant studied extensively in the literature review. It is known to contain
polyphenols such as flavonoids, and also contain anthocyanins (Vučić et al., 2013). Studies similar to
this in which bilberries cytoprotective effects were analysed following exposure to UV radiation and
it was determined that bilberry proved to be effective in the protection of cells (Calò & Marabini,
2014; Svobodová et al., 2008). However, there was no significant results that illustrated the positive
effects of the bilberry achieved in this experimentation. This is surprising due to the many studies that
found positive cytoprotective results regarding bilberry, particularly when bilberry has such a high
anthocyanin content which is highly cytoprotective (Prior & Wu, 2006). This lack of positive results
have been due to a lack of bioavailability of the polyphenols due to the type of extracts they were, or
possible errors in the bilberry extraction and creation.
To conclude, it is obvious from this experimental report that the 0.05mg/ml great willowherb (hot
water) and herb robert (hot water and ethyl acetate) extracts have a highly positive effect on HaCaT
cells with and without exposure to SSI. Further study on these, plus the bilberry extract, extracts may
be required to obtain better defined information on them.

Iain Conlon B.Sc in Medical Biotechnology
40
5 Bibliography
Calò, R., & Marabini, L. (2014). Protective effect of Vaccinium myrtillus extract against UVA- and
UVB-induced damage in a human keratinocyte cell line (HaCaT cells). Journal of
Photochemistry and Photobiology. B, Biology, 132, 27–35.
doi:10.1016/j.jphotobiol.2014.01.013
Chu, W., Cheung, S. C. M., Lau, R. A. W., & Benzie, I. F. F. (2011). Bilberry (Vaccinium myrtillus
L.). CRC Press. Retrieved from http://www.ncbi.nlm.nih.gov/books/NBK92770/
Electromagnetic Spectrum. (2015). Materials Technology Limited. Retrieved May 10, 2015, from
http://www.drb-mattech.co.uk/uv spectrum.html
Eruslanov, E., & Kusmartsev, S. (2010). Identification of ROS using oxidized DCFDA and flow-
cytometry. Methods in Molecular Biology (Clifton, N.J.), 594, 57–72. doi:10.1007/978-1-60761-
411-1_4
Himalayan knotweed | Invasive species list | Fisheries Research. (2015). Fisheries Ireland. Retrieved
April 10, 2015, from http://www.fisheriesireland.ie/Invasive-species-list/himalayan-
knotweed.html
Hoelzl, C., Bichler, J., Ferk, F., Nersesyan, a, Elbling, L., Ehrlich, V., & Chakraborty, a. (2005).
METHODS FOR THE DETECTION OF ANTIOXIDANTS WHICH PREVENT AGE
RELATED DISEASES : A CRITICAL REVIEW WITH comes additionally from studies that
suggest that elevated levels of protective. Cancer, 49–64.
Holick, M. F. (2008). Sunlight, UV-radiation, vitamin D and skin cancer: how much sunlight do we
need? Advances in Experimental Medicine and Biology, 624, 1–15. doi:10.1007/978-0-387-
77574-6_1
Kiss, A. K., Bazylko, A., Filipek, A., Granica, S., Jaszewska, E., Kiarszys, U., … Piwowarski, J.
(2011). Oenothein B’s contribution to the anti-inflammatory and antioxidant activity of
Epilobium sp. Phytomedicine, 18(7), 557–560. doi:10.1016/j.phymed.2010.10.016
Lobo, V., Patil, A., Phatak, A., & Chandra, N. (2010). Free radicals, antioxidants and functional
foods: Impact on human health. Pharmacognosy Reviews, 4(8), 118–26. doi:10.4103/0973-
7847.70902
Lü, J.-M., Lin, P. H., Yao, Q., & Chen, C. (2010). Chemical and molecular mechanisms of
antioxidants: experimental approaches and model systems. Journal of Cellular and Molecular
Medicine, 14(4), 840–60. doi:10.1111/j.1582-4934.2009.00897.x
Miliauskas, G., van Beek, T. A., Venskutonis, P. R., Linssen, J. P. H., & de Waard, P. (2004).
Antioxidative activity of Geranium macrorrhizum. European Food Research and Technology,
218(3), 253–261. doi:10.1007/s00217-003-0836-7
Neagu, E., Paun, G., Constantin, D., & Radu, G. L. (2013). Cytostatic activity of Geranium
robertianum L. extracts processed by membrane procedures. Arabian Journal of Chemistry.
doi:10.1016/j.arabjc.2013.09.028
Pietta, P. G. (2000). Flavonoids as antioxidants. Journal of Natural Products, 63(7), 1035–42.
Retrieved from http://www.ncbi.nlm.nih.gov/pubmed/10924197

Iain Conlon B.Sc in Medical Biotechnology
41
Pool-Zobel, B. L., Bub, A., Schröder, N., & Rechkemmer, G. (1999). Anthocyanins are potent
antioxidants in model systems but do not reduce endogenous oxidative DNA damage in human
colon cells. European Journal of Nutrition, 38(5), 227–34. Retrieved from
http://www.ncbi.nlm.nih.gov/pubmed/10654159
Prior, R. L., & Wu, X. (2006). Anthocyanins: structural characteristics that result in unique metabolic
patterns and biological activities. Free Radical Research, 40(10), 1014–28.
doi:10.1080/10715760600758522
Q-Lab. (2015). Weathering Test Chambers- Q-SUN Xe-1 || Q-Lab. Q-Lab Products. Retrieved April
27, 2015, from http://www.q-lab.com/products/q-sun-xenon-arc-test-chambers/q-sun-xe-1
Riss, T. L., Moravec, R. A., Niles, A. L., Benink, H. A., Worzella, T. J., & Minor, L. (2013, May 1).
Cell Viability Assays. Eli Lilly & Company and the National Center for Advancing
Translational Sciences. Retrieved from http://www.ncbi.nlm.nih.gov/books/NBK144065/
Ross, C. a, & Tabrizi, S. J. (2011). Huntington’s disease: from molecular pathogenesis to clinical
treatment. Lancet Neurology, 10(1), 83–98. doi:10.1016/S1474-4422(10)70245-3
Sanchez-Moreno, C. (2002). Review: Methods Used to Evaluate the Free Radical Scavenging
Activity in Foods and Biological Systems. Food Science and Technology International, 8(3),
121–137. doi:10.1106/108201302026770
Seeram, N. P. (2008). Berry fruits: compositional elements, biochemical activities, and the impact of
their intake on human health, performance, and disease. Journal of Agricultural and Food
Chemistry, 56(3), 627–9. doi:10.1021/jf071988k
SETLOW, R. B., & SETLOW, J. K. (1962). Evidence that ultraviolet-induced thymine dimers in
DNA cause biological damage. Proceedings of the National Academy of Sciences of the United
States of America, 48, 1250–7. Retrieved from
http://www.pubmedcentral.nih.gov/articlerender.fcgi?artid=220940&tool=pmcentrez&rendertyp
e=abstract
SigmaAldrich. (2015). MTT Based In Vitro Toxicology Assay. Sigma Aldrich.
Svobodová, A., Rambousková, J., Walterová, D., & Vostalová, J. (2008). Bilberry extract reduces
UVA-induced oxidative stress in HaCaT keratinocytes: a pilot study. BioFactors (Oxford,
England), 33(4), 249–66. Retrieved from http://www.ncbi.nlm.nih.gov/pubmed/19509461
Tamas, M., Toiu, A., Oniga, I., Deliu, C., Oltean, B., & Coldea, G. (2009). Quantitative determination
of total polyphenols and flavonoids from indigenous species of Epilobium of wild origin and “in
vitro” regenerated plantlets. Contributii Botanice, 44, 119–123. Retrieved from
http://www.cabdirect.org/abstracts/20103071594.html;jsessionid=56AD778762AFDDEFC56D7
4AD8D52087F
TOFTS, R. J. (2004). Geranium robertianum L. Journal of Ecology, 92(3), 537–555.
doi:10.1111/j.0022-0477.2004.00892.x
Tyrrell, R. M. (1995). Ultraviolet radiation and free radical damage to skin. Biochemical Society
Symposium, 61, 47–53. Retrieved from http://www.ncbi.nlm.nih.gov/pubmed/8660402

Iain Conlon B.Sc in Medical Biotechnology
42
Vučić, D. M., Petković, M. R., Rodić, B. B., Stefanović, O. D., Vasić, S. M., & Čomić, L. R. (2013).
Antibacterial and antioxidant activities of bilberry ( Vaccinium myrtillus L .) in vitro. African
Journal of Microbiology Research, 7(45), 5130–5136. doi:10.5897/AJMR2013.2524
WHO | Health effects of UV radiation. (2015). World Health Organisation. World Health
Organization. Retrieved May 10, 2015, from http://www.who.int/uv/health/en/
Wilson, V. G. (2014). Growth and differentiation of HaCaT keratinocytes. Methods in Molecular
Biology (Clifton, N.J.), 1195, 33–41. doi:10.1007/7651_2013_42
Žiberna, L., Lunder, M., Može, Š., Vanzo, A., & Drevenšek, G. (2009). Cardioprotective effects of
bilberry extract on ischemia-reperfusion-induced injury in isolated rat heart. BMC
Pharmacology, 9(Suppl 2), A55. doi:10.1186/1471-2210-9-S2-A55