
Thesis Final
72
Studies on the Characterization, Interfacial Tension and Rheology of a Novel Polymeric Surfactant Derived from Castor Oil for Enhanced Oil Recovery Dissertation submitted in partial fulfillment of requirements for the award of the degree of Master of Technology In PETROLEUM ENGINEERING By NILANJAN PAL (Admission no. 2013MT0087) Under the guidance of Dr. AJAY MANDAL Associate Professor Department of Petroleum Engineering DEPARTMENT OF PETROLEUM ENGINEERING INDIAN SCHOOL OF MINES, DHANBAD April 2015
-
Upload
nilanjan-paul -
Category
Documents
-
view
39 -
download
0
Transcript of Thesis Final
Studies on the Characterization, Interfacial Tension and
Rheology of a Novel Polymeric Surfactant Derived from
Castor Oil for Enhanced Oil Recovery
Dissertation submitted in partial fulfillment of
requirements for the award of the degree of
Master of Technology
In
PETROLEUM ENGINEERING
By
NILANJAN PAL (Admission no. 2013MT0087)
Under the guidance of
Dr. AJAY MANDAL Associate Professor
Department of Petroleum Engineering
DEPARTMENT OF PETROLEUM ENGINEERING
INDIAN SCHOOL OF MINES, DHANBAD
April 2015
DEPARTMENT OF PETROLEUM ENGINEERING INDIAN SCHOOL OF MINES UNIVERSITY
Dhanbad-826004, Jharkhand (India)
________________________Address for Communication_______________________
Dept. of Petroleum Engg., Indian School of Mines University, Dhanbad-826004, Jharkhand
Tel. : +91-326-2296632, 2235280, Fax : +91-326-2296632/2296563
E-mail: [email protected] Website : www.ismdhanbad.ac.in
CERTIFICATE
This is to certify that the dissertation entitled “Studies on the Characterization, Interfacial
Tension and Rheology of a Novel Polymeric Surfactant Derived from Castor Oil for Enhanced
Oil Recovery” carried out by Nilanjan Pal (Admission No. 2013MT0087) in the Department of
Petroleum Engineering, Indian School of Mines, Dhanbad in partial fulfillment of the
requirements for the award of the degree of Master of Technology in Petroleum Engineering is
a record of bonafide research work carried out by him under my supervision and guidance. His
dissertation, in my opinion, is worthy of consideration for the award of the degree of Master of
Technology in accordance with regulations of the institute.
To the best of my knowledge, the results embodied in this dissertation have not been
submitted anywhere else for the award of degree certificate.
Dr. Ajay Mandal
Associate Professor
Department of Petroleum Engineering
Indian School of Mines
Dhanbad-826004

Dedicated to my beloved parents

Page | II
I
It is a privilege to lay earnest thanks to my guide Dr. Ajay Mandal, Associate Professor,
Department of Petroleum Engineering, Indian School of Mines Dhanbad, for his excellent
guidance, caring, patience, and providing me with an motivating atmosphere for doing the
dissertation. His expertise was motivation for me from the inception of this dissertation till the
writing of this project report. I could not have imagined having a better advisor and mentor for
my project.
I am thankful to Prof. V. P. Sharma, Head of Department and distinguished faculty members
of the Department of Petroleum Engineering, Indian School of Mines, Dhanbad for valuable
support to help the completion of my research work in the department which has admirable
facilities from every aspect as required by any researcher.
It was a great time working with PhD research students, Mr. Keshak Babu, Mr. Shranish Kar
and Mr. Sunil Kumar who have been helpful at the very ground level during the various stages
of experiments that were undertaken for the completion of my project (thesis) work.
NILANJAN PAL
Admission No. 2013MT0087
Master of Technology
Petroleum Engineering
ACKNOWLEDGEMENT
Page | III
II
1. "Synthesis and Characterization of new Polymeric Surfactant for
Chemical Enhanced Oil Recovery", Ajay Mandal, Keshak Babu,
Nilanjan Pal, V. K. Saxena.
2. “Surface Tension, Dynamic Light Scattering and Rheological
studies of a new Polymeric Surfactant for application in enhanced
oil recovery”, Nilanjan Pal, Keshak Babu, Ajay Mandal.
3. “Studies on Interfacial Tension and Contact Angle of Synthesized
surfactant and Polymeric from Castor Oil for Enhanced Oil
Recovery”, Keshak Babu, Nilanjan Pal, Achinta Bera, V.K. Saxena,
Ajay Mandal.
COMMUNICATED PAPERS
Page | IV
III
Various experimental studies were carried out on a novel polymeric surfactant synthesized
from castor oil. FTIR analysis of polymeric surfactants with varying acrylamide-to-sulfonate
weight ratios revealed similar chemical composition and bonding arrangement with different
transmittance percentages. Dynamic Light Scattering (DLS) experiments were performed on
all polymeric surfactants to show that hydrodynamic particle diameter generally increased with
concentration due to aggregation of molecules. Addition of NaCl resulted in decrease in
particle size. The effects of concentration and salt addition on interfacial studies and rheology
were investigated. IFT values decreased with concentration upto a certain limit called Critical
Micelle Concentration after which the IFT value increased. Addition of salt saw the same trend
with the lowest IFT value obtained at optimal salinity of the salt-polymeric mixture. The values
of CMC and optimal salinity were identified along with their corresponding IFT values to aid
in the formulation of desired mixtures for achieving ultralow IFT. Viscosity was found to
increase with increase with PMES concentration. However, reduction in viscosity was
observed with temperature rise and salt addition. Analysis of rheological data showed that
polymeric surfactant behaved ideally up to a critical shear rate of 50 s-1 but exhibited shear-
thinning or pseudoplastic behavior at higher shear rates. Determination of viscoelastic
properties were carried out by dynamic mechanical analysis in oscillatory mode. Storage
modulus G' and loss modulus G'' increased with increasing PMES concentration. Specific
frequency (SF) indicated by the crossing point between G' and G'' on the viscoelastic curve
represents the point of transition between elastic and viscous phases of the polymeric surfactant
system.
Keywords: Polymeric Surfactant; Castor Oil; Fourier Transform Infrared Spectroscopy;
Dynamic Light Scattering; Interfacial Tension; Viscosity; Shear Stress; Viscoelasticity
ABSTRACT

Page | V
IV
1. Investigate the effects of concentration and salt addition on the particle size profile of
polymeric surfactant in aqueous solution by DLS Analysis.
2. Analyze and compare the effects of concentration, acrylamide-to-sulfonate ratio and
salt addition on the interfacial tension measurements for polymeric surfactant and
SMES.
3. Study the rheological properties, including viscosity, shear stress and viscoelastic
properties of polymeric surfactant solutions in aqueous solution and under the effect
of salt.
NILANJAN PAL
Admission No. 2013MT0087
Master of Technology
Petroleum Engineering
OBJECTIVES OF THE EXPERIMENTAL STUDY

Page | VI
V
DESCRIPTION Page
No.
ACKNOWLEDGEMENT
COMMUNICATED PAPERS
ABSTRACT
OBJECTIVES OF THE EXPERIMENTAL STUDY
CONTENTS
II
III
IV
V
VI
LIST OF FIGURES VIII
1. INTRODUCTION 2-4
2. LITERATURE REVIEW 5-10
2.1. Current Demand for oil and need for EOR 5
2.2. Prospects of Chemical flooding for EOR 6
2.3. Prominence in ASP Flooding 8
2.4. Chemical EOR challenges 9
2.5. Potential possibilities in the synthesis of a new polymeric surfactant 9
3. WORK OVERVIEW 11-12
3.1. Previous and Relevant Works 11
3.2. Focus of the Present Study 12
4. DLS CHARACTERIZATION 13-20
4.1. Principle of DLS Analysis 13
4.2. Experimental Section 14
4.2.1. Material(s) Required 14
4.2.2. Apparatus Description 14
4.2.3. Measurable Quantities 15
4.2.4. Technical Features 15
4.2.5. Zetasizer Nano S90 Specifications 16
4.2.6. Experimental Procedure 17
4.3. Results and Discussions 18
4.3.1. Effect of PMES concentration on particle size distribution profile 18
4.3.2. Effect of salt addition on particle size distribution profile 19
CONTENTS

Page | VII
5. INTERFACIAL TENSION STUDIES 21-40
5.1. Principle of IFT measurement by Spinning Drop Method 21
5.2. Experimental Section 23
5.2.1. Material(s) Required 23
5.2.2. Apparatus Description 23
5.2.3. Measurable Quantities 24
5.2.4. Technical Features 25
5.2.5. SVT-15 Tensiometer Specifications 27
5.2.6. Capillary Tube Specifications 28
5.2.7. Experimental Procedure 29
5.3. Results and Discussions 31
5.3.1. Effect of surfactant concentration on interfacial tension
measurements for SMES solution
31
5.3.2. Effect of NaCl addition on interfacial tension measurements for
SMES solution
33
5.3.3. Effect of concentration on IFT of polymeric surfactant (PMES)
solutions with different acrylamide-to-surfactant ratios
34
5.3.4. Effect of NaCl addition on the most effective polymeric
surfactant solution
38
5.3.5. Effect of Acrylamide-to-Sulfonate Ratios on salt-polymeric
surfactant mixture with lowest IFT value
39
6. RHEOLOGICAL STUDIES 41-56
6.1. Principle of rheometry 41
6.2. Experimental Section 42
6.2.1. Material(s) Required 42
6.2.2. Apparatus Description 42
6.2.3. Measurable Quantities 43
6.2.4. Technical Features 44
6.2.5. Bohlin Gemini 2 Rheometer Specifications 44
6.2.6. Experimental Procedure 45
6.3. Results and Discussions 47
6.3.1. Effect of Temperature on PMES viscosity 47
6.3.2. Effect of PMES concentration and acrylamide-to-sulfonate ratio
on viscosity and shear Stress
49
6.3.3. Effect of addition of salt on PMES viscosity 53
6.3.4. Effect of concentration on dynamic viscoelasticity
55
7. SUMMARY AND CONCLUSIONS 57-59
REFERENCES 60
Page | VIII
VI
Figure no.
Description Page no.
Fig 3.1 Infrared spectrum of polymeric methyl ester sulfonate 11
Fig 4.1 ZETASIZER (Nano-S90, Malvern) apparatus for DLS
analysis 14
Fig 4.2 Polarizer Tube for storing sample solution during DLS
Analysis 17
Fig 4.3 Effect of PMES concentration on hydrodynamic diameter
of molecules in polymer ethyl ester sulfonate solution 18
Fig 4.4 Effect of PMES concentration on hydrodynamic diameter
of PMES solution containing 1% NaCl 19
Fig 4.5 Effect of PMES concentration on hydrodynamic diameter
of PMES solution containing 2% NaCl 19
Fig 4.6 Effect of PMES concentration on hydrodynamic diameter
of PMES solution containing 3% NaCl 20
Fig 5.1 Spinning Drop in a Spinning Drop Tensiometer along the
Spinning Axis 21
Fig 5.2 Spinning Drop Tensiometer SVT 15N Assembly 24
Fig 5.3 High Temperature Capillary Tube FEC 622/400-HT 25
Fig 5.4 Spinning Drop Video Tensiometer SVT 15N 27
Fig 5.5 A typical Spinning Drop (Crude Oil) in Capillary Tube in
SVT 15N Tensiometer 29
Fig 5.6 Variation of interfacial tension with surfactant
concentration for SMES solution at 298 K
31
Fig 5.7 Snapshot of spinning drop (crude oil) at CMC value (5500
ppm) for SMES solution
32
Fig 5.8 Variation of interfacial tension with NaCl salt
concentration for 5500 ppm SMES solution at 298 K
33
Fig 5.9 Snapshot of spinning drop (crude oil) at optimal salinity
(3.5%) at CMC (5500 ppm) for SMES solution
33
Fig 5.10 Variation of IFT with PMES concentration at different
acrylamide-to-sulfonate ratios at 298 K
35
Fig 5.11 Snapshot of spinning drop (crude oil) at CMC value (6500
ppm) for P1 solution
35
Fig 5.12 Snapshot of spinning drop (crude oil) at CMC value (5500
ppm) for P2 solution
36
LIST
OF
FIGURES

Page | IX
Fig 5.13 Snapshot of spinning drop (crude oil) at CMC value (5500
ppm) for P3 solution
36
Fig 5.14 Snapshot of spinning drop (crude oil) at CMC value (4500
ppm) for P4 solution
37
Fig 5.15 Snapshot of spinning drop (crude oil) at CMC value (4500
ppm) for P5 solution
37
Fig 5.16 Effect of NaCl addition on interfacial tension values for P5
sample (acrylamide-to-sulfonate ratio 1:1) at 4500 ppm
aqueous solution at 298 K
38
Fig 5.17 Snapshot of spinning drop (crude oil) at optimal salinity
(4.5%) at CMC (4500ppm) for P5 solution
39
Fig 5.18 Effect of variation of acrylamide-to-sulfonate ratios on the
IFT values at 4500 ppm PMES solution containing 4.5%
NaCl at 298 K
39
Fig 5.19 Snapshot of spinning drop (crude oil) at optimal salinity
(4.5%) at CMC (4500 ppm) for salt-P4 (acrylamide-to-
surfactant ratio 0.8:1) polymeric surfactant mixture
40
Fig 6.1 Bohlin Gemini 2 Rheometer Assembly 43
Fig 6.2 Variation of Dynamic Viscosity of Polymeric Surfactant
(PMES) with acrylamide to sulfonate ratio for 2500 ppm PMES
Solution at different temperatures
47
Fig 6.3 Variation of Dynamic Viscosity of Polymeric Surfactant
(PMES) with acrylamide to sulfonate ratio for 7500 ppm PMES
Solution at different temperatures
48
Fig 6.4 Variation of Dynamic Viscosity of Polymeric Surfactant
(PMES) with acrylamide to sulfonate ratio for 10000 ppm PMES
Solution at different temperatures
48
Fig 6.5 Experimental Steady shear viscosity profile of P1 solution (with
acrylamide-to-sulfonate ratio 0.4: 1) at 298 K at varying
concentrations
50
Fig 6.6 Experimental Steady shear viscosity profile of P2 solution (with
acrylamide-to-sulfonate ratio 0.5: 1) at 298 K at varying
concentrations
50
Fig 6.7 Experimental Steady shear viscosity profile of P3 solution (with
acrylamide-to-sulfonate ratio 0.6: 1) at 298 K at varying
concentrations
51
Fig 6.8 Experimental Steady shear viscosity profile of P4 solution (with
acrylamide-to-sulfonate ratio 0.8: 1) at 298 K at varying
concentrations
51
Fig 6.9 Experimental Steady shear viscosity profile of P5 solution (with
acrylamide-to-sulfonate ratio 1: 1) at 298 K at varying
concentrations
52
Fig 6.10 Experimental Shear stress profile of P5 solution (with
acrylamide-to-sulfonate ratio 1: 1) at 298 K at varying
concentrations
52
Fig 6.11 Effect of addition of NaCl on the viscosity profile of 6000 ppm
P5 solution (with acrylamide-to-sulfonate ratio 1: 1) at 298 K at
varying concentrations
54

Page | X
Fig 6.12 Effect of addition of CaCl2 on the viscosity profile of 6000 ppm
P5 solution (with acrylamide-to-sulfonate ratio 1: 1) at 298 K at
varying concentrations
54
Fig 6.13 Effect of addition of NaCl and CaCl2 on zero-shear stress curve
of 6000 ppm P5 solution (with acrylamide-to-sulfonate ratio 1:
1) at 298 K at varying concentrations
55
Fig 6.14 Dynamic viscoelasticity curves showing the effect of angular
frequency on storage and loss moduli for P5 solution (with
Sulfonate-to-acrylamide ratio 1: 1) at 298 K at varying
concentrations
56

Page | 2
Chapter 1
Introduction
Traditional oil extraction methods by primary and secondary recovery processes generally
produce about 20 to 40% of the reservoir’s Original Oil in Place (OOIP) during its mature
lifetime. The remaining oil is still trapped in porous media due to the viscous forces, surface
and interfacial forces, and reservoir heterogeneities which results in poor displacement
efficiency [1]. This revelation has led to the application and development of many Enhanced
Oil Recovery methods.
Chemical enhanced oil recovery methods are field proven techniques that improve efficiency
and effectiveness of oil recovery. EOR processes involve a wide variety of mechanisms,
including use of polymers and surfactants that alter or improve the properties of reservoir fluids
to make it more conducive to extraction. Injection of water-soluble polymers is widely
employed in EOR due to its ability to improve sweep efficiency [1] by reducing the mobility
of displacing medium [2]. Surfactant flooding can significantly reduce the oil-water interfacial
tension, lower capillary forces and facilitate wettability alteration to improve oil recovery
[3,4,5]. The application of both polymer and surfactant may prove to be economically effective,
though complications involving proper formulation and design may arise. Improper mixing of
polymer and surfactant may lead to undesirable phase separation.
Lately, studies have been reported on the synthesis and applications of polymeric surfactants
in enhanced oil recovery [6,7]. Although polymeric surfactants are undoubtedly less well-
defined than surfactants, they have created greater interest in terms of flexibility, functionality
and diversity [8]. Polymeric surfactant, synthesized by appropriate mixing of polymer and
surfactant, encompasses the beneficial effects of both polymer and surfactant flooding. Besides
cost-effective, polymeric surfactants allow good mobility control and decrease interfacial
tension, thereby improving oil recovery by increase of fractional flow of oil [9]. The polymeric
methyl ester sulfonate (PMES) can improve the oil recovery rate under standard reservoir
conditions [10].
Various synthetic methods may be employed to introduce graft chains onto the polymer surface
[11] or onto the polymer backbone [12]. The polymeric surfactant investigated in the present
study was synthesized by attaching the sulfonate group of surfactant to the hydrophobic group

Page | 3
of an acrylamide monomer backbone by polymerization process [13]. The process was
designed to graft the sulfonate group to the polymer backbone as a one component system.
Infrared spectroscopy is crucial for elucidating the chemical structure and bonding arrangement
of polymeric materials at a molecular level [14]. The chemical structure and bonding
arrangement of the polymeric surfactant is characterized by FTIR (Fourier Transform Infrared)
spectroscopy analysis with reference to the Spectroscopic identification of organic compounds
by Silverstein et.al. 2005 [15]. This is accomplished by determination of components or groups
of atoms that absorb at specific frequencies in the infrared region [16,17]. FTIR studies on the
synthesized polymeric surfactant (derived from castor oil) is focused in this study. A similar
investigation was carried out on the infrared (IR) spectrum of polymeric surfactant derived
from Jatropha oil [18].
Dynamic Light Scattering is an important characterization technique to determine the size
distribution profile of particles in polymeric solutions. Investigation of hydrodynamic radii
obtained by DLS is very important in understanding the interfacial activity of polymeric
surfactants. The hydrodynamic particle size may be disaggregated by action of alkali [7].
Previous studies revealed that CMC segments roll up aqueous salt systems, altering particle
conformation from rod-like spherical structures and the particle size becomes smaller [19].
The fundamental requirement of many recovery processes is to produce low or ultra-low IFT.
Polymeric surfactants help in reducing the interfacial tension between oil and the displacing
phase, consequently mobilizing residual oil to improve overall oil efficiency. Increase in
capillary number as a consequence of IFT reduction is of practical importance in EOR
processes [20]. Interfacial activity is affected by temperature, concentration, addition of alkali,
salts, etc [21,22]. Investigations were earlier performed to study the interfacial tension
measurements between crude oil and aqueous solutions of SMES and PMES derived from
Jatropha oil [18].
Polymeric surfactant flooding improves the viscosity of the displacing fluid in the reservoir,
thereby increasing the areal and vertical sweep (displacement) efficiency. The effectiveness
and economic feasibility of EOR by flooding is related to the injectivity or injection rate, which
in turn is dependent on the viscosity of the injected fluid [23]. Viscosity is controlled by a
number of factors such as temperature, concentration, presence of salts, etc [24,25]. Normally,
pseudo plastic behavior exhibited by polymer systems is considered beneficial at higher shear
rates since viscosity near the injection well is lowered, which provides improved injectivity

Page | 4
[26]. However, higher viscosities are desired once the injected polymeric surfactant moves far
into the reservoir to achieve desired mobility ratio [9,26]. Recent studies indicate that
viscoelasticity is also an important property of polymer systems that contributes to sweeping
residual oil in pore ends and oil film in pore or pore throats, thereby aiding in improved sweep
efficiency [27]. Hence, both viscometric and viscoelasticity measurements provide important
data about the flow behavior of polymeric surfactants.
This thesis includes studies on the characterization, interfacial activity and rheology of a novel
polymeric surfactant synthesized from castor oil methyl ester. Characterization of the
synthesized polymeric surfactants was performed by FTIR and DLS experiments. FTIR
spectroscopy was useful in characterizing the chemical constitution and bonding nature of the
sample. DLS experiments were performed to understand the particle size profile in the absence
and presence of salts. The results of studies were analyzed to understand flow behavior and
chemical composition of the polymeric surfactant. Attention is primarily focused on achieving
low IFT and high mobility control for polymeric surfactants with different acrylamide-to-
sulfonate ratios at different concentrations. Interfacial tension readings was obtained for both
SMES and PMES solutions with crude oil sample using a Spinning Drop Tensiometer. Effect
of sodium chloride addition on IFT reduction was also studied. Extensive studies were made
with the help of an Advanced Air Bearing Rheometer to study the effect of temperature,
concentration and salt addition (NaCl and CaCl2) on viscosity, shear stress and viscoelastic
properties to determine the justifiability of the polymeric surfactant as an effectual chemical
flooding agent.
Page | 5
Chapter 2
Literature Review
2.1. Current Demand for Oil & Need for EOR
Crude oil makes a major contribution to the world economy today. The provision of heat, light,
and transportation depends on oil and there has not been yet a single energy source to replace
crude oil that is widely integrated. Moreover, the global economy currently depends on the
ability to acquire the energy required and it is indisputable that oil is the main contributor to
this demand. Currently, there is no an energy source available that could compete with oil,
making the world, and mainly the high energy consumers to rely on countries with large
reserves (Energy Information Administration, 2003).
Traditionally oil production strategies have followed primary depletion, secondary recovery,
and tertiary recovery processes. Primary depletion uses the natural reservoir energy to
accomplish the displacement of oil from the porous rocks to the producing wells (Craft et al.,
1991). An average of 10 to 20 percent of original oil in place (OOIP) can be recovered through
primary recovery. Secondary recovery methods are processes in which the oil is subjected to
immiscible displacement with injected fluids such as water or gas. It is estimated that about
thirty to fifty percent of the OOIP can be produced through the entire life of a mature reservoir
that has been developed under primary and secondary recovery methods (Green & Willhite,
1998). The remaining oil is still trapped in the porous media. This is attributed to surface and
interfacial forces (capillary forces), viscosity forces, and reservoir heterogeneities which results
in poor displacement efficiency (Green & Willhite, 1998). Recognition of these facts has led
to the development and use of many enhanced oil recovery (EOR) methods. EOR methods hold
promise for recovering a significant portion of the remaining oil after conventional methods.
Planning for improving or enhancing oil production strategies through EOR methods is one of
the most critical challenges facing the industry today. EOR not only will extend the life of this
important non-renewable resource, but it will also delay a world production decline and
shortage in the energy supply. Realizing the significant potential of EOR, most of oil
companies embarked on a massive journey to advance EOR processes. Various modifications
of EOR methods have been developed to recover at least a portion of the remaining oil. Thermal
Page | 6
processes are the most common type of EOR, where a hot invading phase, such as steam, hot
water or a combustible gas, is injected in order to increase the temperature of oil and gas in the
reservoir and facilitate their flow to the production wells (Green & Willhite, 1998). Another
type of EOR process consists of injecting a miscible phase with the oil and gas into the reservoir
to eliminate the interfacial tension effects. The miscible phase can be a hydrocarbon solvent,
CO2 or an inert gas (N2). Another common EOR technique is chemical flooding which includes
alkalis, surfactants, and polymers, or combinations thereof. The injected alkali and surfactant
agents can lower interfacial tension (IFT) between oil and water, thereby mobilize the residual
oil. Polymers are used to increase the viscosity of the aqueous solution for mobility control
(Green & Willhite, 1998).
2.2. Prospects of Chemical flooding for EOR
Chemical flooding, which has been developed since the early 1950s, is an important method
for enhanced oil recovery that includes alkaline flooding, alkali-surfactant flooding, and alkali-
surfactant-polymer flooding. Surfactant flooding and its variants are EOR processes that have
been employed to recover the residual oil after primary and secondary recovery process.
The efficiency of the chemical EOR is a function of liquid viscosity, relative permeability,
interfacial tensions, wettability, and capillary pressures (Liu, 2008). Even if all the oil is
contacted by the injected chemicals, some oil would still remain in the reservoir. This is due to
the trapping of oil droplets by capillary forces due to high interfacial tension (IFT) between
water and oil (Liu, 2008). Capillary number must be increased in order to reduce the residual
oil saturation. The most logical way to increase the capillary number is to reduce the IFT
(Berger & Lee, 2006; Liu, 2008). Therefore, the principal objective of the chemical process is
to lower the interfacial tension so that the recovery performance will be improved.
The concept of recovering oil by surfactant flooding dates back to 1929 when De Groot was
granted a patent claiming water-soluble surfactants as an aid to improve oil recovery. The
surfactant could reduce the interfacial tension between the brine and residual oil. The use of
proper surfactant can effectively lower the IFT resulting in a corresponding increase in the
capillary number (Berger & Lee, 2006). The success of surfactant flooding depends on many
factors such as formulation, cost of surfactants, availability of chemicals, and oil prices in the
market. In enhanced oil recovery, surfactants could be used in several formulations to enhance

Page | 7
oil production. Some of these formulations are surfactant-alkali flooding, surfactant-polymer
flooding, and alkali-surfactant-polymer flooding. The idea of combining surfactants and alkalis
was first proposed by Reisberg and Doscher in 1956. They added non-ionic surfactants to the
alkali solution to improve oil recovery at laboratory scale. Recent work has shown that the
addition of alkali to the surfactant solution would not only decrease the IFT, but also reduces
the surfactant adsorption on the negatively charged sand surface (Touhami et al., 2001). An
inexpensive alkali could be used with expensive surfactants to achieve both a technically
successful and economically feasible flood.
In order to design an effective surfactant-alkali flooding formulation, it is important to utilize
the synergistic effect between the surfactant and alkali. Surfactants tend to accumulate at the
oil and water interface where the hydrophilic and hydrophobic ends of the molecules can be in
a minimal energy state. This increases the surface pressure and decreases both the interfacial
energy and the IFT. Rudin & Wasan (1992) concluded that the dominant mechanism of the
synergistic effect is the formation of mixed micelles of the surfactants and the generated in situ
surfactant. The mixed micelles cause the IFT to drop significantly (Nelson et al., 1984). At the
same time, surfactant adsorption on sand is reduced by the presence of alkali. The sand surface
will become increasingly negatively charged with an increase in pH and will thereby retard the
adsorption of the anionic surfactant.
A number of alkali-surfactant flooding field tests have been described in the literature (Mayer
et al., 1983; McCafferty and McClaflin, 1992). Success of these processes in an actual reservoir
will depend on how well and for how long the internally-generated surfactant and the
externally-added surfactant work together as intended. Mayer et al., (1983) summarized based
on known field tests the amount of alkali injected and the performance results for early alkaline
flooding processes. Most of the projects were not as profitable as expected. Falls et al., (1992)
reported successful field tests using alkaline-surfactant flooding in recovering water-flood
residual oil from sandstone reservoirs in the White Castle Field, USA. The process recovered
at least 38% of the residual oil after water-flooding.
Alkali-surfactant flooding is a promising method for enhanced oil recovery. With the
combination of alkali and a small amount of surfactant, oil-water IFT can be reduced much
more than with either alkali or surfactant alone. However, the recovery factor of this process is
usually insufficient due to the unfavorable mobility ratio. Hence, a polymer is added to the
surfactant solution to improve the sweep efficiency.

Page | 8
2.3. Prominence in Alkali-Surfactant-Polymer (ASP) Flooding
Alkali-surfactant-polymer (ASP) is considered to be one of the major EOR techniques that can
be successfully used in producing light and medium oils. The advantage of ASP flooding over
conventional alkaline flooding is that ASP can be used for low acid number crudes while
alkaline flooding can only be applied for medium to high acid number crudes. In the ASP
process, alkali reacts with acidic oils to form in-situ surfactant and increases the pH to lower
surfactant adsorption on the porous media. Surfactants are used to lower the IFT between oil
and water while polymer is used to improve the sweep efficiency by providing mobility control
(Elraies et al., 2010). ASP flooding has been extensively evaluated in the laboratory and widely
used in field applications with great success. In recent years, many ASP field pilot tests have
been conducted in USA, India, Venezuela, and China (Pitts et al 2006; Pratap & Gauma, 2004;
Clara et al 2001; Wang et al., 1999). The ASP process uses the benefits of the three flooding
methods, and oil recovery is greatly enhanced by decreasing interfacial tension (IFT),
increasing the capillary number, enhancing microscopic displacing efficiency, and improving
the mobility ratio (Pingping et al., 2009). However, even with these advantages and the success
of ASP projects, the process is not without some disadvantages.
The application of alkali-surfactant polymer in the Daqing oil field in China is an example of
successful field trials. However, because of the high cost of surfactants, this process has not
been expanded (Wang et al., 1997). In order to reduce the cost of the surfactant and to enlarge
the swept volume, this technology was upgraded to alkali-surfactant-polymer flooding. The
combination of alkali surfactant-polymer is expected to cause the residual oil to be
economically recovered from the reservoir.
An earlier paper written by Hou and co-workers (2001) addresses the corrosion and scale
problems that occurred during the ASP flood in Daqing field. The strong alkali had detrimental
effects on polymer performance and in many cases additional polymer was required to achieve
the desired viscosity (Wang et al., 2006). Nasr-El-Din et al., (1992) conducted an experimental
study to examine the effectiveness of alkali concentration in ASP performance. Their
experiments confirmed an exponential decrease in viscosity of the combined ASP slug with
the increase in alkali concentration. The selection of proper surfactants is one of the key factors
for chemical EOR application. Surfactant should be stable under reservoir conditions resulting
in an ultralow interfacial tension. Wangqi & Dave, (2004) conducted screening studied by
interfacial tension experiments using different types of surfactants and validated by core flood

Page | 9
tests. The IFT results showed wide range of IFT reduction, depends on the surfactant
concentration and type. Core flood results indicated that 11.2% OOIP could be recovered when
the selected surfactant concentration and type are combined with alkali and polymer. Flaaten
et al., 2008 performed the screening and optimization of surfactant formulations by
microemulsion phase behavior using various combinations of surfactants, co-solvents, and
alkalis. Branched alcohol propoxy sulfates and internal olefin sulfonates demonstrated a
superior performance when mixed with conventional alkali. The recovery performance
indicated that nearly 100% of residual oil was recovered with very low surfactant adsorption.
2.4. Chemical EOR challenges
Most pilot tests reported in the 2000s accomplished a higher oil recovery than those in the
1970s and 1980s. Improvements in the functionality of the chemicals and a better
understanding of the process mechanisms are the causes for these successes. These field tests
indicate that surfactant flooding and its variants can be technically successful. However, the
main downside for these chemical EOR applications was still the high manufacture cost of
surfactants and the cost of raw materials. The recovered oil by this process was not economical
or the economical and technical risk was too high compared with the oil price (Austad & Milter,
2000). Therefore, a lot of work has been recently conducted to develop an economical
surfactant when the crude oil prices remained high. To reduce the cost of surfactant production,
much attention is focused toward agriculturally derived oleo-chemicals as alternative
feedstocks (Gregorio, 2005). Many surfactants have been produced from natural oils to satisfy
EOR requirements (Wuest et al., 1994; Li et al., 2000). Soybean and coconut oils are the most
popular raw materials used to derive oleo-chemical feedstocks such as fatty alcohol and esters
(Hill, 2000).
2.5. Potential possibilities in the synthesis of a new polymeric
surfactant
This section of the chapter is focused on the description of the development of a new polymeric
surfactant with the aim to overcome some of the existing problems associated with
conventional ASP flooding. The goal is to produce a new surfactant that will be both

Page | 10
economical and effective for interfacial tension reduction and viscosity control. The basic idea
was to attach the sulfonate group to a hydrophobic group of an associative polymer chain. A
hydrophobically modified polymer is one class of water soluble associative polymer that
contains a small number of hydrophobic groups (Abdala, 2002). Hydrophobically modified
polymers have either a telechelic structure in which the chains are end-capped with the
hydrophobic groups, or more complicated comb-like structures in which the hydrophobic
groups are randomly grafted to the polymer backbone. The backbone has a polyelectrolyte
feature and is composed of a polymer of acrylamide or acrylic acid, and ethyl acrylate. Upon
neutralization, the polymer backbone adopts a more extended conformation allowing the
hydrophobic groups to associate forming a transient network structure (Abdala, 2002).
Herein, a single step route that is similar to the method reported by Ye et al., (2004) was used
to produce a new polymeric surfactant via the polymerization process. This surfactant was
designed to graft the sulfonated group to the polymer backbone as one component system for
interfacial tension reduction and viscosity control. Therefore, the polymerization was
conducted with an excess of different surfactant to acrylamide ratios. Sodium methyl ester
sulfonate (SMES) was used as a surfactant feedstock in the polymerization process. Because
the goal was to design a cost effective surfactant, the SMES was synthesized from castor oil as
the raw material. Additionally, it is not a petroleum derivative and has limited food and
medicinal applications.
Page | 11
Chapter 3
Work Overview
3.1. Previous and Relevant Works
The synthesis of polymeric surfactant from castor oil methyl ester was earlier carried out by
our fellow researcher Mr. Keshak Babu under the guidance of Dr. Ajay Mandal in the
Department of Petroleum Engineering. It basically involved two stages of manufacture. First,
sodium methyl ester sulfonate (SMES) was extracted from castor oil. Finally, polymerization
was performed in order to synthesize polymer methyl ester sulfonate (PMES) from SMES.
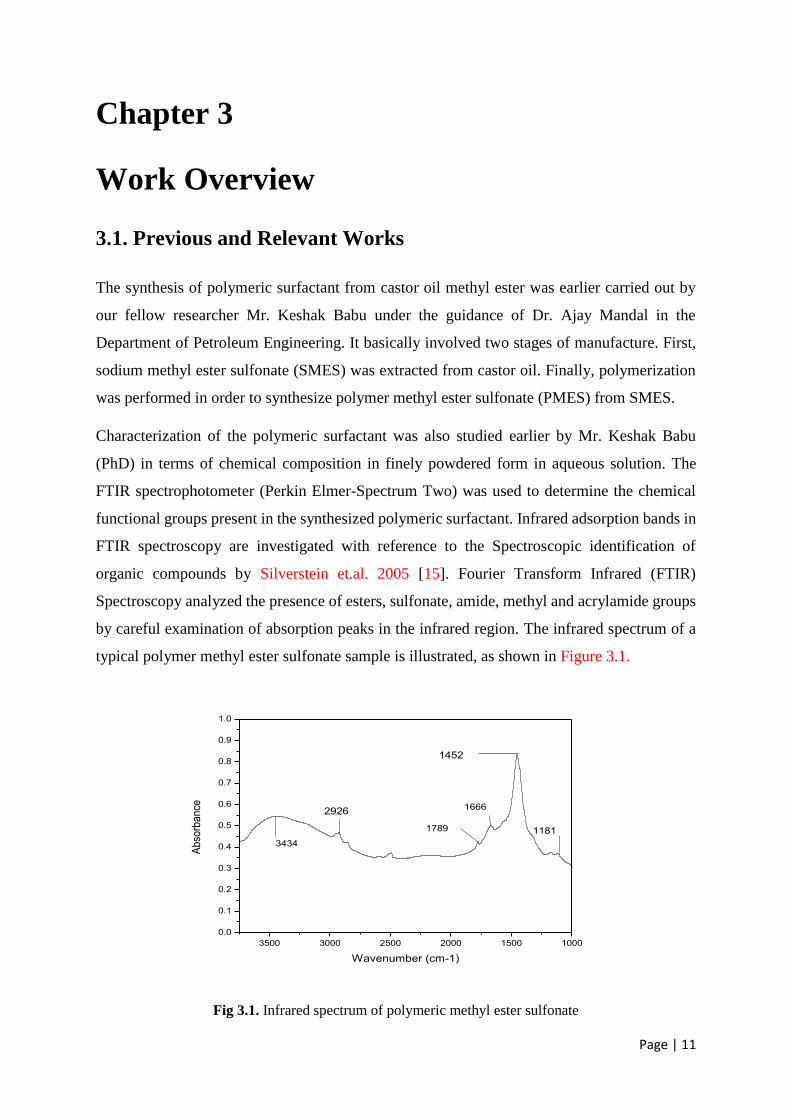
Characterization of the polymeric surfactant was also studied earlier by Mr. Keshak Babu
(PhD) in terms of chemical composition in finely powdered form in aqueous solution. The
FTIR spectrophotometer (Perkin Elmer-Spectrum Two) was used to determine the chemical
functional groups present in the synthesized polymeric surfactant. Infrared adsorption bands in
FTIR spectroscopy are investigated with reference to the Spectroscopic identification of
organic compounds by Silverstein et.al. 2005 [15]. Fourier Transform Infrared (FTIR)
Spectroscopy analyzed the presence of esters, sulfonate, amide, methyl and acrylamide groups
by careful examination of absorption peaks in the infrared region. The infrared spectrum of a
typical polymer methyl ester sulfonate sample is illustrated, as shown in Figure 3.1.
3500 3000 2500 2000 1500 1000
0.0
0.1
0.2
0.3
0.4
0.5
0.6
0.7
0.8
0.9
1.0
Abso
rba
nce
Wavenumber (cm-1)
3434
29261666
1452
11811789
Fig 3.1. Infrared spectrum of polymeric methyl ester sulfonate

Page | 12
3.2. Focus of the Present Study
This thesis encompasses the study of a novel polymeric surfactant derived from castor oil via
the polymerization of sodium methyl ester sulfonate. Since this is a newly synthesized
polymeric surfactant, no prior work was done in this particular topic. I have focused my
research work on particle size characterization, interfacial studies and flow behavior of the
synthesized polymeric surfactant (PMES).
The particle size analysis of the synthesized polymeric surfactant in aqueous solution was
determined at 30 ±0.1°C using ZETASIZER (Nano-S90, Nano series Malvern). The laser
wavelength and the scattering angle were 633 nm and 90° respectively. The refractive index
(1.332) of each solution was measured with the help of a portable refractometer (Refracto 30PX
model). This data would support useful correlation with interfacial tension measurements.
Interfacial tensions between different polymeric surfactant and SMES solutions with crude oil
were measured with the help of spinning drop method. Model SVT 15 spinning drop
tensiometer equipped with video camera was used to determine the IFT at 298 K. SMES or
PMES in aqueous solution was introduced into a high-temperature capillary tube with desirable
specifications.
Rheological measurements were carried out using a Bohlin Gemini 2 Rheometer, manufactured
by M/S Malvern Instruments Limited, UK. It is a model of an ‘Advanced Air Bearing
Rheometer’. Ewart Mooney Geometry was used to obtain data in both viscometry and
oscillatory mode measurements. The viscosity and shear rate measurements in both modes
were carried out using cup and bob (coaxial cylinder) measuring system. This experiment is
useful in the determination of viscosity, shear stress and viscoelastic properties, if any, for flow
behavior analysis.
The polymeric surfactant PMES with different acrylamide-to-sulfonate weight ratios is
introduced and labelled in the table below.
Acrylamide-to-sulfonate Ratio 0.4:1 0.5:1 0.6:1 0.8:1 1:1
Notation P1 P2 P3 P4 P5

Page | 13
Chapter 4
DLS Characterization
4.1. Principle of DLS Analysis
Dynamic Light Scattering or DLS (also referred to as Photon Correlation Spectroscopy or
Quasi-Elastic Light Scattering) is one of the most techniques employed for the determination
of particle size profile in solutions. It allows particle sizing down to 1 nm diameter.
Dynamic Light Scattering (DLS) works by measuring the intensity of light scattered by the
molecules in the sample as a function of time. When light is scattered by a molecule some of
the incident light is scattered. If the molecule was stationary then the amount of light scattered
would be constant. But, as all molecules in solution diffuse with Brownian motion in relation
to the detector, interference (constructive or destructive) occurs causing a change in light
intensity. By measuring the time scale of light intensity fluctuations, DLS provides information
regarding the average size, size distribution, and poly-dispersity of molecules in solution.
The faster the particles diffuse, the faster the intensity will change (if the light was bright
enough this would be seen as a twinkling effect). The speed of these changes is thus directly
related to the motion of the molecule. The diffusion of the molecules is essentially controlled
by the following factors:
Temperature – the higher the temperature, the faster the molecules will move.
Viscosity of the Solvent – the more viscous the solvent, the slower the molecules will
move.
The size of the molecules – the bigger the molecules, the slower the molecules will
move.
If the temperature and solvent are constant and known, the variation in the intensity of the
scattered light is directly related to the “size” of the molecule. This number is referred to as
the hydrodynamic diameter (Dh). The hydrodynamic diameter represents the sphere, which
is defined by the molecule rotating in all directions plus the hydration layer, modified by how

Page | 14
easy it is to pass the solvent through that volume. It is actually a measure of how easy it is to
move the molecule through the solvent.
4.2. Experimental Section
4.2.1. Material(s) Required
The material used in FTIR experiment was polymeric methyl ester sulfonate (PMES) in
powdered form. The acrylamide-to-sulfonate ratio in the polymeric surfactant PMES was
essentially varied on a comparative basis. Sodium chloride (NaCl) was also added at 1%, 2%
and 3% to the solutions to study its effect on particle size distribution.
4.2.2. Apparatus Description
Fig 4.1. ZETASIZER (Nano-S90, Malvern) apparatus for DLS analysis
The particle size analysis of the synthesized polymeric surfactant in aqueous solution was
determined at 30 ±0.1°C using ZETASIZER (Nano-S90, Nano series Malvern). The laser
wavelength and the scattering angle were 633 nm and 90° respectively. The refractive index
(1.332) of each solution was measured with the help of a portable refractometer (Refracto 30PX
model). All samples of the polymeric surfactant were prepared in distilled water and filtered
using a 0.2 µm pore size membrane in order to remove possible dust particles from the solution.

Page | 15
The absorbance of PMES solutions were measured using an UV-1800 (UV- VIS
spectrophotometer Shimadzu, Japan) at a wavelength of 217 nm. The value of absorbance was
obtained at a value of 2.33.
4.2.3. Measurable quantities
Particle size distribution profile in terms of a curve representing relationship between
hydrodynamic diameter and concentration in aqueous solution (using DLS apparatus)
Refractive Index (using refractometer)
Absorbance (using spectrophotometer)
4.2.4. Technical Features
The Zetasizer Nano S90 consists of the below mentioned technical features: Size measurement from 0.3nm (diameter) to 5 microns using 90 degree scattering
optics.
Molecular weight measurement down to 9,800Da.
A ‘Quality Factor’ and ‘Expert Advice System’ gives the confidence of having an
expert at your shoulder.
21CFR part 11 software option enables compliance with ER/ES.
Research software option gives access to further features and analysis algorithms for
the light scattering specialist.
Automation of measurements using an autotitrator option.
Alternative laser, 50mW at 532nm for samples incompatible with the standard 633nm
laser fitted.
Optical filter option to improve measurements with fluorescent sample.
Temperature range extension option to 120°C.
Systems can be upgraded to add zeta potential at a later date.
Page | 16
4.2.5. Zetasizer Nano S90 Specifications
1. Particle size and molecular size
Measurement range: 0.3nm – 5.0 microns* (diameter).
Measurement principle: Dynamic Light Scattering.
Minimum sample volume: 20µL.
Accuracy: Better than +/-2% on NIST traceable latex standards.
Precision / Repeatability: Better than +/-2% on NIST traceable latex standards.
Sensitivity: 10mg/mL (Lysozyme)
2. Molecular weight.
Measurement range: Molecular weight
Measurement principle: Static Light Scattering using Debye plot.
Minimum sample volume: 20µL (3-5 sample concentrations required).
Accuracy: +/- 10% typical
Temperature control range: 0°C - 90°C +/-0.1**, 120°C option.
Light source: He-Ne laser 633nm, Max 4mW.
Laser safety: Class 1.
Power: 100VA.
3. Weight and dimensions:
Dimensions: 320mm, 600mm, 260mm (W,D,H).
Weight: 21 (kg)
4. Operating environment:
Temperature range: 10°C – 35°C.
Humidity: 35% - 80% non-condensing.
Page | 17
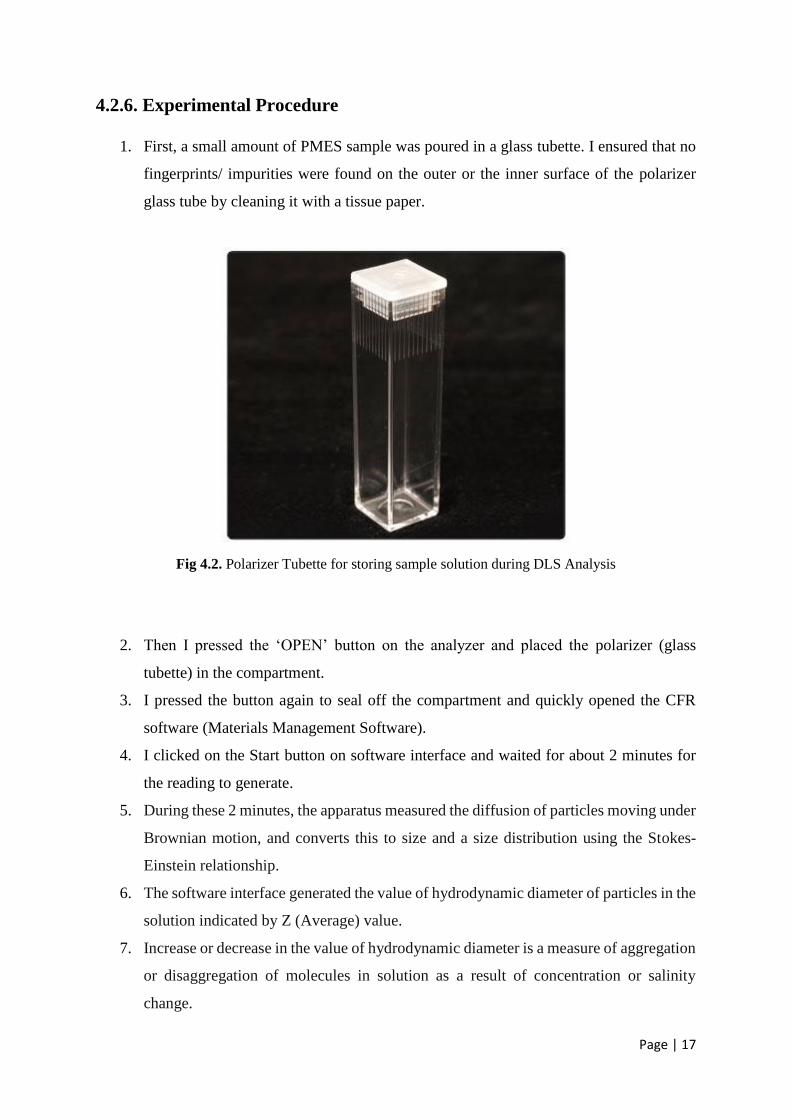
4.2.6. Experimental Procedure
1. First, a small amount of PMES sample was poured in a glass tubette. I ensured that no
fingerprints/ impurities were found on the outer or the inner surface of the polarizer
glass tube by cleaning it with a tissue paper.
Fig 4.2. Polarizer Tubette for storing sample solution during DLS Analysis
2. Then I pressed the ‘OPEN’ button on the analyzer and placed the polarizer (glass
tubette) in the compartment.
3. I pressed the button again to seal off the compartment and quickly opened the CFR
software (Materials Management Software).
4. I clicked on the Start button on software interface and waited for about 2 minutes for
the reading to generate.
5. During these 2 minutes, the apparatus measured the diffusion of particles moving under
Brownian motion, and converts this to size and a size distribution using the Stokes-
Einstein relationship.
6. The software interface generated the value of hydrodynamic diameter of particles in the
solution indicated by Z (Average) value.
7. Increase or decrease in the value of hydrodynamic diameter is a measure of aggregation
or disaggregation of molecules in solution as a result of concentration or salinity
change.
Page | 18
8. This procedure was repeated for other samples with/ without NaCl (sodium chloride)
addition.
9. After proper examination of samples, I cleaned the polarizer/ tubette to prevent
incorrect analysis by light scattering technique.
10. Finally, I switched off the analyzer assembly and saved the data in pdf format for further
examination.
4.3. Results and Discussions
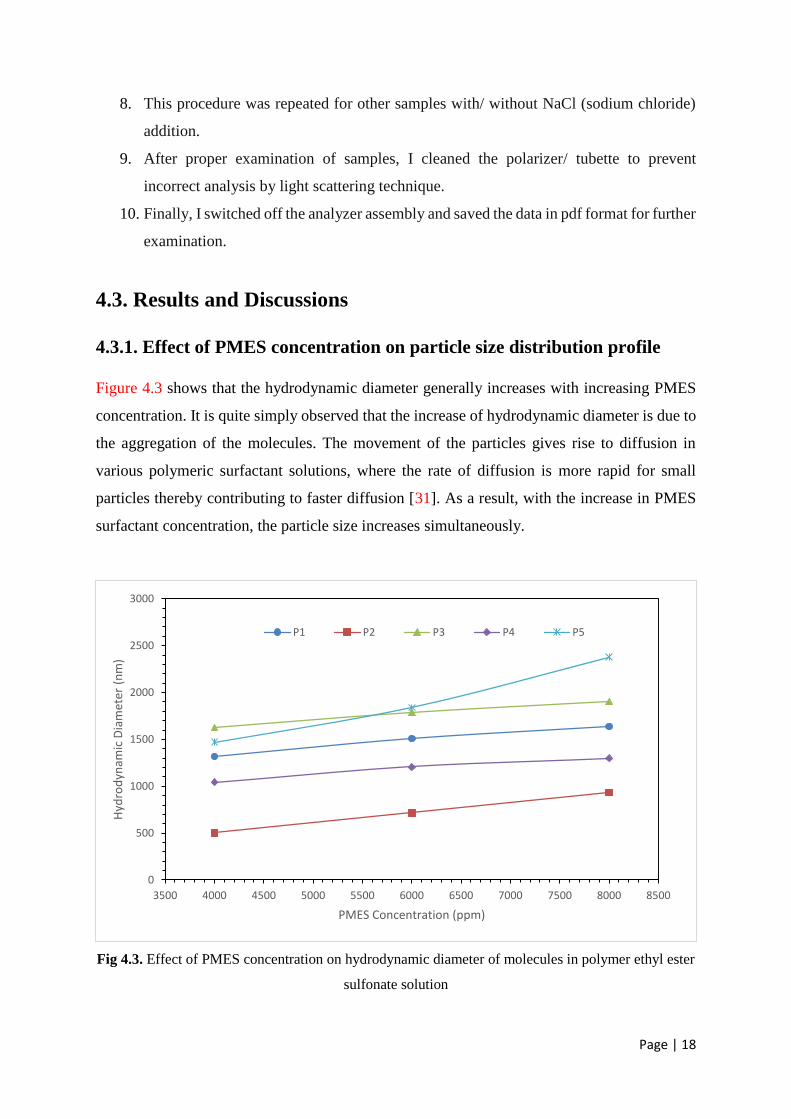
4.3.1. Effect of PMES concentration on particle size distribution profile
Figure 4.3 shows that the hydrodynamic diameter generally increases with increasing PMES
concentration. It is quite simply observed that the increase of hydrodynamic diameter is due to
the aggregation of the molecules. The movement of the particles gives rise to diffusion in
various polymeric surfactant solutions, where the rate of diffusion is more rapid for small
particles thereby contributing to faster diffusion [31]. As a result, with the increase in PMES
surfactant concentration, the particle size increases simultaneously.
Fig 4.3. Effect of PMES concentration on hydrodynamic diameter of molecules in polymer ethyl ester
sulfonate solution
0
500
1000
1500
2000
2500
3000
3500 4000 4500 5000 5500 6000 6500 7000 7500 8000 8500
Hyd
rod
ynam
ic D
iam
eter
(n
m)
PMES Concentration (ppm)
P1 P2 P3 P4 P5

Page | 19
4.3.2. Effect of salt addition on particle size distribution profile
Fig 4.4. Effect of PMES concentration on hydrodynamic diameter of PMES solution containing 1%
NaCl
Fig 4.5. Effect of PMES concentration on hydrodynamic diameter of PMES solution containing 2%
NaCl
0
200
400
600
800
1000
1200
1400
1600
3500 4000 4500 5000 5500 6000 6500 7000 7500 8000 8500
Hyd
rod
ynam
ic D
iam
eter
(n
m)
PMES Concentration (ppm)
P1 (1% NaCl) P2 (1% NaCl) P3 (1% NaCl) P4 (1% NaCl) P5 (1% NaCl)
0
200
400
600
800
1000
1200
1400
1600
3500 4000 4500 5000 5500 6000 6500 7000 7500 8000 8500
Hyd
rod
ynam
ic D
iam
eter
(n
m)
PMES Concentration (ppm)
P1 (2% NaCl) P2 (2% NaCl) P3 (2% NaCl) P4 (2% NaCl) P5 (2% NaCl)

Page | 20
Fig 4.6. Effect of PMES concentration on hydrodynamic diameter of PMES solution containing 3%
NaCl
The effect of sodium chloride 1%, 2% and 3% (mass %) on DLS experiment also plays an
important role for enhanced oil recovery as shown in Figure 4.4, 4.5 and 4.6. Hydrodynamic
diameter was generally found to decrease with increase in salt (concentration) addition since
micelles may disaggregate to smaller size and may even break down to polymer chains. This
may be due to rolling up of CMC segments in aqueous salt solutions, thereby changing particle
structure from rod-like to spherical shape. As a result, the size of micelles becomes smaller.
This could help decrease the surface tension and interfacial tension [7].
0
200
400
600
800
1000
1200
1400
1600
3500 4000 4500 5000 5500 6000 6500 7000 7500 8000 8500
Hyd
rod
ynam
ic D
iam
eter
(n
m)
PMES Concentration (ppm)
P1 (3% NaCl) P2 (3% NaCl) P3 (3% NaCl) P4 (3% NaCl) P5 (3% NaCl)

Page | 21
Chapter 5
Interfacial Tension Studies
5.1 Principle of IFT measurement by Spinning Drop Method
In this method, a droplet of crude oil (lower density liquid) is injected into a surfactant solution
(higher density liquid) contained inside a rotating horizontal glass tube. For individual speeds
of rotation applied in the method, the drop attains an equilibrium shape, which is determined
by the balance between interfacial tension and pressure difference at interface due to centrifugal
force and density difference between the surfactant and crude oil. The drop attains a stable
shape when the above forces are balanced. Flow is assumed to be Newtonian.
Since the rotation of the horizontal tube creates a centrifugal force towards the tube walls, the
liquid drop will start to deform into an elongated shape; this elongation stops when the
interfacial tension and centrifugal forces are balanced. The surface tension between the two
liquids (for bubbles: between the fluid and the gas) can then be derived from the shape of the
drop at this equilibrium point. A device used for such measurements is called a spinning drop
tensiometer.
An approximate theory was developed by Bernard Vonnegut in 1942, to measure the surface
tension of the fluids, which is based on the principle that the interfacial tension and centrifugal
forces are balanced at mechanical equilibrium. This theory assumes that the droplet's length L
is much greater than its radius R, so that it may be approximated as a straight circular cylinder.
Fig 5.1. Spinning Drop in a Spinning Drop Tensiometer along the Spinning Axis

Page | 22
The relation between the surface tension and angular velocity of a droplet can be obtained in
different ways. One of them involves considering the total mechanical energy of the droplet as
the summation of its kinetic energy and its surface energy:
The kinetic energy of a cylinder of length L and radius R rotating about its central axis is
given by
in which
is the moment of inertia of a cylinder rotating about its central axis and ω is its angular velocity.
The surface energy of the droplet is given by
in which V is the constant volume of the droplet and σ is the interfacial tension. Then the total
mechanical energy of the droplet is
in which Δρ is the difference between the densities of the droplet and of the surrounding fluid.
At mechanical equilibrium, the mechanical energy is minimized, and thus
Substituting in
for a cylinder and then solving this relation for interfacial tension yields
Page | 23
This equation is known as Vonnegut’s expression. Interfacial tension of any liquid that gives a
shape very close to a cylinder at steady state, can be estimated using this equation. The straight
cylindrical shape will always develop for sufficiently high ω; this typically happens for L/R >
4. Once this shape has developed, further increasing ω will decrease R while
increasing L keeping LR2 fixed to meet conservation of volume.
5.2. Experimental Section
5.2.1. Materials Required
Crude oil used in the study was acquired from ONGC, Ankleshwar Asset. The crude oil is light
and its API index is found to be 38.2° at 15°C by using a pycnometer. The surfactant used in
the experiment was Sodium methyl ester sulfonate (SMES). Acrylamide monomer and
potassium persulfate were also obtained as important constituents in the polymeric surfactant.
Acetone was used as an extracting agent. The acrylamide-to-sulfonate ratio in the polymeric
surfactant PMES was essentially varied on a comparative basis. Sodium chloride (NaCl) was
also added in varying concentrations to SMES and polymeric methyl ester sulfonate (PMES)
for interfacial measurements.
5.2.2. Apparatus Description
Interfacial tensions between different polymeric surfactant and SMES solutions with crude oil
were measured with the help of spinning drop method. Model SVT 15 spinning drop
tensiometer equipped with video camera was used to determine the IFT at 298 K. In this
equipment, a horizontally arranged capillary glass tube filled with a bulk phase and a
specifically lighter drop phase is set in rotation. The diameter of the drop which is elongated
by centrifugal force correlates with the interfacial tension.
For each sample, SMES or PMES in aqueous solution was introduced into the high-temperature
capillary tube. The tube was first filled with the desired solution and then closed with Teflon
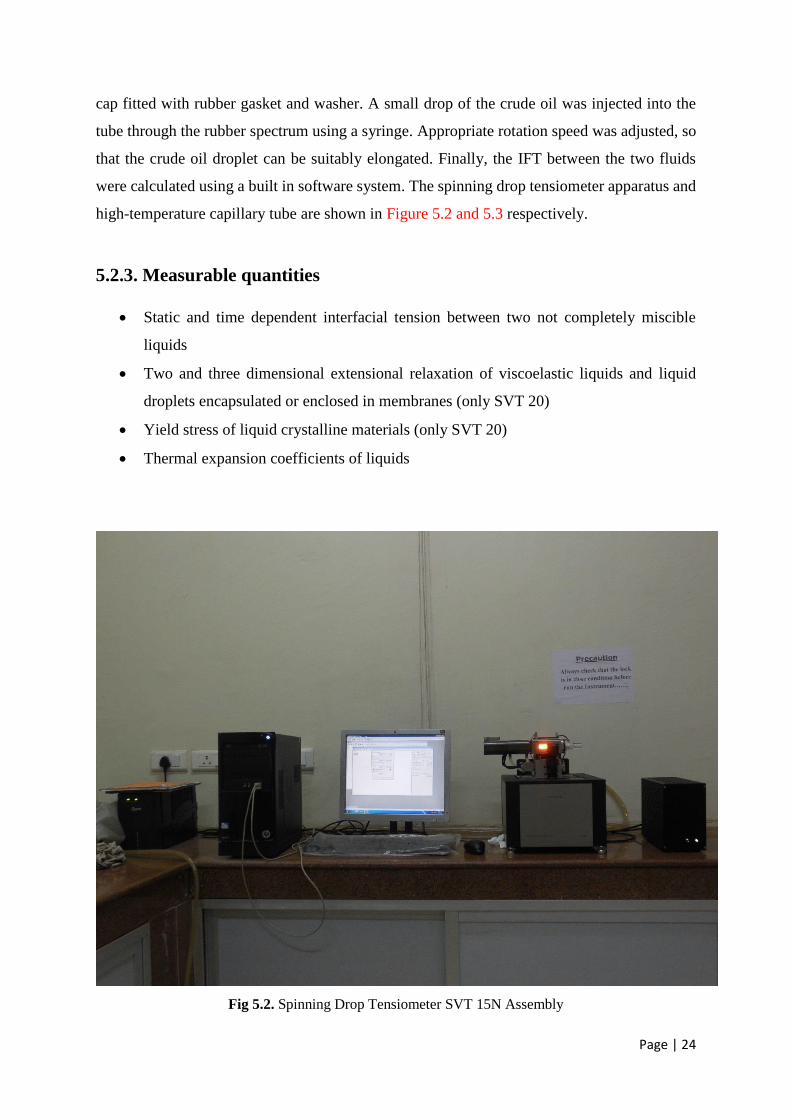
Page | 24
cap fitted with rubber gasket and washer. A small drop of the crude oil was injected into the
tube through the rubber spectrum using a syringe. Appropriate rotation speed was adjusted, so
that the crude oil droplet can be suitably elongated. Finally, the IFT between the two fluids
were calculated using a built in software system. The spinning drop tensiometer apparatus and
high-temperature capillary tube are shown in Figure 5.2 and 5.3 respectively.
5.2.3. Measurable quantities
Static and time dependent interfacial tension between two not completely miscible
liquids
Two and three dimensional extensional relaxation of viscoelastic liquids and liquid
droplets encapsulated or enclosed in membranes (only SVT 20)
Yield stress of liquid crystalline materials (only SVT 20)
Thermal expansion coefficients of liquids
Fig 5.2. Spinning Drop Tensiometer SVT 15N Assembly

Page | 25
5.2.4. Technical Features
The SVT 15N consists of the basic instrument with the following technical features:
Capillary system with electronically commutated, highly dynamic and vibration free
D.C. motor.
Software controlled speed; the SVT 20 also realizes stepwise and sinusoidal variations
of the rotational speed for the measurement of relaxational effects.
Intensity adjustable, stroboscopic and permanent LED-lighting with build-in triggering
of the video system for the observation of droplets in different orientations relative to
the CCD-camera system.
Fig 5.3. High Temperature Capillary Tube FEC 622/400-HT

Page | 26
SVT 20 with touch screen for real-time observation of temperature and other variables
of state; additional manual control of rotational speed, capillary tilt angle, stroboscopic
view angle and intensity of illumination.
Measuring capillaries with a diameter of 12 or 6.25mm, made of borosilicate glass;
optionally made of fused silica for UV light polymerization experiments
(encapsulation) of droplets.
Capillary block with software controlled tilt mechanism.
Automatic, software controlled positioning of the optical zoom lens for an easy
centering of the droplet along the optical axis.
High-performance six-fold power zoom lens with an integrated continuous fine focus
Video system with CCD-camera.
High-performance video digitizing board (frame grabber) for the PC.
Serial RS 232C interface with PC connecting cable, in the SVT 20 with additional
interface for the optional liquid dosing unit LDU and other accessories.
Automatic Calibration tool for scaling of droplet sizes for the video system.

Page | 27
Fig 5.4. Spinning Drop Video Tensiometer SVT 15N
5.2.5. SVT-15 Tensiometer Specifications
1. Measuring range- Interfacial tension: 1·10-6… 2·103 mN/m
2. Speed range- 0 ... 20000 rpm (0 ... 10000 rpm SVT 15)
3. Resolution- ± 0.001 rpm, long term stability of the absolute rotational speed: ± 0.5 rpm,
maximum speed step in relaxation tests: max. ± 2000 rpm/s (SVT 20)
4. Oscillation frequency- 0.01 … 200 Hz at a minimum speed of 3000 rpm (SVT 20)
5. Tilt angle of the capillary block- ± 10°, resolution: 0.0023°
6. Optics- Six-fold zoom lens (0.7 ... 4.5-fold magnification) with integrated fine focus
(± 6 mm) and high light transmitting capacity
7. CCD-camera- with a resolution of max. 768 x 576 pixels,
8. Field of view (FOV)- 1.9 x 1.4 to 12.1 x 9.1 mm
9. Optical distortion- < 0.05 %

Page | 28
10. Video system- High-performance image processing system with 132 MBytes/s data
transfer rate (compatible to European standard CCIR and US standard RS-170),
Up to 50 images/s digitizing speed
11. Measuring methods- Spinning Drop-Method
12. Diameter of capillary- outer 12 mm, inner 8 mm (optional: outer6.25 mm, inner 2.45
mm)
13. Temperature measurement and range- 2x Pt100 input for -60° … 450° C (Pt100
optional), 0.1 K resolution; 1/3 DIN IEC 751 (± 0.03 %), class B; Temperature range:
-10 ... 130 °C
14. Dimensions (L x W x H)- 390 x 390 x 400 mm
15. Weight- 25 kg (base unit SVT: 25 kg, power supply module: 10 kg)
16. Power supply- 100- 240 VAC; 50 … 60 Hz; 450 VA
17. Alternative/Supplementary units and accessories- Fitting/Capillary-Set for small
amounts of liquids; Precision-dosing systems; Control and Analysis Software
SCA20/SVT + SCA25/SVT; complete PC systems
5.2.6. Capillary Tube Specifications
1. Specification- FEC 622/400-HT
2. Type- Fast Exchange Capillary for High Temperature
3. Part no. 2000792
4. Material- Borosilicate Glass
5. Temperature Range- 30- 180° C
6. Outer diameter- 6.22 mm
7. Inner diameter- 4.00 mm
8. Visible Length- 50 mm

Page | 29
5.2.7. Experimental Procedure
1. I make samples of desired concentrations ( above, below and on the CMC values)
2. I clean the capillary glass tube with water, acetone and/ or tetrachloro-ethylene.
3. I filled the capillary tube with the desired surfactant solution (SMES and PMES
solutions) with varying concentrations.
4. I ensured that the water supply to the tensiometer motor assembly is maintained, so as
to prevent heating.
5. I inserted the tube containing surfactant and polymeric surfactant solutions into the
capillary block and tightened the connections.
6. The tensiometer was in “OPEN” condition.
7. I rotated the tube at about 200-400 rpm speed by using the SVT software interface.
8. I injected a pint-sized amount of crude oil into the capillary tube during low-speed
rotation. I ensured that there were no air droplets in the tube, especially in the injected
crude sample.
Fig 5.5. A typical Spinning Drop (Crude Oil) in Capillary Tube in SVT 15N Tensiometer
9. I adjusted the rotational speed (~3000rpm).
10. I adjusted the camera position to view the specified drop on the screen.
11. I adjusted the tilt angle via SVT interface to stop/ hold the drop.
12. Timed Measurement (Using Profile Fit)
Page | 30
Move fitting box (frame) over the drop.
Select Profile Fit/ Fast Fit.
Extract Profile button.
Verify that the profile is detected correctly.
Set time interval (~ 5 seconds). Ensure the time-interval must be long enogh to
carry out finding of profile.
Open a “New Result Window” to save measuring values.
Click the “L” (Tracking/ Timed Measurement) button to start IFT
measurements at 5- second interval.
During the measurement, a graph between IFT (Mn/m) along Y-axis vs Time
stamp (s) along X- axis.
After a satisfactory number of measurements for a specified sample is obtained,
I clicked the “L” button to stop IFT measurement.
13. I saved the reading data in graph and table formats (as pdf/ xps format).
14. After a considerable number of readings, I repeated the procedure from 2 to 13 for
samples of other concentrations.
15. The value where IFT value is lowest is the modified CMC value.
16. At this CMC value, I varied Nacl concentrations (10%) to test the samples and repeat
the procedure from 2 to 13 and find the optimum salinity at CMC.
17. I cleaned the equipment and tube with acetone/ water after the testing of samples is
complete.
18. I switched off the SVT system, tensiometer and refrigerated water circulator. I covered
the tensiometer and capillary block with foam.

Page | 31
5.3. Results and Discussions
5.3.1. Effect of surfactant concentration on interfacial tension measurements
for SMES solution
The Interfacial Tension (IFT) of a surfactant- crude oil system depends on the adsorption of
the surfactant at the crude oil/ water interface. Surfactant type, concentration of surfactant,
temperature and other factors affect the adsorption of surfactants at the crude oil- water
interface. Surfactant concentration influences the IFT variation between crude oil and the water
system.
Fig 5.6. Variation of interfacial tension with surfactant concentration for SMES solution at 298 K
0
0.03
0.06
0.09
0.12
0.15
0 1000 2000 3000 4000 5000 6000 7000 8000
Inte
rfac
ial T
ensi
on
(m
N/m
)
Surfactant Concentration (ppm)

Page | 32
Fig 5.7. Snapshot of spinning drop (crude oil) at CMC value (5500 ppm) for SMES solution
Figure 5.6 shows the variation of interfacial tension values with SMES concentration in
aqueous solution at 298 K. Using spinning drop method, minimum values of IFT were obtained
for SMES solution at 500 ppm, 1500 ppm, 3500 ppm, 4500 ppm, 5500 ppm, 6500 ppm and
7500 ppm concentrations. It was observed that IFT initially decreases with surfactant
concentration. However after a particular limit, the value of IFT increases slightly. This value
of surfactant concentration at which interfacial tension is found to be minimum is called
‘Critical Micelle Concentration’. This behavior is observed because the surfactant molecule
starts to aggregate and form micelle in concentration at the interfaces, thereby restricting or
minimizing interfacial activity. As a result, IFT value after CMC either increases or remains
constant.
In IFT data measurements for SMES, the value of CMC was found to be 5500 ppm. The
corresponding minimum value of IFT was 0.0344 mN/m.

Page | 33
5.3.2. Effect of NaCl addition on interfacial tension measurements for SMES
solution
Fig 5.8. Variation of interfacial tension with NaCl salt concentration for 5500 ppm SMES solution at
298 K
Fig 5.9. Snapshot of spinning drop (crude oil) at optimal salinity (3.5%) at CMC (5500 ppm) for
SMES solution
0
0.005
0.01
0.015
0.02
0.025
0.03
0.035
0.04
0 1 2 3 4 5 6
Inte
rfac
ial T
ensi
on
(m
N/m
)
NaCl Concentration (%)

Page | 34
IFT was found to decrease drastically with salt addition as shown in Figure 5.8. It was observed
from the above figure that at 298 K, with increase in NaCl concentration in SMES solution,
interfacial tension initially decreases and then increases at a particular concentration of NaCl
salt. This is referred to as optimal salinity. Beyond optimal salinity, further addition of salt has
no or detrimental effects on interfacial activity.
The IFT was found to decrease upto a magnitude of the order of 0.05 on salt addition. The
lowest obtained value of IFT was 0.00197 mN/m at an optimal salinity of 3.5% NaCl. This
combined effect of salt and surfactant in crude oil/ water systems is often referred to as the
synergistic effect of salt-surfactant mixture on the IFT.
5.3.3. Effect of concentration on IFT of polymeric surfactant (PMES)
solutions with different acrylamide-to-surfactant ratios
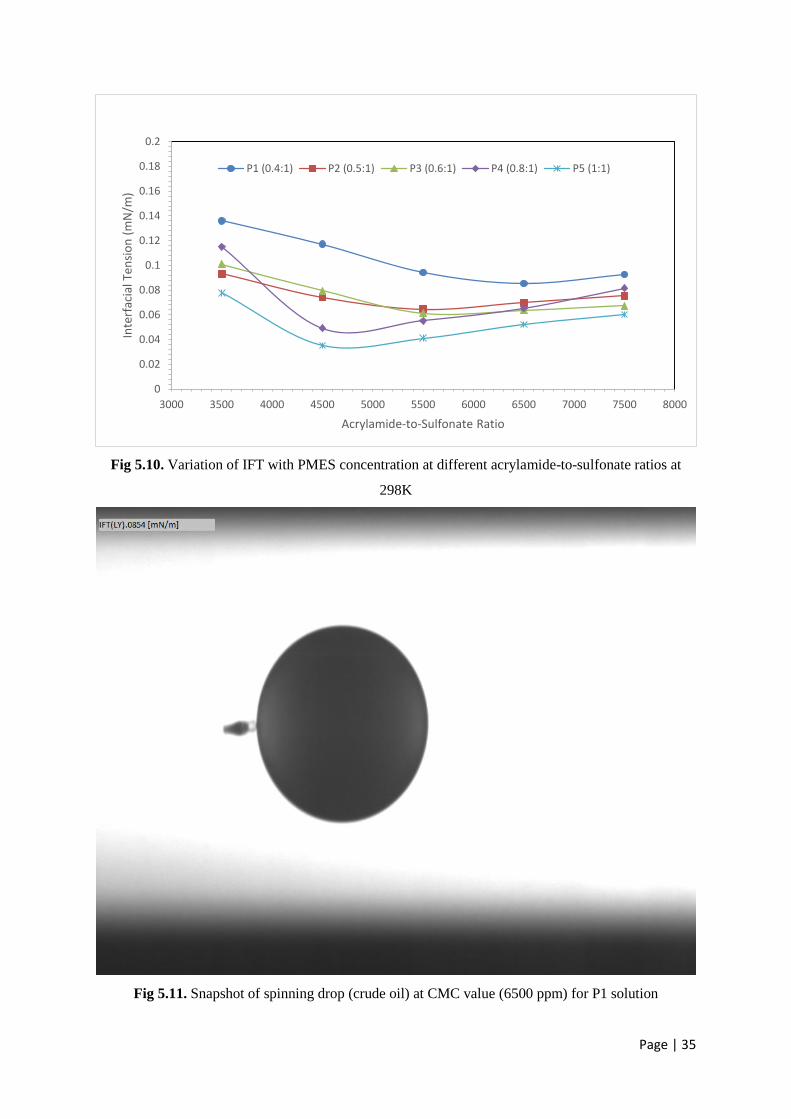
IFT studies were carried out on polymeric surfactant solutions with varying acrylamide-to-
sulfonate ratios at 3500 ppm, 4500 ppm, 5500 ppm, 6500 ppm and 7500 ppm at 298 K. The
IFT values were found to decrease with increase in concentration and after that particular
concentration, it begins to increase slightly. The CMC values of various polymer methyl ester
sulfonate samples were obtained in this experiment. Figure 5.10 shows that the CMC values of
P1, P2, P3, P4 and P5 polymeric surfactants in aqueous solutions were 6500 ppm, 5500 ppm,
5500 ppm, 4500 ppm and 4500 ppm in descending order. The minimum IFT values at CMC
for P1, P2, P3, P4 and P5 were observed to be 0.0854, 0.0647, 0.0612, 0.0493 and 0.0352
mN/m respectively. It is hence clear from the interfacial data that P5 solution is best suited for
interfacial tension reduction. Another advantage is that P5 achieves low IFT value at lower
concentration (4500 ppm) than other polymeric surfactant solutions. The spinning drop
snapshots at the above mentioned IFT values are shown in Figure 5.11, 5.12, 5.13, 5.14 and
5.15.
Page | 35
Fig 5.10. Variation of IFT with PMES concentration at different acrylamide-to-sulfonate ratios at
298K
Fig 5.11. Snapshot of spinning drop (crude oil) at CMC value (6500 ppm) for P1 solution
0
0.02
0.04
0.06
0.08
0.1
0.12
0.14
0.16
0.18
0.2
3000 3500 4000 4500 5000 5500 6000 6500 7000 7500 8000
Inte
rfac
ial T
ensi
on
(m
N/m
)
Acrylamide-to-Sulfonate Ratio
P1 (0.4:1) P2 (0.5:1) P3 (0.6:1) P4 (0.8:1) P5 (1:1)

Page | 36
Fig 5.12. Snapshot of spinning drop (crude oil) at CMC value (5500 ppm) for P2 solution
Fig 5.13. Snapshot of spinning drop (crude oil) at CMC value (5500 ppm) for P3 solution

Page | 37
Fig 5.14. Snapshot of spinning drop (crude oil) at CMC value (4500 ppm) for P4 solution
Fig 5.15. Snapshot of spinning drop (crude oil) at CMC value (4500 ppm) for P5 solution

Page | 38
5.3.4. Effect of NaCl addition on the most effective polymeric surfactant
solution
Sodium chloride (NaCl) was varied at 0.5%, 1.5%, 2.5%, 3.5%, 4.5% and 5.5% to investigate
the effect of salt addition on IFT of the polymeric surfactant best suited for IFT reduction to
allow good mobility control. The interfacial tension decreased initially with increase in salt
concentration and then increased slightly for P5 polymeric surfactant (acrylamide-to-sulfonate
ratio 1:1) at 4500 ppm at 298 K. From Figure 5.16, it is evident that optimal salinity was
measured at 4.5% with interfacial tension value of 0.00432 mN/m. The spinning drop image is
shown in Figure 5.17.
Fig 5.16. Effect of NaCl addition on interfacial tension values for P5 sample (acrylamide-to-sulfonate
ratio 1:1) at 4500 ppm aqueous solution at 298 K
0
0.005
0.01
0.015
0.02
0.025
0.03
0.035
0.04
0 1 2 3 4 5 6
Inte
rfac
ial T
ensi
on
(m
N/m
)
NaCl Concentration (%)

Page | 39
Fig 5.17. Snapshot of spinning drop (crude oil) at optimal salinity (4.5%) at CMC (4500ppm) for P5
solution
5.3.5. Effect of Acrylamide-to-Sulfonate Ratios on salt-polymeric surfactant
mixture with lowest IFT value
Figure 5.18. Effect of variation of acrylamide-to-sulfonate ratios on the IFT values at 4500 ppm
PMES solution containing 4.5% NaCl at 298 K
0.003
0.0035
0.004
0.0045
0.005
0.0055
0.006
0.0065
0.007
0.3 0.4 0.5 0.6 0.7 0.8 0.9 1 1.1
Inte
rfac
ial T
ensi
on
(m
N/m
)
Acrylamide-to-Sulfonate Ratio

Page | 40
Figure 5.19. Snapshot of spinning drop (crude oil) at optimal salinity (4.5%) at CMC (4500 ppm) for
salt-P4 (acrylamide-to-surfactant ratio 0.8:1) polymeric surfactant mixture
The most effective salt-polymeric surfactant mixture in terms of interfacial was obtained at
4500 ppm with 4.5% NaCl content. The acrylamide-to-surfactant ratios were varied to study
its relative effect on IFT measurements. It was evident from Figure 5.18 that P4 (acrylamide-
to-surfactant ratio 0.8:1) is more effectual than other polymeric surfactants to lower IFT to
ultra-low value than polymeric surfactants at combined conditions of CMC and optimal
salinity. This data is relevant in formulating potent salt-polymeric surfactant mixtures for
improved oil recovery by mechanism of interfacial tension reduction and desired mobility
control.

Page | 41
Chapter 6
Rheological Studies
6.1. Principle of rheometry
Rheometry is a powerful technique for the measurement of complex shear rheology across all
material types – sensitive enough to measure the viscosity of dilute polymer solutions, and yet
robust enough to measure the viscoelasticity of high modulus polymers or composites.
Rotational rheometry is ideal for discerning structural and compositional changes of materials,
which can be critical controlling factors in flow and deformation properties, and ultimately
product stability and performance.
The basic principle of rheometry is to perform simple experiments where the flow
characteristics such as the shear stress distribution and the velocity profile are known in
advance and can be imposed. Under these conditions, it is possible to infer the flow curve, that
is, the variation of the shear stress as a function of the shear rate, from measurements of flow
quantities such as torque and the rotational velocity for a rotational viscometer.
A rheometer is usually an instrument, which can exert a torque/force on a material and
accurately measures its response with time (or conversely, it can impose a strain and measures
the resulting torque).
The basics of the rotational rheometry technique are as follows:
The sample is loaded into the gap of a measuring system, or geometry – such as a cone and
plate or a concentric cylinder system – specifically designed to impose simple shear flow when
rotated.
The measuring system is supported by a virtually frictionless air-bearing, and driven by an
ultra-low inertia motor, coupled to an ultra-high precision position encoder. The sample and
measuring system are also temperature controlled.
Various rheological characteristics of the sample can be determined by rotating, oscillating or
applying a step function to the measuring system – either by controlling motor torque (stress
controlled rheometry) or position change (strain controlled rheometry).
Page | 42
Common test modes are rotational (or flow) to measure shear viscosity, and oscillation to
measure dynamic material properties such as viscoelastic modulus and phase angle.
Rotational rheometry also enables other rheological properties to be evaluated, including
yield stress, thixotropy, creep and recovery and stress relaxation.
6.2. Experimental Section
6.2.1. Material(s) Required
Polymeric methyl ester sulfonate (PMES) solutions at different concentrations were
experimented for rheological data. Salts, namely sodium chloride (NaCl) and calcium
chloride (CaCl2) were also added at different concentrations to study their individual
effects on viscosity.
6.2.2. Apparatus Description
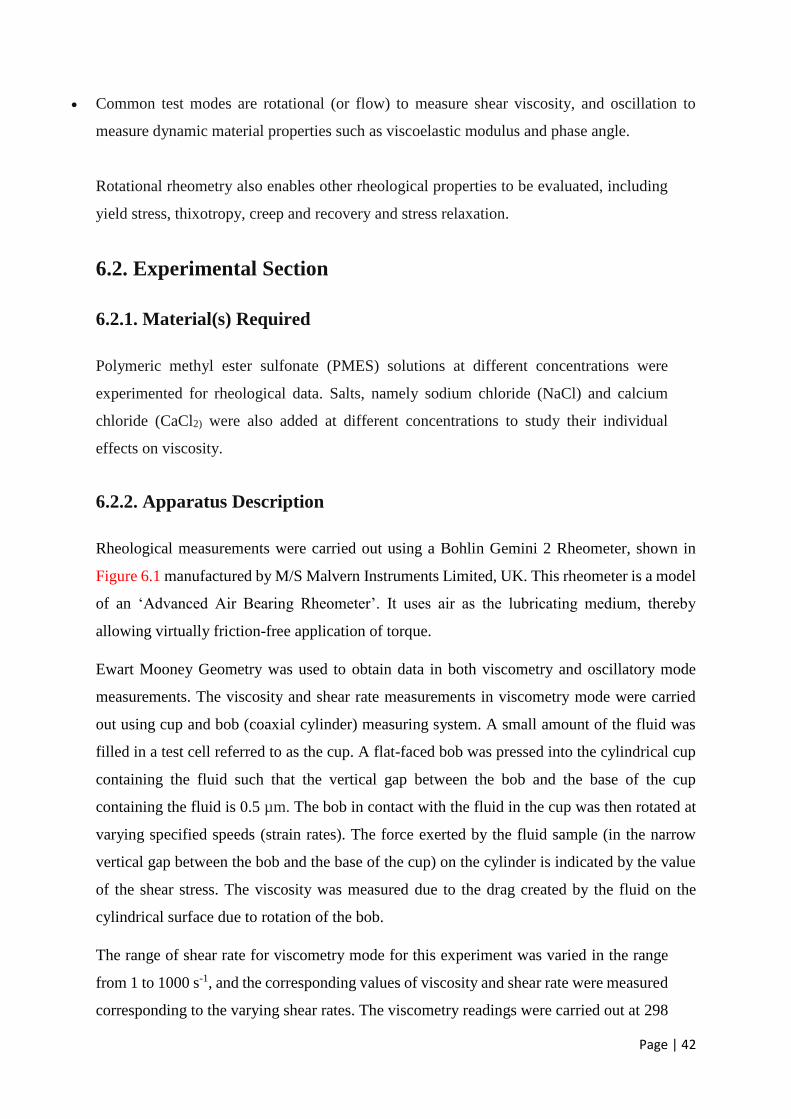
Rheological measurements were carried out using a Bohlin Gemini 2 Rheometer, shown in
Figure 6.1 manufactured by M/S Malvern Instruments Limited, UK. This rheometer is a model
of an ‘Advanced Air Bearing Rheometer’. It uses air as the lubricating medium, thereby
allowing virtually friction-free application of torque.
Ewart Mooney Geometry was used to obtain data in both viscometry and oscillatory mode
measurements. The viscosity and shear rate measurements in viscometry mode were carried
out using cup and bob (coaxial cylinder) measuring system. A small amount of the fluid was
filled in a test cell referred to as the cup. A flat-faced bob was pressed into the cylindrical cup
containing the fluid such that the vertical gap between the bob and the base of the cup
containing the fluid is 0.5 µm. The bob in contact with the fluid in the cup was then rotated at
varying specified speeds (strain rates). The force exerted by the fluid sample (in the narrow
vertical gap between the bob and the base of the cup) on the cylinder is indicated by the value
of the shear stress. The viscosity was measured due to the drag created by the fluid on the
cylindrical surface due to rotation of the bob.
The range of shear rate for viscometry mode for this experiment was varied in the range
from 1 to 1000 s-1, and the corresponding values of viscosity and shear rate were measured
corresponding to the varying shear rates. The viscometry readings were carried out at 298
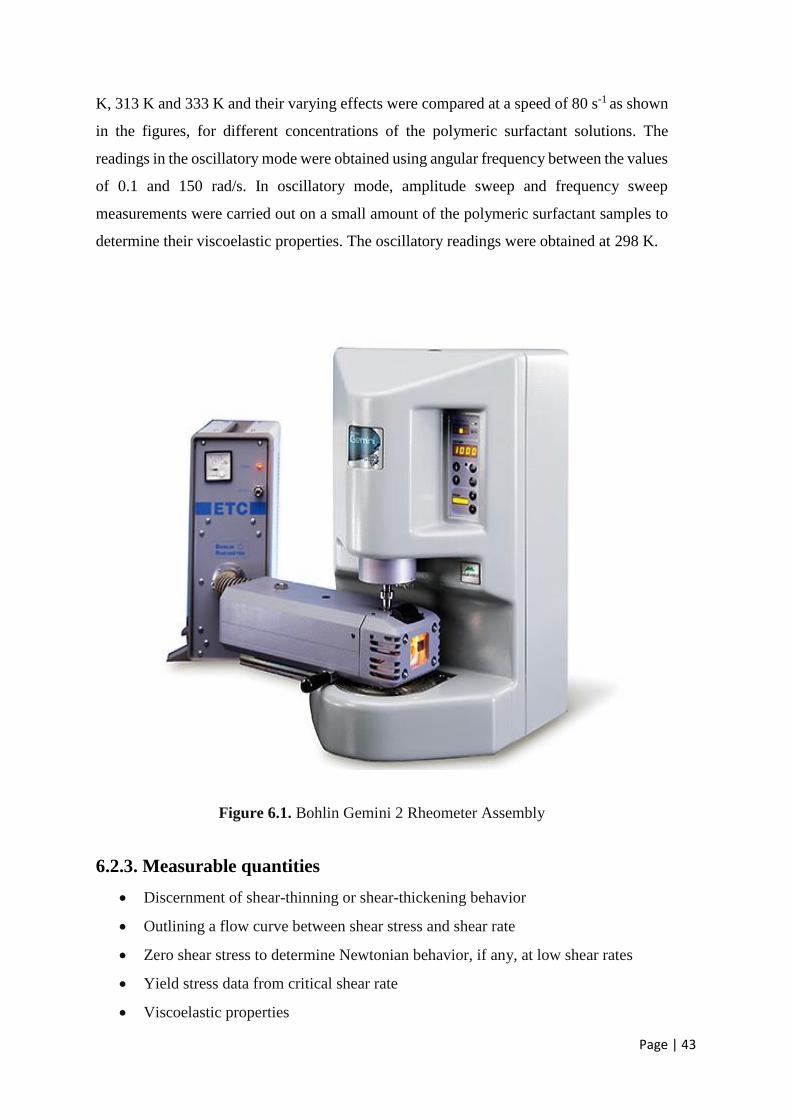
Page | 43
K, 313 K and 333 K and their varying effects were compared at a speed of 80 s-1 as shown
in the figures, for different concentrations of the polymeric surfactant solutions. The
readings in the oscillatory mode were obtained using angular frequency between the values
of 0.1 and 150 rad/s. In oscillatory mode, amplitude sweep and frequency sweep
measurements were carried out on a small amount of the polymeric surfactant samples to
determine their viscoelastic properties. The oscillatory readings were obtained at 298 K.
Figure 6.1. Bohlin Gemini 2 Rheometer Assembly
6.2.3. Measurable quantities
Discernment of shear-thinning or shear-thickening behavior
Outlining a flow curve between shear stress and shear rate
Zero shear stress to determine Newtonian behavior, if any, at low shear rates
Yield stress data from critical shear rate
Viscoelastic properties

Page | 44
6.2.4. Technical Features
The Bohlin Gemini 2 Rheometer consists of the below mentioned technical features:
Rotonetic 2 Drive, patented, adaptive control technology which is optimized for both
strain controlled and stress controlled operation.
High resolution torque mapping system to allow low torques to be set very accurately.
Enabled testing in all conventional strain and stress controlled modes including stress
relaxation, creep and viscometric modes
Full range of EasySwap™ temperature controllers which include fully integrated peltier
devices, a forced gas oven with optional liquid nitrogen cooling and electrical heating.
Quick and easy configureuration to allow testing on a wide range of materials and
applications including polymer melts, composites, fluids and semi-solids.
6.2.5. Bohlin Gemini 2 Rheometer Specifications
1. Torque range: 0.05µNm …. 200mNm Controlled stress/rate viscometry. Controlled
stress/strain oscillation.
2. Torque resolution: Better than 1 nNm Position resolution: 50 nano radians
3. Frequency range: 1 micro Hz …. 150Hz
4. Controlled speed range (CR mode): 0.01 milli rad/sec …. 600 rad/sec
5. Measurable speed range (CS mode): 10 nano rad/sec …. 600 rad/sec
6. Normal force NI measurement range: 0.001 …. 20N (50N option)
7. Step change in strain: <10ms.
8. Temperature range (dependent on control used): -150°C …. 550°C
9. Temperature Controls:
Fluids Circulator: -40°C …. 250°C
ETO (Extended Temperature Option): -15°C …. 300°C
Melts Oven: ambient …. 450°C
Peltier Plate: -30°C …. 200°C
Peltier Cylinder: -20°C …. 180°C
Universal Peltier Option- Coaxial Cylinder or Cone-Plate Geometries
ETC (Extended Temperature Cell): ambient …. 550°C

Page | 45
ETC with optimal LTU (Low Temperature Unit): -150°C …. 550°C
10. Nominal operating voltage: 110V, 220V
11. Size (with Peltier plate): 52 cm (H) * 33 cm (W) * 37 cm (D)
12. Weight (with Peltier plate): 28 kg
13. Optional equipment(s)
Measuring Systems
Vacuum Disposable Plates: Peltier Plate, Melts Oven or ETO
High Pressure (Sealed Cell): 40 bar pressure, 30°C …. 150°C
High Pressure/ High Temperature Cell: 300 bar pressure, ambient …. 300°C
Optical UV Curing Cell
Optical Analysis Cell
Immobilisation Cell
Electro-rheology Cell: DC Voltage upto 10 Kv
6.2.6. Experimental Procedure
1. I utilized the cup and bob (concentric cylinder) measuring system in order to
generate rheological data.
2. The cup, referred to as Mooney cell, is first cleaned thoroughly to remove any
impurities present.
3. I filled the cup with PMES samples upto the brim of the cup, and then placed the
bob at the center of the cup.
4. It is then ensured that a small amount of fluid is present in the narrow vertical gap
between cup and bob.
5. The assembly is then to for a stationary position.
6. The rheometer is then switched ‘ON’ and Gemini software is then opened.
7. First the experiment is conducted in viscometry mode at 298 K, 313 K and 333 K
for viscosity and shear stress measurements.
The range of values for shear rate and number of samplings is calibrated. In
our experiment, the shear rate is between 1 and 250 s-1 with 31 sample
points.

Page | 46
Then, we start the experiment to obtain 31 sample readings for both
viscosity and shear stress at equal intervals (linear/ logarithmic) of shear
rates between 1 and 250 s-1.
The viscosity and shear stress profile is obtained and saved in .xls format.
8. The above procedure is the repeated for PMES solutions containing salts (NaCl and
CaCl2) to obtain viscosity and flow curves for further analysis.
9. After the viscometric readings are completed, I started the oscillatory mode for
viscoelastic measurements at 298 K.
First, amplitude sweep experiments are conducted to study and decide the
frequency range for LVR (Linear Viscoelastic Condition) to achieve the
range for stability.
Frequency sweep measurements are then performed for LVR range of
angular frequencies, say 0.1 to 150 rad/s and predetermined number of
sample points, say 31.
The viscoelastic curves depicting the values of storage and loss moduli at
31 different frequency reading are obtained.
The curve is then copied and saved in .xls formal for further analysis.
10. The rheometer is then switched ‘OFF’ by plugging off the motor assembly and the
cylindrical assembly is the disassembled.
11. After repeating the viscometric and oscillatory measurement procedure explained
earlier, the values are separately plotted and checked for any discrepancies.
12. The viscosity and shear stress curve depicts the flow behavior of the PMES samples
and determines if it has shear thinning or shear thickening characteristics.
13. The shear stress curves depict the zero shear viscosity for each sample, portraying
the Newtonian flow region at low shear rates.
14. The viscoelastic curves portrayed in oscillatory mode shows the relationship of
dynamic moduli with angular frequency. Further analysis shows a crossover point
between storage modulus and loss modulus curves to determine the specific
frequency.
15. The value of SF obtained from all sample measurements represents the transition
point between the elastic and viscous phases.
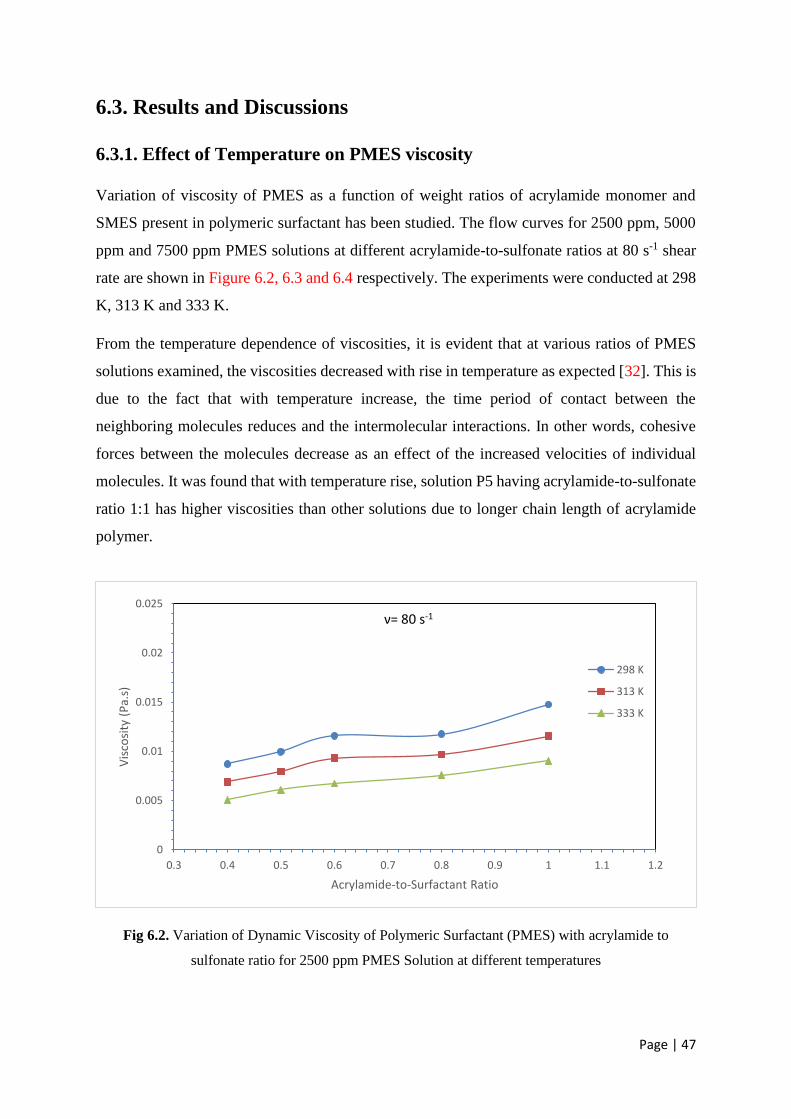
Page | 47
6.3. Results and Discussions
6.3.1. Effect of Temperature on PMES viscosity
Variation of viscosity of PMES as a function of weight ratios of acrylamide monomer and
SMES present in polymeric surfactant has been studied. The flow curves for 2500 ppm, 5000
ppm and 7500 ppm PMES solutions at different acrylamide-to-sulfonate ratios at 80 s-1 shear
rate are shown in Figure 6.2, 6.3 and 6.4 respectively. The experiments were conducted at 298
K, 313 K and 333 K.
From the temperature dependence of viscosities, it is evident that at various ratios of PMES
solutions examined, the viscosities decreased with rise in temperature as expected [32]. This is
due to the fact that with temperature increase, the time period of contact between the
neighboring molecules reduces and the intermolecular interactions. In other words, cohesive
forces between the molecules decrease as an effect of the increased velocities of individual
molecules. It was found that with temperature rise, solution P5 having acrylamide-to-sulfonate
ratio 1:1 has higher viscosities than other solutions due to longer chain length of acrylamide
polymer.
Fig 6.2. Variation of Dynamic Viscosity of Polymeric Surfactant (PMES) with acrylamide to
sulfonate ratio for 2500 ppm PMES Solution at different temperatures
0
0.005
0.01
0.015
0.02
0.025
0.3 0.4 0.5 0.6 0.7 0.8 0.9 1 1.1 1.2
Vis
cosi
ty (
Pa.
s)
Acrylamide-to-Surfactant Ratio
298 K
313 K
333 K
ν= 80 s-1

Page | 48
Fig 6.3. Variation of Dynamic Viscosity of Polymeric Surfactant (PMES) with acrylamide to
sulfonate ratio for 5000 ppm PMES Solution at different temperatures
Fig 6.4. Variation of Dynamic Viscosity of Polymeric Surfactant (PMES) with acrylamide to
sulfonate ratio for 7500 ppm PMES Solution at different temperatures
0
0.005
0.01
0.015
0.02
0.025
0.03
0.3 0.4 0.5 0.6 0.7 0.8 0.9 1 1.1 1.2
Vis
cosi
ty (
Pa.
s)
Acrylamide-to-Surfactant Ratio
298 K
313 K
333 K
ν= 80 s-1
0.005
0.01
0.015
0.02
0.025
0.03
0.035
0.3 0.4 0.5 0.6 0.7 0.8 0.9 1 1.1 1.2
Vis
cosi
ty (
Pa.
s)
Acrylamide-to-Sulfonate Ratio
298 K
313 K
333 K
ν= 80 s-1

Page | 49
6.3.2. Effect of PMES concentration and acrylamide-to-sulfonate ratio on
viscosity and shear Stress
PMES concentrations in different acrylamide-to-sulfonate ratios were varied at 1500 ppm,
3000 ppm, 4500 ppm and 6000 ppm at 298 K. For viscometric analysis, the shear rate was
varied between 1 s-1 and 250 s-1. Solution viscosities increased with increasing concentration
for each PMES solution. As expected, viscosity was found to increase with concentration of
the polymeric surfactant. The viscosity profiles of polymeric surfactant solutions with varying
arylamide-to-sulfonate ratio at different concentrations, as found experimentally, have been
depicted in Figure 6.5, 6.6, 6.7, 6.8 and 6.9 as shown. It was observed that P5 recorded higher
viscosity than other solutions at low shear rates. Shear stress was expectedly found to increase
with concentration. As P5 yeilds best rheological data, the shear stress profile for P5 polymeric
surfactant is depicted in Figure 6.10. Consequently, P5 permits better mobility control and
greater sweep efficiency than other polymeric surfactants during displacement and recovery
processes [9]. Furthermore, viscosities of solutions were found to increase with increasing
acrylamide-to-sulfonate ratios. Increased viscosity may be attributed to their increased
hydrodynamic volume which has the twin effect of blocking the motion of solvent molecules
and retarding their motion by binding [33]. Shear stress profile depicted from experimental
results also showed increase with acrylamide-to-sulfonate ratio, shown in Figure 6.10.

Page | 50
Fig 6.5. Experimental Steady shear viscosity profile of P1 solution (with acrylamide-to-sulfonate ratio
0.4: 1) at 298 K at varying concentrations
Fig 6.6. Experimental Steady shear viscosity profile of P2 solution (with acrylamide-to-sulfonate ratio
0.5: 1) at 298 K at varying concentrations
0.001
0.01
0.1
1 10 100 1000
Vis
cosi
ty (
Pa.
s)
Shear rate (1/s)
1500 ppm 3000 ppm 4500 ppm 6000 ppm
0.001
0.01
0.1
1 10 100 1000
Vis
cosi
ty (
Pa.
s)
Shear rate (1/s)
1500 ppm 3000 ppm 4500 ppm 6000 ppm
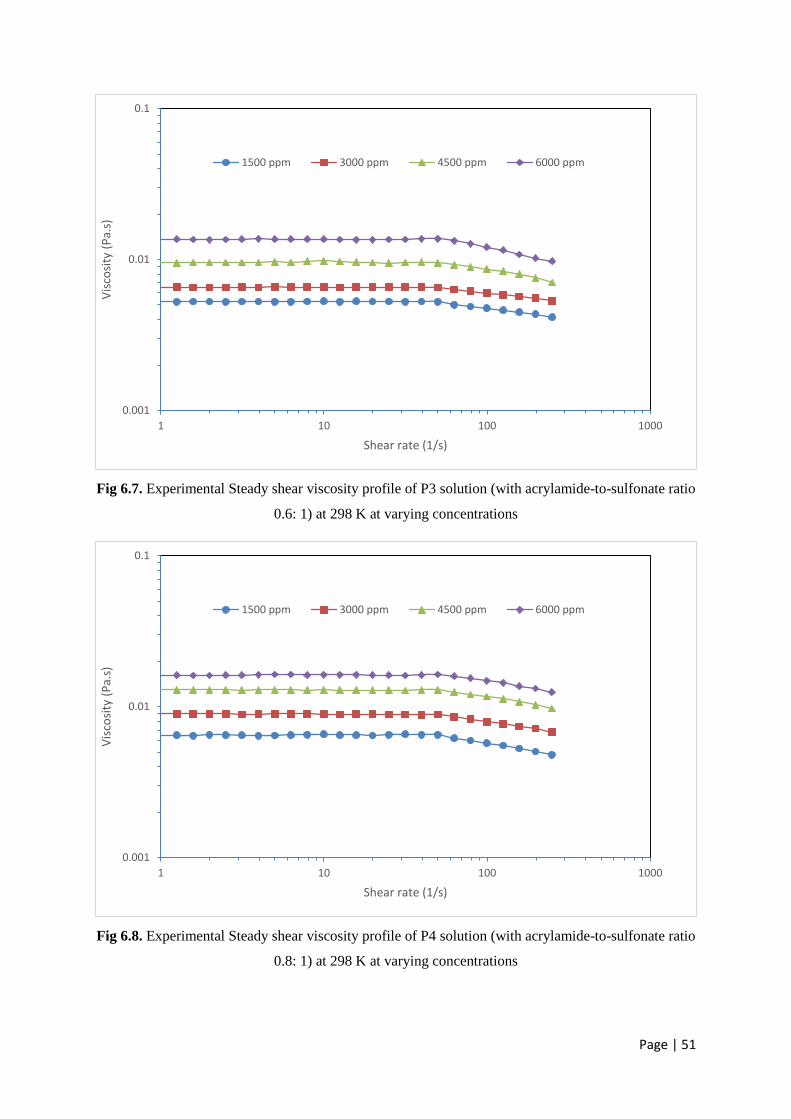
Page | 51
Fig 6.7. Experimental Steady shear viscosity profile of P3 solution (with acrylamide-to-sulfonate ratio
0.6: 1) at 298 K at varying concentrations
Fig 6.8. Experimental Steady shear viscosity profile of P4 solution (with acrylamide-to-sulfonate ratio
0.8: 1) at 298 K at varying concentrations
0.001
0.01
0.1
1 10 100 1000
Vis
cosi
ty (
Pa.
s)
Shear rate (1/s)
1500 ppm 3000 ppm 4500 ppm 6000 ppm
0.001
0.01
0.1
1 10 100 1000
Vis
cosi
ty (
Pa.
s)
Shear rate (1/s)
1500 ppm 3000 ppm 4500 ppm 6000 ppm

Page | 52
Fig 6.9. Experimental Steady shear viscosity profile of P5 solution (with acrylamide-to-sulfonate ratio
1: 1) at 298 K at varying concentrations
Fig 6.10. Experimental Shear stress profile of P5 solution (with acrylamide-to-sulfonate ratio 1: 1) at
298 K at varying concentrations
0.001
0.01
0.1
1 10 100 1000
Vis
cosi
ty (
Pa.
s)
Shear rate (1/s)
1500 ppm 3000 ppm 4500 ppm 6000 ppm
0
0.5
1
1.5
2
2.5
3
3.5
4
4.5
5
0 50 100 150 200 250 300
Shea
r St
ress
(P
a)
Shear Rate (1/s)
1500 ppm
3000 ppm
4500 ppm
6000 ppm
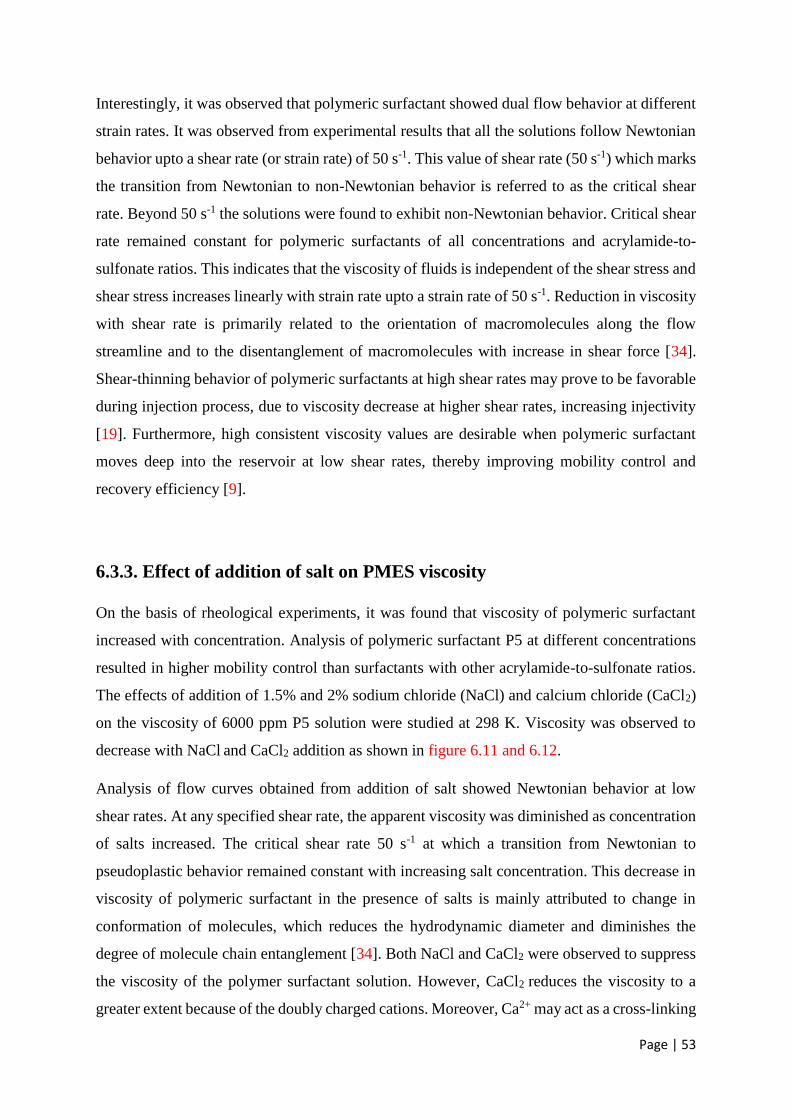
Page | 53
Interestingly, it was observed that polymeric surfactant showed dual flow behavior at different
strain rates. It was observed from experimental results that all the solutions follow Newtonian
behavior upto a shear rate (or strain rate) of 50 s-1. This value of shear rate (50 s-1) which marks
the transition from Newtonian to non-Newtonian behavior is referred to as the critical shear
rate. Beyond 50 s-1 the solutions were found to exhibit non-Newtonian behavior. Critical shear
rate remained constant for polymeric surfactants of all concentrations and acrylamide-to-
sulfonate ratios. This indicates that the viscosity of fluids is independent of the shear stress and
shear stress increases linearly with strain rate upto a strain rate of 50 s-1. Reduction in viscosity
with shear rate is primarily related to the orientation of macromolecules along the flow
streamline and to the disentanglement of macromolecules with increase in shear force [34].
Shear-thinning behavior of polymeric surfactants at high shear rates may prove to be favorable
during injection process, due to viscosity decrease at higher shear rates, increasing injectivity
[19]. Furthermore, high consistent viscosity values are desirable when polymeric surfactant
moves deep into the reservoir at low shear rates, thereby improving mobility control and
recovery efficiency [9].
6.3.3. Effect of addition of salt on PMES viscosity
On the basis of rheological experiments, it was found that viscosity of polymeric surfactant
increased with concentration. Analysis of polymeric surfactant P5 at different concentrations
resulted in higher mobility control than surfactants with other acrylamide-to-sulfonate ratios.
The effects of addition of 1.5% and 2% sodium chloride (NaCl) and calcium chloride (CaCl2)
on the viscosity of 6000 ppm P5 solution were studied at 298 K. Viscosity was observed to
decrease with NaCl and CaCl2 addition as shown in figure 6.11 and 6.12.
Analysis of flow curves obtained from addition of salt showed Newtonian behavior at low
shear rates. At any specified shear rate, the apparent viscosity was diminished as concentration
of salts increased. The critical shear rate 50 s-1 at which a transition from Newtonian to
pseudoplastic behavior remained constant with increasing salt concentration. This decrease in
viscosity of polymeric surfactant in the presence of salts is mainly attributed to change in
conformation of molecules, which reduces the hydrodynamic diameter and diminishes the
degree of molecule chain entanglement [34]. Both NaCl and CaCl2 were observed to suppress
the viscosity of the polymer surfactant solution. However, CaCl2 reduces the viscosity to a
greater extent because of the doubly charged cations. Moreover, Ca2+ may act as a cross-linking

Page | 54
agent to interconnect the molecule chains and further influence the conformation and flow
behavior of the polymeric surfactant in aqueous solution.
Fig 6.11. Effect of addition of NaCl on the viscosity profile of 6000 ppm P5 solution (with
acrylamide-to-sulfonate ratio 1: 1) at 298 K at varying concentrations
Fig 6.12. Effect of addition of CaCl2 on the viscosity profile of 6000 ppm P5 solution (with
acrylamide-to-sulfonate ratio 1: 1) at 298 K at varying concentrations
0.001
0.01
0.1
1 10 100 1000
Vis
cosi
ty (
Pa.
s)
Shear Rate (1/s)
No NaCl
1.5% NaCl
2% NaCl
0.001
0.01
0.1
1 10 100 1000
Vis
cosi
ty (
Pa.
s)
Shear Rate (1/s)
No CaCl2
1.5% CaCl2
2% CaCl2

Page | 55
Fig 6.13. Effect of addition of NaCl and CaCl2 on zero-shear stress curve of 6000 ppm P5 solution
(with acrylamide-to-sulfonate ratio 1: 1) at 298 K at varying concentrations
At low shear rates, the polymer surfactant exhibited Newtonian behavior. Viscosity in the
Newtonian regime is referred to as zero shear viscosity [35]. The value of zero shear viscosity
is very important in understanding the microstructure of the polymeric surfactant. The effect
of addition of NaCl and CaCl2 (at 40 s-1 shear rate) on zero shear viscosity of polymeric
surfactant P5 at 6000 ppm is depicted in Figure 6.13. The zero shear viscosity was found to
decrease with increase in salt concentration in the polymeric surfactant solution. This is
explained by alteration in the conformity of molecules, that diminishes the degree of
entanglement or aggregation of molecule chains.
6.3.4. Effect of concentration on dynamic viscoelasticity
Determination of dynamic modulus is instrumental in determining both elastic and viscous
characteristics when undergoing deformation. Figure 6.14 shows the dynamic viscoelasticity
curves of PMES between dynamic modulus and angular frequency at 298 K. Angular
0
0.005
0.01
0.015
0.02
0.025
0 0.5 1 1.5 2 2.5
Vis
cosi
ty (
Pa.
s)
Salt Concentration (%)
NaCl
CaCl2

Page | 56
frequency readings were varied between 0.1 and 150 radians/second. Oscillatory experiments
were conducted for P5 polymeric surfactant (allowing for maximum mobility control) at
concentrations of 1500, 3000, 4500 and 6000 ppm.
Fig 6.14. Dynamic viscoelasticity curves showing the effect of angular frequency on storage and loss
moduli for P5 solution (with Sulfonate-to-acrylamide ratio 1: 1) at 298 K at varying concentrations
It was observed that the polymeric surfactant exhibited viscoelastic properties. Both storage
modulus G' and loss modulus G'' increased with increasing PMES concentration. A crossover
point was found for G' and G'' of each polymer surfactant solution. This crossing point
determines the specific frequency (SF). In experimental results illustrated in Figure 6.14, the
value of specific frequency was found to decrease with increased PMES concentration. The
value of specific frequency is instrumental in signifying the point of transition between the
elastic phase and viscous phase of the sample [36]. The loss modulus G'' was higher than the
storage modulus G' when angular frequency was less than SF, showing that the viscous
component dominated the viscoelastic properties of PMES solutions. But, when the angular
velocity was greater than the SF value, elasticity component (or storage component) was the
controlling factor and was more effective than the viscous component.
0.0001
0.001
0.01
0.1
1
10
100
0.1 1 10 100 1000
G' &
G''
(Pa)
Angular Frequency (rad/s)
G' 1500 ppm G'' 1500 ppm G' 3000 ppm G'' 3000 ppm G' 4500 ppm G'' 4500 ppm G' 6000 ppm G'' 6000 ppm
Page | 57
Chapter 7
Summary and Conclusions
Numerous experimental studies have been carried out to understand the characterization and
flow properties of a novel polymeric surfactant synthesized from castor oil methyl ester.
Primary focus was stressed upon the investigation of particle size distribution (DLS analysis),
interfacial tension (spinning drop tensiometer) and rheological data (rheometer).
Careful examination of particle size distribution profile for polymeric surfactant revealed that
hydrodynamic diameter generally increases with increasing PMES concentration due to the
aggregation of the molecules. With increase in salt (concentration) addition, hydrodynamic
diameter was generally found to decrease since micelles may disaggregate to smaller size and
may even break down to polymer chains. This may be due to rolling up of CMC segments in
aqueous salt solutions, thereby changing particle structure from rod-like to spherical shape. As
a result, the size of micelles becomes smaller. This knowledge is particularly important for
correlating data to reduce surface tension and interfacial tension, aimed at improved oil
recovery.
Interfacial data was obtained to compare results and corresponding effects of both SMES and
polymer methyl ester sulfonate (PMES). It was observed that IFT initially decreases with
surfactant and PMES concentration. However after a particular limit, the value of IFT increases
slightly. This value of surfactant concentration at which interfacial tension is found to be
minimum is called ‘Critical Micelle Concentration’. This behavior is observed because the
surfactant/ polymeric surfactant molecule starts to aggregate at this CMC value and form
micelle in concentration at the interfaces, thereby restricting or minimizing interfacial activity.
As a result, IFT value after CMC either increases or remains constant. In IFT data
measurements for SMES, the value of CMC was found to be 5500 ppm and its corresponding
minimum IFT value was 0.0344 mN/m. Furthermore for polymeric surfactants in aqueous
solutions, the minimum IFT values for P1, P2, P3, P4 and P5 were observed to be 0.0854,
0.0647, 0.0612, 0.0493 and 0.0352 mN/m at CMC values of 6500 ppm, 5500 ppm, 5500 ppm,
4500 ppm and 4500 ppm respectively.
IFT was found to decrease drastically with salt addition. At 298 K, with increase in NaCl
concentration in SMES and PMES solutions, interfacial tension initially decreases and then
Page | 58
increases at a particular concentration of NaCl salt. This is referred to as optimal salinity.
Beyond optimal salinity, further addition of salt has no or detrimental effects on interfacial
activity. The lowest obtained value of IFT for SMES solution was 0.00197 mN/m at an optimal
salinity of 3.5% NaCl. This combined effect of salt and surfactant in crude oil/ water systems
is often referred to as the synergistic effect of salt-surfactant mixture on the IFT. The interfacial
tension decreased initially with increase in salt concentration and then increased slightly for P5
polymeric surfactant (acrylamide-to-sulfonate ratio 1:1) at 4500 ppm at 298 K. optimal salinity
was measured at 4.5% with interfacial tension value of 0.00432 mN/m. The most effective salt-
polymeric surfactant mixture in terms of interfacial was obtained at 4500 ppm with 4.5% NaCl
content. P4 (acrylamide-to-surfactant ratio 0.8:1) is more effectual than other polymeric
surfactants to lower IFT to ultra-low value than polymeric surfactants at combined conditions
of CMC and optimal salinity.
An extensive study was made to study the rheological (flow) behavior of polymeric surfactants
to determine proper formulations/ mixtures for improved mobility control. From the
temperature dependence of viscosities, it is evident that at various ratios of PMES solutions
examined, the viscosities decreased with rise in temperature as expected. This is due to the fact
that cohesive forces between the molecules decrease as an effect of the increased velocities of
individual molecules. It was found that with temperature rise, solution P5 having acrylamide-
to-sulfonate ratio 1:1 has higher viscosities than other solutions due to longer chain length of
acrylamide polymer. Viscosity was found to increase with concentration of the polymeric
surfactant. It was observed that P5 recorded higher viscosity than other solutions at low shear
rates. Shear stress was expectedly found to increase with concentration. Furthermore,
viscosities of solutions were found to increase with increasing acrylamide-to-sulfonate ratios.
Increased viscosity may be attributed to their increased hydrodynamic volume which has the
twin effect of blocking the motion of solvent molecules and retarding their motion by binding
with them. Interestingly, it was observed that polymeric surfactant showed dual flow behavior
at different strain rates. It was observed from experimental results that all the solutions follow
Newtonian behavior upto a shear rate (or strain rate) of 50 s-1. This value of shear rate (50 s-1)
which marks the transition from Newtonian to non-Newtonian behavior is referred to as the
critical shear rate. Beyond 50 s-1 the solutions were found to exhibit pseudoplastic or shear-
thinning characteristics. Reduction in viscosity with shear rate is primarily related to the
orientation of macromolecules along the flow streamline and to the disentanglement of
macromolecules with increase in shear force. Shear-thinning behavior of polymeric surfactants

Page | 59
at high shear rates may prove to be favorable during injection process, due to viscosity decrease
at higher shear rates, increasing injectivity. Furthermore, high consistent viscosity values are
desirable when polymeric surfactant moves deep into the reservoir at low shear rates, thereby
improving mobility control and recovery efficiency. Both NaCl and CaCl2 were observed to
suppress the viscosity of the polymer surfactant solution. However, CaCl2 reduces the viscosity
to a greater extent because of the doubly charged cations. This decrease in viscosity of
polymeric surfactant in the presence of salts is mainly attributed to change in conformation of
molecules, which reduces the hydrodynamic diameter and diminishes the degree of molecule
chain entanglement. Moreover, Ca2+ may act as a cross-linking agent to interconnect the
molecule chains and further influence the conformation and flow behavior of the polymeric
surfactant in aqueous solution. The zero shear viscosity was found to decrease with increase in
salt concentration in the polymeric surfactant solution. This is explained by alteration in the
conformity of molecules, that diminishes the degree of entanglement or aggregation of
molecule chains. It was observed that the polymeric surfactant exhibited viscoelastic
properties. Both storage modulus G' and loss modulus G'' increased with increasing PMES
concentration. A crossover point was found for G' and G'' of each polymer surfactant solution.
This crossing point determines the specific frequency (SF). The value of specific frequency is
instrumental in signifying the point of transition between the elastic phase and viscous phase
of the sample.
The above investigated data from DLS, IFT and rheological experiments is very useful for the
formulation of effective salt-polymeric surfactant mixtures for improved oil recovery by
mechanism of interfacial tension reduction and desired mobility control. It is also a major factor
controlling the selection of proper polymeric surfactants (with/ without salt) with cost-
effectiveness in desired applications

Page | 60
References
1. D.W. Green, G.P. Willhite, Enhanced Oil Recovery, SPE, 1998.
2. S. Mishra, A. Bera, A. Mandal, J. Petrol. Eng. 395857 (2014) 1-9.
3. Y. Bai, C. Xiong, X. Shang, Y. Xin, Energy Fuels 28 (2014) 1829–1837.
4. A. Bera, K. Ojha, T. Kumar, A. Mandal, Energy Fuels 26 (2012) 3634-3643.
5. A. Samanta, K. Ojha, A. Sarkar, A. Mandal, Adv. Petrol. Explor. Dev. 2 (2011) 13-18.
6. K.A. Elraies, I.M. Tan, M.T. Fathaddin, A. Abo-Jabal, Petrol. Sci. Technol. 29
(2011) 1521–1528.
7. Y. Cao, L. Huilin, Eur. Polym. J. 38 (2001) 1457-1463.
8. S. Liu, S.P. Armes, Curr. Opin. Colloid Interface Sci. 6 (2001) 249-256.
9. N.V. Satry, P.N. Dave, M.K. Valand, Eur. Polym. J. 35 (1999) 517-525.
10. Sugiharjo, E.M.L. Tobing, T. Makmur, Aspek Laboratorium untuk Mununjang
Perencanaanwater; Lemigas Workshop, Jakarta, 2009.
11. E. Uchida, Y. Ikada, Curr. Trends Polym. Sci. 1 (1996) 135-146.
12. K. Kato, E. Uchida, E. Kang, Y. Uyama, Y. Ikada, Progr. Polym. Sci. 28 (2003) 209-
259.
13. L. Ye, R. Huang, J. Wu, H. Hoffman, Colloid Polym. Sci. 282 (2004) 305-313.
14. V.A.E. Barrios, J.R.R. Méndez, N.V.P. Aguilar, G.A. Espinosa, J.L.D. Rodríguez,
Infrared Spectroscopy- Material Science, Engineering and Technology, InTech (2012)
195-212.
15. R.M. Silverstein, F.X. Webster, D.J. Kiemle, Spectrometric Identification of Organic
Compounds, John Wiley & Sons, Inc., 2005.
16. D.I. Bower, W.F. Maddams, The Vibrational Spectroscopy of Polymer, Cambridge
University Press, 1989.
17. J.L. Koenig, Infrared and Raman Spectroscopy of Polymers, Rapra Technology, 2001.
18. K.A. Elraies, I.M. Tan, Introduction to Enhanced Oil Recovery (EOR) Processes and
Bioremediation of Oil-Contaminated Sites, InTech (2012) 45-70.
19. Y. Cao, L. Huilin, Eur. Polym. J. 31 (1999) 920-3.
20. A. Bera, A. Mandal, B. B. Guha, J. Chem. Eng. Data 59 (2013) 89-96
Page | 61
21. Z. Ye, F. Zhang, L. Han, P. Luo, J. Yang, H. Chen. Colloids Surf. A 322 (2008)
138−141.
22. J. Rudin, D.T. Wasan, Ind. Eng. Chem. Res. 31 (1992) 1899−1906.
23. L.W. Lake, Enhanced Oil Recovery, Prentice Hall, 1989.
24. P.J. Clifford, K.S. Sorbie, SPE 13586-MS (1985).
25. H.Z. Dong, S.F. Fang, D.M. Wang, J.Y. Wang, Z. Liu, B.H. Hong, SPE 114342-MS
(2008).
26. K.S. Lee, Energies 4 (2011) 1112-1128.
27. F. Zhao, Y. Du, C. Li, J. Tang, P. Yang, Acta. Phys-Chim. Sin. 20 (2004) 1385-1388.
28. R. Bhargava, S. Wang, J.L. Koening, Adv. Polym. Sci. 163 (2003) 137-191.
29. L.H. Lee, Ed., Characterization of Metal and Polymer Surfaces 1, Academic Press,
1977.
30. M. Awang, M.S. Goh, ChemSusChem. 1 (2008) 210-214.
31. H.U. Kim, K.H. Lim, Bull. Korean Chem. Soc. 25 (2004) 382.
32. M.S. Kamal, I.A. Hussien, A.S. Sultan, M. Han, J. Chem. 801570 (2013).
33. C. Holmberg, L. Sundelöf, Langmuir 12 (1996) 883-889.
34. A. Samanta, A. Bera, K. Ojha, A. Mandal, J. Chem. Data 55 (2010), 4315-4322.
35. Jörg Läuger, Monika Bernzen, NRS, Physica Messtechnik GmbH. 8 (2000).
36. L. Meng, W. Kang, Y. Zhou, Z. Wang, S. Liu, B. Bai, J. Cent. South Univ. Technol. 15
(2008) 126-129.