Thermally-induced interconversions of metal-pyrimidine-4,6 ... · Venezian 21, 20133 Milano (Italy)...
35
Thermally-induced interconversions of metal-pyrimidine-4,6-dicarboxylate polymers. A structural, spectroscopic and magnetic study. Journal: Inorganic Chemistry Manuscript ID: ic-2008-02365w.R2 Manuscript Type: Article Date Submitted by the Author: 18-Feb-2009 Complete List of Authors: Masciocchi, Norberto; Università degli Studi dell'Insubria, Dipartimento di Scienze Chimiche e Ambientali Galli, Simona; Università dell'Insubria, Dipartimento di Scienze Chimiche e Ambientali Tagliabue, Giulia; Università degli Studi dell'Insubria, Dipartimento di Scienze Chimiche e Ambientali Sironi, Angelo; Universita' di Milano, DCSSI Castillo, Oscar; University of the Basque Country, Inorganic Chemistry Luque, Antonio; University of the Basque Country, Inorganic Chemistry Beobide, Garikoitz; University of the Basque Country Wang, Wenguo; Universidad de Granada Romero, Maria; Universidad de Granada, Departamento Quimica Inorganica Barea, Elisa; Universidad de Granada, Departamento Quimica Inorganica Navarro, Jorge; Universidad de Granada, Departamento Quimica Inorganica ACS Paragon Plus Environment Submitted to Inorganic Chemistry
-
Upload
nguyenphuc -
Category
Documents
-
view
221 -
download
0
Transcript of Thermally-induced interconversions of metal-pyrimidine-4,6 ... · Venezian 21, 20133 Milano (Italy)...

Thermally-induced interconversions of
metal-pyrimidine-4,6-dicarboxylate polymers. A structural, spectroscopic and magnetic study.
Journal: Inorganic Chemistry
Manuscript ID: ic-2008-02365w.R2
Manuscript Type: Article
Date Submitted by the Author:
18-Feb-2009
Complete List of Authors: Masciocchi, Norberto; Università degli Studi dell'Insubria, Dipartimento di Scienze Chimiche e Ambientali Galli, Simona; Università dell'Insubria, Dipartimento di Scienze Chimiche e Ambientali Tagliabue, Giulia; Università degli Studi dell'Insubria, Dipartimento di Scienze Chimiche e Ambientali Sironi, Angelo; Universita' di Milano, DCSSI Castillo, Oscar; University of the Basque Country, Inorganic Chemistry Luque, Antonio; University of the Basque Country, Inorganic Chemistry Beobide, Garikoitz; University of the Basque Country Wang, Wenguo; Universidad de Granada Romero, Maria; Universidad de Granada, Departamento Quimica Inorganica Barea, Elisa; Universidad de Granada, Departamento Quimica Inorganica Navarro, Jorge; Universidad de Granada, Departamento Quimica Inorganica
ACS Paragon Plus Environment
Submitted to Inorganic Chemistry
Submitted to Inorganic Chemistry, December 2008 1
Thermally-induced interconversions of
metal-pyrimidine-4,6-dicarboxylate polymers.
A structural, spectroscopic and magnetic study.
Norberto Masciocchi,a Simona Galli,a,* Giulia Tagliabue,a Angelo Sironi,b
Oscar Castillo,c Antonio Luque,c Garikoitz Beobide,c Wenguo Wang,d M.Angustias Romero,d
Elisa Barea,d Jorge A.R. Navarrod,*
a Dipartimento di Scienze Chimiche e Ambientali, Università dell’Insubria, via Valleggio 11, 22100
Como (Italy) b Dipartimento di Chimica Strutturale e Stereochimica Inorganica, Università di Milano, via
Venezian 21, 20133 Milano (Italy) c Departamento de Química Inorgánica, Facultad de Ciencia y Tecnología, Universidad del País
Vasco, Apartado 644, 48080 Bilbao (Spain) d Departamento de Química Inorgánica, Universidad de Granada, Av. Fuentenueva S/N, 18071
Granada (Spain)
Page 1 of 34
ACS Paragon Plus Environment
Submitted to Inorganic Chemistry
123456789101112131415161718192021222324252627282930313233343536373839404142434445464748495051525354555657585960

Submitted to Inorganic Chemistry, December 2008 2
Abstract
Continuing our work on the structural and magnetic aspects of the 1-D coordination polymers of the
[M(pmdc)(H2O)2]·H2O kind (M = Fe, Co, Ni, Cu, Zn; pmdc = pyrimidine-4,6-dicarboxylate), we
have combined ab-initio X-ray powder diffraction methods with in situ thermodiffractometry and
thermal analyses to characterize the selective and reversible transformation of the
[M(pmdc)(H2O)2]·H2O compounds (M = Fe, Co, Ni, Cu) into the bis-hydrated [M(pmdc)(H2O)2]
counterparts by moderate heating, which is followed by an irreversible transformation into 2-D
anhydrous species. The structural features of the transient bis-hydrated species, and of the
completely dehydrated one are described for M = Cu. Remarkably, the first dehydration process
does not alter the 1-D nature of the [M(pmdc)(H2O)2] chains; on the contrary, the second
dehydration gives rise to the loss of the axially coordinated water molecules with a concomitant
condensation of the 1-D chains into 2-D layers through ancillary carboxylate bridging groups. The
magnetic properties of the anhydrous [M(pmdc)] species (M = Co, Ni, Cu) have been investigated,
showing that these phases behave as 2-D Heisenberg antiferromagnets. Notably, in the case of the
[Ni(pmdc)] system, a weak ferromagnetic ordering, arising from a spin canting phenomenon with a
blocking temperature of 13 K, is observed.
Page 2 of 34
ACS Paragon Plus Environment
Submitted to Inorganic Chemistry
123456789101112131415161718192021222324252627282930313233343536373839404142434445464748495051525354555657585960

Submitted to Inorganic Chemistry, December 2008 3
Introduction
In recent years, several coordination polymers containing N-heterocycles and/or organic
carboxylates have been prepared, some of them possessing interesting structural features and/or
functional properties.1 Remarkable examples within this class are species containing the pyrazole,
imidazole,2 diazine moieties and/or a variety of mono- or poly-oxo carboxylate ligands.3 Obviously,
by combining these two functions within the same organic molecules, ligands with enhanced
coordination possibilities can be obtained, and new polymeric materials can be isolated, as
originally demonstrated by the use of isonicotinate as a bridging ligand.4 After this pioneering work,
numerous polyfunctional ligands of this type have been proposed (see Chart I for representative
examples), and widely employed, also by our group, in the construction of polymeric coordination
networks lacking (loosely bound) counterions in the crystal structure cavities, thus potentially
favoring functional properties such as gas sponge behavior5 or molecular recognition.6
Indeed, our extensive use of (differently substituted) 2- and 4-pyrimidinolates has evidenced
the easy formation of porous, hydrated materials which, upon moderate heating, afforded
polycrystalline species possessing significant storage capacities toward industrial and
environmentally relevant gases.5
To extend our work to a distinct class of polyfunctional ligands, we have exploited the
commercially available 4,6-dimethyl-pyrimidine, which can be easily oxidized to the corresponding
dicarboxylic acid (H2pmdc). The latter, originally prepared by Hunt and co-workers back in 1959,7
combines the N,N’-coordination features of pyrimidine to the donor properties of carboxylates.
Moreover, possessing two easily removable acidic hydrogen atoms, it can be coupled to the M(II)
ions of the transition metal series, in search for simple coordination polymers of [M(pmdc)]
formulation.
Our recent results showed that the tris-hydrated species of [M(pmdc)(H2O)2]·H2O
formulation (M = Fe, Co, Zn) are typically formed by reacting the proper metal and ligand salts in
aqueous/methanolic solutions. 8 As a further step of this investigation, we have prepared, and
structurally characterized, the still missing polycrystalline Ni(II) and Cu(II) [M(pmdc)(H2O)2]·H2O
derivatives. It is worth noting that [Ni(pmdc)(H2O)2]·H2O had been already isolated; yet, its modest
(poly)crystallinity allowed just to postulate its isomorphism with the other tris-hydrated compounds,
not a complete structural analysis.8
By means of in situ variable temperature X-ray diffraction (TXRPD), we proved that the
[M(pmdc)(H2O)2]·H2O 1-D chains (1M; M = Fe, Co, Ni, Cu) undergo two consecutive dehydration
steps, affording the bis-hydrated, polycrystalline [M(pmdc)(H2O)2] counterparts (2M) and the
completely dehydrated ones (3M), the latter with significant structural changes leading to a 2-D
Page 3 of 34
ACS Paragon Plus Environment
Submitted to Inorganic Chemistry
123456789101112131415161718192021222324252627282930313233343536373839404142434445464748495051525354555657585960

Submitted to Inorganic Chemistry, December 2008 4
coordination network. Worthy of note, all the species were isolated as polycrystalline materials:
their structural aspects have been thus disclosed by means of ab initio XRPD analyses. A
spectroscopic and magnetic characterization of the 1M and 3M species is also presented, disclosing
that the structural modifications prompted by the 1M → 3M transformation deeply affect the
magnetic behavior.
Experimental
Synthesis
1M materials were synthesized according to the method reported by us in a previous paper.8
2M and 3M materials were prepared by controlled heating of 200 mg of the corresponding 1M
material in a furnace (typically) up to 403 and 503 K (heating rate 10 K min-1), respectively; yield
100%. As mentioned below, much lower temperatures are required to obtain the 2Cu and 3Cu species.
Elemental analyses: Calc. for C6H2FeN2O4, 3Fe: C, 32.47, H, 0.91, N, 12.62; found C 32.72, H 0.98,
N 12.92. Calc. for C6H2CoN2O4, 3Co: C, 32.02, H, 0.90, N, 12.45; found C 32.37, H 1.00, N 12.76.
Calc. for C6H2NiN2O4, 3Ni: C, 32.06, H, 0.90, N, 12.46; found C 32.44, H 0.98, N 12.72. Calc. for
C6H2CuN2O4, 3Cu: C, 31.38, H, 0.88, N, 12.20 found. C 31.66, H 0.93, N 12.55.
Physical Measurements
Thermal analyses (TG/DTG/DTA) were performed on a TA Instruments SDT 2960 thermal
analyzer in a synthetic air atmosphere (79% N2: 21% O2) with a heating rate of 5 °C min-1. DC
Magnetic measurements were performed on polycrystalline samples on a SQUID Quantum Design
MPMS XL-5 in the 2-300 K temperature range applying external fields of 300 and 5000 Oe. AC
magnetic susceptibility measurements were performed applying an oscillating external field of 1 Oe
with a frequency of 100 Hz. Elemental analyses were carried out on a Perkin Elmer CHN Analyzer
2400 Series II. Electronic spectra on polycrystalline samples were carried out on a Varian Cary UV-
vis-NIR spectrophotometer in the reflectance mode. IR spectra were recorded in the 4000-300 cm-1
range on a Midac FT-IR using KBr pellets.
Structural Powder Diffraction Analyses
The powdered 1M (M = Ni, Cu), 2M (M = Fe, Co, Ni, Cu) and 3Cu samples were gently
ground in an agate mortar, then deposited in the hollow of an aluminum sample holder equipped
with a zero-background plate. The data were collected on a Bruker AXS D8 Advance
diffractometer, equipped with a linear position-sensitive Lynxeye detector, primary beam Soller
Page 4 of 34
ACS Paragon Plus Environment
Submitted to Inorganic Chemistry
123456789101112131415161718192021222324252627282930313233343536373839404142434445464748495051525354555657585960

Submitted to Inorganic Chemistry, December 2008 5
slits, and Ni-filtered Cu-Kα (λ = 1.5418 Å) radiation. The generator was operated at 40 kV and 40
mA. Long overnight runs were performed, at the proper temperature, allowing fruitful structural
retrievals. Notably, among the anhydrous 3M species, only the copper one possessed an adequate
degree of crystallinity to allow a complete structural determination. For the 2Fe and 3Cu compounds,
indexing by the single value decomposition technique,9 as implemented in the TOPAS suite,10
allowed the determination of the crystal systems and of the lattice parameters, later confirmed by
the successful structure solutions and refinements. In the case of the 1M species, the comparison of
their diffractograms with those of the already known Fe, Co and Zn homologues allowed to
highlight their isomorphism, thus providing approximate unit cells later refined by means of the Le
Bail method. The same holds for the 2M (M = Co, Ni, Cu) species, whose unit cell was obtained
starting from that of 2Fe. The space groups were assigned on the basis of the systematic absences.
The structure solutions were initiated by the simulated annealing technique,11 as implemented in
TOPAS, using a rigid, idealized, pmdc fragment12 and independent metal and water oxygen atoms.
When pertinent, the metal ions were fixed onto special symmetry positions and geometrical
restraints were added during the final cycles of the refinement. Worthy of note, the torsion angles of
the carboxylate-heterocyclic ring linkage have been ultimately refined, leading to a nearly coplanar
conformation, driven by π-conjugation, in all cases but in 3Cu (see the Results and Discussion
Section). The peak shapes were described by the fundamental parameters approach,13 with the aid,
when necessary, of a spherical harmonics description of the anysotropic full width at half maximum.
The background was modeled by a polynomial function. An isotropic, refinable thermal parameter
was assigned to the metal ions, augmented by 2.0 Å2 for lighter atoms. A preferred orientation
correction, in the March-Dollase formulation,14 was introduced when necessary (1Ni, 1Cu, and 2Cu
[10-1]; 3Cu [011]). A summary of the crystal data and refinement parameters, together with the
profile and Bragg agreement factors, is supplied in Table 1 for the 1M compounds and in Table 2 for
the 2M and 3Cu ones. Crystallographic data (excluding structure factors) for the structures reported
in this paper have been deposited with the Cambridge Crystallographic Data Center as
supplementary publication no. CCDC 712087-712093. Copies of the data can be obtained free of
charge on application to the Director, CCDC, 12 Union Road, Cambridge, CB2 1EZ, UK (Fax:
+44-1223-335033; e-mail: [email protected] or http://www.ccdc.cam.ac.uk).
Thermodiffractometry
The powdered samples of the 1M (M = Fe, Co, Ni) and 2Cu compounds were gently ground
in an agate mortar, and then deposited in the hollow of an aluminum sample holder located in a
custom-made heating chamber (supplied by Officina Elettrotecnica di Tenno, Italy). The data were
Page 5 of 34
ACS Paragon Plus Environment
Submitted to Inorganic Chemistry
123456789101112131415161718192021222324252627282930313233343536373839404142434445464748495051525354555657585960

Submitted to Inorganic Chemistry, December 2008 6
typically collected, on the Bruker Axs D8 Advance diffractometer, in the 303-603 K range at 20 K
per step, highlighting the structural changes due to water loss.
Results and Discussion
Synthesis and Thermal Behavior
Typically, on reacting M(II) salts (M = Fe, Co, Ni, Cu) with KHpmdc in water/methanol
solutions, the tris-hydrated [M(pmdc)(H2O)2]·H2O phases, 1M, are isolated.
The thermal behavior of the [M(pmdc)(H2O)2]·H2O materials (M = Fe, Co, Ni, Cu) was
investigated by coupling in situ variable temperature X-ray diffraction (TXRPD) and thermal
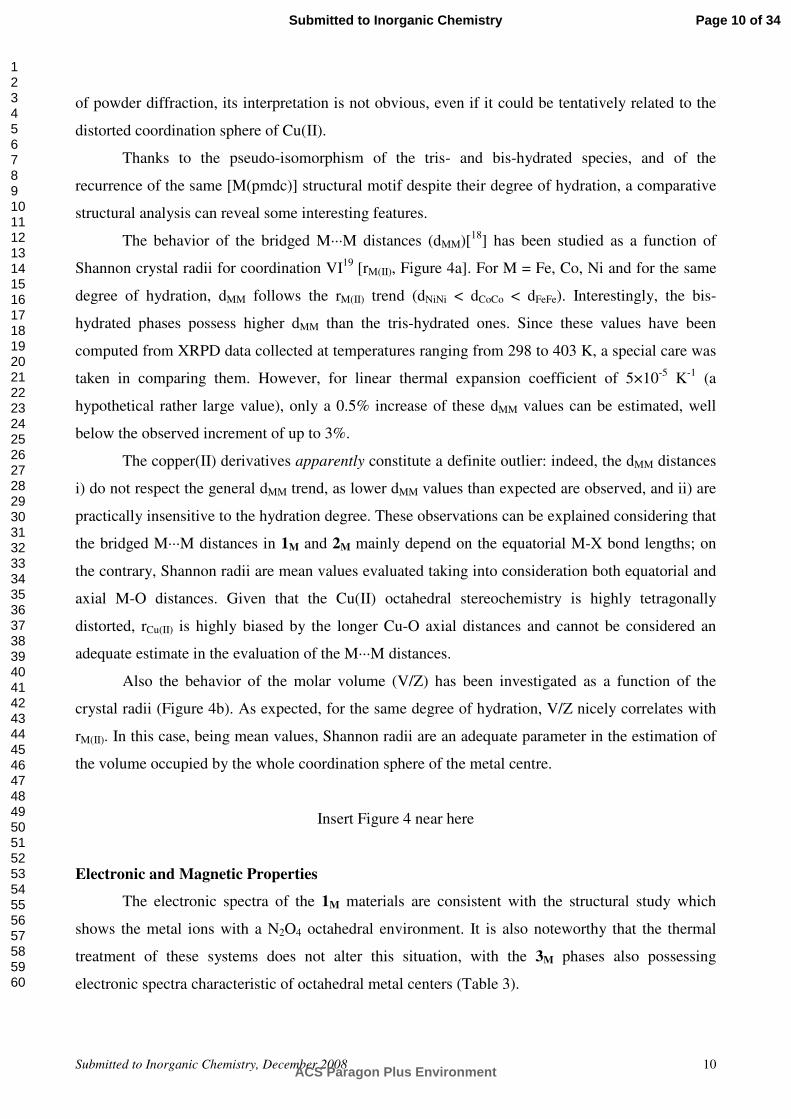
analyses (TG and DTA). In order to facilitate the comprehension of the following discussion, the
thermal behavior of all the investigated species has been sketched in Scheme 1.
Moderate heating of the 1M compounds (M = Fe, Co, Ni) under nitrogen afford,
progressively, two novel phases. Indeed, on raising the temperature, 1Fe, 1Co and 1Ni undergo a first
endothermic process interpreted, on the basis of the observed mass loss, as the evolution of one
water molecule per formula unit to give the bis-hydrated [M(pmdc)(H2O)2] species (2Fe, 2Co and 2Ni,
respectively). The removal of just one water molecule is substantiated by the proper weight loss in
the TG trace, and possesses a structural basis: only the non coordinated water molecules, loosely
interacting by means of hydrogen bonds, are removed first (see below). Worthy of note, if left in
humid environments, the 2Fe, 2Co and 2Ni phases restore, at a different pace, the pristine tris-
hydrated 1M counterparts (XRPD evidence). Therefore, in order to collect meaningful diffraction
data, phase constancy was guaranteed by keeping 2M, during the whole measurement, near 403 K
(see Table 2), thus preventing rehydration. Further heating of the 2Fe, 2Co and 2Ni materials,
promotes a second endothermic event, i.e. the irreversible, complete dehydration to the stable,
(typically) less crystalline, [M(pmdc)] materials, with significant structural changes. Further raising
of the temperature, above 623 K, induces decomposition. As a representative example, Figure 1
shows the TG and DTA traces and the corresponding thermodiffractogram of 1Fe, where two
separate processes, corresponding to the two quoted dehydration steps, are clearly visible. The
TG/DTA traces of the other 1M species are available in Figure S1 of the Supplementary Material.
1Cu constitutes in this sense an exception: indeed, either already after filtering, or at a later
stage, depending on the actual environment, it tends to lose one water molecule per formula unit,
affording the bis-hydrated species 2Cu (or mixtures of 1Cu and 2Cu), demonstrating that also
unpredictable kinetic effects are at work, possibly during nucleation. In a sufficiently humid
environment, pure 1Cu may survive enough to allow a complete structural characterization.
Nevertheless, the thermal investigation of the copper(II) derivatives was performed directly on the
Page 6 of 34
ACS Paragon Plus Environment
Submitted to Inorganic Chemistry
123456789101112131415161718192021222324252627282930313233343536373839404142434445464748495051525354555657585960

Submitted to Inorganic Chemistry, December 2008 7
more stable 2Cu material, directly recovered from the reaction solution: as in the case of the other
2M compounds, heating of 2Cu promotes the irreversible complete dehydration to 3Cu.
Crystal Structures Description
[Ni(pmdc)(H2O)2]·H2O, 1Ni, and [Cu(pmdc)(H2O)2]·H2O, 1Cu. The isostructural species 1Ni
and 1Cu crystallize in the monoclinic C2/c space group. Though possessing a different monoclinic
space group, the previously characterized 1M compounds share, with 1Ni and 1Cu, similar unit cell
parameters (see Table S1, where the originally published cell parameters8 have been properly
transformed to allow comparison with those of the species presented in this contribution). The
observed space group difference is substantiated by the fact that the [hkl] reflections with h+k =
2n+1 are clearly absent in the diffractograms of 1Ni and 1Cu.
In spite of the space group difference, all the 1M materials share the same structural motif: as
already illustrated,8 they are composed by nearly octahedral trans-MN2O4 chromophores, two
nitrogen and two oxygen atoms deriving from two bis-chelating pmdc ligands, the remaining
oxygen atoms belonging to coordinated water molecules. The bridging nature of the pmdc ligands
eventually yields 1-D polymeric chains, along which the metal-bound water molecules protrude
normally to the polymer elongation direction. The reciprocal disposition of the chains generate
cavities in which non coordinated water molecules are hosted (Scheme 2).
Insert Scheme 2 near here
Further stability is imparted to the structure by the extensive net of hydrogen bonds,
mediated by uncoordinated water molecules, involving the water and carboxylate oxygen atoms of
adjacent chains.
The above mentioned space group difference is somewhat unexpected, and requires a deeper
comment. The coordinated water molecules are located at distances, from the metals, which depend
on their ionic sizes and on the presence of other (elongating, such as Jahn-Teller) effects. The
uncoordinated water molecules may either symmetrically interact with different portions of the
polymeric chains (as in the C-centered materials), or manifest a small, coherent, stereochemical
preference, inducing symmetry lowering (as in the P21/n phases). The factors driving toward such a
preference are not easily identifiable: apparently, it is determined by very subtle effects, likely
related to the small stereochemical differences among the 1-D chains in the 1M crystals.
Page 7 of 34
ACS Paragon Plus Environment
Submitted to Inorganic Chemistry
123456789101112131415161718192021222324252627282930313233343536373839404142434445464748495051525354555657585960

Submitted to Inorganic Chemistry, December 2008 8
[M(pmdc)(H2O)2], 2M (M = Fe, Co, Ni, Cu). The [M(pmdc)(H2O)2] species are isostructural
and crystallize in the monoclinic C2/c (M = Fe, Co, Ni) or P21/n (M = Cu) space groups. Again,
despite this space group diversity, the structure of the Cu(II) derivative shares similar unit cell
parameters (Table S1) and structural aspects as the other bis-hydrated compounds. In line with the
above proposed interpretation for the 1M species, such a slight structural modification can be
explained by the stereochemical features of Jahn-Teller distorted Cu(II) ions, significantly different
from the nearly isotropic coordination environments of the other M(II) metal ions.
As already observed for the tris-hydrated parents, the crystal structure of all the 2M species is
composed by 1-D chains of [M(pmdc)(H2O)2] formulation. Along the chain, each M(II) ion
possesses a trans-MN2O4 pseudooctahedral stereochemistry: the equatorial positions are occupied
by the nitrogen and oxygen atoms of two bis-chelating pmdc ligands, bridging metal ions 6.02-6.38
Å apart, while the apical positions are occupied by two water molecules. The chains run along
[101],15 and pack as parallel bundles, reciprocally adopting a hexagonal packing, as in the 1M
compounds. Adjacent chains interact through evident hydrogen bond contacts involving the oxygen
atoms of the carboxylate groups and of the water molecules (Scheme 2). Taking this hydrogen
bonds network into consideration, 2-D sheets normal to [-102] are generated (Figures 2 and S2).
Insert Figure 2 near here
Finally, it is worth noting that the previously reported [Cu(pmdc)(H2O)2]·(H2O)0.2
derivative,8 with 2.2 water molecules per asymmetric unit, is distinct from 2Cu. Indeed, beside
possessing a slightly shorter b axis [12.1675(4) vs 12.234(3) Å], it has a different space group (C2/c
vs P21/n, the latter being confirmed by the presence of weak hkl peaks, with h+k = 2n+1, in the
diffractogram of 2Cu). Nevertheless, apart from the obvious changes in the site symmetries required
by the distinct space groups, the structures of the [Cu(pmdc)(H2O)2] chains are virtually identical,
and, therefore, do not require any specific comparison. Notably, the small fraction of water
molecules hosted in the cavities of [Cu(pmdc)(H2O)2]·(H2O)0.2 may speak for a solid solution of the
1Cu and 2Cu end members, obtained upon a partial dehydration 1Cu allowed by adequate
environmental conditions.
[Cu(pmdc)], 3Cu. [Cu(pmdc)] is the only anhydrous phase in this group of materials which
showed a good-quality and easily interpretable XRPD pattern. As later discussed, its lattice metrics,
of triclinic symmetry, is a definite outlier in the list of monoclinic, nearly isostructural, bis- or tri-
hydrated species. Nevertheless, it is found to contain the same 1-D [Cu(pmdc)] chains. Within the
Page 8 of 34
ACS Paragon Plus Environment
Submitted to Inorganic Chemistry
123456789101112131415161718192021222324252627282930313233343536373839404142434445464748495051525354555657585960

Submitted to Inorganic Chemistry, December 2008 9
chains, the Cu(II) ions possess a square planar stereochemistry, involving two trans-coordinated
oxygen and two trans-coordinated nitrogen atoms of two bis-chelating pmdc ligands, bridging
metal ions about 6.0 Å apart. Coordinated water removal allows the formation of longer axial M-O
interactions involving the oxygen atoms of carboxylate groups of neighboring chains, which twist
their typical coplanarity with the pyrimidine ring up to 19.6(7)°. Overall, the metal centers thus
possess a tetragonally elongated octahedral environment, as expected, on the basis of the Jahn-
Teller effect, for a d9 metal ion as Cu(II). The longer Cu-O2C contacts link the [Cu(pmdc)] chains
into 2-D sheets, this partially hiding the 1-D character of the pristine polymer (Figure 3 and Scheme
2). Similar (though reversible) structural rearrangements promoted by water dehydration and
implying both a structure dimensionality raise and a change of the functional properties, have
already been observed for homo16 or heterobimetallic17 coordination compounds possessing N/O-
coordinating ligands.
Insert Figure 3 near here
Worthy of note, the analogous Fe(II), Co(II) and Ni(II) 3M materials, obtained by thermal
treatment of their hydrated phases, were not of sufficient crystallinity to allow a complete structural
analysis. Nevertheless, the maintenance of the octahedral environment (see below) after the loss of
the coordinated water molecules is indicative of a related condensation process of the 1-D chains
into 2-D layered systems. This type of condensation process has been recently reported by us in
order to explain the different interconversion pathways in the [Mn(pmdc)(H2O)n] systems of
variable dimensionality.5e
Comparative Structural Analysis
For M = Fe, Co, Ni, the partial dehydration transforming the 1M derivatives into the 2M ones
implies, as expected, a symmetry increase. As a representative example of the change in metrics
promoted by dehydration, comparison of the XRPD traces for 1Fe and 2Fe is reported in Figure S5.
In the 1M materials, the axially coordinated water molecules are crystallographically independent
and, as such, they are involved in distinct hydrogen bond interactions with each other, and with the
carboxylate and the chlatrated water oxygen atoms. Possibly, removal of the chlatrated water
molecules eliminates this asymmetry, and raises the space group symmetry to C2/c. In this respect,
it must be pointed out that the copper derivatives behave in the opposite manner, i.e. the loss of
water molecules determines a symmetry lowering. Although this behavior is certain, on the grounds
Page 9 of 34
ACS Paragon Plus Environment
Submitted to Inorganic Chemistry
123456789101112131415161718192021222324252627282930313233343536373839404142434445464748495051525354555657585960
Submitted to Inorganic Chemistry, December 2008 10
of powder diffraction, its interpretation is not obvious, even if it could be tentatively related to the
distorted coordination sphere of Cu(II).
Thanks to the pseudo-isomorphism of the tris- and bis-hydrated species, and of the
recurrence of the same [M(pmdc)] structural motif despite their degree of hydration, a comparative
structural analysis can reveal some interesting features.
The behavior of the bridged M···M distances (dMM)[18] has been studied as a function of
Shannon crystal radii for coordination VI19 [rM(II), Figure 4a]. For M = Fe, Co, Ni and for the same
degree of hydration, dMM follows the rM(II) trend (dNiNi < dCoCo < dFeFe). Interestingly, the bis-
hydrated phases possess higher dMM than the tris-hydrated ones. Since these values have been
computed from XRPD data collected at temperatures ranging from 298 to 403 K, a special care was
taken in comparing them. However, for linear thermal expansion coefficient of 5×10⁻⁵ K-1 (a
hypothetical rather large value), only a 0.5% increase of these dMM values can be estimated, well
below the observed increment of up to 3%.
The copper(II) derivatives apparently constitute a definite outlier: indeed, the dMM distances
i) do not respect the general dMM trend, as lower dMM values than expected are observed, and ii) are
practically insensitive to the hydration degree. These observations can be explained considering that
the bridged M···M distances in 1M and 2M mainly depend on the equatorial M-X bond lengths; on
the contrary, Shannon radii are mean values evaluated taking into consideration both equatorial and
axial M-O distances. Given that the Cu(II) octahedral stereochemistry is highly tetragonally
distorted, rCu(II) is highly biased by the longer Cu-O axial distances and cannot be considered an
adequate estimate in the evaluation of the M···M distances.
Also the behavior of the molar volume (V/Z) has been investigated as a function of the
crystal radii (Figure 4b). As expected, for the same degree of hydration, V/Z nicely correlates with
rM(II). In this case, being mean values, Shannon radii are an adequate parameter in the estimation of
the volume occupied by the whole coordination sphere of the metal centre.
Insert Figure 4 near here
Electronic and Magnetic Properties
The electronic spectra of the 1M materials are consistent with the structural study which
shows the metal ions with a N2O4 octahedral environment. It is also noteworthy that the thermal
treatment of these systems does not alter this situation, with the 3M phases also possessing
electronic spectra characteristic of octahedral metal centers (Table 3).
Page 10 of 34
ACS Paragon Plus Environment
Submitted to Inorganic Chemistry
123456789101112131415161718192021222324252627282930313233343536373839404142434445464748495051525354555657585960

Submitted to Inorganic Chemistry, December 2008 11
As previously shown by us, the magnetic studies performed on the 1-D 1M [M(pmdc)(H2O)2]·H2O
systems reveal that the pmdc bridges are very efficient to transmit an antiferromagnetic exchange
between the metal centers. The structural changes that take place upon thermal treatment of the 1M
species can also have a profound effect on the magnetic properties of the systems, depending on the
relative orientation between the magnetic orbitals of the metal centres and the new established
carboxylate bridge. Such a definite variation of the magnetic properties upon dehydration and
consecutive structural transformation has been previously observed,16,17 though this kind of studies
is not so commonly carried out. The studies performed on the anhydrous 3M phases are indicative of
changes in their magnetic interactions (Figures 5 and 6). As above mentioned, in the 3Cu system
each copper(II) centre is connected to other two metal ions through the bisbidentate pmdc bridges
occupying the equatorial positions defining in this way a 1-D polymeric chain. The two additional
axial interactions with the ancillary carboxylate groups from adjacent chains that give rise to the
observed 2-D crystal structure involve an axial-equatorial magnetic pathway, which has been
reported to provide very weak ferromagnetic or antiferromagnetic interactions.20 Therefore we can
assume a negligible magnetic exchange through the ancillary carboxylate groups and fit its
magnetic data by a numerical expression proposed for uniform copper(II) chains with
antiferromagetic intrachain interactions derived through the hamiltonian H = –JΣSi·Si+1.21 An
additional term to account for the presence of paramagnetic impurities have been included. The
obtained value, –38.8 cm–1, matches that reported for 1Cu, –38.8 cm–1.
For the other metals the magnetic pathway through the ancillary carboxylate groups can not
be neglected. Unfortunately, the details of the crystal structures of compounds 3Ni and 3Co are
unavailable due to the poor quality of their powder X-ray diffraction patterns. Although this
precludes a rigorous interpretation of their magnetic behavior, a tentative modelization of their data
has been performed by means of a chain model with a main field approximation for the interchain
interaction.[22] The best fit parameters, g, J and zJ’ for the 3M series are collected in Table 3. The
obtained intra- and interchain magnetic exchange parameters must be taken only as a guide about
the relative strength of the magnetic coupling constants through the pyrimidine ring and the
ancillary carboxylate group, respectively.
Noteworthy, in the case of 3Ni, the dc χM and χMT values sharply increase at temperatures
below 13 K (Figure 6). This sharp increment in the low temperature region and at low field
strengths suggests a weak ferromagnetic ordering arising from a spin canting phenomenon. This
type of behavior can be confirmed by the lowering of the observed increment for the χM and χMT
values at higher external fields (5000 Oe) and by means of ac measurements, which show a signal
in both the χ’ and χ’’ components centered at 13 K. The lack of hysteresis in the magnetization vs
Page 11 of 34
ACS Paragon Plus Environment
Submitted to Inorganic Chemistry
123456789101112131415161718192021222324252627282930313233343536373839404142434445464748495051525354555657585960

Submitted to Inorganic Chemistry, December 2008 12
applied field cycles at 2 K is indicative of a soft ferromagnet. The origin of this behavior might be
attributed to a significant magnetic anisotropy of the nickel(II) ion, due to the presence, in 3Ni, of
tetragonally elongated coordination polyhedra,23 as a consequence of the structural stress caused by
the chains condensation.
Conclusions
We have reported here the change of the structural and physicochemical properties of a
series of [M(pmdc)(H2O)2]·H2O coordination polymers upon thermal treatment. It is noteworthy
that the removal of both the crystallization and axially bound coordinated water molecules does not
significantly alter the octahedral stereochemistry around the metal ions. This has been proven by
XRPD on the polycrystalline 3Cu species and is also suggested by spectroscopic analyses on the
other 3M derivatives. Nevertheless, the formation of rather compact anhydrous [M(pmdc)]n 2-D
networks gives rise to a significant change in their magnetic properties. This is manifested by the
occurrence of a weak ferromagnetic ordering in the [Ni(pmdc)]n phase as a probable consequence of
the magnetic anisotropy induced by the presence of a distorted octahedral environment as a
consequence of the structural stress caused by the chains condensation.
Supporting Information Available
Synoptic collection of the unit cell parameters of the 1M and 2M species (M = Fe, Co, Ni, Cu) (Table
S1). TG and DTA traces for the 1M species (Figure S1). Crystal packing representation for 2Cu
(Figure S2). Rietveld refinement plots for species 1Ni and 1Cu (Figure S3), 2Fe, 2Co, 2Ni and 2Cu
(Figure S4), and 3Cu (Figure S5). Comparison of the XRPD traces for 1Fe and 2Fe (Figure S6).
Comparison of the XRPD traces for 1Ni–3Ni (Figure S7).
Acknowledgements
This work was supported by the Italian MUR (PRIN2006: “Materiali Ibridi Metallo-
Organici Multifunzionali con Leganti Poliazotati”) and Spanish Ministerio de Ciencia e Inovación
(CTQ2008-00037/PPQ). The Fondazione Provinciale Comasca is acknowledged for partial funding.
G.T. thanks MUR (Progetto Giovani 2006) for a doctoral grant.
Page 12 of 34
ACS Paragon Plus Environment
Submitted to Inorganic Chemistry
123456789101112131415161718192021222324252627282930313233343536373839404142434445464748495051525354555657585960

Submitted to Inorganic Chemistry, December 2008 13
Table 1. Crystal data and refinement details for the compounds 1Ni and 1Cu.
Compound [M(pmdc)(H2O)2]·H2O
1Ni
M = Ni 1Cu
M = Cu
Emp. Form. C6H8NiN2O7 C6H8CuN2O7 fw, g mol-1 278.83 283.69
Crystal system Monoclinic Monoclinic SPGR, Z C2/c, 4 C2/c, 4
a, Å 7.1662(9) 7.0188(4) b, Å 12.036(1) 12.650(1) c, Å 10.585(1) 10.3889(9) α, ° 90 90
β, ° 96.491(7) 94.985(3)
γ, ° 90 90 V, Å3 907.1(2) 918.9 (1)
ρcalc, g cm-3 2.042 2.051 F(000) 568 572
µ(Cu-Kα), cm-1 34.3 37.0 T, K 298(2) 298(2)
2θ range, ° 10-105 10-105 Indexing Gof 25.7 26.8
Ndata 4751 4751 Nobs 533 536
Rp, Rwp[a] 0.045, 0.070 0.078, 0.121
RBragg[a]
0.060 0.079 χ2 [a,b] 10.91 15.4
V/Z, Å3 226.8 229.7
[a] Rp = Σi |yi,o - yi,c|/Σi |yi,o|; Rwp = [Σi wi (yi,o - yi,c)2/Σi wi (yi,o)
2]1/2; RBragg = Σn |In,o - In,c|/Σn In,o; χ2 = Σi
wi (yi,o - yi,c)2/(Nobs - Npar), where yi,o and yi,c are the observed and calculated profile intensities,
respectively, while In,o and In,c the observed and calculated Bragg intensities. The summations run
over i data points or n independent reflections. Statistical weights wi are normally taken as 1/yi,o. [b] These high χ2 values i) are clearly the consequence of the long counting rates allowed by the use
of a PSD detector, which enhances model deficiencies, and ii) lose their statistical meaning for a
Poisson’s distribution of photon counting efficiency.
Page 13 of 34
ACS Paragon Plus Environment
Submitted to Inorganic Chemistry
123456789101112131415161718192021222324252627282930313233343536373839404142434445464748495051525354555657585960

Submitted to Inorganic Chemistry, December 2008 14
Table 2: Crystal data and refinement details for the compounds 2Fe, 2Co, 2Ni, 2Cu and 3Cu.
Compound [M(pmdc)(H2O)n]
2Fe
M = Fe, n = 2 2Co
M = Co, n = 2
2Ni M = Ni, n = 2
2Cu M = Cu, n = 2
3Cu M = Cu, n = 0
Emp. Form. C6H6FeN2O6 C6H6CoN2O6 C6H6N2NiO6 C6H6CuN2O6 C6H2CuN2O4 fw, g mol-1 257.97 261.06 260.82 265.67 229.64
Crystal system Monoclinic Monoclinic Monoclinic Monoclinic Triclinic SPGR, Z C2/c, 4 C2/c, 4 C2/c, 4 P21/n, 4 P-1, 2
a, Å 6.9726(3) 6.9701(8) 6.897(1) 7.0118(2) 5.1495(5) b, Å 11.8600(4) 11.905(1) 11.863(1) 12.1701(4) 6.7207(6) c, Å 10.9749(4) 10.771(2) 10.692(2) 10.3889(3) 10.380(1) α, ° 90 90 90 90 86.511(6)
β, ° 92.402(2) 93.298(7) 94.111(9) 94.820(2) 100.13(1)
γ, ° 90 90 90 90 108.122(7) V, Å3 906.76(6) 892.3(2) 872.5(3) 883.40(4) 336.07(6)
ρcalc, g cm-3 1.890 1.943 1.986 1.996 2.269 F(000) 520 524 528 532 452
µ(Cu-Kα), cm-1 135.6 153.0 34.3 37.1 45.1 T, K 393(2) 403(2) 403(2) 298(2) 383(2)
2θ range, ° 10-90 10-75 10-105 10-105 5-105 Indexing Gof 22.1 53.64 - 18.6 43.5
Ndata 4001 3251 4751 4751 5001 Nobs 370 230 504 1030 776
Rp, Rwp[a] 0.052, 0.071 0.045, 0.060 0.015, 0.022 0.041, 0.065 0.022, 0.033
RBragg[a]
0.051 0.016 0.008 0.040 0.018 χ2 [a] 7.04 3.95 3.29 11.04 4.83
V/Z, Å3 226.9 223.1 218.1 220.9 168.0
[a] Rp = Σi |yi,o - yi,c|/Σi |yi,o|; Rwp = [Σi wi (yi,o - yi,c)2/Σi wi (yi,o)
2]1/2; RBragg = Σn |In,o - In,c|/Σn In,o; χ2 = Σi
wi (yi,o - yi,c)2/(Nobs - Npar), where yi,o and yi,c are the observed and calculated profile intensities,
respectively, while In,o and In,c the observed and calculated Bragg intensities. The summations run
over i data points or n independent reflections. Statistical weights wi are normally taken as 1/yi,o.
Page 14 of 34
ACS Paragon Plus Environment
Submitted to Inorganic Chemistry
123456789101112131415161718192021222324252627282930313233343536373839404142434445464748495051525354555657585960

Submitted to Inorganic Chemistry, December 2008 15
Table 3: Electronic and magnetic properties of compounds 1M and 3M.
Compound ∆∆∆∆o, cm-1 g J, cm-1 zJ’, cm-1 Reference
1Fe 9700 2.15 -2.5 8
1Co 10630 - -1.7[a] 8
1Ni 9020 2.07 -5.2 8
1Cu 15150 2.14 -32.7 8
3Co - 2.09[a] -1.01[a] -1.54[a] This work
3Ni 9020 2.17[a] -2.34[a] -4.73[a] This work
3Cu 15340 2.17 -38.8 This work
[a] Theoretically obtained by ab-initio Density Functional Theory (DFT)
calculations.
Page 15 of 34
ACS Paragon Plus Environment
Submitted to Inorganic Chemistry
123456789101112131415161718192021222324252627282930313233343536373839404142434445464748495051525354555657585960

Submitted to Inorganic Chemistry, December 2008 16
N N
O
N N
O
O
N
N
N
O
O O
N N
O O
N N
O
OO
O-
-
1 2 3
4 5
Chart I. Representative examples of anionic N,O organic ligands used in the construction of
polynuclear and/or polymeric coordination complexes. 1: 2-pyrimidinolate; 2: uracilate; 3: 2,4,6-
trioxo-1,3,5-triazine; 4: pyrimidine-5-carboxylate; 5: pyrimidine-4,6-dicarboxylate.
Page 16 of 34
ACS Paragon Plus Environment
Submitted to Inorganic Chemistry
123456789101112131415161718192021222324252627282930313233343536373839404142434445464748495051525354555657585960
Submitted to Inorganic Chemistry, December 2008 17
Scheme 1. Summary of the observed structural transformations for the 1M species, determined
through a complementary use of thermodiffractometry and thermal analysis. As for the details on
the relative stability of the 1Cu and 2Cu species, see text.
Cooling to r.t.
∆Dec.[M(pmdc)(H2O)2](H2O)
1M
[M(pmdc)(H2O)2]
2M
[M(pmdc)]
3M
∆ ∆
r.t.Dec.[Cu(pmdc)(H2O)2](H2O)
1Cu
[Cu(pmdc)(H2O)2]
2Cu
[Cu(pmdc)]
3Cu
∆ ∆
(M = Fe, Co, Ni)
Cooling to r.t.
∆Dec.[M(pmdc)(H2O)2](H2O)
1M
[M(pmdc)(H2O)2]
2M
[M(pmdc)]
3M
∆ ∆
Cooling to r.t.
∆Dec.[M(pmdc)(H2O)2](H2O)
1M
[M(pmdc)(H2O)2]
2M
[M(pmdc)]
3M
∆ ∆
r.t.Dec.[Cu(pmdc)(H2O)2](H2O)
1Cu
[Cu(pmdc)(H2O)2]
2Cu
[Cu(pmdc)]
3Cu
∆ ∆r.t.Dec.[Cu(pmdc)(H2O)2](H2O)
1Cu
[Cu(pmdc)(H2O)2]
2Cu
[Cu(pmdc)]
3Cu
∆ ∆
(M = Fe, Co, Ni)
Page 17 of 34
ACS Paragon Plus Environment
Submitted to Inorganic Chemistry
123456789101112131415161718192021222324252627282930313233343536373839404142434445464748495051525354555657585960

Submitted to Inorganic Chemistry, December 2008 18
Scheme 2. Schematic representation of a) 1Cu, b) 2Cu and c) 3Cu packing, showing the
1-D polymeric chains (horizontal light brown lines) and the inter-chains interactions
(vertical bars) that form the overall network. Hydrogen bonds, light blue; carboxylate
bridges, red; uncoordinated water molecules, turquoise circles.
a)
b)
c)
a)
b)
c)
Page 18 of 34
ACS Paragon Plus Environment
Submitted to Inorganic Chemistry
123456789101112131415161718192021222324252627282930313233343536373839404142434445464748495051525354555657585960
Submitted to Inorganic Chemistry, December 2008 19
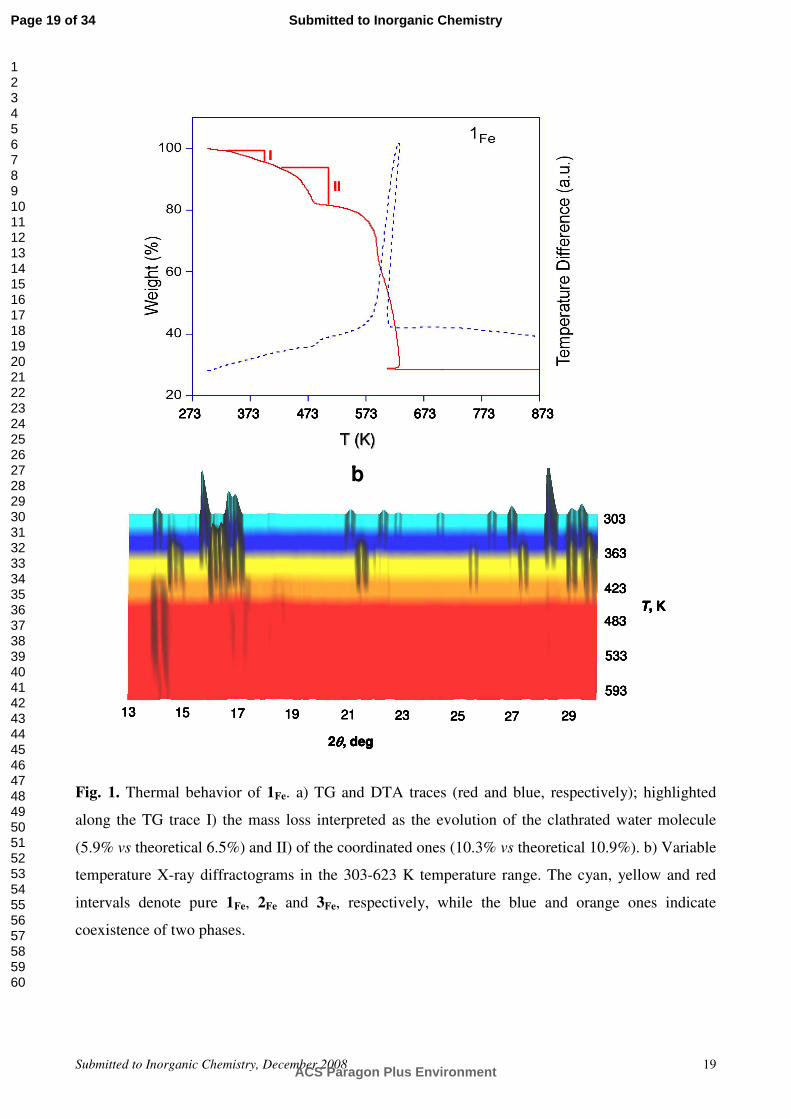
Fig. 1. Thermal behavior of 1Fe. a) TG and DTA traces (red and blue, respectively); highlighted
along the TG trace I) the mass loss interpreted as the evolution of the clathrated water molecule
(5.9% vs theoretical 6.5%) and II) of the coordinated ones (10.3% vs theoretical 10.9%). b) Variable
temperature X-ray diffractograms in the 303-623 K temperature range. The cyan, yellow and red
intervals denote pure 1Fe, 2Fe and 3Fe, respectively, while the blue and orange ones indicate
coexistence of two phases.
2θθθθ, deg
T, K
13 15 17 19 21 23 25 27 29
303
363
423
483
533
593
b
273 373 473 573 673 773 873
T (K)T (K)
II
I
2θθθθ, deg
T, K
13 15 17 19 21 23 25 27 29
303
363
423
483
533
593
b
2θθθθ, deg
T, K
13 15 17 19 21 23 25 27 29
303
363
423
483
533
593
2θθθθ, deg
T, K
13 15 17 19 21 23 25 27 29
303
363
423
483
533
593
2θθθθ, deg
T, K
13 15 17 19 21 23 25 27 29
303
363
423
483
533
593
b
273 373 473 573 673 773 873
T (K)T (K)
II
I
273 373 473 573 673 773 873
T (K)T (K)
273 373 473 573 673 773 873273 373 473 573 673 773 873273 373 473 573 673 773 873
T (K)T (K)
IIII
II
Page 19 of 34
ACS Paragon Plus Environment
Submitted to Inorganic Chemistry
123456789101112131415161718192021222324252627282930313233343536373839404142434445464748495051525354555657585960
Submitted to Inorganic Chemistry, December 2008 20
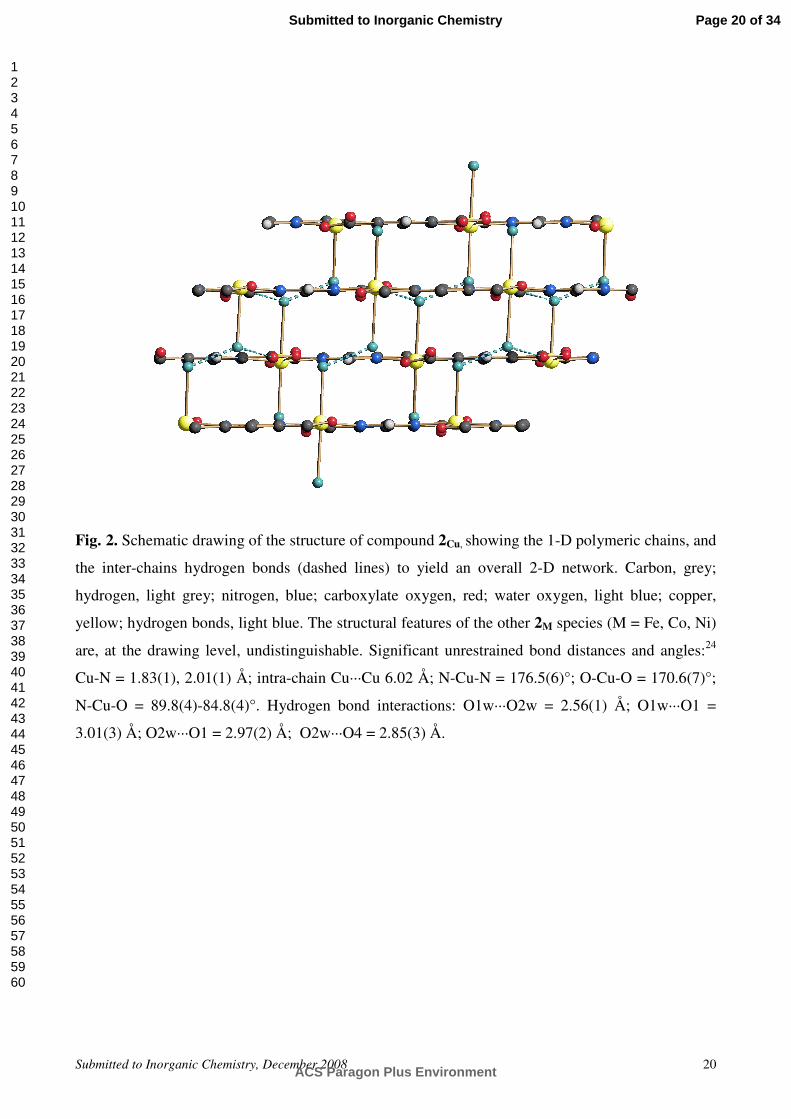
Fig. 2. Schematic drawing of the structure of compound 2Cu, showing the 1-D polymeric chains, and
the inter-chains hydrogen bonds (dashed lines) to yield an overall 2-D network. Carbon, grey;
hydrogen, light grey; nitrogen, blue; carboxylate oxygen, red; water oxygen, light blue; copper,
yellow; hydrogen bonds, light blue. The structural features of the other 2M species (M = Fe, Co, Ni)
are, at the drawing level, undistinguishable. Significant unrestrained bond distances and angles:24
Cu-N = 1.83(1), 2.01(1) Å; intra-chain Cu···Cu 6.02 Å; N-Cu-N = 176.5(6)°; O-Cu-O = 170.6(7)°;
N-Cu-O = 89.8(4)-84.8(4)°. Hydrogen bond interactions: O1w···O2w = 2.56(1) Å; O1w···O1 =
3.01(3) Å; O2w···O1 = 2.97(2) Å; O2w···O4 = 2.85(3) Å.
Page 20 of 34
ACS Paragon Plus Environment
Submitted to Inorganic Chemistry
123456789101112131415161718192021222324252627282930313233343536373839404142434445464748495051525354555657585960

Submitted to Inorganic Chemistry, December 2008 21
Fig. 3. Schematic drawing of structure of compound 3Cu, showing the 1-D polymeric chains and the
longer Cu···O inter-chain contacts (dashed lines). Carbon, grey; hydrogen, light grey; nitrogen, blue;
oxygen, red; copper, yellow. Significant bond distances and angles:24 Cu-N = 1.918(7), 1.861(7) Å;
Cu-O = 1.93(1), 2.02(1) Å; intra-chain Cu···Cu 6.01 Å; Cu···O = 2.86(2), 2.74(2) Å; N-Cu-O =
94.1(4)-93.7(4)°.
Page 21 of 34
ACS Paragon Plus Environment
Submitted to Inorganic Chemistry
123456789101112131415161718192021222324252627282930313233343536373839404142434445464748495051525354555657585960

Submitted to Inorganic Chemistry, December 2008 22
Fig. 4. Comparative structural analysis among the tris-hydrated (blue rhombi), the bis-hydrated (red
squares) and the anhydrous (green circles) species: a) pmdc bridged M···M distances (dMM) as a
function of Shannon crystal radii for coordination number VI [rM(II)].19 b) Molar volume (V/Z) as a
function rM(II).
a
5.90
6.00
6.10
6.20
6.30
6.40
0.68 0.70 0.74 0.76 0.78 0.80
Fe
Co
Ni
Cu
rM(II), Å
dM
M, Å
0.72
bFe
Co
Ni
Cu
210
215
220
225
230
235
240
0.68 0.70 0.72 0.74 0.76 0.78 0.80
rM(II), Å
V/Z
, Å3
Page 22 of 34
ACS Paragon Plus Environment
Submitted to Inorganic Chemistry
123456789101112131415161718192021222324252627282930313233343536373839404142434445464748495051525354555657585960

Submitted to Inorganic Chemistry, December 2008 23
0
0.1
0.2
0.3
0.4
0 50 100
T (K)
0
0.005
0.01
χχχχM T (cm3 K mol-1) χχχχM (cm3 mol-1)
0
0.1
0.2
0.3
0.4
0 50 100
T (K)
0
0.005
0.01
χχχχM T (cm3 K mol-1) χχχχM (cm3 mol-1)
Fig. 5. Comparative thermal behaviour of the dc magnetic susceptibility for the
[Cu(pmdc)(H2O)2]·H2O (1Cu, circles) and [Cu(pmdc)] (3Cu, squares) phases measured applying an
external magnetic field of 300 Oe. Open and full symbols denote χM and χMT, respectively.
Page 23 of 34
ACS Paragon Plus Environment
Submitted to Inorganic Chemistry
123456789101112131415161718192021222324252627282930313233343536373839404142434445464748495051525354555657585960

Submitted to Inorganic Chemistry, December 2008 24
Fig. 6. Comparative thermal behavior of the dc magnetic susceptibility for the
[Ni(pmdc)(H2O)2]·H2O (1Ni, circles) and [Ni(pmdc)] (3Ni, squares) phases measured applying an
external magnetic field of 300 Oe. Open and full symbols denote χM and χMT, respectively. The
inset in the figure represents the ac magnetic susceptibility for 3Ni.
0
1
2
3
0 50 1000
0.1
0.2
0.3
0.4
0
0.05
0.1
0.15
0 10 20T (K)
χχχχM' (cm3 mol-1)
0
0.01
0.02
χχχχM‘’ (cm3 mol-1)
χχχχMT (cm3 K mol-1)
T (K)
χχχχM (cm3 mol-1)
0
1
2
3
0 50 1000
0.1
0.2
0.3
0.4
0
0.05
0.1
0.15
0 10 20T (K)
χχχχM' (cm3 mol-1)
0
0.01
0.02
χχχχM‘’ (cm3 mol-1)
0
0.05
0.1
0.15
0 10 20T (K)
χχχχM' (cm3 mol-1)
0
0.01
0.02
χχχχM‘’ (cm3 mol-1)
χχχχMT (cm3 K mol-1)
T (K)
χχχχM (cm3 mol-1)
Page 24 of 34
ACS Paragon Plus Environment
Submitted to Inorganic Chemistry
123456789101112131415161718192021222324252627282930313233343536373839404142434445464748495051525354555657585960
Submitted to Inorganic Chemistry, December 2008 25
Notes and References
1 a) D. J. Collins and H.-C. Zhou, J. Mater. Chem., 2007, 17, 3154; b) S. Kitagawa, R. Kitaura and
S.-I. Noro, Angew. Chemie Int. Ed., 2004, 43, 2334; c) K. Uemura, S. Kitagawa, M. Kondo, K.
Fukui, R. Kitaura, H.-C. Chang and T. Mizutani, Chem. Eur. J., 2002, 8, 3587. 2 a) K. S. Park, Z. Ni, A. P. Côté, J. Y. Choi, R. Huang, F. J. Uribe-Romo, H. K. Chae, M. O’Keeffe
and O. M. Yaghi, Proc. Natl. Acad. Sci. USA, 2006, 103, 10186; b) H. Hayashi, A. P. Coté, H.
Furukawa, M. O’Keeffe and O. M. Yaghi, Nat. Mater., 2007, 6, 501. 3 G. Ferey, Chem. Soc. Rev., 2008, 37, 191. 4 a) R. G. Xiong, S. R. Wilson and W. Lin, J. Chem. Soc., Dalton Trans., 1998, 4089; b) L. Ma, O.
R. Evans, B. M. Foxman and W. Lin, Inorg. Chem., 1999, 38, 5837. 5 a) J. A. R. Navarro, E. Barea, J. M. Salas, N. Masciocchi, S. Galli, A. Sironi, C. O. Ania and J. B.
Parra, Inorg. Chem., 2006, 45, 2397; b) J. A. R. Navarro, E. Barea, J. M. Salas, N. Masciocchi, S.
Galli, A. Sironi, C. O. Ania and J. B. Parra, J. Mater. Chem., 2007, 17, 1939; c) A. Cingolani, S.
Galli, N. Masciocchi, L. Pandolfo, C. Pettinari and A. Sironi, Dalton Trans., 2006, 2479; d) J. A. R.
Navarro, E. Barea, A. Rodríguez-Diéguez, J. M. Salas, C. O. Ania, J. B. Parra, N. Masciocchi, S.
Galli and A. Sironi, J. Am. Chem. Soc., 2008, 130, 3978; e) G. Beobide, W.-G. Wang, O. Castillo, A.
Luque, P. Román, U. García-Couceiro, J. P. García-Terán, G. Tagliabue, S. Galli and J. A. R.
Navarro, Inorg. Chem., 2008, 47, 5267; f) S. Galli, N. Masciocchi, G. Tagliabue, A. Sironi, J. A. R.
Navarro, J. M. Salas, L. Mendez, M. Domingo, M. Perez-Mendoza and E. Barea, Chem. Eur. J.,
2008, 14, 9890. 6 a) L. C. Tabares, J. A. R. Navarro and J. M. Salas, J. Am. Chem. Soc., 2001, 123, 383; b) E. Barea,
J. A. R. Navarro, J. M. Salas, N. Masciocchi, S. Galli and A. Sironi, J. Am. Chem. Soc., 2004, 126,
3014. 7 R. R. Hunt, J. F. W. McOmie and E. R. Sayer, J. Chem. Soc., 1959, 525. 8 G. Beobide, O. Castillo, A. Luque, U. García-Couceiro, J. P. García-Terán and P. Román, Dalton
Trans., 2007, 2669. 9 A. A. Coelho, J. Appl. Cryst., 2003, 36, 86. 10 Topas-R, Bruker AXS: General profile and structure analysis software for powder diffraction data. 11 A. A. Coelho, J. Appl. Crystallogr., 2000, 33, 899. 12 C-C = C-N = 1.36 Å; C=O = 1.25 Å; C-H = 0.95 Å; aromatic ring angles = 120°. 13 R. W. Cheary and A. A. Coelho, J. Appl. Crystallogr., 1992, 25, 109. 14 a) A. March, Z. Kristallogr., 1932, 81, 285; b) W.A. Dollase, J. Appl. Crystallogr., 1987, 19, 267.
Page 25 of 34
ACS Paragon Plus Environment
Submitted to Inorganic Chemistry
123456789101112131415161718192021222324252627282930313233343536373839404142434445464748495051525354555657585960

Submitted to Inorganic Chemistry, December 2008 26
15 The phenomenological observation of a [10-1] preferred orientation pole (introduced, for 2Cu and
2Ni, in the final steps of the refinement procedure), agrees with the chain elongation axis [101], the
two crystal directions being nearly normal to each other. 16 a) X.-N. Cheng, W.-X. Zhang, Y.-Y. Lin, Y.-Z. Zeng, X.-M. Chen, Adv. Mater., 2007, 19, 1494.;
X.-N. Cheng, W.-X. Zhang, X.-M. Chen, J. Am. Chem. Soc., 2007, 129, 15739. 17 O. Kahn, J. Larionova, J. V. Yakhimi, Chem. Eur. J., 1999, 5, 3443. 18 Worthy of note, while XRPD-derived bond distances and angles involving light atoms are
inherently of low accuracy, dMM interactions are typically well determined, and, therefore, can be
safely employed in a relative comparison. 19 R. D. Shannon, Acta Cryst., 1976, A23, 751. 20 a) O. Castillo, A. Luque, S. Iglesias, C. Guzmán-Miralles and P. Román Inorg. Chem. Comm.,
2001, 4, 640; b) S. K. Ghosh, J. Ribas and P. K. Bharadwaj, Cryst. Eng. Comm., 2004, 6, 250. 21 J. Bonner and M. E. Fisher, Phys. Rev., 1964, 135, A640. 22 (a) C. Y. Weng, Ph.D. Thesis, Carnegie Institute of Technology, 1968. (b) A. Meyer, A. Gleizes,
J. J. Girerd, M. Verdaguer, O. Kahn, Inorg. Chem., 1982, 21,1729. (c) M. E. Fisher. Am. J. Phys.,
1964, 32, 343. 23 A. Cornia, D. Gatteschi and R. Sessoli, Coord. Chem. Rev., 2001, 219–221, 573. 24 As discussed in a number of papers and reviews, bond distances and angles derived from
conventional powder diffraction experiments suffer of intrinsic low accuracy, and should only be
taken as semiquantitative. After all, poor data are better than no data at all.
Page 26 of 34
ACS Paragon Plus Environment
Submitted to Inorganic Chemistry
123456789101112131415161718192021222324252627282930313233343536373839404142434445464748495051525354555657585960

Submitted to Inorganic Chemistry, December 2008 27
Supplementary Material
Table S1
Synoptic collection of the unit cell parameters of the tris-hydrated [M(pmdc)(H2O)2]·H2O and bis-
hydrated [M(pmdc)(H2O)2] species (1M and 2M respectively in the present work; M = Fe, Co, Ni,
Cu). For the sake of comparison, the unit cell parameters reported in Reference a have been
properly transformed, this obviously implying a passage from the original P21/c space group to
P21/n.
Compound SPGR a (Å) b (Å) c (Å) ββββ (°) V (Å3) Reference
1M series
[Fe(pmdc)(H2O)2](H2O) P21/n 7.347 12.128 10.641 95.33 944.1 a
[Co(pmdc)(H2O)2](H2O) P21/n 7.279 12.095 10.592 96.22 927.1 a
[Ni(pmdc)(H2O)2](H2O) C2/c 7.166 12.036 10.585 96.49 907.1 Present work
[Cu(pmdc)(H2O)2](H2O) C2/c 7.019 12.650 10.389 94.99 918.9 Present work
2M series [Fe(pmdc)(H2O)2] C2/c 6.973 11.860 10.975 92.40 906.8 Present work
[Co(pmdc)(H2O)2] C2/c 6.970 11.905 10.771 93.30 892.3 Present work
[Ni(pmdc)(H2O)2] C2/c 6.897 11.863 10.692 94.11 872.5 Present work
[Cu(pmdc)(H2O)2] P21/n 7.012 12.170 10.389 94.82 883.4 Present work
[Cu(pmdc)(H2O)2](H2O)0.2 C2/c 6.977 12.234 10.391 94.93 883.7 a
a G. Beobide, O. Castillo, A. Luque, U. García-Couceiro, J. P. García-Terán and P. Román, Dalton Trans., 2007, 2669.
Page 27 of 34
ACS Paragon Plus Environment
Submitted to Inorganic Chemistry
123456789101112131415161718192021222324252627282930313233343536373839404142434445464748495051525354555657585960

Submitted to Inorganic Chemistry, December 2008 28
Fig. S1 Thermogravimetric curves (TG/DTA) from room temperature to 873 K.
273 373 473 573 673 773 873
TT ((KK))
273 373 473 573 673 773 873
TT ((KK))
273 373 473 573 673 773 873
TT ((KK))
273 373 473 573 673 773 873
TT ((KK))
Page 28 of 34
ACS Paragon Plus Environment
Submitted to Inorganic Chemistry
123456789101112131415161718192021222324252627282930313233343536373839404142434445464748495051525354555657585960
Submitted to Inorganic Chemistry, December 2008 29
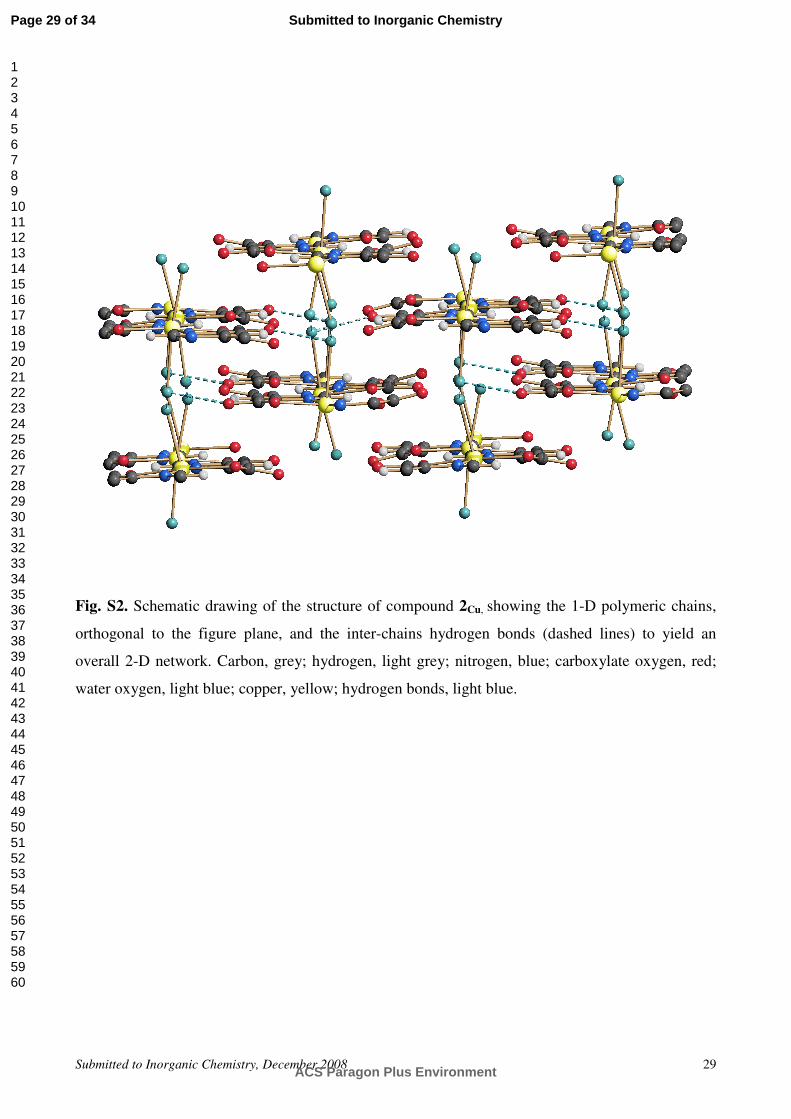
Fig. S2. Schematic drawing of the structure of compound 2Cu, showing the 1-D polymeric chains,
orthogonal to the figure plane, and the inter-chains hydrogen bonds (dashed lines) to yield an
overall 2-D network. Carbon, grey; hydrogen, light grey; nitrogen, blue; carboxylate oxygen, red;
water oxygen, light blue; copper, yellow; hydrogen bonds, light blue.
Page 29 of 34
ACS Paragon Plus Environment
Submitted to Inorganic Chemistry
123456789101112131415161718192021222324252627282930313233343536373839404142434445464748495051525354555657585960

Submitted to Inorganic Chemistry, December 2008 30
100959085807570656055504540353025201510
250.000
200.000
150.000
100.000
50.000
0
-50.000
[Ni(pmdc)(H2O)2](H2O) 100.00 %
100959085807570656055504540353025201510
900.000
800.000
700.000
600.000
500.000
400.000
300.000
200.000
100.000
0
-100.000
-200.000
[Cu(pmdc)(H2O)2](H2O) 100.00 %
Fig. S3 Final Rietveld refinement results, in terms of experimental (blue), calculated (red), and
difference (grey) plot, with peak markers at the bottom. Top to bottom: compounds
[Ni(pmdc)(H2O)2]·H2O (1Ni) and [Cu(pmdc)(H2O)2]·H2O (1Cu). Horizontal axis: 2θ, deg. Vertical
axis: intensity, counts. A few barely visible high-angle peaks in the plots of 1Ni and 1Cu are due to
the aluminum sample holder.
Page 30 of 34
ACS Paragon Plus Environment
Submitted to Inorganic Chemistry
123456789101112131415161718192021222324252627282930313233343536373839404142434445464748495051525354555657585960
Submitted to Inorganic Chemistry, December 2008 31
85807570656055504540353025201510
160.000
140.000
120.000
100.000
80.000
60.000
40.000
20.000
0
-20.000
[Fe(pmdc)(H2O)2] 100.00 %
70656055504540353025201510
35.000
30.000
25.000
20.000
15.000
10.000
5.000
0
-5.000
[Co(pmdc)(H2O)2] 100.00 %
100959085807570656055504540353025201510
110.000
100.000
90.000
80.000
70.000
60.000
50.000
40.000
30.000
20.000
10.000
0
-10.000
[Ni(pmdc)(H2O)2] 100.00 %
100959085807570656055504540353025201510
1.100.000
1.000.000
900.000
800.000
700.000
600.000
500.000
400.000
300.000
200.000
100.000
0
-100.000
-200.000
[Cu(pmdc)(H2O)2] 100.00 %
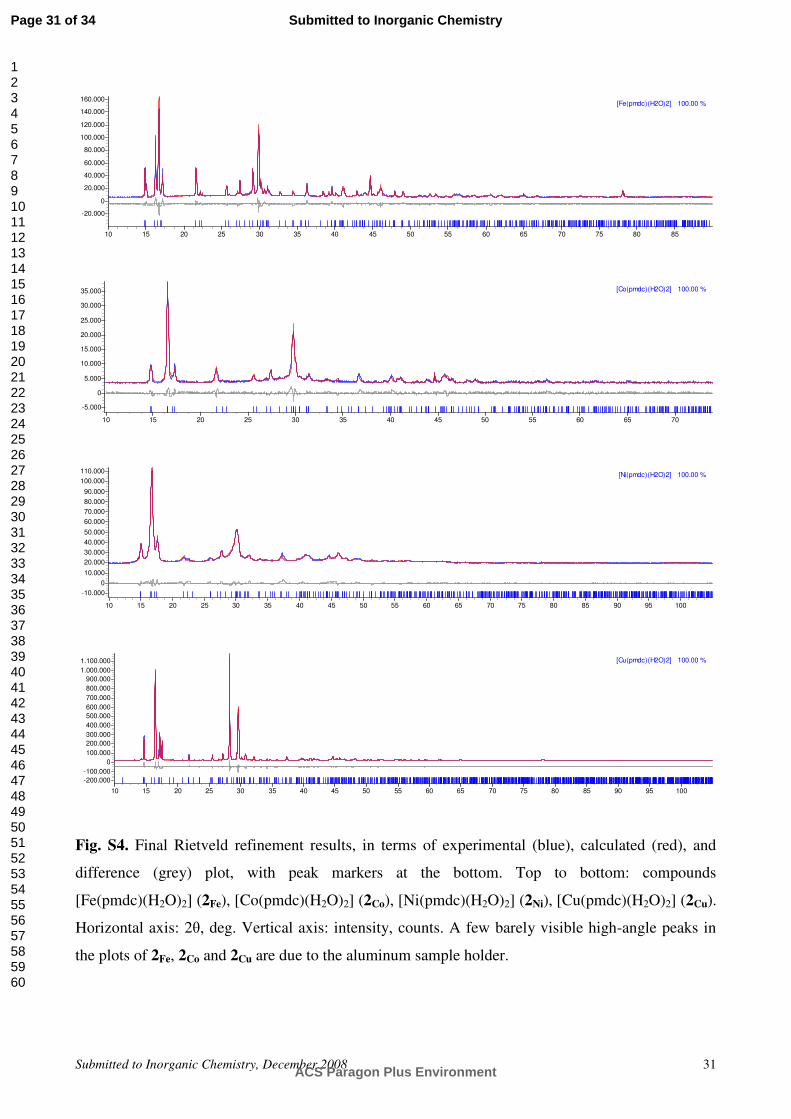
Fig. S4. Final Rietveld refinement results, in terms of experimental (blue), calculated (red), and
difference (grey) plot, with peak markers at the bottom. Top to bottom: compounds
[Fe(pmdc)(H2O)2] (2Fe), [Co(pmdc)(H2O)2] (2Co), [Ni(pmdc)(H2O)2] (2Ni), [Cu(pmdc)(H2O)2] (2Cu).
Horizontal axis: 2θ, deg. Vertical axis: intensity, counts. A few barely visible high-angle peaks in
the plots of 2Fe, 2Co and 2Cu are due to the aluminum sample holder.
Page 31 of 34
ACS Paragon Plus Environment
Submitted to Inorganic Chemistry
123456789101112131415161718192021222324252627282930313233343536373839404142434445464748495051525354555657585960

Submitted to Inorganic Chemistry, December 2008 32
1009590858075706560555045403530252015105
160.000
140.000
120.000
100.000
80.000
60.000
40.000
20.000
0
-20.000
[Cu(pmdc)] 100.00 %
Fig. S5. Final Rietveld refinement results for [Cu(pmdc)] (3Cu), in terms of experimental (blue),
calculated (red), and difference (grey) plot, with peak markers at the bottom. Horizontal axis: 2θ,
deg. Vertical axis: intensity, counts. A few barely visible high-angle peaks in the plot are due to the
aluminum sample holder.
Fig. S6. Comparison of the XRPD traces of [Fe(pmdc)(H2O)2]·H2O (1Fe, blue) and
[Fe(pmdc)(H2O)2] (2Fe, red).
2θθθθ, deg10 15 20 25 30 35 40
2θθθθ, deg10 15 20 25 30 35 40
Page 32 of 34
ACS Paragon Plus Environment
Submitted to Inorganic Chemistry
123456789101112131415161718192021222324252627282930313233343536373839404142434445464748495051525354555657585960

Submitted to Inorganic Chemistry, December 2008 33
Fig. S7. Comparison of the XRPD traces of [Ni(pmdc)(H2O)2]·H2O (1Ni, blue), [Ni(pmdc)(H2O)2]
(2Ni, red), and [Ni(pmdc)] (3Ni, green).
2θθθθ, deg
10 15 20 25 30 35
2θθθθ, deg
10 15 20 25 30 35
Page 33 of 34
ACS Paragon Plus Environment
Submitted to Inorganic Chemistry
123456789101112131415161718192021222324252627282930313233343536373839404142434445464748495051525354555657585960

Submitted to Inorganic Chemistry, December 2008 34
For the Table of Contents:
XRPD methods, combined with in situ thermodiffractometry and thermal analyses, highlighted the
reversible transformation of the 1-D [M(pmdc)(H2O)2]·H2O materials (1M, M = Fe, Co, Ni, Cu;
pmdc = pyrimidine-4,6-dicarboxylate) into the 1-D bis-hydrated counterparts (2M) by moderate
heating, followed by an irreversible complete dehydration (3M) implying a condensation of the 1-D
chains into 2-D layers through ancillary carboxylate bridges. The magnetic characterization of 1M
and 3M disclosed that the structural modifications prompted by the 1M → 3M transformation deeply
affect the magnetic behavior.
1M2M
3M
- H2O ( )
+ H2O ( )
- H2O (▬)
1M2M
3M
- H2O ( )- H2O ( )
+ H2O ( )+ H2O ( )
- H2O (▬)
Page 34 of 34
ACS Paragon Plus Environment
Submitted to Inorganic Chemistry
123456789101112131415161718192021222324252627282930313233343536373839404142434445464748495051525354555657585960


![[PPT]Nomenclatura Inorgánica - MAESTRIA GESTION ... · Web viewNomenclatura Inorgánica Nomenclatura Química Es el sistema de normas, comunes en todo el mundo, para denominar a](https://static.fdocuments.in/doc/165x107/5bb82da609d3f2930f8ba54b/pptnomenclatura-inorganica-maestria-gestion-web-viewnomenclatura-inorganica.jpg)