THEORY OF REASONED ACTION AND ITS …ageconsearch.umn.edu/bitstream/24319/1/cp03re01.pdffarmers’...
19
THEORY OF REASONED ACTION AND ITS INTEGRATION WITH ECONOMIC MODELLING IN LINKING FARMERS’ ATTITUDES AND ADOPTION BEHAVIOUR – AN ILLUSTRATION FROM THE ANALYSIS OF THE UPTAKE OF LIVESTOCK TECHNOLOGIES IN THE SOUTH WEST OF ENGLAND T Rehman 1 , K McKemey 1 , C Garforth 1 , R Huggins 2 , CM Yates 1 , RJ Cook 1 , RB Tranter 1 , JR Park 1 and PT Dorward 1 1 School of Agriculture, Policy and Development, The University of Reading, New Agriculture Building, Earley Gate, PO Box 237, Reading RG6 6AR England 2 National Centre for Environmental Data and Surveillance, Bath, BA2 9ES England [email protected] Abstract The behavioural intentions of a sample of livestock farmers in the south-west of England towards new technologies were analysed within a Theory of Reasoned Action (TORA) framework, in order to explore reasons for the apparently low rate at which research-based knowledge is being transferred to the livestock industry. Correlations between components of attitudes (outcome beliefs and evaluations), subjective norms (normative beliefs and motivation to comply) and behavioural intentions were integrated with Positivistic Mathematical Programming (PosMP) to create a set of farm type models, which can predict the potential rate and equilibrium level of uptake of different kinds of technologies. Data relating to techniques for oestrus detection in dairy cows are used to illustrate the analysis and to show how this approach can help improve the targeting of knowledge and technology transfer strategies. Linking the Theory of Reasoned Action findings with the Positivistic Mathematical Programming approach identified where there is a realistic prospect for increasing or accelerating the uptake of a technology, thus helping an agency charged with knowledge and technology transfer to decide where investment in communication is likely to pay off. In the case of MDC observation times, even a 20% change in attitude score among hill and upland dairy farmers would have minimal impact on the numbers adopting; while a similar change among mixed farms would lead to a greater increase. Targeting mixed farms with this particular technology would make more sense than promoting it among upland farmers. The overall findings reinforce the importance of understanding and addressing the prevailing beliefs and values within the objective population Introduction The examples of innovations and practices emerging from national and international research and development systems that have not been taken up by farmers, despite their economic advantages, are numerous. The research that explains such behaviour tends to emphasise the characteristics of innovations and those of the adopters and non-adopters along with profit motive (Ruttan, 1996) rather than uncover the complex interaction of the variety of motives and attitudes of likely adopters as related to the adoption process. Over the last two decades or so, several farm management studies have used the social psychology theory, Theory of Reasoned Action (TORA), where attitudes (positive or negative dispositions) and intentions of decision-makers, as influenced by beliefs, norms and the expectations of significant others, are central drivers of behaviour rather than profit alone. These studies are concerned primarily with understanding and predicting decision-making behaviours that are not amenable to straight forward explanations and such research falls into four broad categories: (a) environmental conservation management (Batchelor et al., 1999; Beedell, 1996; Beedell and Rehman, 1999 &2000; Bennett et al., 1999; Carr and Tait, 1991; Kiely-Brocato et al., 1980; Korsching and Hoban, 1990; McKemey, 1996; Willock, et al., 1999; Zubair, 2000); (b) soil conservation issues (Duff et al., 1991; Lynne and Rola, 1988; Lynne, et al., 1988; Napier et al., 1984); (c) pest management problems (Fernandez-Cornejo et al., 1994; Hassan, 2002; Heong and Escalada, 1999; Tait, 1983); and, (d) knowledge and technology transfer for subsumption into farmer practice (Batchelor et al., 1999; McKemey and Sakyi-Dawson, 2000; McKemey et al. 2002; Rehman et al., 2003). This paper presents a recently completed research project at The University of Reading on knowledge and technology transfer, where TORA has been combined with a formal economic modelling approach in a novel way to understand and to predict farmers’ behaviour towards the adoption of technologies that have stayed ‘on shelf’ for quite sometime, despite being otherwise promising. The Department for Environment, Food and Rural Affairs (DEFRA), the Environment Agency, the Meat and Livestock Commission and the Milk Development Council (MDC) have sponsored this project. Three specific livestock technology adoption behavioural domains have been targeted: oestrus detection, fertiliser and slurry management, and white clover inclusion in pastures among farmers in South West England. The process of technology adoption is explored in two main steps: first, TORA is used to identify barriers to and drivers for technology uptake; second, the results from TORA analysis are integrated with farm type economic models to project likely rates of adoption.
Transcript of THEORY OF REASONED ACTION AND ITS …ageconsearch.umn.edu/bitstream/24319/1/cp03re01.pdffarmers’...

THEORY OF REASONED ACTION AND ITS INTEGRATION WITH ECONOMIC MODELLING INLINKING FARMERS’ ATTITUDES AND ADOPTION BEHAVIOUR – AN ILLUSTRATION FROM THEANALYSIS OF THE UPTAKE OF LIVESTOCK TECHNOLOGIES IN THE SOUTH WEST OF ENGLAND
T Rehman1, K McKemey1, C Garforth1, R Huggins2, CM Yates1, RJ Cook1, RB Tranter1, JR Park1 andPT Dorward1
1School of Agriculture, Policy and Development, The University of Reading,New Agriculture Building, Earley Gate, PO Box 237, Reading RG6 6AR England
2National Centre for Environmental Data and Surveillance,Bath, BA2 9ES England
AbstractThe behavioural intentions of a sample of livestock farmers in the south-west of England towards new technologies wereanalysed within a Theory of Reasoned Action (TORA) framework, in order to explore reasons for the apparently low rate atwhich research-based knowledge is being transferred to the livestock industry. Correlations between components of attitudes(outcome beliefs and evaluations), subjective norms (normative beliefs and motivation to comply) and behavioural intentionswere integrated with Positivistic Mathematical Programming (PosMP) to create a set of farm type models, which can predict thepotential rate and equilibrium level of uptake of different kinds of technologies. Data relating to techniques for oestrus detectionin dairy cows are used to illustrate the analysis and to show how this approach can help improve the targeting of knowledgeand technology transfer strategies. Linking the Theory of Reasoned Action findings with the Positivistic MathematicalProgramming approach identified where there is a realistic prospect for increasing or accelerating the uptake of a technology,thus helping an agency charged with knowledge and technology transfer to decide where investment in communication is likelyto pay off. In the case of MDC observation times, even a 20% change in attitude score among hill and upland dairy farmerswould have minimal impact on the numbers adopting; while a similar change among mixed farms would lead to a greaterincrease. Targeting mixed farms with this particular technology would make more sense than promoting it among uplandfarmers. The overall findings reinforce the importance of understanding and addressing the prevailing beliefs and values withinthe objective population
IntroductionThe examples of innovations and practices emerging from national and international research and development systems thathave not been taken up by farmers, despite their economic advantages, are numerous. The research that explains suchbehaviour tends to emphasise the characteristics of innovations and those of the adopters and non-adopters along with profitmotive (Ruttan, 1996) rather than uncover the complex interaction of the variety of motives and attitudes of likely adopters asrelated to the adoption process. Over the last two decades or so, several farm management studies have used the socialpsychology theory, Theory of Reasoned Action (TORA), where attitudes (positive or negative dispositions) and intentions ofdecision-makers, as influenced by beliefs, norms and the expectations of significant others, are central drivers of behaviourrather than profit alone. These studies are concerned primarily with understanding and predicting decision-making behavioursthat are not amenable to straight forward explanations and such research falls into four broad categories: (a) environmentalconservation management (Batchelor et al., 1999; Beedell, 1996; Beedell and Rehman, 1999 &2000; Bennett et al., 1999;Carr and Tait, 1991; Kiely-Brocato et al., 1980; Korsching and Hoban, 1990; McKemey, 1996; Willock, et al., 1999; Zubair,2000); (b) soil conservation issues (Duff et al., 1991; Lynne and Rola, 1988; Lynne, et al., 1988; Napier et al., 1984); (c) pestmanagement problems (Fernandez-Cornejo et al., 1994; Hassan, 2002; Heong and Escalada, 1999; Tait, 1983); and, (d)knowledge and technology transfer for subsumption into farmer practice (Batchelor et al., 1999; McKemey and Sakyi-Dawson,2000; McKemey et al. 2002; Rehman et al., 2003).
This paper presents a recently completed research project at The University of Reading on knowledge and technology transfer,where TORA has been combined with a formal economic modelling approach in a novel way to understand and to predictfarmers’ behaviour towards the adoption of technologies that have stayed ‘on shelf’ for quite sometime, despite beingotherwise promising. The Department for Environment, Food and Rural Affairs (DEFRA), the Environment Agency, the Meat andLivestock Commission and the Milk Development Council (MDC) have sponsored this project. Three specific livestocktechnology adoption behavioural domains have been targeted: oestrus detection, fertiliser and slurry management, and whiteclover inclusion in pastures among farmers in South West England. The process of technology adoption is explored in two mainsteps: first, TORA is used to identify barriers to and drivers for technology uptake; second, the results from TORA analysis areintegrated with farm type economic models to project likely rates of adoption.

The paper is divided into the following sections: introduction to TORA; application in South West England; survey on heatdetection; results from TORA application; farm type models and their results; and, implications for knowledge and technologytransfer.
Theory of Reasoned ActionTORA is essentially a series of linked concepts and hypotheses postulated and developed by social psychologists to understandand to predict human behaviour (McKemey and Sakyi-Dawson, 2000). The theory is one of the “expectancy-value” models ofhuman behaviour and its terminology is not very different from that of the well-established subjective expected utility modelused by economists (Lynne, 1995). It has developed from the long-standing collaborative research by eminent psychologistsFishbein and Ajzen (see Fishbein and Ajzen (1975) and Ajzen and Fishbein (1980)). Since its introduction to behaviouralresearch, it has been applied to study a wide variety of situations and is now regarded as one of the most influential theoriesabout volitional human behaviour (Trafimow and Finlay, 2002). As the name of the theory implies, it “ … is based on theassumption that human beings usually behave in a sensible manner; that is, they take account of available information andimplicitly or explicitly consider the implications of their actions ... the theory postulates that a person’s intention to perform (ornot perform) a behavior [sic] is the immediate determinant of that action; barring unforeseen events, people are expected to actin accordance with their intentions” (Ajzen 1988, p.117).
The immediate antecedent of any behaviour is the intent to perform it. The stronger the intention, the more the person isexpected to try and therefore the greater the possibility that the behaviour will actually be performed, and thus the primaryconcern is with identifying the factors underlying the formation and change of behavioural intent (Fishbein & Manfredo, 1992).A person’s intention to behave in a certain way is based on: their ‘attitude’ toward the behaviour in question and theirperception of the social pressures on them to behave in this way, that is, ‘subjective norms’. The relative contribution ofattitudes and subjective norms varies according to the behavioural context and individual involved. Attitudes are determined bythe beliefs about the outcomes of performing the behaviour and the evaluation of these expected outcomes. The subjectivenorm is dependent on beliefs about how others feel the individual should behave and their motivation to comply with these‘others’ (Ajzen & Fishbein, 1980). These relationships are summarised in Figure 1.
The strength of the relationships between the variable constructs within the theory is measured using correlation coefficientanalysis. The multiple-correlation coefficient (R) serves as an index of the extent to which behavioural intention can be predictedfrom the simultaneous
Figure 1: Causal relationship links among the components of TORA (Ajzen and Fishbein, 1980)
consideration of attitude and subjective norm. In computing (R), weights (w) representing the contributions of attitude andsubjective norm towards the prediction of the behavioural intention are obtained. These weights are indicative of the relativeimportance of the variables’ contribution to the prediction of intention (Ajzen & Fishbein, 1980; DeBarr 1993, pp.6-7) andtherefore the relationship between attitudes and behaviour becomes:
SNABI B that so SN and A 211 1
wwmsbebn
i
n
jjjii +=≅∑ ∑==
= =Where A is attitude
toward the behaviour, bi is a belief about the likelihood of outcome i, ei is the evaluation of outcome i, n is the number ofsalient beliefs, S N is the subjective norm, s bj is a normative belief (that the reference group or individual, j , thinks the personshould or should not perform the behaviour), mj is the motivation to comply with referent j, B is the behaviour, B I is thebehavioural intention and 1w and 2w are the empirically determined weights.
Application of TORA
Behaviouralbeliefs and
outcomeevaluations
Attitude toward thebehaviour
Intention Behaviour
Normative(subjective)
beliefs and motivationsto comply
Subjective norm
Relative importance ofattitude and subjective
norm
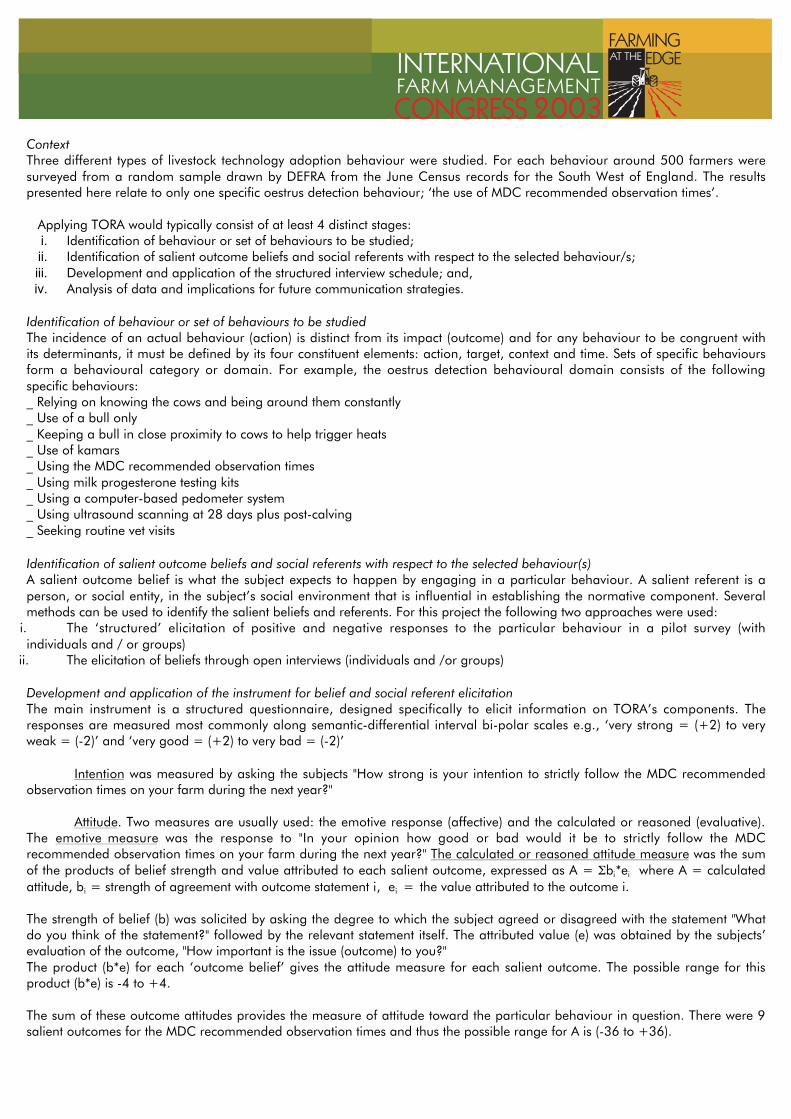
ContextThree different types of livestock technology adoption behaviour were studied. For each behaviour around 500 farmers weresurveyed from a random sample drawn by DEFRA from the June Census records for the South West of England. The resultspresented here relate to only one specific oestrus detection behaviour; ‘the use of MDC recommended observation times’.
Applying TORA would typically consist of at least 4 distinct stages: i. Identification of behaviour or set of behaviours to be studied; ii. Identification of salient outcome beliefs and social referents with respect to the selected behaviour/s; iii. Development and application of the structured interview schedule; and, iv. Analysis of data and implications for future communication strategies.
Identification of behaviour or set of behaviours to be studiedThe incidence of an actual behaviour (action) is distinct from its impact (outcome) and for any behaviour to be congruent withits determinants, it must be defined by its four constituent elements: action, target, context and time. Sets of specific behavioursform a behavioural category or domain. For example, the oestrus detection behavioural domain consists of the followingspecific behaviours:_ Relying on knowing the cows and being around them constantly_ Use of a bull only_ Keeping a bull in close proximity to cows to help trigger heats_ Use of kamars_ Using the MDC recommended observation times_ Using milk progesterone testing kits_ Using a computer-based pedometer system_ Using ultrasound scanning at 28 days plus post-calving_ Seeking routine vet visits
Identification of salient outcome beliefs and social referents with respect to the selected behaviour(s)A salient outcome belief is what the subject expects to happen by engaging in a particular behaviour. A salient referent is aperson, or social entity, in the subject’s social environment that is influential in establishing the normative component. Severalmethods can be used to identify the salient beliefs and referents. For this project the following two approaches were used: i. The ‘structured’ elicitation of positive and negative responses to the particular behaviour in a pilot survey (withindividuals and / or groups) ii. The elicitation of beliefs through open interviews (individuals and /or groups)
Development and application of the instrument for belief and social referent elicitationThe main instrument is a structured questionnaire, designed specifically to elicit information on TORA’s components. Theresponses are measured most commonly along semantic-differential interval bi-polar scales e.g., ‘very strong = (+2) to veryweak = (-2)’ and ‘very good = (+2) to very bad = (-2)’
Intention was measured by asking the subjects "How strong is your intention to strictly follow the MDC recommendedobservation times on your farm during the next year?"
Attitude. Two measures are usually used: the emotive response (affective) and the calculated or reasoned (evaluative).The emotive measure was the response to "In your opinion how good or bad would it be to strictly follow the MDCrecommended observation times on your farm during the next year?" The calculated or reasoned attitude measure was the sumof the products of belief strength and value attributed to each salient outcome, expressed as A = Σbi*ei where A = calculatedattitude, bi = strength of agreement with outcome statement i, ei = the value attributed to the outcome i.
The strength of belief (b) was solicited by asking the degree to which the subject agreed or disagreed with the statement "Whatdo you think of the statement?" followed by the relevant statement itself. The attributed value (e) was obtained by the subjects’evaluation of the outcome, "How important is the issue (outcome) to you?"The product (b*e) for each ‘outcome belief’ gives the attitude measure for each salient outcome. The possible range for thisproduct (b*e) is -4 to +4.
The sum of these outcome attitudes provides the measure of attitude toward the particular behaviour in question. There were 9salient outcomes for the MDC recommended observation times and thus the possible range for A is (-36 to +36).

The subjective norm. Two measures of the subjective norm are usually taken: (i) the stated subjective norm wasmeasured by asking "Would people who you respect in the farming industry be supportive if you adopted the MDCrecommended observation times as a heat detection method on your farm over the next year?" and (ii) the calculatedsubjective norm is measured as the sum of the products of the subjective or normative belief strength and the motivation tocomply related to the salient referents, that is,
SN = Σsbj*mj
where SN = subjective norm, sbj = subjective belief regarding referent j, and mj = the motivation to comply withreferent j.
The subjective belief (sb) was identified by asking "How strongly do you feel (the specific referent) would agree with youadopting one of the heat detection methods mentioned on your farm during the next year?" along the ‘strongly agree (+2) tostrongly disagree (-2)’ scale.The motivation to comply (m) with regard to a particular referent was measured in a similar way by asking "How motivatedwould you be to follow the advice of (specific referent) regarding the use of one of the three heat detection methods on yourfarm during the next year?" Next, the product (sb*m) for each salient referent is calculated to give a normative measureregarding each referent. For the MDC recommended times behaviour there were 8 referents; thus, using a 5 point semanticallydifferentiated scale for both measurements, the range for the SN score is (-32 to +32).
Survey on heat detection behaviourDesign and administration of the questionnaire.The scales used to measure the outcome beliefs, attitudes and subjective norms can be rather repetitive, which could be offputting for the respondents; therefore, for a questionnaire administrated through the post, several steps were taken to minimisethe impact of such a possibility.
Sample for the heat detection behavioural domainOf the 500 questionnaires sent to farmers, 29% returned usable responses. Table 1 shows their crop and livestock details. Thehigh standard deviations relative to the means show that a broad range of dairy farms were covered. The average farm sizeand grassland areas were 96 ha and 75 ha respectively, and the average herd size was 91 milking cows and 50 replacements.Table 2 shows the distribution of farms by farm type as defined by DEFRA’s Farm Business Survey (FBS). The majority of farms(41%) are medium sized specialist dairy with 17% being small specialist dairy farms. Although the sample contains few largefarms and few severely disadvantaged area farms it shows a good distribution over other farm types and between small andmedium farms, which are the focus of this study.
Only 9% of the farms were organic. The majority of farms (68%) were all lowland farms, with a further 13% ‘mostly lowland’.Upland farms accounted for 2% of the sample, with another 7% being ‘mostly upland’. The remaining farms (10%) were acombination of lowland and upland. Almost 67% of the respondents were owner-occupiers, 22% were tenants, and 3% hadboth tenures. The remainder had another role on the farm. A total of 87% of respondents were the main decision takers andsome 60% belonged to a farming or countryside organisation; 92% were male.
The respondents were predominantly middle-aged as almost 80% of them were over 40; and around 60% were aged between41 and 60 years old. Around 19% of the respondents had definitely identified a successor whilst 30% thought that theyprobably had done so. Those who don't yet know accounted for 18% of the sample; the remaining 21% had definitely not orprobably not identified a successor. Whilst over half the respondents had received no education beyond school, a total of 38%had attended college with 8% going on to university. Of those who had received further education, 50% stated that this wasspecifically in agriculture.
Over half of the respondents rely entirely on farming as their source of income; a further quarter receive 75% of their incomefrom farming; some 13% claimed that 25% or less of their total income came from the farm business.
Results from survey analysisAn overview of the TORA analysis of the observation times behaviour is presented in order:a) to identify current levels of behaviour and behavioural intent;b) to identify the differential influence of the attitudinal and normative components on the behavioural intent;c) to identify the cognitive drivers and barriers to the uptake of the particular behaviour; and,d) to identify the rationale supporting the identified influential barriers and drivers.
The findings for the whole sample are given in Figure 2. The correlations between the different variables are non-parametricSpearman type and the significance of differences between the mean scores has been tested using the Mann Whitney 'U' test.

Behaviour and behavioural intentThe MDC observation times are being used by only 10% of the respondents and the intention to adopt the MDC times isgenerally negative, though not strongly so (mean = -0.66, cf. Figure 2 and Table 3). The projected increase in taking up theMDC observation times is just 9%. This is calculated by comparing the proportion of actual use with the proportion intending touse the MDC times.
Differential influence of the attitudinal or normative componentsThis is determined by comparing the strength of the correlation between attitude (A) and the stated behavioural intent (I) andbetween subjective norm (SN) and the stated behavioural intent (I). In the case of dairy farmers following the MDCrecommended times, both A and SN correlate significantly with the farmers' intention and therefore are both influential (cf.Figure 2 and Table 3). However, the SN versus I is the stronger correlation implying that farmers are also sensitive to theopinions of their salient referents regarding MDC times.
Identification of cognitive 'barriers' and 'drivers'The barriers and drivers can be identified by observing the correlations between the different outcome attitudes and thebehavioural intent, that is (bi*ei) versus I. For the MDC observation times no 'barriers’ were observed (see Figure 2 and Tables 5and 6) and the main 'drivers' in order of their respective influence are (a) cost effectiveness; (b) improved heat detection rates;(c) improved conception rates; and, (d) effective silent heat detection. This analysis provides a strong inference that anypromotional messages regarding the MDC observation times should seek to reinforce these issues when targeting dairy farmersin the South West.
Differences between subject categoriesTable 6 shows the differences observed between some of the categories of farmers compared; for example, in the case oforganic farmers two 'barriers' are observed (Figure 3) that is ‘would fit the system’ and ‘ease of management’
For farmers under 40 years of age, the suggestion that following the MDC recommended times is relevant for their untrainedstaff is a barrier, although it is not the dominant influential outcome belief (Table 6). It is worth noting that female respondentsare most influenced by the issue of reduction in demand for labour; this is a topic that did not register any effect on othercategories of subjects (Table 6). This difference in attitude appears to underpin an observation made in the preliminary studiesthat the female members of the farming households tended to be responsible for heat detection.Rationale supporting the identified 'barriers and drivers'The differences between the influential outcome beliefs (b) and attributed values (e) can provide insights into the underlyingrationale regarding the particular barrier or driver as the example of expected appropriateness for untrained staff regarding theMDC times indicates (Table 4). This is just one instance where TORA analysis has brought out latent differences amongdifferent categories of subjects.
Table 4 presents the mean scores regarding the outcome beliefs (b), attributed values (e) and attitudes (b*e). Surprisingly, theattributed value regarding 'MDC times being appropriate for untrained staff' is negative. This seems counter-intuitive andsuggests underlying issues regarding this outcome expectation; that is, some farmers may find the concept of a method beingappropriate for untrained staff demeaning to their own herd knowledge and skill. Thus the messages that stress theappropriateness of a heat detection method for untrained staff may be reinforcing an existing barrier: undervaluing thefarmer’s skill and knowledge for heat detection.
Example Subjective Norm constructTable 7 presents the mean scores for the different social referents regarding the adoption of one of the heat detection methodsaddressed. The referents that correlate most closely with farmers' intention to use MDC times are: veterinarians; other farmers;and the MDC. However, when the motivational scores are examined, the value attributed to the MDC is slightly negative. Thusany strategy to promote a change in general heat detection practice will need to address farmers in the context of theirreferents and seek the endorsement of local vets in order to combat the negative motivation to comply with the MDC.
Combining TORA and Economic Modelling
TORA identifies the barriers and drivers to the adoption of oestrus detection technologies. This information in itself, however,does not provide quantitative estimates of the possible rates of adoption of any technology. To obtain these estimates, resultsfrom TORA analysis are linked to an economic modelling framework based on mathematical programming (MP). In thissection, only the essential features of this framework are mentioned, the complete details are given in Rehman et al. (2003).
Farm level MP models have been constructed using South West regional data from the Farm Business Survey, whilst a randomlyselected sample of farms in the South West was used to apply TORA. As both data sets are derived from the same population,

it is feasible to integrate them notwithstanding any survey bias. The TORA survey has been used to identify specific farm types(consistent with DEFRA's FBS types) ensuring that it contains sufficient data to be representative of a particular farm type. TheTORA survey also provides data on the current use of a given technology on each farm making up each type.
In linking TORA analysis with the MP models, a basic assumption is being made about how the attitude score for a technologyand the proportion of farms using that technology are related. It is a monotonically increasing relationship, implying that anegative score of -36 means no adoption and a score of +36 corresponds to complete adoption. The two key parameters thatare taken from the TORA analysis results to drive the MP models are the attitude score with regard to a technology and thesocial norm associated with it. MP methods have endured the test of time and remain popular for examining decision-makingsituations. Recently Howitt (1995) has proposed a version of MP, known as Positive Mathematical Programming (PMP) thatallows modellers to construct an objective function to replicate the observed decisions for a given period. PMP is very popular inpolicy modelling (Heckelei et al. 2001).
The current project has used a modification of PMP, called Positivistic Mathematical Programming (PosMP), which isconceptually and theoretically more rigorous than PMP. The basic concept is that farmers (or for that matter any economicagent) make decisions based upon whatever information they have available at the time. PosMP seeks to estimate a farmer'sutility function, based upon expectations and information at the time of taking a decision. For instance, although gross marginsmay not be known, the farmer may have an expectation of the likely gross margin and also of the associated risk (the variancein profits or yields). It is these expectations, and facts such as changes in subsidies, together with beliefs and attitudes thatinfluence a farmer's decision. This approach is similar to the TORA in that it seeks to provide estimates of the likelihood of agiven decision being taken. However, it does not take into account the belief and attitude structure generated by TORA analysis.On the other hand being an economic model, PosMP considers the actual physical farm constraints.
The Farm Type ModelsThe PosMP has been used to simulate the cropping and livestock decisions on a range of farm types in the South West ofEngland derived from the Farm Business Survey and June Census data, over 1993 to 2002 for: Specialist dairy; Mainly dairy;Mixed; Hill and Upland
Each model consists of three sets of distinct activities: cash crops; pasture and fodder; and, livestock. For each of these types ofactivity, a Behavioural Response Function (BFR) has been estimated statistically. For instance, on the Specialist Dairy farms, thekey drivers for cropping decisions are the expected gross margins (higher the gross margin of an activity, higher its contributionto the BFR), financial risk (higher the risk, lesser the incentive) and labour (higher the labour requirement, lesser the incentive).All BRFs include a term representing the preceding year, which is always the most significant indicator of behaviour as itrepresents 'unwillingness to change'.
Importing results from TORA to farm type modelsUnlike PMP, PosMP can include new activities that were not present at the calibration and estimation phases in the model.Assuming that the decision maker knows perfectly how the use of a new technology will contribute to the BRF, then that activitycan be included. In our example the use of MDC observation times improves heat detection but also increases labour;therefore, the effect of increased heat detection should translate into a lower replacement rate and hence an increase in grossmargin. But if labour is a significant factor, then the use of the new technology will also lower the contribution to the BRFbecause of the greater need for labour; so, two activities are considered: cows without the use of MDC observation times; and,cows with the use of observation times. Because the two activities have different gross margins and labour requirements, thecontributions to BRF will be different (also the effect of previous behaviour is a severe deterrent to the adoption of a newtechnology). Thus the model is able to replicate the proportions of animals with and without the use of the technology.
However, in reality technology adoption is not as simple as above. The assumption of ‘perfect knowledge’ can hardly besustained; thus making it necessary to estimate empirically how farmers perceive the performance of a technology in relation totheir BRFs, by importing the results of the TORA survey into the PosMP models.
In the survey, a set of nine questions was related to the use of MDC observation times for heat detection. Using a five-pointLikert scale, these questions measure both the strength of a belief held by a decision maker to various belief statements andtheir importance in decision-making. Take the following statement:
"The MDC recommended observation times are an effective method of identifying silent heats"
On the five-point scale, -2 corresponds to disagree strongly, 0 to no opinion and +2 to agree strongly; that is, positive beliefsare measured in a positive sense. Likewise importance of a belief is also measured on a five-point scale, where -2 corresponds

to unimportant, 0 to no opinion and +2 to very important. Hence an effective measure of the perceived benefit of a technologycan be given by summing the product of the belief and importance statements. If a farmer records +2 for his belief in theabove statement but scores 0 for the importance of this statement, the overall contribution to the proposed measure is therefore0. By summing these measures an attitude score ranging from -36 to +36 is obtained.
In the next stage these results are calibrated with the observed level of technology use. In the survey, 11% of farmers werealready using the MDC observation times. The PosMP model can therefore be used to determine the additional contribution tothe BRF, above that of cows without use of the technology, required in order that 11% of farmers would adopt the technology. Itis also necessary to calculate the minimum addition to the BRF required to obtain a 100% adoption.
It is now necessary to make an assumption. If farmers' attitude scores towards a technology are very strongly negative (e.g.corresponding to a score of -36 given above) then no farmers would adopt the technology. On the other hand, if attitudescores are extremely positive (+36) then adoption would be 100%.
Suppose a particular attitude score is B, the difference in the BRF is Dobs under 11% adoption (or Aobs) and Dmax is the differencein the BRF for maximum adoption, three points can be calibrated to each other. Hence:
Difference in BRF Percent adopted Belief and attitudeZero adoption 0 0 -36Current adoption Dobs Aobs BMaximumadoption
Dmax 100 +36
It is now possible to fit a curve through these points. This curve is used to calculate the additional contribution to the BRF underdifferent levels of attitude score, and through the use of the PosMP model the level of adoption.
Next the effect of social norm (SN) is accounted for to measure the influence of referents. This measure is also composed of twoparts. The first attribute, scored on a five-point Likert scale, measures the motivation of the decision maker to following theadvice from various sources (local colleges and universities, veterinary surgeons, other farmers, etc.). The second attribute,similarly measured, records the degree to which each social referent would support a decision to adopt a technology. The sumof the product of these scores for all referents gives a quantitative measure of the SN, scaled along a –32 to 32 range (re-scaled from -1 to 1). Therefore, if 11% of farmers have adopted the technology and the social norm is 0.1 then the differenceto the BRF is increased by 0.11*0.1 expressed as a percentage (that is, an increase of 1.1%). This mechanism simulates theeffect of those farmers who use the technology and other social referents on all farmers. The higher the social norm the greaterinfluence adopters will have on the non-adopters.
It is necessary to make a final assumption about farmers who use a technology currently but would not use it in the followingyear. If the current system is assumed to be in equilibrium (that is 11% of farms will be using the technology in the followingyear ceteris paribus), then the positive/negative effect of SN on adoption must be cancelled out. Therefore, a correction factorrepresenting the proportion of farmers using the technology in the current year who will not use it in the subsequent year is setequal to the effect of the SN under current conditions.
Finally, predictions for successive periods are updated. The farmers who use a technology would receive the benefits (if any) asthe new technology adds to the value of the BRF through changes in expected gross margins, labour use and risk, which canthen be fed back into the models to predict adoption in subsequent periods.
Assessing the prospects for the adoption of MDC recommended observation timesTable 8 shows the distribution of the study farms currently using MDC recommended observation times. Clearly in some casesthe sample sizes were very small and hence the errors associated with these estimates are large. However, it is interesting tonote that none of the hill or upland farmers use this technique. The BRF for hill and upland farmers shows that increasinglabour requirement has a detrimental effect on it and thus activities requiring more labour are less attractive to these farmers.The use of MDC recommended time heat detection method does increase labour by requiring farmers to observe their cows atcertain times.
To avoid difficulties with small sample sizes on some farm types, differences in farm size have been disregarded. The modelssimulate farm production patterns over the period modelled accurately. Further analyses in which successive years are omittedfrom the estimation procedure before providing forecasts for these years showed that the models do perform equally well, theaverage percentage deviation increasing nominally from 7.7% to 8.1%. Under current conditions the models predicted no

change in percentage of farms using MDC recommended observation times, not a surprising result as the current adoption isassumed to be in equilibrium.
Figures 4 to 7 show the adoption process over a 10-year horizon by modelling arbitrary changes to the attitude score of -10%,0%, 10% and 20%. The results show an initial effect of either increasing or reducing the attitude score. With an increase inattitude score the results show a sharp rise in the numbers of farmers using the technology; whereas a decrease in positiveattitude towards the technology reduces the numbers of farmers using it. The hill and upland farmers, where there was norecord of this technology being used, were the least responsive to change. This effect is also compounded by the nature of theBRF of this farm type, showing a reluctance to adopt a technology that increases labour demands. Following an initial changein technology use the results converge towards equilibrium over a number of years. This result is due to the influence of thesocial norm. However, this effect is relatively small and hence the equilibrium is quickly reached and is only slightly greater than(or less than) the initial change.
Figure 8 shows the effect of social norm for the specialist dairy farms assuming a 10% increase in attitude score and a 100%increase in social norm. Although this increase in social norm appears high, in reality the social norm is very small and thus a100% increase is also small. The results show that the initial adoption is the same as previously (it is assumed that social normincreases in year 2 and that year 1 is subject to the current social norm) but it increases marginally more rapidly than before.However, equilibrium is reached in approximately the same time frame as for changes in attitude scores.
Implications for knowledge and technology transferThe combination of TORA’s ability to decompose behavioural intent into quite specific components of attitudes and subjectivenorms, and the predictive ability of PosMP models, offers a useful tool for the improved targeting of knowledge and technologytransfer in the agricultural sector. The model outputs also remind us that attitudes are not static: they can change and thereforethey can be influenced through communication. A knowledge transfer strategy is essentially a communication strategy for aspecific purpose. Three key decisions in designing such a strategy relate to the audience, the appeal and the channel throughwhich information reaches the intended audience. Before exploring these, however, we touch on an important ethical concern.
Social psychology models have been widely used in commercial advertising to identify “appeals” and sources, based on ananalysis of attitude and subjective norm components respectively, that are likely to reinforce or change the behavioural intent ofdistinct audiences towards particular products. The motivation here is to boost company profits by increasing the amount of theproduct that consumers buy. Advertisers try to influence what consumers believe about the product: that there is a strongincentive to exaggerate or mislead is shown by the fact that governments find it necessary to introduce regulations governingwhat can and cannot be claimed in commercial advertising. With agricultural R&D funded by industry levy or the public purse,the underlying objective of technology transfer is to benefit the farmer and/or the population at large. A TORA analysis mayshow that farmers disagree with researchers’ perceptions about the merits of a particular technology. If, for example, farmersdo not believe that the technology will be labour saving, researchers should revisit their earlier conclusions relating to labourrequirements, from the perspective of the reality of farm businesses, before trying to devise clever advertising or demonstrationsto convince farmers otherwise.
The farm type models can show where there is a realistic prospect for increasing or accelerating the uptake of a technology,thus helping an agency charged with knowledge and technology transfer to decide where investment in communication is likelyto pay off. In the case of MDC observation times, even a 20% change in attitude score among hill and upland dairy farmerswould have minimal impact on the numbers adopting; while a similar change among mixed farms would lead to a greaterincrease. Targeting mixed farms with this particular technology would make more sense than promoting it among uplandfarmers.
The second area of decision concerns what one says about the technology in order to influence the audience’s decisions. Therelative influence of attitude and subjective norm on behavioural intention is one consideration. If the TORA analysis shows thatintention is more strongly influenced by attitudes than by subjective norms, promotion of the technology should focus onreinforcing those beliefs that are identified as drivers and combating those which are barriers. For example, the suggestion thatMDC observation times allow farmers to substitute unskilled labour for their own herd management expertise is not one that islikely to appeal to farmers. More sensible would be to provide data, which demonstrate the relative cost-effectiveness of themethod. Where subjective norms are the more significant determinant, then promotion should portray the views of thosereferents whom the analysis shows to be particularly influential, or seek their endorsement of the proposed technology. It canhowever be effective only if the views of referents are supportive of the proposed technology.
How to channel information for knowledge and technology transfer to the audience is the third area of decision. This is wherethe TORA analysis of salient referents and motivation to comply is most useful. Veterinary surgeons – not coming to the farmspecifically to advise on heat detection, but in the normal course of their work – are seen, together with other experienced

farmers, to have the greatest potential to influence farmers’ decisions on whether to use the recommended observation times.Placing stories in the farming press about how experienced farmers have found the observation times to complement their ownexpertise, and circulating to vets in dairying areas well-designed briefing documents on the research evidence relating toobservation times, should therefore be part of any strategy to promote this technology.
The research reported here had its origins in concerns about the slow uptake of technologies that seemed to offer potentialbenefit to farmers. The analysis suggests that combining TORA with PosMP modelling can help R&D agencies target theirknowledge and technology transfer more effectively. Further research will be needed to show whether communication strategiesinformed by this analysis do in fact result in an increase in the rate and equilibrium level of uptake.
AcknowledgementsThe research reported here was funded by DEFRA, the Environment Agency, the Milk Development Council and the Meat andLivestock Commission under the LINK Sustainable Livestock Production programme, project LK0647, from August 2001 to July2003. The authors are grateful for the sponsors’ financial support and for the interest they have shown throughout the courseof the research in the methodology and analysis.

ReferencesAjzen, I. & Fishbein, M. (1980). Understanding Attitudes and Predicting Social Behaviour. Englewood Cliffs, NJ, Prentice-Hall.Batchelor, S. J., McKemey, K. and Sakyi-Dawson, O. (1999). Barriers to the Adoption of Efficient energy Strategies in NorthernGhana (Project Technical Report Contract No R6849). Department of International Development, London.Beedell, J. D. C. (1996). Understanding the Link Between Farmers’ Attitudes and Behaviours Related to conservation Practices inBedfordshire, England. Unpublished PhD Thesis. The University of Reading, England.Beedell, J. and Rehman, T. (1999). Explaining farmers’ conservation behaviour: Why do farmers behave as they do? Journal ofEnvironmental Management 5 7: 165-176.Beedell, J. and Rehman, T. (2000). Using social-psychology models to understand farmers’ conservation behaviour. Journal ofRural Studies 1 6: 117-127.Bennett, R., Meister, A. and Wilkinson, R. (1999). Sustainable Soil Management in New Zealand: Farmer Beliefs, Attitudes andMotivations. Palmerston North, Centre for Applied Economics and Policy Studies, Massey University, New Zealand.Carr, S. and Tait, J. (1991). Differences in the attitudes of farmers and conservationists and their implications. Journal ofEnvironmental Management 3 2: 281-294.DeBarr, K., Ann. (1993). Predicting Adolescents' Behavioral Intention Regarding Safe Farm Tractor Operation. UnpublishedPh.D. Dissertation, Southern Illinois University Carbondale.Dent, J. B., Harrison, S. r. and Woodford, K. B. (1986). Farm Planning with Linear Programming: Concept and Practice.London, Butterworths.Duff, S., N, Stonehouse, D., P, Hilts, S., G, & Blackburn, D., J. (1991). Soil conservation behavior and attitudes among Ontariofarmers toward alternative government policy responses. Journal of Soil and Water Conservation 4 6: 215-219.Fernandez-Cornejo, J, Beach, E.D & Huang, W-Y. (1994).The adoption of IPM techniques by vegetable growers in Florida,Michegan and Texas. Journal of Agricultural and Applied Economics, 2 6. 158-172.Fishbein, M & Ajzen, I. (1975) Belief, Attitude, Intention and Behaviour: An introduction to Theory and Research. Reading, Mass.Addison-Wesley.Fishbein, M., & Manfredo, M., J. (1992). A Theory of Behavior Change. In M. Manfredo J (Ed.), Influencing Human Behavior:Theory and Applications in Recreation, Tourism, and Natural Resources Management (pp. 29-50). Champaign, Illinois:Sagamore Publishing Inc.Hassan, T. (2002). Understanding Farmers’ Attitudes and Behaviours Towards the Use of Pisticides on Cotton Crop in Pakistan’sPunjab. Unpublished PhD Thesis. The University of Reading, England.Heckelei, T., Witzke, H. P. and Henrichsmeyer, W. (2001). Agricultural Sector Modelling and Policy Information Systems.Wissenschaftsverlag Vauk Kiel KG, Kiel.Heong, K. L. and Escalada, M. M. (1999). Quantifying rice farmers’ pest management decisions: beliefs and subjective normsin stem borer control. Crop Protection 1 8: 315-322.Howitt, R. E. (1995). Positive mathematical programming. American Journal of Agricultural Economics 77:329-342.Kiely-Brocato, K. A., Buhyoff, G. J. and Leuschner, W. A. (1980). An attitude matrix scaling system with relevance for resourcemanagement. Journal of Environmental Management 1 0: 71-81.Korsching, P. F. and Hoban, T. J. (1990). Relationship between information sources and farmers' conservation perceptions andbehaviour. Society and Natural Resources 3:1-10.Lynne, G. D. and Rola, L. R. (1988). Improving attitude-behavior prediction models with economic variables: farmer actiontoward soil conservation. Journal of Social Psychology 128:19-28.Lynne, G. D., Shonkwiler, J. and Rola, L. R. (1988). Attitudes and farmer conservation behaviour. American Journal ofAgricultural Economics 7 0:12-19.Lynne, G. D. (1995). Modifying the neo-classical approach to technology adoption with behavioural sciences models. Journalof Agricultural and Applied Economics 2 7:67-80.McKemey, K. (1996). Post-War Agricultural Migrants’ Attitudes and Behavioural Intentions Toward a Protected RainforestBoundary: An analysis Applying the Theory of Reasoned Action with the ‘Si aPaz’ Buffer Zone, South Eastern Nicaragua.Unpublished PhD Thesis. The University of Reading, England.McKemey, K. and Saky-Dawson, O.A. (2000). Rice Crop Protection Technology Uptake Blockages Amongst Rice Farmers in Ghana:with Particular Reference to Variety Adoption and the Reduction of Pesticide Use. Legon, Ghana, University of Legon, Ghana.

McKemey, K., Sakyi-Dawson, O. A. and Batchelor. S. J. (2002). Displaced Person Domestic Energy - Demonstration Phase(Project Technical Report Contract No R7483). Department of International Development, London.Napier, T. L., Thraen, C. S., Gore, A. and Goe, W. R. (1984). Factors effecting adoption of conventional and conservationtillage practices in Ohio. Journal of Soil and Water Conservation 3 9: 205-209.Ruttan, V W (1996). What happened to technology adoption-diffusion research? Sociologia Ruralis 3 6: 51-72.Rehman, T., Yates, C. M., McKemey, K., Garforth, C. J., Cooke, R. J., Tranter, R. B., Park, J. R. and Dorward, P. T. (2003).Modelling the uptake of new technologies on dairy farms in South West England using the Theory of Reasoned Action andMathematical Programming. A Contributed Paper presented at the Agricultural Economics Society Conference, April 2003.Seale Hayne, England. 37pp.Saljoughi, F. (2002). Adoption of M-Commerce. Unpublished MSc Thesis. Agder university College in Grimstad, Norway.Tait, E. J. (1983). Pest control decision making on Brassica crops. Advances in Applied Biology 8:121- 188.Trafimow, D. and Finaly, K. A. (2002). The prediction of attitudes from beliefs and evaluations: the logic of double negative. BritishJournal of Social Psychology 41:77-86.Willock, J, Deary, I J, Edwards-Jones, G, Gibson, G J, McGregor, M. J, Sutherland, A, Dent, J B, Morgan, W and Grieve, R (1999).The role of attitudes and objectives in farmer decision-making: business and environmentally-orientated behaviour in Scotland.Journal of Agricultural Economics 50: 286-303.Zubair, M. (2002). An Application of Theory of Planned Behaviour and Logistic Regression Models to Understand Farm LevelTree Planting and its Determinants in the District of Dera Ismail Khan of Pakistan's North West Frontier Province. UnpublishedPhD Thesis, The University of Reading, England.

Table 1: Sample study farm statistics
N Mean Stand. Dev. Min MaxFarm size (ha) 134 96.4 66.9 5 400Permanent pasture (ha) 134 45.8 48.2 0 324Temporary pasture (ha) 134 29.0 28.2 0 135Forage maize (ha) 134 7.5 14.2 0 100Other forage crops (ha) 134 1.5 5.3 0 50Other arable crops (ha) 134 9.1 18.2 0 100Dairy cows 134 90.9 62.5 0 280Beef cows 134 43.3 59.6 0 400Sheep 23 173.1 152.6 1 700Dairy replacements 134 49.5 50.5 0 400
Table 2: Distribution of study farm types as defined by DEFRA’s Farm Business Survey
Total Small Medium LargeSpecialist Dairy 79 23 55 1Dairy and arable 15 3 12 0Mixed 18 6 10 2Disadvantaged area 20 5 13 2Severely disadvantaged area 3 0 3 0Total 135 37 93 5
Table 3: Mean, median and IQR readings of TORA variables for the whole sample re MDCobservation times and correlations of these variables with stated intent
n 131 I vs.Correlations
Main TORA variables (possiblerange)
mean median IQR rs
Strength of intention (1) (range -2 to +2) -0.66 -1 (-2/0)Stated attitude (SA) (range -2 to +2) 0.36 0 (0/1) 0.607(CA) Calculated Attitude ΣΣΣΣbi* ei (range -36to +36)
3.78 2 (0/5) 0.208
Stated (SN) (range -2 to +2) 0.36 0 (0/1) 0.343IQR: Inter Quartile RangeThe Spearman correlation coefficients are shown which are significant at a p = <O.050
Table 4: Outcome (OA) and calculated attitudes (CA), mean, median and Inter Quartile Rangereadings re MDC observation times
Outcomesn = 131
Outcome belief (b) Value attributed (e) Outcomeattitudes (OA)(b*e)
mean
median
IQR Mean
median
IQR Mean
median
IQR
(5) Improve HD rates 0.22
0 (0/1)
0.32
1 (-1/1) 0 .8 0
1 (0/1)
(4) Cost effective 0.18
0 (-1/1)
0.19
0 (-1/1) 0 .6 9
0 (0/1)
( 8 ) I m p r o v econception rates
0.23
0 (0/1)
0.44
1 (0/1) 0 .6 7
0 (0/1)

(1) Effective for silentheats
0.30
0 (0/1)
0.28
1 (-1/1) 0 .5 4
0 (0/1)
(3) Would fit system -0.33
0 (-1/0)
0.07
0 (-1/1) 0 .3 9
0 (0/1)
(6 ) Appropr ia teuntrained staff
-0.09
0 (-1/1)
-0.01
0 (-1/1) 0 .3 1
0 (0/1)
(9) Used all yearround
0.12
0 (-1/1)
0.17
0 (-1/1) 0 .2 9
0 (0/1)
(2) Easy to manage -0.27
0 (-1/1)
0.21
0 (-1/1) 0 .2 4
0 (0/1)
(7) Reduce labourdemand
-0.77
-1 (-1/0)
0.11
0 (-1/1) -0 .1 7
0 (-1/1)
Calculated attitude ΣΣΣΣbi* ei (range -36 to +36) 3 .7 8
2 (0/5)
Alpha coefficient re scale reliability14 0 .8 23
Table 5: Outcome attitudes (b*e) vs. intention (I)correlations re MDC observation times (whole sample)
Outcomesn = 131
Attitudes(b*e)rs
(1) Effective for silent heats 0.231(2) Easy to manage(3) Would fit system(4) Cost effective 0.381(5) Improve HD rates 0.282(6) Appropriate for untrained staff(7) Reduce labour demand(8) Improve conception rates 0.276(9) Can be used all year round(CA)Calculate Attitude ΣΣΣΣbi* ei reMDC times
0.208
The Spearman correlation coefficients are shown which are significant at a p = <O.050
14 The reliability test of the CA scale made, up of the different outcome attitudes, produced an Alpha (Cronbach) coefficient of 0.8. For ascale to be considered reliable the coefficient should be 0.6>.
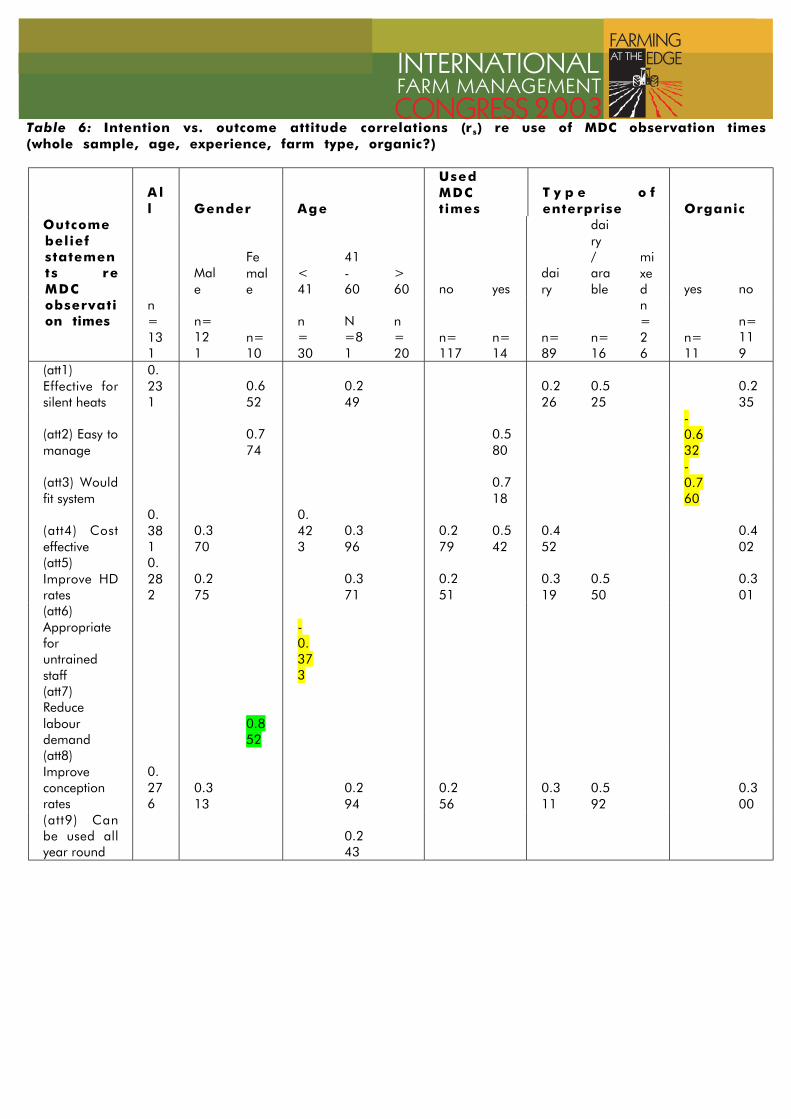
Table 6: Intention vs. outcome attitude correlations (rs) re use of MDC observation times(whole sample, age, experience, farm type, organic?)
A ll Gender Age
UsedMDCtimes
T y p e o fenterprise Organic
Male
Female
<41
41-60
>60 no yes
dairy
dairy/arable
mixed yes no
Outcomebeliefstatements reMDCobservation times
n=131
n=121
n=10
n=30
N=81
n=20
n=117
n=14
n=89
n=16
n=26
n=11
n=119
(att1)Effective forsilent heats
0.231
0.652
0.249
0.226
0.525
0.235
(att2) Easy tomanage
0.774
0.580
-0.632
(att3) Wouldfit system
0.718
-0.760
(att4) Costeffective
0.381
0.370
0.423
0.396
0.279
0.542
0.452
0.402
(att5)Improve HDrates
0.282
0.275
0.371
0.251
0.319
0.550
0.301
(att6)Appropriateforuntrainedstaff
-0.373
(att7)Reducelabourdemand
0.852
(att8)Improveconceptionrates
0.276
0.313
0.294
0.256
0.311
0.592
0.300
(att9) Canbe used allyear round
0.243

Table 7: Individual referent and calculated subjective norm, mean, median and IQR readingsre heat detection practice change in general
Referentn = 134
Motivation S t r e n g t h o fnormative belief
Subjective Norm
mean
median
IQR Mean
median
IQR Mean
median
IQR
Vet 0.86 1 (0 to1)
0.87 1 (0 to1)
1.14
1 (0 to2)
Other farmers 0.72 1 (0 to1)
0.53 0 (0 to1)
0.76
0 (0 to1)
AI service 0.43 1 (0 to1)
0.60 1 (0 to1)
0.53
0 (0 to1)
Farming press 0.32 1 (0 to1)
0.49 0 (0 to1)
0.45
0 (0 to1)
ADAS -0.34
0 (-1to 1)
0.28 0 (0 to1)
0.43
0 (0 to1)
MDC -0.09
0 (-1to 1)
0.50 0 (0 to1)
0.42
0 (0 to1)
Agric college orUNI
-0.04
0 (-1to 1)
0.46 0 (0 to1)
0.39
0 (0 to1)
Internet -0.56
-1 (-2to 0)
0.10 0 (0 to0)
0.38
0 (0 to0)
(CSN) Subjective norm (range -36 to +36) 4.66
3 ( 0t o8 )
Table 8: Percentage Distribution of FBS Farm Types in the TORA survey currently using MDCrecommended observation times
Total Small MediumSpecialist Dairy 10.3 17.4 7.3Dairy and arable 20.0 0.0 25.0Mixed 16.7 16.7 20.0Hill and Upland 0.0 0.0 0.0Total 11.9 13.5 9.7

Notes1. Only the Spearman correlation coefficients (rs) are shown that are significant at ≤0.050. (*, **, *** denote significance (p) at the 0.05, 0.01 and 0.001levels respectively).2. In the case of MDC observation times only 4 cognitive 'drivers' and no cognitive 'barriers' are observed when the whole sample is considered.3. The possible range and the mean score registered regarding each of the variables considered are presented.4. The Subjective Norm presented is the stated rather than calculated measure.
Figure 2: TORA nalysis of the MDC observation time findings (whole sample)
Ranked Influential 'Drivers' (b*e) correlation With Intention
rs.
Cost effective (range -4 to +4) mean = 0.69 0.381
(***) Improved HD rates (range -4 to +4) mean = 0.80 0.282
(***) Improved conception rates (range -4 to +4) mean = 0.67
0.276 (**)
Effective for silent heats (range -4 to +4) mean = 0.69 0.231
(**)
Attitude ΣΣΣΣbi*ei
Mean = 3.78 (range -36 to +36)
Subjective Norm
Mean = 0.36 (range -2 to +2)
Intention Mean = -0.66 (range -2 to +2)
Behaviour Mean = 0.10 (range = 0 to 1)
rs
0.261 (*)
rs
0.343 (***)
rs
0.387 (***)
Notes1. Only the Spearman correlation coefficients (rs) are shown that are significant at ≤0.050. (*, **, *** denote significance
(p) at the 0.05, 0.01 and 0.001levels respectively).2. In the case of MDC observation times only 4 cognitive 'drivers' and no cognitive 'barriers' are observed when the
whole sample is considered.3. The possible range and the mean score registered regarding each of the variables considered are presented.4. The Subjective Norm presented is the stated rather than calculated measure.
Figure 2: TORA nalysis of the MDC observation time findings (whole sample)

Notes:1. Only the Spearman correlation coefficients (rs) are shown that are significant at <0.050. (*, **, *** denote significance (p) at the 0.05, 0.01 and 0.001levels respectively).2. In the case of MDC observation times only 2 cognitive 'barriers and no cognitive 'drivers' are observed when the sub sample of organic farmers is considered.3. The possible range and the mean score registered regarding each of the variables considered are presented4. The Subjective Norm presented is the stated rather than calculated measureFigure 3: TORA analysis of the MDC observation time findings (Organic farmers)
Ranked Influential 'Barriers'(b*e) Correlation With Intention rs.
Would fit the system (range -4 to +4) mean = 0.10 -0.760(***)
Easy to manage (range -4 to +4) mean = 0.45 -0.632(***)
AttitudeΣΣΣΣbi*ei
Mean = 0.71(range -36 to +36)
SubjectiveNorm
Mean = 0.45(range -2 to +2)
IntentionMean = -1.27(range -2 to +2)
BehaviourMean = 0.08(range = 0 to 1)
rs(NS)
rs(NS)
rs(NS)
Notes:1. Only the Spearman correlation coefficients (rs) are shown that are significant at <0.050. (*, **, *** denote significance (p) atthe 0.05, 0.01 and 0.001levels respectively).2. In the case of MDC observation times only 2 cognitive 'barriers and no cognitive 'drivers' are observed when the sub sampleof organic farmers is considered.3. The possible range and the mean score registered regarding each of the variables considered are presented4. The Subjective Norm presented is the stated rather than calculated measureFigure 3: TORA analysis of the MDC observation time findings (Organic farmers)
0
5
10
15
20
25
1 2 3 4 5 6 7 8 9 10
Year
% A
dopt
ed -10%0%10%20%
Figure 4: Predicted rate of adoption of MDC recommended observation times for specialistdairy farms assuming changes in attitude score

Figure 5: Predicted rate of adoption of MDC recommended observation times for mainly dairyfarms assuming changes in attitude score
Figure 6: Predicted rate of adoption of MDC recommended observation times for mixed farmsassuming changes in attitude score
Figure 7: Predicted rate of adoption of MDC recommended observation times for hill andupland farms assuming changes in attitude score
05
101520253035
1 2 3 4 5 6 7 8 9 10
Year
% A
do
pte
d -10%0%10%20%
0
5
10
15
20
25
30
1 2 3 4 5 6 7 8 9 10
Year
% A
dopt
ed -10%0%10%20%
00.5
11.5
22.5
33.5
4
1 2 3 4 5 6 7 8 9 10
Year
% A
do
pte
d -10%
0%
10%
20%

Figure 8: Predicted rate of adoption of MDC recommended observation times for specialistdairy farms under a 10% increase to attitude score and 100% increase in social norm
02468
10121416
1 2 3 4 5 6 7 8 9 10
Year
% A
do
pte
dCurrent SN
+100% SN