THEORETICAL AND EXPERIMENTAL ANALYSIS OF DYNAMIC …
14
Jovanovi}, M., Lj. et al.: Theoretical and Experimental Analysis of Dynamic Process of … THERMAL SCIENCE, Year 2012, Vol. 16, Suppl. 2, pp. S687-S700 S687 THEORETICAL AND EXPERIMENTAL ANALYSIS OF DYNAMIC PROCESSES OF PIPE BRANCH FOR SUPPLY WATER TO THE PELTON TURBINE by Miomir Lj. JOVANOVIĆ * , Dragica R. MILENKOVIĆ, Goran S. PETROVIĆ, Predrag Dj. MILIĆ, and Saša M. MILANOVIĆ Faculty of Mechanical Engineering, University of Ni{, Ni{, Serbia Original scientific paper DOI: 10.2298/TSCI The paper presents the results of the analysis of pipe branch A6 to feed the Hydropower Plant ”Perućica” with integrated action Pelton turbines. The analysis was conducted experimentally (tensometric) and numerically. The basis of the experimental research is the numerical finite element analysis of pipe branch A6 in pipeline C3. Pipe branch research was conducted in order to set the experiment and to determine extreme stress states. The analysis was used to perform the determination of the stress state of a geometrically complex assembly. This was done in detail as it had never been done before, even in the design phase. The actual states of the body pipe branch were established, along with the possible occurrence of water hammer accompanied by the appearance of hydraulic oscillation. This provides better energetic efficiency of the turbine devices. Key words: pipe branch, FEM analysis, tensometric examination, hydraulic transient, Pelton turbine, pipeline Introduction The rapid growth of electricity consumption has led to the construction of large turbine plants in the world and our country. Such plants require a certain security in conditions of variable working mode and a high level of operational readiness. It is known that very intensive dynamic loads of machinery, equipment and feed piping system appear in the transient states of these plants, and that they require comprehensive study and analysis. For theoretical and experimental research, the hydropower plant "Perućica", which experienced problems due to hydraulic vibrations, was selected [1, 2]. The hydroenergy turbine plant "Perućica" is defined by the energy potential of the basin of the river Gornja Zeta, whose water is characterized by extremely favorable hydrological conditions with the basin area of 850 km 2 , average annual precipitation of 2072 mm/m 2 , and the average annual flow of 49.74 m 3 /s. The gross fall of 550 m provides the power of 307 MW, maximum annual production of 1300 GWh, and planned production of 932 GWh. The hydropower plant „Perućica“ is a derivational type plant with integrated horizontal Pelton * Corresponding author: [email protected]
Transcript of THEORETICAL AND EXPERIMENTAL ANALYSIS OF DYNAMIC …

Jovanovi, M., Lj. et al.: Theoretical and Experimental Analysis of Dynamic Process of …
THERMAL SCIENCE, Year 2012, Vol. 16, Suppl. 2, pp. S687-S700 S687
THEORETICAL AND EXPERIMENTAL ANALYSIS OF DYNAMIC PROCESSES OF PIPE BRANCH FOR SUPPLY WATER TO THE
PELTON TURBINE
by
Miomir Lj. JOVANOVIĆ*, Dragica R. MILENKOVIĆ, Goran S. PETROVIĆ, Predrag Dj. MILIĆ, and Saša M. MILANOVIĆ
Faculty of Mechanical Engineering, University of Ni, Ni, Serbia
Original scientific paper
DOI: 10.2298/TSCI
The paper presents the results of the analysis of pipe branch A6 to feed the Hydropower Plant ”Perućica” with integrated action Pelton turbines. The analysis was conducted experimentally (tensometric) and numerically. The basis of the experimental research is the numerical finite element analysis of pipe branch A6 in pipeline C3. Pipe branch research was conducted in order to set the experiment and to determine extreme stress states. The analysis was used to perform the determination of the stress state of a geometrically complex assembly. This was done in detail as it had never been done before, even in the design phase. The actual states of the body pipe branch were established, along with the possible occurrence of water hammer accompanied by the appearance of hydraulic oscillation. This provides better energetic efficiency of the turbine devices.
Key words: pipe branch, FEM analysis, tensometric examination, hydraulic transient, Pelton turbine, pipeline
Introduction
The rapid growth of electricity consumption has led to the construction of large turbine plants in the world and our country. Such plants require a certain security in conditions of variable working mode and a high level of operational readiness.
It is known that very intensive dynamic loads of machinery, equipment and feed piping system appear in the transient states of these plants, and that they require comprehensive study and analysis. For theoretical and experimental research, the hydropower plant "Perućica", which experienced problems due to hydraulic vibrations, was selected [1, 2]. The hydroenergy turbine plant "Perućica" is defined by the energy potential of the basin of the river Gornja Zeta, whose water is characterized by extremely favorable hydrological conditions with the basin area of 850 km2, average annual precipitation of 2072 mm/m2, and the average annual flow of 49.74 m3/s. The gross fall of 550 m provides the power of 307 MW, maximum annual production of 1300 GWh, and planned production of 932 GWh. The hydropower plant „Perućica“ is a derivational type plant with integrated horizontal Pelton
* Corresponding author: [email protected]
Jovanovi, M., Lj. et al.: Theoretical and Experimental Analysis of Dynamic Process of …
S688 THERMAL SCIENCE, Year 2012, Vol. 16, Suppl. 2, pp. S687-S700
turbines. Pipeline C3, which is discussed in this paper, was built in 1976, and supplies two generators of 65 MW.
The basic research and analysis of pipe branch A6, which is located on pipeline C3, was conducted as a part of mandatory periodic testing of the existing hydro-mechanical equipment. Additional research [3-6] provided a more complex image of the hydraulic pipe branch as a separate responsible element of this hydropower plant. Therefore, a static finite element method (FEM) analysis of piping system C3 and pipe branch A6 was performed. Experimental tensometric verification of the most loaded parts of the pipe branch in the charging mode and variable work of the object A6 with two Pelton turbines was also done. These two analyses, theoretical and experimental, give a very specific image of pipe construction and condition of capital hydro-mechanical equipment.
The examinations in the lab on the turbine model and objects give reliable information/data. However, since they are very expensive and complex, they still have not been performed in our country, even though the problems and damages due to hydraulic vibrations on much of the hydro-plants (even in Perućica) are very common/frequent [1, 2]. That is why the research of the transitional processes is still very important – to secure the safety of the installments [7, 8] and to improve their energy characteristics – greater energy efficiency.
Static structural analysis of pipe branch A6
For the analysis of the stress-strain state of the piping system, a nonlinear FEM for elasto-plastic stress field was used according to the bilinear solidification characteristic "nioval" 47. The bilinear characteristic is distinguished by two linear characteristics of the material strain in the elasto-plastic area. A nonlinear material property caused a nonlinear basic analysis considering the uncertain distribution of strain. The nonlinear analysis was conducted using the Newton-Raphson method [9]. The application of incremental loads was performed through 25 steps, determining total strains of the model to full effect.
Criteria for evaluation of pipe branch construction
Analyses were performed based on technical standards for responsible support structure, prescribed by the International Standards EC3. Allowed stresses were taken according to the standard SRPS U.E7.145 (1987/1991). The static safety factor for steel constructions was the primary influence (load case I), N 1.5 for normal stresses and S2.598 for shear stresses. Allowed normal and tangential stresses of the first case loads for "nioval" 47 were N-C = 313 N/mm2, N-C = 180 N/mm2. Allowed normal stresses under the regulations of the pipeline C3 designer (West-Alpina) were P = 313 N/mm2 and B = 293 N/mm2 for pipes and pipe branches (P 1.5, B 1.6 ).
Determination of pipe system load
1. The hydrostatic pressure inside the pipe branch is inserted based on the water column height to the internal surface of the construction. The measured pressure of the water column in the longitudinal axis of the branch at the time of the measurement was p0(Z) = 5.26·106 N/m2.
0 H2O( ) g( )XYZ XYZp p Z h Z (1)
where p0(Z) = 5.26·106 N/m2is the water pressure at the level of centerpiece horizontal plane of

Jovanovi, M., Lj. et al.: Theoretical and Experimental Analysis of Dynamic Process of …
THERMAL SCIENCE, Year 2012, Vol. 16, Suppl. 2, pp. S687-S700 S689
pipe, ρH2O = 1000 kg/m3 is the density of water, g = 9.81 m/sec2 is the acceleration of gravity, hXYZ is the global coordinate of the longitudinal axis of pipe branch in which the pressure is p0(Z = 610 m) = 5.26·106 N/m2 and ZXYZ is the local coordinate of gravity pressed surface of the finite element relative to the longitudinal axis of pipe branch. 2. The influence of gravity on the mass of pipe branch was introduced by acceleration due to gravity g = 9.81 m/sec2. The influence of gravity acts on the elements of the pipe branch and BEAM elements of the pipeline. 3. The influence of the weight of water in the pipe before and after the pipe branch was introduced by continuous load of water in the pipe: on a 2500 mm pipe the specific load was q = 48155 N/m, on a 2350 mm pipe the specific load was q = 42580 N/m, on a 2160 mm pipe (with different pipe thickness) it was q = 35947 N/m, q = 28997 N/m, q = 19724 N/m, and on a 1200 mm pipe it was q = 11095 N/m. 4. Longitudinal elastic force of pipeline C3. For modeling the elastic forces caused by hydrostatic pressure, an approximate method was used with a pre-determined elastic pipe elongation. Approximately the same results would be obtained using the pipe finite elements within which to define the hydrostatic pressure. Longitudinal elastic forces in the pipeline caused by hydrostatic pressure appear to the extent determined by the length of the elastic expansion pipe in the longitudinal direction. Longitudinal elastic forces are important in the pipe system with larger length and weight of pipeline such as the C3. These forces are determined by introducing the coefficient KL(I) (longitudinal elastic coefficient of expansion pipe) specified for the working conditions of pipeline C3 at the model geometry (I). Based on the coefficient KL(I), (starting from the longitudinal increase of hydraulic forces) the internal elastic forces were determined. In this way the linear finite elements obtained the pipe properties. The appearance of elastic forces in the pipeline is caused by internal hydrostatic pressure and the elastic expansion of pipeline. Longitudinal elastic forces in the pipe system are obtained by determining the coefficient KL(I) which represents the ratio of elastic elongation steel pipe ΔL(p) under internal pressure p and pipe elongation ΔLE(p,A0) effect caused by the same pressure on the forehead (closed end) pipe, area A0:
FEM
L(I)E 0
, ,
( , )
L p d DK
L p A
(2)
For pressure pipes, elongation (expansion) pipe is not directly caused by the force of the closed end of the head pipe because the tube at the internal pressure sheath expands in the radial direction. The expansion of tubes in the application of homogeneous elastic material causes shortening (contraction) of the pipe. The closed pipes under overpressure have an elongation which is the sum of the elongation due to the pressure at the closed end of the tube and the shortening due to the pressure to the internal wall of the pipe (shell). The elongation due to the pressure only on the closed end of the tube cross section area A0 can be determined from the pressure in the pipe p, pipe geometry D/d/L and elastic modulus of pipe material E:
2
0E 0 2 2
P
( , )( )
pA L pd LL p A
EA E D d
(3)
On the other hand, the closed pipe elongation ΔL(p) due to overpressure p is a typical case of the theory of elasticity of pipes, and is solved in this paper using FEM analysis. For example, FEM analysis used a d/D = 2500/2560 mm pipe, made of "nioval"-

Jovanovi, M., Lj. et al.: Theoretical and Experimental Analysis of Dynamic Process of …
S690 THERMAL SCIENCE, Year 2012, Vol. 16, Suppl. 2, pp. S687-S700
47 (elastic modulus E = 1.95·1011 N/m2), under internal pressure of 52.6 bar, closed at both ends of the flat circular surface. For the pipe of selected length L = 125 m, FEM analysis determined the envelope pipe elongation of ΔzFEM(L=125) = 0.028337 m. The finite element shell (δ/R = 30/1265 mm) was used. Elastic elongation caused only by the force in the front surface of the same pipe, according to equation (3), for this example is:
2 5 2
0 2 2 11 2 2
52.6 10 2.5 125.0(p,A ) 0.06945 mE ( ) 1.95 10 (2.56 2.50 )
pd LL
E D d
(4)
Based on the FEM analysis of elongation and elongation of pipe only from the pressure on the front surface, the longitudinal elastic coefficient of expansion is determined, according to expression (2), KL(I) = 0.40798. Thus, the elastic force of pipe elongation which occurs due to internal pressure can be determined for all pipe diameters in the pipeline. The longitudinal elastic force in each pipe under pressure p is then expressed through the corresponding coefficient KL, hydrostatic water pressure p and inside surface of pipe A(d), equation (5). In this way, the influence of pressure is introduced into the finite elements of the piping system. Elastic forces are the basis of displacement (dilation) of pipeline.
)()( LE dpAKdF (5)
Geometric model of pipe branch A6
The geometric model of the pipe branch is actually an analytical model of pipe distribution system C3 in the tunnel of the mechanical hall of the hydropower plant “Perućica”. The geometric model has the length of 146.890 m and width of 19.025 m. The geometric model of pipe C3 for analysis extends to a flat surface in the tunnel, distributing water to the turbines (fig. 1).
Figure 1. Horizontal plan of mechanical building with distribution pipe system C1-C3
The geometric model is of linear form in most of the piping system, while it is derived from the solids (filling volume continuum) in the part of the pipe branch. Pipe branch A6 is the object of the analysis, and that is why it is geometrically described in more detail in the form of solid continuum. Figure 2 shows pipe branch A6 in the first spot where C3 branches. Between pipe branch A6 and the line from the rest of the pipeline, there is a transition geometry that is not specifically shown but its elements can be seen. Transitional geometry is derived in order to create the surfaces which receive the pressure in the head of

Jovanovi, M., Lj. et al.: Theoretical and Experimental Analysis of Dynamic Process of …
THERMAL SCIENCE, Year 2012, Vol. 16, Suppl. 2, pp. S687-S700 S691
the inlet and outlet pipe of the branch. Also, pipe branch A6 is the main object of the analysis and, therefore, other parts of the distribution system C3 are not elaborated. The geometric model of the pipe branch was developed with the geometric modeler SolidWorks 2005.
Figure 2. The geometric model of pipe distribution C3 with pipe branches A6-A1
Discrete model of pipe branch A6
A discrete model is a set of finite elements which represent the actual physical pipe system C3 in front-turbine pipe tunnel. The discrete model is shown in fig. 3. The discrete model is derived from the 660 line finite elements which represent the pipe structure before and after pipe branch A6.
Figure 3. Discrete model of pipe branch A6, it has 1,688,800 solid finite elements (tetrahedron) with a grid of 536,769 nodes
The whole model is supported over 141 GAP line finite elements which introduce the friction in the supports in the X-Y plane of the model. Reactions due to friction in sliding supports are determined by vertical pressure forces of pipeline in supports and the coefficient of friction μ ≈ 0.40. The coefficient is taken for steel on steel friction and according to the surface condition of supports. There are 22 sliding supports and 7 fixed supports in the model. Pipe branch A6 is dependent on the ground over 112 GAP elements on a small contact surface. Fixed supports are at the beginning of the incoming pipe in T9 and at the ends of outlet pipes toward turbines. By introducing GAP finite elements, slipping of the whole pipeline is allowed

Jovanovi, M., Lj. et al.: Theoretical and Experimental Analysis of Dynamic Process of …
S692 THERMAL SCIENCE, Year 2012, Vol. 16, Suppl. 2, pp. S687-S700
due to charging and thermal dilatation. The slipping of pipeline C3 occurs in all supports which are only underpinned (supported). This really sets the suspension conditions of pipe branch A6 which is the subject of stress-strain analysis. The pipe branch (without transition elements) is modeled with 1,456,589 solid elements. Transitional geometry is modeled with 230,581 solid elements (insignificant specific mass). The complexity of the model is caused by the choice of tetrahedron as a favorable finite element in terms of shape for discretizing the geometrically complex continuum. The model is characterized by the pipe curvature in 3-D space, variable diameter of pipe branch, variable thickness of sheath pipe branch, and the presence of welded joints. The modeling was done with automatic generator. A controlled grid of finite elements in terms of tetrahedron geometric form and distortion of tetrahedron was developed with preprocessor MSC-NASTRAN [5, 6]. The overview of discrete properties of the FEM model is shown in tab. 1 and tab. 2.
Table 1. The grid elements of model pipe branch
Mass of FEM model [kg]
The volume of solid [m3]
Length of solid model [m]
Number of solid elements
(tetrahedrons)
The average volume of one element [cm3]
Value of average finite element
(tetrahedron) [cm] 44,333 5,640 9,473 1,687,170 3.34 2.665
Table 2. Overview the number of elements in the whole model
MODEL – 10 SOLID
Tetrahedron (4) BEAM
(Grid TYPE 2) GAP
Gap element MEMBRANES
at measuring points
The number of finite elements
1,687,170 660 141 832
Figure 4. Contour total translation of pipeline C3 (beam model)
Results of static Newton-Raphson analysis
The results of nonlinear static FEM analysis of piping systems are presented in further text. Fig. 4 shows the translation of the whole pipe system. The translation of pipe branch A6, as a central element of analysis, is given in fig. 5.
Jovanovi, M., Lj. et al.: Theoretical and Experimental Analysis of Dynamic Process of …
THERMAL SCIENCE, Year 2012, Vol. 16, Suppl. 2, pp. S687-S700 S693
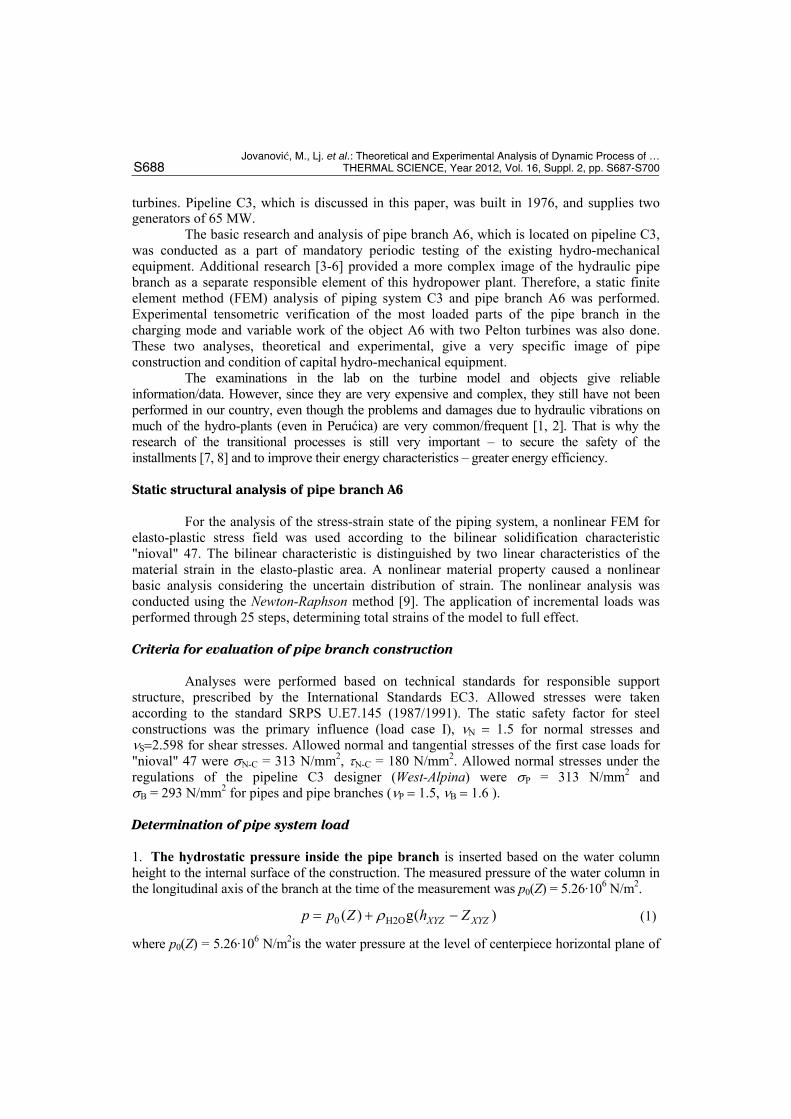
Figure 5. Contour total translation of pipeline A6 (solid model)
Figure 6. Contour of maximum comparative stress (Cutting plane-3, Pipe branch A6) (Max VM stress = 367344576 N/m2)
Figure 5 shows the results of Total Translation pipe branch on support A6 which is 0.0213 m. The maximum translation in the pipe system is under support A1 (the last curve at the end of pipeline C3) and amounts to 0.0277 m. These pictures were taken in the Continious Image form with fields to stress gradient and translation legend on the right side of the picture. Pictures of strain 4-5 are symbolic with caricatured increasing translation. Figure 6 gives an overview of the maximum VM stresses in cut pipe branch (lower half). Figure 6 shows the most complex VM stress at the internal knife of the pipe branch where it separates water flow from the main pipe to the turbine.

Jovanovi, M., Lj. et al.: Theoretical and Experimental Analysis of Dynamic Process of …
S694 THERMAL SCIENCE, Year 2012, Vol. 16, Suppl. 2, pp. S687-S700
Figure 7. Schematic layout of strain gauges during testing pipe branch A6
(a)
(b)
Figure 8. Hydropower Perućica: (a) photo of pipe branch A6, (b) measuring point R05, measuring experimental installation
Tensometric testing
Technical description of the measuring installation
Tensometric measurements were performed at 10 locations using three-component rosettes (RY41-10/120, HBM RY61-1.5/120). Measuring rosettes are connected to the digital measuring amplifier (HBM MGCPlus with 32 channels) and acquisition computer HP 6720. Special measuring cables NK LIYCY 60.25 mm2 are used for signal transfer. Ten installed measuring rosettes have 30 component strain sensors. The data about the position of measuring rosettes are given in fig. 7. The photo of the pipe branch is given in fig. 8(a). Figure 8(b) shows one measuring point (Rosette R05), according to the position and photography. Pressure measurement was performed in parallel on the location front-turbine shutter of pipe branch A6, with measuring instrument Cerabar T PMP 131 – ECOGRAPH T RSG 30. Measuring frequency amplifier HBM MGCPlus of ΩKD = 1000 Hz was used in measurements.
Regimes of experimental tests
The checking of the pipe branch was performed for two categories of action: Static,

Jovanovi, M., Lj. et al.: Theoretical and Experimental Analysis of Dynamic Process of …
THERMAL SCIENCE, Year 2012, Vol. 16, Suppl. 2, pp. S687-S700 S695
slowly charging pipeline C3, with water up to the highest point on the building entrance of upper water, and Dynamic variable load piping system during operation of turbines A5-A6 and their generator.
Results of measurements in the regime of static charging pipeline
Charging the pipeline C3 (conducted in 2007) lasted 9 hours. Charging in the regime of “bypass” reduces the speed of charging pipeline C3 in regard to normal flow. Charging causes the water pressure in the pipeline, which generates the primary loads of piping system.
Figure 9 shows the resulting data for the same measurements that are numerically determined, principal stresses, the angle of principal stress, and complex stress by Hencky-Huber-Mises (Von Mises).
Figure 9. Pipe branch A6 measuring point R05 charging pipeline regime (static), experimental
principal tensometric stress, reference Von Mises stress and angle of principal stress
Results of measurements in the regime of dynamic work aggregates
The highest variability of the load (pressure) pipe system occurs in the regime of full power Pelton turbines work (power A6 + A5 = 59 MW). The regime was realized with kinematics of normal acceleration and quick stop. Deceleration was determined by the prescribed procedure of automatic control of the duration of the transitional regime (Siemens PLC). This caused, according to fig. 10, the biggest change of pressure in front of the Pelton turbine of approximately 9%.
As a result of pressure changes, a process of change was created in the stress-strain state of the system piping. Changes of the three reference stresses, measured at the measuring point (R05), are shown in fig. 9. Measurement point (R05) is located in the central plane of the pipe branch at the inner pipe curve, separating the flow water, fig. 7.
Figure 10(b) provides a diagram of hydrodynamic pressure changes in front of the turbine.
Diagram 10 shows that after 600 seconds (after the closure of the front-turbine valve is completed), the pressure shock begins.

Jovanovi, M., Lj. et al.: Theoretical and Experimental Analysis of Dynamic Process of …
S696 THERMAL SCIENCE, Year 2012, Vol. 16, Suppl. 2, pp. S687-S700
Fluid Flow Analysis and Results
Determination of the intensity of the force which acts on the water flow branch A6 in pipeline C3 of hydropower plant Perucica
For the above defined geometry of the bend A6 (fig. 11), the measured overpressure in section 1-1 of pm = 52.6 bar, and the known flow rates in sections 1-1 and 3-3 (Q1 = 38.25 m3/s and Q3 = 12.75 m3/s), it is possible to determine the intensity of the force exerted by a water jet on the observed bend using the moment of momentum theorem, continuity equation and Bernoulli equations.
Figure 10. Pipe branch A6 measuring point R05 (dynamics): (a) tensometric three-component deformations, (b) diagram of hydrodynamic pressure changes in front of the turbine
According to the moment of the momentum theorem, the equation for defined cross-sections yields:
332211321* vQvQvQGPPPR
(6)
where 1 2 3, ,P P P
are the pressure forces in cross sections 1-1, 2-2 and 3-3, G
is the external force which acts on water in the control volume pipe bend, and R
is the force on the pipe bend walls.

Jovanovi, M., Lj. et al.: Theoretical and Experimental Analysis of Dynamic Process of …
THERMAL SCIENCE, Year 2012, Vol. 16, Suppl. 2, pp. S687-S700 S697
On the basis of flow rates Q1, Q2, Q3 the calculated velocities through the cross sections 1-1, 2-2 and 3-3 are: v1 = 7.8 m/s, v2 = 5.88 m/s and v3 = 11.28 m/s.
According to the Bernoulli equations, pressures and the pressure forces in cross sections 1-1, 2-2 and 3-3 are determined. Intensities of pressure forces are: P1 = 25806.87 kN, P2 = 22859.3 kN and P3 = 5907.47 kN.
The intensity of external force G = 259.11 kN is determined on the basis of water weight in the pipe bend for defined control volume V = 26.413 m3. Projections of force R
on coordinate
axes are determined according to Eq. 1, and the results are: R*
x = 3101.3 kN, R*
y = 6051.307 kN and R*
z = 259.11 kN. Simulation of Transient Flow: The previous calculation is valid for the case of
steady flow. Unsteady flow analysis in water power stations is one of the most significant issues in the prediction of undesirable pressure variations in waterways, as well as probable changes in rotor speed, for the power plants safe operation. Hydraulic transient in a hydroelectric power plant is usually caused by various turbine operations such as start up, load acceptance, and load rejection.
Traditionally, transient flow in a water power station is simulated using well-known water hammer equations [1, 2, 7, 12], and considering the steady state skin friction.
The main objective of this part of the paper is to simulate the transient flow in hydroelectric power stations using the improved method of characteristics developed by Karney [13] with extension given in paper [14]. The main task is to investigate the effects of the surge tank and wicket gate on transient conditions.
To fulfill these aims, the governing equations including continuity and momentum equations are numerically solved along the water ways. The forbay and tailrace water levels are considered as constant head boundary conditions.
Figure 12. Pressure values as function of time Figure 13. Water velocities in function of time
Figure 11. Geometry of the branch and forces
Jovanovi, M., Lj. et al.: Theoretical and Experimental Analysis of Dynamic Process of …
S698 THERMAL SCIENCE, Year 2012, Vol. 16, Suppl. 2, pp. S687-S700
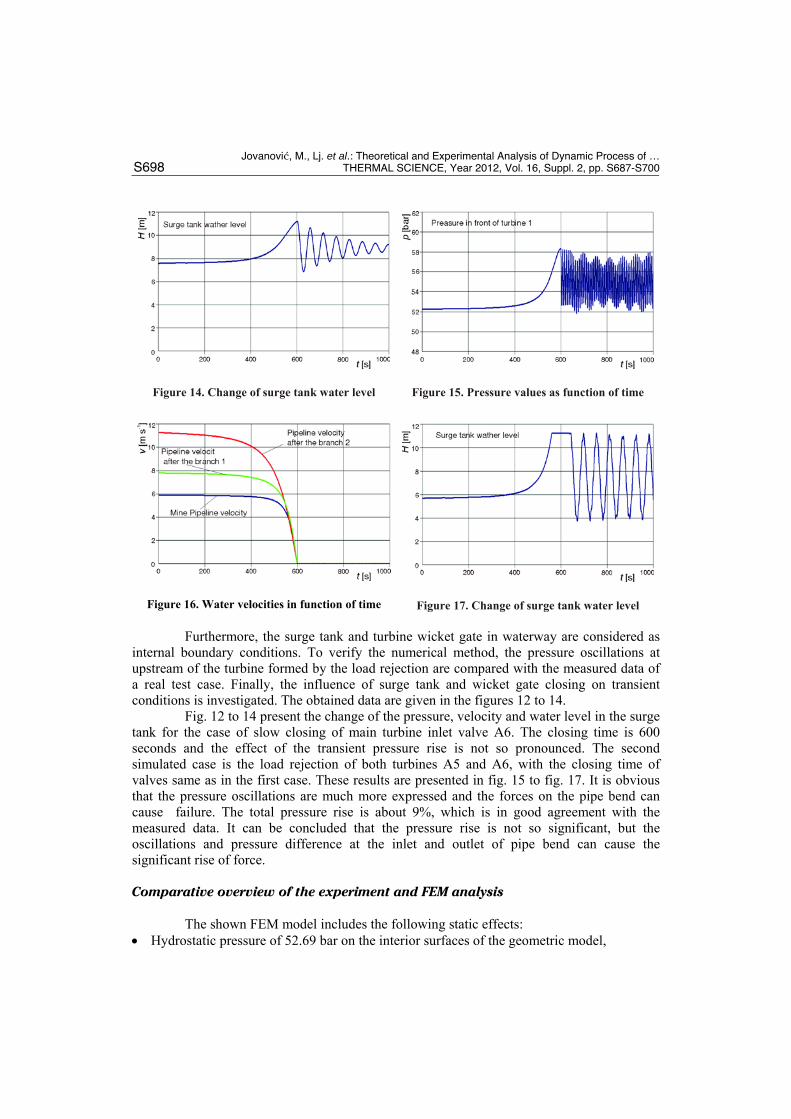
Figure 14. Change of surge tank water level Figure 15. Pressure values as function of time
Figure 16. Water velocities in function of time Figure 17. Change of surge tank water level
Furthermore, the surge tank and turbine wicket gate in waterway are considered as internal boundary conditions. To verify the numerical method, the pressure oscillations at upstream of the turbine formed by the load rejection are compared with the measured data of a real test case. Finally, the influence of surge tank and wicket gate closing on transient conditions is investigated. The obtained data are given in the figures 12 to 14.
Fig. 12 to 14 present the change of the pressure, velocity and water level in the surge tank for the case of slow closing of main turbine inlet valve A6. The closing time is 600 seconds and the effect of the transient pressure rise is not so pronounced. The second simulated case is the load rejection of both turbines A5 and A6, with the closing time of valves same as in the first case. These results are presented in fig. 15 to fig. 17. It is obvious that the pressure oscillations are much more expressed and the forces on the pipe bend can cause failure. The total pressure rise is about 9%, which is in good agreement with the measured data. It can be concluded that the pressure rise is not so significant, but the oscillations and pressure difference at the inlet and outlet of pipe bend can cause the significant rise of force.
Comparative overview of the experiment and FEM analysis
The shown FEM model includes the following static effects: Hydrostatic pressure of 52.69 bar on the interior surfaces of the geometric model,
Jovanovi, M., Lj. et al.: Theoretical and Experimental Analysis of Dynamic Process of …
THERMAL SCIENCE, Year 2012, Vol. 16, Suppl. 2, pp. S687-S700 S699
Influence of the Earth's gravity on the material of pipeline system g = 9.81 m/s2, Hydro-static effect of weight water in the form of forces on the linear part of the pipeline
model, Friction in the supports μ = 0.4 examination of the surface and 32 years of aging in a humid
condition, Presence of elastic forces in the beam elements of the model due to piping system
elongation caused by hydrostatic pressure fluid. Supports are modeled with the following features:
The elastic base due to pressure on the concrete supports of pipeline C3. The absence extension resistance uplift of pipeline with the supports. Restraint of line elements on the support T9 and elements in front-turbine wall. Freedom of movement of the internal supports of pipeline in the horizontal plane. Forces of friction (first-order theory) determined by vertical forces in the supports.
The approximation of model: The model dimensionally satisfies the control geometry of ± 1.5 mm, Hydrostatic forces are neglected in curves of linear model of the rest of pipelines, Friction in the supports is taken as equal but it is certainly different, Unknown differences of design and assembly geometry have not been introduced, The material is considered homogeneous and isotropic.
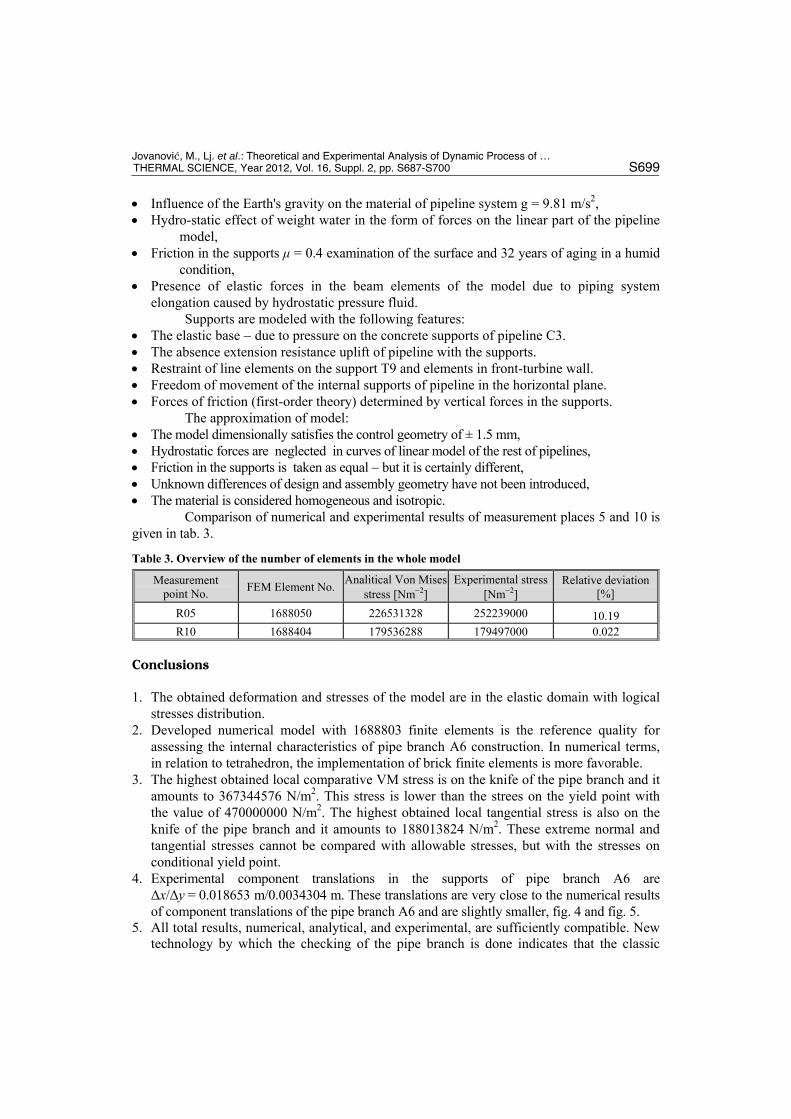
Comparison of numerical and experimental results of measurement places 5 and 10 is given in tab. 3.
Table 3. Overview of the number of elements in the whole model
Measurement point No.
FEM Element No. Analitical Von Mises
stress [Nm2] Experimental stress
[Nm2] Relative deviation
[%]
R05 1688050 226531328 252239000 10.19 R10 1688404 179536288 179497000 0.022
Conclusions
1. The obtained deformation and stresses of the model are in the elastic domain with logical stresses distribution.
2. Developed numerical model with 1688803 finite elements is the reference quality for assessing the internal characteristics of pipe branch A6 construction. In numerical terms, in relation to tetrahedron, the implementation of brick finite elements is more favorable.
3. The highest obtained local comparative VM stress is on the knife of the pipe branch and it amounts to 367344576 N/m2. This stress is lower than the strees on the yield point with the value of 470000000 N/m2. The highest obtained local tangential stress is also on the knife of the pipe branch and it amounts to 188013824 N/m2. These extreme normal and tangential stresses cannot be compared with allowable stresses, but with the stresses on conditional yield point.
4. Experimental component translations in the supports of pipe branch A6 are Δx/Δy = 0.018653 m/0.0034304 m. These translations are very close to the numerical results of component translations of the pipe branch A6 and are slightly smaller, fig. 4 and fig. 5.
5. All total results, numerical, analytical, and experimental, are sufficiently compatible. New technology by which the checking of the pipe branch is done indicates that the classic
Jovanovi, M., Lj. et al.: Theoretical and Experimental Analysis of Dynamic Process of …
S700 THERMAL SCIENCE, Year 2012, Vol. 16, Suppl. 2, pp. S687-S700
design technology of pipe branch was successful. 6. The comparison of the performed experiment on the hydropower plant Perućica with the
performed numerical simulation points to the same values of pressures in branch A6, which verifies this research.
7. The presented procedure of testing the work of a hydro-turbine installment can be recommended with the aim of increasing the general safety and energy efficiency.
Acknowledgement
The paper is a part of the research done within the projects TR35049 and TR 33040. The authors would like to thank to the Ministry of Education and Science, Republic of Serbia.
References
[1] Pejović, S., Obradović, D., Transient hydraulic processes and vibrations, Symposium "Modern problems of nonlinear continuum mechanics", Proceedings, Vrnjačka Banja, Serbia, 1985, pp. 35-77
[2] Pejović, S., et al. Calculations of hydraulic oscillations, International conference 35 years of Turboinstitut, Proceedings, Ljubljanja, Yugoslavia, 1984, pp. 750-766.
[3] Documentation of Material Control and Production Quality Pipe System under pressure at Power Plant „Perućica”– third phase", Institut of Material, Belgrad, Serbia, 1975.
[4] Stability Analysis of Pipe System III Power Plant „Perućica”, Energoproject Belgrad, 2000. [5] Power Plant „Perućica”– Pipe System C3, Periodicaly Examination Report, Lola Institut, Belgrad,
Serbia, 2002. [6] Jovanović, Lj. M., et al., Characteristic Stress State Examination of Pipe System C3 in Power Plant
„Perućica”- Part 9, Mechanical Faculty Podgorica, Montenegro and Mechanical Faculty Niš, Serbia, 2008.
[7] Pejović, S., et al., The influence of the transitional occurrences on the safety of energetic installments, 12th Council of the energy experts of Serbia, Proceedings, Poreč, Yugoslavia, 1981.
[8] Babić, M., et al., Overview of a new method for Designing high Efficiency Small hydro power Plants, Thermal Science, 14 (2010), pp. 155-169.
[9] ANSYS - Release 7.0, Theory Reference, Nonlinear Structural Analysis, 2000. [10] MSC/NASTRAN for Windows V 4.0, Theory Reference, FEMAP, 1998. [11] ALGOR-SSAP0H, V11.08-3H, Reference 1996. [12] Pejović, S., Hydraulic shock and transient regimes of hydropower systems, Institut of Mechanical
Faculty, Belgrad, 1977. [13] Karney, B., McInnis, D., Efficient calculation of transient flow in simple pipe network, Journal of
Hydraulic Engineering, 118 (1992), 7, pp. 1014-1030. [14] Boričić, B. Z., et al., Improving of method of characteristics for calculation of transient flow in pipe
networks, International scientific conference, Unitech ’04, Proceedings, 2004, pp. II-465-II-470.
Paper submitted: May 5, 2012.
Paper revised: July 4, 2012.
Paper accepted: July 10, 2012.