AE-376 Experimental and Theoretical Dynamic Study of the ...
44
AE-376 l/DC 62t.039.56, 621.039.524.46.034.46.036.2 Experimental and Theoretical Dynamic Study of the Agesta Nuclear Power Station P.-A. Bliselius, H. Vollmer and F. Akerhielm AKTIEBOLAGET ATOMENERGI STUDSVIK, NYKOPING, SWEDEN 1969
Transcript of AE-376 Experimental and Theoretical Dynamic Study of the ...
AE-376 l /DC 62t.039.56,
621.039.524.46.034.46.036.2
Experimental and Theoretical Dynamic
Study of the Agesta Nuclear Power Station
P.-A. Bliselius, H. Vollmer and F. Akerhielm
AKTIEBOLAGET ATOMENERGI
STUDSVIK, NYKOPING, SWEDEN 1969


AE-376
EXPERIMENTAL AND THEORETICAL DYNAMIC STUDY
OF THE AGESTA NUCLEAR POWER STATION
P . -A. Blisel ius ; , H. Vollmer ' and F . Akerhie lm
SUMMARY
The repor t p resen t s a final review and summary of all dynamic
investigations of the Agesta nuclear power station. Special attention
is paid to the final and unpublished exper iments per formed in 1965-66.
These exper iments a r e d iscussed and compared to the theore t ica l p r e
dict ions.
Transfe r functions and step responses were measu red by p e r t u r
bations in react ivi ty and s t eam load. Three methods were used for
t ransfer function m e a s u r e m e n t s : step functions, t rapeze waves and
multifrequency functions based on the pseudo-random binary sequence
(PRBS).
F r o m the frequency analysis we found that the different pe r tu rba
tion methods led to quite consistent r e s u l t s . For the Agesta applica
tion the PRBS method is demonst ra ted to be an accura te and prac t ica l
method for obtaining exper imenta l t r ans fe r functions. The s tep t ech
nique did not give sat isfactory resu l t s for frequencies above approx
imately 0. 01 Hz.
F r o m the stat ic check of the model we may conclude that the ex
per iments agree fairly well mutually and with theory. The m e a s u r e d
react ivi ty coefficients tend to be sma l l e r than the predicted ones .
The predicted t r ans ien t s compare well with the m e a s u r e d ones.
However, there is a tendency to more peaked power t rans ien t s from
the model . This is believed to be due to the assumption that the m o
dera tor could be r ega rded as one channel.
The dynamic exper iments ca r r i ed out at the Agesta nuclear power
station demonst ra te both the inherent stabili ty and the safety of this
plant.
P r in ted and dis tr ibuted in December 1 969.
P r e s e n t add re s s : ^ A B ASEA-ATOM, Vas te ras , Sweden 2 ' B R O W N BOVERI/KRUPP, Mannheim, Germany

LIST OF CONTENTS
Page
1. Introduction
2. Exper imenta l methods and equipment
2. 1 Exper imenta l methods
2. 2 Exper imenta l equipment
2. 2. 1 Measured quantities and signal t r ansduce r s
2 . 2 . 2 Data collecting and record ing sys tem
3. Descript ion of the dynamic model
4. Implementation of the dynamic exper iments
4. 1 Pe r fo rmance and analysis of exper iments
4 .2 Cros s -checks of the exper iments
5. Resul ts
5. 1 Remarks on the react ivi ty coefficients
5. 2 Static behaviour
5.3 Aperiodic per turbat ions
5.4 Frequency responses
6. Conclusions
7. Acknowledgements
References
List of figures
List of symbols

- 3 -
1. INTRODUCTION
The Agesta r eac to r is the f irs t power r eac to r built in Sweden. Its
main purpose is to provide experience for further developments . The
r eac to r is designed for a combined production of t he rma l power
(55 MW) for d is t r ic t heating and of e lec t r ic power (10 MW). A detailed
descr ipt ion of the Agesta nuclear power station is given in re ference
[ 1 ] . The reac to r was taken to the f irs t cr i t ical i ty in July 1963, and
reached full power in March 1964.
The r e a c t o r , contained in a p r e s s u r e ve s se l , is modera ted , r e
flected and cooled with heavy water at a t empe ra tu r e of 205 - 220 C.
The 140 fuel a s sembl i e s consist of 19 rod bundles of natural UO_,
canned in Zirca loy-I I . A simplified flow d iagram is outlined in F ig
ure 1. One cha rac t e r i s t i c feature of the Agesta r eac to r concept is
its inherent operat ional stabil i ty, which means that the internal feed
backs conduce to an efficient sel f - regulat ion of the sys tem. The forced
circulat ion and the suitable values of the negative fuel and m o d e r a
tor t empe ra tu r e coefficients of react ivi ty contribute to this p roper ty .
An analog model of the r eac to r plant [2 ] was worked out at an ear ly
s tage .
The dynamic investigation of the Agesta power reac to r se rves
basical ly th ree purposes :
a) identification of the p rocess and check of the analog model
b) check and development of exper imenta l methods and equipment
c) check of plant behaviour
Resul ts from pre l iminary dynamic exper iments , which were
c a r r i e d out in 1964, have been descr ibed [ 3 ] . The final dynamic ex
per iments were s ta r ted in the autumn of 1965 and finished during 1966.
These exper iments have been repor ted in part [4 "]. The repor t to be
presented here a ims at giving a final review and summary of al l dynam
ic investigations of the Agesta nuclear power station. Major attention
is paid to the final and unpublished exper iments . These will be d i s
cussed and compared to the theore t ica l predic t ions .
Our study was concentrated to the se l f - regula ted r eac to r , i . e .
with the automatic control sys tem switched off. Transfer functions
and step responses were measu red by per turbing the react ivi ty with

- 4 -
a fine control rod. Per tu rba t ions were a lso imposed in s team load, but
in this case only single steps were used.
Both theory and available equipment determined what kind of ex
per iments should be ca r r i ed out. The major source of uncertaint ies of
the model input data re la tes to the react ivi ty coefficients. Since these
could be deduced from the p re l iminary exper iments , the theore t ica l
r e sponses could be determined in advance with good accuracy and thus
se rve as a useful guide for the performance of the exper iments .
This repor t gives comparisons between theory and exper iments as
well as between different exper imental methods, including check of r e
producibil i ty.
2. EXPERIMENTAL METHODS AND EQUIPMENT
2. 1 Exper imenta l methods
Three per turbat ion methods have been used for the t ransfe r func
tions m e a s u r e m e n t s :
a) t r apeze waves
b) s tep functions (positive and negative steps)
c) multifrequency functions based on the pseudo-random binary sequence (PRBS) [ 5 ] .
The use of t rapezoidal per turbat ions was mainly motivated by the
need for a react ivi ty cal ibrat ion at a suitable frequency. At high f r e
quencies feedbacks a r e negligible and react ivi ty may be deduced from
nuclear power modulation and the well-known zero power t ransfer func
tion. Calculations show that 0. 3 Hz is high enough. This frequency is
attainable by the ordinary fine control rods at Agesta.
During the final measu remen t s in 1965 - 66 at Agesta the step func
tion was one of the per turbat ions used. Both positive and negative steps
were introduced in react ivi ty and in the valve setting of the s team load.
The step function had to be selected due mostly to l imitat ions of the
number of extra movements of the fine control rods during the m e a s
u rement s , However, by using the step technique the exper iments were
p repa red in such a way that theore t ica l step responses were available
from the analog simulation of the Agesta sys tem.

- 5 -
The third per turbat ion method, multifrequency s ignals , was based
on pseudo- random binary sequences , PRBS. The application of this
technique was developed during the f i rs t dynamic measu remen t s at
Agesta [ 3 , 4 ] . The two main methods for generating PRBS a re max i
mal length (m-)sequences and quadrat ic res idue (QR) sequences .
The PRBS is per iodic , T = N • A t, where N is the number of bit
in terva ls during a per iod and At is the bit in terval in seconds. A PRBS
is also charac te r i zed by its cyclic autocorre la t ion function, cp ( T ) ,
he re wri t ten in d i sc re te form:
N | 1 if T = 0, modulo N
^ ^ N l X(t)x(t + T ) = J i (1) t = 1 ( " M elsewhere
x(t) means the value of the sequence fx( t ) , t = 1, 2, . . . , N} . The e le
ments of the set [x(t)} satisfy the following conditions:
x(t) = +1 or -1 (2)
x(t + N) = x(t) (3)
N
£x(t) = - 1 (4) t = 1
P lus or minus signs of condition (2) a r e determined by the sequence
generat ion according to m - or QR-codes. F o r our application at Agesta
we generated the PRBS by QR-codes [6, 7], In this case N is a p r i m e
of the form 4 k - 1 . N-values of 31 and 127 were used for these m e a s u r e
ments .
The PRBS spec t rum is a line spec t rum with frequencies at mul t i
ples of the fundamental frequency, which i s :
£„ • N 4 * HZ <5 '
The upper frequency l imi t , the 3 dB point, is given by the re la t ion:
f _ ,_ & 0. 44 Nf =^£r, i f N > 1 9 (6) 3dB ~ o At

- 6 -
The normal ized PRBS amplitude spect rum is given by a :
im P s i n
a n = 5T-" - m " ' l f n ^ ° ^ N
1 a o ~ " N
2. 2 Exper imenta l equipment
_2._2j_l_Me^^u^e_d_quantitie_s _and_signal_transducers
During the p re l iminary exper iments the measu remen t s were p e r
formed with the fine control rod FCR II. This rod is however ra ther
close to the ion chamber and the relat ive change in the ion chamber
cur ren t due to the local effect of the rod displacement was therefore
2 - 3 t imes as l a rge as the re la t ive change in total reac tor power.
This fact could la te r easily be verified during the final exper iments
when the H ? 0 s team flow was recorded and the change in the rmal pow
er could be measu red accura te ly from the change in s team flow. Dur
ing the final exper iment the other fine control rod (FCR I) located far
from the ion chamber was used. F o r these per turbat ions the re la t ive
change in the ion chamber cur ren t was approximately equal to the r e
lative change in the s team flow. The measu red t empe ra tu r e s and p r e s
sure were taken from only one (a-circui t ) of the four para l le l p r i m a r y
c i rcui t s (see F ig . 1). Fo r step per turbat ion in s team load we also r e
corded information about the position of the valve setting during the
1965 - 66 exper iments .
Reactor signals for the dynamic recordings were taken mostly
from the ordinary operational inst rumentat ion, which means usually
l imita t ions both in accuracy and frequency response . A short review
of the m e a s u r e d quantit ies and the t r ansduce r s used is given below
(see also Fig . 1).
z: Posi t ion of fine control rod, FCR I. The indication is continu
ous with a t ime constant of about 0. 1 sec .
o: Net react ivi ty measu red by a react ivi ty mete r [8] , The most
sensit ive full scale range is 1 100 pcm with a t ime constant of
about 0. 08 sec . 1 pcm = 1 0 Ak/k.

- 7 -
P: Nuclear power. A gamma-compensa ted ion chamber was con
nected to a separa te electronic channel.
T : D-O t empera tu re after heat exchanger «=> inlet t empera tu re to
r eac to r . A r e s i s t ance t he rmomete r (0. 4 o / C) and Har tmann-
Braun t r a n s m i t t e r (0 - 20 mA) were used. Range: 0 - 250 C.
Time constant « 7 sec .
T : D_0 t empera tu re before heat e x c h a n g e r « r e a c t o r outlet t em-mo 2 c ° pe ra tu re « modera to r t empe ra tu r e . A t ransducer of the same
type as for T was used but the ranee was 150 - 250 C. ; r so b
w : H 0 0 s team flow. The t ransducer consisted of a ven tur imeter so 2 and a Har tmann-Braun DP t r a n s m i t t e r (0 - 20 mA). Range:
0 - 4 0 ton/h . Time constant « 1 sec .
p: Steam p r e s s u r e in heat exchanger. The t r ansducer consisted
of a Bourdon tube senso r with a Har tmann-Braun t r a n s m i t t e r
(0 - 20 mA). Range: 0 - 4 0 b a r s . Time c o n s t a n t s 1 s ec .
2._2._2_Data_collecting and recording sys tem
The main unit of the digital recording sys tem was RAMSES [ 9 ] .
The data acquisition unit, RAMSES, is an automatic and very flexible
data collecting and record ing sys tem for different nuclear m e a s u r e
ments . The signal conditioning and digitizing were developed during
the p re l imina ry exper iments and have also been repor ted [3]. Eight
signals were simultaneously digitized by RAMSES. F o r superv isory
purposes the same signals were recorded on an analog Sanborn record
er .
Active low pass f i l ters were used [10] and the sampling frequency
was normal ly 8 t imes the variable b reak frequency of the f i l ters when
recordings were taken for frequency analys is .
The RAMSES equipment also controlled the generation of the p e r
turbation function. F o r that purpose a p r o g r a m unit (tape r eade r with
a closed loop of punched tape) works synchronously with the other seq
uences of RAMSES.

- 8 -
3. DESCRIPTION OF THE DYNAMIC MODEL
The model used for prepar ing and analysing the dynamic exper i
ments per formed in 1965 - 1966 is documented in a separa te repor t
[ 13] , so that its descr ipt ion may be very brief h e r e .
The model is one-dimensional and essent ia l ly l inear ; the only non-
l inear i t ies considered were those in the kinetic equations and the ca l
culation of the turbine mass flow. Its input data re la te to basic design
fea tures , the only appreciable uncertaint ies being confined to the r e
activity coefficients and the heat t ransfer coefficient of the s team .gen
e r a t o r .
Fig. 2 may serve to display the se t -up of the model as well as the
in teract ions occurr ing in the dynamics of the Agesta nuclear power
plant.
Power is calculated from the kinetic equations where react ivi ty is
determined by externally inser ted react ivi ty and feedbacks. The la t ter
a r e mainly due to fuel t empera tu re changes (Doppler effect and t he rma l
expansion), modera tor and coolant t empera tu re changes.
The react ivi ty worth of a t empe ra tu r e change depends upon where
this change occu r s . Due to its importance this effect is accounted for
when calculating the react ivi ty contributions from modera tor t e m p e r
a ture changes. This implies a spatial integration of the weighted local
t e m p e r a t u r e changes, which is performed analytically.
The heat flux to the coolant is mainly determined by nuclear power,
a minor influence is due to coolant t e m p e r a t u r e . The la t ter is a func
tion of heat flux, inlet t empera tu re and possibly coolant velocity if the
pumps a r e not run at constant speed.
The outlet modera tor t empera tu re is essent ia l ly determined by the
inlet modera tor t empera tu re and to a l e s s e r extent by nuclear power
(y-heating) and affects the ex-core components of the plant. The in te r
actions between p r i m a r y and secondary side of the s team generator
a r e indicated in Fig . 2. Finally, the outlet t empera tu re of the s team
generator is the var iable represent ing the influence of the ex-core com
ponents on the core .
The effect of Xe-poisoning may be neglected in short t ime in te r
vals up to 5 minutes . This has been verified by a special model which

- 9 -
determines react ivi ty contributions due to Xe-poisoning from the nu
c lear power his tory and the nuclear and ma te r i a l p roper t i e s for iodine
and xenon. More details on the model may be found in Ref. [ 14] .
Three steps may be distinguished when performing an actual dy
namic calculation. F i r s t , the data of the plant design and operation
have to be collected. Second, from these input data the dynamic r e l a
t ionships between the var ious (physical) quantities of in te res t a r e de
t e rmined in t e r m s of t r ans fe r functions. Third, the t r ans ien t s a r e ca l
culated on an analog computer .
4. IMPLEMENTATION OF THE DYNAMIC EXPERIMENTS
4. 1 Pe r fo rmance and analysis of exper iments
The objective of the dynamic studies was stated in section 1. Its
technical rea l iza t ion was l imited by seve ra l fac tors , the main l imi ta
tions being in -co re ins t rumentat ion, possibil i ty of adequately p e r t u r b
ing the plant sys tem, and t ime for r eac to r exper imen t s .
Before the exper iments were per formed in the r eac to r the planned
per turbat ions were introduced in the analog model and the theore t ica l
r e sponses were recorded . These responses served la ter as a guide
for set t ings of amplification of the signals from the t r a n s d u c e r s during
the r eac to r exper iments . Immediately after the experiment a compar
ison between theore t ica l and exper imenta l r e sponses was made . Any
difference between actual and expected behaviour had to be checked by
another m e a s u r e m e n t .
Pe r tu rba t ions were introduced in react ivi ty and s team load by
means of the fine control rod FCR I and the turbine admiss ion valve,
respec t ive ly . Both periodic and aperiodic per turbat ions were in t ro
duced in react ivi ty , while only aperiodic per turbat ions were i n t ro
duced in load.
The periodic per turbat ions cover a frequency range of 0.002 - 0 .3
Hz. To reduce al iasing e r r o r s for the signals that were to be frequency-
analysed, the sampling frequency was chosen well above double (nor
mally 8 t imes) the b reak frequency of the f i l ter .
Per tu rba t ion and response signals were recorded on an eight-
channel pen r e c o r d e r and on paper tape via an eight channel mul t i
plexer and an A/D conver te r . The pen recordings provided means for
adjusting the gain of the measur ing equipment and for supervis ing the
p r o c e s s .

- 10 -
The reac tor condition before and after the aperiodic per turbat ions
and during the per iodic per turbat ions was read from the plant ins t ru
mentat ion. The initial power level in the step per turbat ion experiments
was 54 - 58 M ¥ except for the positive load per turbat ions where the
level was 44 - 45 MW. The mean power level during the react ivi ty
osci l lator exper iment was 57. 3 MW.
The digital recording of the experimental step responses was visu
alized by means of a plot ter on a d iagram (see example in F ig . 6) for
a d i rect comparison with the theoret ical r e sponses . A frequency anal
ys is of the responses was performed on a PACE analog computer .
The digital recording of the experimental per iodic responses were
frequency-analysed on a digital computer . The digital p r o g r a m s
KORSKOHAN [11] and HAVIBIK [12] were used for obtaining frequency
r e sponses . In KORSKOHAN a c ros sco r re l a t i on of input and output
signals is per formed in o rde r to t ry to minimize the influence of noise.
All t ransfe r functions a re given in the form of a ra t io between the
two modulations:
GO) =AJ[M/*AB) (8) y x
The s y m b o l s x and y deno te the p e r t u r b a t i o n (input) and r e s p o n s e
(output) s i g n a l s , r e s p e c t i v e l y .
The c h a r a c t e r i s t i c s of the p e r t u r b a t i o n and s a m p l i n g a r e ident i f ied
by the s y m b o l
Type Ap N At n s n
P
•where
Type = type of p e r t u r b a t i o n
Ap = r e a c t i v i t y in p c m b e t w e e n the b i n a r y l e v e l s
N = n u m b e r of b i t i n t e r v a l s At p e r p e r i o d
At = b i t i n t e r v a l in s e c o n d s
n = n u m b e r of s a m p l e s p e r bi t i n t e r v a l
n = n u m b e r of a n a l y s e d p e r i o d s

- 11 -
4 .2 Cross -checks of the exper iments
The complexity of the ins t rumentat ion and analysis r equ i re s a
careful check of the exper imenta l information.
Before s tar t ing the exper iments the readings of var ious ins t ru
ments were recorded and checked mutually. To this end the power ba l
ance was made from different quantit ies (flow, t e m p e r a t u r e s on the
p r imary side, flow, p r e s s u r e on the secondary side of the heat ex
changer) .
After the per turbat ion this check was repeated for the deviations
of the var iab les from thei r steady s t a t e s . Here , power changes may be
determined by four methods .
i) from the ion chamber direct ly
ii) f rom coolant flow and the t empe ra tu r e drop a c r o s s the
heat exchanger
iii) f rom coolant flow and the inlet and outlet t e m p e r a t u r e of
the heat exchanger
iv) from p r e s s u r e and s team flow on the secondary side of
the heat exchanger
Moreover , separa te thermocouples and f lowmeters of the four
coolant c i rcui t s a r e available so that further mutual checks a r e pos
sible .
Thus the analysis of one experiment in itself offers information
on the quality of the various s ignals . This information is inc reased
when repeat ing the exper iments (at the same reac to r condition). P lo t t
ing the m e a s u r e d deviations of the var iab les from thei r steady s ta tes
as a function of the per turbat ions provides excellent means of checking
the reproducibi l i ty and consistency of the var ious quant i t ies .
Different exper iments may be analysed to provide the same in
formation. For example, the step response of a signal may be F o u r i e r -
analysed and this t ransfe r function can be compared to that obtained
from multifrequency ana lys is . However, this compar ison is not a pure
mutual check as it involves the imperfections of different techniques.

- 12 -
5. RESULTS
In this section the resu l t s of the theore t ica l and exper imental dy
namic investigations will be presented and subjected to various com
pa r i sons . P r i m a r i l y , the comparison between the theore t ica l and ex
per imenta l resu l t s is of in te res t . F u r t h e r m o r e , var ious experiments
per formed at the same reac tor condition as well as var ious measur ing
techniques will be compared.
5. 1 Remarks on the react ivi ty coefficients
The information needed for the dynamic calculations re la tes to the
initial steady state of the r eac to r pr ior to the per turbat ion induced. It
compr i ses basic data on the plant design and operation which a r e well
defined. The only uncertainty of major influence concerns the react ivi ty
coefficients, notably the modera tor t empera tu re coefficient dp/dT
and to a l e s s e r degree the Doppler coefficient dp/dT... The coolant tem
pe ra tu re coefficient is smal l ( -1 . 5 pern/ C) and has no large effect on
the r e s u l t s .
As the theore t ica l determinat ion of dp /dT is associa ted with ^ ' m
rela t ively large uncer ta in t ies , an attempt was made to get more r e l i
able information from the pre l iminary exper iments . Analysing the
steady state before and after a reactivity and load per turbat ion p r o
vided a means of deducing the react ivi ty coefficients dp /d T and
dp /d Tr [ 1 5 ] . In the pre l iminary exper iments the numer ica l values
were found to be - 30 and - 2 . 2 p e m / C, respect ive ly . However, even
lower values can be expected with the uncertaint ies involved. For the
final dynamic experiments less negative values were expected due to
the plutonium build-up, so that in the last calculations - 25 and - 2
p e m / C were employed.
F r o m high-power static exper iments the modera tor t empera tu re
coefficient was found to be - 30 p e m / C [ 17] . The physics calcula
tions gave a value which was more negative, - 34 p e m / C. However,
the general experience is that the applied theore t ica l method always
overes t imates the t empera tu re reactivity effect.
We may a lso mention that the modera tor t empera tu re coefficient
was measured at Agesta at ze ro power [18] and found to be almost
- 40 p e m / C at 210 - 2 1 5 C. As this value includes control rod effects,

- 13 -
it i s not c o m p a r a b l e d i r e c t l y to our h igh p o w e r m e a s u r e m e n t s . How
e v e r , we have h e r e an e x a m p l e of t h e w e l l - k n o w n diff icul ty of e x t r a p
o la t ing f r o m low p o w e r da ta to full p o w e r b e h a v i o u r .
5 . 2 S ta t i c b e h a v i o u r
Any a p e r i o d i c p e r t u r b a t i o n i m p o s e d on the p lan t wi l l c a u s e t r a n
s i e n t s , wh ich wi l l l e v e l off a t a f ina l s t e a d y s t a t e wh ich i s d i f fe ren t
f r o m t h e i n i t i a l . M e a s u r i n g the d e v i a t i o n s of the two s t e a d y s t a t e s for
v a r i o u s p e r t u r b a t i o n s and c o m p a r i n g t h e m wi th t h e c a l c u l a t e d c h a n g e s
p r o v i d e s e x c e l l e n t m e a n s of check ing f i r s t l y the a c c u r a c y and r e p r o
duc ib i l i t y of the e x p e r i m e n t s and s e c o n d l y the s t a t i c p a r t of the m o d e l .
F i g . 3 d i s p l a y s the r e l a t i v e c h a n g e s of p o w e r , s t e a m flow, p r e s
s u r e and the t e m p e r a t u r e d r o p a c r o s s the hea t e x c h a n g e r a s a funct ion
of t h e r e a c t i v i t y p e r t u r b a t i o n . Al l t h e s e v a r i a b l e s shou ld be on t h e
s a m e l ine a s they i n d i c a t e t h e p o w e r c h a n g e . The e x p e r i m e n t s show
good m u t u a l a g r e e m e n t .
In t h e s t e a m load e x p e r i m e n t s t h e t u r b i n e a d m i s s i o n v a l v e c r o s s
s e c t i o n , A , w a s c h a n g e d . S ince t h e s t e a m flow in t h e A g e s t a p lan t i s
p r o p o r t i o n a l t o the p r e s s u r e p and A, it i s conven ien t to conce ive 6 A'
T - ^ T T O +T?> <9>
a s p e r t u r b a t i o n , a s w a s s u g g e s t e d in Ref. [ 15] . The c o r r e c t i o n f a c t o r
1 + —£• a c c o u n t s for t h e n o n - l i n e a r i t y of the s t e a m flow c a l c u l a t i o n .
S t r a i g h t l i ne s t h r o u g h the o r i g i n a r e e x p e c t e d when p lo t t ing the 6 Af
d e v i a t i o n s a s a funct ion of - j — . The e x p e r i m e n t a l r e s u l t s a r e shown
in F i g s . 4 and 5. The r e s u l t s i n d i c a t e tha t the n o n - l i n e a r ef fects in
t h e s y s t e m b e c o m e n o t i c e a b l e , in fact t he c h a n g e s a r e r e m a r k a b l y
l a r g e (to a c h i e v e good a c c u r a c y ) .
The r e s u l t s p r e s e n t e d in F i g s . 3 to 5 wi l l be u t i l i z e d for c o m p a r
i s o n wi th t h e o r y . We s h a l l c o n s i d e r a p e r t u r b a t i o n of r e a c t i v i t y of 6 A*
- 6 8 p c m and a change of the va lue of —— = - 25 %. The d i f fe ren t J\
p a r t s of t h e m o d e l wi l l be c h e c k e d s e p a r a t e l y a s f o l l ows .
As s e e n f r o m F i g . 2 the ou t l e t m o d e r a t o r t e m p e r a t u r e , T , is ° m o
d e t e r m i n e d by n u c l e a r p o w e r , P , and ou t l e t h e a t e x c h a n g e r t e m p e r a t u r e ,
T . When us ing t h e e x p e r i m e n t a l v a l u e s ( c o r r e c t e d by the s t r a i g h t

- 14 -
l ines in F igs . 3 to 5) of P and T a direct check is obtained of the ° ' so
fuel, coolant and modera to r dynamics. In the f i r s t line of Table I (page 15) &T normal ized to the t empera tu re r i se in the core , AT , is given ' mo ; c &
for react ivi ty and load per turbat ion exper iment . Excellent agreement
is seen between theore t ica l and exper imental r e s u l t s .
Calculating the outlet t empera tu re of the heat exchanger, 6T , as s o
a function of measu red outlet modera tor t empera tu re and p r e s s u r e (or
saturat ion t empera tu re ) provides a check of essential ly the dynamics
of the p r i m a r y side of the heat exchanger. The theore t ica l and exper i
mental r e su l t s compare very well , as seen from Table I, second l ine. The re la t ive p r e s s u r e change as calculated from T and A* c & mo
se rves as check of the dynamics of the secondary side of the heat ex
changer, see Table I. The agreement between theory and experiment
is good. A s imi la r check is made for the heat flux from p r i m a r y to
secondary side, 6q. Some discrepancies a re noticed.
Finally, the power change is calculated from the per turbat ion
di rect ly . This is a check of the entire model . Here , too, good a g r e e
ment may be seen for the react ivi ty per turbat ion, whereas some d i s
crepancy a r i s e s for s team load per turba t ions . In the la t te r Xe-poison-
ing was not accounted for, which explains a part of the discrepancy.
Similar r e su l t s were obtained when analysing the exper iments p e r
formed in 1965, see Ref. [ 15J .
We may conclude that the exper iments agree mutually and with
theory fairly well .

- 15 -
T a b l e I C a l c u l a t e d and m e a s u r e d c h a n g e s of v a r i a b l e s a f t e r a
r e a c t i v i t y and l o a d p e r t u r b a t i o n .
S t ep in
V a r i a b l e
5 T
-IT S 2 l p - T .o> C
5T
AT ( T m o , p ) s
^ ( T ,A ) p v m o '
l ^ < P e x r A >
R e a c t i v i t y , - 68 pern
T h e o r e t i c a l
- 20 %
- 15 %
- 3 . 0 %
- 2 . 3 %
- 3 . 4 %
E x p e r i m e n t a l
- 19 %
- . 1 5 %
- 3 . 2 %
- 3 . 3 %
- 3 . 3 %
A d m i s s i o n v a l v e , 5 Af / A = - 0 . 2 5
T h e o r e t i c a l
15 %
31 %
7 . 5 %
- 16 %
- 17 %
E x p e r i m e n t a l
16 %
36 %
7 . 2 %
- 22 %
- 22 %
5 . 3 A p e r i o d i c p e r t u r b a t i o n s
In a f i r s t g r o u p of e x p e r i m e n t s a c o n t r o l r o d w a s d r o p p e d o r p a r
t i a l l y t a k e n out , r e s u l t i n g in r e a c t i v i t y i n s e r t i o n s of - 68 and + 46 p e m ,
r e s p e c t i v e l y . T h e s e v a l u e s w e r e m e a s u r e d wi th a r e a c t i v i t y m e t e r [ 8 ] .
The t i m e n e e d e d for the i n s e r t i o n s w a s 2 to 3 s e c , and we s h a l l c a l l
t h e s e p e r t u r b a t i o n s s t e p s for the s a k e of s i m p l i c i t y .
The r e s p o n s e s of v a r i o u s p lant v a r i a b l e s due to a s t e p of - 68 p e m
a r e d i s p l a y e d in F i g s . 6 and 7. F i g . 6 i s a s a m p l e showing t h e d ig i t a l
p lot ob ta ined f r o m t h e p a p e r t a p e . In the fol lowing, p lo t s of t h i s k ind
wi l l be c o m p a r e d to the t h e o r e t i c a l r e s u l t s on the s a m e f i g u r e . F i g . 7
p r e s e n t s the t h e o r e t i c a l and e x p e r i m e n t a l t r a n s i e n t s for the above m e n
t i oned e x p e r i m e n t .
The c a l c u l a t e d n u c l e a r power i s m o r e p e a k e d t h a n t h e m e a s u r e d ,
but a g r e e s f a i r l y w e l l w i th the l a t t e r . The m o r e p r o n o u n c e d peak ing
m a y be due t o the a s s u m p t i o n of hav ing one m o d e r a t o r c h a n n e l wi th
one def ined coolan t v e l o c i t y . Ac tua l l y t h e ve loc i t y p ro f i l e in the m o d
e r a t o r wi l l not be u n i f o r m and s o m e s m o o t h i n g i s e x p e c t e d .

- 16 -
The calculated p r e s s u r e , p, at the secondary side of the heat ex
changer and the t empe ra tu r e s at modera tor inlet, T , and outlet, s o
T , dec rease in accordance with the exper iments . The mutual a g r e e -mo r °
ment is very sat is factory.
The measu red s team flow seems to dec rease faster than expected
from theory . The mutual agreement seems to be acceptable , however,
when considering the la rge spread of the flow signal.
The r e su l t s presented in Fig. 7 may be looked upon as typical of
negative step per turbat ions in react iv i ty . Similar t rends were found
when repeating the measu remen t with a slightly l a rge r per turbat ion,
and s imi la r r e su l t s were repor ted previously, see Fig. 21 of Ref. [ l 6 ] .
An example of a positive step in react ivi ty (+ 46 pcm) is shown in
Fig. 8. When comparing the theore t ica l resu l t s with the exper imental ,
s imi la r a rguments may be adduced as for negative s teps . Considering
the uncer ta int ies of the exper imental resu l t s the agreement between
theory and experiment is sa t is factory.
When comparing a l inear and non-l inear calculation of the t r a n
sients a discrepancy is seen mainly in the nuclear power. A l inear
calculation yields smal le r power peaks for positive steps and la rger
peaks for negative steps compared to the non-l inear calculation. The
final steady s tates a r e pract ica l ly unaffected. This-non-l inear effect
can be seen from the power peaks of Fig . 7 and 8. If the sys tem were
l inear , the ra t io of the peaks should be equal to the ra t io of the p e r -46
turbat ions , i . e . —TTQ = ~ 0-68. The exper imental ra t io of the power peaks amounts to - 0.77 and their theore t ica l ra t io to - 0 .79 . These
r e su l t s demonst ra te the non-l inear effect and the excellent agreement
between theory and exper iment .
In a second group of exper iments the setting of the turbine a d m i s
sion valve was changed manually. During the t ime when the per turbat ion
is induced (say 8 to 15 sec) the s team flow is a good indication of the
valve a r e a , as p r e s s u r e feedbacks a r e then sti l l negligible. In Fig. 9
a negative load per turbat ion is displayed. The calculated power de
c r e a s e s faster than the exper imenta l . The calculated p r e s s u r e r i s e
follows the exper imenta l quite well . Both calculated t empera tu re changes
a r e l a rge r than the measured . This is not a general s ta tement , since
in other exper iments the opposite was discovered, see Fig. 11 and 12

- 17 -
of Ref. [ 16J. Here the accuracy of the exper imenta l r e su l t s plays an
important ro l e .
Comparing m e a s u r e d and calculated s team load t rans ien t s revea l s
that the theore t ica l feedbacks of p r e s s u r e on s t eam load a r e l a rge r
than those existent in the plant.
To summar i ze a fair agreement between theore t ica l and exper i
mental r esu l t s is found both for the above-mentioned and for previous
exper iments , see Ref. [ l 6 j .
5 .4 Frequency re sponses
The responses to s tep react ivi ty per turbat ions have been f r e
quency-analysed to provide a compar ison with r e su l t s from periodic
pe r tu rba t ions .
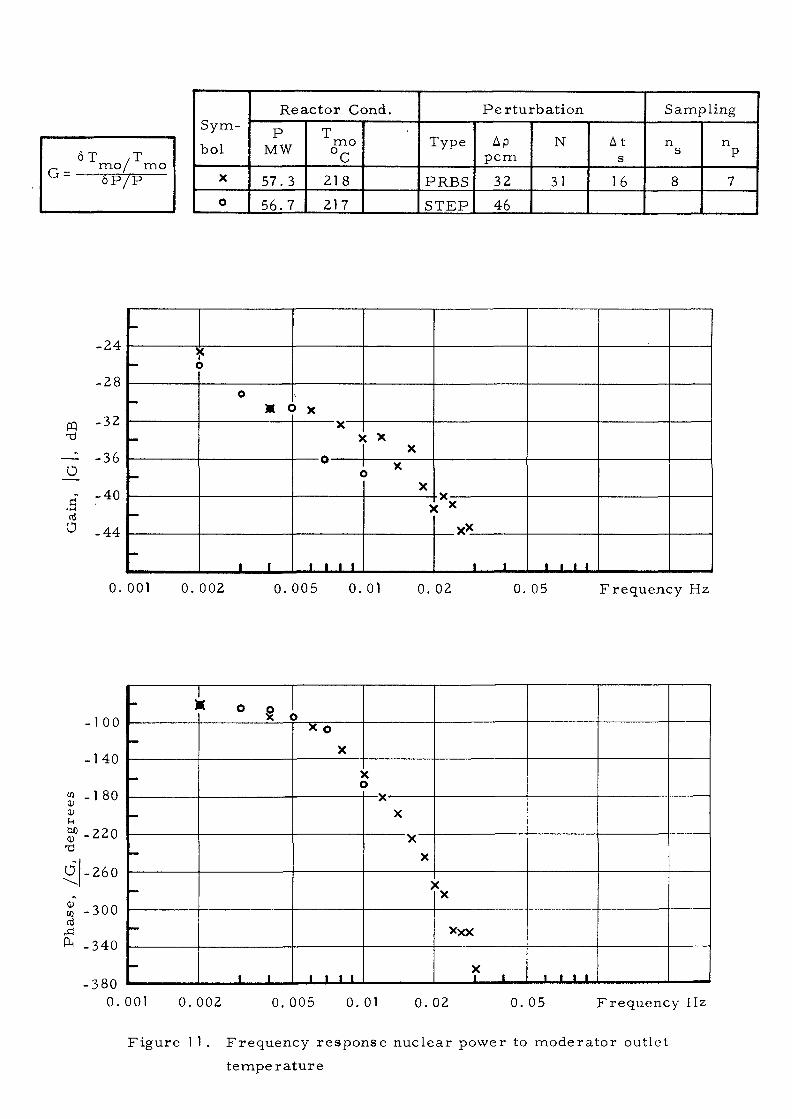
In F i g s . 10 - 14 a r e shown frequency responses obtained from p e r
turbat ions in the form of PRBS, t r apeze and s tep. The frequency r e
sponses shown a r e from react ivi ty to power and from power to m o d e r
ator outlet t e m p e r a t u r e , heat exchanger outlet t e m p e r a t u r e , heat ex
changer p r e s s u r e and s t eam flow.
The frequency responses from step measu remen t s have been ob
tained by means of a PACE analog computer , the t ime functions of in
put and output signals being generated by a curve follower. The grea tes t
difficulty in the frequency analysis on PACE is to decide what degree
of smoothing should be used. A cer ta in degree of smoothing is neces sa ry
in order to draw a curve through sca t te red points . The smoothing causes
a dec rease of the higher f requencies . This is a drawback expecially for
s tep responses where the energy dec r ea se s re la t ively fast with i n c r e a s
ing frequency. In a l l physical p r o c e s s e s the so-ca l led step functions
a r e in rea l i ty l imited r a m p functions, which further reduces "the energy
at high f requencies .
The decreas ing accuracy at high frequencies of the frequency r e
sponse determined from the s tep response makes a separa te high f r e
quency cal ibrat ion of the react ivi ty per turbat ions signal n e c e s s a r y .
This cal ibrat ion has to be per formed by oscillating the per turbat ion
rod at a frequency sufficiently high to make the influence of in ternal
r eac to r feedbacks negligible.

- 18 -
Due to the aperiodici ty of the step signal, l a rge r steps must here
be introduced than in the PRBS measuremen t s for the same de
gree of accuracy . Non-l inear i t ies and plant l imitations can thus have
a negative effect on the m e a s u r e m e n t s . To determine the final steady
state with good accuracy the plant has to remain for a long t ime in an
abnormal condition. This may cause problems of r eac to r feedbacks
with long t ime constants (e. g. Xe).
The influence of sca t ter ing in the signals on the methods of analy
sis is demonstra ted in F igs . 10 - 14. The scat ter ing of the power and
t empe ra tu r e signals is l e ss than that of the p r e s s u r e and flow signals ,
as seen from Fig. 6. For the first cases the agreement between f re
quency responses obtained from PRBS and step is bet ter than for the
la t te r c a s e s . The least degree of agreement is found for the flow s ig
nal that has the highest level of sca t te r ing . The d isagreement between
the two methods of analysis i nc r ea se s with increas ing frequency, and
at frequencies above approximately 0.01 Hz the resu l t s from the
Four i e r analysis of the step responses a r e not sa t is factory.
The PRBS method has been found to be the bes t of the investigated
methods of obtaining frequency responses in the Agesta r eac to r . Fo r the
react ivi ty per turbat ion measurement s no separa te cal ibrat ion of input
react ivi ty is neces sa ry , as the gain of the frequency response can be
normal ized to the zero power t ransfer function at high frequency. Meas
urements at low frequency can be normal ized by means of overlapping
frequency ranges . F ig . 10 shows that there is good overlap for the three
frequency ranges used in the m e a s u r e m e n t s .
Resul ts from t rapeze per turbat ions have a lso been plotted in Fig .
10 and they agree well with the r e su l t s obtained by means of other
per turbat ion s ignals .
6. CONCLUSIONS
The exper iments comprise step responses and t ransfe r functions
measu red by per turbat ions in react ivi ty and s team load.
The step technique is found to be excellent for a stat ic check of
the consistency of the measuremen t and of the agreement between ex
per iment and theory. It a lso provides a good overal l picture of the a c
tual dynamic behaviour.

- 19 -
Three methods were used for t r ans fe r function measu remen t s : step
functions, t rapeze waves and multifrequency functions based upon the
pseudo- random binary sequence (PRBS). A frequency analysis of the step
r e sponses does not give sat isfactory resu l t s for frequencies above approx
imately 0. 01 Hz. This is a disadvantage, as a react ivi ty cal ibrat ion must
be performed at a frequency above 0. 01 Hz to make the influence of internal
r eac to r feedbacks negligible. Non- l inear i t ies and reac tor feedbacks with
long t ime constants may have a negative effect on the step m e a s u r e m e n t s .
The n e c e s s a r y smoothing of sca t t e red points in the analog frequency
analysis dec reases the accuracy of the r e s u l t s .
Trapeze waves provide good accuracy in the frequency ana lys is , but
the m e a s u r e m e n t s a r e t ime consuming, and the re might be some change
in r eac to r condition between measu remen t s at different frequencies.
The PRBS method has proved to be an accura te and prac t ica l method
for obtaining exper imenta l t r ans fe r functions over the frequency range
of main in teres t . Small per turbat ions can be applied which reduces the
influence of non- l inea r i t i e s . A c ros sco r r e l a t i on method in the analysis
is aimed at minimizing the influence of noise .
Frequency analysis of m e a s u r e m e n t s with different per turbat ion me th
ods shows consistent r e su l t s for the Agesta m e a s u r e m e n t s .
F r o m the s ta t ic check of the model we may conclude that the expe r i
ments agree fairly well mutually and with theory. The measured react ivi ty
coefficients tend to be sma l l e r than the predicted ones.
The predicted t rans ien ts compare well with the measured ones. How
ever , the re is a tendency to m o r e peaked power t r ans ien t s from the model.
This is believed to be due to the assumption that the modera to r could be
regarded as one channel. _ o
The dynamic exper iments car r ied out at the Agesta nuclear power
station demons t ra te both the inherent stability and the safety of this plant.
- 20 -
7. ACKNOWLEDGEMENTS
The authors a r e grateful for the generous support from the staff of O
the Agesta Power Station who made these measu remen t s possible. The
a s s i s t ance of Mr. S. Berglund in the design and building of electronic
equipment for the exper iments and of Mr. G. Olsson in the prepara t ions
and performance of the exper iments and in the data process ing of the r e
sults is gratefully acknowledged. Thanks a re due also to the PACE com
puter group under the supervis ion of Mr. N. Schuch for ass i s tance in the
analog computat ions.
The authors wish to acknowledge the valuable cooperation during the
p re l iminary experiments with M e s s r s . P . E. Blomberg, O. Nylund and K.
Stenback in the planning, performance and analysis of the measu remen t s
and with Mr. R. Josefs son in the analog computations.

- 21 -
REFERENCES
THE AGESTA NUCLEAR POWER STATION, A staff repor t by AB Atomenergi , Ed. by B. McHugh, Stockholm 1964.
SPANNE T and WIESEL R, i960, AB Atomenergi , Sweden, (Internal r epor t R3-172a, b, c).
BLISELIUS P - A et al, 1965, AB Atomenergi , Sweden (Internal repor t RFT-128 , R3-365).
APEJLQVIST G et al, Phys ics exper iments at the Agesta power station. 1966. (AE-244).
BALCOMBJ D, DEMUTH H B and GYFTOPOULOS E P , A c ro s sco r r e l a t i on method for measur ing the impulse r e sponse of r eac to r sys tems , Nucl. Sci. Eng. 11(1961) p. 159.
CORRAN E R and CUMMINS J D, Binary codes with impulse autocorre la t ion functions for dynamic exper iments . 1962. (AEEW-R 210).
BLISELIUS P -A , 1965. AB Atomenergi , Sweden. (Internal repor t TPM-RFT-141)
BERGLUND S and BLISELIUS P-A, 1964. AB Atomenergi , Sweden. (Internal repor t RFT-102, R3-357. )
BJORKMAN J, A smal l ve r sa t i l e data collecting sys tem for exper imental r eac to r physics . Automatic acquisi t ion and reduction of nuclear data. P r o c . conf. Kar l s ruhe , July 13-16, 1964. Ed. by K H Beckur ts , W Glaser and G Krliger. Gesellschaft fur Kernforschung m. b. H. Kar l s ruhe 1964.
SCHUCH N, 1965. AB Atomenergi , Sweden. (Internal r epor t RTR-137)
BLISELIUS P - A and TOLLANDER B, 1965. AB Atomenergi , Sweden. (Internal repor t RFN-199, RFT-132)

- 22 -
12. BLISELIUS P - A and PEKAREK H, 1964. AB Atomenergi , Sweden. (Internal repor t TPM-RFX-334)
13. VOLLMER H, 1965. AB Atomenergi, Sweden. (Internal repor t RTR-161, R3-372)
14. VOLLMER H and JOSEFSSON R, 1966. AB Atomenergi , Sweden. (Internal repor t RTR-188, R3-374)
15. VOLLMER H, 1966. AB Atomenergi , Sweden. (Internal repor t RTR-195, R3-376)
16. VOLLMER H and JOSEFSSON R, 1966. AB Atomenergi , Sweden. (Internal repor t RTR-230, R3-379)
1 7- APELQVIST G and BLOMBERG P E, Reactivity measu remen t s in Swedish power r e a c t o r s . IAEA panel on Reactivity me a s u re me n t s , Vienna, 9-13 Dec. 1968. (PL-322/8)
18. BERNANDER G, o
Measurements of the reactivity proper t ies of the Agesta nuclear power reac tor at zero power. 1967. (AE-289)

- 23 -
LIST OF FIGURES
Fig . 1 Simplified flow diagram of the Agesta power r e a c t o r .
F ig . 2 Schematic block d iagram of the Agesta power r e a c t o r .
F ig . 3 Measured changes of nuclear power, s t eam flow, t e m p e r a
tu re difference a c r o s s heat exchanger and p r e s s u r e on the
secondary side of the heat exchanger for react ivi ty p e r t u r
bat ions.
F ig . 4 Measured changes of nuclear power and p r e s s u r e on the
secondary side of the heat exchanger for s team load p e r t u r
bations .
F ig . 5 Measured changes of modera tor outlet t empe ra tu r e and heat
exchanger outlet t empe ra tu r e for s t eam load per tu rba t ions .
F ig . 6 Measured points from a step in react iv i ty .
F ig . 7 Measured and calculated r e sponses to a step in react iv i ty
of - 68 pcm.
Fig . 8 Measured and calculated r e sponses to a step in react ivi ty of
+ 46 pcm.
Fig . 9 Measured and calculated responses to a s tep in turbine
admiss ion valve sett ing.
F ig . 10 Frequency response react ivi ty to nuclear power.
F ig . 11 Frequency response nuclear power to modera tor outlet t e m
p e r a t u r e .
F ig . 12 Frequency response nuclear power to heat exchanger outlet
t e m p e r a t u r e .
F ig . 13 Frequency response nuclear power to heat exchanger s t eam
p r e s s u r e .
Fig . 14 Frequency response nuclear power to total s t eam flow.

- 24 -
P
Ap
9 (T) xxv '
n f o
G(ju>)
h
N
n P
n s
P
P R B S
P
q
T
T c
T mo
T so
* T s
At
LIST OF SYMBOLS
net react ivi ty in pcm, where 1 pcm = 10 Ak/k
react ivi ty in pcm between the binary levels of per turbat ions
autocorrela t ion function
t ime delay pa rame te r
turbine admiss ion valve c ro s s section
modified turbine admiss ion valve c ro s s sect ion according
to Eq. (9)
the amplitude of n harmonic
fundamental frequency
t ransfe r function
specific enthalpy
number of bit in tervals per period
number of analysed per iods
number of samples per bit in terval
nuclear power
Pseudo-Random Binary Sequence
s team p r e s s u r e (secondary side of heat exchanger)
heat flux
period of PRBS
t empera tu re of coolant flow
D~0 t empe ra tu r e before heat exchanger
D_0 t empe ra tu r e after heat exchanger
t empera tu re difference a c r o s s p r imary side of the heat
exchanger
bit in terval of PRBS
velocity

- 25 -
W, w m a s s flow ra te from heat exchanger of water and s team,
respect ive ly
w total s t eam flow from heat exchangers so °
x (t) input or per turbat ion signal
y (t) output or response signal
z position of fine control rod


H2> PRESSURISER
CONTROL ROD DRIVE £
COOLING TOWER
• -
•
REACTOR PRESSURE VESSEL —
STEAM
CIRCUITS FROM THE. THREE OTHER HEAT EXCHANGERS
^ , la? 2. - ^ — T -
HEAT EXCHANGER
MAIN PUMP
Qoja
FUEL' ASSEMBLY
i Y rt 'so'
FOUR PARALLEL MAIN CIRCUITS ( q . c . e g n c t g )
> INDICATES POINTS IN THE REACTOR SYSTEM, WHERE PERTURBATIONS WERE INTRODUCED.
TURBINE REGULATOR
MAIN CONDENSER
Q TURBOGENERATOR
„ H , 0 STEAM
H20
HSh
e DUMPA ACOND. • " • - > / 4 — " •
H , 0
COOLERS
— F ^ q —
€>• H 2 0
FEEDWATER TANK DISTRICT HEATING
PLANT
Figure 1 . Simplified flow diagram of the Agesta nuclear power station

ext Neutron
Kinetics
, .1 M
6P Fuel
Dynamics
5q
|6v
1 e
Coolant
Dynamics
6v m
<ST„ ST
coModerator
Dynamics
<5T
<5T mo
6T m
Notation: P Nuclear Power p Pressure q Heat Flux T Temperature v Velocity W,w Mass Flow of Water, Steam p Reactivity h Specific Enthalpy 'v Weighted with respect to
reactivity
Subscripts:
Dynamics of Elements between Moderator and Heat Exchanger
6v
6T siDynamics of
Heat Exchanger Primary Side
«q.
c coolant ext externa] f fw i m o s heat exchanger sat saturation
6T so
Dynamics of Elements between Heat Exchanger and Coolant
6T ci
Dynamics of Heat Exchangei Secondary Side
5T sat fuel
feed water inlet of a region moderator outlet of a region
6W fw
6h fw
6w so
<5p
Figure 2. Schematic Block Diagram for the Agesta Nuclear Power Station

, „ 6w 6T - 6 T A
oP so rao so op P ' w
so A T
A %
- 4
- 3
6P X - p
6w
o -$ so
so 6T - 6T mo so
A T
a »p
re la t ive power change
reLative s team fLow change
re la t ive t empera tu re difference change
re la t ive p r e s s u r e change
pcm
L-4
Figure 3. Measured changes of nuclear power, s t eam flow, t empera tu re
difference ac ros s heat exchanger and p r e s s u r e on the secondary
side of heat exchanger for react ivi ty per turbat ions

p
%
A -A P
%
- 40
- 30
10-
- 5 -
- 1 0
6 P X -^ ( r e l a t i v e p o w e r change)
• - i - ( r e l a t i v e p r e s s u r e change)
F i g u r e 4 . M e a s u r e d c h a n g e s of n u c l e a r p o w e r and p r e s s u r e on the s e c o n d a r y
s ide of h e a t e x c h a n g e r for s t e a m load p e r t u r b a t i o n s

6 T 6 T mo so
Figure 5. Measured changes of modera tor outLet t empera tu re and heat
exchanger outlet t empera tu re for s t eam Load per turbat ions

400 *i
300
200
100
MMJi«Ili^^ 100 150 200 250 300
F i g u r e 6. M e a s u r e d po in t s f r o m a s t e p in r e a c t i v i t y

Units
-~*8*-8 300
200
1 00
P o i n t s denote m e a s u r e d r e s u l t s . C u r v e s denote c a l c u l a t e d r e s u l t s ,
,-w^i
X
V
D
O
•
P T
mo T so
P w so
Initial value
57. 0 MW
221 °C
2 I ! ° C 17.9 bar 88.6 t /h
Quantity Scale factor
5.76 MW/100 units
0 .640°C/100 units
0 .642°C/100 units
0.256 ba r /100 units
1.025 t /h /100 units
0 100 200
F i g u r e 7 . M e a s u r e d and c a l c u l a t e d r e s p o n s e s to a s t ep in r e a c t i v i t y of - 6 8 p c m
300 T i m e , s e c o n d s

Units
A
P o i n t s denote m e a s u r e d r e s u l t s . C u r v e s ' denote c a l c u l a t e d r e s u l t s .
Symbol
X
V
a o
•
P T m o T so
P w so
In i t ia l va lue
56 .7 MW
Z17°C 207UC
16. 1 b a r
85 t / h
Quantity-
Sca le f a c t o r
2 . 9 6 MW/1 00 un i t s
0. 6 4 0 ° C / 1 0 0 un i t s 0. 6 4 2 ° C / 1 0 0 un i t s
0 .256 b a r / 1 0 0 un i t s
1 . 0 2 5 t / h / 1 0 0 un i t s
0 x — ff-sr*
T m o
w so
• ' • _ v r • ^—v—-«v i . — — — • •
-V—'4J-
• so
<P o° * ° °
x x x
100
• V
D a
X X X x
200 300 T i m e , s e c o n d s
F i g u r e 8. M e a s u r e d and c a l c u l a t e d r e s p o n s e s to a s t e p in r e a c t i v i t y of +46 p c m

Units
4
300
200
1 00
Points denote measured r e su l t s . Curves denote calculated r e su l t s .
, U „ 1
X
V
a o •
P T mo T so P w
so
Initial value
56.9 MW
220°C
210°C 17.5 bar
88.4 t /h
Quantity
Scale factor
5.92 MW/100 units
0 .640°C/100 units
1 . 61°C/100 units 0. 51 3 ba r /1 00 units
1 0.25 t /h /100 units
° o o o o o o
0 100 200 Figure 9. Measured and calculated responses to a step in turbine admission valve setting
300 Time, seconds

S y m
bol
X
o
V
T
•
R e a c t o r Cond.
P
MW
5 7 . 3
5 7 . 3
5 7 . 3
5 7 . 3
56 .7
T m o °C
218
218
218
218
217
P e r t u r b a t i o n
Type
P R B S
P R B S
P R B S
T R A P
S T E P
AP p c m
32
32
32
16*40
46
N
31
31
31
2
At s
16
4. 8
1.6
1 . 6*70
Sampl ing
n s
8
8
8
6 * 8
n P
7
5
17
(-*• p a r a m e t e r r ange )
12
10
8
6
4
2
-
-
-
i
-
< *
•
1
i '
«r« 0* X
» x 1
J i l l
t • •
-. o X
f ' x x x
X O
£ O T
' <
°yo 0
. i n ! V ^ T ^ 0.001 0 .002 0 .005 0.01 0 .02 0 . 0 5 0.1 0 . 2 0 .3
F r e q u e n c y Hz
60
40
20
•20
•40
X
t - i
-
-
-
-
-
-
-
-
»
•
*
«
1 1
' X
<*x •
:
«
i i i i
' * T X
• X X
* * (
x T < * * x ; x o
o o V
1 l
o ^ o ^
I I I !
r v v v 7 v *
! i
!
v *
0.001 0 .002 0 .005 0.01 0 .02 0 . 0 5 0.1 0 .2 0.3
F r e q u e n c y Hz
F i g u r e 10. F r e q u e n c y r e s p o n s e r e a c t i v i t y to n u c l e a r p o w e r
G 6T /T m o / m o
5"P/P
S y m
bol
X
o
R e a c t o r Cond.
P MW
5 7 . 3
56 .7
T m o °C
218
217
P e r t u r b a t i o n
Type
P R B S
S T E P
Ap p c m
32
46
N
31
At s
16
Sampl ing
n s
8
n P
7
-a
Cs_
Gai
n,
- 2 4
- 2 8
-32
-36
-40
- 4 4
-
J
- <
-
-
-
-
-
< >
o X C
1 1 ,..
> X
<
t i l l
X
> x
X
> vX
' ' 1 1 1 1
0 .001 0 .002 0 . 0 0 5 0.01 0. 02 0. 05 F r e q u e n c y Hz
- 1 0 0
-140
? -180
2 ? - 2 2 0
O -260
S -300
k -340
-380
3
-
-
-
-
-
-
-
< o o X <
1 1 .,
i X 0
X
: (
i i i i
< >
X X
X X
) < X
XXX
X 1 1 I I
0.001 0 .002 0 .005 0.01 0. 02 0. 05 F r e q u e n c y IIz
F i g u r e 1 1 . F r e q u e n c y r e s p o n s e n u c l e a r p o w e r to m o d e r a t o r ou t le t
t e m p e r a t u r e

S y m
bol
X
o
R e a c t o r Cond.
P
MW
5 7 . 3
56 .7
T m o °C 218
217
P
b a r
208
207
P e r t u r b a t i o n
Type
P R B S
S T E P
Ap p c m
32
46
N
31
At s
16
Sampl ing
n s
8
n P
7
O
O
-26
-30
- 3 4
- 3 8
-42
-46
-50
- 5 4
-58
> _
c -
-
-
-
-
-
-
< >
o X
t
1 1
X >
X >
<
o
I.I I I
X
: x X
>
X
< X
X
V
x , , 1 f 1 1
0.001 0 .002 0 .005 0.01 0. 02 0. 05 F r e q u e n c y Hz
Q O u CO
6
a) nJ
A OH
100
• 140
•180
• 220
• 260
-300
-340
-380
-420
*
-
-
—
—
—
—
—
o X
• •
* o x c >
I 1 I I
)
: x X
X
X
> <
X
X
X X
X
1 1 1 1 I I 0.001 0 .002 0 .005 0.01 0. 02 0. 05 F r e q u e n c y Hz
F i g u r e 12. F r e q u e n c y r e s p o n s e n u c l e a r p o w e r to h e a t e x c h a n g e r ou t le t
t e m p e r a t u r e

S y m
bol
X
o
R e a c t o r Cond.
P
MW
5 7 . 3
5 6 . 7
T m o °C
218
217
P
b a r
16. 5
16.1
P e r t u r b a t i o n
Type
P R B S
S T E P
Ap p c m
32
46
N
31
At s
16
S a m p l i n g
n s
8
n P
7
16
-20
P3 T3
0
Gai
n,
- 2 4
- 2 8
-32
- 3 6
- 4 0
- 4 4
<
-
-
-
-
-
3
t °
o <
X
« 1
>
X
o *
1 I I I
t x x X X
3
X
( X
X
1 1 1 1 1 1..,
0 .001 0 .002 0 .005 0 .01 0 . 0 2 0. 05 F r e q u e n c y Hz
CO <u CD u OX)
6
CD CO
ti
OH
- 6 0
-100
- 1 4 0
- 1 8 0
-220
-260
- 3 0 0
-340
-380
O —
X
-
-
-
-
-
-
-
-
° 9 <
1 1 .
< >
* x '
o
1 1 1 1
> c
X X
X *
> (
X
X
X
X
• ' 1 1 1 1
0.001 0 .002 0 . 0 0 5 0.01 0 .02 0 .05 F r e q u e n c y Hz
F i g u r e 13 . F r e q u e n c y r e s p o n s e n u c l e a r p o w e r to h e a t e x c h a n g e r
s t e a m p r e s s u r e

S y m
bol
X
o
R e a c t o r Cond.
P
MW
5 7 . 3
5 6 . 7
T m o °C 218
217
w so
t / h
86
85
P e r t u r b a t i o n
Type
P R B S
S T E P
Ap p c m
32
46
N
31
At s
16
Sampl ing
n s
8
n P
7
a
o
-12
-16
-20
- 2 4
- 2 8
-32
-36
-40
- 4 4
X
-<
-
-
-
-
-
—
-
>
X
o
o <
• »
X
X o >
<
M M
1* V
**x j * v
<.
X
A
X ' 1 1 1 1 1
0.001 0 .002 0 .005 0.01 0 .02 0 .05 F r e q u e n c y Hz
- 6 0
•1 00
S -140
$ -180
O -220
m -260
^ -300
-340
f 1 0 « « c
-
-
-
—
—
—
x
• '
> o c
X X
i l l !
)
* X A X
X
X 3 <
X
X *x
X
1 » 1 1 1 1
0.001 0 .002 0 .005 0 .01 0 .02 0. 05 F r e q u e n c y Hz
F i g u r e 14. F r e q u e n c y r e s p o n s e n u c l e a r p o w e r to to ta l s t e a m flow

LIST OF PUBLISHED AE-REPORTS
1-300. (See the back cover earlier reports.)
301. The present status of the half-life measuring equipment and technique at Studsvik. By S. G. Malmskog. 1967. 26 p. Sw. cr. 10: - .
302. Determination of oxygen In aluminum by means of 14 MeV neutrons with an account of flux attenuation in the sample. By D. Bruno and K. Jirlow. 1967. 16 p. Sw. cr. 10:- .
303. Neutron elastic scattering cross sections of the elements N l , Co, and Cu between 1.5 and 8.0 mev. By B. Holmqvist and T. Wiedling. 1967. 17 p. Sw. cr. 10: - .
304. A study of the energy dependence of the Th232 capture cross section in the energy region O.I to 3.4 eV. By G. Lundgren. 1967. 25 p. Sw. cr. 10:- .
305. Studies of the reactivity effect of polythene In the fast reactor FRO. By L. I. Tiren and R. Hakansson. 1967. 25 p. Sw. cr. 10: - .
306. Final report on IFA-10, the first Swedish instrumented fuel assembly Irradiated in HBWR, Norway. By J-A. Gyllander. 1967. 35 p. Sw. cr. 10: - .
307. Solution of large systems of linear equations with quadratic or non-quadratic matrices and deconvolution of spectra. By K. Nygaard. 1967. 15 p. Sw. cr. 10: - .
308. Irradiation of superheater test fuel elements in the steam loop of the R2 reactor. By F. Ravndal. 1967. 94 p. Sw. cr. 10: - .
309. Measurement of the decay of thermal neutrons in water poisoned with the non-1/v neutron absorber cadmium. By. L. G. Larsson and E. Moller. 1967. 20 p. Sw. cr. 10:- .
310. Calculated absolute detection efficiencies of cylindrical Nal fTI) scintillation crystals for aqueous spherical sources. By. O. Strindehag and B. Tollander. 1968. 18 p. Sw. cr. 10: - .
311. Spectroscopic study of recombination in the early afterglow of a helium plasma. By J. Stevefelt. 1968. 49 p. Sw. cr. 10: - .
312. Report on the personnel dosimetry at AB Atomenergi during 1966. By J. Carlsson and T. Wahlberg. 1968. 10 p. Sw. cr. 10: - .
313. The electron temperature of a partially ionized gas in an electric field. By F. Robben. 1968. 16 p. Sw. cr. 10:- .
314. Activation Doppler measurements on U238 and U235 in some fast reactor spectra. By L. I . Tiren and I. Gustafsson. 1968. 40 p. Sw. cr. 10: - .
315. Transient temperature distribution in a reactor core with cylindrical fuel rods and compressible coolant. By H. Vollmer. 1968. 38 p. Sw. cr. 10: - .
316. Linear dynamics model for steam cooled fast cower reactors. By H. Vollmer. 1968. 40 p. Sw. cr. 10: - .
317. A low level radioactivity monitor for aqueous waste. By E. J . M. Quirk. 1968. 35 p. Sw. cr. 10: - .
318. A study of the temperature distribution in U O J reactor fuel elements. By I. Devoid. 1968. 82 p. Sw. cr. 10: - .
319. An on-line water monitor for low level ^-radioactivity measurements. By E. J. M. Quirk. 1968. 26 p. Sw. cr. 10: - .
320. Special cryostats for lithium compensated germanium detectors. By A. Lauber, B. Malmsten and B. Rosencrantz. 1968. 14 p. Sw. cr. 10: - .
321. Stability of a steam cooled fast power reactor, its transients due to moderate perturbations and accidents. By H. Vollmer. 1968. 36 p. Sw. cr. 10: - .
322. Progress report 1967. Nuclear chemistry. 1968. 30 p. Sw. cr. 10: - . 323. Noise in the measurement of light with photomultiptiers. By F. Robben.
1968. 74 p. Sw. cr. 10: - . 324. Theoretical investigation of an electrogasdynamic generator. By S. Palm-
gren. 1968. 36 p. Sw. cr. 10:- . 325. Some comparisons of measured and predicted primary radiation levels in
the Agesta power plant. By E. Aalto, R Sandlin and A. Krell. 1968. 44 p. Sw. cr. 10:- .
326. An investigation of an irradiated fuel pin by measurement of the production of fast neutrons in a thermal column and by pile oscillation technique. By Veine Gustavsson. 1968. 24 p. Sw. cr. 10:- .
327. Phytoplankton from TvSren, a bay of the Baltic, 1961-1963. By TorbJSm Willen. 1968. 76 p. Sw. 10:- .
328. Electronic contributions to the phonon damping In metals. By Rune Jonson. 1968. 38 p. Sw. cr. 10: - .
329. Calculation of resonance interaction effects using a rational approximation to the symmetric resonance line shape function. By H. Haggblom. 1968. 48 p. Sw. cr- 10:- .
330. Studies of the effect of heavy water in the fast reactor FRO. By L. I. Tiren, R. Hakansson and B. Karmhag. 1968. 26 p. Sw. cr. 10: - .
331. A comparison of theoretical and experimental values of the activation Doppler effect in some fast reactor spectra. By H. Haggblom and L. I. Tiren. 1968. 28 p. Sw. cr. 10: - .
332. Aspects of low temperature irradiation in neutron activation analysis. By D. Brune. 1968. 12 p. Sw. cr. 10: - .
333. Application of a betatron in photonuclear activation analysis. By D. Brune. S. Mattsson and K. Llden. 1968. 13 p. Sw. cr. 10: - .
334. Computation of resonance-screened cross section by the Dorix-Speng system. By H. Haggblom. 1968. 34 p. Sw. cr. 10:- .
335. Solution of large systems of linear equations in the presence of errors. A constructive criticism of the least squares method. By K. Nygaard. 1968. 28 p. Sw. cr. 10: - .
336. Calculation of void volume fraction in the subcooled and quality boiling regions. By S. Z. Rouhani and E. Axelsson. 1968. 26 p. Sw. cr. 10:- .
337. Neutron elastic scattering cross sections of iron and zinc in the energy region 2.5 to 8.1 MeV. By B. Holmqvist, S. G. Johansson, A. Kiss, G. Lo-din and T. Wiedling. 1968. 30 p. Sw. cr. 10: - .
338. Calibration experiments with a DISA hot-wire anemometer. By B. Kjell-strom and S. Hedberg. 1968. 112 p. Sw. cr. 10: - .
339. Silicon diode dosimeter for fast neutrons. By L. Svansson, P. Swedberg, C-O. Widell and M. Wik. 1968. 42 p. Sw. cr. 10: - .
340. Phase diagrams of some sodium and potassium salts in light and heavy water. By K. E. Holmberg. 1968 48 p. Sw. cr. 10:- .
341. Nonlinear dynamic model of power plants with single-phase coolant reactors. By H. Vollmer. 1968. 26 p. Sw. cr. 10:- .
342. Report on the personnel dosimetry at AB Atomenergi during 1967. By J. Carisson and T. Wahlberg. 1968. 10 p. Sw. cr. 10: - .
343. Friction factors in rough rod bundles estimated from experiments In partially rough annuli - effects of dissimilarities in the shear stress and turbulence distributions. By B. Kjellstrom. 1968. 22 p. Sw. cr. 10:- .
344. A study of the resonance interaction effect between " ' U and u 'Pu in the lower energy region. By H. Haggblom. 1968. 48 p. Sw. cr. 10:- .
345. Application of the microwave discharge modification of the Wilzbach technique for the tritium labelling of some organics of biological interest. By T. Gosztonyi. 1968. 12 p. Sw. cr. 10: - .
346. A comparison between effective cross section calculations using the intermediate resonance approximation and more exact methods. By H. HSggblom. 1969. 64 p. Sw. cr. 10:- .
347. A parameter study of large fast reactor nuclear explosion accidents. By J . R. Wiesel. 1969. 34 p. Sw. cr. 10:- .
348. Computer program for inelastic neutron scattering by an anharmonic crystal. By L. Bohlin, I. Ebbsjo and T. Hogberg. 1969. 52 p. Sw. cr. 10: - .
349. On low energy levels in 1 MW. By S . G. Malmskog, M. HSJeberg and V. Berg. 1969. 18 p. Sw. cr. 10:- .
350. Formation of negative metal ions in a field-free plasma. By E. Larsson. 1969. 32 p. Sw. cr. 10:- .
351. A determination of the 2 200 m/s absorption cross section and resonance integral of arsenic by pile oscillator technique. By E. K. Sokotowski and R. Bladh. 1969. 14 p. Sw. cr. 10:- .
352. The decay of " 'Os . By S. G. Malmskog and A. Backlin. 1969. 24 p. Sw. cr. 10: - .
353. Diffusion from a ground level point source experiment with thermolumine-scence dosimeters and Kr 85 as tracer substance. By Ch. Gyllander, S. Hollman and U. Widemo. 1969. 23 p. Sw. cr. 10:- .
354. Progress report, FFN, October 1, 1967 - September 30, 1968. By T. Wiedling. 1969. 35 p. Sw. cr. 10:- .
355. Thermodynamic analysis of a supercritical mercury power cycle. By A. S. Roberts, Jr., 1969. 25 p. Sw. cr. 10:- .
356. On the theory of compensation in lithium drifted semiconductor detectors. By A. Lauber. 1969. 45 p. Sw. cr. 10:- .
357. Half-life measurements of levels in "As. By M. Hojeberg and S. G. Malmskog. 1969. 14 p. Sw. cr. 10:- .
358. A non-linear digital computer model requiring short computation time for studies concerning the hydrodynamics of the BWR. By F. Reisch and G. Vayssier. 1969. 36 p. Sw. cr. 10: - .
359. Vanadium beta emission detectors for reactor in-core neutron monitoring. I. D. Andersson and B. Sijderlund. 1969. 26 p. Sw. cr. 10: - .
360. Progress report 1968 nuclear chemistry. 1969. 38 p. Sw. cr. 10 : - . 361. A half-life measurement of the 343.4 keV level in "«Lu. By M. HSjeberg
and S. G. Malmskog. 1969. 10 p. Sw. cr. 10: - . 362. The application of thermoluminescence dosimeters to studies of released
activity distributions. By B-l. Ruden. 1969. 36 p. Sw. cr. 10: - . 363. Transition rates in l61Dy. By V. Berg and S. G. Malmskog. 1969. 32 p.
Sw. cr. 10: - . 364. Control rod reactivity measurements in the Agesta reactor with the pulsed
neutron method. By K. Bjoreus. 1969. 44 p. Sw. cr. 10:—. 365. On phonons in simple metals I I . Calculated dispersion curves in aluminium.
By R. Johnson and A. Westin. 1969. 124 p. Sw. cr. 10:- . 366. Neutron elastic scattering cross sections. Experimental data and optical
model cross section calculations. A compilation of neutron data from the Studsvik neutron physics laboratory. By B. Holmqvist and T. Wiedling. 1969. 212 p. Sw. cr. 10:-.
367. Gamma radiation from fission fragments. Experimental apparatus — mass spectrum resolution. By J. Higbie. 1969. 50 p. Sw. cr. 10:—.
368. Scandinavian radiation chemistry meeting Studsvik and Stockholm, September 17-19, 1969. By H. Christensen. 1969. 34 p. Sw. cr. 10: - .
369. Report on the personnel dosimetry at AB Atomenergi during 1968. By J. Carlsson and T. Wahlberg. 1969. 10 p. Sw. cr 10:- .
370. Absolute transition rates in "Mr. By S. G. Malmskog and V. Berg. 1969. 16 p. Sw. cr. 10:- .
371. Transition probabilities in the 1/2+(631) Band in " 5 U . By M. Hojeberg and S. G. Malmskog. 1969. 18 p. Sw. cr. 10:- .
372. E2 and M1 transition probabilities in odd mass Hg nuclei. By V. Berg, A. Backlin, B. Fogelberg and S. G. Malmskog. 1969. 19 p. Sw. cr. 10: - .
373. An experimental study of the accuracy of compensation in lithium drifted germanium detectors. By A. Lauber and B. Malmsten. 1969. 25 p. Sw. cr. 10:- .
374. Gamma radiation from fission fragments. By J . Higbie. 1969. 22 p. Sw. cr. 10:- .
375 Fast Neutron Elastic and Inelastic Scattering of Vanadium. By B. Holmqvist, S. G. Johansson, G. Lodin and T. Wiedling. 1969. 48 p. Sw. cr. 10: - .
376. Experimental and Theoretical Dynamic Study of the Agesta Nuclear Power Station. By P.-A. Bliselius, H. Vollmer and F. Akerhielm. 1969. 39 p. Sw. cr. 10: -
List of published AES-reports (In Swedish)
1 . Analysis be means of gamma spectrometry. By D. Brune. 1961. 10 p. Sw. cr. 6:- .
2. Irradiation changes and neutron atmosphere in reactor pressure vessels-some points of view. By M. Grounes. 1962. 33 p. Sw. cr. 6 : - .
3. Study of the elongation limit in mild steel. By G. Dstberg and R. Atter-mo. 1963. 17 p. Sw. cr. 6 : - .
4. Technical purchasing in the reactor field. By Erik Jonson. 1963. 64 p. Sw. cr. 8 : - .
5. Agesta nuclear power station. Summary of technical data, description*, etc. for the reactor. By B. LilliehSSk. 1964. 336 p. Sw. cr. 15:- .
6. Atom Day 1965. Summary of lectures and discussions. By S. SandstrSm. 1966. 321 p. Sw. cr. 15:-.
7. Building materials containing radium considered from the radiation protection point of view. By Stlg O. W. Bergstrom and Tor Wahlberg. 1967. 26 p. Sw. cr. 10:- .
Additional copies available from the library of AB Atomenergi, Fack, S-611 01 Nykoping, Sweden.
EOS-tryckerierna, Stockholm 1969


![[MS-WPE376]: WordPad ECMA 376 Standards Support · WordPad ECMA 376 Standards Support](https://static.fdocuments.in/doc/165x107/5fab533dea0e1c27ad282e55/ms-wpe376-wordpad-ecma-376-standards-support-wordpad-ecma-376-standards-support.jpg)