Building Next Generation Cloud Apps: Salesforce, Informatica, Xactly

THE ADVISORS’ INNER CIRCLE FUND II
CHAMPLAIN SMALL COMPANY FUND
CHAMPLAIN MID CAP FUND
CHAMPLAIN EMERGING MARKETS FUND
SEMI-ANNUAL REPORT
01.31.17
INVESTMENT ADVISER:CHAMPLAIN INVESTMENT PARTNERS, LLC
THE ADVISORS’ INNER CIRCLE FUND II CHAMPLAIN FUNDSJANUARY 31, 2017(Unaudited)
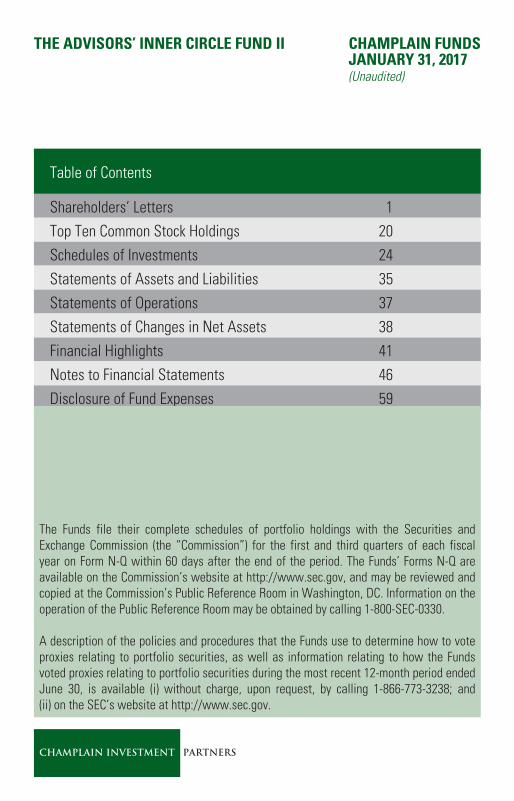
Table of Contents
Shareholders’ Letters 1Top Ten Common Stock Holdings 20Schedules of Investments 24Statements of Assets and Liabilities 35Statements of Operations 37Statements of Changes in Net Assets 38Financial Highlights 41Notes to Financial Statements 46Disclosure of Fund Expenses 59
The Funds file their complete schedules of portfolio holdings with the Securities andExchange Commission (the “Commission”) for the first and third quarters of each fiscalyear on Form N-Q within 60 days after the end of the period. The Funds’ Forms N-Q areavailable on the Commission’s website at http://www.sec.gov, and may be reviewed andcopied at the Commission’s Public Reference Room in Washington, DC. Information on theoperation of the Public Reference Room may be obtained by calling 1-800-SEC-0330.
A description of the policies and procedures that the Funds use to determine how to voteproxies relating to portfolio securities, as well as information relating to how the Fundsvoted proxies relating to portfolio securities during the most recent 12-month period endedJune 30, is available (i) without charge, upon request, by calling 1-866-773-3238; and(ii) on the SEC’s website at http://www.sec.gov.
CHAMPLAIN INVESTMENT PARTNERS
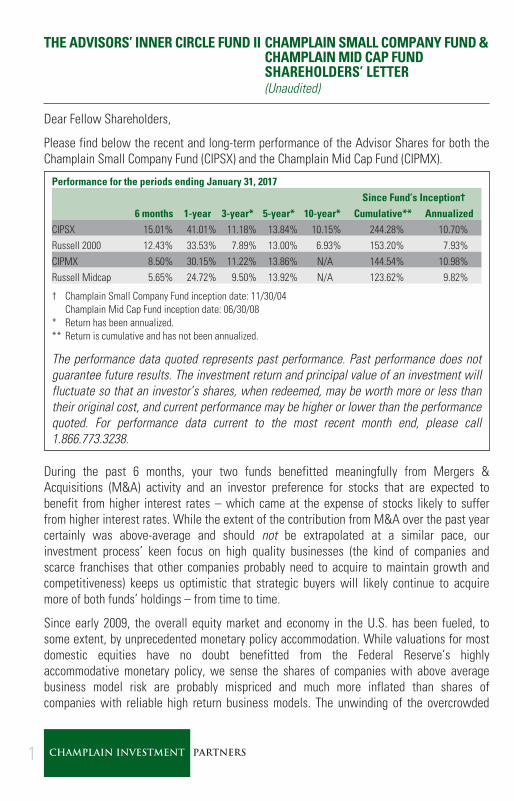
THE ADVISORS’ INNER CIRCLE FUND II CHAMPLAIN SMALL COMPANY FUND &CHAMPLAIN MID CAP FUNDSHAREHOLDERS’ LETTER(Unaudited)
Dear Fellow Shareholders,
Please find below the recent and long-term performance of the Advisor Shares for both theChamplain Small Company Fund (CIPSX) and the Champlain Mid Cap Fund (CIPMX).
Performance for the periods ending January 31, 2017Since Fund’s Inception†
6 months 1-year 3-year* 5-year* 10-year* Cumulative** AnnualizedCIPSX 15.01% 41.01% 11.18% 13.84% 10.15% 244.28% 10.70%Russell 2000 12.43% 33.53% 7.89% 13.00% 6.93% 153.20% 7.93%CIPMX 8.50% 30.15% 11.22% 13.86% N/A 144.54% 10.98%Russell Midcap 5.65% 24.72% 9.50% 13.92% N/A 123.62% 9.82%
† Champlain Small Company Fund inception date: 11/30/04Champlain Mid Cap Fund inception date: 06/30/08
* Return has been annualized.** Return is cumulative and has not been annualized.
The performance data quoted represents past performance. Past performance does notguarantee future results. The investment return and principal value of an investment willfluctuate so that an investor’s shares, when redeemed, may be worth more or less thantheir original cost, and current performance may be higher or lower than the performancequoted. For performance data current to the most recent month end, please call1.866.773.3238.
During the past 6 months, your two funds benefitted meaningfully from Mergers &Acquisitions (M&A) activity and an investor preference for stocks that are expected tobenefit from higher interest rates – which came at the expense of stocks likely to sufferfrom higher interest rates. While the extent of the contribution from M&A over the past yearcertainly was above-average and should not be extrapolated at a similar pace, ourinvestment process’ keen focus on high quality businesses (the kind of companies andscarce franchises that other companies probably need to acquire to maintain growth andcompetitiveness) keeps us optimistic that strategic buyers will likely continue to acquiremore of both funds’ holdings – from time to time.
Since early 2009, the overall equity market and economy in the U.S. has been fueled, tosome extent, by unprecedented monetary policy accommodation. While valuations for mostdomestic equities have no doubt benefitted from the Federal Reserve’s highlyaccommodative monetary policy, we sense the shares of companies with above averagebusiness model risk are probably mispriced and much more inflated than shares ofcompanies with reliable high return business models. The unwinding of the overcrowded
1 CHAMPLAIN INVESTMENT PARTNERS
THE ADVISORS’ INNER CIRCLE FUND II CHAMPLAIN SMALL COMPANY FUND &CHAMPLAIN MID CAP FUNDSHAREHOLDERS’ LETTER(Unaudited)
low volatility trade since last summer and the recent pro-cyclical bias to the post-electionrally for U.S. equities have only reinforced our sense of this mispricing. Historically, asinvestors have anticipated the Federal Reserve will begin to raise interest rates, higherquality companies have started to outperform the lower quality companies. It will beinteresting to see how equities perform if or when the Federal Reserve’s accommodation issubstantially removed or when we next have a recession. Though we cannot make anyguarantee, we expect both funds to outperform during such periods of monetary policytightening as well as in a severe and prolonged correction or bear market.
Importantly, the weighted average portfolio characteristics of each fund’s holdings indicatethat your funds are invested in companies with historically much better trailing 5-yeargrowth of revenue and book value on a per share basis, as well as higher historicalprofitability and higher business returns than the companies in their respective Russellbenchmarks – as measured by Gross Profitability and other meaningful business returnmetrics. Both funds also held shares in companies that are more fundamentally stable orreliable, as well as less burdened by debt than the companies in their respective Russellbenchmarks (source: FactSet). Importantly, the Small Company Fund’s holdings trade at amuch lower valuation than the Russell 2000 benchmark while the Mid Cap Fund trades at avaluation that is similar to the Russell Midcap benchmark (all calculations based on the12/31/16 one-year weighted harmonic average price-earnings (p/e) ratios inclusive of non-earners). In our minds, both funds offer shareholders attractive relative value. However, ourcurrent estimate of the weighted average discount to Fair Value for the holdings of eachfund suggests limited near-term upside at this time. We should point out though that ourvaluation methodology uses a “normalized” risk-free rate as we do not believe the era oflow inflation and Zero Interest Rate Policy (ZIRP) is a permanent condition. Please note thatif the yield on 10-year U.S. Treasury Bonds goes above 4%, then hindsight may suggest ourvaluation modeling was overly optimistic.
In recent months, two founders and original members of Champlain’s small and midcapinvestment team (David O’Neal and Van Harissis) elected to retire and start new chapters intheir lives. They join Dan Butler who retired last year. While all three were invaluable toChamplain when we started and as we sought to become established, they each helped ushire or develop a highly motivated and capable analyst to fill their role on the team. As wehave said to those we have met with over the years, Champlain’s most valuable player onthe small and midcap team is our investment process. Investment outcomes for this teamare not dependent on any one person’s special stock picking skills. Instead, our investmentprocess leverages analysts who execute a highly disciplined team-oriented process thatleaves limited flexibility to make big mistakes and points us toward the companies most
2 CHAMPLAIN INVESTMENT PARTNERS
THE ADVISORS’ INNER CIRCLE FUND II CHAMPLAIN SMALL COMPANY FUND &CHAMPLAIN MID CAP FUNDSHAREHOLDERS’ LETTER(Unaudited)
likely to succeed over time. As all three of these retirees have elected to retain a portion oftheir equity in the Champlain Investment Partners partnership, we have not had to say“goodbye” – but only “talk to you soon.”
Technology
While they contributed disproportionately to the strategy’s post financial crisis returns, oursoftware holdings have produced rather lackluster relative returns for both funds over thepast six months. The combination of post-election interest in the cyclical semiconductorsand electronics related companies coupled with weak relative stock selection for theMid Cap Fund were the primary culprits. We expect the pro-cyclical bias to prove fleetingwhile the interest rate pressure on the valuations of our faster growing SaaS and cloud-based software holdings may persist somewhat longer. We continue to discount cash flowsusing a pre-financial crisis 10-year U.S. Treasury bond yield, and believe our softwareholdings represent attractive and compelling absolute value at today’s interest rate levels.We are quite reluctant to abandon your funds’ current software holdings as we believe theirrevenue and earnings growth are likely to overcome the potential multiple compression fromsomewhat higher interest rates.
For the Small Company Fund, we used a meaningful share price pullback from recent highsto start new software positions in New Relic, Xactly Corporation, and Gigamon at attractivevaluations. New Relic provides a cloud-based suite of next-generation ApplicationPerformance Monitoring software used by businesses to evaluate their user experience/engagement and optimize functionality via precise troubleshooting of the software code.Xactly delivers cloud-based incentive compensation management software and relatedanalytics. Importantly, nearly all of Xactly’s clients have agreed to let Xactly own the data ithas collected for the past 11 years creating an increasingly valuable database for customersto tap for analysis and the design of more efficient data-driven compensation plans. It isencouraging to know that Xactly’s biggest “competitor” – by a wide margin – is theinternally built spreadsheet. We expect CFOs and auditors to become increasinglyuncomfortable with the internal spreadsheet option, especially after the U.S. accountingstandard shifts away from GAAP to IFRS. Gigamon’s technology enables data inspection forsecurity and analytical reasons and helps customers avoid making expensive additionalinvestments in network equipment. We also started reweighting Guidewire as the sharesretreated meaningfully from where we last trimmed. In October, at a minor discount to theannounced acquisition price by Verizon, we sold Fleetmatics Group a month prior to the dealclosing. Qlik Technologies was acquired by the private equity firm Thoma Bravo in August,and Mentor Graphics recently agreed to be acquired by Siemens AG. We also elected toeliminate pricing strategy software provider PROS Holdings as we believe their slowly
3 CHAMPLAIN INVESTMENT PARTNERS

THE ADVISORS’ INNER CIRCLE FUND II CHAMPLAIN SMALL COMPANY FUND &CHAMPLAIN MID CAP FUNDSHAREHOLDERS’ LETTER(Unaudited)
unfolding and ungainly transition to a cloud-based offering has left them vulnerable to freshcompetition from other software vendors that had added price strategy technology to theirapplications.
For the Mid Cap Fund, we used a meaningful share price pullback from recent highs to starta new position in Tableau Software, provider of easy-to-use and agnostic data visualizationsoftware. We also added to Akamai, Guidewire, Blackbaud, Palo Alto Networks, and RedHat on weakness. Recently both WalMart and Amazon have signed large contracts withWorkday, affirming our enthusiasm for Workday’s true cloud-architected software and thecompany’s long-term outlook. The strong growth of new clients at Splunk and the degree towhich existing clients are expanding their business with Splunk also affirms our growingenthusiasm for Splunk’s data mining technology and the company’s long-term outlook. A fullvaluation and some excessive enthusiasm for the company’s still nascent Internet of Thingsopportunity warranted our decision to reduce the position size for PTC Inc. by almost half.Valuation also caused us to eliminate the position in Xilinx, although at the time we sold theshares we did not appreciate the potential for this company’s semiconductors to be used innext generation computers designed for machine learning or artificial intelligence.
Industrials and Materials
Our long standing enthusiasm and valuation analysis for CLARCOR were affirmed this pastDecember by Parker Hannifin’s $83 bid to acquire the company, and this fully priced buyouthelped both funds industrial holdings overcome a strong pro-cyclical bias since the election.Led by strong returns for Chase Corp. (newly purchased manufacturer of coatings and otherprotective materials), Balchem, and Innospec, the Small Company Fund’s specialty chemicalcompanies also outperformed the materials sector. However, the Mid Cap Fund’s specialtychemical and packaging holdings underperformed the materials sector, creating a smalldeficit as the highly cyclical companies and industries (e.g. metals & mining) outperformedmaterially over the past six months.
While the stability of CLARCOR’s business model will be missed, we expect the SmallCompany Fund’s relatively recent and growing exposure to the food service equipmentindustry (e.g. John Bean Technologies, Manitowoc Foodservice, and Standex) to represent avery similar risk/reward profile. While none have as high a percentage of aftermarketexposure that CLARCOR enjoyed, the overall world-wide demand for food service equipmentis less cyclical than CLARCOR’s end markets. The foodservice equipment industry stillpresents considerable opportunity to consolidate the smaller private participants in ouropinion, while constantly iterating restaurant menus and the growing demand for laborsaving automation in the production plants and restaurant also will likely help fuel growth.
4 CHAMPLAIN INVESTMENT PARTNERS
THE ADVISORS’ INNER CIRCLE FUND II CHAMPLAIN SMALL COMPANY FUND &CHAMPLAIN MID CAP FUNDSHAREHOLDERS’ LETTER(Unaudited)
As John Bean and Manitowoc build out their platforms, we expect both companies tobecome increasingly attractive to larger industrial enterprises looking to diversify awaycyclical exposure or build out their existing foodservice segment.
The Small Company Fund’s increased weight in H.B. Fuller Company reflects our growingenthusiasm for their strategy to grow the highly profitable Engineered Adhesives segmentand improve overall margins. We are comforted by the 40% of sales to the non-cyclicalhygiene and packaging end markets and the 46 consecutive years of dividend increases.With the shares up well off their March lows, we eliminated the remaining small weight weheld in Raven Industries early last fall as enthusiasm for industrials with energy andagriculture exposure rebounded. We would rather concentrate that capital into otherholdings with more balanced and less cyclical end market exposure.
The Mid Cap Fund already owns a collection of well managed asset-light “PortfolioManagers” that have out-earned, outgrown, and better allocated capital by a wide marginversus the average midcap industrial company. Nonetheless, our early fall decision last yearto eliminate Parker-Hannifin and bring former holding AMETEK back into the strategyimproved on the already strong overall return profile of this fund’s collection of industrial“Portfolio Managers.” AMETEK is a well-diversified and historically high return machinerycompany with expertise in Test & Measurement, Metrology, and Precision Motion Control.We also started a new position in International Flavors and Fragrances, a producer of keyingredients for the food, beverage, and personal care industries as its share price recentlyretreated back to what we consider a reasonable valuation. We are particularly encouragedby a recent acquisition which provided the company with a meaningful toe hold in the highmargin active ingredients industry for makeup and personal care products. We alsocontinued to build up the position size for Aptargroup, which makes specialty packaging/dispensing for pharmaceutical, cosmetic, food, and beverage companies. Both companies’shares have historically behaved more like a consumer staples stock than a materials stockwhile both also have consistently earned attractive returns in recent years.
Energy
Because of the sector’s modest overall weight in the benchmarks, the weak relative returnsfrom this strategy’s energy holdings and its underweight of the outperforming sector onlycreated a small deficit for the funds over the past six months. Without any conviction aboutthe long-term outlook for the price of oil, we have limited the energy service holdings in thissector for both funds to companies that are similar to the high quality industrial holdingsheld by both funds. We also are reluctant to hold exposure to shale-based Exploration andProduction (E&P) companies. While Saudi Arabia’s change of heart about market share may
5 CHAMPLAIN INVESTMENT PARTNERS
THE ADVISORS’ INNER CIRCLE FUND II CHAMPLAIN SMALL COMPANY FUND &CHAMPLAIN MID CAP FUNDSHAREHOLDERS’ LETTER(Unaudited)
accelerate the balancing of the oil market, we are interested to see what the response willbe from North American shale-oil producers. We favor Denbury’s CO2 Enhanced OilRecovery business model over traditional E&P companies. To break even on a cash basis,Denbury needs about $40/bbl, however to get the share price back above what we think theinfrastructure and CO2 reserves are worth, widespread confidence of a sustainable oil priceof closer to $65/bbl probably will be needed. We wonder if the combination of decliningcosts to produce oil from shale (adding to supply) and the rapidly evolving electric vehiclebattery technology (curtailing demand) will eventually place incredible pressure on the priceof oil. Perhaps these trends are part of the motivation for why Saudi Arabia is taking itsnational oil company public.
Consumer
The investor abandonment of the low volatility trade accelerated after the U.S. presidentialelection, and the Small Company Fund’s consumer holdings underperformed the sectornoticeably due to our overweight of the underperforming staples sector and relativelyweaker stock selection within staples. The Mid Cap Fund’s consumer holdings performedabout in-line with the sector, but stock selection in staples also was relatively weak. In bothfunds, we took advantage of the recent sell pressure in staples. In the Small Company Fund,we added meaningfully to TreeHouse Foods and B&G Foods while starting new positions inAdvancePierre Foods, Amplify Snack Brands; and former holding, Helen of Troy.AdvancePierre Foods produces ready to microwave hamburgers and other sandwichesmostly for convenience stores, cafeterias, and other foodservice venues. Amplify producesSkinnyPop, Paqui Tortilla Chips, Oatmega protein bars, and recently acquired the Tyrrell’sbrand of hand cooked English style chips and crips. Helen of Troy built a diverse portfolio ofconsumer products while at the same time produced strong returns on capital. In theMid Cap Fund; we bought back a small position in the spice maker McCormick, added toTreeHouse Foods, J.M. Smuckers, Mead Johnson Nutrition, and Sally Beauty. We alsoeliminated Tupperware Brands as we would rather concentrate the fund’s capital on otherholdings with better long-term fundamentals. (In February, Mead Johnson agreed to beacquired by Reckitt Benckiser Group for $90 per share.)
TreeHouse Foods’ shares were especially weak this period due to an earnings miss andweak near-term guidance, but the latest earnings report in February suggests therestructuring of the sales force has put the business substantially back on track. Salespeople are now organized along product lines coupled with key account managers for the 30largest customers. A sharp rebound for the shares of midcap holding Flowers Foodsfollowed the settlement of their largest and longest tenured class action lawsuit by somedelivery drivers for just under $20,000 per driver. This settlement strongly suggests the
6 CHAMPLAIN INVESTMENT PARTNERS

THE ADVISORS’ INNER CIRCLE FUND II CHAMPLAIN SMALL COMPANY FUND &CHAMPLAIN MID CAP FUNDSHAREHOLDERS’ LETTER(Unaudited)
remaining class action lawsuits will likely get settled on terms that will not unduly threatenthe franchise as some had suggested earlier in the year. After a long activist encouragedstrategic review process (during which we sold some Cabela’s), it was announced that BassPro Shops would acquire Cabela’s for over $65. Our skepticism that attractive financing forthis deal could be arranged by this already leveraged buyer prompted us to sell ourremaining Cabela’s shares at a modest discount to the proposed acquisition price.
Financials
As investors anticipated meaningfully higher interest rates, first from a more hawkish FederalReserve and then because of the pro-growth rhetoric of an incoming Trump Administration, ourmostly asset-sensitive banks outperformed the interest rate sensitive REIT and Utility sectorsby a wide margin since our last letter. A sense that the bull market for compliance has peakedalso may have contributed to the powerful investor enthusiasm for banks post the election. Therecently announced and still pending acquisitions of Property & Casualty (P&C) insurers AlliedWorld Assurance and Endurance Specialty also contributed significantly to the strong relativeperformance in financials for both funds during the past six months.
We reacted to the initial buyout of Endurance by adding to Allied World, Argo Group, andNavigator Group for the Small Company Fund and to Allied World for the Mid Cap Fund.However, we will need to see valuations pull back before we will want to increase eitherfund’s exposure to the P&C insurance industry. We eliminated the small position in P&Cinsurer James River Group Holdings Ltd. from the Small Company Fund at a valuationcomparable to that at which both Endurance and Allied World agreed to be acquired. Duringthe past 6 months, our concerns about Financial Engines dissipated after listening tomanagement discuss their recent investments, the integration of The Mutual Fund Store(TMFS), and the strong plan participant response to being able to access TMFS’ financialplanning services. The increased focus on fiduciary duty has certainly opened doors for newrelationships, and we sense plan sponsors will continue to seek out and embrace conflict-free advisor relationships regardless of the Trump Administration’s stance on fiduciary duty.Furthermore, we expect continued news about the inappropriate purchase of high feeannuities for tax-deferred accounts to encourage more assets to migrate to advisors withplatforms of best-in-class managers and transparent fees. Given our enthusiasm forreasonably priced conflict-free investment management advice, we recently started a freshposition in Morningstar, Inc. for the Mid Cap Fund. We believe the company is windingdown a period of abnormally high investment in internal technology and softwarecapabilities and expect to see margins begin to rebound. Also, the recent consolidatingacquisition of PitchBook, a provider of data and a research & analysis platform for privateequity and venture capital investment firms, offers attractive growth.
7 CHAMPLAIN INVESTMENT PARTNERS
THE ADVISORS’ INNER CIRCLE FUND II CHAMPLAIN SMALL COMPANY FUND &CHAMPLAIN MID CAP FUNDSHAREHOLDERS’ LETTER(Unaudited)
While it’s tempting, we are reluctant to declare the end of the low interest rate era.Although we sense post-peak globalization will usher in some inflationary pressure, we alsosee as many short-term headwinds as tailwinds developing for the U.S. economy.Meanwhile, demographics (very slow growth in working-age population) and high overalldebt levels relative to GDP remain powerful structural deterrents to strong economic growthin the U.S and abroad! The potential for a productivity windfall from cloud computing,machine learning, artificial intelligence, and other Second Machine Age innovationscoalescing could be very deflationary if it creates unemployment for scores of well-paidworkers in technology, transportation, finance, investment management, and healthcare.While it is hard to quantify the positive impact less regulation might have on businesses andthe investment plans of their owners; it would not surprise us to see a strong US Dollar,trade friction, or the impact of higher interest rates create offsetting economic headwindsand usher in renewed Federal Reserve reluctance to hike short-term interest ratesaggressively. Thus, an eventual rebound in relative performance for REITs and utilities at theexpense of banks and insurance stocks will not surprise us. As several of the bank holdingsin both funds approached our current thinking about their Fair Value during the sharp post-election bank stock rally, we trimmed the positions and reduced both funds’ overallexposure to the banking industry.
Health Care
Led by Danaher’s acquisition of molecular diagnostic provider Cepheid, which closed inNovember of last year, both funds’ healthcare holdings outperformed their Russellbenchmarks’ healthcare names and contributed to the funds’ overall relative performanceadvantage over the past six months. We began to redeploy some of the Cepheid capital bystarting a new position for the Small Company Fund in Penumbra, an innovator ofneurovascular tools and devices that address strokes. Additionally, the company hasdeveloped a unique suite of peripheral vascular products to treat both blood clots andpotential aneurisms. Because Globus Medical does not provide a full suite of spinal surgeryproducts, we sense the company will be at an increasing competitive disadvantage toNuVasive (a holding of both funds), Medtronic, and others. Accordingly, we eliminated themodest position the Small Company Fund had in Globus. The small positions in HalyardHealth and Phibro Animal Health also were eliminated in favor of owning more of otherSmall Company Fund holdings in which we have higher confidence.
For the Mid Cap Fund, we reinvested capital from St. Jude Medical (acquired by AbbottLaboratories) and Cepheid by starting a new position in the dental, medical, and veterinarydistributor Henry Schein. We also began a new position in Stericycle, a provider of medicalwaste collection and document shredding services. Another new position was started in
8 CHAMPLAIN INVESTMENT PARTNERS

THE ADVISORS’ INNER CIRCLE FUND II CHAMPLAIN SMALL COMPANY FUND &CHAMPLAIN MID CAP FUNDSHAREHOLDERS’ LETTER(Unaudited)
ABIOMED, a manufacturer of minimally invasive (trans-catheter) pumps for circulatorysupport that provide substantially better outcomes than intra-aortic balloon pumps whenused during coronary intervention procedures and acute heart attacks. ABIOMED’stechnology and broad product offering place the company well ahead of its nearestcompetitor in our opinion. We added meaningfully to Integra LifeSciences, DENTSPLYSIRONA, NuVasive, LabCorp, C.R. Bard, and Waters Corp. Although it is a terrific franchise,we sold this strategy’s small position in Mettler-Toledo because of valuation. We also soldthe remainder of the fund’s position in Edwards Lifesciences because of valuation – andbefore they disappointed investors with weaker than anticipated earnings and forwardguidance in November. Finally, we eliminated the small remaining position in Teleflex as wewould rather focus the fund’s capital on other holdings in this sector.
If Republicans repeal the Affordable Care Act, it may create some headwinds for this sector,particularly for the companies that depend on hospitals’ capital spending for expansion andtechnology as well as service companies that are highly dependent on patient volumes andgovernment reimbursement (industries to which both funds are much less exposed).Importantly, the Mid Cap Fund is much more exposed to the dental industry than bothbenchmarks, and we do not expect any partial or full repeal of ACA to have the samenegative impact on dental visits as hospital patient volumes. The dental companies in whichthis strategy is invested offer technology driven products that allow for easier and lessobtrusive teeth and bite alignment (Align Technology) and production of crowns in thedentist’s office at the time of the initial visit (DENTSPLY SIRONA).
Final Thoughts
Much about the impact from the new Trump Administration is probably still unknowable atthis time, and we are unwilling to predict what electioneering rhetoric will or will notbecome policy. The early skirmishes between the entrenched policy makers (both theelected ones in Congress and the unelected ones) and the new Administration have thepotential to produce paralysis and disappoint investors who are expecting major tax reformand other policies beneficial for equities. The outlook for Europe also looks unpredictable.The socialization of risk by the European Central Bank in recent years and the growingsupport for populist politicians may well produce some renewed volatility for capitalmarkets. Indeed, the flight of capital into Germany suggests some see trouble brewing forthe European Union. Thank goodness our investment process does not rely on our ability topredict policy and forecast the macro-economic outlook!
Our investment process instead relies on high quality businesses and a valuation discipline.To help our constituents better understand our definition of high quality; please allow us to
9 CHAMPLAIN INVESTMENT PARTNERS
THE ADVISORS’ INNER CIRCLE FUND II CHAMPLAIN SMALL COMPANY FUND &CHAMPLAIN MID CAP FUNDSHAREHOLDERS’ LETTER(Unaudited)
elaborate... In the context of investing, a high quality business/company is not just abouthigh returns and predictability in the present moment or recent past. A business with a clearand obvious path to higher profitability may represent quality. A high quality business/company also is about reliability and durability – a lower than average exposure to cyclicalrisk, obsolescence risk, or an unexpected and fairly rapid demise. The sector factors weemploy at the front end of our investment process help us manage this kind of risk. Highquality also is very much about healthy corporate governance and a corporate culture ofgood habits and disciplined capital allocation that prudently and carefully sows seeds forthe future while also being thoughtful about how to share profits with shareholders oncecredible investment opportunities have dissipated enough to allow the company to generatefree cash flow. High quality businesses attract talented, wise, and reasonably humbleemployees, management, and directors. Thus, they are typically able to adjust the firm’soperations for new conditions such as a strong US Dollar or weak economy, and they rarelymake excuses. They also tend not to leverage the balance sheet to the point where theenterprise could be exposed to existential risk or major disruption. A high quality business/company also enjoys a healthy win/win relationship with its employees, customers,suppliers, and other stakeholders. It does not constantly need a lot of legal aid or makechronic use of lobbyists to gain legislative favor. High quality isn’t necessarily growth orvalue. In the technology sector, strong relative growth may often represent the safety ofgrowing acceptance and relevance while weak relative growth or no growth at all mayrepresent a business model in transition or facing obsolescence. In the financial sector,rapidly growing balance sheets are often a precursor to asset quality problems or anunexpected but painful mismatch of assets and liabilities. Importantly, a high qualitybusiness will most likely not be a good or even a safe equity investment if the shares areextremely overvalued. High quality and value may or may not coincide with a low p/emultiple, because value is all about a healthy discount to the net present value of futurecash flows. Similarly, a high current dividend yield may not be as valuable as a lowerdividend yield with a faster growing dividend.
As we continue to recycle the capital in this strategy either because of our sell discipline orM&A activity, we will be patient and vigilant so that we do not trade down in quality.Despite today’s lofty valuations, history and experience teach us that credible new highquality opportunities for both funds will most likely present themselves in due time.
As always, we remain inspired by and grateful for the privilege to manage a portion of yourwealth. Importantly, we also appreciate the vast majority of executives and board membersat your funds’ holdings who do a terrific job of allocating capital and building theirshareholders’ wealth. We will do our best not to undermine their good work while we seek
10 CHAMPLAIN INVESTMENT PARTNERS
THE ADVISORS’ INNER CIRCLE FUND II CHAMPLAIN SMALL COMPANY FUND &CHAMPLAIN MID CAP FUNDSHAREHOLDERS’ LETTER(Unaudited)
to add value by managing the funds’ valuation risk. At the same time, please know that wewill not hesitate to engage with management in a constructive manner if we believe theyneed to hear another point of view or if they ask us to approve unreasonable compensationor incentives.
Sincerely yours,
Scott T. Brayman
The above commentary represents management’s assessment of the Funds and market environment at aspecific point in time and should not be relied upon by the reader as research or investment adviceregarding the funds or any stock in particular, nor should it be construed as a recommendation topurchase or sell a security.
Holdings are subject to change. Current and future holdings are subject to risk.
Mutual fund investing involves risk, including possible loss of principal. There can be no assurance thatthe Funds will achieve their stated objectives. In addition to the normal risks associated with investing,investments in smaller companies typically exhibit higher volatility. Current and future holdings aresubject to risk. Diversification does not protect against market loss.
11 CHAMPLAIN INVESTMENT PARTNERS
THE ADVISORS’ INNER CIRCLE FUND II CHAMPLAIN EMERGINGMARKETS FUNDSHAREHOLDERS’ LETTER(Unaudited)
Dear Fellow Shareholders,
Please find below the recent performance the Champlain Emerging Markets Fund (CIPDX).
Performance for the periods ending January 31, 2017Since Fund’s Inception†
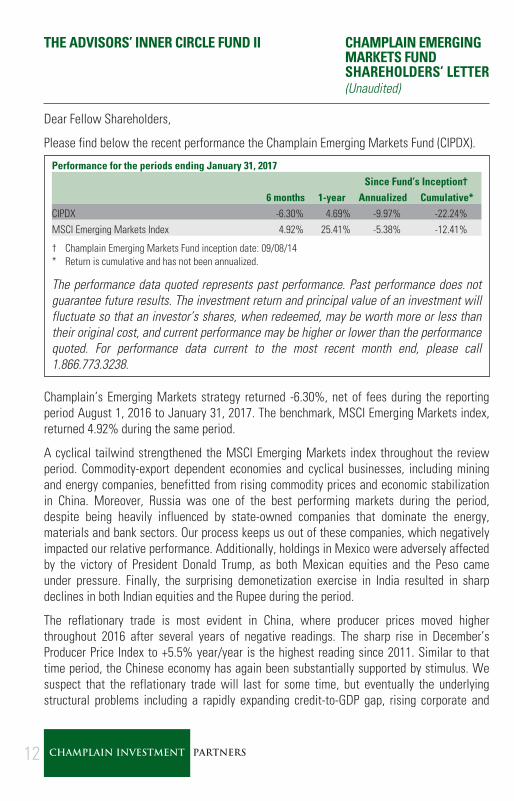
6 months 1-year Annualized Cumulative*CIPDX -6.30% 4.69% -9.97% -22.24%MSCI Emerging Markets Index 4.92% 25.41% -5.38% -12.41%
† Champlain Emerging Markets Fund inception date: 09/08/14* Return is cumulative and has not been annualized.
The performance data quoted represents past performance. Past performance does notguarantee future results. The investment return and principal value of an investment willfluctuate so that an investor’s shares, when redeemed, may be worth more or less thantheir original cost, and current performance may be higher or lower than the performancequoted. For performance data current to the most recent month end, please call1.866.773.3238.
Champlain’s Emerging Markets strategy returned -6.30%, net of fees during the reportingperiod August 1, 2016 to January 31, 2017. The benchmark, MSCI Emerging Markets index,returned 4.92% during the same period.
A cyclical tailwind strengthened the MSCI Emerging Markets index throughout the reviewperiod. Commodity-export dependent economies and cyclical businesses, including miningand energy companies, benefitted from rising commodity prices and economic stabilizationin China. Moreover, Russia was one of the best performing markets during the period,despite being heavily influenced by state-owned companies that dominate the energy,materials and bank sectors. Our process keeps us out of these companies, which negativelyimpacted our relative performance. Additionally, holdings in Mexico were adversely affectedby the victory of President Donald Trump, as both Mexican equities and the Peso cameunder pressure. Finally, the surprising demonetization exercise in India resulted in sharpdeclines in both Indian equities and the Rupee during the period.
The reflationary trade is most evident in China, where producer prices moved higherthroughout 2016 after several years of negative readings. The sharp rise in December’sProducer Price Index to +5.5% year/year is the highest reading since 2011. Similar to thattime period, the Chinese economy has again been substantially supported by stimulus. Wesuspect that the reflationary trade will last for some time, but eventually the underlyingstructural problems including a rapidly expanding credit-to-GDP gap, rising corporate and
12 CHAMPLAIN INVESTMENT PARTNERS
THE ADVISORS’ INNER CIRCLE FUND II CHAMPLAIN EMERGINGMARKETS FUNDSHAREHOLDERS’ LETTER(Unaudited)
household debt, and capital outflows will act as a drag on growth. This will likely have anegative impact on the traditionally cyclical sectors and currencies in Emerging Markets(EM).
Our Emerging Markets investment process favors high quality, less cyclical, cash flowgenerative businesses over cyclical businesses selling commoditized products, withunpredictable margins and limited sustainable competitive advantages. While no business isimmune from some cyclicality, we will continue to avoid business models tied directly to theprice of a commodity. There will be periods of time, similar to this review period, when thestrategy underperforms the broader benchmark, although over a full business cycle, weexpect to generate attractive returns by being patient and holding a portfolio of qualityfranchises that compound wealth over time.
Asia
Our largest country exposure is India, which was one of the worst performing marketsduring the period and meaningfully impacted our performance. In early November, PrimeMinister Modi shocked the economy by ceasing the usage of all 500 and 1,000 Rupee notes,which accounted for ~86% of all currency in circulation (U.S. $240 billion). Prime MinisterModi sought to reduce the scope of the cash based economy, which is undocumented andlimits tax revenue. He also sought to remove untraceable “dark money” from the system byforcing old currency notes to be deposited into legitimate bank accounts. This currencyreform enables the forthcoming national goods and services tax to be more easilyimplemented in 2017, as more transactions will be “on the record.” Consequently, weexpect the government to capture more tax revenue which is necessary to build desperatelyneeded infrastructure. Hence, we think the long term impacts of demonization are positiveand in the short term, the equity market volatility is creating opportunities to own greatbusinesses that were previously overpriced. We increased on our position in GodrejConsumer Products, a consumer staples company with a strong portfolio of brands in thepersonal care and household insecticides segments. Similarly, we added to Bharti Infratel,the largest cell tower company in India, after its share price was pressured by a combinationof demonetization volatility and uncertainty regarding a stake sale by its parent company.The long term trend of increased data consumption is forcing the carriers to invest in themobile phone networks, which will benefit Bharti’s tower business. We also added to AxisBank, rebuilding the position after trimming it at a price closer to our estimate of Fair Value.We are encouraged by management’s aggressive identification and write down ofproblematic corporate loans in its portfolio. We believe its consumer franchise, which hasattractive long-term growth opportunities, is being undervalued. We expect to continueadding to our Indian exposure if we find meaningful discounts to our Fair Value estimates.
13 CHAMPLAIN INVESTMENT PARTNERS
THE ADVISORS’ INNER CIRCLE FUND II CHAMPLAIN EMERGINGMARKETS FUNDSHAREHOLDERS’ LETTER(Unaudited)
India continues to be one of our favorite markets in EM given its positive demographics, lowlevels of household debt, globally competitive companies and a reform-minded governmentthat is creating a supportive macroeconomic backdrop.
As mentioned earlier, the government stimulus-driven reflation trade in China has increasedproducer prices substantially in 2016 and into early 2017. Our relative underweight positionsin Chinese materials, energy and state-owned financial institutions were headwinds for thestrategy. Further impacting performance was our exposure to Chinese exporter, TechtronicIndustries. Techtronic is a long-term holding, most recognizable by its strong portfolio ofbrands including Ryobi and Milwaukee Power Tools. Techtronic has numerous growthopportunities; including expanding the Milwaukee brand in the professional contractorsegment in the U.S. and penetrating new markets globally with its do-it-yourself brandRyobi. Techtronic is a beneficiary of a weaker Chinese Reminbi, as a large percentage ofrevenue is generated outside of China. Not surprisingly, shares were under pressure due tothe anti-China rhetoric of President Trump and his administration. We have not added to ourposition, despite the large discount to our Fair Value estimate, given the lack of clarityaround U.S. trade policy.
Our other Chinese exposure continues to be focused in technology and consumerdiscretionary with no exposure to the Chinese banks or state controlled energy companies,both of which tend to be run for the commonwealth rather than minority shareholders.Within technology, our two largest positions, Tencent and Alibaba, were positivecontributors to performance. During the review period, we exited our position in JD.comnear our Fair Value estimate. We became more concerned about Alibaba’s increasing leadover JD.com, as Alibaba has assembled a portfolio of operating companies that are quicklyamassing critical scale across many key verticals in China including payments, cloud andtransaction services (O2O). Simply put, we doubt JD.com has the financial flexibility to keepup. Ultimately, we believe Alibaba has built an enviable ecosystem to maintain itsdominance for years in the future.
Outside of India and China, we continue to be underweight South Korea and Taiwan in favorof Southeast Asia. However, we initiated a position in Amorepacific Corporation in SouthKorea. Amorepacific is a personal care company that develops, manufactures and sellscosmetics and skin care products, primarily in Asia. The company is in the early stages ofexpansion into China and Southeast Asia, which hold significant growth opportunities giventhe size of these untapped markets. We expect management to continue prudently buildingthe business while endeavoring to maintain high returns. Shares were negatively impactedby an ongoing dispute with China over South Korea’s intention to build a missile shield withthe U.S. This political situation provided an opportunity to own a high quality business at a
14 CHAMPLAIN INVESTMENT PARTNERS

THE ADVISORS’ INNER CIRCLE FUND II CHAMPLAIN EMERGINGMARKETS FUNDSHAREHOLDERS’ LETTER(Unaudited)
meaningful discount to our Fair Value estimate. Existing holding Hanmi Pharmaceutical wasa major detractor during the period as shares were pressured after the company disclosedmaterial changes to two of its pipeline drugs. We believe there is long-term value in thecompany’s existing pipeline of products that are being developed in partnership with largeglobal pharmaceutical companies such as Genentech and Eli Lilly. Although it may takesome time to validate, our valuation framework suggests investors are giving very littlevalue to the pipeline. Meanwhile the core domestic business continues to grow whilegenerating healthy free cash flows.
In Southeast Asia, we added to Universal Robina in the Philippines, a long-term holding inthe consumer staples sector. We believe the near-term headwinds driven by intensifiedcompetition from Nestle in the coffee business, potential taxes on sugar and junk food, anda reset of the Vietnam beverage business will be outweighed by the long-term strengths ofthe underlying business. Management continues to focus on product innovation and pushtopline growth through geographic expansion, while maintaining high returns on investedcapital. We also added to our position in Thai Beverage after shares came under pressurewhen the government regulated alcohol consumption during the month of mourningfollowing the King of Thailand’s death. Once this slowdown passes, we expect ThaiBeverage to continue growing its beer business while maintaining its dominant marketposition in spirits. In Indonesia, we exited our position in Bank Mandiri as shares weretrading close to our Fair Value estimate and we saw limited additional upside.
Latin America
The Mexican Peso has been declining relative to the U.S. Dollar since late 2014, coincidingwith the secular decline in oil prices. This trend extended into the fourth quarter of 2016. Ourholdings in Mexico were further impacted by the election of Donald Trump to the U.S.Presidency. The Mexican budget continues to face oil-related strains and the specter of adisadvantageously renegotiated NAFTA or overtly anti-Mexican policies put in place during aTrump Presidency have the Peso and Mexican equities under pressure. There is no doubt thatMexico benefited from the NAFTA trade agreement, but now holds little leverage in a tradenegotiation. However, the Peso declined nearly 20% from the election until the swearing inceremony in early January, which ironically, makes Mexico an extremely attractive countryfor manufacturing, regardless of whether a 10% tariff is implemented. A border taxadjustment would have a more pronounced and immediate impact on equity prices and thecurrency, but the beauty of a freely floating currency is that it adjusts, usually relativelyquickly. As such, a border tax adjustment in combination with a stronger U.S. Dollar couldactually have positive long term consequences for Mexican manufacturing. As a result, weare cautiously optimistic and are awaiting better clarity on how policy will truly unfold.
15 CHAMPLAIN INVESTMENT PARTNERS

THE ADVISORS’ INNER CIRCLE FUND II CHAMPLAIN EMERGINGMARKETS FUNDSHAREHOLDERS’ LETTER(Unaudited)
That said, prior to the election, we did exit two positions, Grupo Bimbo and Liverpool. Bothwere trading near our Fair Value estimates, but also had company specific risks which wethought were not fully reflected in prices. Post-election, we exited two additional positions.We exited Alsea, a regional restaurant operator, as their M&A growth strategy appearedchallenged and no longer justified the valuation, given a dearth of domestic marketacquisition opportunities and limited flexibility to utilize the balance sheet. We also exitedNemak, a specialized auto parts supplier with significant exposure to the U.S. auto market.We already had concerns regarding global auto demand and readjusted our Fair Valueestimates to reflect lower long-term growth. Further, we believe shares will be range bounduntil Trump’s trade policy is clarified. Meanwhile, we added to Gruma, the world’s largestproducer of corn and flour tortillas on price weakness. We consider the company to be mostlyimmune to tariffs and U.S. trade protectionism given its large asset base across the U.S.
While Brazil’s economy has stabilized, long-term structural headwinds will likely prevent astrong and lasting economic rebound. Therefore, we remain underweight, but did add asmall position in Ambev, Brazil’s largest beverage company, after the company missed thirdquarter earnings expectations. The consumer continues to be challenged in Brazil andAmbev clearly isn’t immune. Weakness may persist for some time, but we expect Ambev toeventually recover given its unassailable market position, high margins and strong cash flowgeneration. We expect to add to the position in the near-term on oversold conditions.
Ceemena
We initiated a position in South African restaurant franchisor and food and beveragemanufacturer Famous Brands during the review period. Famous Brands offers franchises ofits nearly 30 restaurant brands while operating a food and beverage manufacturing andlogistics business that delivers product to the restaurants. In this way, management solvedstructural factors that were unique to South Africa including an unreliable logistics sectorand high inflation. As it turns out, this business model has worked well for Famous Brandsthrough the years and had enabled management to grow the business quickly whilegenerating high returns and free cash flow. Over the long term, we expect the company tocontinue expanding in South Africa, but faster growth opportunities are available in otherAfrican countries as well as in select developed markets where Famous Brands hassustainable competitive advantages.
We also added to our position in Safaricom in Kenya during the period as geopolitical risksresulted in stock price weakness and created an opportunity to add to a strong franchise. Wecontinue to like Safaricom’s ability to grow its M-PESA franchise by layering other servicesthat should generate attractive returns. M-PESA is a mobile phone-based money transfer,
16 CHAMPLAIN INVESTMENT PARTNERS

THE ADVISORS’ INNER CIRCLE FUND II CHAMPLAIN EMERGINGMARKETS FUNDSHAREHOLDERS’ LETTER(Unaudited)
financing and microfinancing service, launched in 2007 by Vodaphone for Safaricom andVodacom, the largest mobile network operators in Kenya and Tanzania. Safaricom is alsoexpanding its 4G network in Kenya, which we believe will increase its technology lead overits competitors and should provide increased durability to its telecom business.
Final Thoughts
The strategy faced multiple headwinds during the review period. Specifically, our biggestoverweight markets, India, Mexico and the Philippines were underperformers while ourunderweight markets, Russia, and Brazil were outperformers. This largely reflects thecyclical trade that began in early 2016. Our absolute and relative performance suffered fromthe strategy’s positioning in higher quality, less cyclical businesses which underperformedthe broader benchmarks. We continue to view the rebound in commodities and other highlycyclical businesses skeptically. While China’s debt problems are well documented, there is acomplacency among investors that is somewhat disconcerting. President Trump’s victoryand the shock demonetization in India resulted in a sharp contraction of asset values inMexico and India, respectively. India is likely to move past the demonization impact in a fewquarters while Mexico faces continued uncertainty, which may prevent a near-termsustainable rebound in prices. We view volatility as an opportunity and as valuations arebecoming more reasonable in India, we are able to add to high quality franchises that webelieve will compound wealth over a long time horizon. Undoubtedly geopolitical events willcontinue to create short term volatility, but we remain steadfastly focused on owning highquality businesses at reasonable valuations, which we believe will deliver the best returnsfor shareholders over time.
We are grateful for the privilege to manage a portion of your portfolio.
Sincerely,
Russell E. Hoss, CFA
The above commentary represents management’s assessment of the Funds and market environment at aspecific point in time and should not be relied upon by the reader as research or investment adviceregarding the funds or any stock in particular, nor should it be construed as a recommendation topurchase or sell a security.
17 CHAMPLAIN INVESTMENT PARTNERS

THE ADVISORS’ INNER CIRCLE FUND II CHAMPLAIN EMERGINGMARKETS FUNDSHAREHOLDERS’ LETTER(Unaudited)
Holdings are subject to change. Current and future holdings are subject to risk.
Mutual fund investing involves risk, including possible loss of principal. There can be no assurance thatthe Fund will achieve its stated objectives. Foreign investments present risks due to currencyfluctuations, economic and political factors, lower liquidity, government regulations, differences insecurities regulations and accounting standards, possible changes in taxation, limited public informationand other factors. The risks are magnified in countries with emerging markets, since these countriesmay have relatively unstable governments and less established markets and economies. Small-capstocks also are subject to substantial risks such as market, business, size volatility, managementexperience, product diversification, financial resource, competitive strength, liquidity, and potential tofall out of favor that may cause their prices to fluctuate over time, sometimes rapidly and unpredictably.The fund is non-diversified.
18 CHAMPLAIN INVESTMENT PARTNERS

THE ADVISORS’ INNER CIRCLE FUND II CHAMPLAIN FUNDS
DEFINITION OF THE COMPARATIVE INDICES
MSCI Emerging Markets Index is a free float-adjusted market capitalization index that isdesigned to measure equity market performance of emerging markets. It consists of thefollowing 21 emerging market country indices: Brazil, Chile, China, Colombia, CzechRepublic, Egypt, Hungary, India, Indonesia, Korea, Malaysia, Mexico, Morocco, Peru,Philippines, Poland, Russia, South Africa, Taiwan, Thailand, and Turkey.
Russell Midcap Index measures the performance of the mid-cap segment of the U.S.equity universe. It includes approximately 800 of the smallest securities based on acombination of their market cap and current index membership.
Russell 2000 Index is an unmanaged index comprised of 2,000 stocks of U.S. companieswith small market capitalization.
Russell 3000 Index measures the performance of the largest 3000 U.S. companiesrepresenting approximately 98% of the investable U.S. equity market.
19 CHAMPLAIN INVESTMENT PARTNERS
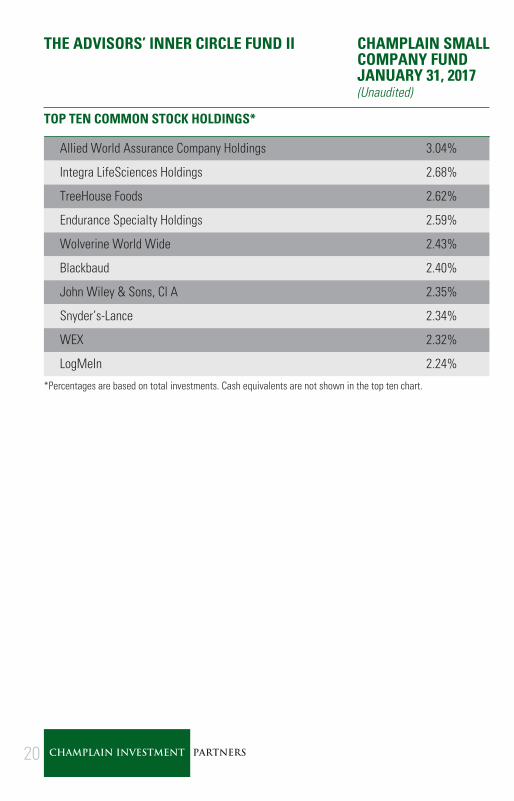
THE ADVISORS’ INNER CIRCLE FUND II CHAMPLAIN SMALLCOMPANY FUNDJANUARY 31, 2017(Unaudited)
TOP TEN COMMON STOCK HOLDINGS*
Allied World Assurance Company Holdings 3.04%
Integra LifeSciences Holdings 2.68%
TreeHouse Foods 2.62%
Endurance Specialty Holdings 2.59%
Wolverine World Wide 2.43%
Blackbaud 2.40%
John Wiley & Sons, Cl A 2.35%
Snyder’s-Lance 2.34%
WEX 2.32%
LogMeIn 2.24%
*Percentages are based on total investments. Cash equivalents are not shown in the top ten chart.
20 CHAMPLAIN INVESTMENT PARTNERS
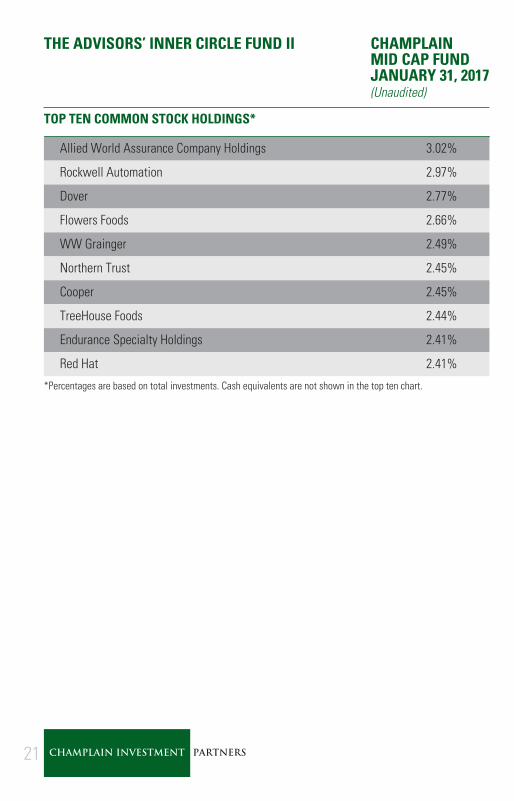
THE ADVISORS’ INNER CIRCLE FUND II CHAMPLAINMID CAP FUNDJANUARY 31, 2017(Unaudited)
TOP TEN COMMON STOCK HOLDINGS*
Allied World Assurance Company Holdings 3.02%
Rockwell Automation 2.97%
Dover 2.77%
Flowers Foods 2.66%
WW Grainger 2.49%
Northern Trust 2.45%
Cooper 2.45%
TreeHouse Foods 2.44%
Endurance Specialty Holdings 2.41%
Red Hat 2.41%
*Percentages are based on total investments. Cash equivalents are not shown in the top ten chart.
21 CHAMPLAIN INVESTMENT PARTNERS

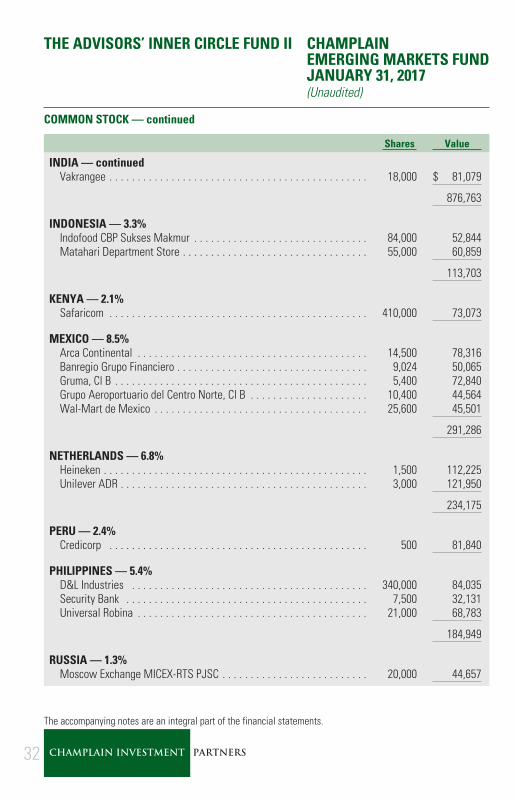
THE ADVISORS’ INNER CIRCLE FUND II CHAMPLAINEMERGING MARKETS FUNDJANUARY 31, 2017(Unaudited)
TOP TEN COMMON STOCK HOLDINGS*
Housing Development Finance 4.70%
Tencent Holdings 4.40%
Unilever ADR 3.60%
Heineken 3.32%
Alibaba Group Holding ADR 3.29%
HDFC Bank 3.08%
Amorepacific 2.98%
AIA Group 2.73%
D&L Industries 2.48%
Thai Beverage 2.45%
*Percentages are based on total investments. Cash equivalents are not shown in the top ten chart.
22 CHAMPLAIN INVESTMENT PARTNERS
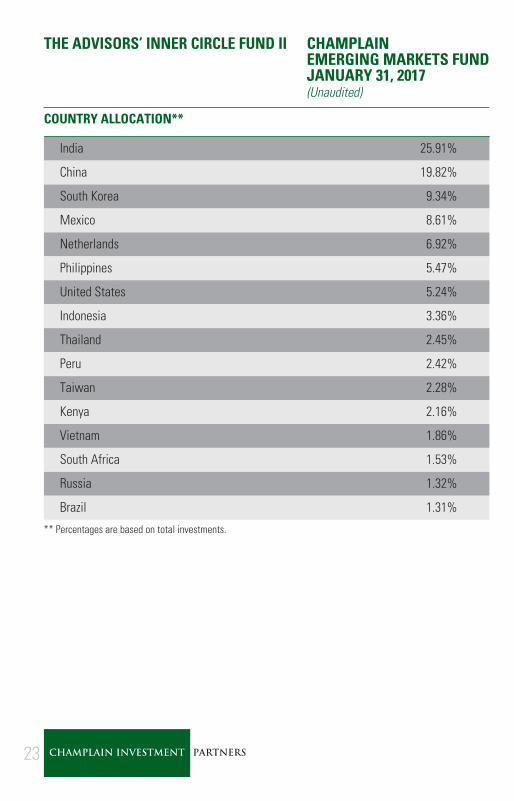
THE ADVISORS’ INNER CIRCLE FUND II CHAMPLAINEMERGING MARKETS FUNDJANUARY 31, 2017(Unaudited)
COUNTRY ALLOCATION**
India 25.91%
China 19.82%
South Korea 9.34%
Mexico 8.61%
Netherlands 6.92%
Philippines 5.47%
United States 5.24%
Indonesia 3.36%
Thailand 2.45%
Peru 2.42%
Taiwan 2.28%
Kenya 2.16%
Vietnam 1.86%
South Africa 1.53%
Russia 1.32%
Brazil 1.31%
** Percentages are based on total investments.
23 CHAMPLAIN INVESTMENT PARTNERS

THE ADVISORS’ INNER CIRCLE FUND II CHAMPLAINSMALL COMPANY FUNDJANUARY 31, 2017(Unaudited)
SECTOR WEIGHTINGS†:21.2% Financials
18.0% Health Care17.2% Information Technology
16.6% Industrials10.4% Consumer Staples
9.0% Consumer Discretionary4.2% Materials
1.8% Energy1.6% Cash Equivalents
† Percentages are based on total investments.
SCHEDULE OF INVESTMENTSCOMMON STOCK — 97.4%
Shares Value
CONSUMER DISCRETIONARY — 8.9%Buffalo Wild Wings* . . . . . . . . . . . . . . . . . . . . . . . . . . . . . . . . . 90,000 $ 13,590,000CST Brands . . . . . . . . . . . . . . . . . . . . . . . . . . . . . . . . . . . . . . . . 184,000 8,865,120El Pollo Loco Holdings* . . . . . . . . . . . . . . . . . . . . . . . . . . . . . . . 425,000 5,291,250Helen of Troy* . . . . . . . . . . . . . . . . . . . . . . . . . . . . . . . . . . . . . . 168,500 15,721,050Hibbett Sports* . . . . . . . . . . . . . . . . . . . . . . . . . . . . . . . . . . . . . 250,000 8,250,000John Wiley & Sons, Cl A . . . . . . . . . . . . . . . . . . . . . . . . . . . . . . 525,000 28,927,500Wolverine World Wide . . . . . . . . . . . . . . . . . . . . . . . . . . . . . . . 1,275,000 29,949,750
110,594,670
CONSUMER STAPLES — 10.3%AdvancePierre Foods Holdings . . . . . . . . . . . . . . . . . . . . . . . . . . 750,000 20,782,500Amplify Snack Brands* . . . . . . . . . . . . . . . . . . . . . . . . . . . . . . . 400,000 3,852,000B&G Foods . . . . . . . . . . . . . . . . . . . . . . . . . . . . . . . . . . . . . . . . . 450,000 19,957,500Boston Beer, Cl A* . . . . . . . . . . . . . . . . . . . . . . . . . . . . . . . . . . . 96,500 14,832,050J&J Snack Foods . . . . . . . . . . . . . . . . . . . . . . . . . . . . . . . . . . . . 60,000 7,654,200Snyder’s-Lance . . . . . . . . . . . . . . . . . . . . . . . . . . . . . . . . . . . . . 750,000 28,785,000TreeHouse Foods* . . . . . . . . . . . . . . . . . . . . . . . . . . . . . . . . . . . 425,000 32,249,000
128,112,250
ENERGY — 1.7%Denbury Resources* . . . . . . . . . . . . . . . . . . . . . . . . . . . . . . . . . 1,550,000 5,192,500Forum Energy Technologies* . . . . . . . . . . . . . . . . . . . . . . . . . . . 750,000 16,275,000
21,467,500
The accompanying notes are an integral part of the financial statements.
24 CHAMPLAIN INVESTMENT PARTNERS
THE ADVISORS’ INNER CIRCLE FUND II CHAMPLAINSMALL COMPANY FUNDJANUARY 31, 2017(Unaudited)
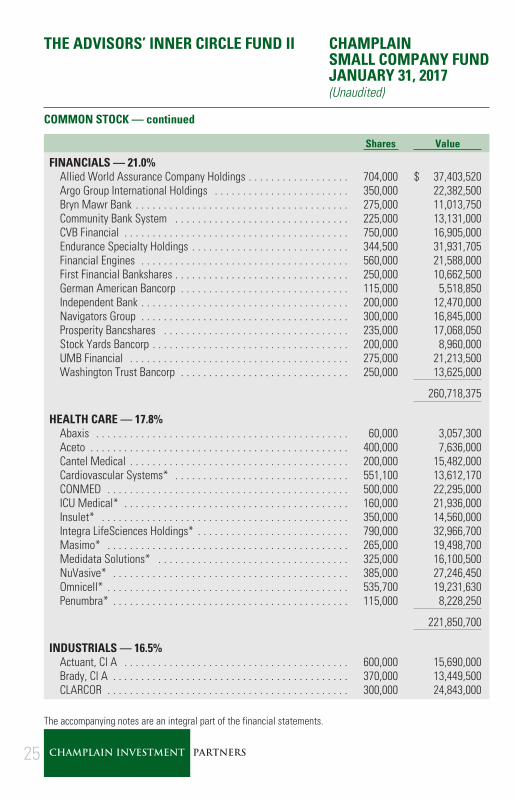
COMMON STOCK — continued
Shares Value
FINANCIALS — 21.0%Allied World Assurance Company Holdings . . . . . . . . . . . . . . . . . . 704,000 $ 37,403,520Argo Group International Holdings . . . . . . . . . . . . . . . . . . . . . . . . 350,000 22,382,500Bryn Mawr Bank . . . . . . . . . . . . . . . . . . . . . . . . . . . . . . . . . . . . . . 275,000 11,013,750Community Bank System . . . . . . . . . . . . . . . . . . . . . . . . . . . . . . . 225,000 13,131,000CVB Financial . . . . . . . . . . . . . . . . . . . . . . . . . . . . . . . . . . . . . . . . 750,000 16,905,000Endurance Specialty Holdings . . . . . . . . . . . . . . . . . . . . . . . . . . . . 344,500 31,931,705Financial Engines . . . . . . . . . . . . . . . . . . . . . . . . . . . . . . . . . . . . . 560,000 21,588,000First Financial Bankshares . . . . . . . . . . . . . . . . . . . . . . . . . . . . . . . 250,000 10,662,500German American Bancorp . . . . . . . . . . . . . . . . . . . . . . . . . . . . . . 115,000 5,518,850Independent Bank . . . . . . . . . . . . . . . . . . . . . . . . . . . . . . . . . . . . . 200,000 12,470,000Navigators Group . . . . . . . . . . . . . . . . . . . . . . . . . . . . . . . . . . . . . 300,000 16,845,000Prosperity Bancshares . . . . . . . . . . . . . . . . . . . . . . . . . . . . . . . . . 235,000 17,068,050Stock Yards Bancorp . . . . . . . . . . . . . . . . . . . . . . . . . . . . . . . . . . . 200,000 8,960,000UMB Financial . . . . . . . . . . . . . . . . . . . . . . . . . . . . . . . . . . . . . . . 275,000 21,213,500Washington Trust Bancorp . . . . . . . . . . . . . . . . . . . . . . . . . . . . . . 250,000 13,625,000
260,718,375
HEALTH CARE — 17.8%Abaxis . . . . . . . . . . . . . . . . . . . . . . . . . . . . . . . . . . . . . . . . . . . . . 60,000 3,057,300Aceto . . . . . . . . . . . . . . . . . . . . . . . . . . . . . . . . . . . . . . . . . . . . . . 400,000 7,636,000Cantel Medical . . . . . . . . . . . . . . . . . . . . . . . . . . . . . . . . . . . . . . . 200,000 15,482,000Cardiovascular Systems* . . . . . . . . . . . . . . . . . . . . . . . . . . . . . . . 551,100 13,612,170CONMED . . . . . . . . . . . . . . . . . . . . . . . . . . . . . . . . . . . . . . . . . . . 500,000 22,295,000ICU Medical* . . . . . . . . . . . . . . . . . . . . . . . . . . . . . . . . . . . . . . . . 160,000 21,936,000Insulet* . . . . . . . . . . . . . . . . . . . . . . . . . . . . . . . . . . . . . . . . . . . . 350,000 14,560,000Integra LifeSciences Holdings* . . . . . . . . . . . . . . . . . . . . . . . . . . . 790,000 32,966,700Masimo* . . . . . . . . . . . . . . . . . . . . . . . . . . . . . . . . . . . . . . . . . . . 265,000 19,498,700Medidata Solutions* . . . . . . . . . . . . . . . . . . . . . . . . . . . . . . . . . . 325,000 16,100,500NuVasive* . . . . . . . . . . . . . . . . . . . . . . . . . . . . . . . . . . . . . . . . . . 385,000 27,246,450Omnicell* . . . . . . . . . . . . . . . . . . . . . . . . . . . . . . . . . . . . . . . . . . . 535,700 19,231,630Penumbra* . . . . . . . . . . . . . . . . . . . . . . . . . . . . . . . . . . . . . . . . . . 115,000 8,228,250
221,850,700
INDUSTRIALS — 16.5%Actuant, Cl A . . . . . . . . . . . . . . . . . . . . . . . . . . . . . . . . . . . . . . . . 600,000 15,690,000Brady, Cl A . . . . . . . . . . . . . . . . . . . . . . . . . . . . . . . . . . . . . . . . . . 370,000 13,449,500CLARCOR . . . . . . . . . . . . . . . . . . . . . . . . . . . . . . . . . . . . . . . . . . . 300,000 24,843,000
The accompanying notes are an integral part of the financial statements.
25 CHAMPLAIN INVESTMENT PARTNERS
THE ADVISORS’ INNER CIRCLE FUND II CHAMPLAINSMALL COMPANY FUNDJANUARY 31, 2017(Unaudited)
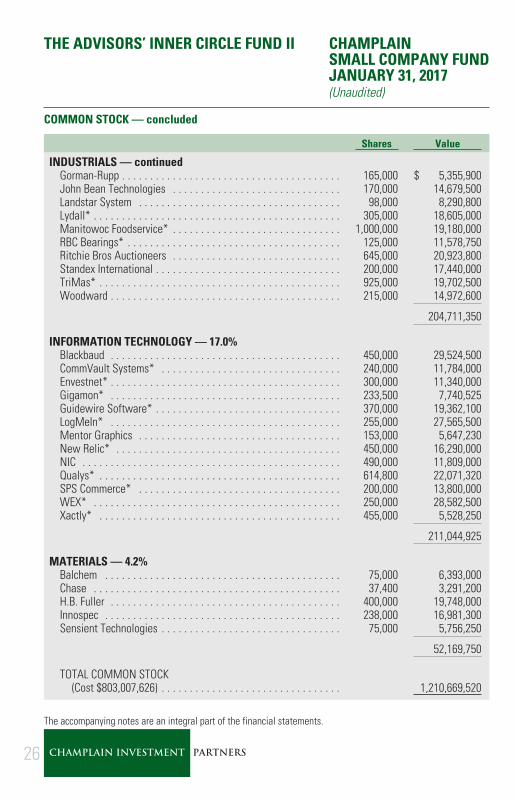
COMMON STOCK — concluded
Shares Value
INDUSTRIALS — continuedGorman-Rupp . . . . . . . . . . . . . . . . . . . . . . . . . . . . . . . . . . . . . . . 165,000 $ 5,355,900John Bean Technologies . . . . . . . . . . . . . . . . . . . . . . . . . . . . . . 170,000 14,679,500Landstar System . . . . . . . . . . . . . . . . . . . . . . . . . . . . . . . . . . . . 98,000 8,290,800Lydall* . . . . . . . . . . . . . . . . . . . . . . . . . . . . . . . . . . . . . . . . . . . . 305,000 18,605,000Manitowoc Foodservice* . . . . . . . . . . . . . . . . . . . . . . . . . . . . . . 1,000,000 19,180,000RBC Bearings* . . . . . . . . . . . . . . . . . . . . . . . . . . . . . . . . . . . . . . 125,000 11,578,750Ritchie Bros Auctioneers . . . . . . . . . . . . . . . . . . . . . . . . . . . . . . 645,000 20,923,800Standex International . . . . . . . . . . . . . . . . . . . . . . . . . . . . . . . . . 200,000 17,440,000TriMas* . . . . . . . . . . . . . . . . . . . . . . . . . . . . . . . . . . . . . . . . . . . 925,000 19,702,500Woodward . . . . . . . . . . . . . . . . . . . . . . . . . . . . . . . . . . . . . . . . . 215,000 14,972,600
204,711,350
INFORMATION TECHNOLOGY — 17.0%Blackbaud . . . . . . . . . . . . . . . . . . . . . . . . . . . . . . . . . . . . . . . . . 450,000 29,524,500CommVault Systems* . . . . . . . . . . . . . . . . . . . . . . . . . . . . . . . . 240,000 11,784,000Envestnet* . . . . . . . . . . . . . . . . . . . . . . . . . . . . . . . . . . . . . . . . . 300,000 11,340,000Gigamon* . . . . . . . . . . . . . . . . . . . . . . . . . . . . . . . . . . . . . . . . . 233,500 7,740,525Guidewire Software* . . . . . . . . . . . . . . . . . . . . . . . . . . . . . . . . . 370,000 19,362,100LogMeIn* . . . . . . . . . . . . . . . . . . . . . . . . . . . . . . . . . . . . . . . . . 255,000 27,565,500Mentor Graphics . . . . . . . . . . . . . . . . . . . . . . . . . . . . . . . . . . . . 153,000 5,647,230New Relic* . . . . . . . . . . . . . . . . . . . . . . . . . . . . . . . . . . . . . . . . 450,000 16,290,000NIC . . . . . . . . . . . . . . . . . . . . . . . . . . . . . . . . . . . . . . . . . . . . . . 490,000 11,809,000Qualys* . . . . . . . . . . . . . . . . . . . . . . . . . . . . . . . . . . . . . . . . . . . 614,800 22,071,320SPS Commerce* . . . . . . . . . . . . . . . . . . . . . . . . . . . . . . . . . . . . 200,000 13,800,000WEX* . . . . . . . . . . . . . . . . . . . . . . . . . . . . . . . . . . . . . . . . . . . . 250,000 28,582,500Xactly* . . . . . . . . . . . . . . . . . . . . . . . . . . . . . . . . . . . . . . . . . . . 455,000 5,528,250
211,044,925
MATERIALS — 4.2%Balchem . . . . . . . . . . . . . . . . . . . . . . . . . . . . . . . . . . . . . . . . . . 75,000 6,393,000Chase . . . . . . . . . . . . . . . . . . . . . . . . . . . . . . . . . . . . . . . . . . . . 37,400 3,291,200H.B. Fuller . . . . . . . . . . . . . . . . . . . . . . . . . . . . . . . . . . . . . . . . . 400,000 19,748,000Innospec . . . . . . . . . . . . . . . . . . . . . . . . . . . . . . . . . . . . . . . . . . 238,000 16,981,300Sensient Technologies . . . . . . . . . . . . . . . . . . . . . . . . . . . . . . . . 75,000 5,756,250
52,169,750
TOTAL COMMON STOCK(Cost $803,007,626) . . . . . . . . . . . . . . . . . . . . . . . . . . . . . . . . 1,210,669,520
The accompanying notes are an integral part of the financial statements.
26 CHAMPLAIN INVESTMENT PARTNERS
THE ADVISORS’ INNER CIRCLE FUND II CHAMPLAINSMALL COMPANY FUNDJANUARY 31, 2017(Unaudited)
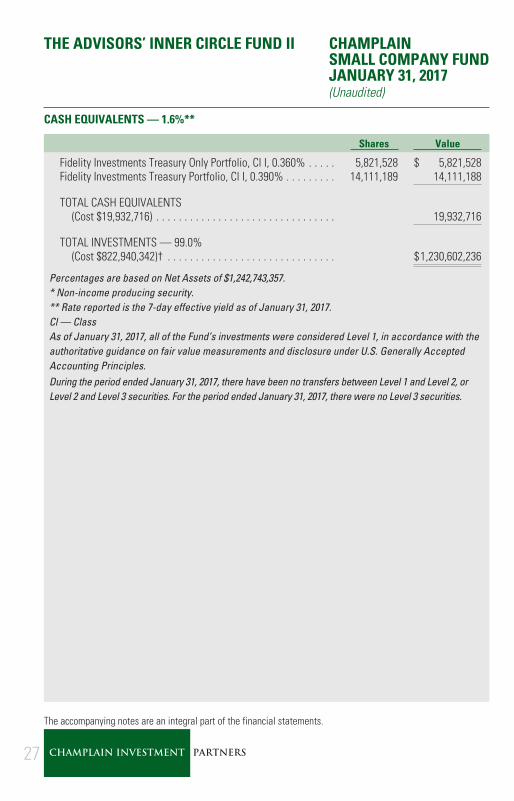
CASH EQUIVALENTS — 1.6%**
Shares Value
Fidelity Investments Treasury Only Portfolio, Cl I, 0.360% . . . . . 5,821,528 $ 5,821,528Fidelity Investments Treasury Portfolio, Cl I, 0.390% . . . . . . . . . 14,111,189 14,111,188
TOTAL CASH EQUIVALENTS(Cost $19,932,716) . . . . . . . . . . . . . . . . . . . . . . . . . . . . . . . . 19,932,716
TOTAL INVESTMENTS — 99.0%(Cost $822,940,342)† . . . . . . . . . . . . . . . . . . . . . . . . . . . . . . $1,230,602,236
Percentages are based on Net Assets of $1,242,743,357.* Non-income producing security.** Rate reported is the 7-day effective yield as of January 31, 2017.Cl — ClassAs of January 31, 2017, all of the Fund’s investments were considered Level 1, in accordance with theauthoritative guidance on fair value measurements and disclosure under U.S. Generally AcceptedAccounting Principles.During the period ended January 31, 2017, there have been no transfers between Level 1 and Level 2, orLevel 2 and Level 3 securities. For the period ended January 31, 2017, there were no Level 3 securities.
The accompanying notes are an integral part of the financial statements.
27 CHAMPLAIN INVESTMENT PARTNERS
THE ADVISORS’ INNER CIRCLE FUND II CHAMPLAINMID CAP FUNDJANUARY 31, 2017(Unaudited)
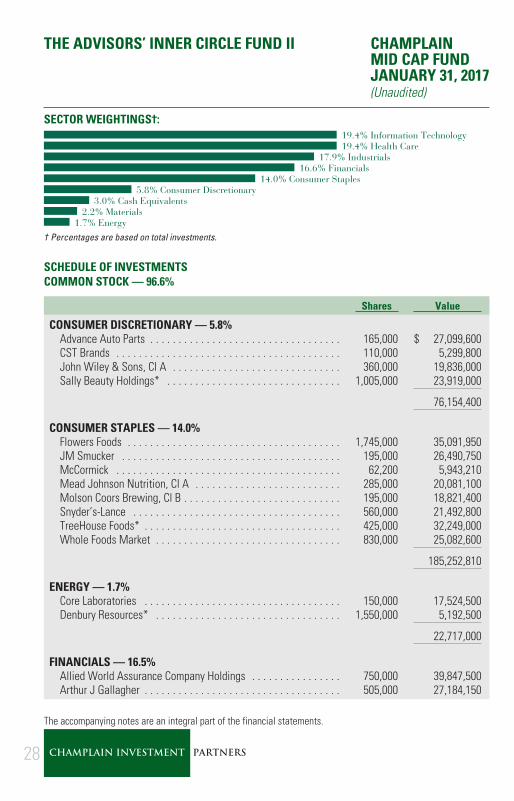
SECTOR WEIGHTINGS†:19.4% Information Technology19.4% Health Care
17.9% Industrials16.6% Financials
14.0% Consumer Staples5.8% Consumer Discretionary
3.0% Cash Equivalents2.2% Materials
1.7% Energy
† Percentages are based on total investments.
SCHEDULE OF INVESTMENTSCOMMON STOCK — 96.6%
Shares Value
CONSUMER DISCRETIONARY — 5.8%Advance Auto Parts . . . . . . . . . . . . . . . . . . . . . . . . . . . . . . . . . . 165,000 $ 27,099,600CST Brands . . . . . . . . . . . . . . . . . . . . . . . . . . . . . . . . . . . . . . . . 110,000 5,299,800John Wiley & Sons, Cl A . . . . . . . . . . . . . . . . . . . . . . . . . . . . . . 360,000 19,836,000Sally Beauty Holdings* . . . . . . . . . . . . . . . . . . . . . . . . . . . . . . . 1,005,000 23,919,000
76,154,400
CONSUMER STAPLES — 14.0%Flowers Foods . . . . . . . . . . . . . . . . . . . . . . . . . . . . . . . . . . . . . . 1,745,000 35,091,950JM Smucker . . . . . . . . . . . . . . . . . . . . . . . . . . . . . . . . . . . . . . . 195,000 26,490,750McCormick . . . . . . . . . . . . . . . . . . . . . . . . . . . . . . . . . . . . . . . . 62,200 5,943,210Mead Johnson Nutrition, Cl A . . . . . . . . . . . . . . . . . . . . . . . . . . 285,000 20,081,100Molson Coors Brewing, Cl B . . . . . . . . . . . . . . . . . . . . . . . . . . . . 195,000 18,821,400Snyder’s-Lance . . . . . . . . . . . . . . . . . . . . . . . . . . . . . . . . . . . . . 560,000 21,492,800TreeHouse Foods* . . . . . . . . . . . . . . . . . . . . . . . . . . . . . . . . . . . 425,000 32,249,000Whole Foods Market . . . . . . . . . . . . . . . . . . . . . . . . . . . . . . . . . 830,000 25,082,600
185,252,810
ENERGY — 1.7%Core Laboratories . . . . . . . . . . . . . . . . . . . . . . . . . . . . . . . . . . . 150,000 17,524,500Denbury Resources* . . . . . . . . . . . . . . . . . . . . . . . . . . . . . . . . . 1,550,000 5,192,500
22,717,000
FINANCIALS — 16.5%Allied World Assurance Company Holdings . . . . . . . . . . . . . . . . 750,000 39,847,500Arthur J Gallagher . . . . . . . . . . . . . . . . . . . . . . . . . . . . . . . . . . . 505,000 27,184,150
The accompanying notes are an integral part of the financial statements.
28 CHAMPLAIN INVESTMENT PARTNERS
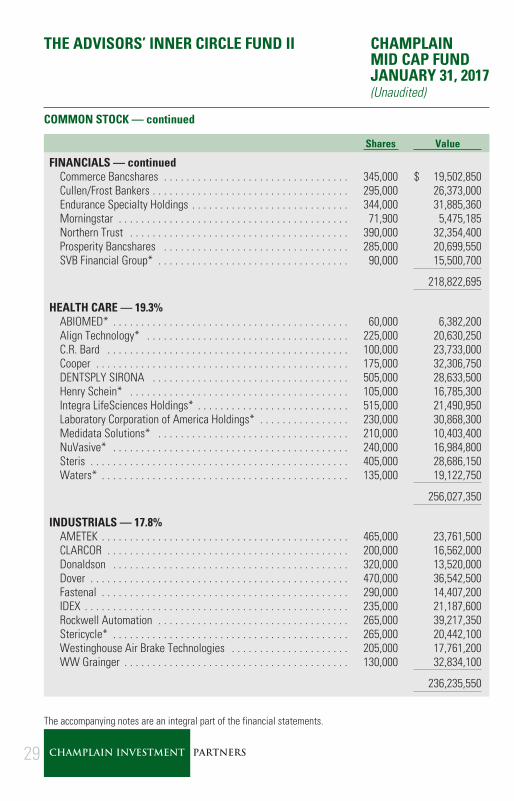
THE ADVISORS’ INNER CIRCLE FUND II CHAMPLAINMID CAP FUNDJANUARY 31, 2017(Unaudited)
COMMON STOCK — continued
Shares Value
FINANCIALS — continuedCommerce Bancshares . . . . . . . . . . . . . . . . . . . . . . . . . . . . . . . . . 345,000 $ 19,502,850Cullen/Frost Bankers . . . . . . . . . . . . . . . . . . . . . . . . . . . . . . . . . . . 295,000 26,373,000Endurance Specialty Holdings . . . . . . . . . . . . . . . . . . . . . . . . . . . . 344,000 31,885,360Morningstar . . . . . . . . . . . . . . . . . . . . . . . . . . . . . . . . . . . . . . . . . 71,900 5,475,185Northern Trust . . . . . . . . . . . . . . . . . . . . . . . . . . . . . . . . . . . . . . . 390,000 32,354,400Prosperity Bancshares . . . . . . . . . . . . . . . . . . . . . . . . . . . . . . . . . 285,000 20,699,550SVB Financial Group* . . . . . . . . . . . . . . . . . . . . . . . . . . . . . . . . . . 90,000 15,500,700
218,822,695
HEALTH CARE — 19.3%ABIOMED* . . . . . . . . . . . . . . . . . . . . . . . . . . . . . . . . . . . . . . . . . . 60,000 6,382,200Align Technology* . . . . . . . . . . . . . . . . . . . . . . . . . . . . . . . . . . . . 225,000 20,630,250C.R. Bard . . . . . . . . . . . . . . . . . . . . . . . . . . . . . . . . . . . . . . . . . . . 100,000 23,733,000Cooper . . . . . . . . . . . . . . . . . . . . . . . . . . . . . . . . . . . . . . . . . . . . . 175,000 32,306,750DENTSPLY SIRONA . . . . . . . . . . . . . . . . . . . . . . . . . . . . . . . . . . . 505,000 28,633,500Henry Schein* . . . . . . . . . . . . . . . . . . . . . . . . . . . . . . . . . . . . . . . 105,000 16,785,300Integra LifeSciences Holdings* . . . . . . . . . . . . . . . . . . . . . . . . . . . 515,000 21,490,950Laboratory Corporation of America Holdings* . . . . . . . . . . . . . . . . 230,000 30,868,300Medidata Solutions* . . . . . . . . . . . . . . . . . . . . . . . . . . . . . . . . . . 210,000 10,403,400NuVasive* . . . . . . . . . . . . . . . . . . . . . . . . . . . . . . . . . . . . . . . . . . 240,000 16,984,800Steris . . . . . . . . . . . . . . . . . . . . . . . . . . . . . . . . . . . . . . . . . . . . . . 405,000 28,686,150Waters* . . . . . . . . . . . . . . . . . . . . . . . . . . . . . . . . . . . . . . . . . . . . 135,000 19,122,750
256,027,350
INDUSTRIALS — 17.8%AMETEK . . . . . . . . . . . . . . . . . . . . . . . . . . . . . . . . . . . . . . . . . . . . 465,000 23,761,500CLARCOR . . . . . . . . . . . . . . . . . . . . . . . . . . . . . . . . . . . . . . . . . . . 200,000 16,562,000Donaldson . . . . . . . . . . . . . . . . . . . . . . . . . . . . . . . . . . . . . . . . . . 320,000 13,520,000Dover . . . . . . . . . . . . . . . . . . . . . . . . . . . . . . . . . . . . . . . . . . . . . . 470,000 36,542,500Fastenal . . . . . . . . . . . . . . . . . . . . . . . . . . . . . . . . . . . . . . . . . . . . 290,000 14,407,200IDEX . . . . . . . . . . . . . . . . . . . . . . . . . . . . . . . . . . . . . . . . . . . . . . . 235,000 21,187,600Rockwell Automation . . . . . . . . . . . . . . . . . . . . . . . . . . . . . . . . . . 265,000 39,217,350Stericycle* . . . . . . . . . . . . . . . . . . . . . . . . . . . . . . . . . . . . . . . . . . 265,000 20,442,100Westinghouse Air Brake Technologies . . . . . . . . . . . . . . . . . . . . . 205,000 17,761,200WW Grainger . . . . . . . . . . . . . . . . . . . . . . . . . . . . . . . . . . . . . . . . 130,000 32,834,100
236,235,550
The accompanying notes are an integral part of the financial statements.
29 CHAMPLAIN INVESTMENT PARTNERS
THE ADVISORS’ INNER CIRCLE FUND II CHAMPLAINMID CAP FUNDJANUARY 31, 2017(Unaudited)
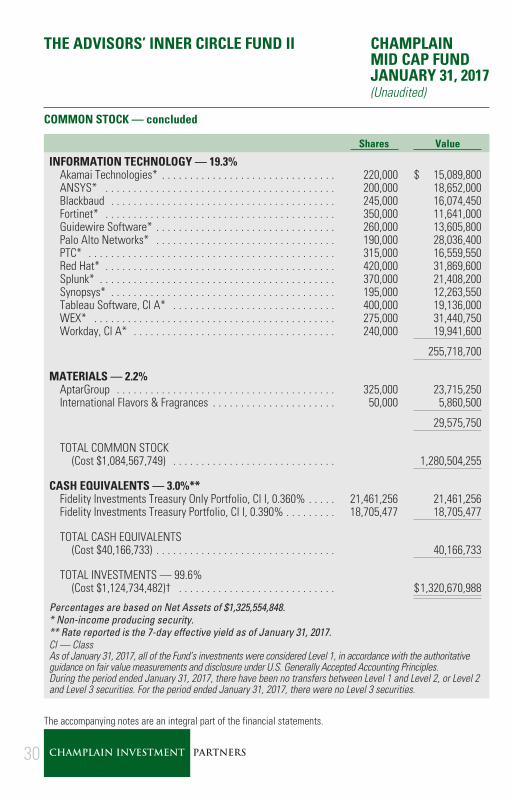
COMMON STOCK — concluded
Shares Value
INFORMATION TECHNOLOGY — 19.3%Akamai Technologies* . . . . . . . . . . . . . . . . . . . . . . . . . . . . . . . 220,000 $ 15,089,800ANSYS* . . . . . . . . . . . . . . . . . . . . . . . . . . . . . . . . . . . . . . . . . 200,000 18,652,000Blackbaud . . . . . . . . . . . . . . . . . . . . . . . . . . . . . . . . . . . . . . . . 245,000 16,074,450Fortinet* . . . . . . . . . . . . . . . . . . . . . . . . . . . . . . . . . . . . . . . . . 350,000 11,641,000Guidewire Software* . . . . . . . . . . . . . . . . . . . . . . . . . . . . . . . . 260,000 13,605,800Palo Alto Networks* . . . . . . . . . . . . . . . . . . . . . . . . . . . . . . . . 190,000 28,036,400PTC* . . . . . . . . . . . . . . . . . . . . . . . . . . . . . . . . . . . . . . . . . . . . 315,000 16,559,550Red Hat* . . . . . . . . . . . . . . . . . . . . . . . . . . . . . . . . . . . . . . . . . 420,000 31,869,600Splunk* . . . . . . . . . . . . . . . . . . . . . . . . . . . . . . . . . . . . . . . . . . 370,000 21,408,200Synopsys* . . . . . . . . . . . . . . . . . . . . . . . . . . . . . . . . . . . . . . . . 195,000 12,263,550Tableau Software, Cl A* . . . . . . . . . . . . . . . . . . . . . . . . . . . . . 400,000 19,136,000WEX* . . . . . . . . . . . . . . . . . . . . . . . . . . . . . . . . . . . . . . . . . . . 275,000 31,440,750Workday, Cl A* . . . . . . . . . . . . . . . . . . . . . . . . . . . . . . . . . . . . 240,000 19,941,600
255,718,700
MATERIALS — 2.2%AptarGroup . . . . . . . . . . . . . . . . . . . . . . . . . . . . . . . . . . . . . . . 325,000 23,715,250International Flavors & Fragrances . . . . . . . . . . . . . . . . . . . . . . 50,000 5,860,500
29,575,750
TOTAL COMMON STOCK(Cost $1,084,567,749) . . . . . . . . . . . . . . . . . . . . . . . . . . . . . 1,280,504,255
CASH EQUIVALENTS — 3.0%**Fidelity Investments Treasury Only Portfolio, Cl I, 0.360% . . . . . 21,461,256 21,461,256Fidelity Investments Treasury Portfolio, Cl I, 0.390% . . . . . . . . . 18,705,477 18,705,477
TOTAL CASH EQUIVALENTS(Cost $40,166,733) . . . . . . . . . . . . . . . . . . . . . . . . . . . . . . . . 40,166,733
TOTAL INVESTMENTS — 99.6%(Cost $1,124,734,482)† . . . . . . . . . . . . . . . . . . . . . . . . . . . . $1,320,670,988
Percentages are based on Net Assets of $1,325,554,848.* Non-income producing security.** Rate reported is the 7-day effective yield as of January 31, 2017.Cl — ClassAs of January 31, 2017, all of the Fund’s investments were considered Level 1, in accordance with the authoritativeguidance on fair value measurements and disclosure under U.S. Generally Accepted Accounting Principles.During the period ended January 31, 2017, there have been no transfers between Level 1 and Level 2, or Level 2and Level 3 securities. For the period ended January 31, 2017, there were no Level 3 securities.
The accompanying notes are an integral part of the financial statements.
30 CHAMPLAIN INVESTMENT PARTNERS
THE ADVISORS’ INNER CIRCLE FUND II CHAMPLAINEMERGING MARKETS FUNDJANUARY 31, 2017(Unaudited)
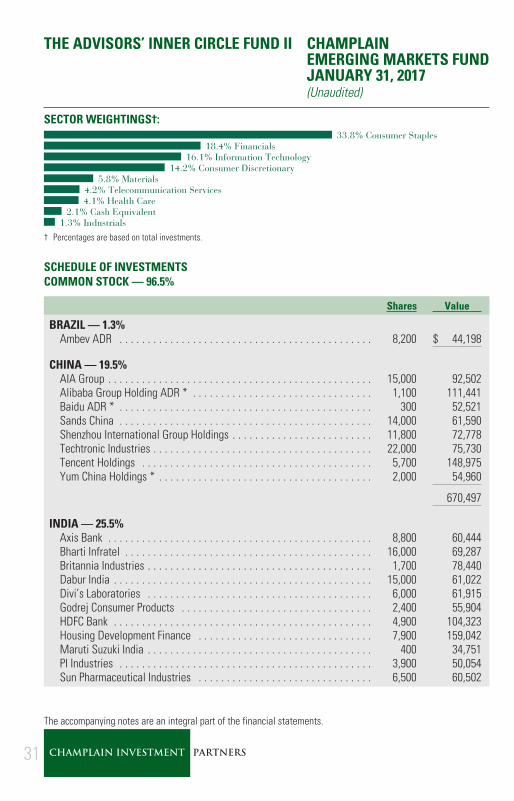
SECTOR WEIGHTINGS†:33.8% Consumer Staples
18.4% Financials16.1% Information Technology
14.2% Consumer Discretionary5.8% Materials
4.2% Telecommunication Services4.1% Health Care
2.1% Cash Equivalent1.3% Industrials
† Percentages are based on total investments.
SCHEDULE OF INVESTMENTSCOMMON STOCK — 96.5%
Shares Value
BRAZIL — 1.3%Ambev ADR . . . . . . . . . . . . . . . . . . . . . . . . . . . . . . . . . . . . . . . . . . . . . 8,200 $ 44,198
CHINA — 19.5%AIA Group . . . . . . . . . . . . . . . . . . . . . . . . . . . . . . . . . . . . . . . . . . . . . . . 15,000 92,502Alibaba Group Holding ADR * . . . . . . . . . . . . . . . . . . . . . . . . . . . . . . . . 1,100 111,441Baidu ADR * . . . . . . . . . . . . . . . . . . . . . . . . . . . . . . . . . . . . . . . . . . . . . 300 52,521Sands China . . . . . . . . . . . . . . . . . . . . . . . . . . . . . . . . . . . . . . . . . . . . . 14,000 61,590Shenzhou International Group Holdings . . . . . . . . . . . . . . . . . . . . . . . . . 11,800 72,778Techtronic Industries . . . . . . . . . . . . . . . . . . . . . . . . . . . . . . . . . . . . . . . 22,000 75,730Tencent Holdings . . . . . . . . . . . . . . . . . . . . . . . . . . . . . . . . . . . . . . . . . 5,700 148,975Yum China Holdings * . . . . . . . . . . . . . . . . . . . . . . . . . . . . . . . . . . . . . . 2,000 54,960
670,497
INDIA — 25.5%Axis Bank . . . . . . . . . . . . . . . . . . . . . . . . . . . . . . . . . . . . . . . . . . . . . . . 8,800 60,444Bharti Infratel . . . . . . . . . . . . . . . . . . . . . . . . . . . . . . . . . . . . . . . . . . . . 16,000 69,287Britannia Industries . . . . . . . . . . . . . . . . . . . . . . . . . . . . . . . . . . . . . . . . 1,700 78,440Dabur India . . . . . . . . . . . . . . . . . . . . . . . . . . . . . . . . . . . . . . . . . . . . . . 15,000 61,022Divi’s Laboratories . . . . . . . . . . . . . . . . . . . . . . . . . . . . . . . . . . . . . . . . 6,000 61,915Godrej Consumer Products . . . . . . . . . . . . . . . . . . . . . . . . . . . . . . . . . . 2,400 55,904HDFC Bank . . . . . . . . . . . . . . . . . . . . . . . . . . . . . . . . . . . . . . . . . . . . . . 4,900 104,323Housing Development Finance . . . . . . . . . . . . . . . . . . . . . . . . . . . . . . . 7,900 159,042Maruti Suzuki India . . . . . . . . . . . . . . . . . . . . . . . . . . . . . . . . . . . . . . . . 400 34,751PI Industries . . . . . . . . . . . . . . . . . . . . . . . . . . . . . . . . . . . . . . . . . . . . . 3,900 50,054Sun Pharmaceutical Industries . . . . . . . . . . . . . . . . . . . . . . . . . . . . . . . 6,500 60,502
The accompanying notes are an integral part of the financial statements.
31 CHAMPLAIN INVESTMENT PARTNERS
THE ADVISORS’ INNER CIRCLE FUND II CHAMPLAINEMERGING MARKETS FUNDJANUARY 31, 2017(Unaudited)
COMMON STOCK — continued
Shares Value
INDIA — continuedVakrangee . . . . . . . . . . . . . . . . . . . . . . . . . . . . . . . . . . . . . . . . . . . . . . 18,000 $ 81,079
876,763
INDONESIA — 3.3%Indofood CBP Sukses Makmur . . . . . . . . . . . . . . . . . . . . . . . . . . . . . . . 84,000 52,844Matahari Department Store . . . . . . . . . . . . . . . . . . . . . . . . . . . . . . . . . 55,000 60,859
113,703
KENYA — 2.1%Safaricom . . . . . . . . . . . . . . . . . . . . . . . . . . . . . . . . . . . . . . . . . . . . . . 410,000 73,073
MEXICO — 8.5%Arca Continental . . . . . . . . . . . . . . . . . . . . . . . . . . . . . . . . . . . . . . . . . 14,500 78,316Banregio Grupo Financiero . . . . . . . . . . . . . . . . . . . . . . . . . . . . . . . . . . 9,024 50,065Gruma, Cl B . . . . . . . . . . . . . . . . . . . . . . . . . . . . . . . . . . . . . . . . . . . . . 5,400 72,840Grupo Aeroportuario del Centro Norte, Cl B . . . . . . . . . . . . . . . . . . . . . 10,400 44,564Wal-Mart de Mexico . . . . . . . . . . . . . . . . . . . . . . . . . . . . . . . . . . . . . . 25,600 45,501
291,286
NETHERLANDS — 6.8%Heineken . . . . . . . . . . . . . . . . . . . . . . . . . . . . . . . . . . . . . . . . . . . . . . . 1,500 112,225Unilever ADR . . . . . . . . . . . . . . . . . . . . . . . . . . . . . . . . . . . . . . . . . . . . 3,000 121,950
234,175
PERU — 2.4%Credicorp . . . . . . . . . . . . . . . . . . . . . . . . . . . . . . . . . . . . . . . . . . . . . . 500 81,840
PHILIPPINES — 5.4%D&L Industries . . . . . . . . . . . . . . . . . . . . . . . . . . . . . . . . . . . . . . . . . . 340,000 84,035Security Bank . . . . . . . . . . . . . . . . . . . . . . . . . . . . . . . . . . . . . . . . . . . 7,500 32,131Universal Robina . . . . . . . . . . . . . . . . . . . . . . . . . . . . . . . . . . . . . . . . . 21,000 68,783
184,949
RUSSIA — 1.3%Moscow Exchange MICEX-RTS PJSC . . . . . . . . . . . . . . . . . . . . . . . . . . 20,000 44,657
The accompanying notes are an integral part of the financial statements.
32 CHAMPLAIN INVESTMENT PARTNERS
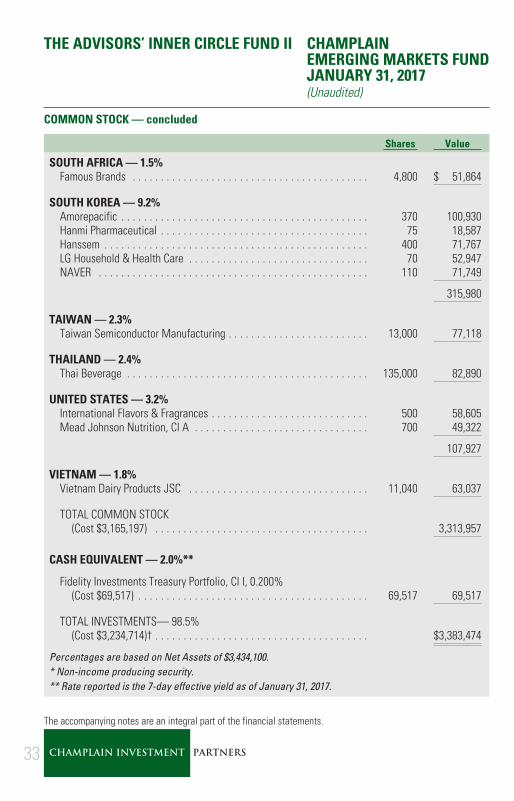
THE ADVISORS’ INNER CIRCLE FUND II CHAMPLAINEMERGING MARKETS FUNDJANUARY 31, 2017(Unaudited)
COMMON STOCK — concluded
Shares Value
SOUTH AFRICA — 1.5%Famous Brands . . . . . . . . . . . . . . . . . . . . . . . . . . . . . . . . . . . . . . . . . . 4,800 $ 51,864
SOUTH KOREA — 9.2%Amorepacific . . . . . . . . . . . . . . . . . . . . . . . . . . . . . . . . . . . . . . . . . . . . 370 100,930Hanmi Pharmaceutical . . . . . . . . . . . . . . . . . . . . . . . . . . . . . . . . . . . . . 75 18,587Hanssem . . . . . . . . . . . . . . . . . . . . . . . . . . . . . . . . . . . . . . . . . . . . . . . 400 71,767LG Household & Health Care . . . . . . . . . . . . . . . . . . . . . . . . . . . . . . . . 70 52,947NAVER . . . . . . . . . . . . . . . . . . . . . . . . . . . . . . . . . . . . . . . . . . . . . . . . 110 71,749
315,980
TAIWAN — 2.3%Taiwan Semiconductor Manufacturing . . . . . . . . . . . . . . . . . . . . . . . . . 13,000 77,118
THAILAND — 2.4%Thai Beverage . . . . . . . . . . . . . . . . . . . . . . . . . . . . . . . . . . . . . . . . . . . 135,000 82,890
UNITED STATES — 3.2%International Flavors & Fragrances . . . . . . . . . . . . . . . . . . . . . . . . . . . . 500 58,605Mead Johnson Nutrition, Cl A . . . . . . . . . . . . . . . . . . . . . . . . . . . . . . . 700 49,322
107,927
VIETNAM — 1.8%Vietnam Dairy Products JSC . . . . . . . . . . . . . . . . . . . . . . . . . . . . . . . . 11,040 63,037
TOTAL COMMON STOCK(Cost $3,165,197) . . . . . . . . . . . . . . . . . . . . . . . . . . . . . . . . . . . . . . 3,313,957
CASH EQUIVALENT — 2.0%**
Fidelity Investments Treasury Portfolio, Cl I, 0.200%(Cost $69,517) . . . . . . . . . . . . . . . . . . . . . . . . . . . . . . . . . . . . . . . . . 69,517 69,517
TOTAL INVESTMENTS— 98.5%(Cost $3,234,714)† . . . . . . . . . . . . . . . . . . . . . . . . . . . . . . . . . . . . . . $3,383,474
Percentages are based on Net Assets of $3,434,100.* Non-income producing security.** Rate reported is the 7-day effective yield as of January 31, 2017.
The accompanying notes are an integral part of the financial statements.
33 CHAMPLAIN INVESTMENT PARTNERS
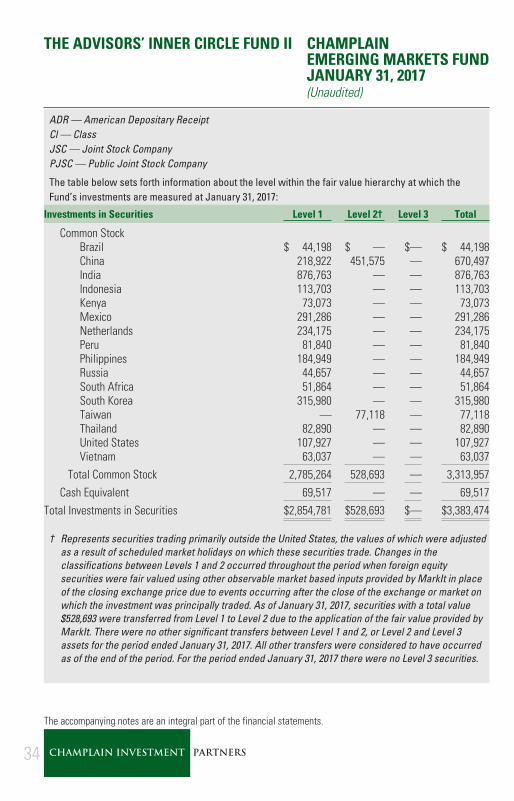
THE ADVISORS’ INNER CIRCLE FUND II CHAMPLAINEMERGING MARKETS FUNDJANUARY 31, 2017(Unaudited)
ADR — American Depositary ReceiptCl — ClassJSC — Joint Stock CompanyPJSC — Public Joint Stock Company
The table below sets forth information about the level within the fair value hierarchy at which theFund’s investments are measured at January 31, 2017:
Investments in Securities Level 1 Level 2† Level 3 Total
Common StockBrazil $ 44,198 $ — $— $ 44,198China 218,922 451,575 — 670,497India 876,763 — — 876,763Indonesia 113,703 — — 113,703Kenya 73,073 — — 73,073Mexico 291,286 — — 291,286Netherlands 234,175 — — 234,175Peru 81,840 — — 81,840Philippines 184,949 — — 184,949Russia 44,657 — — 44,657South Africa 51,864 — — 51,864South Korea 315,980 — — 315,980Taiwan — 77,118 — 77,118Thailand 82,890 — — 82,890United States 107,927 — — 107,927Vietnam 63,037 — — 63,037
Total Common Stock 2,785,264 528,693 — 3,313,957Cash Equivalent 69,517 — — 69,517
Total Investments in Securities $2,854,781 $528,693 $— $3,383,474
† Represents securities trading primarily outside the United States, the values of which were adjustedas a result of scheduled market holidays on which these securities trade. Changes in theclassifications between Levels 1 and 2 occurred throughout the period when foreign equitysecurities were fair valued using other observable market based inputs provided by MarkIt in placeof the closing exchange price due to events occurring after the close of the exchange or market onwhich the investment was principally traded. As of January 31, 2017, securities with a total value$528,693 were transferred from Level 1 to Level 2 due to the application of the fair value provided byMarkIt. There were no other significant transfers between Level 1 and 2, or Level 2 and Level 3assets for the period ended January 31, 2017. All other transfers were considered to have occurredas of the end of the period. For the period ended January 31, 2017 there were no Level 3 securities.
The accompanying notes are an integral part of the financial statements.
34 CHAMPLAIN INVESTMENT PARTNERS

THE ADVISORS’ INNER CIRCLE FUND II CHAMPLAIN FUNDSJANUARY 31, 2017(Unaudited)
STATEMENTS OF ASSETS AND LIABILITIES
ChamplainSmall
CompanyFund
ChamplainMid Cap
Fund
ChamplainEmergingMarkets
Fund
Assets:Investments, at value (Cost $822,940,342,
$1,124,734,482 and $3,234,714 respectively) . . . . . . $1,230,602,236 $1,320,670,988 $3,383,474Foreign Currency, at value (Cost $–, $–, $1,947
respectively) . . . . . . . . . . . . . . . . . . . . . . . . . . . . . . . — — 1,991Receivable for Capital Shares Sold . . . . . . . . . . . . . . . . 2,417,912 12,975,741 —Receivable for Investment Securities Sold . . . . . . . . . . . 15,724,431 6,382,409 41,444Receivable for Dividends . . . . . . . . . . . . . . . . . . . . . . . . 222,242 354,067 1,648Receivable for Dividend Tax Reclaim . . . . . . . . . . . . . . . 36,400 37,370 86Receivable from Adviser . . . . . . . . . . . . . . . . . . . . . . . . — — 5,336Prepaid Expenses . . . . . . . . . . . . . . . . . . . . . . . . . . . . . 35,380 31,108 12,250
Total Assets . . . . . . . . . . . . . . . . . . . . . . . . . . . . . . 1,249,038,601 1,340,451,683 3,446,229
Liabilities:Payable for Investment Securities Purchased . . . . . . . . . 3,810,917 12,166,481 —Payable due to Distributor . . . . . . . . . . . . . . . . . . . . . . . 193,861 151,336 1,073Payable due to Transfer Agent . . . . . . . . . . . . . . . . . . . . 437,497 234,622 5,056Payable due to Administrator . . . . . . . . . . . . . . . . . . . . 69,402 71,773 189Payable due to Trustees . . . . . . . . . . . . . . . . . . . . . . . . 3,104 3,081 8Chief Compliance Officer Fees Payable . . . . . . . . . . . . . 1,369 1,299 63Payable due to Investment Adviser . . . . . . . . . . . . . . . . 816,957 786,346 —Payable for Capital Shares Redeemed . . . . . . . . . . . . . . 955,425 1,468,350 —Other Accrued Expenses . . . . . . . . . . . . . . . . . . . . . . . . 6,712 13,547 5,740
Total Liabilities . . . . . . . . . . . . . . . . . . . . . . . . . . . 6,295,244 14,896,835 12,129
Net Assets . . . . . . . . . . . . . . . . . . . . . . . . . . . . . . . . . $1,242,743,357 $1,325,554,848 $3,434,100
NET ASSETS CONSIST OF:
Paid-in Capital . . . . . . . . . . . . . . . . . . . . . . . . . . . . . . . $ 810,329,286 $1,114,981,624 $4,013,296Undistributed (Distributions in Excess of) Net
Investment Income (Accumulated Net InvestmentLoss) . . . . . . . . . . . . . . . . . . . . . . . . . . . . . . . . . . . . . (5,535,389) 18,536 (71,391)
Accumulated Net Realized Gain (Loss) . . . . . . . . . . . . . . 30,287,566 14,618,182 (656,664)Net Unrealized Appreciation on Investments . . . . . . . . . 407,661,894 195,936,506 148,760Net Unrealized Appreciation on Foreign Currency and
Translation of Other Assets and LiabilitiesDenominated in Foreign Currencies . . . . . . . . . . . . . . — — 99
Net Assets . . . . . . . . . . . . . . . . . . . . . . . . . . . . . . . $1,242,743,357 $1,325,554,848 $3,434,100
The accompanying notes are an integral part of the financial statements.
35 CHAMPLAIN INVESTMENT PARTNERS
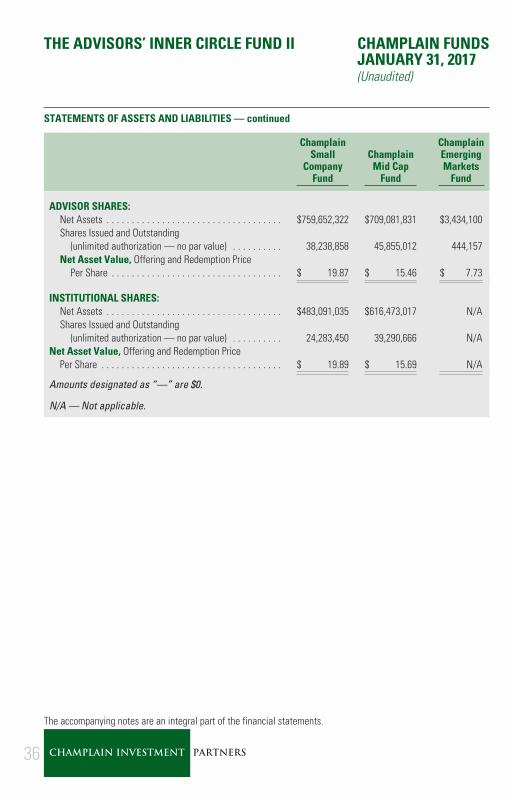
THE ADVISORS’ INNER CIRCLE FUND II CHAMPLAIN FUNDSJANUARY 31, 2017(Unaudited)
STATEMENTS OF ASSETS AND LIABILITIES — continued
ChamplainSmall
CompanyFund
ChamplainMid Cap
Fund
ChamplainEmergingMarkets
Fund
ADVISOR SHARES:Net Assets . . . . . . . . . . . . . . . . . . . . . . . . . . . . . . . . . . . $759,652,322 $709,081,831 $3,434,100Shares Issued and Outstanding
(unlimited authorization — no par value) . . . . . . . . . . 38,238,858 45,855,012 444,157Net Asset Value, Offering and Redemption Price
Per Share . . . . . . . . . . . . . . . . . . . . . . . . . . . . . . . . . . $ 19.87 $ 15.46 $ 7.73
INSTITUTIONAL SHARES:Net Assets . . . . . . . . . . . . . . . . . . . . . . . . . . . . . . . . . . . $483,091,035 $616,473,017 N/AShares Issued and Outstanding
(unlimited authorization — no par value) . . . . . . . . . . 24,283,450 39,290,666 N/ANet Asset Value, Offering and Redemption Price
Per Share . . . . . . . . . . . . . . . . . . . . . . . . . . . . . . . . . . . . $ 19.89 $ 15.69 N/A
Amounts designated as “—” are $0.
N/A — Not applicable.
The accompanying notes are an integral part of the financial statements.
36 CHAMPLAIN INVESTMENT PARTNERS

THE ADVISORS’ INNER CIRCLE FUND II CHAMPLAIN FUNDSSIX MONTHS ENDEDJANUARY 31, 2017(Unaudited)
STATEMENTS OF OPERATIONS
ChamplainSmall
CompanyFund
ChamplainMid Cap
Fund
ChamplainEmergingMarkets
Fund
Investment IncomeDividends . . . . . . . . . . . . . . . . . . . . . . . . . . . . . . . . . . . . . . . $ 5,536,435 $ 6,193,919 $ 17,519Less: Foreign Taxes Withheld . . . . . . . . . . . . . . . . . . . . . . . . (25,883) (22,688) (1,449)
Total Investment Income . . . . . . . . . . . . . . . . . . . . . . . 5,510,552 6,171,231 16,070
ExpensesInvestment Advisory Fees . . . . . . . . . . . . . . . . . . . . . . . . . . . 4,890,457 4,237,469 17,608Distribution Fees — Advisor Shares . . . . . . . . . . . . . . . . . . . 1,172,984 812,720 4,328Administration Fees . . . . . . . . . . . . . . . . . . . . . . . . . . . . . . . 390,519 384,509 1,153Trustees’ Fees . . . . . . . . . . . . . . . . . . . . . . . . . . . . . . . . . . . 9,475 8,997 28Chief Compliance Officer Fees . . . . . . . . . . . . . . . . . . . . . . . 2,702 2,599 44Transfer Agent Fees . . . . . . . . . . . . . . . . . . . . . . . . . . . . . . . 1,011,638 570,129 18,075Professional Fees . . . . . . . . . . . . . . . . . . . . . . . . . . . . . . . . . 37,193 38,564 —Printing Fees . . . . . . . . . . . . . . . . . . . . . . . . . . . . . . . . . . . . 31,243 26,876 3,438Registration Fees . . . . . . . . . . . . . . . . . . . . . . . . . . . . . . . . . 27,533 36,889 8,584Custodian Fees . . . . . . . . . . . . . . . . . . . . . . . . . . . . . . . . . . . 24,342 23,252 7,179Insurance and Other Expenses . . . . . . . . . . . . . . . . . . . . . . . 14,347 12,284 4,564
Total Expenses . . . . . . . . . . . . . . . . . . . . . . . . . . . . . . . 7,612,433 6,154,288 65,001Less: Advisory Fees Waived . . . . . . . . . . . . . . . . . . . . . . . . . (170,410) — (17,608)Reimbursement from Adviser . . . . . . . . . . . . . . . . . . . . . . . . — — (21,120)Fees Paid Indirectly(1) . . . . . . . . . . . . . . . . . . . . . . . . . . . . . . . (18,808) (9,913) (4)
Net Expenses . . . . . . . . . . . . . . . . . . . . . . . . . . . . . . . . 7,423,215 6,144,375 26,269Net Investment Income (Loss) . . . . . . . . . . . . . . . . . . . . . (1,912,663) 26,856 (10,199)Net Realized Gain on Investments . . . . . . . . . . . . . . . . . . 61,827,676 48,998,948 4,379Net Realized Loss on Foreign Currency
Transactions . . . . . . . . . . . . . . . . . . . . . . . . . . . . . . . . . — — (4,236)Net Realized Gain . . . . . . . . . . . . . . . . . . . . . . . . . . . . . . . 61,827,676 48,998,948 143Net Change in Unrealized Appreciation
(Depreciation) on Investments . . . . . . . . . . . . . . . . . . . 102,526,883 48,853,037 (205,434)Net Change in Unrealized Depreciation on Translation
of Assets and Liabilities Denominated in ForeignCurrencies . . . . . . . . . . . . . . . . . . . . . . . . . . . . . . . . . . . — — (146)
Net Change in Unrealized Appreciation(Depreciation) . . . . . . . . . . . . . . . . . . . . . . . . . . . . . . . . 102,526,883 48,853,037 (205,580)
Net Realized and Unrealized Gain (Loss) onInvestments . . . . . . . . . . . . . . . . . . . . . . . . . . . . . . . . . . 164,354,559 97,851,985 (205,437)
Net Increase (Decrease) in Net Assets Resultingfrom Operations . . . . . . . . . . . . . . . . . . . . . . . . . . . . . . $162,441,896 $97,878,841 $(215,636)
Amounts designated as “—” are $0.
(1) See Note 4 in Notes to Financial Statements.
The accompanying notes are an integral part of the financial statements.
37 CHAMPLAIN INVESTMENT PARTNERS
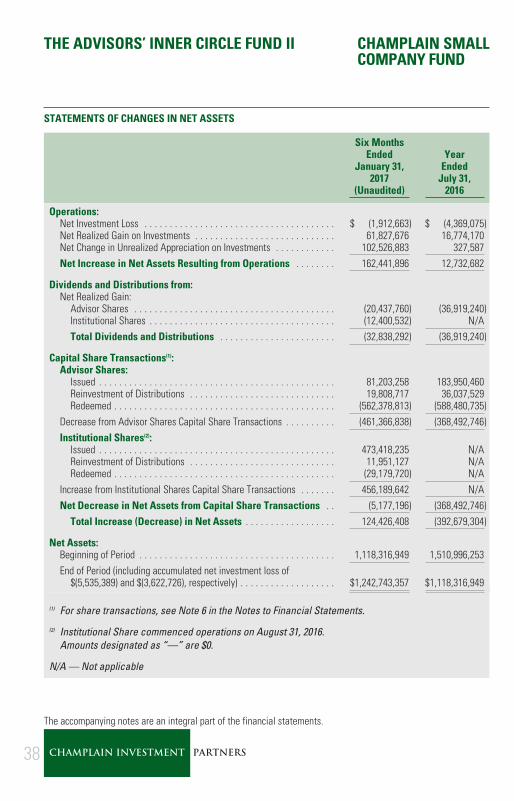
THE ADVISORS’ INNER CIRCLE FUND II CHAMPLAIN SMALLCOMPANY FUND
STATEMENTS OF CHANGES IN NET ASSETS
Six MonthsEnded
January 31,2017
(Unaudited)
YearEnded
July 31,2016
Operations:Net Investment Loss . . . . . . . . . . . . . . . . . . . . . . . . . . . . . . . . . . . . . . $ (1,912,663) $ (4,369,075)Net Realized Gain on Investments . . . . . . . . . . . . . . . . . . . . . . . . . . . . 61,827,676 16,774,170Net Change in Unrealized Appreciation on Investments . . . . . . . . . . . . 102,526,883 327,587Net Increase in Net Assets Resulting from Operations . . . . . . . . 162,441,896 12,732,682
Dividends and Distributions from:Net Realized Gain:
Advisor Shares . . . . . . . . . . . . . . . . . . . . . . . . . . . . . . . . . . . . . . . . (20,437,760) (36,919,240)Institutional Shares . . . . . . . . . . . . . . . . . . . . . . . . . . . . . . . . . . . . . (12,400,532) N/ATotal Dividends and Distributions . . . . . . . . . . . . . . . . . . . . . . . (32,838,292) (36,919,240)
Capital Share Transactions(1):Advisor Shares:
Issued . . . . . . . . . . . . . . . . . . . . . . . . . . . . . . . . . . . . . . . . . . . . . . . 81,203,258 183,950,460Reinvestment of Distributions . . . . . . . . . . . . . . . . . . . . . . . . . . . . . 19,808,717 36,037,529Redeemed . . . . . . . . . . . . . . . . . . . . . . . . . . . . . . . . . . . . . . . . . . . . (562,378,813) (588,480,735)
Decrease from Advisor Shares Capital Share Transactions . . . . . . . . . . (461,366,838) (368,492,746)Institutional Shares(2):
Issued . . . . . . . . . . . . . . . . . . . . . . . . . . . . . . . . . . . . . . . . . . . . . . . 473,418,235 N/AReinvestment of Distributions . . . . . . . . . . . . . . . . . . . . . . . . . . . . . 11,951,127 N/ARedeemed . . . . . . . . . . . . . . . . . . . . . . . . . . . . . . . . . . . . . . . . . . . . (29,179,720) N/A
Increase from Institutional Shares Capital Share Transactions . . . . . . . 456,189,642 N/ANet Decrease in Net Assets from Capital Share Transactions . . (5,177,196) (368,492,746)
Total Increase (Decrease) in Net Assets . . . . . . . . . . . . . . . . . . 124,426,408 (392,679,304)
Net Assets:Beginning of Period . . . . . . . . . . . . . . . . . . . . . . . . . . . . . . . . . . . . . . . 1,118,316,949 1,510,996,253End of Period (including accumulated net investment loss of
$(5,535,389) and $(3,622,726), respectively) . . . . . . . . . . . . . . . . . . . $1,242,743,357 $1,118,316,949
(1) For share transactions, see Note 6 in the Notes to Financial Statements.
(2) Institutional Share commenced operations on August 31, 2016.Amounts designated as “—” are $0.
N/A — Not applicable
The accompanying notes are an integral part of the financial statements.
38 CHAMPLAIN INVESTMENT PARTNERS

THE ADVISORS’ INNER CIRCLE FUND II CHAMPLAINMID CAP FUND
STATEMENTS OF CHANGES IN NET ASSETS
Six MonthsEnded
January 31,2017
(Unaudited)
YearEnded
July 31,2016
Operations:Net Investment Income . . . . . . . . . . . . . . . . . . . . . . . . . . . . . . . . . . . . $ 26,856 $ 728,145Net Realized Gain on Investments . . . . . . . . . . . . . . . . . . . . . . . . . . . . 48,998,948 18,870,010Net Change in Unrealized Appreciation on Investments . . . . . . . . . . . . 48,853,037 47,565,905
Net Increase in Net Assets Resulting from Operations . . . . . . . . 97,878,841 67,164,060
Dividends and Distributions from:Net Investment Income:
Institutional Shares . . . . . . . . . . . . . . . . . . . . . . . . . . . . . . . . . . . . . (347,274) (363,834)Net Realized Gain:
Advisor Shares . . . . . . . . . . . . . . . . . . . . . . . . . . . . . . . . . . . . . . . . (27,847,186) (41,584,318)Institutional Shares . . . . . . . . . . . . . . . . . . . . . . . . . . . . . . . . . . . . . (22,477,935) (15,163,987)
Total Dividends and Distributions . . . . . . . . . . . . . . . . . . . . . . . (50,672,395) (57,112,139)
Capital Share Transactions(1):Advisor Shares:
Issued . . . . . . . . . . . . . . . . . . . . . . . . . . . . . . . . . . . . . . . . . . . . . . . 133,532,213 203,371,832Reinvestment of Distributions . . . . . . . . . . . . . . . . . . . . . . . . . . . . . 26,524,003 39,595,827Redeemed . . . . . . . . . . . . . . . . . . . . . . . . . . . . . . . . . . . . . . . . . . . . (91,814,408) (158,772,994)
Increase from Advisor Shares Capital Share Transactions . . . . . . . . . . . 68,241,808 84,194,665
Institutional Shares:Issued . . . . . . . . . . . . . . . . . . . . . . . . . . . . . . . . . . . . . . . . . . . . . . . 239,899,554 292,687,142Reinvestment of Distributions . . . . . . . . . . . . . . . . . . . . . . . . . . . . . 22,016,600 15,121,450Redeemed . . . . . . . . . . . . . . . . . . . . . . . . . . . . . . . . . . . . . . . . . . . . (57,215,166) (75,836,077)
Increase from Institutional Shares Capital Share Transactions . . . . . . . 204,700,988 231,972,515
Net Increase in Net Assets from Capital Share Transactions . . . 272,942,796 316,167,180
Total Increase in Net Assets . . . . . . . . . . . . . . . . . . . . . . . . . . . . 320,149,242 326,219,101
Net Assets:Beginning of Period . . . . . . . . . . . . . . . . . . . . . . . . . . . . . . . . . . . . . . . 1,005,405,606 679,186,505
End of Period (including undistributed net investment income of$18,536 and $338,954, respectively) . . . . . . . . . . . . . . . . . . . . . . . . $1,325,554,848 $1,005,405,606
(1) For share transactions, see Note 6 in the Notes to Financial Statements.Amounts designated as “—” are $0.
The accompanying notes are an integral part of the financial statements.
39 CHAMPLAIN INVESTMENT PARTNERS
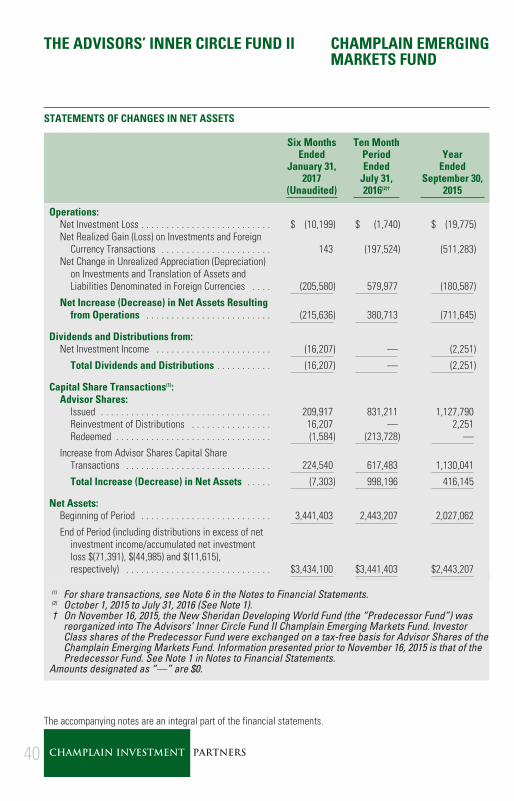
THE ADVISORS’ INNER CIRCLE FUND II CHAMPLAIN EMERGINGMARKETS FUND
STATEMENTS OF CHANGES IN NET ASSETS
Six MonthsEnded
January 31,2017
(Unaudited)
Ten MonthPeriodEnded
July 31,2016(2)†
YearEnded
September 30,2015
Operations:Net Investment Loss . . . . . . . . . . . . . . . . . . . . . . . . . . $ (10,199) $ (1,740) $ (19,775)Net Realized Gain (Loss) on Investments and Foreign
Currency Transactions . . . . . . . . . . . . . . . . . . . . . . 143 (197,524) (511,283)Net Change in Unrealized Appreciation (Depreciation)
on Investments and Translation of Assets andLiabilities Denominated in Foreign Currencies . . . . (205,580) 579,977 (180,587)
Net Increase (Decrease) in Net Assets Resultingfrom Operations . . . . . . . . . . . . . . . . . . . . . . . . . (215,636) 380,713 (711,645)
Dividends and Distributions from:Net Investment Income . . . . . . . . . . . . . . . . . . . . . . . (16,207) — (2,251)
Total Dividends and Distributions . . . . . . . . . . . (16,207) — (2,251)
Capital Share Transactions(1):Advisor Shares:
Issued . . . . . . . . . . . . . . . . . . . . . . . . . . . . . . . . . . 209,917 831,211 1,127,790Reinvestment of Distributions . . . . . . . . . . . . . . . . 16,207 — 2,251Redeemed . . . . . . . . . . . . . . . . . . . . . . . . . . . . . . . (1,584) (213,728) —
Increase from Advisor Shares Capital ShareTransactions . . . . . . . . . . . . . . . . . . . . . . . . . . . . . 224,540 617,483 1,130,041
Total Increase (Decrease) in Net Assets . . . . . (7,303) 998,196 416,145
Net Assets:Beginning of Period . . . . . . . . . . . . . . . . . . . . . . . . . . 3,441,403 2,443,207 2,027,062
End of Period (including distributions in excess of netinvestment income/accumulated net investmentloss $(71,391), $(44,985) and $(11,615),respectively) . . . . . . . . . . . . . . . . . . . . . . . . . . . . . $3,434,100 $3,441,403 $2,443,207
(1) For share transactions, see Note 6 in the Notes to Financial Statements.(2) October 1, 2015 to July 31, 2016 (See Note 1).† On November 16, 2015, the New Sheridan Developing World Fund (the “Predecessor Fund”) was
reorganized into The Advisors’ Inner Circle Fund II Champlain Emerging Markets Fund. InvestorClass shares of the Predecessor Fund were exchanged on a tax-free basis for Advisor Shares of theChamplain Emerging Markets Fund. Information presented prior to November 16, 2015 is that of thePredecessor Fund. See Note 1 in Notes to Financial Statements.
Amounts designated as “—” are $0.
The accompanying notes are an integral part of the financial statements.
40 CHAMPLAIN INVESTMENT PARTNERS
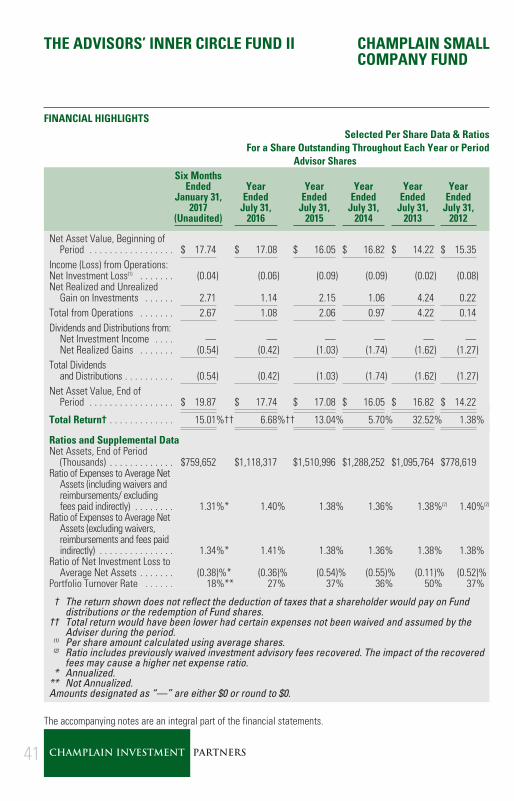
THE ADVISORS’ INNER CIRCLE FUND II CHAMPLAIN SMALLCOMPANY FUND
FINANCIAL HIGHLIGHTSSelected Per Share Data & Ratios
For a Share Outstanding Throughout Each Year or PeriodAdvisor Shares
Six MonthsEnded
January 31,2017
(Unaudited)
YearEnded
July 31,2016
YearEnded
July 31,2015
YearEnded
July 31,2014
YearEnded
July 31,2013
YearEnded
July 31,2012
Net Asset Value, Beginning ofPeriod . . . . . . . . . . . . . . . . . $ 17.74 $ 17.08 $ 16.05 $ 16.82 $ 14.22 $ 15.35
Income (Loss) from Operations:Net Investment Loss(1) . . . . . . . (0.04) (0.06) (0.09) (0.09) (0.02) (0.08)Net Realized and Unrealized
Gain on Investments . . . . . . 2.71 1.14 2.15 1.06 4.24 0.22Total from Operations . . . . . . . 2.67 1.08 2.06 0.97 4.22 0.14Dividends and Distributions from:
Net Investment Income . . . . — — — — — —Net Realized Gains . . . . . . . (0.54) (0.42) (1.03) (1.74) (1.62) (1.27)
Total Dividendsand Distributions . . . . . . . . . . (0.54) (0.42) (1.03) (1.74) (1.62) (1.27)
Net Asset Value, End ofPeriod . . . . . . . . . . . . . . . . . $ 19.87 $ 17.74 $ 17.08 $ 16.05 $ 16.82 $ 14.22
Total Return† . . . . . . . . . . . . . 15.01%†† 6.68%†† 13.04% 5.70% 32.52% 1.38%
Ratios and Supplemental DataNet Assets, End of Period
(Thousands) . . . . . . . . . . . . . $759,652 $1,118,317 $1,510,996 $1,288,252 $1,095,764 $778,619Ratio of Expenses to Average Net
Assets (including waivers andreimbursements/ excludingfees paid indirectly) . . . . . . . . 1.31%* 1.40% 1.38% 1.36% 1.38%(2) 1.40%(2)
Ratio of Expenses to Average NetAssets (excluding waivers,reimbursements and fees paidindirectly) . . . . . . . . . . . . . . . 1.34%* 1.41% 1.38% 1.36% 1.38% 1.38%
Ratio of Net Investment Loss toAverage Net Assets . . . . . . . (0.38)%* (0.36)% (0.54)% (0.55)% (0.11)% (0.52)%
Portfolio Turnover Rate . . . . . . 18%** 27% 37% 36% 50% 37%
† The return shown does not reflect the deduction of taxes that a shareholder would pay on Funddistributions or the redemption of Fund shares.
†† Total return would have been lower had certain expenses not been waived and assumed by theAdviser during the period.
(1) Per share amount calculated using average shares.(2) Ratio includes previously waived investment advisory fees recovered. The impact of the recovered
fees may cause a higher net expense ratio.* Annualized.
** Not Annualized.Amounts designated as “—” are either $0 or round to $0.
The accompanying notes are an integral part of the financial statements.
41 CHAMPLAIN INVESTMENT PARTNERS

THE ADVISORS’ INNER CIRCLE FUND II CHAMPLAIN SMALLCOMPANY FUND
FINANCIAL HIGHLIGHTSSelected Per Share Data & Ratios
For a Share Outstanding Throughout Each PeriodInstitutional
SharesPeriodEnded
January 31,2017(1)
(Unaudited)
Net Asset Value, Beginning of Period . . . . . . . . . . . . . . . . . . . . . . . . . . . . . . . . . . . . . . . . . . $ 18.36
Income (Loss) from Operations:Net Investment Loss(2) . . . . . . . . . . . . . . . . . . . . . . . . . . . . . . . . . . . . . . . . . . . . . . . . . . . . . . (0.01)Net Realized and Unrealized Gain on Investments . . . . . . . . . . . . . . . . . . . . . . . . . . . . . . . . . 2.08
Total from Operations . . . . . . . . . . . . . . . . . . . . . . . . . . . . . . . . . . . . . . . . . . . . . . . . . . . . . . 2.07
Dividends and Distributions from:Net Investment Income . . . . . . . . . . . . . . . . . . . . . . . . . . . . . . . . . . . . . . . . . . . . . . . . . . . —Net Realized Gains . . . . . . . . . . . . . . . . . . . . . . . . . . . . . . . . . . . . . . . . . . . . . . . . . . . . . . (0.54)
Total Dividends and Distributions . . . . . . . . . . . . . . . . . . . . . . . . . . . . . . . . . . . . . . . . . . . . . (0.54)
Net Asset Value, End of Period . . . . . . . . . . . . . . . . . . . . . . . . . . . . . . . . . . . . . . . . . . . . . . . $ 19.89
Total Return† . . . . . . . . . . . . . . . . . . . . . . . . . . . . . . . . . . . . . . . . . . . . . . . . . . . . . . . . . . . 11.24%††
Ratios and Supplemental DataNet Assets, End of Period (Thousands) . . . . . . . . . . . . . . . . . . . . . . . . . . . . . . . . . . . . . . . . . . $483,091Ratio of Expenses to Average Net Assets (including waivers
and reimbursements/excluding fees paid indirectly) . . . . . . . . . . . . . . . . . . . . . . . . . . . . . . 1.05%*Ratio of Expenses to Average Net Assets (excluding waivers,
reimbursements and fees paid indirectly) . . . . . . . . . . . . . . . . . . . . . . . . . . . . . . . . . . . . . 1.08%*Ratio of Net Investment Loss to Average Net Assets . . . . . . . . . . . . . . . . . . . . . . . . . . . . . . . (0.09)%*Portfolio Turnover Rate . . . . . . . . . . . . . . . . . . . . . . . . . . . . . . . . . . . . . . . . . . . . . . . . . . . . . 18%**
(1) Institutional Shares commenced operations on August 31, 2016.(2) Per share amount calculated using average shares.† The return shown does not reflect the deduction of taxes that a shareholder would pay on Fund
distributions or the redemption of Fund shares.†† Total return would have been lower had certain expenses not been waived and assumed by the
Adviser during the period.* Annualized.
** Not Annualized.Amounts designated as “—” are $0 or round to $0.
The accompanying notes are an integral part of the financial statements.
42 CHAMPLAIN INVESTMENT PARTNERS

THE ADVISORS’ INNER CIRCLE FUND II CHAMPLAINMID CAP FUND
FINANCIAL HIGHLIGHTSSelected Per Share Data & Ratios
For a Share Outstanding Throughout Each Year or PeriodAdvisor Shares
Six MonthsEnded
January 31,2017
(Unaudited)
YearEnded
July 31,2016
YearEnded
July 31,2015
YearEnded
July 31,2014
YearEnded
July 31,2013
YearEnded
July 31,2012
Net Asset Value, Beginning ofPeriod . . . . . . . . . . . . . . . . . . . . . . $ 14.85 $ 14.89 $ 14.92 $ 14.29 $ 11.33 $ 11.78
Income (Loss) from Operations:Net Investment Loss(1) . . . . . . . . . . . . . (0.01) — (0.01) (0.03) (0.01) (0.02)Net Realized and Unrealized Gain
(Loss) on Investments . . . . . . . . . . . 1.26 1.06 1.54 1.90 3.51 (0.08)(2)
Total from Operations . . . . . . . . . . . . . 1.25 1.06 1.53 1.87 3.50 (0.10)Dividends and Distributions from:
Net Investment Income . . . . . . . . . — — — — — —Net Realized Gains . . . . . . . . . . . . . (0.64) (1.10) (1.56) (1.24) (0.54) (0.35)
Total Dividends and Distributions . . . . (0.64) (1.10) (1.56) (1.24) (0.54) (0.35)Net Asset Value, End of Period . . . . . . $ 15.46 $ 14.85 $ 14.89 $ 14.92 $ 14.29 $ 11.33
Total Return† . . . . . . . . . . . . . . . . . . 8.50% 8.22% 10.65% 13.65% 32.00%†† (0.67)%††
Ratios and Supplemental DataNet Assets, End of Period (Thousands) . . $709,082 $614,998 $526,649 $568,782 $509,234 $340,611Ratio of Expenses to Average Net
Assets (including waivers andreimbursements/excluding feespaid indirectly) . . . . . . . . . . . . . . . . 1.17%* 1.28% 1.29%(3) 1.30%(3) 1.30% 1.30%
Ratio of Expenses to Average NetAssets (excluding waivers,reimbursements and fees paidindirectly) . . . . . . . . . . . . . . . . . . . . 1.17%* 1.28% 1.28% 1.29% 1.30% 1.34%
Ratio of Net Investment Income (Loss)to Average Net Assets . . . . . . . . . . (0.10)%* 0.03% (0.09)% (0.21)% (0.06)% (0.20)%
Portfolio Turnover Rate . . . . . . . . . . . . 17%** 40% 46% 52% 50% 41%
† The return shown does not reflect the deduction of taxes that a shareholder would pay on Funddistributions or the redemption of Fund shares.
†† Total return would have been lower had certain expenses not been waived and assumed by theAdviser during the period.
(1) Per share amount calculated using average shares.(2) The amount shown for the year ended July 31, 2012, for a unit outstanding throughout the year does
not accord to the aggregate net gains on investments for the year due to the timing of purchases/redemptions of fund shares.
(3) Ratio includes previously waived investment advisory fees recovered. The impact of the recoveredfees may cause a higher net expense ratio.
* Annualized** Not AnnualizedAmounts designated as “—” are either $0 or round to $0.
The accompanying notes are an integral part of the financial statements.
43 CHAMPLAIN INVESTMENT PARTNERS
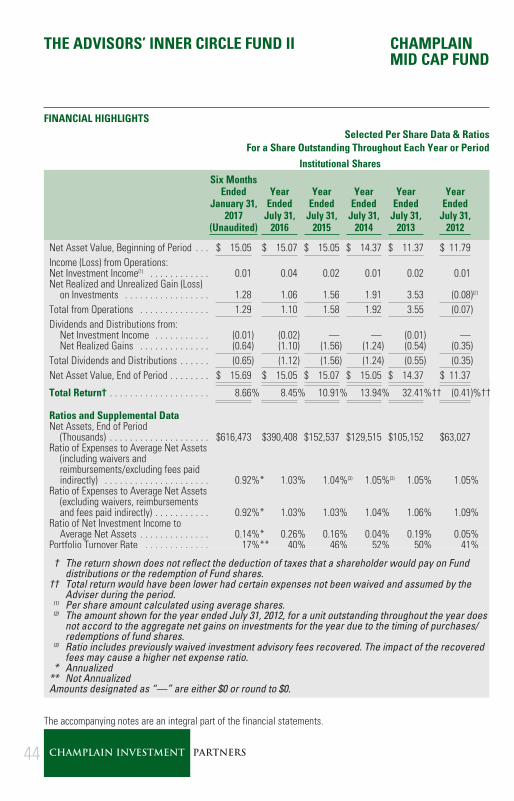
THE ADVISORS’ INNER CIRCLE FUND II CHAMPLAINMID CAP FUND
FINANCIAL HIGHLIGHTSSelected Per Share Data & Ratios
For a Share Outstanding Throughout Each Year or PeriodInstitutional Shares
Six MonthsEnded
January 31,2017
(Unaudited)
YearEnded
July 31,2016
YearEnded
July 31,2015
YearEnded
July 31,2014
YearEnded
July 31,2013
YearEnded
July 31,2012
Net Asset Value, Beginning of Period . . . $ 15.05 $ 15.07 $ 15.05 $ 14.37 $ 11.37 $ 11.79Income (Loss) from Operations:Net Investment Income(1) . . . . . . . . . . . . 0.01 0.04 0.02 0.01 0.02 0.01Net Realized and Unrealized Gain (Loss)
on Investments . . . . . . . . . . . . . . . . . 1.28 1.06 1.56 1.91 3.53 (0.08)(2)
Total from Operations . . . . . . . . . . . . . . 1.29 1.10 1.58 1.92 3.55 (0.07)Dividends and Distributions from:
Net Investment Income . . . . . . . . . . . (0.01) (0.02) — — (0.01) —Net Realized Gains . . . . . . . . . . . . . . (0.64) (1.10) (1.56) (1.24) (0.54) (0.35)
Total Dividends and Distributions . . . . . . (0.65) (1.12) (1.56) (1.24) (0.55) (0.35)Net Asset Value, End of Period . . . . . . . . $ 15.69 $ 15.05 $ 15.07 $ 15.05 $ 14.37 $ 11.37
Total Return† . . . . . . . . . . . . . . . . . . . . 8.66% 8.45% 10.91% 13.94% 32.41%†† (0.41)%††
Ratios and Supplemental DataNet Assets, End of Period
(Thousands) . . . . . . . . . . . . . . . . . . . . $616,473 $390,408 $152,537 $129,515 $105,152 $63,027Ratio of Expenses to Average Net Assets
(including waivers andreimbursements/excluding fees paidindirectly) . . . . . . . . . . . . . . . . . . . . . 0.92%* 1.03% 1.04%(3) 1.05%(3) 1.05% 1.05%
Ratio of Expenses to Average Net Assets(excluding waivers, reimbursementsand fees paid indirectly) . . . . . . . . . . . 0.92%* 1.03% 1.03% 1.04% 1.06% 1.09%
Ratio of Net Investment Income toAverage Net Assets . . . . . . . . . . . . . . 0.14%* 0.26% 0.16% 0.04% 0.19% 0.05%
Portfolio Turnover Rate . . . . . . . . . . . . . 17%** 40% 46% 52% 50% 41%
† The return shown does not reflect the deduction of taxes that a shareholder would pay on Funddistributions or the redemption of Fund shares.
†† Total return would have been lower had certain expenses not been waived and assumed by theAdviser during the period.
(1) Per share amount calculated using average shares.(2) The amount shown for the year ended July 31, 2012, for a unit outstanding throughout the year does
not accord to the aggregate net gains on investments for the year due to the timing of purchases/redemptions of fund shares.
(3) Ratio includes previously waived investment advisory fees recovered. The impact of the recoveredfees may cause a higher net expense ratio.
* Annualized** Not AnnualizedAmounts designated as “—” are either $0 or round to $0.
The accompanying notes are an integral part of the financial statements.
44 CHAMPLAIN INVESTMENT PARTNERS
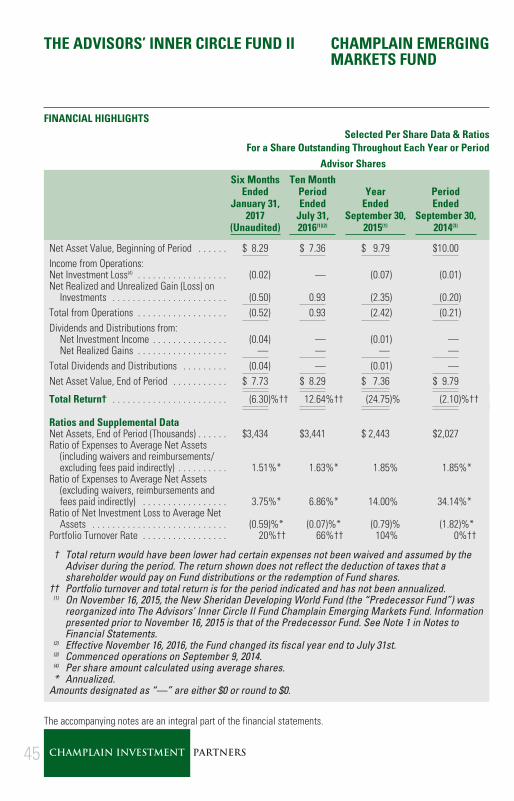
THE ADVISORS’ INNER CIRCLE FUND II CHAMPLAIN EMERGINGMARKETS FUND
FINANCIAL HIGHLIGHTSSelected Per Share Data & Ratios
For a Share Outstanding Throughout Each Year or PeriodAdvisor Shares
Six MonthsEnded
January 31,2017
(Unaudited)
Ten MonthPeriodEnded
July 31,2016(1)(2)
YearEnded
September 30,2015(1)
PeriodEnded
September 30,2014(3)
Net Asset Value, Beginning of Period . . . . . . $ 8.29 $ 7.36 $ 9.79 $10.00Income from Operations:Net Investment Loss(4) . . . . . . . . . . . . . . . . . . (0.02) — (0.07) (0.01)Net Realized and Unrealized Gain (Loss) on
Investments . . . . . . . . . . . . . . . . . . . . . . . (0.50) 0.93 (2.35) (0.20)Total from Operations . . . . . . . . . . . . . . . . . . (0.52) 0.93 (2.42) (0.21)Dividends and Distributions from:
Net Investment Income . . . . . . . . . . . . . . . (0.04) — (0.01) —Net Realized Gains . . . . . . . . . . . . . . . . . . — — — —
Total Dividends and Distributions . . . . . . . . . (0.04) — (0.01) —Net Asset Value, End of Period . . . . . . . . . . . $ 7.73 $ 8.29 $ 7.36 $ 9.79
Total Return† . . . . . . . . . . . . . . . . . . . . . . . (6.30)%†† 12.64%†† (24.75)% (2.10)%††
Ratios and Supplemental DataNet Assets, End of Period (Thousands) . . . . . . $3,434 $3,441 $ 2,443 $2,027Ratio of Expenses to Average Net Assets
(including waivers and reimbursements/excluding fees paid indirectly) . . . . . . . . . . 1.51%* 1.63%* 1.85% 1.85%*
Ratio of Expenses to Average Net Assets(excluding waivers, reimbursements andfees paid indirectly) . . . . . . . . . . . . . . . . . 3.75%* 6.86%* 14.00% 34.14%*
Ratio of Net Investment Loss to Average NetAssets . . . . . . . . . . . . . . . . . . . . . . . . . . . (0.59)%* (0.07)%* (0.79)% (1.82)%*
Portfolio Turnover Rate . . . . . . . . . . . . . . . . . 20%†† 66%†† 104% 0%††
† Total return would have been lower had certain expenses not been waived and assumed by theAdviser during the period. The return shown does not reflect the deduction of taxes that ashareholder would pay on Fund distributions or the redemption of Fund shares.
†† Portfolio turnover and total return is for the period indicated and has not been annualized.(1) On November 16, 2015, the New Sheridan Developing World Fund (the “Predecessor Fund”) was
reorganized into The Advisors’ Inner Circle II Fund Champlain Emerging Markets Fund. Informationpresented prior to November 16, 2015 is that of the Predecessor Fund. See Note 1 in Notes toFinancial Statements.
(2) Effective November 16, 2016, the Fund changed its fiscal year end to July 31st.(3) Commenced operations on September 9, 2014.(4) Per share amount calculated using average shares.* Annualized.
Amounts designated as “—” are either $0 or round to $0.
The accompanying notes are an integral part of the financial statements.
45 CHAMPLAIN INVESTMENT PARTNERS

THE ADVISORS’ INNER CIRCLE FUND II CHAMPLAIN FUNDSJANUARY 31, 2017
NOTES TO FINANCIAL STATEMENTS (Unaudited)
1. ORGANIZATION:
The Advisors’ Inner Circle Fund II (the “Trust”) is organized as a Massachusettsbusiness trust under an Amended and Restated Agreement and Declaration of Trust datedJuly 24, 1992. The Trust is registered under the Investment Company Act of 1940, asamended, as an open-end management investment company with thirty-three funds. Thefinancial statements herein are those of the Champlain Small Company Fund, ChamplainMid Cap Fund and Champlain Emerging Markets Fund (each a “Fund” and collectively, the“Funds”). The investment objective of the Funds is capital appreciation. Each of theChamplain Funds is classified as a “diversified” with the exception of the ChamplainEmerging Markets Fund which is classified as “non-diversified” investment company underthe 1940 Act. The Champlain Small Company Fund invests in small companies with marketcapitalization of less than $2.5 billion, the Champlain Mid Cap Fund invests primarily (atleast 80% of their net assets) in medium-sized companies with market capitalization of lessthan $15 billion and the Champlain Emerging Markets Fund invests primarily (at least 80%of its net assets) in equity securities of issuers who are economically tied to an emergingmarket country. The financial statements of the remaining funds within the Trust arepresented separately. The assets of each Fund of the Trust are segregated, and ashareholder’s interest is limited to the fund in which shares are held. The Funds currentlyoffer Advisor Shares; the Champlain Small Company Fund offers Institutional Shares, whichcommenced operations on August 31, 2016, and the Champlain Mid Cap Fund also offersInstitutional Shares, which commenced operations on January 3, 2011. The ChamplainEmerging Markets Fund commenced operations on September 9, 2014 as the New SheridanDeveloping World Fund (the “Predecessor Fund”), a series of ALPS Series Trust, whichreorganized through a transfer of all assets and liabilities to the Champlain EmergingMarkets Fund on November 16, 2015. Investor Class Shares of the Predecessor Fund wereexchanged on a tax-free basis for Advisor Shares of the Fund. The Predecessor Fund hadsubstantially similar investment objectives, investment strategies, policies and restrictionsas those of the Fund. For financial reporting purposes, the Predecessor Fund’s financial andperformance history prior to the reorganization has been carried forward and is reflected inthe Champlain Emerging Markets Fund’s financial statements and financial highlights.
Effective November 16, 2015, the Champlain Emerging Markets Fund has changed its fiscalyear end to July 31, 2016.
2. SIGNIFICANT ACCOUNTING POLICIES:
The following is a summary of the significant accounting policies followed by the Funds inpreparation of their financial statements. The Funds are investment companies in conformity
46 CHAMPLAIN INVESTMENT PARTNERS

THE ADVISORS’ INNER CIRCLE FUND II CHAMPLAIN FUNDSJANUARY 31, 2017
with U.S. generally accepted accounting principles (“U.S. GAAP”). Therefore, the Fundsfollow the accounting and reporting guidance for investment companies.
Use of Estimates — The preparation of financial statements, in conformity with U.S.GAAP requires management to make estimates and assumptions that affect thereported amount of assets and liabilities and disclosure of contingent assets andliabilities at the date of the financial statements and the reported amounts of increasesand decreases in net assets from operations during the reporting period. Actual resultscould differ from those estimates and such differences could be material.
Security Valuation — Securities listed on a securities exchange, market or automatedquotation system for which quotations are readily available (except for securities tradedon NASDAQ), including securities traded over the counter, are valued at the last quotedsale price on the primary exchange or market (foreign or domestic) on which they aretraded, or, if there is no such reported sale, at the most recent quoted bid price. Forsecurities traded on NASDAQ, the NASDAQ Official Closing Price will be used.Investment companies are valued at Net Asset Value.
Securities for which market prices are not “readily available” are valued in accordancewith Fair Value Procedures established by the Trust’s Board of Trustees (the “Board”).The Trust’s Fair Value Procedures are implemented through a Fair Value Committee (the“Committee”) designated by the Board. Some of the more common reasons that maynecessitate that a security be valued using Fair Value Procedures include: the security’strading has been halted or suspended; the security has been de-listed from a nationalexchange; the security’s primary trading market is temporarily closed at a time whenunder normal conditions it would be open; the security has not been traded for anextended period of time; the security’s primary pricing source is not able or willing toprovide a price; or trading of the security is subject to local government-imposedrestrictions. When a security is valued in accordance with the Trust’s Fair ValueProcedures, the Committee will determine the value after taking into considerationrelevant information reasonably available to the Committee. As of January 31, 2017,there were no fair valued securities held by the Funds.
For securities that principally trade on a foreign market or exchange, a significant gap intime can exist between the time of a particular security’s last trade and the time atwhich the Fund calculates its net asset values. The closing prices of such securities mayno longer reflect their market value at the time the Fund calculates net asset value if anevent that could materially affect the value of those securities (a “Significant Event”)has occurred between the time of the security’s last close and the time that the Fundcalculates net asset value. A Significant Event may relate to a single issuer or to an
47 CHAMPLAIN INVESTMENT PARTNERS
THE ADVISORS’ INNER CIRCLE FUND II CHAMPLAIN FUNDSJANUARY 31, 2017
entire market sector. If Champlain Investment Partners, LLC (the “Adviser”), of the Fundbecomes aware of a Significant Event that has occurred with respect to a security orgroup of securities after the closing of the exchange or market on which the security orsecurities principally trade, but before the time at which the Fund calculates net assetvalue, it may request that a Committee meeting be called.
The Champlain Emerging Markets Fund uses MarkIt Fair Value (“MarkIt”) as a thirdparty fair valuation vendor. MarkIt provides a fair value for foreign securities in the Fundbased on certain factors and methodologies (involving, generally, tracking valuationcorrelations between the U.S. market and each non-U.S. security) applied by MarkIt inthe event that there is a movement in the U.S. market that exceeds a specific thresholdestablished by the Committee. The Committee establishes a “confidence interval” whichis used to determine the level of correlation between the value of a foreign security andmovements in the U.S. market before a particular security is fair valued when thethreshold is exceeded. In the event that the threshold established by the Committee isexceeded on a specific day, the Fund values its non-U.S. securities that exceed theapplicable “confidence interval” based upon the fair values provided by MarkIt. In suchevent, it is not necessary to hold a Committee meeting. In the event that the Adviserbelieves that the fair values provided by MarkIt are not reliable, the Adviser contactsSEI Investments Global Fund Services (the “Administrator”) and may request that ameeting of the Committee be held.
If a local market in which the Fund owns securities is closed for one or more days, theFund shall value all securities held in that corresponding currency based on the fairvalue prices provided by MarkIt using the predetermined confidence interval discussedabove.
In accordance with the authoritative guidance on fair value measurements anddisclosure under U.S. GAAP, the Funds disclose the fair value of their investments in ahierarchy that prioritizes the inputs to valuation techniques used to measure the fairvalue. The objective of a fair value measurement is to determine the price that would bereceived to sell an asset or paid to transfer a liability in an orderly transaction betweenmarket participants at the measurement date (an exit price). Accordingly, the fair valuehierarchy gives the highest priority to quoted prices (unadjusted) in active markets foridentical assets or liabilities (Level 1) and the lowest priority to unobservable inputs(Level 3). The three levels of the fair value hierarchy are described below:
• Level 1 – Unadjusted quoted prices in active markets for identical, unrestrictedassets or liabilities that the Funds have the ability to access at the measurementdate;
48 CHAMPLAIN INVESTMENT PARTNERS

THE ADVISORS’ INNER CIRCLE FUND II CHAMPLAIN FUNDSJANUARY 31, 2017
• Level 2 – Quoted prices which are not active, or inputs that are observable (eitherdirectly or indirectly) for substantially the full term of the asset or liability; and othersignificant observable inputs (includes quoted prices for similar securities, interestrates, prepayment spreads, credit risk, referenced indices, quoted prices in inactivemarkets, adjusted quoted prices in active markets, etc.); and
• Level 3 – Prices, inputs or exotic modeling techniques which are both significantto the fair value measurement and unobservable (supported by little or no marketactivity).
Investments are classified within the level of the lowest significant input considered indetermining fair value. Investments classified within Level 3 whose fair valuemeasurement considers several inputs may include Level 1 or Level 2 inputs ascomponents of the overall fair value measurement.
For details of investment classifications, reference the Schedules of Investments. Theinputs or methodology used for valuing securities are not necessarily an indication ofthe risk associated with investing in those securities.
For the period ended January 31, 2017, there have been no significant changes to theFunds’ fair value methodologies.
Federal Income Taxes — It is each Fund’s intention to continue to qualify as aregulated investment company under Subchapter M of the Internal Revenue Code and todistribute all of their taxable income. Accordingly, no provision for Federal income taxeshas been made in the financial statements.
The Funds evaluate tax positions taken or expected to be taken in the course ofpreparing the Funds’ tax returns to determine whether it is “more-likely-than-not” (i.e.,greater than 50-percent) that each tax position will be sustained upon examination by ataxing authority based on the technical merits of the position. Tax positions not deemedto meet the more-likely-than-not threshold are recorded as a tax benefit or expense inthe current year. The Funds did not record any tax provision in the current period.However, management’s conclusions regarding tax positions taken may be subject toreview and adjustment at a later date based on factors including, but not limited to,examination by tax authorities (i.e., the last 3 tax year ends, as applicable), on-goinganalysis of and changes to tax laws, regulations and interpretations thereof.
As of and during the period ended January 31, 2017, the Funds did not have liabilitiesfor any unrecognized tax benefits. The Funds recognize interest and penalties, if any,related to unrecognized tax benefits as income tax expense on the Statement ofOperations. During the period ended January 31, 2017, the Funds did not incur anyinterest or penalties.
49 CHAMPLAIN INVESTMENT PARTNERS

THE ADVISORS’ INNER CIRCLE FUND II CHAMPLAIN FUNDSJANUARY 31, 2017
Security Transactions and Investment Income — Security transactions areaccounted for on trade date for financial reporting purposes. Costs used in determiningrealized gains and losses on the sales of investment securities are based on specificidentification. Dividend income is recognized on the ex-dividend date and interestincome is recognized on an accrual basis.
Foreign Currency Translation — The books and records of the Funds are maintainedin U.S. dollars. Investment securities and other assets and liabilities denominated in aforeign currency are translated into U.S. dollars on the date of valuation. The Funds donot isolate that portion of realized or unrealized gains and losses resulting from changesin the foreign exchange rate from fluctuations arising from changes in the market pricesof the securities. These gains and losses are included in net realized and unrealizedgains and losses on investments on the Statements of Operations. Net realized andunrealized gains and losses on foreign currency transactions represent net foreignexchange gains or losses from foreign currency exchange contracts, disposition offoreign currencies, currency gains or losses realized between trade and settlementdates on securities transactions and the difference between the amount of theinvestment income and foreign withholding taxes recorded on the Funds’ books and theU.S. dollar equivalent of the amounts actually received or paid.
Forward Foreign Currency Exchange Contracts — The Funds may enter intoforward foreign currency exchange contracts to protect the value of securities held andrelated receivables and payables against changes in future foreign exchange rates. Aforward currency contract is an agreement between two parties to buy and sell currencyat a set price on a future date. The market value of the contract will fluctuate withchanges in currency exchange rates. The contract is marked-to-market daily using thecurrent forward rate and the change in market value is recorded by the Funds asunrealized gain or loss. The Funds recognize realized gains or losses when the contractis closed, equal to the difference between the value of the contract at the time it wasopened and the value at the time it was closed. Any realized or unrealized gains/(loss)during the year are presented on the Statements of Operations. Risks may arise fromunanticipated movements in the value of a foreign currency relative to the U.S. dollar.Risks may also arise upon entering into these contracts from the potential inability ofcounterparties to meet the terms of their contracts and are generally limited to theamount of unrealized gain on the contracts at the date of default. For the period endedJanuary 31, 2017, the Funds did not enter into any forward foreign currency contracts.
Classes — Class specific expenses, such as distribution fees, are borne by that classof shares. Income, realized and unrealized gains/losses and non-class specific expensesare allocated to the respective class on the basis of relative net assets.
50 CHAMPLAIN INVESTMENT PARTNERS

THE ADVISORS’ INNER CIRCLE FUND II CHAMPLAIN FUNDSJANUARY 31, 2017
Expenses — Most expenses of the Trust can be directly attributed to a particular fund.Expenses that cannot be directly attributed to a particular fund are apportioned amongthe funds of the Trust based on the number of funds and/or relative net assets.
Dividends and Distributions to Shareholders — Dividends from net investmentincome, if any, are declared and paid annually by the Funds. Any net realized capitalgains are distributed to shareholders at least annually.
3. TRANSACTIONS WITH AFFILIATES:
Certain officers and a trustee of the Trust are also officers of SEI Investments Global FundsServices (the “Administrator”), a wholly owned subsidiary of SEI Investments Company, and/or SEI Investments Distribution Co. (the “Distributor”). Such officers and the trustee are paidno fees by the Trust for serving as officers and trustee of the Trust.
The services provided by the Chief Compliance Officer (“CCO”) and his staff, who are theemployees of the Administrator, are paid for by the Trust as incurred. The services includeregulatory oversight of the Trust’s Advisors and service providers as required by SECregulations. The CCO’s services have been approved by and are reviewed by the Board.
4. ADMINISTRATION, DISTRIBUTION, TRANSFER AGENT AND CUSTODIANAGREEMENTS:
The Funds and the Administrator are parties to an Administration Agreement, under whichthe Administrator provides administrative services to the Fund. For these services, theAdministrator is paid an asset-based fee, which will vary depending on the number of shareclasses and the average daily net assets of the Fund. For the period ended January 31, 2017,Small Company Fund, Mid Cap Fund and Emerging Markets Fund were charged $390,519,$384,509, and $1,153 for these services, respectively.
The Funds have adopted a Distribution Plan (the “Plan”) for the Advisor Shares. Under thePlan, the Distributor, or third parties that enter into agreements with the Distributor, mayreceive up to 0.25% of the Funds’ average net assets attributable to the Advisor Shares ascompensation for distribution services.
DST Systems, Inc. serves as the transfer agent and dividend disbursing agent for the Fundsunder a transfer agency agreement with the Trust. The Funds may earn cash managementcredits which can be used to offset transfer agent expenses. During the period endedJanuary 31, 2017, the Small Company Fund earned credits of $18,808, the Mid Cap Fundearned credits of $9,913, and the Emerging Markets Fund earned credits of $4 which wereused to offset transfer agent expenses. These amounts are listed as “Fees Paid Indirectly”on the Statements of Operations.
51 CHAMPLAIN INVESTMENT PARTNERS
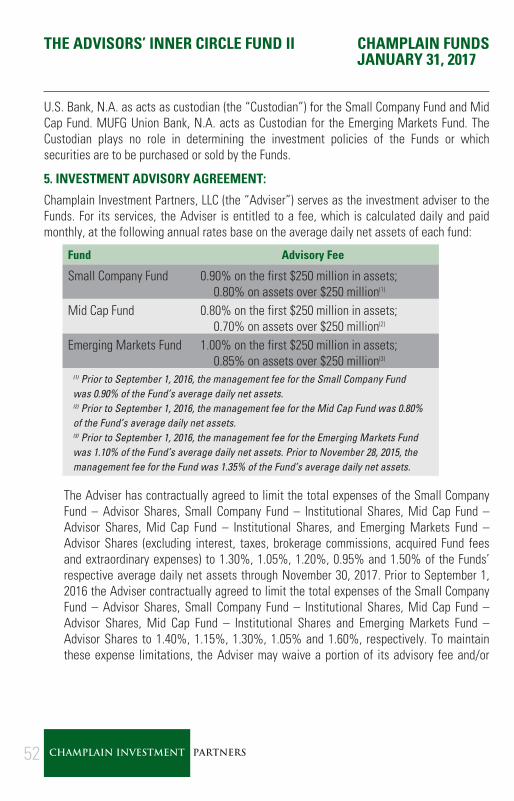
THE ADVISORS’ INNER CIRCLE FUND II CHAMPLAIN FUNDSJANUARY 31, 2017
U.S. Bank, N.A. as acts as custodian (the “Custodian”) for the Small Company Fund and MidCap Fund. MUFG Union Bank, N.A. acts as Custodian for the Emerging Markets Fund. TheCustodian plays no role in determining the investment policies of the Funds or whichsecurities are to be purchased or sold by the Funds.
5. INVESTMENT ADVISORY AGREEMENT:
Champlain Investment Partners, LLC (the “Adviser”) serves as the investment adviser to theFunds. For its services, the Adviser is entitled to a fee, which is calculated daily and paidmonthly, at the following annual rates base on the average daily net assets of each fund:
Fund Advisory Fee
Small Company Fund 0.90% on the first $250 million in assets;0.80% on assets over $250 million(1)
Mid Cap Fund 0.80% on the first $250 million in assets;0.70% on assets over $250 million(2)
Emerging Markets Fund 1.00% on the first $250 million in assets;0.85% on assets over $250 million(3)
(1) Prior to September 1, 2016, the management fee for the Small Company Fundwas 0.90% of the Fund’s average daily net assets.(2) Prior to September 1, 2016, the management fee for the Mid Cap Fund was 0.80%of the Fund’s average daily net assets.(3) Prior to September 1, 2016, the management fee for the Emerging Markets Fundwas 1.10% of the Fund’s average daily net assets. Prior to November 28, 2015, themanagement fee for the Fund was 1.35% of the Fund’s average daily net assets.
The Adviser has contractually agreed to limit the total expenses of the Small CompanyFund – Advisor Shares, Small Company Fund – Institutional Shares, Mid Cap Fund –Advisor Shares, Mid Cap Fund – Institutional Shares, and Emerging Markets Fund –Advisor Shares (excluding interest, taxes, brokerage commissions, acquired Fund feesand extraordinary expenses) to 1.30%, 1.05%, 1.20%, 0.95% and 1.50% of the Funds’respective average daily net assets through November 30, 2017. Prior to September 1,2016 the Adviser contractually agreed to limit the total expenses of the Small CompanyFund – Advisor Shares, Small Company Fund – Institutional Shares, Mid Cap Fund –Advisor Shares, Mid Cap Fund – Institutional Shares and Emerging Markets Fund –Advisor Shares to 1.40%, 1.15%, 1.30%, 1.05% and 1.60%, respectively. To maintainthese expense limitations, the Adviser may waive a portion of its advisory fee and/or
52 CHAMPLAIN INVESTMENT PARTNERS
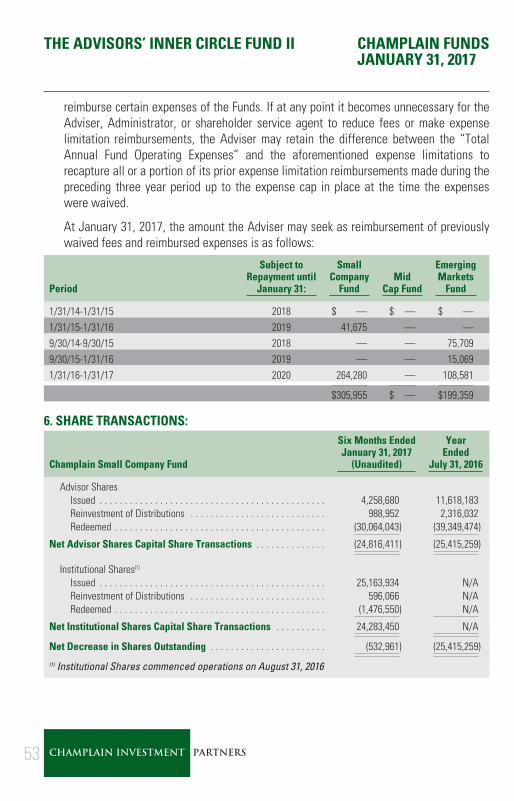
THE ADVISORS’ INNER CIRCLE FUND II CHAMPLAIN FUNDSJANUARY 31, 2017
reimburse certain expenses of the Funds. If at any point it becomes unnecessary for theAdviser, Administrator, or shareholder service agent to reduce fees or make expenselimitation reimbursements, the Adviser may retain the difference between the “TotalAnnual Fund Operating Expenses” and the aforementioned expense limitations torecapture all or a portion of its prior expense limitation reimbursements made during thepreceding three year period up to the expense cap in place at the time the expenseswere waived.
At January 31, 2017, the amount the Adviser may seek as reimbursement of previouslywaived fees and reimbursed expenses is as follows:
Period
Subject toRepayment until
January 31:
SmallCompany
FundMid
Cap Fund
EmergingMarkets
Fund
1/31/14-1/31/15 2018 $ — $ — $ —1/31/15-1/31/16 2019 41,675 — —9/30/14-9/30/15 2018 — — 75,7099/30/15-1/31/16 2019 — — 15,0691/31/16-1/31/17 2020 264,280 — 108,581
$305,955 $ — $199,359
6. SHARE TRANSACTIONS:
Champlain Small Company Fund
Six Months EndedJanuary 31, 2017
(Unaudited)
YearEnded
July 31, 2016
Advisor SharesIssued . . . . . . . . . . . . . . . . . . . . . . . . . . . . . . . . . . . . . . . . . . . . . 4,258,680 11,618,183Reinvestment of Distributions . . . . . . . . . . . . . . . . . . . . . . . . . . . 988,952 2,316,032Redeemed . . . . . . . . . . . . . . . . . . . . . . . . . . . . . . . . . . . . . . . . . . (30,064,043) (39,349,474)
Net Advisor Shares Capital Share Transactions . . . . . . . . . . . . . . (24,816,411) (25,415,259)
Institutional Shares(1)
Issued . . . . . . . . . . . . . . . . . . . . . . . . . . . . . . . . . . . . . . . . . . . . . 25,163,934 N/AReinvestment of Distributions . . . . . . . . . . . . . . . . . . . . . . . . . . . 596,066 N/ARedeemed . . . . . . . . . . . . . . . . . . . . . . . . . . . . . . . . . . . . . . . . . . (1,476,550) N/A
Net Institutional Shares Capital Share Transactions . . . . . . . . . . 24,283,450 N/A
Net Decrease in Shares Outstanding . . . . . . . . . . . . . . . . . . . . . . . (532,961) (25,415,259)
(1) Institutional Shares commenced operations on August 31, 2016
53 CHAMPLAIN INVESTMENT PARTNERS
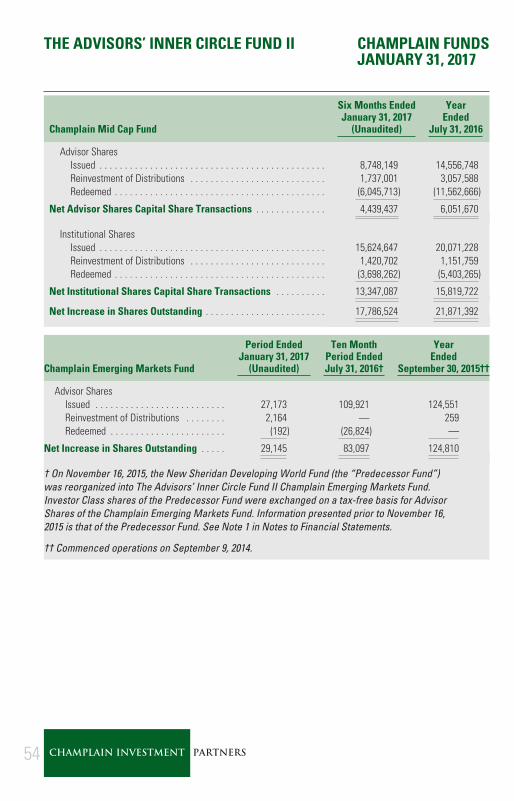
THE ADVISORS’ INNER CIRCLE FUND II CHAMPLAIN FUNDSJANUARY 31, 2017
Champlain Mid Cap Fund
Six Months EndedJanuary 31, 2017
(Unaudited)
YearEnded
July 31, 2016
Advisor SharesIssued . . . . . . . . . . . . . . . . . . . . . . . . . . . . . . . . . . . . . . . . . . . . . 8,748,149 14,556,748Reinvestment of Distributions . . . . . . . . . . . . . . . . . . . . . . . . . . . 1,737,001 3,057,588Redeemed . . . . . . . . . . . . . . . . . . . . . . . . . . . . . . . . . . . . . . . . . . (6,045,713) (11,562,666)
Net Advisor Shares Capital Share Transactions . . . . . . . . . . . . . . 4,439,437 6,051,670
Institutional SharesIssued . . . . . . . . . . . . . . . . . . . . . . . . . . . . . . . . . . . . . . . . . . . . . 15,624,647 20,071,228Reinvestment of Distributions . . . . . . . . . . . . . . . . . . . . . . . . . . . 1,420,702 1,151,759Redeemed . . . . . . . . . . . . . . . . . . . . . . . . . . . . . . . . . . . . . . . . . . (3,698,262) (5,403,265)
Net Institutional Shares Capital Share Transactions . . . . . . . . . . 13,347,087 15,819,722
Net Increase in Shares Outstanding . . . . . . . . . . . . . . . . . . . . . . . . 17,786,524 21,871,392
Champlain Emerging Markets Fund
Period EndedJanuary 31, 2017
(Unaudited)
Ten MonthPeriod EndedJuly 31, 2016†
YearEnded
September 30, 2015††
Advisor SharesIssued . . . . . . . . . . . . . . . . . . . . . . . . . . 27,173 109,921 124,551Reinvestment of Distributions . . . . . . . . 2,164 — 259Redeemed . . . . . . . . . . . . . . . . . . . . . . . (192) (26,824) —
Net Increase in Shares Outstanding . . . . . 29,145 83,097 124,810
† On November 16, 2015, the New Sheridan Developing World Fund (the “Predecessor Fund”)was reorganized into The Advisors’ Inner Circle Fund II Champlain Emerging Markets Fund.Investor Class shares of the Predecessor Fund were exchanged on a tax-free basis for AdvisorShares of the Champlain Emerging Markets Fund. Information presented prior to November 16,2015 is that of the Predecessor Fund. See Note 1 in Notes to Financial Statements.
†† Commenced operations on September 9, 2014.
54 CHAMPLAIN INVESTMENT PARTNERS

THE ADVISORS’ INNER CIRCLE FUND II CHAMPLAIN FUNDSJANUARY 31, 2017
7. INVESTMENT TRANSACTIONS:
For the period ended January 31, 2017, the purchases and sales of investment securitiesother than long-term U.S. Government and short-term investments were:
Purchases Sales
Champlain Small Company Fund $196,476,758 $214,791,033Champlain Mid Cap Fund 413,965,875 181,444,516Champlain Emerging Markets Fund 826,079 673,661
There were no purchases or sales of long-term U.S. Government securities for any of theFunds.
8. FEDERAL TAX INFORMATION:
The amount and character of income and capital gain distributions, if any, to be paid, aredetermined in accordance with Federal income tax regulations, which may differ from U.S.GAAP. As a result, net investment income (loss) and net realized gain (loss) on investmenttransactions for a reporting period may differ significantly from distributions during suchperiod. These book/tax differences may be temporary or permanent. To the extent thesedifferences are permanent in nature, they are charged or credited to undistributed netinvestment income (loss), accumulated net realized gain (loss) or paid-in capital, asappropriate, in the period that the differences arise.
The tax character of dividends and distributions declared during the years ended July 31,2016, July 31, 2015 and the period ended September 30, 2014 for the Emerging MarketsFund, were as follows was as follows:
OrdinaryIncome
Long-TermCapital Gain
Return ofCapital Total
Small Company Fund2016 $ 6,563,528 $30,355,712 $ — $36,919,2402015 4,189,435 75,518,443 — 79,707,878Mid Cap Fund2016 $ 7,221,822 $49,890,317 $ — $57,112,1392015 14,327,207 54,539,820 — 68,867,027
55 CHAMPLAIN INVESTMENT PARTNERS
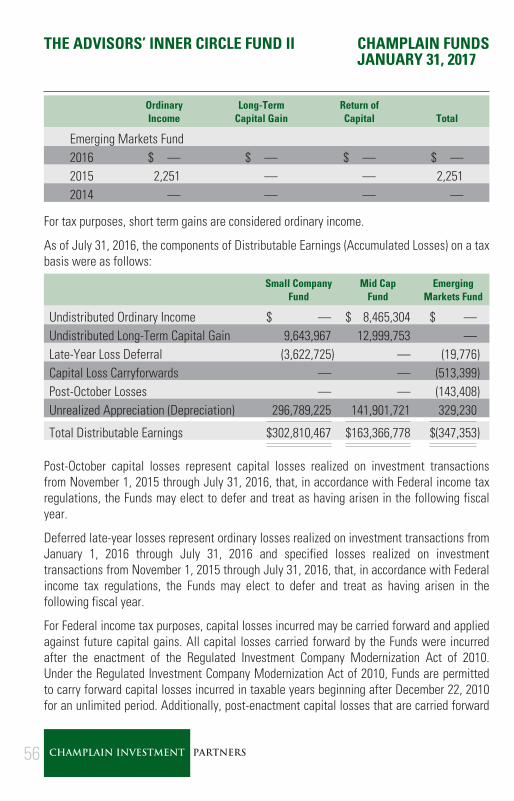
THE ADVISORS’ INNER CIRCLE FUND II CHAMPLAIN FUNDSJANUARY 31, 2017
OrdinaryIncome
Long-TermCapital Gain
Return ofCapital Total
Emerging Markets Fund2016 $ — $ — $ — $ —2015 2,251 — — 2,2512014 — — — —
For tax purposes, short term gains are considered ordinary income.
As of July 31, 2016, the components of Distributable Earnings (Accumulated Losses) on a taxbasis were as follows:
Small CompanyFund
Mid CapFund
EmergingMarkets Fund
Undistributed Ordinary Income $ — $ 8,465,304 $ —Undistributed Long-Term Capital Gain 9,643,967 12,999,753 —Late-Year Loss Deferral (3,622,725) — (19,776)Capital Loss Carryforwards — — (513,399)Post-October Losses — — (143,408)Unrealized Appreciation (Depreciation) 296,789,225 141,901,721 329,230
Total Distributable Earnings $302,810,467 $163,366,778 $(347,353)
Post-October capital losses represent capital losses realized on investment transactionsfrom November 1, 2015 through July 31, 2016, that, in accordance with Federal income taxregulations, the Funds may elect to defer and treat as having arisen in the following fiscalyear.
Deferred late-year losses represent ordinary losses realized on investment transactions fromJanuary 1, 2016 through July 31, 2016 and specified losses realized on investmenttransactions from November 1, 2015 through July 31, 2016, that, in accordance with Federalincome tax regulations, the Funds may elect to defer and treat as having arisen in thefollowing fiscal year.
For Federal income tax purposes, capital losses incurred may be carried forward and appliedagainst future capital gains. All capital losses carried forward by the Funds were incurredafter the enactment of the Regulated Investment Company Modernization Act of 2010.Under the Regulated Investment Company Modernization Act of 2010, Funds are permittedto carry forward capital losses incurred in taxable years beginning after December 22, 2010for an unlimited period. Additionally, post-enactment capital losses that are carried forward
56 CHAMPLAIN INVESTMENT PARTNERS
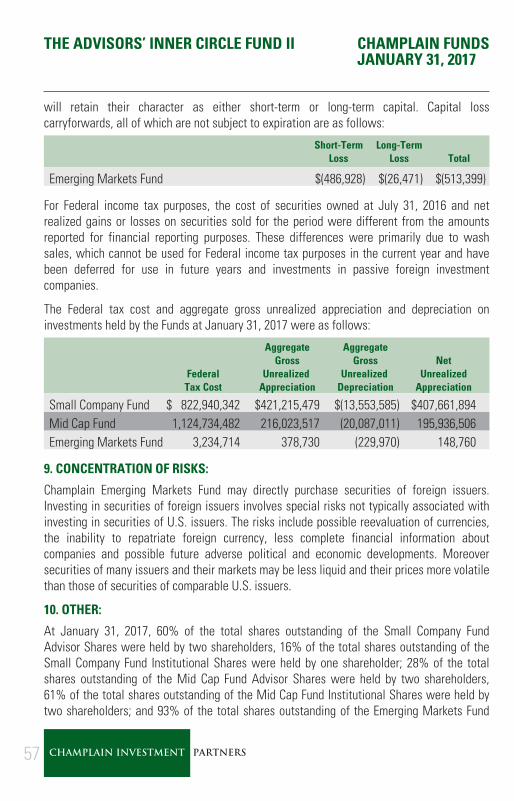
THE ADVISORS’ INNER CIRCLE FUND II CHAMPLAIN FUNDSJANUARY 31, 2017
will retain their character as either short-term or long-term capital. Capital losscarryforwards, all of which are not subject to expiration are as follows:
Short-TermLoss
Long-TermLoss Total
Emerging Markets Fund $(486,928) $(26,471) $(513,399)
For Federal income tax purposes, the cost of securities owned at July 31, 2016 and netrealized gains or losses on securities sold for the period were different from the amountsreported for financial reporting purposes. These differences were primarily due to washsales, which cannot be used for Federal income tax purposes in the current year and havebeen deferred for use in future years and investments in passive foreign investmentcompanies.
The Federal tax cost and aggregate gross unrealized appreciation and depreciation oninvestments held by the Funds at January 31, 2017 were as follows:
FederalTax Cost
AggregateGross
UnrealizedAppreciation
AggregateGross
UnrealizedDepreciation
NetUnrealized
Appreciation
Small Company Fund $ 822,940,342 $421,215,479 $(13,553,585) $407,661,894Mid Cap Fund 1,124,734,482 216,023,517 (20,087,011) 195,936,506Emerging Markets Fund 3,234,714 378,730 (229,970) 148,760
9. CONCENTRATION OF RISKS:
Champlain Emerging Markets Fund may directly purchase securities of foreign issuers.Investing in securities of foreign issuers involves special risks not typically associated withinvesting in securities of U.S. issuers. The risks include possible reevaluation of currencies,the inability to repatriate foreign currency, less complete financial information aboutcompanies and possible future adverse political and economic developments. Moreoversecurities of many issuers and their markets may be less liquid and their prices more volatilethan those of securities of comparable U.S. issuers.
10. OTHER:
At January 31, 2017, 60% of the total shares outstanding of the Small Company FundAdvisor Shares were held by two shareholders, 16% of the total shares outstanding of theSmall Company Fund Institutional Shares were held by one shareholder; 28% of the totalshares outstanding of the Mid Cap Fund Advisor Shares were held by two shareholders,61% of the total shares outstanding of the Mid Cap Fund Institutional Shares were held bytwo shareholders; and 93% of the total shares outstanding of the Emerging Markets Fund
57 CHAMPLAIN INVESTMENT PARTNERS
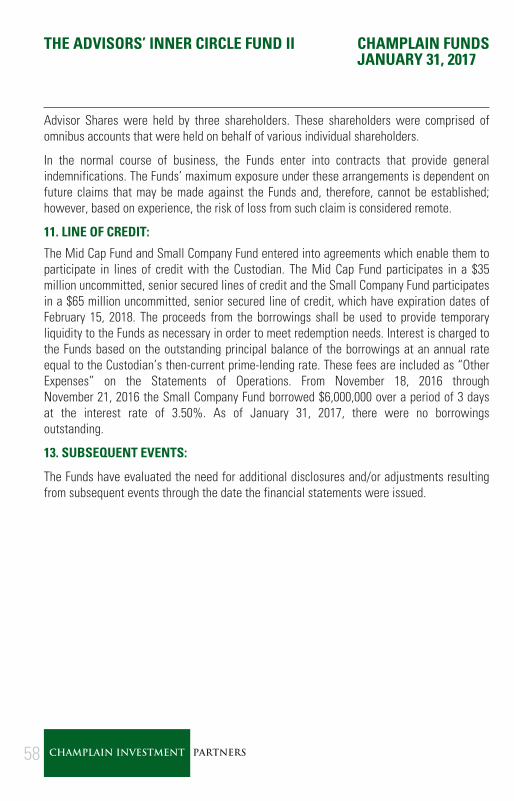
THE ADVISORS’ INNER CIRCLE FUND II CHAMPLAIN FUNDSJANUARY 31, 2017
Advisor Shares were held by three shareholders. These shareholders were comprised ofomnibus accounts that were held on behalf of various individual shareholders.
In the normal course of business, the Funds enter into contracts that provide generalindemnifications. The Funds’ maximum exposure under these arrangements is dependent onfuture claims that may be made against the Funds and, therefore, cannot be established;however, based on experience, the risk of loss from such claim is considered remote.
11. LINE OF CREDIT:
The Mid Cap Fund and Small Company Fund entered into agreements which enable them toparticipate in lines of credit with the Custodian. The Mid Cap Fund participates in a $35million uncommitted, senior secured lines of credit and the Small Company Fund participatesin a $65 million uncommitted, senior secured line of credit, which have expiration dates ofFebruary 15, 2018. The proceeds from the borrowings shall be used to provide temporaryliquidity to the Funds as necessary in order to meet redemption needs. Interest is charged tothe Funds based on the outstanding principal balance of the borrowings at an annual rateequal to the Custodian’s then-current prime-lending rate. These fees are included as “OtherExpenses” on the Statements of Operations. From November 18, 2016 throughNovember 21, 2016 the Small Company Fund borrowed $6,000,000 over a period of 3 daysat the interest rate of 3.50%. As of January 31, 2017, there were no borrowingsoutstanding.
13. SUBSEQUENT EVENTS:
The Funds have evaluated the need for additional disclosures and/or adjustments resultingfrom subsequent events through the date the financial statements were issued.
58 CHAMPLAIN INVESTMENT PARTNERS

THE ADVISORS’ INNER CIRCLE FUND II CHAMPLAIN FUNDSJANUARY 31, 2017
DISCLOSURE OF FUND EXPENSES (Unaudited)
All mutual funds have operating expenses. As a shareholder of a mutual fund, yourinvestment is affected by these ongoing costs, which include (among others) costs forportfolio management, administrative services, and shareholder reports like this one. It isimportant for you to understand the impact of these costs on your investment returns.
Operating expenses such as these are deducted from the mutual fund’s gross income anddirectly reduce your final investment return. These expenses are expressed as a percentageof the mutual fund’s average net assets; this percentage is known as the mutual fund’sexpense ratio.
The following examples use the expense ratio and are intended to help you understand theongoing costs (in dollars) of investing in your Fund and to compare these costs with those ofother mutual funds. The examples are based on an investment of $1,000 made at thebeginning of the period shown and held for the entire period from August 1, 2016 toJanuary 31, 2017.
The table on the next page illustrates your Fund’s costs in two ways:
• ACTUAL FUND RETURN. This section helps you to estimate the actual expenses afterfee waivers that your Fund incurred over the period. The “Expenses Paid During Period”column shows the actual dollar expense cost incurred by a $1,000 investment in the Fund,and the “Ending Account Value” number is derived from deducting that expense cost fromthe Fund’s gross investment return. You can use this information, together with the actualamount you invested in the Fund, to estimate the expenses you paid over that period. Simplydivide your actual account value by $1,000 to arrive at a ratio (for example, an $8,600account value divided by $1,000 = 8.6), then multiply that ratio by the number shown for yourFund under “Expenses Paid During Period.”
• HYPOTHETICAL 5% RETURN. This section helps you compare your Fund’s costs withthose of other mutual funds. It assumes that the Fund had an annual 5% return beforeexpenses during the year, but that the expense ratio (Column 3) for the period is unchanged.This example is useful in making comparisons because the Securities and ExchangeCommission requires all mutual funds to make this 5% calculation. You can assess yourFund’s comparative cost by comparing the hypothetical result for your Fund in the “ExpensePaid During Period” column with those that appear in the same charts in the shareholderreports for other mutual funds.
59 CHAMPLAIN INVESTMENT PARTNERS
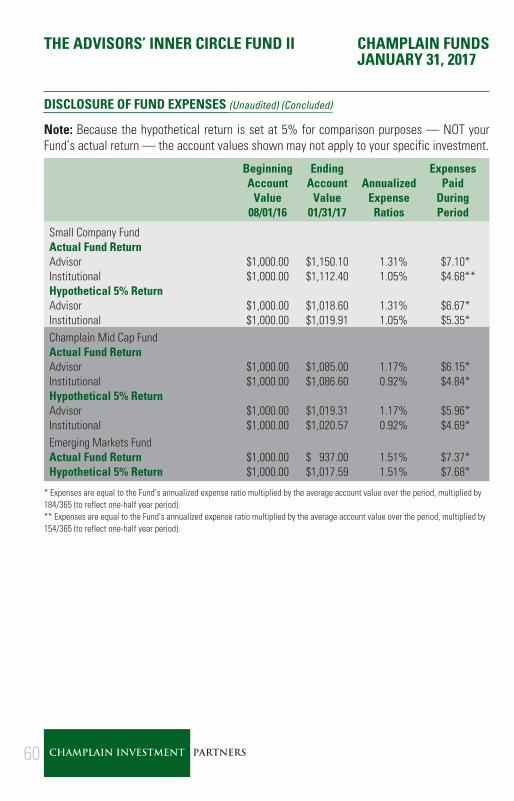
THE ADVISORS’ INNER CIRCLE FUND II CHAMPLAIN FUNDSJANUARY 31, 2017
DISCLOSURE OF FUND EXPENSES (Unaudited) (Concluded)
Note: Because the hypothetical return is set at 5% for comparison purposes — NOT yourFund’s actual return — the account values shown may not apply to your specific investment.
BeginningAccount
Value08/01/16
EndingAccount
Value01/31/17
AnnualizedExpense
Ratios
ExpensesPaid
DuringPeriod
Small Company FundActual Fund ReturnAdvisor $1,000.00 $1,150.10 1.31% $7.10*Institutional $1,000.00 $1,112.40 1.05% $4.68**Hypothetical 5% ReturnAdvisor $1,000.00 $1,018.60 1.31% $6.67*Institutional $1,000.00 $1,019.91 1.05% $5.35*Champlain Mid Cap FundActual Fund ReturnAdvisor $1,000.00 $1,085.00 1.17% $6.15*Institutional $1,000.00 $1,086.60 0.92% $4.84*Hypothetical 5% ReturnAdvisor $1,000.00 $1,019.31 1.17% $5.96*Institutional $1,000.00 $1,020.57 0.92% $4.69*Emerging Markets FundActual Fund Return $1,000.00 $ 937.00 1.51% $7.37*Hypothetical 5% Return $1,000.00 $1,017.59 1.51% $7.68*
* Expenses are equal to the Fund’s annualized expense ratio multiplied by the average account value over the period, multiplied by184/365 (to reflect one-half year period).** Expenses are equal to the Fund’s annualized expense ratio multiplied by the average account value over the period, multiplied by154/365 (to reflect one-half year period).
60 CHAMPLAIN INVESTMENT PARTNERS

NOTES

Champlain FundsP.O. Box 219009Kansas City, MO 64121-9009866-773-3238
Adviser:Champlain Investment Partners, LLC180 Battery StreetBurlington, VT 05401
Distributor:SEI Investments Distribution Co.Oaks, PA 19456
Administrator:SEI Investments Global Funds ServicesOne Freedom Valley DriveOaks, PA 19456
Legal Counsel:Morgan, Lewis & Bockius LLP1701 Market StreetPhiladelphia, PA 19103-2921
Independent Registered Public Accounting Firm:Ernst & Young LLPOne Commerce Square2005 Market Street, Suite 700Philadelphia, PA 19103
This information must be preceded or accompanied by a current prospectus for theFunds.
CSC-SA-001-1300