The Zebrafish Mutation Project - NIH 1 Session 3... · 2017-05-12 · The Zebrafish Mutation...
24
The Zebrafish Mutation Project Derek L Stemple Wellcome Trust Sanger Institute Linking Disease Model Phenotypes to Human Conditions 10 September 2015
Transcript of The Zebrafish Mutation Project - NIH 1 Session 3... · 2017-05-12 · The Zebrafish Mutation...
The Zebrafish Mutation Project
Derek L StempleWellcome Trust Sanger Institute
Linking Disease Model Phenotypes to Human Conditions10 September 2015
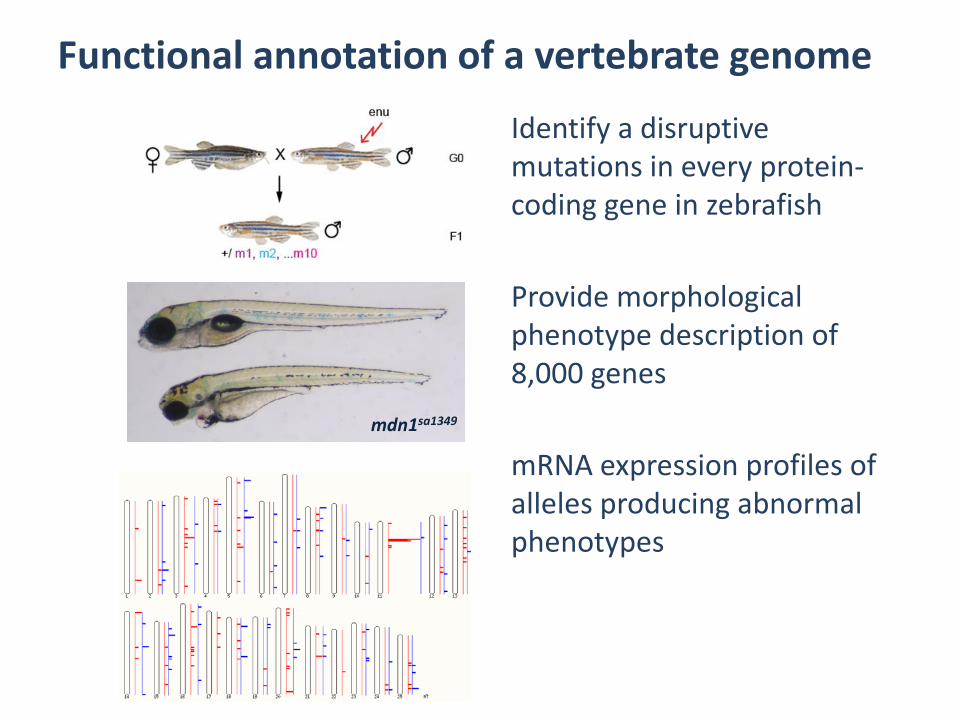
Functional annotation of a vertebrate genome
Identify a disruptive mutations in every protein-coding gene in zebrafish
mdn1sa1349
Provide morphological phenotype description of 8,000 genes
mRNA expression profiles of alleles producing abnormal phenotypes
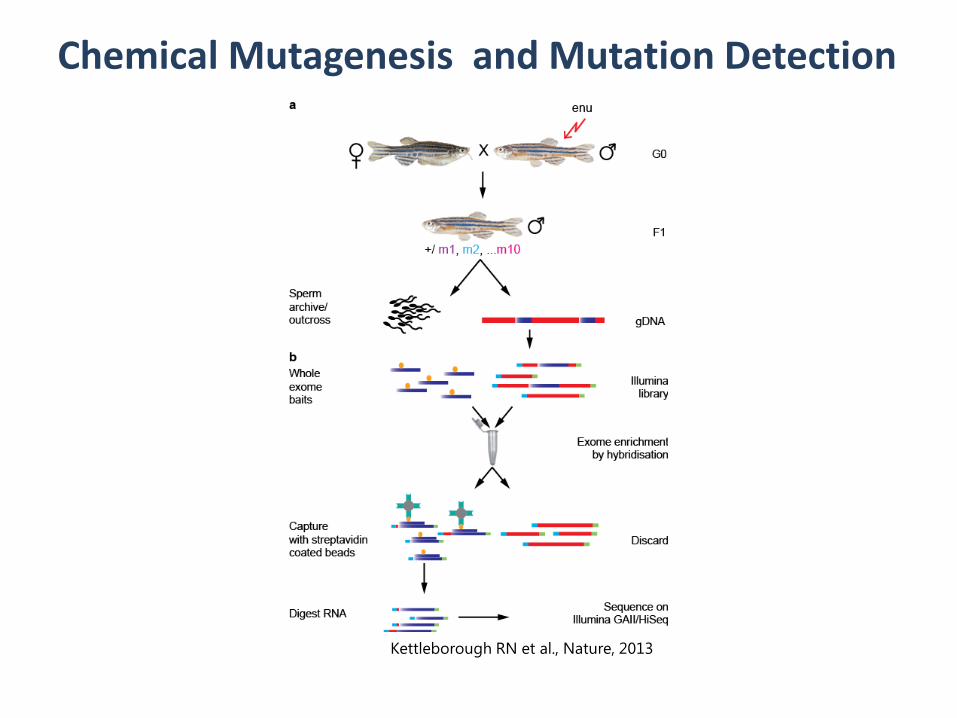
Chemical Mutagenesis and Mutation Detection
Kettleborough RN et al., Nature, 2013
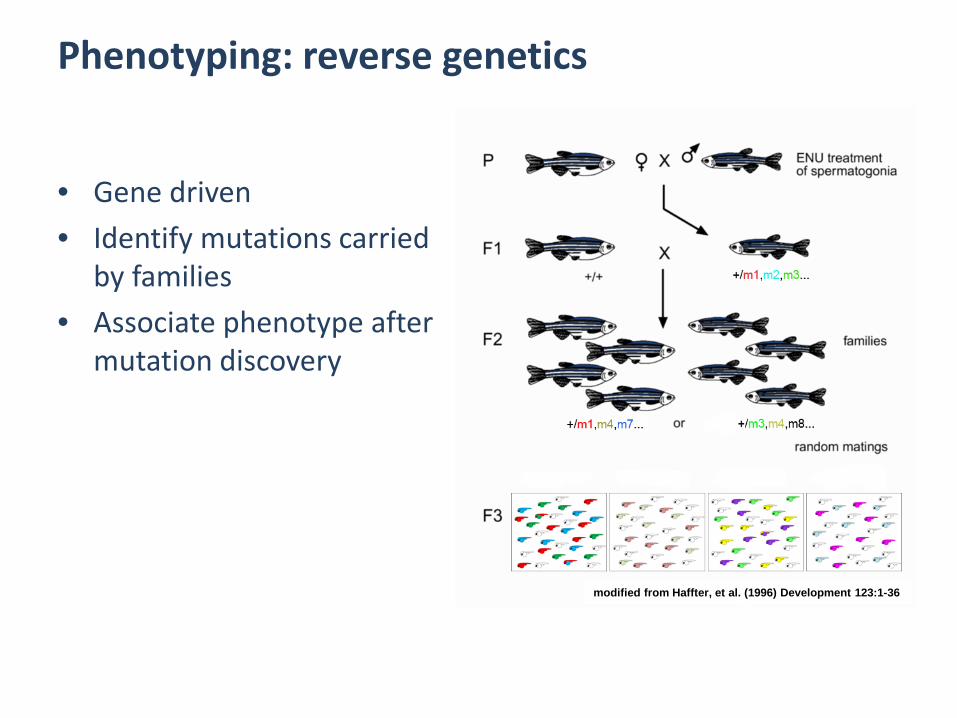
Phenotyping: reverse genetics
• Gene driven• Identify mutations carried
by families• Associate phenotype after
mutation discovery
Haffter, et al. (1996) Development 123:1-36modified from Haffter, et al. (1996) Development 123:1-36

Morphological phenotyping
Kettleborough RN et al., Nature, 2013
Dooley CM et al., Methods, 2013
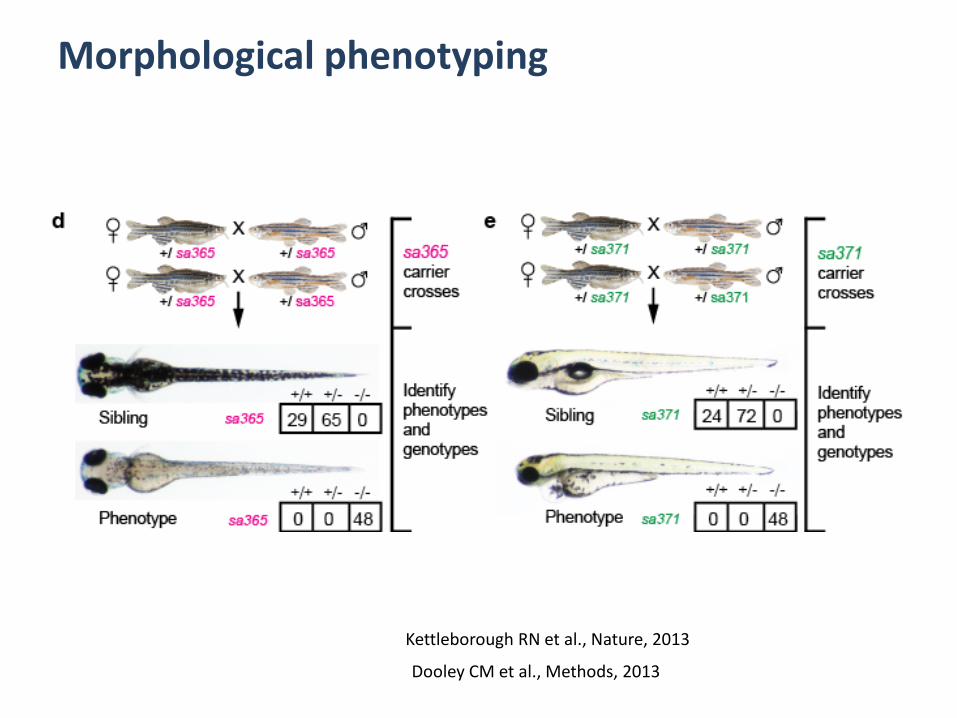
Morphological phenotyping
Kettleborough RN et al., Nature, 2013
Dooley CM et al., Methods, 2013

Zebrafish Mutation Project: lamc1http://www.sanger.ac.uk/sanger/Zebrafish_Zmpgene/ENSDARG00000036279
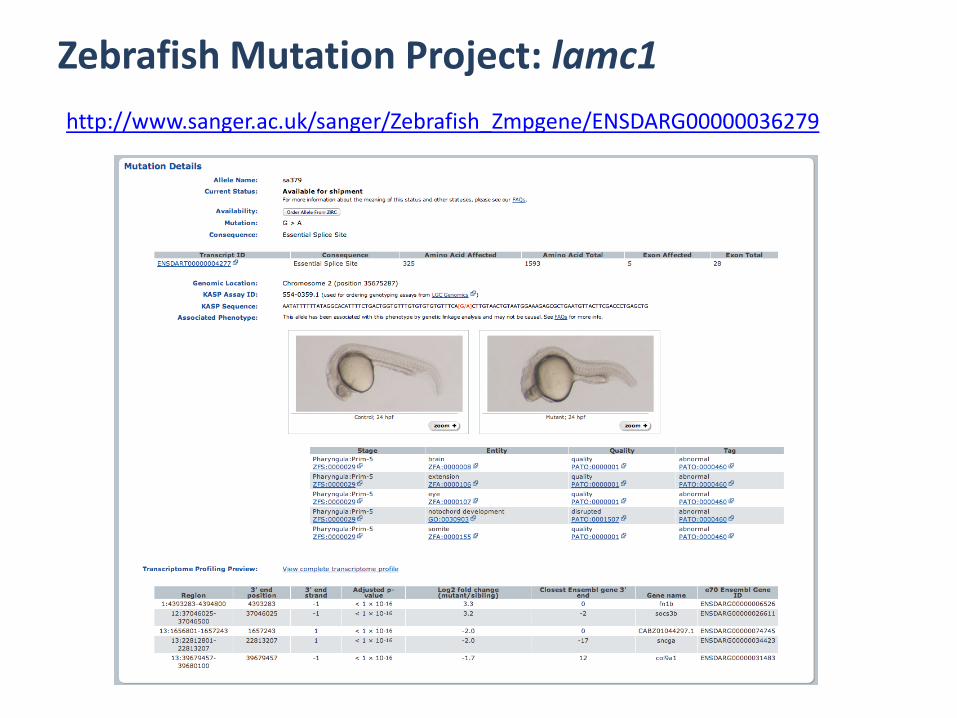
Zebrafish Mutation Project: lamc1http://www.sanger.ac.uk/sanger/Zebrafish_Zmpgene/ENSDARG00000036279
Mutation Detection
• All detected mutations are available for perusal at the European Nucleic Acid Archive (ENA)http://www.ebi.ac.uk/ena/data/view/PRJEB1830
• So far we have sequenced 2,839 F1 males• We have identified 32,383 nonsense and disruptive
splice-site alleles in 14,059 genes (53% of total) • BUT, we are reaching a point of diminishing returns
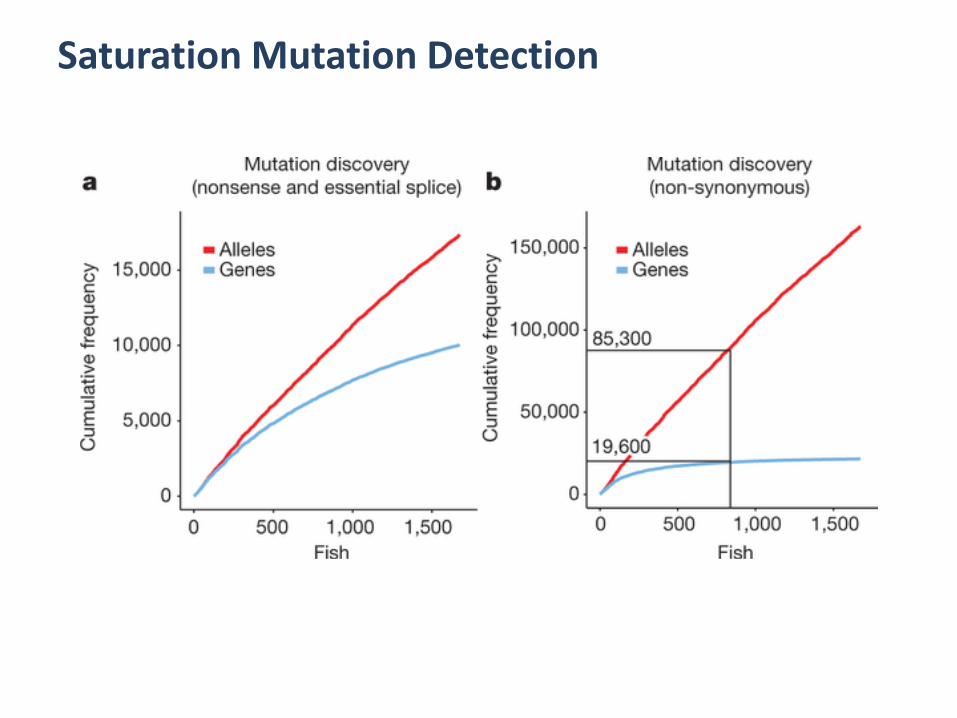
Saturation Mutation Detection
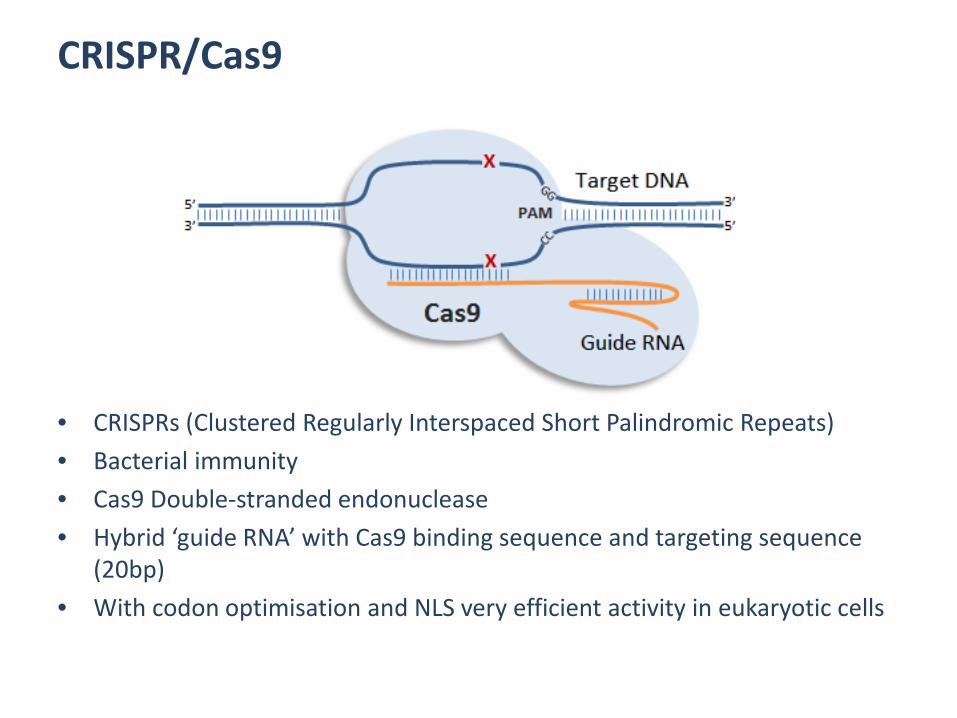
CRISPR/Cas9
• CRISPRs (Clustered Regularly Interspaced Short Palindromic Repeats) • Bacterial immunity• Cas9 Double-stranded endonuclease• Hybrid ‘guide RNA’ with Cas9 binding sequence and targeting sequence
(20bp)• With codon optimisation and NLS very efficient activity in eukaryotic cells
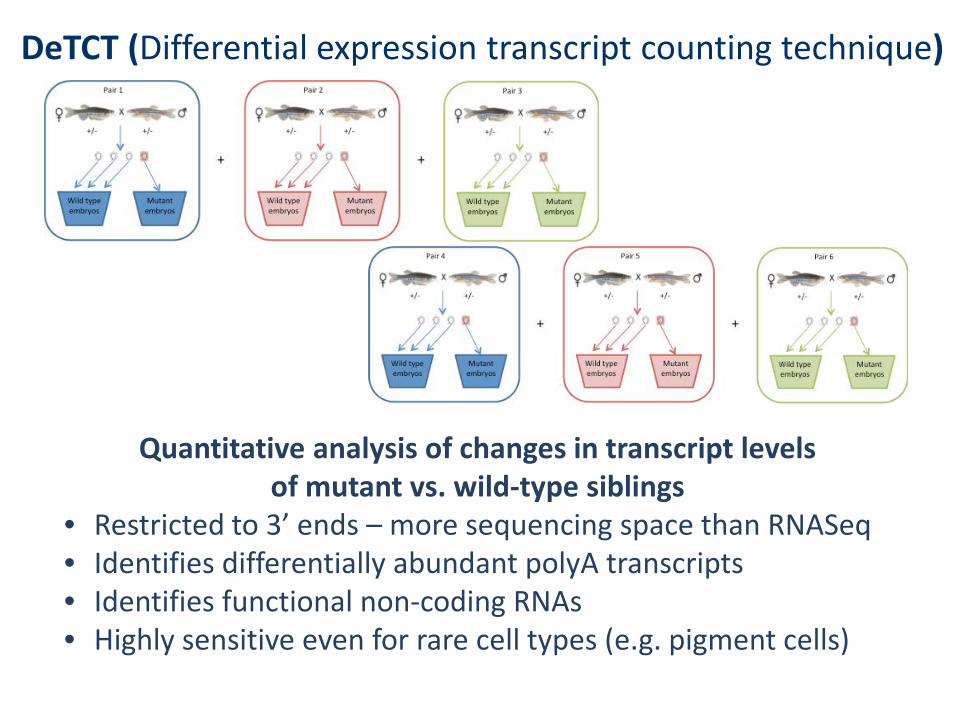
DeTCT (Differential expression transcript counting technique)
Quantitative analysis of changes in transcript levelsof mutant vs. wild-type siblings
• Restricted to 3’ ends – more sequencing space than RNASeq• Identifies differentially abundant polyA transcripts • Identifies functional non-coding RNAs• Highly sensitive even for rare cell types (e.g. pigment cells)
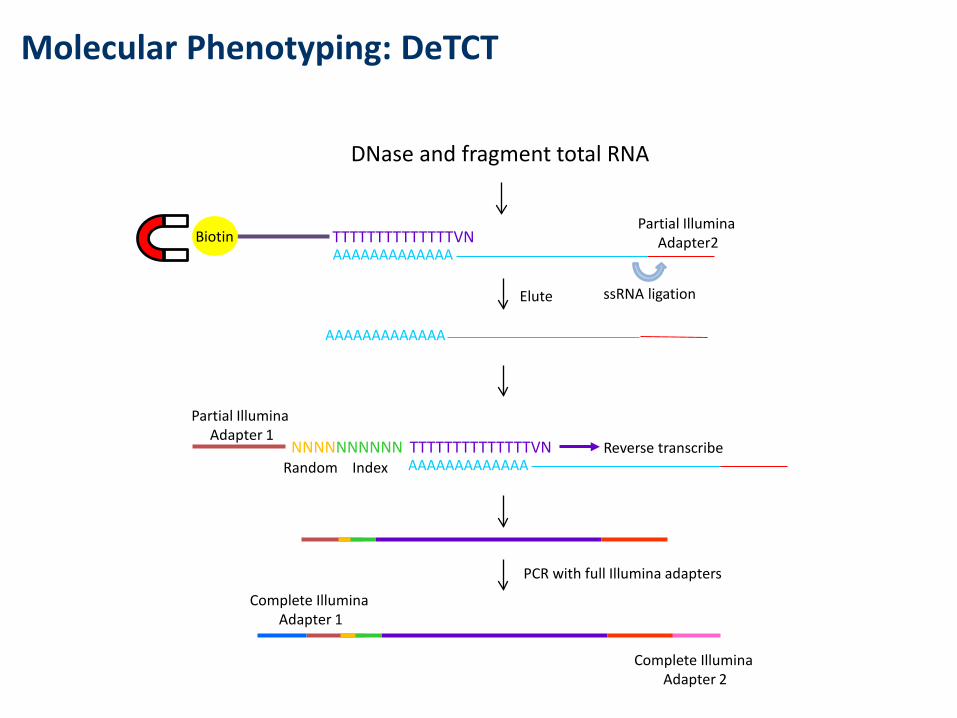
Molecular Phenotyping: DeTCT
AAAAAAAAAAAAATTTTTTTTTTTTTTVNNNNNNNNNNN
Partial Illumina Adapter 1
IndexReverse transcribe
Random
Complete Illumina Adapter 2
Complete Illumina Adapter 1
AAAAAAAAAAAAATTTTTTTTTTTTTTVN
Partial Illumina Adapter2
AAAAAAAAAAAAA
Biotin
ssRNA ligationElute
PCR with full Illumina adapters
DNase and fragment total RNA
Illumina Adapter 2
Illumina Adapter 1
PolyT/A
Index tag
Random bases
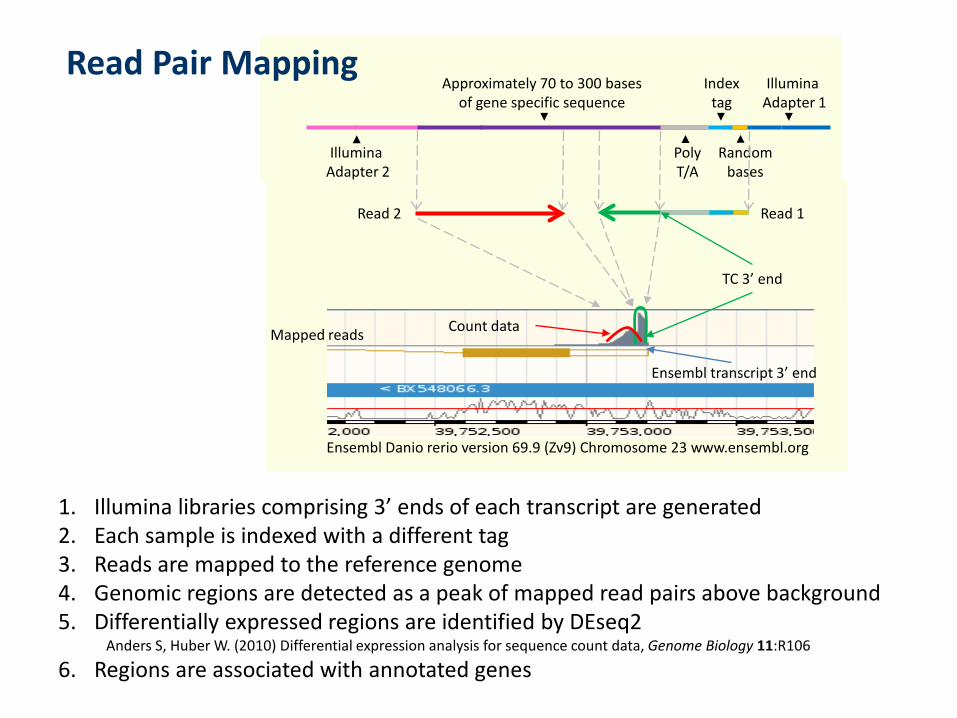
Approximately 70 to 300 bases of gene specific sequence
Read 1Read 2
TC 3’ end
Ensembl transcript 3’ end
Count data
Ensembl Danio rerio version 69.9 (Zv9) Chromosome 23 www.ensembl.org
Mapped reads
1. Illumina libraries comprising 3’ ends of each transcript are generated2. Each sample is indexed with a different tag3. Reads are mapped to the reference genome4. Genomic regions are detected as a peak of mapped read pairs above background5. Differentially expressed regions are identified by DEseq2
Anders S, Huber W. (2010) Differential expression analysis for sequence count data, Genome Biology 11:R106
6. Regions are associated with annotated genes
Read Pair Mapping

DeTCT input
Many biological replicates: 12 embryos per conditionOutput: Table of differentially abundant transcript ends~ 100 experiments analysed
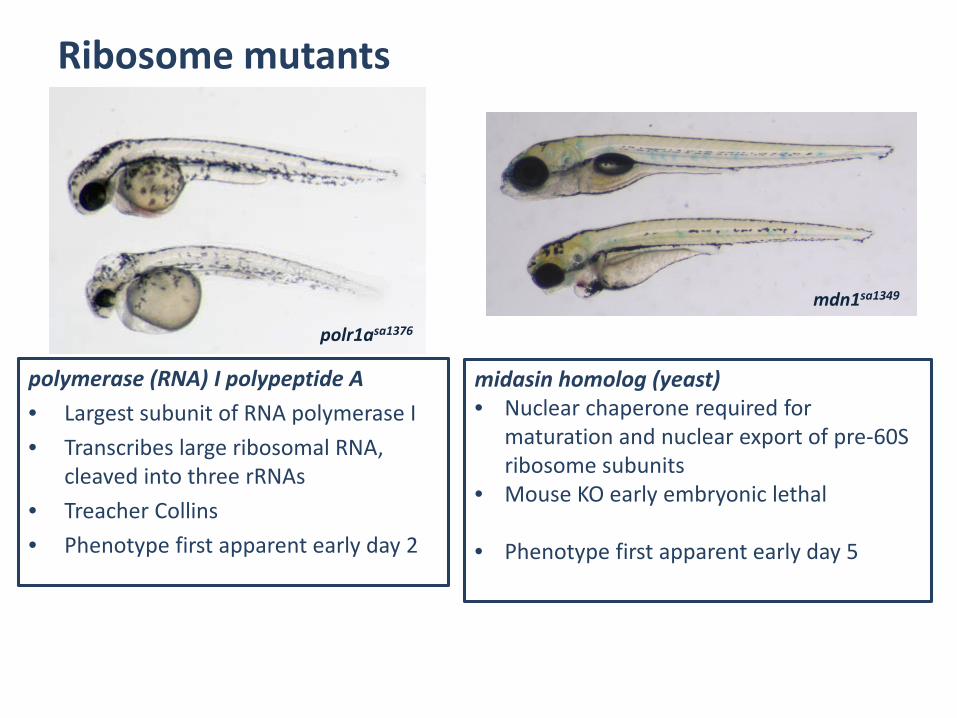
Ribosome mutants
polr1asa1376
mdn1sa1349
polymerase (RNA) I polypeptide A• Largest subunit of RNA polymerase I• Transcribes large ribosomal RNA,
cleaved into three rRNAs• Treacher Collins• Phenotype first apparent early day 2
midasin homolog (yeast)• Nuclear chaperone required for
maturation and nuclear export of pre-60S ribosome subunits
• Mouse KO early embryonic lethal
• Phenotype first apparent early day 5
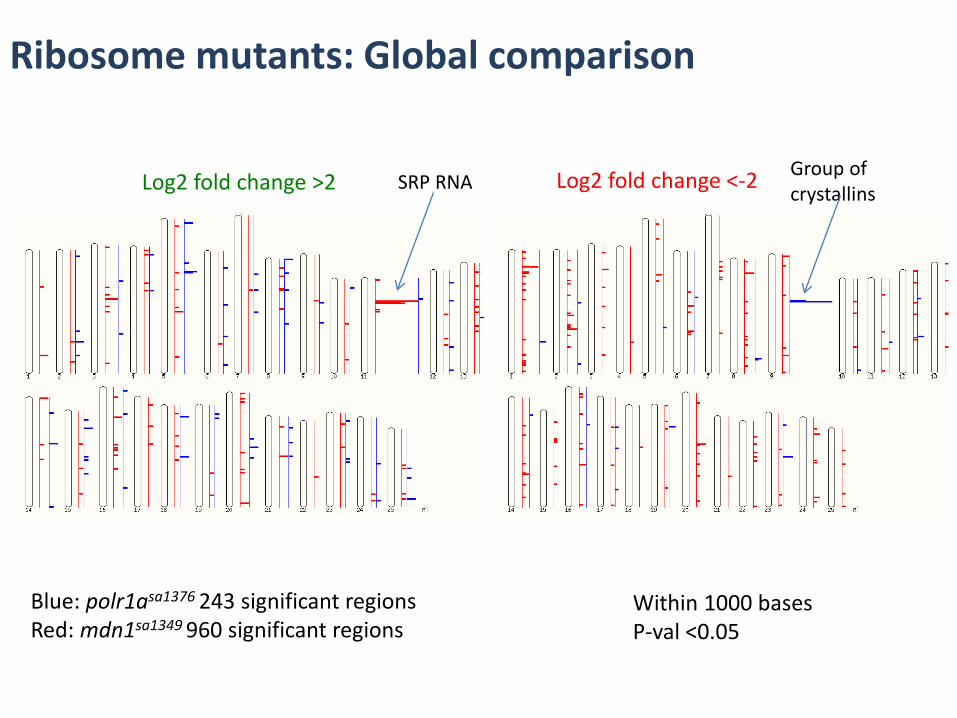
Ribosome mutants: Global comparison
Log2 fold change >2 SRP RNA Log2 fold change <-2 Group of crystallins
Blue: polr1asa1376 243 significant regionsRed: mdn1sa1349 960 significant regions
Within 1000 basesP-val <0.05

ZFIN: Comprehensive gene expression patternspolr1a http://zfin.org/ZDB-GENE-030131-5286

polr1asa1376: anatomical analysis
Enrichment analysis of ZFA terms
ZFA:0001477 portion of tissue 4.03E-18
ZFA:0001105 embryonic structure 6.12E-18
ZFA:0001512 anatomical group 1.03E-17
ZFA:0001439 anatomical system 2.24E-17
ZFA:0001308 organism subdivision 3.02E-14
ZFA:0000396 nervous system 3.85E-13
ZFA:0001490 cavitated compound organ 4.82E-13
ZFA:0001488 multi-tissue structure 5.15E-13
ZFA:0000496 compound organ 5.88E-12
ZFA:0000282 sensory system 7.81E-11
ZFA:0001127 visual system 1.36E-10
ZFA:0000107 eye 4.38E-10
ZFA:0001478 anatomical cluster 1.06E-09
ZFA:0009000 cell 2.74E-09
ZFA:0001114 head 7.62E-09
ZFA:0000093 blastomere 2.30E-08
ZFA:0001175 blastodisc 3.59E-08
ZFA:0000035 lens 4.16E-08
ZFA:0005566 anterior segment eye 7.89E-08
ZFA:0000445 optic tectum 1.57E-07
Visual system Nervous system
ZFA:0001328 neuromere 8.35E-06
ZFA:0000029 hindbrain 1.06E-05
ZFA:0001094 whole organism 1.42E-05
ZFA:0000037 anatomical structure 2.08E-05
ZFA:0000079 telencephalon 7.24E-05
ZFA:0000128 midbrain 8.75E-05
ZFA:0000101 diencephalon 5.28E-04
ZFA:0000109 forebrain 0.001206
ZFA:0000633 caudal tuberculum 0.001387
ZFA:0000516 periventricular grey zone 0.002074
ZFA:0000100 cerebellum 0.002128
ZFA:0000075 spinal cord 0.00255
ZFA:0000008 brain 0.003093
ZFA:0000599 torus semicircularis 0.003164
ZFA:0000012 central nervous system 0.004276
ZFA:0000098 proliferative region 0.006039
ZFA:0001261 ventricular system 0.01604
ZFA:0001679 solid lens vesicle 0.032223
ZFA:0000159 tectal ventricle 0.0374
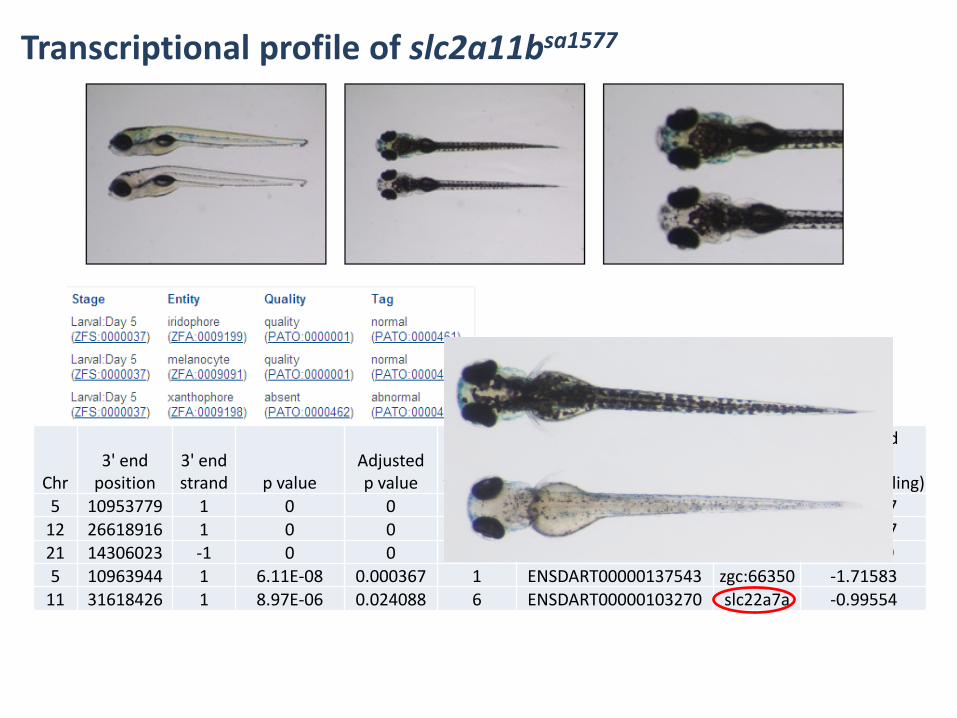
Transcriptional profile of slc2a11bsa1577
Chr3' end
position3' end strand p value
Adjusted p value
Distance to 3' end
e70 Ensembl Transcript ID
Gene name
Log2 fold change
(mutant/sibling)5 10953779 1 0 0 -6 ENSDART00000092333 slc2a11b -4.09817
12 26618916 1 0 0 0 ENSDART00000012265 gch2 -1.6850721 14306023 -1 0 0 4 ENSDART00000035742 cybasc3b 3.174595 10963944 1 6.11E-08 0.000367 1 ENSDART00000137543 zgc:66350 -1.71583
11 31618426 1 8.97E-06 0.024088 6 ENSDART00000103270 slc22a7a -0.99554
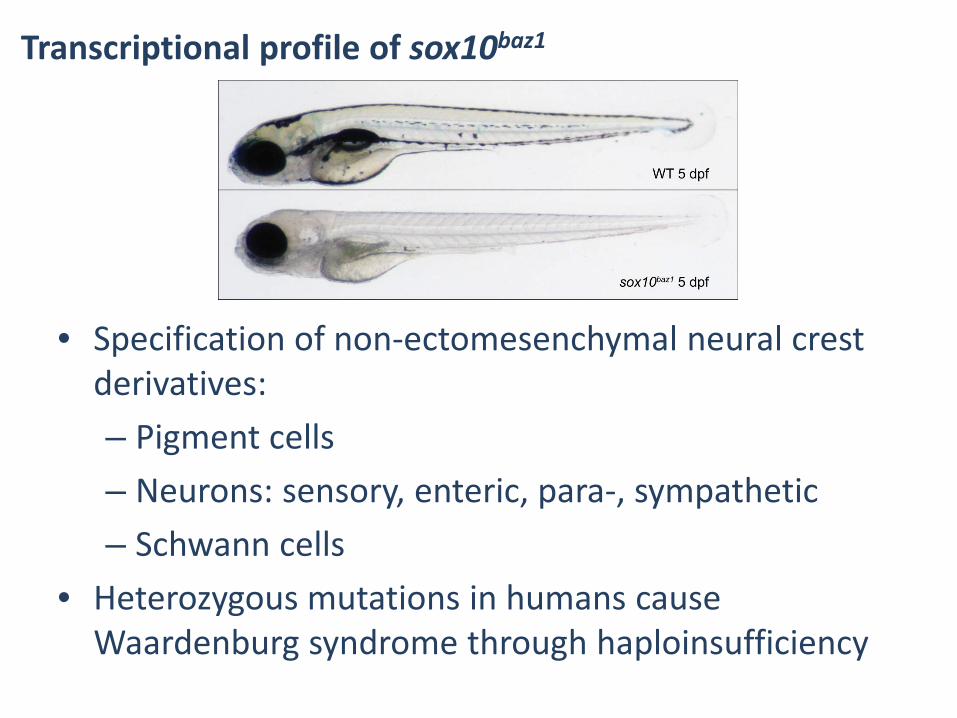
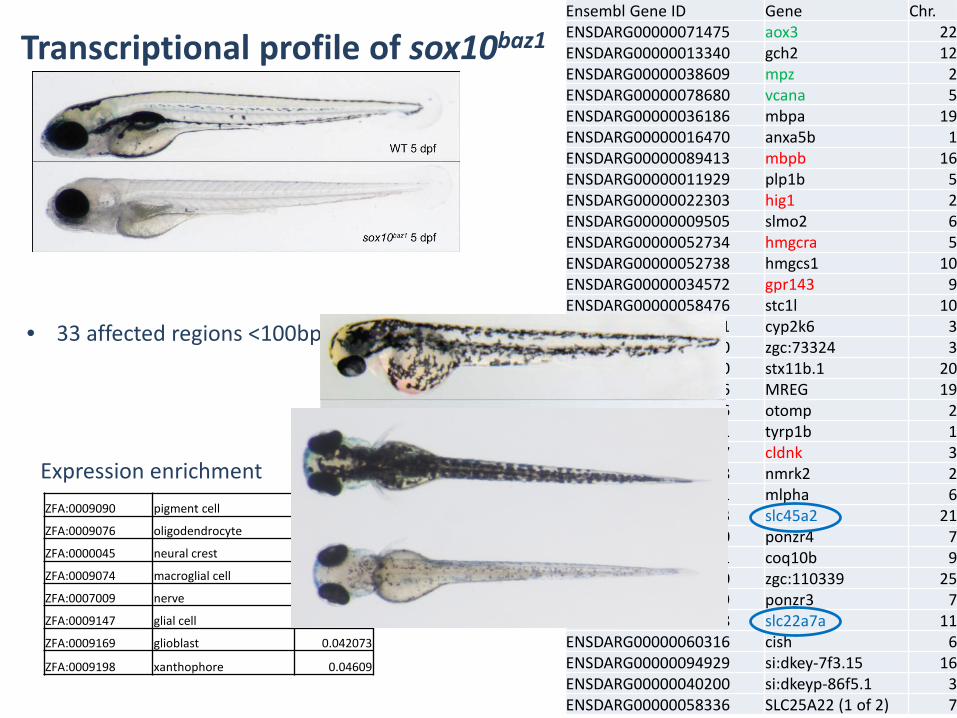
Transcriptional profile of sox10baz1
• Specification of non-ectomesenchymal neural crest derivatives:– Pigment cells– Neurons: sensory, enteric, para-, sympathetic– Schwann cells
• Heterozygous mutations in humans cause Waardenburg syndrome through haploinsufficiency
Transcriptional profile of sox10baz1
ZFA:0009090 pigment cell 3.77E-09
ZFA:0009076 oligodendrocyte 7.11E-04
ZFA:0000045 neural crest 0.023978
ZFA:0009074 macroglial cell 0.027105
ZFA:0007009 nerve 0.029275
ZFA:0009147 glial cell 0.039239
ZFA:0009169 glioblast 0.042073
ZFA:0009198 xanthophore 0.04609
Expression enrichment
• 33 affected regions <100bp gene distance
Ensembl Gene ID Gene Chr.ENSDARG00000071475 aox3 22ENSDARG00000013340 gch2 12ENSDARG00000038609 mpz 2ENSDARG00000078680 vcana 5ENSDARG00000036186 mbpa 19ENSDARG00000016470 anxa5b 1ENSDARG00000089413 mbpb 16ENSDARG00000011929 plp1b 5ENSDARG00000022303 hig1 2ENSDARG00000009505 slmo2 6ENSDARG00000052734 hmgcra 5ENSDARG00000052738 hmgcs1 10ENSDARG00000034572 gpr143 9ENSDARG00000058476 stc1l 10ENSDARG00000038371 cyp2k6 3ENSDARG00000009040 zgc:73324 3ENSDARG00000029290 stx11b.1 20ENSDARG00000011076 MREG 19ENSDARG00000040306 otomp 2ENSDARG00000056151 tyrp1b 1ENSDARG00000042357 cldnk 3ENSDARG00000067848 nmrk2 2ENSDARG00000070991 mlpha 6ENSDARG00000002593 slc45a2 21ENSDARG00000087440 ponzr4 7ENSDARG00000056141 coq10b 9ENSDARG00000046030 zgc:110339 25ENSDARG00000088589 ponzr3 7ENSDARG00000056028 slc22a7a 11ENSDARG00000060316 cish 6ENSDARG00000094929 si:dkey-7f3.15 16ENSDARG00000040200 si:dkeyp-86f5.1 3ENSDARG00000058336 SLC25A22 (1 of 2) 7

Functional annotation: Current focus
• Unbiased vs. targeted analysis– Random mutagenesis for unbiased gene analysis
• KO alleles in 26,000 genes• Phenotypes for 8,000 genes
– CRISPR/Cas9 for targeted groups of genes
• Transcriptional profiling using DeTCT– Thus far 39 experiments complete, with 78 sets of samples collected
• Expand profile network analysis
• Single embryo transcriptional profiling– Independent from morphological phenotype
• Single cell transcript counting
AcknowledgementsZMP:Elisabeth Busch-NentwichRoss KettleboroughSteve HarveyAmanda HallCatherine ScahillChris DooleyIan PackhamIan SealyJohn CollinsJorge ZamoraNeha WaliPeter ClarkeRichard ClarkRichard GibbonsRichard WhiteRoiseann CainSamantha CarruthersZsofia Pusztai
Jeffrey BarrettMari NiemiJames Morris
Animal Support:James BussellDiane HazlehurstNick HarmanNicola Goodwin
DNA pipelines
Freek van Eeden
ZIRC, Eugene:Zoltan VargaApril Freeman
ZFIN, Eugene:Leyla Ruzicka
EZRC, KIT Karlsruhe:Robert GeislerJana Maier