The World Bank Group Bangladesh
36
The World Bank Group Bangladesh Fiscal Costs of Non-financial Public Corporations Naoko C. Kojo Economic Policy and Debt Department August 2010 Public Disclosure Authorized Public Disclosure Authorized Public Disclosure Authorized Public Disclosure Authorized
Transcript of The World Bank Group Bangladesh

The World Bank Group
Bangladesh Fiscal Costs of Non-financial Public Corporations
Naoko C. Kojo
Economic Policy and Debt Department
August 2010
Pub
lic D
iscl
osur
e A
utho
rized
Pub
lic D
iscl
osur
e A
utho
rized
Pub
lic D
iscl
osur
e A
utho
rized
Pub
lic D
iscl
osur
e A
utho
rized
wb350881
Typewritten Text
98267

2
Bangladesh: Fiscal Costs of Non-Financial Public Corporations
Naoko C. Kojo1
Contents 1. Introduction .............................................................................................................................................. 3
2. Non-Public Financial Corporation in Bangladesh ................................................................................... 3
2.1 Financial Performance of the NFPC Sector .................................................................................. 4
2.2 Fiscal transfers to NFPCs .............................................................................................................. 7
3. Bangladesh Power Development Board (PDB) ..................................................................................... 10
3.1 Power Sector Reform .................................................................................................................. 10
3.2 Tariff Analysis ............................................................................................................................ 11
3.3 Operation of PDB ....................................................................................................................... 13
3.4 Financial Performance of PDB ................................................................................................... 13
3.5 Fiscal Transfers to PDB .............................................................................................................. 19
4. Bangladesh Petroleum Corporation (BPC) ............................................................................................ 20
4.1 Petroleum Sector ......................................................................................................................... 21
4.2 BPC’s Operation ......................................................................................................................... 21
4.2 Tariff Analysis ............................................................................................................................ 23
4.4 Financial Performance ................................................................................................................ 24
4.5 Fiscal Transfers to BPC .............................................................................................................. 28
5. Fiscal Implication of New Power Purchase Agreements ....................................................................... 29
5.1 New Power Purchase Agreements .............................................................................................. 29
5.2 Fiscal Implication of New Power Purchase Agreements ............................................................ 30
6. Conclusion ............................................................................................................................................. 32
Appendix ..................................................................................................................................................... 34
References ................................................................................................................................................... 36
1 This paper has been prepared in response to a request from the Bangladesh country team. I am grateful for the
assistance provided by the country team members for the collection of requisite information. My thanks go to
Eduardo Ley (PRMED), Marijn Verhoeven (PRMPS), Daniel Altana (FIEL) and the IMF Bangladesh team for their
very helpful comments. All the remaining errors are mine.

3
1. Introduction
1. The overall fiscal position of Bangladesh looks sustainable, but there are concerns that the
country may be trapped in a low revenue-low capital spending equilibrium, which is holding back
Bangladesh’s growth potential. Eliminating wasteful spending and halting fiscal drains through
inefficient non-financial public corporations (NFPCs) are important ways to create fiscal space,
particularly in the area of infrastructure.
2. This paper reviews the financial performance of the NFPC sector in Bangladesh, with a specific
focus on two major loss-making firms: Bangladesh Petroleum Corporation (BPC) and Power
Development Board (PDB). The objective of this paper is to update the Bank’s knowledge on the
financial performance of the NFPC sector and estimate the fiscal costs emanating from the sector.
3. This paper was prepared based on the information available on the public domain, supplemented
by the data provided by the Monitoring Cell of the Ministry of Finance as well as the existing knowledge
base in the Bank. As the first phase of a multi-phased study, the analysis presented in this paper focuses
exclusively on the financial aspects of the NFPC sector, and was carried out entirely away from the field
on a desk basis, with the understanding that the next phase would involve information gathering on the
ground. It is important to note that statistics on NFPCs are generally of poor quality. Data are often
partial and inconsistent with each other even if they are obtained from the same sources. As such, the
information and statistics presented in this paper should be interpreted with caution, although every effort
was made to reconcile the inconsistent and sometimes conflicting information.
4. The study finds that the NFPC sector has indeed absorbed a considerable amount of fiscal
resources. In FY2008 alone, for example, at least Tk. 378 billion (US$5.5 billion, or 7 percent of GDP)
was channeled to the sector through explicit, implicit and quasi-fiscal means. Of this amount, transfers to
PDB and BPC were estimated at over Tk. 151 billion (2.8 percent of GDP), around 40 percent of total
fiscal assistance to the NFPC sector. Considering Bangladesh’s limited revenue mobilization capacity,
the large fiscal costs associated with inefficient enterprises represent a major fiscal drain, which crowds
out spending for more productive purposes. Indeed, the economic costs associated with the
mismanagement of NFPCs in terms of lost growth opportunities and unemployment must be significant.
5. The study also shows considerable fiscak risks from the newly signed power purchase agreements,
an emergency response to the ongoing power crisis. Scenario analysis suggests that the new agreements
are likely to emtail very large costs to PDB, raising the firm’s net loss from Tk. 9 billion in FY2009 to
beyond Tk. 100 billion in FY2011, even if the average tariff is raised by 15 percent. PDB would face
serious liquidy problems, requiring significant fiscal assistance to continue its core business. Regardless
of how resources are transferred, the fiscal and economic implications would be considerable.
6. The structure of the paper is as follows. Section 2 will provide an overview of the recent
development in the NFPC sector, with a view to identifying financially troubled enterprises. Sections 3
and 4 will respectively review the financial performance of the two major loss-making NFPCs—PDB and
BPC—and attempt to estimate the magnitude of fiscal resources transferred to them in a variety of means.
Section 5 will turn attention to the recent power purchase agreements signed and estimate their budgetary
implications. Finally Section 6 will conclude the paper.
2. Non-Public Financial Corporation in Bangladesh
7. In Bangladesh, NFPCs engage in an extensive range of commercial and quasi-fiscal activities.
Currently, there are 45 NFPCs operating in seven broad industrial sectors: manufacturing, utilities,

4
transport and communication, commerce, agriculture and fisheries, construction and services and other
sectors. Most of the NFPCs operate under government regulations and are subject to interventions in
pricing, operation and management.
2.1 Financial Performance of the NFPC Sector
8. Performance of the NFPC sector as a whole has been unsatisfactory. According to the data
obtained directly from the Monitoring Cell—Non-financial Public Enterprise Economic Classification of
Estimates (see Appendix)—the sector has chronically reported a net loss for the past two decades, except
for FY2009, when it recorded a net profit after tax, of Tk. 20 billion (Table 1).2
Table 1. Consolidated Financial Results of Non-financial Public Corporations /1
(in billions of Taka, unless otherwise indicated)
FY05 FY06 FY07 FY08 FY09
Operating revenue 359.4 459.4 500.6 551.7 668.0
Operatnig surplus -25.7 -16.1 -18.6 -32.5 38.3
Non-operating income (net) -3.5 -4.7 -1.3 -3.5 -7.0
o/w Grants/subsidies 0.1 0.1 0.1 0.1 0.1
o/w Financing charges 9.4 12.0 12.4 12.8 16.0
Net profit before tax -29.2 -20.8 -19.9 -36.0 31.3
Direct tax 1.3 5.2 6.9 9.1 10.9
Net profit after tax -30.6 -26.0 -26.8 -45.1 20.5
Dividend 0.1 4.8 5.6 5.7 7.2
Memorandum items:
Total assets 1,252.2 1,327.7 1,621.5 1,558.5 1,631.8
Equity 361.6 348.1 508.3 555.2 538.5
Value added 8.6 27.6 26.5 19.8 87.5
Net profit after tax in percent of GDP (%) -0.8 -0.6 -0.6 -0.8 0.3
Value added in percent of GDP (%) 0.2 0.7 0.6 0.4 1.4
Operating profit in percent total assets (%) -2.1 -1.2 -1.1 -2.1 2.3
Dividends in percent of equity (%) 0.02 1.37 1.10 1.02 1.33
Sources: Non-financial Public Enterprise Economic Classification of Estimates for the year 2004-05, 2005-06,
2007-08, and 2008-09 (Annual Audited Data), obtained directly from Monitoring Cell.
1/ Note that the net loss for FY08 is likely to be under-estimated and the net profit for FY09 over-estimated, since it
does not include the financial results of Bangladesh Biman Corporation (BBC), a chronic loss-making corporation.
The magnitude of under/over-estimation is likely to be rather limited, however, because the firm’s net loss is usually
small.
9. Five NFPCs—Bangladesh Oil, Gas and Mineral Resources Corporation (BOGMC or
Petrobangla), Chittagong Port Authorities (CPA), Bangladesh Telecommunication Regulatory
Commission (BTRC), Rural Electric Board (REB) and Chittagong Development Authority (CDA)—have
shown a particularly strong performance over the past five years, constantly reporting a positive net profit.
Of the five enterprises, Petrobangla has been the main contributor to the national budget through
corporate tax and dividend payments. In FY2009 alone, Petrobangla made a contribution in the amount
of Tk. 12 billion, accounting for over 70 percent of the overall NFPCs’ contribution to the budget.
2 Note that net losses were made even after the sector received various explicit, implicit and quasi-fiscal transfers.
See below for further discussions.

5
10. In sharp contrast, four companies have chronically reported a net loss, attributing to the bulk of
the consolidated NFPC net losses. They are Bangladesh Petroleum Corporation (BPC), Bangladesh
Power Development Board (PDB), Bangladesh Jute Mills Corporation (BJMC) and Bangladesh Sugar
and Food Industries Corporation (BSFIC), in the order of loss magnitude.
11. Indeed, if these four enterprises
are excluded, one finds considerable
improvements in the consolidated
financial results of the sector since
FY2003 (Figure 1 and Table 2), although
this achievement should be discounted on
account of vatrious fiscal supports
extended to the sector (see below for
further discussions). The exclusion of the
four enterprises also reveals that NFPCs
other than these four have in general made
a decent tax contribution to the budget;
the effective income tax rate ranges
between 14 percent and 27 percent against
the statutory corporate income tax rate of
27.5 percent and 37.5 percent for publicly
and non-publicly traded companies.3
12. Among the four enterprises, the
large losses made by PDB and BPC are
particularly noteworthy. During FY2008 and FY2009, these two enterprises together accounted for 82-95
percent of the consolidated NFPC net loss.
Table 2. Financial Indicators (in percent)
FY05 FY06 FY07 FY08 FY09
Value added in percent of GDP
All NFPCs 0.2 0.7 0.6 0.4 1.4
Excluding PDB, BPC, BJMC and BSFIC 0.7 1.2 1.1 1.4 1.4
Net profit after tax in percent of GDP
All NFPCs -0.8 -0.6 -0.6 -0.8 0.3
Excluding PDB, BPC, BJMC and BSFIC 0.2 0.4 0.4 0.7 0.8
Operating profit in percent of total assets
All NFPCs -2.1 -1.2 -1.1 -2.1 2.3
Excluding PDB, BPC, BJMC and BSFIC 0.7 2.0 1.8 4.1 5.3
Return on equity
All NFPCs 0.0 1.2 1.2 1.1 1.4
Excluding PDB, BPC, BJMC and BSFIC 0.0 1.4 1.1 1.0 1.3
Effective income tax rate
All NFPCs -4.6 -25.2 -34.7 -25.2 34.6
Excluding PDB, BPC, BJMC and BSFIC 14.6 22.7 26.4 19.0 17.6
Source: Author’s calculation based on Non-financial Public Enterprise Economic Classification of Estimates for the
year 2004-05, 2005-06, 2007-08, and 2008-09 (Annual Audited Data), obtained directly from Monitoring Cell.
3 http://www.nbr-bd.org/incometax.html.
Figure 1. Net Profit/Loss of NFPCs (after tax)
(in billions of FY00 Taka)
Source: Author’s calculation based on data obtained directly from the
Monitoring Cell.
-60
-50
-40
-30
-20
-10
0
10
20
30
40BPC
PDB
BJMC
BSFIC
Others
Consolidated NFPC net profit/loss

6
13. At this point, it is important to ponit out serious data issues regarding NFPCs in Bangladesh.
Statistics on the NFPC sector are generally weak and unreliable. Data are often significantly inconsistent
even when they are obtained from the same source. Table 3 shows the financial results of the
consolidated NFPC sector, presented in various parts of the Bangladesh Economic Review 2009, and
compares them with those reported in Non-financial Public Enterprise Economic Classification of
Estimates obtained from the Monitoring Cell (as presented in Table 1). Interestingly, all the tables
presented in the Bangladesh Economic Review 2009 refer to the Monitoring Cell as the data source, but
often the reported figures differ, sometimes by a large margin. Further investigation is warranted to
clarify what explains the large differences.
Table 3. Financial Results of NFPCs from Various Sources (in billions of Taka)
FY05 FY06 FY07 FY08 FY09
Operating revenue
Economic Review (Table 9.1, p. 120) 362.7 443.4 331.8 200.2 -
Economic Review (Table 9.3, p. 122) 362.7 443.4 500.6 200.2 -
Economic Review (Appendix 35, p. 293) - - - - -
Obtained directly from Monitoring Cell 359.4 459.4 500.6 551.7 668.0
Operating surplus
Economic Review (Table 9.1, p. 120) -24.7 -27.0 -15.7 36.1 -
Economic Review (Table 9.3, p. 122) -24.7 -27.0 -18.6 36.1 -
Economic Review (Appendix 35, p. 293) - - - - -
Obtained directly from Monitoring Cell -25.7 -16.1 -18.6 -32.5 38.3
Dividend contribution
Economic Review (Table 9.3, p. 122) 0.6 2.9 5.6 5.4 -
Economic Review (Appendix 36, p. 294) 5.7 2.4 0.6 0.4 4.1
Obtained directly from Monitoring Cell 0.1 4.8 5.6 5.7 7.2
Net profit after tax
Economic Review (Table 9.1, p. 120) - - - - -
Economic Review (Table 9.3, p. 122) -29.3 -34.4 -26.8 27.9 -
Economic Review (Appendix 35, p. 293) -26.8 -28.5 -26.8 -38.4 -20.5
Obtained directly from Monitoring Cell -30.6 -26.0 -26.8 -45.1 20.5 Sources: Bangladesh Economic Review 2009 and Non-financial Public Enterprise Economic Classification of Estimates for the
year 2004-05, 2005-06, 2007-08, and 2008-09 (Annual Audited Data), obtained directly from the Monitoring Cell. Note that
revised data for FY09, to be published in the Bangladesh Economic Review 2010 (forthcoming), are not reflected in this table.
14. As of end-June 2009, the NFPC sector’s liabilities to the central government were estimated at Tk.
727 billion (or about 12 percent of GDP), of which Tk. 545 billion was in arrears (
15. Table 4). The status of such liabilities is uncertain as it does not appear that the government is
actively pursuing the collection of these liabilities. PDB held, by far, the largest debt service liabilities to
the government. Its debt to the government stood at Tk. 340 billion (including arrears of Tk. 295 billion),
about 47 percent of total NFPCs’ liabilities to the government. Data on the NFPC sector’s debt to the
government are weak. While attempts were made to generate time series data based on past issues of the
Bangladesh Economic Reviews, significant data inconsistencies across time and series have hampered the
creation of a meaningful time series database.

7
Table 4. NFPCs’ Debt to Central Government as of June 30, 2009 (in billions of Taka)
Principal
outstanding
Arrears Total
Principal Interest
Total 182.3 206.5 338.1 726.9
Of which
PDB 44.5 103.9 191.3 339.7
Petrobangla (BOGMC) 13.3 29.8 46.6 89.6
BCIC /1 8.7 25.5 32.2 66.4 Source: Bangladesh Economic Review 2009 (Appendix 37, p. 295).
1/ Bangladesh Chemical Industries Corporation, whose main products include fertilizer.
16. The extent of NFPCs’ overall indebtedness is unknown, although their liabilities to the
government are likely to account for the major portion of their total debt. While the Bangladesh
Economic Review 2009 presents the NFPCs’ outstanding and classified loans from the domestic banking
system, of Tk. 142 billion, this is believed to be only the tip of the iceberg. Over time, the enterprises
have “borrowed” from domestic banks in the form of overdrafts, received foreign loans (not as on-lending
from the government) and accumulated arrears to suppliers.
17. Likewise, the extent of government explicit contingent liabilities associated with NFPCs is
unknown. While the central government’s explicit guarantees to public enterprises (both financial and
non-financial) are published in the Budget in Brief (Statement VIA) since FY2008, the reported figures
are for original loan principals only.4 Information on the outstanding principals of guaranteed loans and
their service schedule is unavailable, hampering assessment of fiscal risks from explicit guarantees.
Information regarding the explicit guarantees actually invoked—that is, debt service payments passed
onto the government—is not regularly published. Nonetheless, given that the bulk of government bail-
outs in the past were associated with un-guaranteed obligations as we will show in the reminder of this
paper, risk assessment based on explicit guarantees would be by far in adequate in the case of Bangladesh.
2.2 Fiscal transfers to NFPCs
18. To keep NFPC financially afloat, the government has transferred a significant amount of fiscal
resources to NFPCs through explicit and implicit means, as well as quasi-fiscal channels through non-
government public sector entities. Generally speaking, explicit fiscal transfers are those that entail
immediate cash movements from the budget, and are recorded explicitly as government expenditure and
lending in the budget. In contrast, implicit transfers do not inolve immediate cash movement. Because of
this, and because of the difficulties in quantifying some of the transfers, implicit fiscal assistance is often
un-recorded and hidden from the public eye.5
Quasi-fiscal transfers, which may or may not involve cash
transfers, occur outside the national budget framework, but within the public sector.
19. Explicit budgetary financing to NFPCs has been provided in the form of current grants/subsidies,
equity financing, government loans (including on-lending) and ADP appropriation as project financing
(i.e., capital transfer). When the central government assume liabilities owed by NFPCs (guaranteed or
not) involving immediate cash payment out of the national budget, this payment is regarded as an explicit
fiscal transfer.
4 www.mof.gov.bd/en/budget/10_11/brief/en/st6A.pdf?phpMyAdmin=GqNisTr562C5oxdV%2CEruqlWwoM5
5 Some of the implicit transfers, for example, forgone dividends and corporate tax, are not easily quantifiable, and
thus are not recorded.

8
20. Implicit fiscal support to NFPCs has taken a number of forms, such as defaults on government
loans (i.e., accumulation of arrears on government loans), take-over of an NFPC’s liabilities through bond
issues (i.e., not involving immediate cash payment from the budget), deferred tax payments, including
incompliance of tax obligations (VAT, duties and corporate tax), forgone dividend and corporate tax
payments on account of NFPCs’ poor financial performance, ex-post conversion of loans to equity or
grants, recapitalization of state-owned commercial banks prompted by the accumulation of NFPCs’ non-
performing loans,6 running down of company assets, and so on.
21. Quasi-fiscal transfers to NFPC have included build-up of payables within NFPCs (inter-enterprise
arrears), input subsidization through other NFPCs, and borrowing from nationalized commercial banks, as
well as the accumulation of overdrafts from these banks. If the interest rate charged on the loans from
state-owned commercial banks is subsidized, the differential between the market interest rate and the rate
applicable to the loan also constitutes additional quasi-fiscal transfers to NFPCs.
22. The choice regarding the form of fiscal transfer appears rather ad hoc. It is generally believed
that the magnitude of implicit and quasi-fiscal assistance to NFPCs has outweighed the explicit transfers
by a large margin.
23. Quantifying the total fiscal and quasi-transfers to NFPCs, in a comprehensive manner, is
extremely tricky, due to data weaknesses as well as the un-measurable nature of some of the implicit
transfers, for example forgone dividend and direct tax payments. While some information, such as
individual NFPCs’financial results and their debt service liabilities to the central government (including
arrears) are monitored and recorded by the Monitoring Cell of the Ministry of Finance, data are often
sketchy and there are a number of inconsistencies across time and entry.
24. Available information suggests that fiscal and quasi-fiscal transfers to NFPCs amounted to, at
least, Tk. 378 billion (US$ 5.5 billion) in FY2008 and Tk. 345 billion (US$ 5 billion) in FY2009, about
6.9 percent and 5.6 percent of GDP, respectively (Table 5). Note that these figures are partial estimates
and do not include many other fiscal transfers, for which detailed information is unavailable. For
example, while it is believed that transport NFPCs benefited from subsidized fuels, the lack of
information on volume of petroleum products they purchased from BPC and the price paid for each
product makes it impossible to estimate the fiscal costs of such subsidies.7
Another example is the
invoked government guarantees on NFPC loans, on which again information is unavailable at least on the
public domain. Of the Tk. 374 billion provided to NFPCs during FY2008, fiscal transfers to PDB and
PBC were estimated at Tk.151 billion, about 40 percent of total assistance to NFPCs during that year, as
we will discuss in greater details in Sections 3 and 4.
6 Bangladesh Bank Annual Report (2009) reports that a large non-performing loan portfolio has been the major
predicament of banks, particularly of state owned commercial banks (p. 37). 7 These NFPCs would include Bangladesh Shipping Corporation (BSC), Bangladesh Inland Water Transport
Corporation (BIWTC), Bangladesh Biman Corporation (BBC), and Bangladesh Road Transport Corporation
(BRTC).

9
Table 5. Various Fiscal Transfers to NFPCs (in billions of Taka)
FY08 FY09
Explicit transfer 70.5 97.3
Grants/subsidies 0.1 0.1
Government loans (net) 1.8 2.7
Equity injection 23.7 19.3
ADT (capital transfer) 44.8 75.3
Implicit transfer 85.0 58.7
Accumulation of arrears on gov. loans (net) 11.3 58.7
Take-over of NFPC liabilities thru bond issue /1 73.7 0.0
Quasi-fiscal transfer 222.3 188.6
Gas subsidies to PDB and BCIC 110.0 75.8
Petrol subsidies to PDB /2 3.6 0.0
Net credit from banking system 108.7 112.8
Total 377.7 344.6
In percent of GDP 6.9% 5.6% Sources: Author’s calculation based on Bangladesh Economic Review (2008, 2009),
Bangladesh Bank Annual Report (2008, 2009), and Non-financial Public Enterprise
Economic Classification of Estimates for the year 2004-05, 2005-06, 2007-08, and
2008-09 (Annual Audited Data), Budget in Brief (2007-08, 2008-09), and information
obtained from www.petrobangla.org.bd.
1/ See Table 6. There was no take-over of NFPC liabilities through issuance of
government securities in FY2009.
2/ There were no fuel subsidies to PDB in FY2009 when international prices of
petroleum products dropped just below PDB’s purchase prices. See Table 13.
25. Explicit transfers to NFPCs—resource transfers to NFPCs out of national budget—accounted for
a small proportion of the total fiscal transfers to NFPCs, estimated at Tk. 70 billion in FY2008 and Tk. 97
billion in FY2009. Equivalently, the government of Bangladesh spent 11 percent and 14 percent of its
revenue on NFPCs in FY2008 and FY2009 respectively. Equity injections and capital transfers were the
two main forms of explicit fiscal transfers, whereas current grants/subsidies as well as borrowing from the
government (net)—estimated from the stock figures—were rather limited in these years.
26. By accumulating its arrears on government loans, the NFPC sector received Tk. 11 billion and Tk.
59 billion in FY2008 and FY2009, respectively, as implicit transfers. The central government’s take-over
of NFPCs’ liabilities to banks, in the mount of Tk. 74 billion, through the issuance of Treasury bonds in
FY2008 also constituted part of the implicit transfer to the NFPC sector (Table 6).8
Table 6. Issuance of Government Security for the Take-over of NFPC liabilities in FY2008
(in billions of Taka)
Name of Security Objective Amount
3-year (Pubali Bank) Treasury Bond To repay the loan of BADC 0.2
2-year & 3-year BPC Treasury Bond To repay the loan of BPC 18.0
BPC Treasury Bond (5-year and above) To repay the loan of BPC 55.3
5-year BSFIC Treasury Bond To repay the loan of BSFIC to Janata Bank 0.2
Total 73.7
Source: Bank of Bangladesh Annual Report (2008, 2009).
8 The liabilities of Tk. 74 billion were related to losses that were financed by bank loans.
10
27. Finally, if we assume that the bulk of net credit to NFPCs was provided by state-owned
commercial banks—a plausible assumption as profit-maximizing private banks are likely to shy away
from financially unviable enterprises—then the estimated quasi-fiscal assistance through the banking
system stood at Tk. 109 billion and Tk. 113 billion in FY2008 and FY2009, respectively. Some of these
credits could become viable, ex post, if and when the NFPCs became commercially viable. Input
subsidies (gas, petroleum products) to NFPCs were particularly large in FY2008, estimated at Tk. 114
billion, because of the wide gap between world and domestic administered prices. With the fall in
international commodity prices, quasi-fiscal transfers through input subsidized shrank in FY2009, to Tk.
76 billion. This is still a large amount.
28. The remainder of this paper focuses on the financial performance of Bangladesh Power
Development Board (PDB) and Bangladesh Petroleum Corporation (BPC), the two main loss-making
enterprises, and estimates the magnitude of fiscal resources they have absorbed over time.
3. Bangladesh Power Development Board (PDB)
3.1 Power Sector Reform
29. The Bangladesh power sector has experienced numerous institutional and operational changes
during the past decades. Through policy frameworks proposed by several documents, including the Power
Sector Reform in Bangladesh (1993) and National Energy Policy (1996), the sector has undergone a
series of reforms—including sector unbundling, private sector participation, corporatization of entities
and establishment of an independent regulatory commission—in order to harness competition, encourage
private participation and ensure operational improvements and financial solvency of power sector entities.
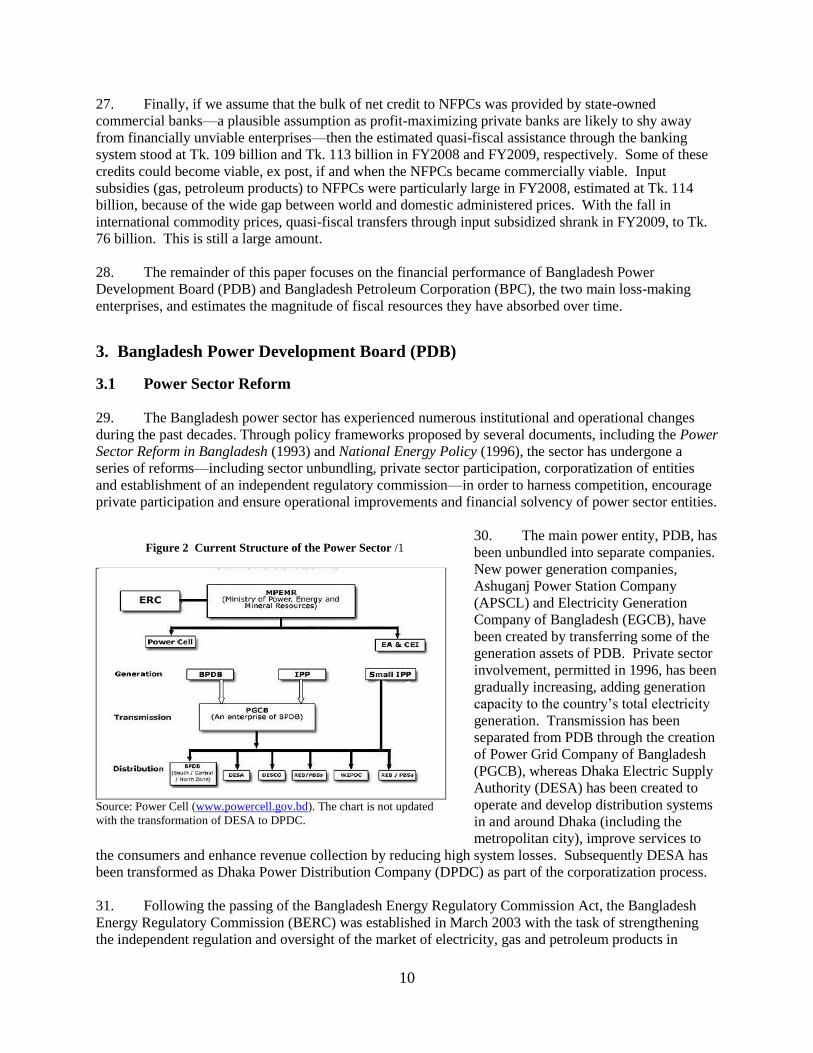
30. The main power entity, PDB, has
been unbundled into separate companies.
New power generation companies,
Ashuganj Power Station Company
(APSCL) and Electricity Generation
Company of Bangladesh (EGCB), have
been created by transferring some of the
generation assets of PDB. Private sector
involvement, permitted in 1996, has been
gradually increasing, adding generation
capacity to the country’s total electricity
generation. Transmission has been
separated from PDB through the creation
of Power Grid Company of Bangladesh
(PGCB), whereas Dhaka Electric Supply
Authority (DESA) has been created to
operate and develop distribution systems
in and around Dhaka (including the
metropolitan city), improve services to
the consumers and enhance revenue collection by reducing high system losses. Subsequently DESA has
been transformed as Dhaka Power Distribution Company (DPDC) as part of the corporatization process.
31. Following the passing of the Bangladesh Energy Regulatory Commission Act, the Bangladesh
Energy Regulatory Commission (BERC) was established in March 2003 with the task of strengthening
the independent regulation and oversight of the market of electricity, gas and petroleum products in
Figure 2 Current Structure of the Power Sector /1
Source: Power Cell (www.powercell.gov.bd). The chart is not updated
with the transformation of DESA to DPDC.

11
Bangladesh. The commission became effective in April 2004, but the agency is just becoming
operational now after long delays. As in other countries, the regulator has the authority to set wholesale
and retail tariffs of electricity, gas and petroleum products, as well as to issue and revoke licenses in the
energy sector. The Ministry of Power, Energy and Mineral Resources is now solely responsible for
setting the overall policy framework, overseeing state-owned energy enterprises.
32. The reform has so far failed to achieve the intended objectives in terms of improved competition,
increased private sector participation, and most importantly, reliable supply of electricity. There are,
however, some positive results such as the marked reduction in system losses and improved revenue
collection. Still, PDB continues to make large losses, while some new entities, such as PGCB and
DESCO are earning profits. Frequent load shedding is perennial and is causing serious impacts on
commercial activities and discomfort in the life of citizens. Currently, the country is facing around 1,500
MW of power shortages, a margin that will take years to narrow given the lack of public funds available
and the long lead times between securing funding and the completion of new power plants.
3.2 Tariff Analysis
33. Electricity tariffs are set by BERC for both retail and bulk supply of electricity. BERC issued its
first ever tariff order on March 1, 2007. The latest tariff adjustment (second tariff order) became effective
on March 1, 2010 (Table 7). Currently, PDB, DPDC, DESCO and WZPDC charge identical retail tariffs.
34. The tariff structure in Bangladesh is standard, charging different tariffs for different consumer
categories. Residential users pay a fixed charge and a variable increasing block-charge based on the
consumption level. As in many countries, cross-subsidization exists between customer categories, with
the commercial sector covering the bulk of the cross-subsidy. Electricity bills for retail consumers
include VAT of five percent on the total value of electricity consumed as well as the service and demand
charges. The VAT collection goes directly into the Treasury Account from banks, through which
consumers pay the bill, without channeling PDB.
35. The tariff adjustment process is not very transparent. Although an electricity pricing formula was
adopted in 2003 as part of the Bank’s financial support to the country, the implementation of the formula
has never happened. Similarly, while the Bangladesh Energy Regulatory Commission Electricity
Distribution Tariff Regulation (2008) requires that licensees file a tariff application on a cost-plus basis, it
is said that the tariffs determined by BERC often reflect signals (and sometimes directions) from the
government, which treats power price adjustments with great sensitivity and in a coordinated fashion with
adjustments to the administered prices of food, petroleum products, natural gas and fertilizers (all of them
are subsidized).

12
Table 7. PDB Tariff Schedule (excluding VAT) Effective from March 1, 2010
Consumer Class Tariff per kWh Service Charge
(Tk/month)
Demand Charge
(Tk/kWh, month)
Minimum Charge
(Tk/KW, month) (Tk) (US¢ eqv.)
A: Residential
1 phase: 6
3 phase: 27 12 100
a) First Stage: 0-100kWh 2.6 3.9
b) Second Stage:101-400kWh 3.3 4.9
c) Third Stage: >400kWh 5.65 8.5
B: Agricultural pump 1.93 2.9
35
(for approved
demand of
< 30KW)
25 125
C: Small industry
63
37
(for approved
demand of
< 40KW)
n/a a) Flat 4.35 6.5
b) Off-peak 3.5 5.2
c) Peak 5.95 8.9
D: Non residential light & power 3.35 5.0 1 phase: 5
3 phase: 25 15 100
E: Commercial
1 phase: 6
3 phase: 27 22 125
a) Flat 5.58 8.4
b) Off-peak 4.05 6.1
c) Peak 8.45 12.6
F: Medium voltage general usage
(11KV)
355
42
(for maximum
demand)
80 a) Flat 4.17 6.2
b) Off-peak 3.43 5.1
c) Peak 7.12 10.7
G-1: Extra high voltage DESA
(132KV) 2.415 3.6 None n/a 80
G-2: Extra high voltage general
purpose ( 132 KV)
None
37
(for maximum
demand)
80
a) Flat 3.1 4.6
b) 23:00-6:00 HRS 1.63 2.4
c) 6:00-13:00 HRS 2.72 4.1
d) 13:00-17:00 HRS 1.82 2.7
e) 17:00-23:00 HRS 5.94 8.9
H: High voltage general purpose (33
KV)
410
37
(for maximum
demand)
80 a) Flat 3.92 5.9
b) Off-peak 3.33 5.0
c) Peak 6.82 10.2
I-1: PBSs 2.0389 3.1 400 n/a n/a
I-2: DESCO
None n/a n/a a) 132KV (flat) 2.415 3.6
b) 33KV (flat) 2.4452 3.7
I-3: WZPDCL
None n/a n/a a) 132KV (flat) 2.415 3.6
b) 33KV (flat) 2.4452 3.7
I-4:
None n/a n/a a) Other PDB zones (132KV) 2.415 3.6
b) Other PDB zones (33KV) 2.4452 3.7
J: Street light & water pump 3.98 6.0 205 37 n/a
Source: www.bpdb.gov.bd.

13
3.3 Operation of PDB
36. PDB is responsible for a major portion of generation and distribution of electricity mainly in
urban areas of the country, except for metropolitan city of Dhaka and its adjoining area.
37. As of end-FY2009, PDB had access to total installed capacity of 5,493 MW, including 1,330 MW
in independent power producers (IPPs) and 351 MW in rental power plans. The installed capacity of
PDB, including its two generation companies, was 3,812 MW.
38. Of the total installed capacity of 5,493 MW, the maximum available generation capacity however
was only 4,162 MW, that is, only three fourth of installed capacity was available for generation. The gap
between the installed capacity and actual production is, according to the recent Budget speech,
attributable to the erosion in capacity utilization due to aging, defective and inadequate transmission and
distribution system, as well as shortages of natural gas, the main fuel used for power generation.9
39. During FY2009, 15,449 GWh of net energy was generated in the public sector power plant under
PDB. In addition, PDB purchased 10,173GWh of electricity from IPPs and rental power plants in the
private sector at a fixed rate. The net energy generated by public and private sector plants stood at 25,622
GWh. PDB sold about 85 percent of total energy generation to four distribution companies, DPDC, REB,
DESCO and WZPDC (“bulk supply”), and distributed the remainder to its distribution areas.
40. The main fuel for power generation is natural gas (88.4 percent), followed by furnace oil (3.9
percent) and diesel (2 percent). Domestic prices of these fuels are regulated and fixed by BERC at
substantially below market levels. The subsidized fuels serve as a significant input subsidy to PDB,
lowering its costs of sales and raising the operating profit unless otherwise.
3.4 Financial Performance of PDB
41. PDB’s financial statements show that the enterprise is facing serious viability problems. Since
the mid-1990s, year after year it has incurred an operating and net loss (Table 8). PDB has made no
dividend and corporate tax payments to the national budget for quite some time. As stated earlier, VAT
on electricity supply goes directly to the national budget without being channeled through PDB.
Table 8. PDB Income Statement (in billions of Taka)
FY05 FY06 FY07 FY08 FY09
Operating revenue 44.7 46.6 49.6 55.9 63.6
o/w electricity sales 43.6 45.9 48.0 53.9 61.5
Operating expenses 47.7 53.5 56.4 62.5 70.2
Operating profit/loss -3.0 -6.9 -6.8 -6.6 -6.5
Non-operating expenses (net) /1 3.1 2.4 2.3 3.3 1.8
Net profit/loss -6.1 -9.4 -9.0 -9.8 -8.3
Sources: PDB and Monitoring Cell.
1/ Includes finance charges, exchange losses, etc.
9 See Budget Speech of June 10, 2010, p. 17. To be precise, it is not the shortages of gas, but inadequate
infrastructure (distribution network) that is constraining gas supply and hence contributing to the erosion in
generation capacity.

14
42. One major factor contributing to PDB’s poor financial performance is the non-economic
electricity tariffs that are set below the cost recovery level. In FY2009, PDB’s effective tariff—calculated
by dividing the firm’s revenue from energy sales by the volume sold—was Tk. 2.68 per kWh in FY2009,
equivalent to US¢3.9 (Table 9). This is very low by regional and international standards. For example, in
India, where power is heavily subsidized, the tariff per unit of power is US¢8 for domestic consumers and
US¢16 for commercial supply.10
Over time PDB’s effective tariff has eroded considerably in real terms,
as the rates of tariff adjustments have fallen behind the rate of inflation (Table 10).11
The effective tariff
in FY2009 was worth only 70 percent of that in FY2000 in real terms.
Table 9. PDB Effective Tariff by Customer (FY2009) /1
Consumer class Effective tariff per kWh
Taka US¢ eqv.
Residential 3.2 4.6
Agricultural 1.9 2.8
Industrial 4.2 6.0
Small Industrial 4.4 6.3
Medium Voltage General Purpose 4.2 6.1
High Voltage General Purpose 3.9 5.7
Commercial 5.6 8.1
Bulk supply 2.4 3.5
Extra High Voltage (DPDC) 2.4 3.5
REB 2.3 3.4
DESCO 2.5 3.6
WZPDC 2.5 3.6
Extra High Voltage General Purpose 2.7 3.9
Other 3.9 5.7
Non-residential Light & Power 3.6 5.2
Street Lights & Water Pumps 4.4 6.3
Effective tariff (total) 2.7 3.9
Source: World Bank.
Table 10. PDB Effective Tariff per kWh (nominal and constant prices)
FY00 FY01 FY02 FY03 FY04 FY05 FY06 FY07 FY08 FY09
Nominal Taka 2.2 2.3 2.3 2.5 2.4 2.3 2.2 2.3 2.4 2.7
Constant FY00 Taka 2.2 2.2 2.2 2.2 2.1 1.8 1.7 1.6 1.5 1.5
Inflation (period average, %) 2.8 1.9 2.8 4.4 5.8 6.5 7.2 7.2 9.9 6.7
Source: World Bank data.
10
http://en.wikipedia.org/wiki/Electricity_sector_in_India. 11
Note however that the average tariff declined even in nominal terms, especially during FY05-07 for unknown
reasons.

15
43. Against the effevtive tariff of Tk 2.68
per kWh, PDB’s cost price per unit of
electricity—break-even tariff—in FY2009,
derived based on the “actual” cost-plus basis
(Table 11) was Tk. 3.07 per kWh (including
input subsidies, see below for further
discussions), suggesting that PDB made, on
average, a loss of Tk. 0.39 on each unit of
electricity it sold during the year.12
This
translates an annual loss of over Tk. 9 billion
(Table 12), or US$134 million. PDB’s losses
are mainly concentrated in the bulk supply
business (power sales to distribution
companies), while the loss emanating from
the agriculture sector, for which the tariff is
the lowest, is limited given the small volume
of energy consumed by this consumer class.
Over time, the wedge between the effective
tariff and PDB’s cost price has grown (Figure
3).
Table 11. PDB Revenue Requirement Based on Actual Cost Build-up in FY2009 /1
(in millions of Taka, unless otherwise indicated)
Total costs 73,374
Cost of sales 56,363
Fuel costs (subsidized) 18,905
Electricity purchase from IPP 23,849
Electricity purchase from Rental Plants 6,979
Electricity purchase from Public Plants 5,990
Wheeling charges 1,313
Repairs & maintenance 3,019
Salaries & wages 3,680
Admin. expenses 773
Depreciation 7,381
Financing & other charges 2,087
Exchange rate fluctuation 335
Other (net) -267
Total revenue requirement (a) 73,374
Energy sales (GWh) (b) 23,937
Break-even tariff (Taka/kWh) (a/b) 3.07
Source: Author’s calculation based on PDB Annual Report (2009).
1/ Note that the derived break-even tariff is below market levels on
account of fuel subsidies. See text.
12
Note it is not a levelised energy cost (LEC), which reflects all the costs over the lifetime of an energy-generating
system, including the cost of capital.
Figure 3. PDB Effective Electricity Tariff and Cost Price
(Taka per kWh)
Source: Author’s calculation based on PDB Annual Report (2009).
Supply cost
Effective tariff

16
Table 12. Estimated PDB’s Loss from Subsidized Energy Tariff (FY2009)
(in millions of Taka)
Sales Loss
Actual Hypothetical /1
Residential 7,093 6,880 213
Agricultural 267 424 -157
Industrial 8,172 6,021 2,151
Commercial 3,189 1,752 1,437
Bulk 44,866 57,874 -13,007
Other 528 414 114
Total 64,115 73,374 -9,259
Source: Author’s calculation.
1/ Estimated using the cost price of Tk. 3.07 per kWh and actual volume of sales by
customer class. Note that Tk. 3.07 is below a market cost price on account of subsidized
inputs. See text.
Table 13. Fuel Subsidies to PDB in FY2008 and FY2009 /1
(in billions of Taka unless otherwise indicated)
FY2008 FY2009
Actual No fuel
subsidies
Estimated
subsidies Actual
No fuel
subsidies
Estimated
subsidies
Gas 11.2 83.5 72.3 11.9 63.7 51.8
Unit cost (Tk/’000 cubic ft) 73.9 552.8 73.9 395.4
Volume (mln. cubic ft) 150,992 150,992 161,008 161,008
Furnace oil 2.1 3.7 1.5 2,189 1.9 -0.3
Unit cost (Tk/litre) 15.5 26.9 24.3 20.9
Volume (mln. liter) 137.1 137.1 90.3 90.3
HSD, SKO, LDO 3.7 5.7 2.0 4.8 4.3 -0.6
Unit cost (Tk/liter) 32.9 50.9 42.7 37.8
Volume (mln. liter) 111.5 111.5 112.8 112.8
Total 17.0 92.8 75.9 18.9 69.8 50.9
Fuel subsidy (Taka/kWh) /2 3.35 2.13 Source: Author’s calculation based on information in PDB Annual Report (2008 and 2009) and World Bank DECPG GEM
database.
1/ Actual fuel costs are derived from the actual volume and actual unit price (period average) of fuels as reported in PDB
Annual Report (2008 and 2009). No subsidy fuel costs are derived from the actual volume of fuels PDB purchased during the
year, and international price of each product (period average), converted to Taka.
2/ Derived by dividing the estimated fuel subsidies by the volume of electricity sold.

17
Figure 4. Comparison: International and PDB’s Purchase Prices of Fuels
Natural Gas (Taka/1000 cubic feet)
High-speed Diesel (Taka/liter)
Table 14. PDB Accounts Receivable
(in billions of Taka)
Retail consumers 9.8
DPDC (DESA) 29.4
DESCO 1.1
WZPDCL 2.9
REB 1.9
Total 45.0 Source: Auditor’s Report and Accounts of PDB
(2008).
44. The financial problem of PDB has been aggravated by the accumulation of accounts receivable
from consumers—mostly public power distribution companies—which has caused serious payments
gridlock and liquidity problems to PDB (Table 14). As of end-FY2008, PDB’s accounts receivable
amounted to Tk. 45 billion, equivalent to 80 percent of the firm’s operating revenue in the same year. Of
this amount DPDC (DESA) alone accounted for Tk. 29 billion (65 percent of total receivables).
45. Faced with severe liquidity problems, PDB has accumulated payables to contractors and fuel
suppliers. PDB’s payables were estimated at Tk.9.1 billion at end-FY2008. This is much smaller
compared with its receivables. No information is available regarding to whom this amount is payable.
PDB’s payments to IPPs for the purchase of power—believed to be guaranteed by the central
government—appear current at present, especially since July 2007, when the central government began to
make a monthly transfer of Tk. 500 million with the aim of ensuring PDB’s timely and full payments to
IPPs.13,14
The exact nature of this transfer is unclear as discussed further below.
13
PDB’s payments to IPPs are not included in the list of government’s guarantees published in the Budget in Brief
(Statement VIA). It is not clear why they are not included. It may be because PDB’s payments are only implicitly
0.0
100.0
200.0
300.0
400.0
500.0
600.0
700.0
800.0
900.0
International price
PDB's purchase price
0.0
10.0
20.0
30.0
40.0
50.0
60.0
70.0
80.0
International price
PDB's purchase price
Furnace Oil (Taka/liter)
Sources: PDB Annual Report (2009) and World Bank DECPG
GEM database.
0.0
5.0
10.0
15.0
20.0
25.0
30.0
35.0
40.0
45.0
International price
PDB's purchase price

18
Table 15. PDB Outstanding Debt as of end-FY2008
(in billions of Taka)
Long-term debt 65.5
Government loans 42.0
Project loans 29.9
IPP bill 12.1
Foreign loans 23.5
Medium-term debt 7.2
Short-term debt 93.5
Arrears 78.3
Principal arrears 38.7
Government 3.4
Foreign loans 35.4
Interest arrears 39.6
Government 31.7
Foreign loans 7.8
Current portion of long-term debt 4.4
Government loans 1.1
Foreign loans 3.3
Accounts payble 9.1
Other short-term liabilities 1.7
Total /1 166.1
Memorandum item
Bank loans /2 19.7 Sources: PDB Annual Report (2008) and Bangladesh
Economic Review 2008.
1/ As reported in PDB’s balance sheet.
2/ As reported in the Economic Review.
46. PDB is severely indebted and has over time accumulated a significant amount of debt service
overdues. According to PDB’s balance sheet as of end-FY2008, the stock of PDB’s total debt was
estimated at Tk. 166 billion, equivalent US$2.4 billion (Table 15). Of this amount, PDB’s liabilities to
the central government were over Tk. 78 billion (including arrears of Tk. 36 billion), accounting for 47
percent of the total debt the firm reported in their balance sheet. PDB has arrears on both government
loans and foreign loans.
47. Four issues are worth highlighting. First, PDB’s balance sheet does not report debt owed to
domestic commercial banks, which according to the Bangladesh Economic Review 2008 stood at Tk.
19.7 billion as on June 30, 2008. Adding this amount to the total debt, as reported in PDB’s balance sheet,
yields Tk. 186 billion, about US$2.7 billion or 3.4 percent of GDP.
48. Second, the agency’s debt service liabilities to the government are hugely different depending on
the information source. In contrast to what is reported in PDB’s balance sheet, of Tk. 78 billion, the
Bangladesh Economic Review 2008 shows the firm’s end-FY2008 debt service liabilities to the
government as Tk. 316 billion, including arrears of Tk. 265 billion. The difference between the two
guaranteed by the government, or they are explicitly guaranteed but not reported because they constitute as short-
term counter guarantees (which the Statement does not cover). 14
This monthly budgetary transfer was introduced in accordance with the World Bank Power Sector Development
Policy Credit of 2008.

19
figures is Tk. 238 billion, equivalent to US$3.5 billion (Table 16). The bulk of the difference is attributed
to the penalty calculation. Although some of the gap may be explained by the difference in the exchange
rate applied to on-lent foreign-currency loans, differences in accounting practice alone cannot possibly
explain such a large gap.15
Table 16. PDB Differences in DSL Data as of end-FY2008
(in billions of Taka)
PDB AR
(a)
Econ. Review
(b)
Difference
(b-a)
Outstanding principal 42.0 51.1 9.0
Project loans 29.9 51.1 21.2
IPP loans 12.1 0 -12.1
Arrears /1 36.2 264.8 228.6
Total /1 78.3 315.9 237.6 Sources: PDB Annual Report (2008) and Bangladesh Economic Review 2008.
1/ Including the current portion of long-term loans.
49. Third, the treatment of the government’s monthly transfers to PDB is different between the two
bodies (Table 16). On the one hand, PDB’s financial statements treat the monthly receipts as borrowings
from the government ear-marked for IPP bills (Tk. 12 billion).16 On the other hand, the government
does not count such transfers as loans to PDB and hence does not include the total sum as part of PDB’s
debt service liabilities; neither does it report the transfers as current grants/subsidies in the Bangladesh
Economic Review 2008 (Table 9.2, p. 121).17
It is not clear how these transfers are recorded in the
government’s book.
50. Finally, the exact nature of arrears on foreign loans (Tk. 46.5 billion or US$678 million) is
unclear. Given PDB’s status as a public sector organization, one would have expected the government to
take over PDB’s debt service bills before allowing arrears to accumulate, even if they were not
guaranteed ex ante.
3.5 Fiscal Transfers to PDB
51. The bulk of PDB’s net losses have been financed by budgetary transfers, and to a small extent,
through foreign grants, foreign loans, the accumulation of payables to constructors and suppliers.
52. Transfers from the government have taken various forms. As explicit transfers, the government
has provided grants, equity capital and loans (including on-lending), in addition to ADP capital transfers.
Part of the explicit transfers is the monthly budgetary support from the government ear-marked for the
payment of IPP bills. Implicit fiscal assistance has included the conversion of loans and interest into
equity (de facto debt forgiveness), build-up of debt service overdues; and foregone dividend and
15
Foreign-currency debt stocks may be valued at the exchange rate prevailing at the time of disbursement, or
converted to local currency terms at the time of reporting at the then prevailing exchange rate. In countries where
there are large exchange rate movements over time, like in Bangladesh, differences in accounting practices pose a
major problem. 16
It is treated as “cash loans” in the list of government loans, provided in Auditors Report and Accounts (2008),
Annex Note 21. 17 For example, these loans are not included in Debt Service Liability (DSL) Accounts and Guidelines (up to
FY2008-2009), published by the Ministry of Finance.

20
corporate tax payments. Subsidized fuels for power generation as well as build-up of payables to
suppliers and bank overdrafts, if from the public sector, have constituted quasi-fiscal assistance.
53. Estimates suggest that during FY2008 total fiscal and quasi-fiscal assistance to PDB amounted to
at least Tk. 99.6 billion (Table 17), about US$1.5 billion or 1.8 percent of GDP.18
Of this amount, Tk. 17
billion was provided as explicit transfers, mostly in the form of monthly transfers to pay the IPP bills and
capital transfers. Equity injections and current grants/subsidies were limited. As implicit transfers, PDB
benefited Tk. 3.6 billion by accumulating debt service arrears, including the current portion of debt
service liabilities to the government that had not been declared as arrears. There was no ex-post
conversion of loans to equity during FY2008.
Table 17. Estimated Fiscal Transfers to PDB in FY2008
(in billions of Taka)
Explicit transfer 17.2
Grants 0.1
Government loans 8.7
Government loans - project (net) 0.6
Government loans - IPP bills (net) /1 8.1
Equity injection 1.5
ADP (capital transfer) 6.9
Implicit transfer /1 3.6
Accumulation of principal arrears 0.6
Accumulation of interest arrears 1.9
Accumulation of over-dues 1.1
Quasi-fiscal transfer 78.8
Fuel subsidy /2 75.9
Bank loans (net) 2.9
Total 99.6
In percent of GDP 1.8% Source: Author’s calculation. See text.
1/ Monthly budgetary supports ear-marked for IPP bills.
2/ See Table 13.
54. Quasi-fiscal transfers to PDB were significant, estimated at Tk. 78.8 billion. Of this amount, fuel
subsidies amounted to Tk. 75.9 billion, while net borrowing from commercial banks, believed to be
mostly from state-owned commercial banks, was Tk. 2.9 billion. In the absence of detailed information, it
is not possible to estimate the portion of PDB’s payables to the public sector (inter-enterprise arrears).
55. The above estimation was carried out as follows. First, flow figures on explicit fiscal transfers
were obtained from the PDB Annual Report (2008), and were reconcilied for consistency using the stock
figures as of end-FY2007 and FY2008. As regards implicit transfers, the accumulation of arrears, both
for principal and interest portions, and current liabilities was estimated by taking the first order difference
of the outstanding debt service liabilities as of end-FY2007 and FY2008, for which information is
provided in greater details in Auditor’s Report and Accounts of PDB (2008). As for quasi-fiscal transfers,
fuel subsidies were estimated based on the volume of fuels used for power generation, and the wedge
between PDB’s purchase price and the international price of furnace oil, diesel and natural gas during
FY2008, (Table 13). Provision of credits through the banking sector were calculated by taking the first
18
Complete financial statements are available only for FY2008.

21
order difference of the outstanding stock of bank loans to PDB at end-FY2007 and FY2008, reported in
the Bangladesh Economic Review.
4. Bangladesh Petroleum Corporation (BPC)
4.1 Petroleum Sector
56. The petroleum sector in Bangladesh is dominated by Bangladesh Petroleum Corporation (BPC),
a statutory organization established by a Presidential Ordinance (Ordinance No. 88, 13/11/1976) for the
purposes of importing, refining and processing of crude petroleum, blending of lubricants, exporting and
marketing of petroleum products including by-products and lubricants. As a sole importer and distributor
of petroleum products, BPC controls the wholesale market as well as the retail market in Bangladesh
through its three subsidiaries that are shielded from competition (see below). BPC is also responsible for
development and expansion of fuel reserve systems throughout the country.
57. At present, PBC has seven subsidiary companies: a refinery, three oil marketing companies, two
blending plants, and an LPG bottling company (Table 18). The position of BPC in relation to these
companies is similar to that of a holding company.
Table 18. BPC Subsidiary Companies
Type of activity Subsidiaries Ownership
Refinery Eastern Refinery Ltd. (ERL) 100% BPC
Oil marketing companies
Padma Oil Company Ltd (POCL) 50.35% BPC
49.65% Other
Jamuna Oil Company Ltd (JOCL) 70% BPC
30% Others
Meghna Petroleum Lmimite (MPL) 70% BPC
30% Others
Lube blending plants
Eastern Lubricants Blenders Ltd (ELBL) 59.32% BPC
40.68% Others
Standard Asiatic Oil Company Ltd (SAOCL) 50% BPC
50% Private
Bottling company LP Gas Ltd (LPB) 100% BPC
Source: www.bpc.gov.bd.
4.2 BPC’s Operation
58. Over the past five years, BPC imported 3.3-3.8 million tons of petroleum products a year
including about 1.2 million tons of crude oil to meet the country's demand, mainly from Saudi Arabia,
Kuwait, United Arab Emirates, India and Malaysia, at a cost between US$1.5 and US$3 billion (
59. Table 19).

22
Table 19. BPC Imports of Petroleum Products (volume)
(in millions of metric tons, unless otherwise indicated)
FY05 FY06 FY07 FY08 FY09
Crude oil 1,063 1,253 1,211 1,242 861
JP1, Kerosene, Petrol, Octane, Diesel 2,692 2,381 2,536 2,228 2,508
Total imports 3,755 3,634 3,747 3,470 3,369
Total imports (value, in mln. of US dollar) 1,541 1,955 2,172 2,992 2,090
Source: Bangladesh Economic Review 2009.
60. Imported crude oil is refined by Eastern Refinery Limited (ERL) into 17 different kinds of
products, mainly high speed diesel, kerosene, fuel oil, petrol and octane, and some special non-fuel
products. Some of the ERL products are produced only on demand. The refinery has the capacity of
refining 1.5 million tons of crude oil per year. Refined oils produced by ERL meet domestic demand for
most of the petroleum products of the country, except for diesel, kerosene and JP-1 (Jet Propulsion-1),
and to a small extent octane and petrol. These products are imported as finished products to supplement
the deficit. See Table 20 for product-wise sales of petroleum products in FY2009. BPC exports a small
amount of naphtha produced by ERL.
Table 20. BPC Domestic Sales by Products in FY2009
(in thousands of metric tons)
ERL Production
1/
Imported refined
products Total
Diesel (HSD) 291.5 2,010.0 2,301.5
Kerosene (SKO) 190.7 152.0 342.7
Petrol (MS) & Octane (HOBC) 118.6 75.0 193.6
Fuel oil (FOHS) 134.5 30.0 164.5
Jet A-1 13.8 240.0 253.8
Bitumen 24.9 0.0 24.9
LPG 10.6 0.0 10.6
Other 20.0 0.0 20.0
Total 804.6 2,507.0 3,311.6
Source: Author’s calculation based on the information available on www.bpc.gov.bd.
1/ ERL production was derived as a residual from the total volume of domestic sales and volume
imported during FY2009, ignoring BPC’s opening/closing stock of the year.

23
4.2 Tariff Analysis
61. Wholesale and retail prices of
petroleum products are set by the regulator,
BERC. With the rapid increase in
international oil prices, the domestic retail
prices of diesel, kerosene, petrol and octane
were adjusted upwards several times during
the 2000s, but by less than a full extent,
against the concern that passing through of
large price increases would cause adverse
social and political impacts (Figure 5).
Information on retail prices of other products,
such as LPG and furnace oil, and wholesale
prices is not available.
62. Following the crash in global oil
prices, the retail prices of four main
petroleum products were slashed in October
2008, and again in January 2009. The latter
came as a follow-up step to implement the Awami League government’s election pledge. Currently, the
retail price per liter is Tk. 44 (US$0.64) for diesel and kerosene, Tk. 74 (US$1.08) for petrol and Tk. 77
(US$1.12) for octane.
63. Retail prices include VAT of 15 percent, as well as other duties charged on imported products,
such as customs and supplementary duties, and infrastructure development surcharges. According to the
customs schedule downloaded from the Bangladesh Customs’ website, the statutory rate of import duty is
37.5 percent for all imported petroleum products except for lubricating oils, for which the duty is 25
percent.19
64. Bangladesh’s retail prices of petroleum products are amongst the lowest in the region (Table 21).
There are concerns that the large price differences have encouraged widespread smuggling of petroleum
products in the border states of India.
Table 21. Comparison of Regional Petroleum Retail Prices (March 2008)
(Taka/liter)
Bangladesh India (Kolkata) Pakistan Sri Lanka Nepal
Diesel 40.00 56.97 48.15 47.67 59.72
Kerosene 40.00 15.77 45.22 43.22 54.35
Petrol 65.00 79.80 68.53 74.36 84.93
Octane 67.00 82.31 81.58 76.27 - Source: Bangladesh Public Expenditure and Institutional Review (2010) Table 4-5.
19
http://www.nbr-bd.org/nbrweb/CustomsFiles/cusTariff.asp.
Figure 5. Retail Fuel Price (Tk/liter)
Source: World Bank data.
Kerosene
Diesel
Petrol
Octane

24
4.4 Financial Performance
65. Information regarding BPC’s financial performance is generally difficult to obtain. The
company’s website presents no financial information, except for its past contributions of VAT and duties
to the national budget, and some trade activities. While partial and provisional financial statements of
more recent years are available, the complete financial statements obtained for the analysis are of FY2006.
The analysis provided below should therefore be interpreted with caution, as it is based on dated,
fragmented and generally not very reliable information.
66. Data obtained from the Monitoring Cell suggest that BPC recorded a sizable net loss every year
throughout the entire 2000s. One major contributor to BPC’s poor financial performance is said to be the
non-economic retail prices of petroleum products that are set below the firm’s cost recovery level. As is
evident from Table 22, the firm’s financial position has deteriorated significantly during the past years in
parallel with the rise in global oil prices. In particular, BPC incurred a huge net loss of nearly Tk. 70
billion (1.3 percent of GDP) in FY2008, when international oil prices hit a record high level. Once global
commodity prices plunged at the onset of the global financial crisis, the firm’s losses shrank sharply in
FY2009.
Table 22. BPC Income Statement (in billions of Taka) /1
FY05 FY06 FY07 FY08 FY09
Operating profit/loss -26.0 -27.3 -28.2 -65.8 -3.1
Net profit/loss -29.0 -32.4 -32.3 -69.9 -9.4 Source: Monitoring Cell.
1/ BPC’s income statements report the equity injection of Tk. 6 billion and Tk. 7 billion in FY2007 and FY2008,
respectively, as a subsidy, which artificially compresses the firm’s net loss of the year. The government does not
record these as subsidies.
67. BPC collects VAT on fuel oils that are included in the retail prices, and channels the collection to
the national budget together with duties on crude and refined oils it imports. The firm’s annual
contribution to the national coffer has been about Tk. 25-30 billion a year (Table 23). Being a chronically
loss making company, BPC has made no corporate income tax and dividend payments to the government
for quite some time.
Table 23. BPC Contribution to National Budget (in billions of Taka)
FY05 FY06 FY07 FY08 FY09
Contribution to budget 24.6 26.2 26.3 30.2 27.9 Sources: www.bpc.gov.bd and Bangladesh Economic Review (various issues)
68. Analysis based on the Auditors Report on the Accounts of BPC (2006) suggests that the firm’s
cost price per unit of domestically sold products, estimated on a cost-plus basis, was Tk. 33.40 in FY2006,
compared with the effective retail price of Tk. 29.42, estimated from domestic sales revenue and the
volume of sales (Table 24). This means that, on average, BPC made a loss of Tk. 3.97 (US¢6) for every
unit of petroleum products it sold on the domestic market during the year.20
The overall loss from the
subsidized fuel sales was estimated at over Tk. 17 billion (Tk. 3.97*4,373 million units) in FY2006,
accounting for 64 percent of the firm’s total operating loss of the year.
20
Due to the lack of information on the wholesale prices and volume sold on the wholesale market, it is assumed
that all domestic demand for petroleum products was met through retail sales.

25
Table 24. BPC Cost Build-up in FY2006
(in millions of Taka unless otherwise indicated)
Total costs 146,039
Cost of sales /1 139,055
Employee expenses 31
Administrative expenses 22
Selling & distribution expenses /2 565
Depreciation 3
Financing charges 6,363
Revenue requirement before export income (a) 146,039
Volume of domestic sales (mln. unit) (b) 4,373
Domestic cost price per unit (Taka) (a/b) /3 33.40 Source: Author’s calculation based on Auditors Reports on the Account of
BPC (2006).
1/ Includes import costs of fuel oils and refining/processing costs.
2/ Includes maintenance, insurance and export expenses.
3/ One unit is a liter for all products except for LPG and bitumen. For the
latter two, a metric ton is used as a unit.
69. Analysis based on product-wise import data—available only for diesel, kerosene, and petrol and
octane for FY2009 and FY2010—suggests that BPC made losses mainly through sales of imported diesel
and kerosene. Part of such losses is compensated for through the sales of other products, indicating there
is some cross-subsidization between products (Table 25). In FY2009 (FY2010), for example, while BPC
made a loss of Tk. 23.5 billion (Tk. 37 billion) through the sale of under-priced diesel and kerosene, a
profit of Tk. 3 billion (Tk. 2 billion) was generated through the sale of motor oils. In other words, the
firm made a net loss of Tk. 20 billion in FY2009 (Tk. 35 billion in FY2010) through the sales of these
four products alone. In the absence of further information, it is not possible to know the full extent of
cross-subsidization between products. Neither is it possible to estimate the cost difference between
products imported from overseas and produced domestically by ERL.21
21
However, it is safe to assume that the cost price of domestically refined petroleum products is lower. Otherwise, it
makes no economic sense to import more expensive finished products. If we assume that it takes US¢10 to refine
crude oil to produce a liter of petrol (typical refining cost in the US), then the cost price of petrol produced by ERL
would have been around Tk. 47.6 per liter in FY2009, including VAT, which is coincidentally identical to the
administered retail price of diesel and kerosene.

26
Table 25. BPC Estimated Loss from Administered Pricing System
(in Taka per liter, unless otherwise indicated)
FY2009 FY2010 /3
Admin.
price /1
Import
parity price
/2
Profit Admin.
price
Import
parity price
/2
Profit
Diesel 47.6 51.2 -9.2 44.0 53.1 -14.9
Kerosene 47.6 52.2 -10.3 44.0 51.2 -12.8
Profit (mln. Taka) /4 -23,483 -37,305
Petrol/octane 79.3 48.9 30.4 75.5 59.2 16.3
Profit (mln. Taka) /4 3,160 2,227 Source: Author’s calculation based on the import data taken from www.bpc.gov.bd.
1/ Simple period average of retail price for FY2009.
2/ Import parity price per liter is estimated by applying VAT (15 percent) and import duties (37.5 percent) over the
C&F import price per liter, calculated from the volume and value of each product imported. For simplicity, no dealer
margin and no distribution and marketing cost is assumed in the estimates.
3/ FY2010 import data are estimates.
4/ Derived by multiplying loss per liter by volume of diesel, kerosene and petrol/octane imported.
70. BPC’s financial difficulties have been intensified further by a sizable amount of accounts
receivable. At the end of FY2006, the firm’s receivables totaled to Tk. 34.7 billion, equivalent to 31
percent of its sales revenue of the year. The agent’s subsidiary firms, in particular, Padma Oil Company
(one of BPC’s oil marketing companies), were responsible for the bulk of BPC’s receivables in FY2006
(Table 26).
71. Faced with serious liquidity problems, BPC too has accumulated a large amount of payables. As
of end-FY2006, its total payables were estimated at Tk. 30 billion (Table 27). Of this amount, payables
to the suppliers were relatively small, and the large part was attributed to import expenses, such as cost of
freight/transport, river/port dues, and handling commissions. Considering that these services are typically
provided by other public corporations, it is likely that BPC’s payables with respect to import expenses
consititutes cross-enterprise arrears. No further information is available.
Table 26. BPC Accounts Receivable at end-FY2006
(in millions of Taka)
Trade related /1 33,228
* Eastern Refinery (ERL) 742
* Padma Oil (POCL) 20,926
* Jamuna Oil (JOCL) 6,136
* Meghana Petroleum (MPL) 4,714
* Standard Asiatic Oil (SAOCL) 208
* Petrobangla 107
Trafigura 205
B. P. Singapore 186
Others (trade) 4
Non-trade related /2 1,447
Total 34,675 Source: Auditors Report on the Accounts of BPC (2006).
1/ Firms with asterisk are NFPCs.
2/ Project current account and sundry debtors.
Table 27. BPC Accounts Payable as of end-FY2006
(in millions of Taka)
Suppliers 3,453
Kuwait Petroleum 2,069
Bangladesh Gas Field 58
Petrobangla 1,325
Others 26,662
Import expenses 19,034
Export expenses 73
Import differential 91
Companies current account 5,808
Trade VAT payable 1,656
Others 1
Total 30,115
Source: Auditors Reports on the Accountsof BPC (2006).

27
72. According to the provisional balance sheet for the year ending in June 2008, BPC’s total
liabilities stood at Tk. 234 billion at year-end (Table 28). Debt owed to the central government was
estimated at slightly over Tk. 50 billion, which included Tk. 48.7 billion of the Treasury Bonds the
government issued to domestic banks (totaling Tk. 88.3 billion) in FY2006 and FY2008, when assuming
the firm’s accumulated liabilities (Table 29). No arrears on long-term loans are reported. BPC’s balance
sheets present no information about loans from domestic banks other than bank overdrafts, although the
Bangladesh Economic Review 2008 shows an estimated amount of Tk. 85 billion.
Table 28. BPC Outstanding Debt as of end-FY2008
(in billions of Taka)
Long-term 50.2
Government loans 1.1
Bonds payable to government 48.7
Payable for government for shares vested in BPC 0.3
Pre-liberation dues 0.1
Short-term 183.8
Short-term loans from IsDB 31.1
Accounts payable 42.1
Accrued expenses 2.4
Bank overdrafts 107.1
Income tax payable 1.1
Total /1 234.0
Memorandum item:
Bank loans /2 85.2 Sources: BPC provisional balance sheet (2008) and Bangladesh Economic Review
2008.
1/ As reported in the balance sheet.
2/ As reported in the Economic Review 2008.
Table 29. Government Bond Issue for the Take-over of BPC’s liabilities
(in billions of Taka)
Year of issue Name of Security Amount
FY06 3-year Sonali Bank Treasury Bond -2009 10.00
FY08 2-year & 3-year BPC Treasury Bond 18.00
FY08 BPC Treasury Bond (5-year and above) 55.27
Total 83.27 Source: Bangladesh Bank Annual Report (2006, 2008), Annex Table-XIV.
73. A distinct feature of BPC’s debt structure is the sizable amount of short-term liabilities, in
particular, large bank overdrafts, of Tk. 107 billion, from Sonali Bank, Janata Bank, Agrani Bank and
Rupali Bank, all of which are nationalized commercial banks. Detailed information is available only for
FY2006 and is presented in Table 30. It is not entirely clear how BPC has accumulated such large
overdrafts. Neither, is it clear if the overdrafts attract any penalty. Short-term loans from the Islamic
Development Bank (IsDB) are a revolving credit facility for the importation of oil. BPC also has an
income tax payable to the government, of Tk. 1.1 billion. Given BPC’s chronic loss position, this liability
must have been incurred a long time ago and carried over since then.

28
Table 30. BPC Outstanding Bank Overdrafts at end-FY2006
(in billions of Taka)
Sonali Bank 44.9
Janata Bank 30.8
Agrani Bank 11.6
Rupali Bank 2.1
Total 89.5 Source: Auditors Report on the Accounts of BPC (2006).
74. As before, data on BPC’s debt to the central government differ significantly depending on the
source. According to BPC’s provisional balance sheet for FY2008, the firm’s total liabilities to the
government stood at Tk. 50 billion at end-FY2008, whereas the Bangladesh Economic Review 2008
reports them as Tk. 1.8 billion, including arrears of Tk. 1.7 billion (Table 31).
Table 31. BPC Debt Owed to Central Government at end-FY2008
(in billions of Taka)
BPC B/S
(a) /1
Econ.
Review (b)
Difference
(b-a)
Principal outstanding 50.1 0.1 -50.0
Government loans 1.1 0.1 -1.0
Bonds payable to government 48.7 0 -48.7
Payable to gov. for shares vested in BPC 0.3 0 -0.3
Arrears 0 1.7 1.7
Principal arrears 0 1.1 1.1
Interest arrears 0 0.6 0.6
Total 50.1 1.8 -48.3 Sources: BPC provisional balance sheet (2008) and Bangladesh Economic Review 2008.
1/ Balance sheet does not indicate the existence of arrears.
75. The bulk of this difference, of Tk. 48 billion, can be explained by the treatment of BPC’s bank
loans that were repaid by the central government through a bond issue in FY2006 and FY2008. While
BPC records them as long-term liabilities to the government (i.e., creditors changed from banks to the
government), the government does not record them as BPC’s debt service liabilities to the central
government. That is, the government treats it as a pure take-over of liabilities. The exact terms of the
take-over are not available, and questions remain as to why BPC records only Tk. 48.7 billion, rather than
the full face value of the Treasury bonds, of Tk. 83 billion as payables to the central government in their
book.
4.5 Fiscal Transfers to BPC
76. Estimates suggest that fiscal and quasi-fiscal transfers to BPC reached at least Tk. 51 billion
(US$743 million) during FY2008, the year when the firm made a record loss of Tk. 70 billion (Table 32).
Explicit fiscal transfers to BPC were a small part of the total amount, accounting for only 26 percent.
Explicit transfers were provided mostly in the form of equity injections and capital transfers.

29
Table 32. Estimated Fiscal Transfers to BPC (in billions of Taka)
FY06 FY07 FY08
Direct transfer 4.1 12.0 13.5
Government grant 0.0 0.0 0.0
Government loans (net) 0.0 -0.1 0.0
Equity injection 0.0 6.0 7.0
ADP (capital transfer) 4.1 6.1 6.5
Implicit transfer 10.0 0.0 73.3
Take-over of debt owed to NCBs /1 10.0 0.0 73.3
Quasi-fiscal transfer /2 129.4 10.9 -35.8
Accumulation of overdraft from NCBs 46.2 0.2 17.4
Bank loans (net) 83.2 10.7 -53.2
Total 143.4 22.9 51.0
Source: Author’s calculation based on Bangladesh Economic Review (various issues), Bangladesh Bank
Annual Report (various issues), and BPC balance sheets.
1/ See Table 29.
2/ Excludes accumulation of payables associated with importation (possible inter-enterprise arrears).
77. The bulk of the fiscal assistance to BPC was provided through implicit and quasi-fiscal transfers.
The government’s take-over of BPC’s domestic bank loans through the issuance of Treasury bonds
constituted an implicit fiscal transfer of Tk. 73 billon in FY2008, whereas the accumulation of overdrafts
from state-owned commercial banks, in the amount of Tk. 17.4 billion, can be regarded as a quasi-fiscal
transfer to BPC. Due to the lack of information, it is not possible to estimate input subsidies to BPC
through other NFPCs, in particular, through subsidized gas from Petrobangla and electricity from PDB,
another kind of quasi-fiscal transfer to the firm.
78. Most of the information necessary for the estimation was sourced from the Bangladesh Economic
Review and Bangladesh Bank Annual Report, in light of the weaknesses in BPC’s financial statements in
general. The amount of new government borrowing (net) was calculated taking the first order difference
of the outstanding principals, as reported in the Bangladesh Economic Review. Since data on BPC’s
arrears, presented in the Economic Review, appear to have a break in series, implicit fiscal transfers
through the accumulation of arrears cannot be calculated in the same manner, and are excluded from this
analysis. Information regarding the government’s take-over of bank loans was obtained from Table XIV
(government borrowing from the banking system) of the Bangladesh Bank Annual Report (2006 and
2008). Accumulation of bank overdrafts was derived from the stock data, presented in BPC’s provisional
balance sheet (2008). Similarly, new bank borrowing (net) were calculated from the stock data reported
in the Bangladesh Economic Review.
5. Fiscal Implication of New Power Purchase Agreements
5.1 New Power Purchase Agreements
79. Bangladesh is currently facing 1,500-2,000 MW of power shortages during the peak hours.22
The resulting frequent load shedding is having serious impacts on every sphere of life and production in
factories and fields. Sensitivity and severity of the present power shortages are unprecedented, as
22
This is a margine that will take years to narrow. Bangladesh achieved only about 4,000 MW effective generation
capacities in 39 years since independence (103 MW per year). If expansion of power generation was to progress at
the same pace, it would take about 14 years to add new generation capacity of 1,500 MW.

30
illustrated by the draconian measures the government adopted in recent months to deal with them. In
March 2010, as emergency measures, the government halted supplies of gas to three major fertilizer-
manufacturing plants, diverting gas to power plans to help increase electricity generation, and imposed
restrictions on the use of air-conditioners in private homes. The ongoing power shortages are indeed a
major challenge for the Awami League government, as a potential source of political instability.
80. In a bid to boost power supplies in the imemdiate short run, the government recently signed
several contracts to purchase power from private companies that are planning to build temporary power
stations. All these plants are powered by diesel and furnace oil, and are expected to add around 1,300
MW of electricity to the national grid during the course of FY2011.23
The expected timing of which
construction of each plant is completed is provided in the Road Map, published recently by the Ministry
of Finance.24
However, it remains to be seen if the construction of these plants will progress as expected,
since reportedly some of these private companies that won the contract has never been in the business of
power generation.
81. A number of observers have raised serious concerns about the fiscal implication of the new power
contracts. Each purchase agreement sets out an agreed wholesale tariff at which PDB purchases
electricity from the private company. Sources report that the wholesale price of power will range
between Tk. 7.66 and Tk. 13.66 per kWh, far above the existing tariffs approved by BERC (Table 9).25
While the government is considering tariff adjustments over the next two to three years, a full pass-
through of the high wholesale price is unlikely for now. A significantly higher loss of PDB appears
unavoidable at least during FY2011.
82. There are additional concerns if BPC has to import more refined products to meet the growing
demand from the new oil-fired power plants, as this would certainly raise BPC’s loss. Information is
mixed. While one source says that the private companies will have to source (unsubsidized) fuels by
themselves on the internatioanl market, others report that BPC will make imported diesel and furnace oil
available to them at subsidized price. If the latter is the case, then the country’s ammual demand of fuel
oils would shoot up from annual 3.5 million tons to around 4.5 million tons in FY2011.26
Here again,
unless the domestic price of these oils is adjusted to the import parity level, BPC is bound to make a
larger loss in FY2011, particularly now that global oil prices are at more elevated levels than during the
past two years.
5.2 Fiscal Implication of New Power Purchase Agreements
83. What follows attempts to estimate the potential fiscal costs associated with the new power
purchase agreements. In the absence of detailed information on the new contracts, the results presented
below should be taken only as rough estimates.
23
In the meantime the government is looking into ways to import liquefied natural gas to improve gas supplies, but
the lack of infrastructure, such as a re-gasification unit, will make this a difficult problem to solve. In the long term
the government hopes to construct two nuclear power plants with the assistance of Russia’s atomic energy
corporation, Rosatom. It is not clear how Bangladesh is going to fund the construction of these plants, which are
likely to cost US$1.5billion each to build. 24
Towards Revamping Power and Energy Sector: A Road Map, June 2010, available at www.mof.gov.bd. 25
See for example, “Power tariff to go up”, The Daily Star, May 14, 2010. 26
See for example, “Bangladesh fuel import bills to up by BDT 5,000cr nest FY”, Energy Bangla, April 19, 2010.

31
Impact on PDB’s Financial Position
84. Scenario analysis suggests that, in the absence of retail tariff adjustments, PDB could suffer a net
loss of between Tk. 36 and Tk. 116 billion during FY2011 (compared with Tk. 9 billino in FY2009),
depending on the volume of electricity added to the national grid during the year, and wholesale tariff of
electricity purchased by PDB. The results presented in Table 33 can be interpreted as follows. The
estimated PDB’s loss during FY2011 would be Tk. 36.4 billion if (i) 500 MW of 1,300 MW of additional
electricity expected to be available during the year does actually become available to be sent to the
national grid; and (ii) if the weighted average price of 500 MW of power PDB purchases is Tk. 8.0 per
kWh. If all the expected additional energy was to be available from July 1, 2010, at the average purhcase
price of Tk. 12 per kWh, then PDB’s net loss could amount to Tk. 116 billion for FY2011. If the bulk of
PDB’s loss is to be covered by fiscal transfers, the implication on the budget is significant.
Table 33. PDB Estimated Net Loss in FY2011: No Tariff Adjustment /1
(in billions of Taka)
MW Wholesale Tariff for PDB (Tk/kWh)
8.0 9.0 10.0 11.0 12.0
500 36.4 40.8 45.2 49.6 54.0
700 45.0 51.2 57.3 63.4 69.6
900 53.6 61.5 69.4 77.3 85.2
1,100 62.2 71.9 81.5 91.2 100.8
1,300 70.8 82.2 93.6 105.0 116.0 Source: Author’s calculation.
1/ Assumes weighted average tariff of Tk. 2.68 per kWh. Net losses were projected based on
PDB's cost structure and energy generation efficiency in FY2009, adjusted for domestic price
changes (period average), and assumed to be 7.8 percent for FY2010 and 7.0 percent for FY2011.
For simplicity, the estimates do not include additional wheeling charges PDB will have to pay as
a result of new power purchase agreements.
85. If the tariff schedule is to be revised upwards, say by 15 percent, effective on July 1, 2010, then
the estimated PDB’s loss for the year would decline slighly to Tk. 27-107 billion (see Table 34). Still the
potential fiscal resources needed to keep the operation of PDB would be significant, suggesting that
piecemeal tariff adjustments alone are unlikely to mitigate PDB’s financial burden significantly.
Table 34. PDB Estimated Net Loss in FY2011: 15% Higher Tariff
(in billions of Taka)
MW Wholesale Tariff for PDB (Tk/kWh)
8.0 9.0 10.0 11.0 12.0
500 26.6 31.0 35.4 39.7 44.1
700 35.2 41.3 47.5 53.6 59.7
900 43.8 51.9 59.6 67.5 75.3
1,100 52.4 62.0 71.7 81.3 90.9
1,300 61.0 72.4 83.8 95.2 106.6
Source: Author’s calculation.

32
Impacts on BPC’s Financial Position
86. If BPC is to import more petroleum products, in particular, diesel and furnace oil, to respond to
the growing demand from the new power plants, the firm’s fuel import bill could rise from US$2.2 billion
in FY2010 to US$2.5-3.4 billion in FY2011 (an increase of 13-55 percent), depending on the
developments of international commodity marets and the growth in domestic demand. With the projected
crude oil price of US$81.4 per barrel by the World Bank, BPC’s import bill would likely to be around
US$2.6-3 billion during FY2011. See Table 35, which can be interpreted as before.
Table 35. BPC: Estimated Fuel Import Bill for FY2011
(in billions of US dollars)
MW International Crude Oil Price (US$/barrel)
75.0 80.0 85.0 90.0 95.0
500 2.5 2.6 2.8 3.0 3.1
700 2.5 2.7 2.9 3.0 3.2
900 2.6 2.8 2.9 3.1 3.3
1,100 2.6 2.8 3.0 3.2 3.3
1,300 2.7 2.9 3.0 3.2 3.4
Source: Author’s calculation.
87. In the absence of price information for furnace oil, it is not possible to estimate the potential scale
of loss BPC could make by supplying imported fuels to the new power plants. Rough estimates suggest,
however, that BPC’s loss from domestic sale of diesel alone could reach Tk. 50 billion, although part of
this loss would be compensated for by the sale of other products, such as petrol and octane.
88. To sum up, the series of power purchase agreements signed lately is likely to place a huge strain
on public finances. In the absence of any price adjustments, PDB—and BPC if it will have to import
more oils—would face a serious liquidity problem, and require a significant amount of fiscal resources to
continue its core business. Regardless of how resources are transferred—be they explicit, implicit or
quasi-fiscal transfer—the cost of the new agreements would eventually need to be taken care of by the
government. Besides these fiscal costs, broader economic cost associated with the inefficient NFPCs
would be further aggravated.
6. Conclusion 89. This paper has reviewed the financial performance of non-financial public corporations (NFPCs)
in Bangladesh, with a specific focus on the two major loss-making firms, Bangladesh Petroleum
Corporation (BPC) and Power Development Board (PDB).
90. Based on the existing information within the Bank, available mostly on the public domain, the
study finds the following:
Peformance of the NFPC sector as a whole has been unsatisfactorty. However, once four
chronically loss-making enterprises are excluded, one finds improving performance of the rest of
the sector. Since FY2003, the SOE sector excluding the four enterprises has been reporting a
growing consolidated net profit, although this achievement needs to be discounted in light of
various fiscal transfers.

33
There has been a significant amount of resource transfers to the NFPC sector every year through
explicit, implicit and quasi-fiscal means. In FY2008, at least Tk. 378 billion (US$5.5 billion, or 7
percent of GDP) was provided to the sector. PDB and BPC absorbed the bulk of this amount.
The large resource transfers to the loss-making enterprises represent a considerable fiscal drain,
constraining resource availability for high-priority needs such as infrastucture investment.
Besides direct fiscal costs, there are broader economic costs of inefficient NFPCs in terms of lost
growth opportunities and unemployment.
These fiscal transfers are not recorded in a systematic, transparent manner. There are significant
information gaps in the NFPC sector in Bangladesh. Information gaps exist both at the enterprise
and government levels, and available data are generally of poor quality.
One of the main factors behind the poor financial performance of PDB and BPC is the low
administered price set for the goods and services they render, which are below the cost recovery
levels. By distoring the energy prices, Bangladesh is discouraging to conserve energy and seek
more efficient energy sources. The non-economic electricity tariffs are also discouraging
investment or participation of private sector in electricity generation. In the petroleum sector,
very low petrol prices are encouraging widespread smuggling in the border states of India. With
the recent liberalization of petroleum products in India, concerns about smuggling are even more
elevated.
The newly signed power purchase deals are likely to put a further strain on the public finances in
the years to come, unless bold measures are taken. Piecemeal and ad hoc tariff adjustments alone
are unlikely to address PDB’s financial viability in a sustainable manner.
The next phase of the study could expand the scope of the analysis in the following areas:
Fiscal implications of subsidized fertilizer and gas, provided by Bangladesh Chemical Industries
Corporation (BCBI) and Petrobangla (or BOGMC). While these firms are not reporting losses, it
is believed that significantly under-prised fertilizer and natural gas are incurring large opportunity
costs to the government.
Institutional framework for managing NFPCs and their perofmrnacne. Whare are the roles of the
Ministry of Finance, line ministries and Bangladesh Bank?
Analysis on the previous reform and privatization efforts.
Non-financial aspects of NFPC performance, in particular, broader economic costs associated
with the mismanagement of NFPCs, including unemployment and lost growth opportunities
through foregone resources, which could otherwise have been available for more productive
purposes, such as infrastructure investment.
Forward looking analysis of fiscal risks emanating from the NFPC sector.

34
Appendix
The table presented below is the information on NFPCs maintained by the Monitoring Cell, titled Non-
financial Public Enterprise Economic Classification of Estimates for the year 2008-09 (revised). Figures
are presented in lakh.
No
n -
Fin
an
cia
l P
ub
lic
En
terp
ris
e E
co
no
mic
Cla
ss
ific
ati
on
of
Es
tim
ate
s
Fo
r t
he
Ye
ar
20
08
- 2
00
9 (
Re
vis
ed
D
ata
)
Sa
bre
Co
rp.
HO
/O
pe
rtg
.P
G S
Va
lue
Em
pls
De
p &
oth
Op
tg.
Ne
t N
on
-W
P
Su
b-
Intr
es
tD
ire
ct
Div
i-R
et.
Ne
t p
rof.
Go
vt.
Ca
p.
Ex
p.
Co
de
Na
me
EN
TA
dd
ed
Co
mp
'nN
C Ite
mS
urp
lus
Op
. In
co
mP
Fs
idy
Ta
xd
en
dIn
co
me
aft
er
tax
sa
vin
gFin
.R
eq
d.
12
34
56
78
91
01
11
21
31
41
51
61
71
8
Ma
nu
fac
turi
ng
10
0B
TM
CH
O6
25
10
61
-43
64
18
48
-90
20
00
00
0-9
02
-90
2-8
53
54
90
7
10
0B
TM
CE
NT
21
71
93
81
23
39
94
27
3-3
41
00
01
21
30
0-1
23
7-1
23
7-9
64
17
01
13
4
12
00
BJM
CH
O1
38
86
11
77
78
88
16
-12
70
00
00
0-1
27
-12
7-1
11
14
12
52
12
00
BJM
CE
NT
56
79
43
52
17
21
57
73
16
27
49
82
-15
03
11
68
00
86
84
00
-23
54
8-2
35
48
-18
56
61
33
41
99
00
20
0B
SE
CH
O7
65
40
63
58
48
55
4-1
81
00
00
01
00
-28
1-1
81
-22
72
69
49
6
20
0B
SE
CE
NT
81
83
87
12
37
10
60
15
25
16
73
46
77
15
36
27
10
13
59
14
30
18
84
12
68
31
52
19
41
18
78
-63
30
0B
SF
ICH
O4
94
13
75
71
18
41
03
31
51
00
00
00
00
01
51
37
-11
4
30
0B
SF
ICE
NT
36
38
93
69
03
-51
41
64
00
13
42
-18
25
74
77
61
22
07
54
20
0-2
11
45
-21
14
5-1
98
03
24
87
22
29
0
40
0B
CIC
HO
31
23
14
00
17
23
16
03
12
00
00
00
00
00
12
07
80
66
0
40
0B
CIC
EN
T3
01
52
72
05
22
19
63
06
21
51
03
78
96
36
90
06
50
72
27
80
11
50
61
81
04
01
15
19
11
51
94
94
15
34
54
0-1
48
74
60
0B
FID
CH
O1
48
62
57
12
29
31
83
08
81
00
00
00
88
18
81
91
11
79
-73
2
60
0B
FID
CE
NT
15
76
41
02
93
54
71
34
00
33
21
74
05
63
04
13
50
74
07
21
76
11
05
32
16
71
11
4
Su
b T
ota
l5
06
81
13
67
30
11
39
50
98
39
27
45
91
79
66
61
30
02
27
34
03
07
17
20
04
12
02
4-3
28
51
-30
82
71
30
67
44
03
63
09
70
Ele
ctr
icit
y, G
as
,& w
ate
r
31
00
PD
BE
NT
63
42
11
66
41
35
-29
92
42
53
50
78
38
3-1
33
65
75
34
61
50
02
64
57
00
-15
49
18
-15
49
18
-76
53
51
73
75
42
50
28
8
31
01
DE
SA
EN
T0
00
00
00
00
00
00
00
00
33
00
CW
AS
AE
NT
40
56
23
38
17
18
14
32
52
7-2
41
92
70
02
14
64
50
35
84
08
88
58
19
-67
34
00
DW
AS
AE
NT
42
32
42
17
71
20
55
39
80
57
00
03
74
83
95
40
01
17
42
00
30
06
02
86
32
81
30
28
36
96
32
39
36
90
0B
OG
MC
HO
44
93
24
25
81
23
51
12
07
22
59
19
00
00
02
75
00
-26
58
19
19
-26
35
66
41
26
99
7
90
0B
OG
MC
EN
T2
27
94
22
16
56
20
62
86
14
96
43
12
88
16
00
34
22
51
28
53
70
32
71
64
02
72
75
36
79
17
51
06
71
11
10
46
45
72
82
-53
18
2
Su
b T
ota
l9
53
46
57
52
48
12
00
98
45
27
58
11
74
23
30
80
33
27
39
86
87
03
11
16
64
29
15
53
86
-95
93
8-4
05
52
21
48
62
69
45
92
47
97
2
Tra
ns
po
rt &
Co
mm
un
ica
tio
n
21
00
BS
CE
NT
32
25
42
67
27
55
28
88
31
61
53
03
03
33
00
01
62
30
02
90
13
20
14
51
64
50
52
40
53
7
22
00
BIW
TC
EN
T1
63
08
83
65
79
42
52
88
10
18
16
36
16
14
05
08
98
05
00
19
03
24
03
29
21
48
60
19
39
24
00
CP
AE
NT
10
70
00
37
70
86
92
92
88
43
95
00
50
94
93
66
70
00
20
00
05
00
02
96
15
34
61
53
91
15
83
87
74
47
62
24
01
CD
WM
BE
NT
00
00
00
00
00
00
00
00
0
25
00
MP
AE
NT
27
12
20
77
63
53
27
21
00
0-3
63
72
57
70
00
23
00
-12
90
-12
90
-29
01
68
21
97
2
25
01
MD
WM
BE
NT
02
8-2
81
42
56
-22
52
10
00
00
-20
4-2
04
-14
90
14
9
25
10
BL
PA
HO
23
42
17
78
56
41
65
36
33
60
00
00
50
-14
36
34
91
37
81
02
9
26
00
BIM
AN
EN
T0
00
00
00
00
00
00
00
00
28
00
BR
TC
EN
T1
20
34
74
88
45
46
24
92
31
37
-10
83
35
90
01
29
00
0-2
01
4-2
01
41
12
31
30
61
83
29
00
JM
BA
HO
27
56
51
22
77
15
28
72
94
01
49
93
00
00
06
00
14
39
31
49
93
14
39
36
61
-13
73
2
Su
b T
ota
l2
00
21
59
64
48
10
37
66
21
37
91
66
89
65
69
98
57
10
50
21
88
20
39
26
45
04
52
90
51
74
06
19
78
13
88
16
76
83
9
Co
mm
erc
ial
10
00
BP
CE
NT
20
08
38
02
03
87
55
-30
37
44
37
21
-30
83
24
81
20
06
75
78
00
-93
59
8-9
35
98
-93
57
83
86
69
74
44
10
10
BP
CE
NT
21
52
61
92
13
13
80
21
23
91
10
52
35
21
66
67
75
72
56
90
27
93
37
98
34
73
36
05
70
78
71
25
96
63
25
38
13
00
BJC
EN
T0
14
5-1
45
27
46
-42
55
50
00
00
01
25
12
51
31
0-1
31
15
00
TC
BE
NT
32
31
53
47
75
-24
60
71
55
6-3
23
19
00
00
00
0-2
33
1-2
33
1-2
27
55
59
28
34
Su
b T
ota
l4
19
33
14
42
05
05
5-1
17
40
12
47
83
60
4-2
78
21
13
83
45
69
07
03
71
37
98
34
73
-92
19
9-8
87
26
-88
59
71
40
88
10
26
85
Ag
ric
ult
ure
& F
ish
eri
es
70
0B
FD
CH
O2
80
37
0-8
91
60
1-2
51
00
00
00
-25
1-2
51
-24
92
08
45
7
70
0B
FD
CE
NT
20
21
85
21
16
85
09
12
95
31
-31
60
00
11
02
04
21
43
33
32
9-3
80
0B
AD
CH
O1
61
55
50
71
11
08
41
28
27
-76
9-9
74
00
00
00
-97
4-9
74
-17
43
32
42
06
7
Su
b T
ota
l1
84
56
62
93
12
16
31
34
96
-63
9-6
94
-31
60
00
11
0-1
02
1-1
01
1-1
65
98
61
25
21
Co
ns
tru
cti
on
Se
cto
r
35
00
CD
AH
O2
07
51
24
58
18
29
45
53
75
17
66
60
00
00
10
91
75
58
17
66
61
76
32
11
86
6-5
76
7
36
00
RA
JU
KH
O9
21
91
24
47
97
51
18
63
00
64
89
00
00
03
00
61
89
64
89
64
89
30
20
72
37
18
37
00
KD
AH
O1
44
64
11
10
35
28
91
34
61
30
00
00
40
57
36
13
70
67
71
65
38
00
RD
AH
O1
30
81
12
91
79
13
82
71
30
00
00
15
-21
32
65
05
47
9
Su
b T
ota
l3
27
24
52
42
27
48
32
16
65
36
24
78
10
00
00
46
42
43
18
24
78
12
48
53
43
34
91
84
95
Se
rvic
e S
ec
tor
11
00
BF
DC
(FIL
M)E
NT
25
85
18
31
75
45
44
24
8-3
81
79
00
13
10
10
01
02
48
19
0-5
8
14
00
BF
FW
TH
O5
02
44
75
02
74
60
75
-33
80
00
00
0-3
38
-33
8-3
33
53
38
14
00
BF
FW
TE
NT
10
97
19
99
79
74
60
02
28
14
71
11
70
55
09
99
61
95
32
43
02
12
69
7
17
00
BT
BH
O1
35
44
49
90
54
51
27
42
70
00
00
10
41
74
27
44
41
27
-31
8
23
00
BIW
TA
HO
16
16
98
60
87
56
26
38
81
98
0-8
07
00
00
00
-80
7-8
07
11
73
10
65
99
48
6
27
00
BP
RC
EN
T3
49
02
13
61
35
56
86
20
24
67
-44
90
06
00
10
-53
-43
14
91
65
71
50
8
30
00
BW
DB
HO
58
01
44
50
75
12
93
91
28
68
07
10
00
00
07
17
17
17
10
30
01
DD
EN
T3
52
22
06
41
45
87
91
65
60
3-7
00
00
05
96
59
66
61
32
2-3
39
30
02
ME
EN
T1
69
09
69
72
15
54
92
75
00
00
00
75
75
16
62
8-1
39
32
00
RE
BH
O2
92
73
52
62
24
01
13
17
52
74
20
56
30
00
00
50
02
00
63
20
56
32
03
36
90
54
77
02
10
32
01
PB
SE
NT
33
35
44
26
33
69
70
17
53
27
12
36
11
21
35
12
72
14
08
00
24
55
90
04
80
64
80
64
09
18
82
30
74
13
89
50
0B
SC
ICH
O5
01
71
85
83
15
93
41
86
1-3
21
00
00
00
-32
1-3
21
-26
08
36
98
62
9
66
00
EP
ZA
HO
18
62
82
27
01
63
58
17
25
42
95
10
33
80
00
00
70
09
63
81
03
38
13
93
31
72
72
33
39
76
00
CA
AB
EN
T2
62
55
15
80
41
04
51
64
44
56
00
-15
94
61
35
00
64
20
25
00
13
98
38
98
69
98
23
88
51
68
87
77
00
BH
BH
O8
78
15
47
24
72
40
00
00
00
00
00
00
78
00
BS
BH
O9
05
13
07
75
77
50
00
00
00
00
00
67
36
73
78
01
BS
BE
NT
00
00
00
00
00
00
00
00
0
80
00
EP
BE
NT
25
17
16
86
83
05
61
16
25
41
73
00
00
04
27
42
74
43
26
0-1
83
60
04
BT
RC
HO
25
47
68
49
43
24
98
25
22
50
24
96
00
00
00
00
24
96
00
24
96
00
24
96
00
29
59
-24
66
41
Su
b T
ota
l7
74
60
43
71
35
54
03
25
07
32
48
49
20
52
80
79
83
33
56
78
00
25
44
70
38
29
28
56
68
28
94
97
33
48
71
24
23
52
-92
52
2
Gra
nd
To
tal
66
79
58
95
80
41
75
87
54
15
25
94
52
23
27
35
38
32
32
10
11
86
11
99
78
50
15
98
39
10
85
23
71
63
61
33
26
72
04
90
23
65
99
97
52
96
13
86
96
0

35
N
on
- F
ina
nc
ial P
ub
lic
En
terp
ris
e E
co
no
mic
Cla
ss
ific
ati
on
of
Es
tim
ate
s
Fo
r t
he
Ye
ar
20
08
- 2
00
9 (
Re
vis
ed
D
ata
)
Sa
bre
Co
rp.
HO
/E
qu
ity
L.T
erm
Lo
an
Fin
an
ce
As
su
md
As
su
me
dE
qu
ity
L.T
erm
Cu
rre
nt
To
tal
Ne
t Fix
O
the
rL
.T.C
urr
.A
ss
ets
Pe
rso
nn
el
Co
de
Na
me
EN
TIn
jec
tio
nB
orr
ow
Re
pa
yD
efi
cit
As
se
tsS
t.C
red
itL
iab
ilit
is L
iab
ilit
is F
un
dA
ss
ets
As
se
tsS
toc
kO
the
rsS
tre
ng
th
11
92
02
12
22
32
42
52
62
72
82
93
03
13
23
3
Ma
nu
fac
turi
ng
10
0B
TM
CH
O0
18
72
0-9
64
97
0.0
06
.00
42
68
61
91
38
81
32
37
33
66
44
61
94
52
36
49
90
12
80
02
19
7
10
0B
TM
CE
NT
00
38
91
52
35
48
.05
20
71
.05
-34
76
11
15
42
33
75
41
05
36
32
28
12
79
17
85
85
14
50
3
12
00
BJM
CH
O0
00
25
2-1
14
.65
13
7.3
5-1
27
34
27
86
10
48
52
44
75
11
27
23
80
72
20
66
51
63
27
12
00
BJM
CE
NT
06
90
34
42
54
1-6
59
35
72
3.1
-86
9.9
0-1
86
16
62
54
61
11
67
71
32
36
15
71
72
38
48
20
16
08
94
68
65
30
12
4
20
0B
SE
CH
O0
49
20
42
36
.50
24
0.5
02
44
48
12
44
41
48
84
15
37
73
16
05
13
89
34
01
32
34
17
8
20
0B
SE
CE
NT
01
37
51
93
19
73
68
.63
76
87
.63
34
20
74
25
49
38
88
41
15
64
03
34
90
14
95
11
87
74
48
42
52
38
8
30
0B
SF
ICH
O1
20
0-1
26
15
16
5.5
61
50
39
.56
96
41
21
90
35
95
47
91
09
12
07
82
97
48
05
92
65
34
5
30
0B
SF
ICE
NT
24
87
15
26
15
26
19
80
35
72
7.4
25
53
0.4
0-1
16
00
86
76
61
13
08
78
82
53
21
06
08
89
22
26
95
23
60
49
15
96
6
40
0B
CIC
HO
01
50
05
10
05
10
.00
37
68
30
41
31
17
39
74
08
29
68
73
66
86
88
32
10
13
76
97
58
0
40
0B
CIC
EN
T0
09
81
8-5
05
62
87
94
.42
37
38
.40
17
86
90
46
36
70
10
71
29
74
94
89
38
23
97
50
35
39
73
41
21
93
97
98
88
60
0B
FID
CH
O3
50
00
-10
82
12
35
.71
53
.70
26
81
36
61
12
01
11
83
53
72
63
83
80
13
78
81
72
60
0B
FID
CE
NT
00
28
41
39
82
77
1.3
14
16
9.3
1-1
50
21
99
57
20
22
33
86
78
63
02
18
91
46
33
25
85
25
34
5
Su
b T
ota
l2
84
97
32
11
55
07
79
98
86
84
26
78
41
43
30
61
91
95
72
86
85
19
88
31
39
89
36
18
70
31
55
62
78
16
39
67
80
09
41
70
01
3
Ele
ctr
icit
y,G
as
,Wa
ter
31
00
PD
BE
NT
68
51
08
73
18
46
63
41
41
09
58
39
86
.32
25
08
1.3
01
10
84
93
87
89
99
10
93
36
33
08
08
55
16
50
13
55
06
87
18
45
23
83
93
26
13
60
2
31
01
DE
SA
EN
T0
00
00
0.0
00
00
00
00
00
33
00
CW
AS
AE
NT
00
38
43
17
13
59
.31
16
76
.31
61
80
84
81
11
19
42
58
55
10
81
68
63
71
21
12
40
62
9
34
00
DW
AS
AE
NT
26
04
30
15
06
-60
25
62
9.8
65
02
7.8
65
46
09
24
09
84
88
46
59
59
21
46
28
53
71
14
04
58
45
73
44
37
51
90
0B
OG
MC
HO
00
35
79
26
27
89
91
96
37
08
.00
24
89
1-3
38
36
16
92
13
16
02
68
34
25
90
50
15
59
38
56
2
90
0B
OG
MC
EN
T1
82
51
72
61
41
44
-42
58
90
-42
58
9.0
00
00
00
00
06
94
8
Su
b T
ota
l9
63
78
89
04
49
84
60
16
10
10
91
89
4.4
72
52
90
4.4
71
68
56
56
89
46
28
12
82
61
63
86
28
99
21
27
22
95
79
00
29
28
19
10
63
84
82
54
92
Tra
ns
po
rt &
co
mm
un
ica
tio
n
21
00
BS
CE
NT
04
20
00
73
9-7
25
28
85
.92
16
0.9
02
59
53
52
55
81
18
53
90
36
45
73
35
12
84
25
71
29
17
42
72
22
00
BIW
TC
EN
T0
02
33
34
27
27
62
.64
50
34
.64
35
49
61
87
06
22
74
87
69
51
39
84
42
87
18
38
21
45
68
33
49
24
00
CP
AE
NT
00
04
47
62
55
27
.12
50
28
9.1
24
82
56
11
74
88
99
40
75
99
45
51
61
22
23
77
43
52
39
60
55
95
73
1
24
01
CD
WM
BE
NT
00
00
00
.00
00
00
00
00
0
25
00
MP
AE
NT
66
30
01
30
93
05
7.6
14
36
6.6
14
48
86
01
18
90
56
77
62
19
50
11
93
11
87
32
44
71
49
0
25
01
MD
WM
BE
NT
00
01
49
10
0.5
92
49
.59
12
28
21
55
91
80
85
26
17
64
11
02
10
1
25
10
BL
PA
HO
50
00
25
57
84
95
3.9
31
73
7.9
35
71
71
04
01
96
48
72
02
34
54
16
60
22
10
78
26
00
BIM
AN
EN
T0
00
00
0.0
00
00
00
00
00
28
00
BR
TC
EN
T0
02
48
62
66
91
64
.65
28
33
.65
-28
23
62
09
92
27
49
32
02
50
17
90
15
37
54
01
27
12
25
2
29
00
JM
BA
HO
00
10
16
7-3
56
54
33
4.9
17
69
.91
16
62
00
21
33
92
75
53
38
71
45
30
13
02
10
66
90
75
17
41
22
Su
b T
ota
l1
16
34
20
00
15
98
04
96
55
17
78
7.3
56
74
42
.35
73
38
05
32
41
97
18
34
67
12
41
46
96
02
42
54
24
17
88
36
22
06
50
51
33
95
Co
mm
erc
ial
10
00
BP
CE
NT
04
51
10
06
38
15
42
84
49
84
09
36
.81
32
54
34
.81
-35
08
51
61
18
98
77
55
90
10
36
63
72
18
05
84
15
24
89
40
40
13
65
11
6
10
10
BP
CE
NT
00
69
43
23
24
90
42
.52
52
27
4.5
25
79
82
12
36
15
09
23
45
79
57
72
26
10
17
49
91
48
55
03
90
91
82
72
1
13
00
BJC
EN
T0
00
-13
18
29
.86
69
8.8
6-1
37
98
81
41
86
75
43
39
31
21
83
00
91
28
19
8
15
00
TC
BE
NT
03
82
50
30
46
11
83
.45
42
29
.45
94
24
-21
25
11
91
43
31
12
33
80
01
30
18
19
1
Su
b T
ota
l0
45
11
38
63
90
98
29
06
45
91
99
2.6
43
82
63
7.6
4-4
21
43
37
65
91
41
29
53
76
16
39
85
72
62
06
60
17
31
19
74
90
81
44
29
32
26
Ag
ric
ult
ure
& F
ish
eri
es
70
0B
FD
CH
O0
00
45
7-2
34
.72
22
.30
-17
93
37
45
22
11
82
40
70
23
47
02
38
29
10
0
70
0B
FD
CE
NT
01
20
25
-98
23
53
.38
22
55
.38
34
06
47
30
25
57
83
37
14
78
16
11
21
12
56
76
38
9
80
0B
AD
CH
O0
00
20
67
-19
50
9.4
-17
44
2.4
0-3
85
10
14
52
08
61
-17
50
42
35
50
0-1
98
59
59
46
Su
b T
ota
l0
12
02
52
42
6-1
73
90
.72
-14
96
4.7
2-3
68
97
86
20
68
55
74
02
80
10
40
51
82
11
29
64
66
43
5
Co
ns
tru
cti
on
Se
cto
r
35
00
CD
AH
O0
00
-57
67
29
45
3.4
92
36
86
.49
21
88
20
24
09
64
59
77
18
58
12
60
50
31
51
54
10
36
00
RA
JU
KH
O3
62
50
00
-12
53
34
12
39
28
70
6.0
03
19
27
40
34
14
63
53
42
03
65
11
21
60
90
22
81
60
69
4
37
00
KD
AH
O6
72
00
-60
71
74
9.0
41
14
2.0
41
69
15
01
02
11
79
35
62
30
76
60
10
93
92
31
38
00
RD
AH
O1
50
04
64
10
25
.07
14
89
.07
10
79
06
91
33
51
21
94
36
94
82
02
67
61
06
Su
b T
ota
l3
69
37
00
-18
44
37
34
66
.65
50
23
.63
68
86
16
96
05
98
42
95
26
11
77
51
44
46
20
27
32
90
14
41
Se
rvic
e S
ec
tor
11
00
BF
DC
(FIL
M)E
NT
00
80
22
44
8.2
64
70
.26
33
20
20
15
37
77
91
13
22
78
19
05
33
94
59
24
09
14
00
BF
FW
TH
O0
00
33
8-1
96
.43
14
1.5
73
46
54
77
41
71
81
13
30
00
80
84
25
2
14
00
BF
FW
TE
NT
29
56
20
20
-46
03
84
.06
-75
.94
59
94
13
07
41
63
11
46
44
21
83
02
11
26
92
95
55
46
17
00
BT
BH
O0
00
-31
82
88
.87
-29
.13
31
90
0-1
03
18
07
76
17
38
06
66
24
8
23
00
BIW
TA
HO
47
96
51
43
45
0-3
87
27
.27
87
24
.27
70
46
49
29
34
05
92
96
93
14
11
30
38
43
70
17
36
44
21
3
27
00
BP
RC
EN
T7
25
03
43
11
25
32
1.2
61
44
6.2
64
28
48
27
26
42
77
53
34
41
77
98
85
26
48
73
0
30
00
BW
DB
HO
00
00
72
17
21
.00
13
47
36
96
30
13
33
86
27
02
36
37
72
71
44
75
36
21
00
01
28
71
96
73
42
30
01
DD
EN
T0
00
-33
93
32
.86
-6.1
41
42
52
04
95
14
74
71
10
86
02
12
91
53
29
41
30
02
ME
EN
T0
00
-13
92
35
.48
96
.48
30
51
65
83
43
40
51
14
61
04
42
21
48
27
1
32
00
RE
BH
O3
85
25
53
49
81
26
15
-91
97
11
37
78
.77
10
45
81
.77
86
12
78
49
28
78
32
92
81
38
70
84
89
18
10
93
31
00
28
48
56
95
3
32
01
PB
SE
NT
09
19
37
27
28
8-2
32
60
46
53
5.4
23
27
5.4
01
23
31
11
00
08
64
38
41
26
15
08
30
18
96
65
09
97
61
70
53
14
41
35
92
61
40
50
0B
SC
ICH
O4
00
14
52
23
74
48
08
34
3.7
38
82
3.7
32
90
00
46
06
44
25
37
93
16
30
19
64
29
89
06
13
21
64
4
66
00
EP
ZA
HO
00
11
31
44
70
55
07
.37
99
77
.37
69
97
14
85
39
12
25
21
30
76
14
85
28
26
08
22
07
93
8
76
00
CA
AB
EN
T0
03
29
92
01
86
10
29
3.9
53
04
79
.95
21
74
53
53
02
03
52
30
30
57
03
16
84
40
24
03
02
06
91
11
16
53
40
4
77
00
BH
BH
O0
00
00
0.0
00
00
00
00
03
60
78
00
BS
BH
O1
50
70
0-8
35
15
68
.54
73
3.5
42
11
28
20
11
87
12
40
09
21
32
19
89
50
19
82
42
9
78
01
BS
BE
NT
00
00
00
.00
00
00
00
00
0
80
00
EP
BE
NT
00
0-1
83
46
8.6
12
85
.61
10
10
90
31
10
14
04
98
60
05
15
52
51
60
04
BT
RC
HO
29
59
00
-24
96
00
25
25
58
.91
29
58
.91
00
00
00
00
11
7
Su
b T
ota
l5
54
69
15
53
02
45
58
0-2
57
71
34
50
31
7.9
11
92
60
4.9
12
72
42
21
23
28
08
69
12
13
45
96
44
38
19
38
74
51
68
79
91
77
66
42
26
00
41
49
18
8
Gra
nd
To
tal
19
27
96
81
08
15
85
42
20
23
75
68
77
64
94
.25
10
14
06
2.3
53
84
83
26
27
88
00
46
54
73
61
63
18
36
25
33
54
88
49
93
66
05
40
51
35
44
87
00
16
91
90
Pa
ge
3 o
f 4
18
/06
/09

36
References
Auditors Report and Accounts of Bangladesh Power Development Board for the Year Ended June 30,
2008 (partial).
Auditors Rerpot on the Accounts of Bangladesh Petroleum Corporation for the Year Ended 30th June,
2006.
Bangladesh Bank Annual Report 2006-2007.
Bangladesh Bank Annual Report 2007-2008.
Bangladesh Bank Annual Report 2008-2009.
Bangladesh Economic Review (2008).
Bangladesh Economic Review (2009).
Bangladesh Economic Review (2010, forthcoming)
Bangladesh Energy Regulatory Commission Electricity Distribution Tariff Regulation (2008).
Bangladesh Power Development Board Annual Report 2007-2008.
Bangladesh Power Development Board Annual Report 2008-2009.
Budget in Brief, 2008-09.
Budget in Brief, 2009-10.
Daily Star (2010). “Power tariff to go up”, May 14, 2010.
Debt Service Liability (DSL) Accounts and Guidelines (up to FY2008-2009), Finance Division, Minsitry
of Finance.
Energy Bangla (2010). “BPC fuel oil import bills to up by BDT 5,000cr next FY”, April 19, 2010.
Towards Revamping Power and Energy Sector: A Road Map (2010). Finance Division, Ministry of
Finance, Government of the People’s Republic of Bangladesh, June 2010.
World Bank (2010). Bangladesh Public Expenditure and Institutional Review (draft).
World Bank (2009). Implementation Completion and Results Report on Power Sector Development
Policy, Report no. CIR00001098, September 2009.