The waterbed effect and the EU ETS - Ecofys Consultancy waterbed effect and the EU ETS An...
21
The waterbed effect and the EU ETS An explanation of a possible phasing out of Dutch coal fired power plants as an example
Transcript of The waterbed effect and the EU ETS - Ecofys Consultancy waterbed effect and the EU ETS An...

The waterbed effect and the EU ETS
An explanation of a possible phasing out
of Dutch coal fired power plants as an example

ECOFYS Netherlands B.V. | Kanaalweg 15G | 3526 KL Utrecht| T +31 (0)30 662-3300 | F +31 (0)30 662-3301 | E [email protected] | I www.ecofys.com
Chamber of Commerce 30161191
The waterbed effect and the EU ETS
An explanation of a possible phasing out of Dutch coal fired power plants as
an example
By: Eline Begemann, Long Lam, Maarten Neelis
Date: 22 February 2016
Project number: CSPNL16521
Reviewer:
Bram Borkent
© Ecofys 2016 commissioned by: ENECO
The original report was published in Dutch language. This English translation has been made possible
by the European Climate Fund.

ECOFYS Netherlands B.V. | Kanaalweg 15G | 3526 KL Utrecht| T +31 (0)30 662-3300 | F +31 (0)30 662-3301 | E [email protected] | I www.ecofys.com
Chamber of Commerce 30161191
Abstract
In proposals for supplementary policy measures for the reduction of CO2 in sectors falling under the
EU ETS, it has often been said that these are not effective owing to the waterbed effect that occurs
under the existing CO2 ceiling of the EU ETS. CO2 emissions that you reduce by an additional policy
instrument may lead to additional CO2 emissions elsewhere in the European economy, because the
ceiling has not changed. The discussion regarding the waterbed effect is current in the Netherlands
and it appears in debates concerning a possible early phasing out of all coal fired power plants in the
Netherlands. ECN has calculated that this would result in a decrease of Dutch emissions by at least
15 Mt CO2 per year. Approximately half of this reduction is due to the substitution of coal by gas, the
other half would come from an increase in imported electricity.
In this study we present how the alleged waterbed effect precisely works and the impact that the
Market Stability Reserve (MSR), introduced by the European Commission, has on the waterbed effect.
In doing so, we will use the example of a possible phasing out of coal fired power plants in the
Netherlands. We make the following distinctions here:
1. The direct waterbed effect on emissions from the decrease of emissions in the Netherlands is
directly offset by an increase of emissions elsewhere as a result of the relocation of activities.
This impact only occurs gradually, i.e by the aforementioned increase in net imported
electricity. Should the emission factor of the additional net imported electricity be identical to
that of the disused coal fired power plants in the Netherlands, 7.5 Mt CO2 will be immediately
transferred abroad based on the figure mentioned in the ECN study. In the case of the
imported electricity being generated from CO2-free sources such as wind energy, then this
type of waterbed effect fails to occur and all 15 Mt emission allowances per year are then
added to the existing surplus of emission allowances.
2. The indirect waterbed effect through a reducing effect on the CO2 price. In practice, this will
only exercise a very limited impact and will barely lead to an increase in emissions in the
short term. The maximum of 15 million emission allowances that are made available annually
due to the early closure, amount to less than 1% of the annual emissions in the EU ETS.
Therefore, this will have only a small impact on the CO2 price and thus, via the price, barely
lead to immediate higher emissions elsewhere.
3. The indirect waterbed effect through the banking channel, where emission allowances that
are currently not used will be banked for potential future use. This effect occurs but is muted
by the MSR over time. On the basis of cumulative avoided emissions of at least 83 Mt CO2
and a maximum of 165 Mt CO2, approximately 40% of the unused emission allowances (i.e.
33 to 67 million) will be absorbed by the MSR in the period between 2020 – 2030 and thus
only become available again after 2030. We assume here that the MSR will be stocked by
2030.
Should the MSR continue to absorb emission allowances from the market after 2030, the dampening
effect of the MSR on the waterbed effect will intensify in time. However, if the MSR can no longer be

ECOFYS Netherlands B.V. | Kanaalweg 15G | 3526 KL Utrecht| T +31 (0)30 662-3300 | F +31 (0)30 662-3301 | E [email protected] | I www.ecofys.com
Chamber of Commerce 30161191
filled by 2030 because the surplus has reduced below the MSR threshold, then the dampening effect
will reduce. Hereby it is important to remember that ultimately all the allowances absorbed by the
MSR will become available again in future years, i.e. when the MSR is drained in the period after
2030. This may change in the future if alternative political choices are made regarding the surplus of
emission allowances in the EU ETS.
We have recapitulated a few things in the following figure:
This study indicates that the direct waterbed effect under the EU ETS where emissions avoided in the
Netherlands automatically lead to more emissions elsewhere only partially takes place at the most.
The waterbed effect through the banking channel, in the sense that these emission allowances
remain to be used at a later stage, does indeed occur but the MSR exercises a dampening effect over
time and this effect also becomes subject to possible future political decisions regarding the surplus
in the EU ETS.
We hope that this exploratory study contributes to a better insight into the effect of supplementary
policy measures on the net CO2 reduction in sectors under the EU ETS, given the current surplus of
emission allowances, and the impact of the MSR on the additional surplus that is created.
Cumulative
emission
reduction
165 MtCO2e
Phasing out coal
fired power plants
165 MtCO2e
cumulatively over
2020-2030
Additional CO2
from imported
electricity
0-82.5 MtCO2e
40% of
additional
surplus taken up
by MSR
Additional
surplus of
allowances
82.5-165 MtCO2e
60% of
additional
surplus stays in
circulation
To be used in
future
CO2 price
Increased CO2
emissions
Emission
allowances in
MSR are
released
1
2
3b
To be used in
future
3a
1 Waterbed effect through direct displacement of activities
Waterbed effect through CO2 price channel
Waterbed effect through banking channel
2
3

ECOFYS Netherlands B.V. | Kanaalweg 15G | 3526 KL Utrecht| T +31 (0)30 662-3300 | F +31 (0)30 662-3301 | E [email protected] | I www.ecofys.com
Chamber of Commerce 30161191
Table of contents
1 Introduction and guide 1
1.1 Background 1
1.2 This study 2
2 The waterbed effect under the EU ETS and the role of the MSR 3
2.1 Operation of the EU ETS and the MSR 3
2.2 The MSR impact on additional surplus through phasing out 5
2.2.1 The waterbed effect in the EU ETS 5
2.2.2 Dampening of the waterbed effect through the MSR 6
3 Conclusions 12
4 References 14
CSPNL16521 1
1 Introduction and guide
1.1 Background
The European Emissions Trading System (EU ETS) is seen as the cornerstone of European climate
policy. Recently this has been reaffirmed in the Energy Report that was submitted by the Cabinet to
the Lower House in February. The cardinal feature of the EU ETS is that a common CO2 emissions
ceiling1 applies at the European level for all sources of emissions and sectors covered by the EU ETS,
such as the steel and chemicals sector as well as the electricity sector.
In proposals for supplementary policy measures for the reduction of CO2 in sectors falling under the
EU ETS, it has often been said that these are not effective owing to the waterbed effect that occurs
under the existing CO2 ceiling of the EU ETS. CO2 emissions that you reduce by an additional policy
instrument may lead to additional CO2 emissions elsewhere in the European economy. After all, CO2
emission allowances that cannot be used by the additional measure can be used to emit CO2 in other
sectors.
In principle, the waterbed effect can occur in all additional climate and energy measures designed to
reduce CO2 emissions in sectors covered by the EU ETS. A number of these measures account for the
calculation of the European CO2 ceiling, i.e. by also defining explicit European targets regarding
sustainable energy and energy efficiency alongside CO2 reduction targets. Measures, however, that
Member States have taken in order to achieve these targets could be partial or also truly additional,
i.e. more extensive than what had been accounted for in the calculation of the CO2 ceiling. Debate on
the waterbed effect is being held in several Member States where additional policy is currently being
considered. Among these are the promotion of nuclear energy in the United Kingdom and ambitious
measures for promoting renewable energy in Germany.
In the Netherlands, in response to motions passed in the Lower House, the current question being
asked is whether early phasing out of all coal fired power plants in the Netherlands is contributing to
the reduction of CO2 emissions (EZ, 2015). Nobody doubts that this is physically the case in the
Netherlands. What happens then to the remaining emission allowances left over? Does this lead to
direct or indirect additional CO2 emissions elsewhere in the European economy? In short, is the
waterbed effect at play here?
ECN published a study in October 2015, commissioned by DELTA NV, on the impact of early closure
of five Dutch coal fired power plants2 in 2017 or 2020 (ECN, 2015). The ECN study only dealt with the
impact of closure of the coal fired power plants on the EU Emissions Trading System (EU ETS) to a
1 A number of non-CO2 emissions also fall under the EU ETS. Hereafter, we refer to the CO2 ceiling and CO2 emissions for the sake of the
readability of the report. 2 Hemweg 9, Boiler 9 Amer Power Station, Maasvlakte, Maasvlakte 3 and Eemshaven

CSPNL16521 2
limited extent. What is remarkable is that the report did not address the impact that a closure would
have on the recently introduced Market Stability Reserve (MSR) within the EU ETS, that would enter
into force in 2019.
In this context, Eneco commissioned Ecofys to examine the precise workings of the alleged waterbed
effect. Important questions therefore are:
Does the waterbed effect actually occur and does it also occur when a large surplus of CO2
emission allowances exists? After all, according to current estimates, there are approximately
2 billion unused emission allowances at the moment. This raises the question whether
additional CO2 emissions would indeed directly arise elsewhere if the coal fired power plants
in the Netherlands would close? If this is the case, then why is the surplus not used up
immediately?
What is the impact on the MSR recently introduced by the European Union on the EU ETS and
the waterbed effect? The MSR enters into force in 2019 and is specifically intended to reduce
surplus emission allowances in the EU ETS and make them more scarce. If an additional
policy instrument is introduced, such as a sustainable energy subsidy or closure of coal fired
power plants, this leads to an increase in the surplus of CO2 emission allowances. To what
degree does the MSR dampen or delay the potential waterbed effect as a result of these
additional measures?
1.2 This study
By addressing the aforementioned questions, this report serves as an expansion of and an addition to
the ECN report. Only in chapter 2.1 does the study first provide a factual insight into the working of
the EU ETS and the MSR. The effects of an additional surplus of emission allowances on the MSR
under the EU ETS through closure of Dutch coal fired power plants are described in chapter 2.2.
Finally, chapter 3 recapitulates the main conclusions of the study.

CSPNL16521 3
2 The waterbed effect under the EU ETS and the
role of the MSR
2.1 Operation of the EU ETS and the MSR
The EU ETS is the largest international system for trading in allowances for greenhouse gas emissions
and creates a financial incentive to lower greenhouse gas emissions. Geographically, it covers the
countries in the European Union and additionally Iceland, Liechtenstein and Norway. It limits the
emissions of more than 11,000 energy-intensive installations in power generation and the
manufacturing industry, and activities undertaken by aviation enterprises in these countries (EC,
2015a).
The EU ETS operates by setting a limit on the total amount of greenhouse gases that are emitted
from installations governed by the system. Permissible emissions under the limit will be divided into
emission allowances that are partly auctioned and partly distributed for free annually. The total
amount of available emission allowances is reduced by the passage of time. As a result, companies
falling under the EU ETS reduce their overall emissions.
Companies falling under the EU ETS must monitor their emissions and submit an amount of emission
allowances at the end of the year that correspond to the amount of emissions that they emitted. One
emission right equates to one ton of CO2 emissions. If this is not done, the company is then fined
heavily and the obligation to submit emission allowances does not expire. Whenever a company is in
danger of having too few emission allowances to cover the period in question, it has two options
available in order to avoid this fine: either the limiting of emissions or the purchase of emission
allowances through auctions or from other companies. Whenever a company has more emission
allowances than actual emissions, the emission allowances may either be retained for future use or
sold to other companies. The fact that a limited amount of emission allowances are available and this
amount progressively declines (the CO2 ceiling), ensures that these maintain their value. An
emissions trading system, in principle, ensures that emissions are reduced where it costs the least,
while the achievement of the target is guaranteed. This makes emissions trading an attractive policy
instrument.
Under the EU ETS, a surplus of emission allowances has been built up since 2009, partly due to lower
emissions during the crisis where the emissions decreased but the ceiling was not adjusted. This
surplus led to a lower CO2 price, which brings the risk that the emission trading system does not
result in emission reduction in the short term. In the long term, it has a negative impact on the
ability of the EU ETS to comply with stricter requirements in the area of emission reduction (EC,
2015b). The European Commission addresses this with the help of, inter alia, the Market Stability
Reserve (MSR). This reserve shall enter force on 1 January 2019 and will tackle both the current
surplus of emission allowances as well as allow the EU ETS to withstand future fluctuations better by
adapting the size of the surplus to the availability of auctioned emission allowances.

CSPNL16521 4
The MSR adapts the number of auctioned emission allowances to the overall amount of emission
allowances in circulation:
If more than the upper limit 833 Mt emission allowances are in circulation, the surplus is
decreased by auctioning fewer emission allowances and adding the non-auctioned emission
allowances to the MSR. The number of emission allowances added to the MSR is 12%
annually of the overall number of emission allowances in circulation.
If fewer than the lower limit of 400 Mt of emission allowances are in circulation, an additional
100 Mt of emission allowances will be auctioned per year extracted from the MSR. If fewer
than 100 Mt of emission allowances remain in the reserve, all these emission allowances are
to be auctioned.
The current surplus in the EU ETS is over 2 billion emission allowances (2000 Mt). This corresponds
to more than a year of EU ETS emissions. The MSR ensures that this surplus gradually decreases
from 2019 to 1.4 - 2.4 billion emission allowances in 2020 and to below the limit of 833 Mt between
2025 and 2032. The surplus will decrease a few years later to below the limit of 400 Mt. This is borne
out from several studies (European Environment Agency, 2015a) (PBL & NEa, 2014) (DEHSt, 2014)
(Thomson Reuters Point Carbon, 2014) (Sandbag, 2015)3. Most studies indicate that the MSR shall
only bring 100 Mt of emission allowances onto the market per year after 2030. Without the MSR the
current surplus would change minimally in coming years. The studies indicate negligible differences in
the quantity of allowances coming into the MSR and the surplus over time. This is mainly due to the
differences in emission forecasts, assumptions over the behaviour of the EU ETS market participants
and the costs of emission reduction.4
Market analyses and other studies indicate that owing to the decrease of the surplus due to the MSR,
the price of emission allowances, and thus the incentive to reduce emissions, will increase. Studies
that use the model based on marginal costs and cost optimisation of the EU ETS participants estimate
that the price with the MSR will be €10-13 /tCO2 in 2020, an increase of € 3-5/tCO2 compared with
the situation without an MSR. In 2030 the price is estimated at € 20-40/tCO2 (PBL, 2015) (DIW
Berlin, 2015). At the moment that the MSR will be drained again, the effect is reversed. The
additional allowances that then come onto the market lead to a lower CO2 price compared the
situation without the MSR being drained.
3 This is a selection of studies on the MSR and must not be considered as an exhaustive list. 4 Most studies were conducted before the MSR was adopted, with the EC proposal of January 2014 (MSR from 2021) and variants on the EC
proposal as the starting point, as a result of which the calculated scenarios differ somewhat from today’s form of the MSR. For the
comparison, we have taken the scenarios that most reflect the similarities with the final draft, i.e. a starting date of 2017/2018 and the 900
million emission allowances issued from the auctions for 2014-2016 (backloading) directly into the MSR. The difference in the starting date
ensures a difference in surplus on the market primarily in the initial years after entering force, but the difference decreases over the years.

CSPNL16521 5
2.2 The MSR impact on additional surplus through phasing out
2.2.1 The waterbed effect in the EU ETS
Additional policy instruments, as introduced earlier in this report, that result in a decrease in
emissions under the EU ETS can lead to a waterbed effect. This effect can occur in three different
ways that are related to one another:
1. The direct waterbed effect by direct relocation of activities, where emissions from one
location decrease, while they increase at another location
2. The indirect waterbed effect through a negative effect on the price of emission allowances,
that indirectly results in an increase in emissions from other installations under the EU ETS
3. The waterbed effect via the room for emissions, where room for emissions that are currently
unused may be used at a later stage.
Relocation of activities can occur when a country takes individual measures and thus emissions are
relocated to another country. This is the direct waterbed effect. In the event of phasing out of the
coal fired power plants in the Netherlands, for instance due to the loss of capacity in the Netherlands
being (partly) offset by increased importation of electricity from surrounding countries or by lower
exports and thus increased production abroad. In this manner, the closure of the coal fired power
plants indeed ensures reduction of emissions in the Netherlands, but it also ensures a relocation of a
part of the emissions abroad if the net imported electricity did not come from CO2-free sources.
Additionally, the waterbed effect can occur via the prices of emission allowances. This occurs when
emission reducing measures, for example closure of coal fired power plants, leads to a lower demand
for emission allowances. This decrease in demand results in a decrease of the price of emission
allowances. As a result, other measures that possibly would have been cost-effective at a higher price
may no longer be adopted. This is the indirect waterbed effect. The question is to what extent this
effect actually occurs in practice. The additional availability of emission allowances as a result of the
diminished demand must be large enough to exercise an impact on the price. Furthermore, many
companies use long-term price expectations in decisions concerning emission reduction measures.
It may also be the case that the additional policy measures actually lower the emissions under the EU
ETS, which simply increases the surplus in demand for emission allowances in the market. However,
because the overall emission ceiling under the EU ETS does not change, the room for emissions in
principle (unless politics decide otherwise) remains available for future emissions. The additional
measure thus ensures that emissions shift over time. This is the waterbed effect via the room for
emissions. As set out above, the MSR dampens the waterbed effect over time by (temporarily)
decreasing the room for emissions, where it also exercises an impact on the CO2 price through lower
availability. The extent of the impact and its duration is dependent on future decision-making on the
surplus.
The three aforementioned waterbed effects are inextricably linked. A small direct waterbed effect on
the emissions will lower the demand for emissions and depress the CO2 price further, and the surplus
CSPNL16521 6
of emission allowances will increase. A small waterbed effect of the first type thus results in a larger
waterbed effect of the second and third types.
It is important to realise that the aforementioned effects occur in a phasing-out of coal fired power
plants in the Netherlands, but also to a greater or lesser extent to all additional policy instruments
related to energy consumption and the emissions under the EU ETS. Examples include the Multiyear
Energy Efficiency (MEE) agreement, the stimulation of sustainable energy by the Stimulation of
Sustainable Energy production (SDE+) and the subsidising of CO2 capture and storage (CCS). In a
number of these measures, the determining of the European CO2 ceiling is already taken into
account, namely by also defining the CO2 reduction target and explicit European targets on
sustainable energy and energy efficiency that are to be realised by Member States partly by policy
measures.
2.2.2 Dampening of the waterbed effect through the MSR
The various aforementioned effects can also be well illustrated quantitatively using emission
reductions in the Netherlands by a mandatory closure of all coal fired power plants, such as those
calculated by ECN. These calculations (ECN, 2015) indicate that Dutch emissions from the early
closure of all coal fired power plants from 2020 decrease by at least 15 Mt CO2 per year. This is in
addition to the substitution of approximately half of the coal by gas in the generation of electricity.
The other half of the CO2 decrease comes from the increase of net imports of electricity.
The ECN study makes no further mention of either the source or generation methods of the increased
net imports of electricity. Assume that the emission factor of these net imports is identical to those of
the discontinued capacity in the Netherlands, then 7.5 Mt CO2 would be immediately relocated abroad
(waterbed effect 1, Figure 1). In the event that the increased net imports are achieved from CO2-free
sources, then this relocation does not occur. The 15 Mt CO2 can then be regarded as a maximum
room for emissions that are unused annually through phasing out. This surplus will partly result
through a lower CO2 price in higher emissions within the EU ETS (waterbed effect 2, Figure 1), partly
simultaneously and partly available for the future.
The additional room for emissions would then be partly filled directly and remain partly available for
the future. The MSR exercises an effect on this relocation both over time and also on the CO2 price.
This is schematically depicted in Figure 2. On account of the percentage of the surplus of the future
auctioning withheld by the MSR, the number of emission allowances halted in the MSR will also
increase. This does not allow the use of the entire amount of emission allowances released by other
EU ETS participants, until the surplus sinks to the lower limit and these allowances are brought back
into circulation from the MSR in the (distant) future. This allows the MSR to spread the waterbed
effect over time, though it does not essentially disappear: the emission allowances do not disappear
and remain available for future emissions, unless other political choices on the surplus of emission
allowances in the EU ETS are made in the future.

CSPNL16521 7
Figure 1: Schematic depiction of the waterbed effect through direct relocation of emissions abroad (1) and through a
decrease of the CO2 price through lower demand (2)
Figure 2: Schematic depiction of the effect of the phasing out of coal fired power plants in combination with the MSR
on the surplus of emission allowances
Total emissions
Otheremissions
Emissions coalfired power plants
in NL
Additionalemissionsgas-fired
power plants in
NL
Reducedemissions
from coal-to-gas switch in
NL
Reducedemissions in NL through
importation of electricity
Otheremissions
Emissions coal fired power plants
before closure
After closure these emissions can
partially occur in other countries
through increased imports (1)…
Illustration of the potential waterbed effect through two channels:1) replacement of activities and 2) lower CO2-price
1
… and lead to lower CO2 prices
through new supply-demand
balance (2)
CO2-price
Supply and demand of
emission allowances
Fixed
supply
through
fixed
ceiling
Reduced demand
through coal-to-
gas switch in NL
Lower
CO2-
price
7.5Mton
7.5Mton
2

CSPNL16521 8
Given that the annual emissions in the EU ETS of approximately 1,800 Mt CO2e per year (European
Environment Agency, 2015b) and the surplus of over 2 billion emission allowances, the closure of the
Dutch coal fired power plants alone will only exercise a limited impact on the functioning of the EU
ETS and the MSR. The maximum of 15 million emission allowances that are made available annually
due to the early closure, amount to less than 1% of the annual emissions in the EU ETS. Compared to
the fluctuations in the annual EU ETS emissions by, inter alia, economic circumstances and the
weather, the early closure of the Dutch coal fired power plants falls within the typical margin of
uncertainty for future emissions. This means that the additional surplus of emission allowances will
exercise a fairly small impact on the CO2 price, and the CO2 price will decrease to a very limited
extent by the additional surplus. The second waterbed effect described (increase of emissions
through a lower CO2 price) will therefore be small.
A total of 83-165 Mt of emission allowances will be released over the period 2020-2030 by the early
closure of the coal fired power plants and added to the surplus, depending on the corresponding
emissions of the imported electricity. As a simplification, we assume that the replacement by gas in
the Netherlands and net imports yields a constant reduction per year for the period 2020-20305. In
the expectation of a CO2 price of between € 20 and 40/tCO2 in 2030 and a further increase in the CO2
price thereafter through the falling emission ceiling, all coal fired power plants will become
unprofitable regardless of new measures6. If this already is the case in 2030, then the waterbed
effect is no longer an issue because the emission allowances released by the closure of the coal fired
power plants are the result of the market forces through the CO2 price. Therefore, we limit the
analysis of the impact of the MSR on the waterbed effect until 2030.
From the various studies mentioned in chapter 2.1, it appears that the MSR will withdraw emission
allowances from circulation every year until a certain year between 2025–2032. In the event that the
MSR will absorb emission allowances at least until 2030, the MSR will have absorbed 33-67 Mt of
additional emission allowances surplus through early closure in 2030. In this manner, the MSR
spreads excess surplus over time, depending on whether imported electricity is generated from coal
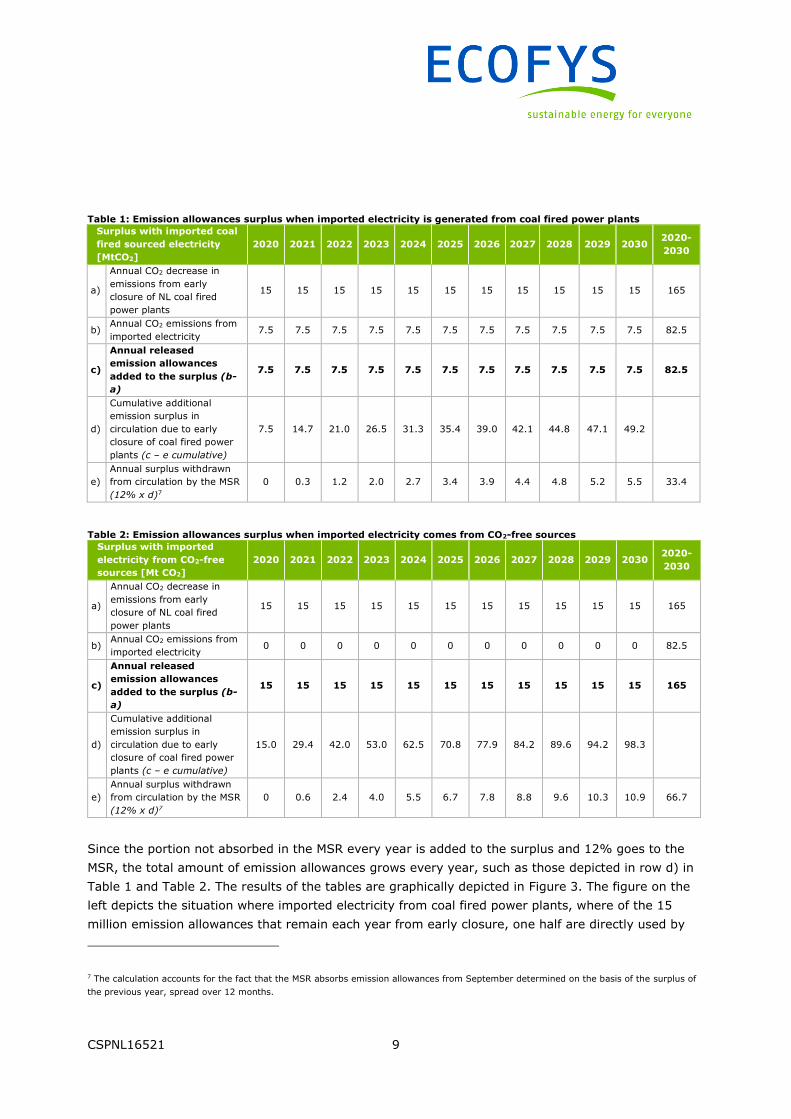
fired power plants (see Table 1) or comes from CO2-free sources (see Table 2).
5 The lower level of 83 million rights assumes that net imported electricity is generated with an emission factor equal to the electricity
replaced in the Netherlands. The upper limit of 165 million rights corresponds to imported electricity from CO2 emission-free sources. The
ECN study indicates a slowly incremental reduction of 15 Mt CO2 in the Netherlands in 2020 to 17 Mt CO2 in 2030. For the readability of the
report, we maintain a reduction of 15 Mt CO2 for the entire period of the study. Furthermore, within this study no examination is undertaken
regarding the plausibility of the reduction and distribution of net imports and the domestic replacement of coal by gas mentioned by ECN. 6 The CO2 price required to make coal fired power plants unprofitable is influenced by various factors, such as the prices of coal and gas and
electricity demand, and varies over time. At the moment, a CO2 price of approximately € 35/tCO2 is required to switch the electricity supply
from coal over to gas (I4CE, 2015).
CSPNL16521 9
Table 1: Emission allowances surplus when imported electricity is generated from coal fired power plants
Surplus with imported coal
fired sourced electricity
[MtCO2]
2020 2021 2022 2023 2024 2025 2026 2027 2028 2029 2030 2020-
2030
a)
Annual CO2 decrease in
emissions from early
closure of NL coal fired
power plants
15 15 15 15 15 15 15 15 15 15 15 165
b) Annual CO2 emissions from
imported electricity 7.5 7.5 7.5 7.5 7.5 7.5 7.5 7.5 7.5 7.5 7.5 82.5
c)
Annual released
emission allowances
added to the surplus (b-
a)
7.5 7.5 7.5 7.5 7.5 7.5 7.5 7.5 7.5 7.5 7.5 82.5
d)
Cumulative additional
emission surplus in
circulation due to early
closure of coal fired power
plants (c – e cumulative)
7.5 14.7 21.0 26.5 31.3 35.4 39.0 42.1 44.8 47.1 49.2
e)
Annual surplus withdrawn
from circulation by the MSR
(12% x d)7
0 0.3 1.2 2.0 2.7 3.4 3.9 4.4 4.8 5.2 5.5 33.4
Table 2: Emission allowances surplus when imported electricity comes from CO2-free sources
Surplus with imported
electricity from CO2-free
sources [Mt CO2]
2020 2021 2022 2023 2024 2025 2026 2027 2028 2029 2030 2020-
2030
a)
Annual CO2 decrease in
emissions from early
closure of NL coal fired
power plants
15 15 15 15 15 15 15 15 15 15 15 165
b) Annual CO2 emissions from
imported electricity 0 0 0 0 0 0 0 0 0 0 0 82.5
c)
Annual released
emission allowances
added to the surplus (b-
a)
15 15 15 15 15 15 15 15 15 15 15 165
d)
Cumulative additional
emission surplus in
circulation due to early
closure of coal fired power
plants (c – e cumulative)
15.0 29.4 42.0 53.0 62.5 70.8 77.9 84.2 89.6 94.2 98.3
e)
Annual surplus withdrawn
from circulation by the MSR
(12% x d)7
0 0.6 2.4 4.0 5.5 6.7 7.8 8.8 9.6 10.3 10.9 66.7
Since the portion not absorbed in the MSR every year is added to the surplus and 12% goes to the
MSR, the total amount of emission allowances grows every year, such as those depicted in row d) in
Table 1 and Table 2. The results of the tables are graphically depicted in Figure 3. The figure on the
left depicts the situation where imported electricity from coal fired power plants, where of the 15
million emission allowances that remain each year from early closure, one half are directly used by
7 The calculation accounts for the fact that the MSR absorbs emission allowances from September determined on the basis of the surplus of
the previous year, spread over 12 months.

CSPNL16521 10
the coal fired power plants abroad and the other half appear as additional emission allowances on the
market. The figure on the right depicts the situation where 15 million allowances are added as
surplus to the emission allowances market each year. Both figures show that the MSR absorbs
approximately 40% of de 83-165 Mt of additional allowances that are released by early closure. If
this analysis were to be extended after 2030 and the MSR continues to absorb emission allowances
from the market after 2030, the dampening effect of the MSR on the waterbed effect will be stronger.
Figure 3: Impact of de MSR on the additional emission allowances surplus resulting from early closure of Dutch coal
fired power plants
A schematic overview of aforementioned calculations is depicted in Figure 4.
Figure 4: Schematic overview of the effect of phasing out coal fired power plants on the EU ETS
0
20
40
60
80
100
120
140
160
2020 2021 2022 2023 2024 2025 2026 2027 2028 2029 2030
Additio
nal
surp
lus of
allo
wances
[MtC
O2e]
Year
Flow of surplus into MSR
until 2030
Imported electricity from coal fired power plants
0
20
40
60
80
100
120
140
160
2020 2021 2022 2023 2024 2025 2026 2027 2028 2029 2030
Additio
nal
surp
lus of
allo
wances
[MtC
O2e]
Year
Flow of surplus into MSR
until 2030
Imported electricity from CO2-free sources
Year
Annual surplus withdrawn from circulation by the MSR
Cumulative additional emission surplus in circulation due to early closure of coal fired power plants
Emission allowances in the MSR
MSR neemt ten minste t/m 2030 emissierechten
uit omloop
Cumulative
emission
reduction
165 MtCO2e
Phasing out coal
fired power plants
165 MtCO2e
cumulatively over
2020-2030
Additional CO2
from imported
electricity
0-82.5 MtCO2e
40% of
additional
surplus taken up
by MSR
Additional
surplus of
allowances
82.5-165 MtCO2e
60% of
additional
surplus stays in
circulation
To be used in
future
CO2 price
Increased CO2
emissions
Emission
allowances in
MSR are
released
1
2
3b
To be used in
future
3a
1 Waterbed effect through direct displacement of activities
Waterbed effect through CO2 price channel
Waterbed effect through banking channel
2
3

CSPNL16521 11
Should the MSR halt absorbing emission allowances even before 2030 because the surplus in
circulation has decreased below the threshold of 833 Mt of emission allowances, then the picture in
Figure 3 would be different. The amount of additional emission allowances that the MSR would absorb
from circulation would then be lower.
Moreover, at any given moment, the point is reached where the surplus in circulation falls below the
lower limit of 400 Mt allowances, causing the MSR to introduce emission allowances on the market
again and then is slowly drained. The additional allowances that then come onto the market lead to a
lower CO2 price compared the situation without the MSR being drained. The early closure of Dutch
coal fired power plants therefore also influences the CO2 price in the second half of the following
decade and the years thereafter, because it can influence the turning points of flooding and draining
of the MSR.
The impact of only a closure of Dutch coal fired power plants on the EU ETS and the MSR is logically
limited. However, should all coal fired power plants in Europe close because of new measures, it will
probably exercise a major impact upon the EU ETS and the MSR. This is not examined further in this
study.

CSPNL16521 12
3 Conclusions
A phasing out of the five new coal fired power plants from 2020 as a measure in addition to the EU
ETS, results in a decrease of Dutch emissions by at least 15 Mt CO2 per year. This is in addition to the
substitution of approximately half of the coal by gas in the generation of electricity. The other half of
the CO2 decrease in the Netherlands comes from an increase of net imported electricity. This can lead
to various waterbed effects under the EU ETS:
1. The direct waterbed effect on emissions from the decrease of emissions in the Netherlands is
directly offset by an increase of emissions elsewhere as a result of the relocation of activities.
This impact only occurs gradually, i.e by the aforementioned increase in net imported
electricity. Should the emission factor of the additional net imported electricity be identical to
that of the disused coal fired power plants in the Netherlands, 7.5 Mt CO2 will be immediately
transferred abroad based on the figure mentioned in the ECN study. In the case of the
imported electricity being generated from CO2-free sources such as wind energy, then this
type of waterbed effect fails to occur and all 15 Mt emission allowances per year are then
added to the existing surplus of emission allowances.
2. The indirect waterbed effect through a reducing effect on the CO2 price. In practice, this will
only exercise a very limited impact and will barely lead to an increase in emissions in the
short term. The maximum of 15 million emission allowances that are made available annually
due to the early closure, amount to less than 1% of the annual emissions in the EU ETS.
Therefore, this will have only a small impact on the CO2 price and thus, via the price, barely
lead to immediate higher emissions elsewhere.
3. The indirect waterbed effect through the banking channel, where emission allowances that
are currently not used will be banked for potential future use. This effect occurs but is muted
by the MSR over time. On the basis of cumulative avoided emissions of at least 83 Mt CO2
and a maximum of 165 Mt CO2, approximately 40% of the unused emission allowances (i.e.
33 to 67 million) will be absorbed by the MSR in the period between 2020 – 2030 and thus
only become available again after 2030. We assume here that the MSR will be stocked by
2030.
Should the MSR continue to absorb emission allowances from the market after 2030, the dampening
effect of the MSR on the waterbed effect will intensify in time. However, if the MSR can no longer be
filled by 2030 because the surplus has reduced below the MSR threshold, then the dampening effect
will shrink. Hereby it is important to remember that ultimately all the allowances absorbed by the
MSR will become available again in future years, i.e. when the MSR is drained in the period after
2030. This may change in the future if alternative political choices are made regarding the surplus of
emission allowances in the EU ETS.
In this study we thus show that the direct waterbed effect under the EU ETS where avoided emissions
in the Netherlands automatically directly lead to more emissions elsewhere, only occurs partially. The
waterbed effect on the room for emissions through time, in the sense that room for emissions remain

CSPNL16521 13
and can be used at a later stage does indeed occur, but the MSR exercises a dampening effect on this
waterbed effect on the room for emissions in the EU ETS and this effect is subject to possible future
political decisions concerning the surplus in the EU ETS.
We hope that this exploratory study contributes to a better insight into the effect of supplementary
policy measures on the net CO2 reduction in sectors under the EU ETS, given the current surplus of
emission allowances, and the impact of the MSR on the additional surplus that is created.

CSPNL16521 14
4 References
DEHSt (2014), Strengthening Emissions Trading.
DIW Berlin (2015), Modelling a market stability reserve in carbon markets.
EC (2015a), The EU Emissions Trading System (EU ETS). Retrieved from
http://ec.europa.eu/clima/policies/ets/index_en.htm
EC (2015b), Retrieved from Structural reform of the European carbon market:
http://ec.europa.eu/clima/policies/ets/reform/index_en.htm
ECN (2015), Effecten van het vervroegd sluiten van de Nederlandse kolencentrales.
European Environment Agency (2015a), Trends and projections in the EU ETS in 2015.
European Environment Agency (2015b), EU Emissions Trading System (ETS) data viewer.
Retrieved from http://www.eea.europa.eu/data-and-maps/data/data-viewers/emissions-
trading-viewer.
EZ (2015), Brief Minister Kamp aan Tweede Kamer betreffende uitvoering motie over uitfaseren van
kolencentrales.
I4CE (2015), Tendances Carbone No. 107.
PBL & NEa (2014), Marktstabiliteitsreserve in het EU ETS.
PBL (2015), CO2-prijs en veilingsopbrengsten in de nationale energieverkenning 2015.
Sandbag (2015), Sandbag Market Stability Reserve modelling tool. Retrieved from
https://sandbag.org.uk/carbonpricing/data/msr/.
Thomson Reuters Point Carbon (2014), The MSR: Impact on balance and prices. Retrieved from
https://www.ceps.eu/sites/default/files/Ferdinand.pdf.


ECOFYS Netherlands B.V.
Kanaalweg 15G
3526 KL Utrecht
T: +31 (0) 30 662-3300
F: +31 (0) 30 662-3301
I: www.ecofys.com