THE WALT DISNEY COMPANY AND SUBSIDIARIES
127
UNITED STATES SECURITIES AND EXCHANGE COMMISSION Washington, D.C. 20549 FORM 10-K ANNUAL REPORT PURSUANT TO SECTION 13 OR 15(d) OF THE SECURITIES EXCHANGE ACT OF 1934 For the Fiscal Year Ended October 1, 2016 Commission File Number 1-11605 Incorporated in Delaware 500 South Buena Vista Street, Burbank, California 91521 (818) 560-1000 I.R.S. Employer Identification No. 95-4545390 Securities Registered Pursuant to Section 12(b) of the Act: Title of Each Class Name of Each Exchange on Which Registered Common Stock, $.01 par value New York Stock Exchange Securities Registered Pursuant to Section 12(g) of the Act: None. Indicate by check mark if the registrant is a well-known seasoned issuer, as defined in Rule 405 of the Securities Act. Yes x No o Indicate by check mark if the registrant is not required to file reports pursuant to Section 13 or Section 15(d) of the Act. Yes o No x Indicate by check mark whether the registrant (1) has filed all reports required to be filed by Section 13 or 15(d) of the Securities Exchange Act of 1934 during the preceding 12 months and (2) has been subject to such filing requirements for the past 90 days. Yes x No o Indicate by check mark whether the registrant has submitted electronically and posted on its corporate Web site, if any, every Interactive Data File required to be submitted and posted pursuant to Rule 405 of Regulation S-T during the preceding 12 months (or for such shorter period that the registrant was required to submit and post such files). Yes x No o Indicate by check mark if disclosure of delinquent filers pursuant to Rule 405 of Regulation S-K is not contained herein, and will not be contained, to the best of registrant’s knowledge, in definitive proxy or information statements incorporated by reference in Part III of this Form 10-K or any amendment to this Form 10- K. x Indicate by check mark whether the registrant is a large accelerated filer, an accelerated filer, a non-accelerated filer, or a smaller reporting company. See the definitions of “large accelerated filer”, “accelerated filer”, and “smaller reporting company” in Rule 12b-2 of the Exchange Act (Check one). Large accelerated filer x Accelerated filer o Non-accelerated filer (do not check if smaller reporting company) o Smaller reporting company o Indicate by check mark whether the registrant is a shell company (as defined in Rule 12b-2 of the Act). Yes o No x The aggregate market value of common stock held by non-affiliates (based on the closing price on the last business day of the registrant’s most recently completed second fiscal quarter as reported on the New York Stock Exchange-Composite Transactions) was $160.9 billion . All executive officers and directors of the registrant and all persons filing a Schedule 13D with the Securities and Exchange Commission in respect to registrant’s common stock have been deemed, solely for the purpose of the foregoing calculation, to be “affiliates” of the registrant. There were 1,591,460,982 shares of common stock outstanding as of November 16, 2016 . Documents Incorporated by Reference Certain information required for Part III of this report is incorporated herein by reference to the proxy statement for the 2017 annual meeting of the Company’s shareholders.
Transcript of THE WALT DISNEY COMPANY AND SUBSIDIARIES

UNITED STATESSECURITIES AND EXCHANGE COMMISSION
Washington, D.C. 20549
FORM 10-KANNUAL REPORT PURSUANT TO SECTION 13 OR 15(d) OF THE
SECURITIES EXCHANGE ACT OF 1934
For the Fiscal Year Ended October 1, 2016 Commission File Number 1-11605
Incorporated in Delaware500 South Buena Vista Street, Burbank, California 91521(818) 560-1000
I.R.S. Employer Identification No.95-4545390
Securities Registered Pursuant to Section 12(b) of the Act:
Title of Each Class Name of Each Exchange
on Which RegisteredCommon Stock, $.01 par value New York Stock Exchange
Securities Registered Pursuant to Section 12(g) of the Act: None.
Indicate by check mark if the registrant is a well-known seasoned issuer, as defined in Rule 405 of theSecurities Act. Yes x No o
Indicate by check mark if the registrant is not required to file reports pursuant to Section 13 or Section 15(d)of the Act. Yes o No x
Indicate by check mark whether the registrant (1) has filed all reports required to be filed by Section 13 or 15(d) of the Securities Exchange Act of 1934during the preceding 12 months and (2) has been subject to such filing requirements for the past 90 days. Yes x No o
Indicate by check mark whether the registrant has submitted electronically and posted on its corporate Web site, if any, every Interactive Data File required tobe submitted and posted pursuant to Rule 405 of Regulation S-T during the preceding 12 months (or for such shorter period that the registrant was required tosubmit and post such files). Yes x No o
Indicate by check mark if disclosure of delinquent filers pursuant to Rule 405 of Regulation S-K is not contained herein, and will not be contained, to the bestof registrant’s knowledge, in definitive proxy or information statements incorporated by reference in Part III of this Form 10-K or any amendment to this Form 10-K. x
Indicate by check mark whether the registrant is a large accelerated filer, an accelerated filer, a non-accelerated filer, or a smaller reporting company. See thedefinitions of “large accelerated filer”, “accelerated filer”, and “smaller reporting company” in Rule 12b-2 of the Exchange Act (Check one).
Large accelerated filer x Accelerated filer o Non-accelerated filer (do not check if smaller reporting company) o Smaller reporting company o
Indicate by check mark whether the registrant is a shell company (as defined in Rule 12b-2 of the Act). Yes o No x
The aggregate market value of common stock held by non-affiliates (based on the closing price on the last business day of the registrant’s most recentlycompleted second fiscal quarter as reported on the New York Stock Exchange-Composite Transactions) was $160.9 billion . All executive officers and directors ofthe registrant and all persons filing a Schedule 13D with the Securities and Exchange Commission in respect to registrant’s common stock have been deemed,solely for the purpose of the foregoing calculation, to be “affiliates” of the registrant.
There were 1,591,460,982 shares of common stock outstanding as of November 16, 2016 .
Documents Incorporated by ReferenceCertain information required for Part III of this report is incorporated herein by reference to the proxy statement for the 2017 annual meeting of the
Company’s shareholders.

THE WALT DISNEY COMPANY AND SUBSIDIARIES
TABLE OF CONTENTS
PagePART I
ITEM 1. Business 1 ITEM 1A. Risk Factors 15 ITEM 1B. Unresolved Staff Comments 20 ITEM 2. Properties 21 ITEM 3. Legal Proceedings 22 ITEM 4. Mine Safety Disclosures 22 Executive Officers of the Company 22
PART II ITEM 5. Market for the Company’s Common Equity, Related Stockholder Matters and Issuer Purchases of Equity Securities 23 ITEM 6. Selected Financial Data 24 ITEM 7. Management’s Discussion and Analysis of Financial Condition and Results of Operations 25 ITEM 7A. Quantitative and Qualitative Disclosures About Market Risk 51 ITEM 8. Financial Statements and Supplementary Data 52 ITEM 9. Changes in and Disagreements with Accountants on Accounting and Financial Disclosure 52 ITEM 9A. Controls and Procedures 52 ITEM 9B. Other Information 52
PART III ITEM 10. Directors, Executive Officers and Corporate Governance 53 ITEM 11. Executive Compensation 53 ITEM 12. Security Ownership of Certain Beneficial Owners and Management and Related Stockholder Matters 53 ITEM 13. Certain Relationships and Related Transactions, and Director Independence 53 ITEM 14. Principal Accounting Fees and Services 53
PART IV ITEM 15. Exhibits and Financial Statement Schedules 54 SIGNATURES 57 Consolidated Financial Information — The Walt Disney Company 58


TABLE OF CONTENTS
PART I
ITEM 1. Business
The Walt Disney Company, together with its subsidiaries, is a diversified worldwide entertainment company with operations in four business segments:Media Networks, Parks and Resorts, Studio Entertainment, and Consumer Products & Interactive Media. For convenience, the terms “Company” and “we” areused to refer collectively to the parent company and the subsidiaries through which our various businesses are actually conducted.
Information on the Company’s revenues, segment operating income and identifiable assets appears in Note 1 to the Consolidated Financial Statementsincluded in Item 8 hereof. The Company employed approximately 195,000 people as of October 1, 2016 .
MEDIA NETWORKS
The Media Networks segment includes cable and broadcast television networks, television production and distribution operations, domestic televisionstations and radio networks and stations. The Company also has investments in entities that operate programming, distribution and content management services,including television networks, which are accounted for under the equity method of accounting.
The businesses in the Media Networks segment principally generate revenue from the following:• fees charged to cable, satellite, and telecommunications service providers (Multi-channel Video Programming Distributors “MVPD”), broadband service
providers (digital MVPDs) and television stations affiliated with our domestic broadcast television network for the right to deliver our programs to theircustomers/subscribers (“affiliate fees”);
• the sale to advertisers of time in programs for commercial announcements (“ad sales”); and• the sale to television networks and distributors for the right to use our television programming (“program sales”).
Operating expenses primarily consist of programming and production costs, participations and residuals expense, technical support costs, operating labor anddistribution costs.
Cable Networks
Our primary cable networks consist of ESPN, the Disney Channels and Freeform, which produce their own programs or acquire rights from third parties toair their programs on our networks.
Cable networks derive the majority of their revenues from affiliate fees and, for certain networks (primarily ESPN and Freeform), ad sales. Generally, theCompany’s cable networks provide programming services under multi-year agreements with MVPDs that include contractually determined rates on a persubscriber basis. The amounts that we can charge to MVPDs for our cable network services are largely dependent on the quality and quantity of programming thatwe can provide and the competitive market. The ability to sell time for commercial announcements and the rates received are primarily dependent on the size andnature of the audience that the network can deliver to the advertiser as well as overall advertiser demand. We also sell programming developed by our cablenetworks worldwide to television broadcasters, to subscription video-on-demand (SVOD) services, such as Netflix, Hulu and Amazon, and in home entertainmentformats such as DVD, Blu-ray and iTunes.
1

TABLE OF CONTENTS
The Company’s significant cable networks and the number of subscribers as estimated by Nielsen Media Research (1) (except where noted) are as follows:
EstimatedSubscribers(in millions)
ESPN - Domestic ESPN 90ESPN2 89ESPNU 71ESPNEWS (2) 70SEC Network (2) 62
Disney Channels - Domestic Disney Channel 93Disney Junior 74Disney XD 78
Freeform 91International Channels (3)
ESPN channels 141Disney Channel 205Disney Junior 140Disney XD 127
(1) Nielsen Media Research estimates are as of September 2016 and only capture traditional MVPD subscriber counts and do not include digital MVPDsubscribers.
(2) Because Nielsen Media Research does not measure these networks, estimated subscriber counts are according to SNL Kagan as of December 2015.(3) Because Nielsen Media Research and SNL Kagan do not measure these networks, estimated subscriber counts are based on internal management reports
as of September 2016.
ESPNESPN is a multimedia sports entertainment company owned 80% by the Company and 20% by Hearst Corporation. ESPN operates eight 24-hour domestic
television sports networks: ESPN, ESPN2, ESPNU (a network devoted to college sports), ESPNEWS, SEC Network (a sports programming network dedicated toSoutheastern Conference college athletics), ESPN Classic, the regionally focused Longhorn Network (a network dedicated to The University of Texas athletics)and ESPN Deportes (a Spanish language network), which are all simulcast in high definition except ESPN Classic. ESPN programs the sports schedule on theABC Television Network, which is branded ESPN on ABC. ESPN owns 19 television networks outside of the United States (primarily in Latin America) thatallow ESPN to reach sports fans in over 60 countries and territories in four languages.
ESPN holds rights for various professional and college sports programming including college football (including bowl games and the College FootballPlayoff) and basketball, the National Basketball Association (NBA), the National Football League (NFL), Major League Baseball (MLB), US Open Tennis,various soccer rights, the Wimbledon Championships and the Masters golf tournament.
ESPN also operates:
• ESPN.com – which delivers comprehensive sports news, information and video on internet-connected devices• WatchESPN – which delivers live streams of most of ESPN’s domestic networks on internet-connected devices to authenticated MVPD subscribers. Non-
subscribers have limited access to certain content on select Watch platforms• ESPN3, SEC Network + and ACC Network Extra – which are ESPN’s live multi-screen sports networks that deliver exclusive sports events and are
accessible on WatchESPN• ESPN Events – which owns and operates a portfolio of collegiate sporting events including bowl games, basketball games and post-season award shows
2

TABLE OF CONTENTS
• ESPN Radio – which distributes talk and play by play programming and is one of the largest sports radio networks in the U.S. ESPN Radio networkprogramming is carried on more than 500 terrestrial stations including four ESPN owned stations in New York, Los Angeles, Chicago and Dallas and onsatellite and internet radio
• ESPN The Magazine – which is a bi-weekly sports magazine
Disney ChannelsThe Company operates over 100 Disney branded television channels, which are broadcast in 34 languages and 163 countries/territories. Branded channels
include Disney Channel, Disney Junior, Disney XD, Disney Cinemagic, Disney Cinema and DLife. Disney Channel content is also available through subscriptionand video-on-demand services and online through our websites: DisneyChannel.com, DisneyXD.com and DisneyJunior.com. Programming for these networksincludes internally developed and acquired programming. The Disney Channels also include Radio Disney and RadioDisney.com.
Disney Channel, Disney Junior and Disney XD are available digitally through products that deliver live or on-demand channel programming on internet-connected devices to authenticated MVPD subscribers. Non-subscribers have limited access to select content on these platforms.
Disney Channel - Disney Channel is a cable network airing original series and movie programming targeted to kids ages 2 to 14. In the U.S., Disney Channelairs 24 hours a day. Disney Channel develops and produces shows for exhibition on its network, including live-action comedy series, animated programming andpreschool series as well as original movies . Disney Channel also airs programming and content from Disney’s theatrical film and television programming library.
Disney Junior - Disney Junior is a cable network that airs programming targeted to kids ages 2 to 7 and their parents and caregivers, featuring animated andlive-action programming that blends Disney’s storytelling and characters with learning. In the U.S., Disney Junior airs 24 hours a day. Disney Junior also airs as aprogramming block on the Disney Channel.
Disney XD - Disney XD is a cable channel airing a mix of live-action and animated original programming targeted to kids ages 6 to 14. In the U.S., DisneyXD airs 24 hours a day.
Disney Cinemagic and Disney Cinema - Disney Cinemagic and Disney Cinema are premium subscription services available in certain countries in Europeairing a selection of Disney movies, Disney cartoons and shorts as well as animated television series.
Radio Disney - Radio Disney is a 24-hour radio network targeted to kids, tweens and families reaching listeners through a national broadcast on variousdistribution platforms. Radio Disney operates from an owned terrestrial radio station in Los Angeles. Radio Disney is also available throughout Latin America ontwo owned terrestrial stations and through agreements with third-party radio stations.
FreeformFreeform (formerly ABC Family) is a domestic cable network targeted to viewers ages 14 to 34. Freeform produces original live-action programming,
acquires programming from third parties, airs content from our owned theatrical film library and features branded holiday programming events such as “13 Nightsof Halloween” and “25 Days of Christmas”.
Freeform is available digitally through products that deliver either live or on-demand channel programing on internet-connected devices to authenticatedMVPD subscribers. Non-subscribers have limited access to select Freeform programming.
HungamaHungama is a kids general entertainment cable network in India, which features a mix of animation, Hindi-language series and game shows.
UTV/Bindass NetworksWe operate UTV and Bindass branded cable television networks in India. The networks include UTV Action and UTV Movies, which offer Bollywood
movies as well as Hindi dubbed Hollywood movies. The networks also include Bindass, a youth entertainment channel, and Bindass Play, a music channel.
Broadcasting
Our broadcasting business includes a domestic broadcast network, television production and distribution operations, and eight owned domestic televisionstations.
3

TABLE OF CONTENTS
Domestic Broadcast Television NetworkThe Company operates the ABC Television Network (ABC), which as of October 1, 2016 , had affiliation agreements with 242 local television stations
reaching almost 100% of all U.S. television households. ABC broadcasts programs in the following “dayparts”: primetime, daytime, late night, news and sports.
ABC produces its own programs and also acquires programming rights from third parties as well as entities that are owned by or affiliated with theCompany. ABC derives the majority of its revenues from ad sales. The ability to sell time for commercial announcements and the rates received are primarilydependent on the size and nature of the audience that the network can deliver to the advertiser as well as overall advertiser demand for time on network broadcasts.ABC also receives fees from affiliated television stations for the right to broadcast ABC programming.
ABC network programming is available digitally on internet-connected devices to authenticated MVPD subscribers. Non-subscribers have a more limitedaccess to on-demand episodes.
The ABC app and ABC.com provide online extensions to ABC programming including episodes and selected clips. ABCNews.com provides in-depthworldwide news coverage online and video-on-demand news reports from ABC News broadcasts. ABC News also has an agreement to provide news content toYahoo! News.
Television ProductionThe Company produces the majority of its scripted television programs under the ABC Studios banner. Program development is carried out in collaboration
with independent writers, producers and creative teams, with a focus on one-hour dramas and half-hour comedies, primarily for primetime broadcasts. Primetimeprogramming produced either for our networks or for third parties for the 2016/2017 television season includes thirteen returning and five new one-hour dramasand four new and three returning half-hour comedies. Additionally, the Company is producing five drama series for Netflix. The Company also produces JimmyKimmel Live for late night and a variety of primetime specials, as well as syndicated, news and daytime programming.
Television DistributionWe distribute the Company’s productions worldwide to television broadcasters, to SVOD services such as Netflix, Hulu and Amazon, and in home
entertainment formats.
Domestic Television StationsThe Company owns eight television stations, six of which are located in the top-ten markets in the U.S. in terms of television households. The television
stations derive the majority of their revenues from ad sales. The stations also receive affiliate fees from MVPDs. All of our television stations are affiliated withABC and collectively reach 23% of the nation’s television households. Each owned station broadcasts three digital channels: the first consists of local, ABC andsyndicated programming; the second is the Live Well Network; and the third is the LAFF Network.
The stations we own are as follows:
TV Station Market Television Market
Ranking (1)
WABC New York, NY 1KABC Los Angeles, CA 2WLS Chicago, IL 3WPVI Philadelphia, PA 4KGO San Francisco, CA 6
KTRK Houston, TX 10WTVD Raleigh-Durham, NC 25KFSN Fresno, CA 54
(1) Based on Nielsen Media Research, U.S. Television Household Estimates, January 1, 2016
4

TABLE OF CONTENTS
Equity Investments
The Company has investments in media businesses that are accounted for under the equity method, and the Company’s share of the financial results for theseequity investments are reported as “Equity in the income of investees” in the Company’s Consolidated Statements of Income. The Company’s significant mediaequity investments are as follows:
A+E and ViceA+E Television Networks (A+E) is a joint venture owned 50% by the Company and 50% by the Hearst Corporation. A+E operates a variety of cable
networks including:
• A&E – which offers entertainment programming including original reality and scripted series• HISTORY – which offers original series and event-driven specials• Lifetime – which is devoted to female-focused programming• Lifetime Movie Network (LMN) – which is a 24-hour movie channel• FYI – which offers contemporary lifestyle programming• Lifetime Real Women – which is a 24-hour cable network with programming focusing on women
Internationally, A+E programming is available in over 150 countries.
During fiscal 2016, A+E acquired an 8% interest in Vice Group Holdings, Inc. (Vice) in exchange for a 49.9% interest in A+E’s H2 channel, which has beenrebranded as Viceland and programmed with Vice content. A+E has a 20% interest in Vice. In addition, the Company has an 11% direct ownership interest inVice.
A+E and Vice's significant cable networks and the number of domestic subscribers by channel as estimated by Nielsen Media Research (1) are as follows:
EstimatedSubscribers
(in millions) (1)
A+E A&E 92HISTORY 93Lifetime 92LMN 79FYI 68
Vice Viceland 68
(1) Nielsen Media Research estimates are as of September 2016 and only capture traditional MVPD subscriber counts and do not include digital MVPDsubscribers.
BAMTechIn fiscal 2016, the Company acquired a 15% interest in BAMTech, LLC (BAMTech), an entity which holds Major League Baseball’s streaming technology
and content delivery businesses, for $450 million. BAMTech is a content management and distribution business and also has a direct-to-consumer business inwhich it acquires rights and distributes sports programming.
The Company is committed to acquire an additional 18% interest for $557 million in January 2017. In addition, the Company has an option to increase itsownership to 66% by acquiring additional shares at fair market value from Major League Baseball between August 2020 and August 2023.
CTVESPN holds a 30% equity interest in CTV Specialty Television, Inc., which owns television networks in Canada, including The Sports Networks (TSN) 1-5,
Le Réseau des Sports (RDS), RDS2, RDS Info, ESPN Classic Canada, Discovery Canada and Animal Planet Canada.
HuluHulu aggregates acquired television and film entertainment content and original content produced by Hulu and distributes it digitally to internet-connected
devices. Hulu offers a subscription-based service with limited commercials and a subscription-based service with no commercials.
5

TABLE OF CONTENTS
The Company licenses television and film programming to Hulu in the ordinary course of business. The Company defers a portion of its profits from thesetransactions until Hulu recognizes third-party revenue from the exploitation of the rights. The portion that is deferred reflects our ownership interest in Hulu.
Hulu is owned 30% each by the Company, Twenty-First Century Fox, Inc. and Comcast Corporation. Time Warner, Inc. (TW) holds the remaining 10%interest in the venture, which was acquired from Hulu for $583 million in August 2016. For not more than 36 months from August 2016, TW may put its shares toHulu or Hulu may call the shares from TW under certain limited circumstances arising from regulatory review. The Company and Twenty-First Century Fox, Inc.have agreed to make a capital contribution for up to approximately $300 million each if required to fund the repurchase of shares from TW.
Seven TVSeven TV operates an advertising-supported, free-to-air Disney Channel in Russia. During fiscal 2016, the Company reduced its common share ownership in
Seven TV from 49% to 20% to comply with Russian regulations that limit foreign ownership of media companies, while maintaining our 49% economic interest inthe business.
Competition and Seasonality
The Company’s Media Networks businesses compete for viewers primarily with other television and cable networks, independent television stations andother media, such as online video services and video games. With respect to the sale of advertising time, we compete with other television networks and radiostations, independent television stations, MVPDs and other advertising media such as online and electronic delivery of content, newspapers, magazines andbillboards. Our television and radio stations primarily compete for audiences and advertisers in individual market areas.
The growth in the number of networks distributed by MVPDs and growth in number of online services has resulted in increased competitive pressures foradvertising revenues for our broadcast and cable networks. The Company’s cable networks also face competition from other cable networks for carriage byMVPDs and face competition from online services. The Company’s contractual agreements with MVPDs are renewed or renegotiated from time to time in theordinary course of business. Consolidation and other market conditions in the cable and satellite distribution industry and other factors may adversely affect theCompany’s ability to obtain and maintain contractual terms for the distribution of its various cable programming services that are as favorable as those currently inplace.
The Company’s Media Networks businesses also compete for the acquisition of sports and other programming. The market for programming is verycompetitive, particularly for live sports programming.
The Company’s internet websites and digital products compete with other websites and entertainment products.
Advertising revenues at Media Networks are subject to seasonal advertising patterns and changes in viewership levels. Revenues are typically somewhathigher during the fall and somewhat lower during the summer months. Affiliate fees are generally collected ratably throughout the year.
Federal Regulation
Television and radio broadcasting are subject to extensive regulation by the Federal Communications Commission (FCC) under federal laws and regulations,including the Communications Act of 1934, as amended. Violation of FCC regulations can result in substantial monetary forfeitures, limited renewals of licensesand, in egregious cases, denial of license renewal or revocation of a license. FCC regulations that affect our Media Networks segment include the following:
• Licensing of television and radio stations. Each of the television and radio stations we own must be licensed by the FCC. These licenses are granted forperiods of up to eight years, and we must obtain renewal of licenses as they expire in order to continue operating the stations. We (and the acquiring entityin the case of a divestiture) must also obtain FCC approval whenever we seek to have a license transferred in connection with the acquisition ordivestiture of a station. The FCC may decline to renew or approve the transfer of a license in certain circumstances and may delay renewals whilepermitting a licensee to continue operating. Although we have received such renewals and approvals in the past or have been permitted to continueoperations when renewal is delayed, there can be no assurance that this will be the case in the future.
6

TABLE OF CONTENTS
• Television and radio station ownership limits. The FCC imposes limitations on the number of television stations and radio stations we can own in aspecific market, on the combined number of television and radio stations we can own in a single market and on the aggregate percentage of the nationalaudience that can be reached by television stations we own. Currently:▪ FCC regulations may restrict our ability to own more than one television station in a market, depending on the size and nature of the market. We do
not own more than one television station in any market.▪ Federal statutes permit our television stations in the aggregate to reach a maximum of 39% of the national audience The FCC recently changed how it
treats UHF television stations for purposes of determining compliance with the 39% cap and pursuant to the FCC’s revised rules, our eight stationsreach approximately 23% of the national audience.
▪ FCC regulations in some cases impose restrictions on our ability to acquire additional radio or television stations in the markets in which we ownradio stations, but we do not believe any such limitations are material to our current operating plans.
• Dual networks. FCC rules currently prohibit any of the four major broadcast television networks — ABC, CBS, Fox and NBC — from being undercommon ownership or control.
• Regulation of programming. The FCC regulates broadcast programming by, among other things, banning “indecent” programming, regulating politicaladvertising and imposing commercial time limits during children’s programming. Penalties for broadcasting indecent programming can range up to$350,000 per indecent utterance or image per station.Federal legislation and FCC rules also limit the amount of commercial matter that may be shown on broadcast or cable channels during programmingdesigned for children 12 years of age and younger. In addition, broadcast channels are generally required to provide a minimum of three hours per weekof programming that has as a “significant purpose” meeting the educational and informational needs of children 16 years of age and younger. FCC rulesalso give television station owners the right to reject or refuse network programming in certain circumstances or to substitute programming that thelicensee reasonably believes to be of greater local or national importance.
• Cable and satellite carriage of broadcast television stations. With respect to cable systems operating within a television station’s Designated MarketArea, FCC rules require that every three years each television station elect either “must carry” status, pursuant to which cable operators generally mustcarry a local television station in the station’s market, or “retransmission consent” status, pursuant to which the cable operator must negotiate with thetelevision station to obtain the consent of the television station prior to carrying its signal. Under the Satellite Home Viewer Improvement Act and itssuccessors, including most recently the STELA Reauthorization Act (STELAR), which also requires the “must carry” or “retransmission consent”election, satellite carriers are permitted to retransmit a local television station’s signal into its local market with the consent of the local television station.The ABC owned television stations have historically elected retransmission consent. Portions of these satellite laws are set to expire on December 31,2019.
• Cable and satellite carriage of programming. The Communications Act and FCC rules regulate some aspects of negotiations regarding cable and satelliteretransmission consent, and some cable and satellite companies have sought regulation of additional aspects of the carriage of programming on cable andsatellite systems. New legislation, court action or regulation in this area could have an impact on the Company’s operations.
The foregoing is a brief summary of certain provisions of the Communications Act, other legislation and specific FCC rules and policies. Reference shouldbe made to the Communications Act, other legislation, FCC rules and public notices and rulings of the FCC for further information concerning the nature andextent of the FCC’s regulatory authority.
FCC laws and regulations are subject to change, and the Company generally cannot predict whether new legislation, court action or regulations, or a changein the extent of application or enforcement of current laws and regulations, would have an adverse impact on our operations.
PARKS AND RESORTS
The Company owns and operates the Walt Disney World Resort in Florida; the Disneyland Resort in California; Aulani, a Disney Resort & Spa in Hawaii;the Disney Vacation Club; the Disney Cruise Line; and Adventures by Disney. The Company manages and has effective ownership interests of 81% in DisneylandParis, 47% in Hong Kong Disneyland Resort and 43% in Shanghai Disney Resort, each of which is consolidated in our financial statements. The Company alsolicenses our intellectual property to a third party to operate the Tokyo Disney Resort in Japan. The Company’s Walt Disney Imagineering unit designs anddevelops new theme park concepts and attractions as well as resort properties.
7

TABLE OF CONTENTS
The businesses in the Parks and Resorts segment generate revenues from the sale of admissions to theme parks, sales of food, beverage and merchandise,charges for room nights at hotels, sales of cruise and other vacation packages and sales, as well as rentals of vacation club properties. Revenues are also generatedfrom sponsorships and co-branding opportunities, real estate rent and sales, and royalties from Tokyo Disney Resort. Significant costs include labor, infrastructurecosts, depreciation, costs of merchandise, food and beverage sold, marketing and sales expense and cost of vacation club units. Infrastructure costs includeinformation systems expense, repairs and maintenance, utilities and fuel, property taxes, insurance and transportation.
Walt Disney World Resort
The Walt Disney World Resort is located 22 miles southwest of Orlando, Florida, on approximately 25,000 acres of land. The resort includes theme parks(the Magic Kingdom, Epcot, Disney’s Hollywood Studios and Disney’s Animal Kingdom); hotels; vacation club properties; a retail, dining and entertainmentcomplex; a sports complex; conference centers; campgrounds; golf courses; water parks; and other recreational facilities designed to attract visitors for an extendedstay.
The Walt Disney World Resort is marketed through a variety of international, national and local advertising and promotional activities. A number ofattractions and restaurants in each of the theme parks are sponsored or operated by other corporations through multi-year agreements.
Magic Kingdom — The Magic Kingdom consists of six themed areas: Adventureland, Fantasyland, Frontierland, Liberty Square, Main Street USA andTomorrowland. Each land provides a unique guest experience featuring themed attractions, live Disney character interactions, restaurants, refreshment areas andmerchandise shops. Additionally, there are daily parades and a nighttime fireworks extravaganza, Wishes.
Epcot — Epcot consists of two major themed areas: Future World and World Showcase. Future World dramatizes certain historical developments andaddresses the challenges facing the world today through pavilions devoted to showcasing science and technology innovations, communication, energy,transportation, use of imagination, nature and food production, the ocean environment and space. World Showcase presents a community of nations focusing onthe culture, traditions and accomplishments of people around the world. Countries represented with pavilions include Canada, China, France, Germany, Italy,Japan, Mexico, Morocco, Norway, the United Kingdom and the United States. Both areas feature themed attractions, restaurants and merchandise shops. Epcotalso features Illuminations: Reflections of Earth, a nighttime entertainment spectacular.
Disney’s Hollywood Studios — Disney’s Hollywood Studios consists of seven themed areas: Animation Courtyard, Commissary Lane, Echo Lake,Hollywood Boulevard, Muppets Courtyard, Pixar Place and Sunset Boulevard. The areas provide behind-the-scenes glimpses of Hollywood-style action throughvarious shows and attractions and offer themed food service and merchandise facilities. The park also features Fantasmic! , a nighttime entertainment spectacular,and Star Wars: A Galactic Spectacular . In 2016, the Company began construction on two new themed areas based on the Star Wars and Toy Story franchises.
Disney’s Animal Kingdom — Disney’s Animal Kingdom consists of a 145-foot tall Tree of Life centerpiece surrounded by six themed areas: Africa, Asia,Dinoland U.S.A., Discovery Island, Oasis and Rafiki’s Planet Watch. Each themed area contains attractions, entertainment, restaurants and merchandise shops. Thepark features more than 300 species of mammals, birds, reptiles and amphibians and 3,000 varieties of vegetation. The Company has a long-term agreement for theexclusive global theme park rights to build AVATAR-themed lands and plans to open Pandora - The World of AVATAR at Disney’s Animal Kingdom in summer2017.
Hotels and Other Resort Facilities — As of October 1, 2016 , the Company owned and operated 18 resort hotels at the Walt Disney World Resort, withapproximately 23,000 rooms and 3,000 vacation club units. Resort facilities include 468,000 square feet of conference meeting space and Disney’s Fort Wildernesscamping and recreational area, which offers approximately 800 campsites.
The Walt Disney World Resort also hosts Disney Springs, a 127-acre retail, dining and entertainment complex, consisting of four areas: Marketplace, TheLanding, Town Center and West Side. The areas are home to more than 150 venues including the 51,000-square-foot World of Disney retail store. Most of theDisney Springs facilities are operated by third parties that pay rent to the Company.
Nine independently-operated hotels with approximately 6,000 rooms are situated on property leased from the Company.
ESPN Wide World of Sports Complex is a 230-acre center that hosts professional caliber training and competitions, festival and tournament events andinteractive sports activities. The complex, which welcomes both amateur and professional athletes, accommodates multiple sporting events, including baseball,basketball, football, soccer, softball, tennis and track and
8

TABLE OF CONTENTS
field. It also includes a 9,500-seat stadium. The Company plans to build an 8,000-seat indoor sports venue that will host cheer, dance, basketball and volleyballcompetitions.
Other recreational amenities and activities available at the Walt Disney World Resort include three championship golf courses, miniature golf courses, full-service spas, tennis, sailing, water skiing, swimming, horseback riding and a number of other noncompetitive sports and leisure time activities. The resort alsoincludes two water parks: Disney’s Blizzard Beach and Disney’s Typhoon Lagoon.
Disneyland Resort
The Company owns 486 acres and has the rights under long-term lease for use of an additional 55 acres of land in Anaheim, California. The DisneylandResort includes two theme parks (Disneyland and Disney California Adventure), three resort hotels and Downtown Disney, a retail, dining and entertainmentcomplex.
The Disneyland Resort is marketed through a variety of international, national and local advertising and promotional activities. A number of the attractionsand restaurants in the theme parks are sponsored or operated by other corporations through multi-year agreements.
Disneyland — Disneyland consists of eight themed areas: Adventureland, Critter Country, Fantasyland, Frontierland, Main Street USA, Mickey’sToontown, New Orleans Square and Tomorrowland. These areas feature themed attractions, shows, restaurants, merchandise shops and refreshment stands.Additionally, Disneyland offers daily parades, a nighttime fireworks extravaganza and a nighttime entertainment spectacular, Fantasmic! . In 2016, the Companybegan construction on a new Star Wars-themed area at Disneyland.
Disney California Adventure — Disney California Adventure is adjacent to Disneyland and includes seven themed areas: Buena Vista Street, Cars Land,Grizzly Peak, Hollywood Land, Pacific Wharf, Paradise Pier and “a bug’s land”. These areas include attractions, shows, restaurants, merchandise shops andrefreshment stands. Additionally, Disney California Adventure offers a nighttime water spectacular, World of Color.
Hotels and Other Resort Facilities — Disneyland Resort includes three Company-owned and operated hotels with approximately 2,400 rooms, 50 vacationclub units and 180,000 square feet of conference meeting space. The Company plans to build a new 6,800-space parking garage scheduled to open in late 2018.
Downtown Disney, a themed 15-acre, retail, entertainment and dining outdoor complex with approximately 30 venues, is located adjacent to both Disneylandand Disney California Adventure. Most of the Downtown Disney facilities are operated by third parties that pay rent to the Company.
Aulani, a Disney Resort & Spa
Aulani, a Disney Resort & Spa, is a Company operated family resort on a 21-acre oceanfront property on Oahu, Hawaii featuring 351 hotel rooms, an18,000-square-foot spa and 12,000 square feet of conference meeting space. The resort also has 481 Disney Vacation Club units.
Disneyland Paris
The Company has an 81% effective ownership interest in Disneyland Paris, which is located on a 5,510-acre development in Marne-la-Vallée, approximately20 miles east of Paris, France. The land is being developed by Disneyland Paris pursuant to a master agreement with French governmental authorities. TheCompany manages and has a 77% equity interest in Euro Disney S.C.A., a publicly-traded French entity that is the holding company for Euro Disney AssociésS.C.A., the primary operating company of Disneyland Paris. The Company also has a direct 18% ownership interest in Euro Disney Associés S.C.A. DisneylandParis includes two theme parks (Disneyland Park and Walt Disney Studios Park); seven themed resort hotels; two convention centers; a shopping, dining andentertainment complex (Disney Village); and a 27-hole golf facility. Of the 5,510 acres comprising the site, approximately half have been developed to date,including, a planned community development, Val d’Europe. An indirect, wholly-owned subsidiary of the Company is responsible for managing Disneyland Parisand charges royalties and management fees based on the operating performance of the resort. The Company has waived payment of royalties and management feesfor the fourth quarter of fiscal 2016 through the third quarter of fiscal 2018.
Disneyland Park — Disneyland Park consists of five themed areas: Adventureland, Discoveryland, Fantasyland, Frontierland and Main Street USA. Theseareas include themed attractions, shows, restaurants, merchandise shops and refreshment stands. Disneyland Park also features a daily parade and a nighttimeentertainment spectacular, Disney Dreams! .
9

TABLE OF CONTENTS
Walt Disney Studios Park — Walt Disney Studios Park takes guests into the worlds of cinema, animation and television and includes four themed areas:Backlot, Front Lot, Production Courtyard and Toon Studio. These areas each include themed attractions, shows, restaurants, merchandise shops and refreshmentstands.
Hotels and Other Facilities — Disneyland Paris operates seven resort hotels, with approximately 5,800 rooms and 210,000 square feet of conferencemeeting space. In addition, several on-site hotels that are owned and operated by third parties provide approximately 2,700 rooms.
Disney Village is a 500,000-square-foot retail, dining and entertainment complex located between the theme parks and the hotels. A number of the DisneyVillage facilities are operated by third parties and pay rent to Disneyland Paris.
Val d’Europe is a planned community near Disneyland Paris that is being developed in phases. Val d’Europe currently includes a regional train station,hotels and a town center consisting of a shopping center as well as office, commercial and residential space. Third parties operate these developments on landleased or purchased from Disneyland Paris.
Disneyland Paris along with 50% joint venture partner, Pierre & Vacances-Center Parcs, is developing Villages Nature, a European eco-tourism destinationadjacent to the resort, which is targeted to open in 2017.
Disneyland Paris Recapitalization — During calendar 2015, Disneyland Paris completed a €1.0 billion recapitalization through a €0.4 billion equity rightsoffering and the conversion of €0.6 billion of loans from the Company into equity. The recapitalization process was finalized in November 2015, and theCompany’s effective ownership interest increased from 51% to 81% (See Note 6 to the Consolidated Financial Statements).
As of October 1, 2016 , Disneyland Paris had €1.1 billion of loans payable to the Company.
Hong Kong Disneyland Resort
The Company owns a 47% interest in Hong Kong Disneyland Resort through Hongkong International Theme Parks Limited, an entity in which theGovernment of the Hong Kong Special Administrative Region (HKSAR) owns a 53% majority interest. The resort is located on 310 acres on Lantau Island and isin close proximity to the Hong Kong International Airport. Hong Kong Disneyland Resort includes one theme park and two themed resort hotels. A separate HongKong subsidiary of the Company is responsible for managing Hong Kong Disneyland Resort. The Company is entitled to receive royalties and management feesbased on the operating performance of Hong Kong Disneyland Resort.
Hong Kong Disneyland — Hong Kong Disneyland consists of seven themed areas: Adventureland, Fantasyland, Grizzly Gulch, Main Street USA, MysticPoint, Tomorrowland and Toy Story Land. These areas feature themed attractions, shows, restaurants, merchandise shops and refreshment stands. Additionally,there are daily parades and a nighttime fireworks extravaganza, Disney in the Stars . A new themed area based on Marvel’s Iron Man franchise is expected to openin early calendar 2017.
Hotels — Hong Kong Disneyland Resort includes two themed hotels with a total of 1,000 rooms. A third hotel with 750 rooms is under construction andexpected to open in 2017.
Shanghai Disney Resort
The Company owns a 43% interest in Shanghai Disney Resort, which opened in June 2016. Shanghai Shendi (Group) Co., Ltd (Shendi), owns a 57%interest. The resort is located in the Pudong district of Shanghai on approximately 1,000 acres of land, which includes the Shanghai Disneyland theme park; twothemed resort hotels; a retail, dining and entertainment complex; and an outdoor recreation area. A management company, in which the Company has a 70%interest and Shendi has a 30% interest, is responsible for operating the resort and receives a management fee based on the operating performance of ShanghaiDisney Resort. The Company is also entitled to royalties based on the resort’s revenues.
The investment in the resort is funded in accordance with each shareholder’s equity ownership percentage, with approximately 67% from equitycontributions and 33% from shareholder loans. As of October 1, 2016 , the Company and Shendi have provided loans to Shanghai Disney Resort of $757 millionand 6.4 billion yuan ($964 million), respectively.
Shanghai Disneyland — Shanghai Disneyland consists of six themed areas: Adventure Isle, Fantasyland, Gardens of Imagination, Mickey Avenue,Tomorrowland and Treasure Cove. These areas feature themed attractions, shows, restaurants, merchandise shops and refreshment stands. Additionally, there aredaily parades and a nighttime fireworks spectacular, Ignite the Dream . Construction has begun on a seventh themed area based on the Toy Story franchise, and weexpect this new area to open in 2018.
10

TABLE OF CONTENTS
Hotels and Other Facilities - Shanghai Disneyland Resort includes two themed hotels with a total of 1,220 rooms. Disneytown is an 11-acre outdoorcomplex of dining, shopping and entertainment venues and is located adjacent to Shanghai Disneyland. Most Disneytown facilities are operated by third partiesthat pay rent to Shanghai Disney Resort.
Tokyo Disney Resort
Tokyo Disney Resort is located on 494 acres of land, six miles east of downtown Tokyo, Japan. The resort includes two theme parks (Tokyo Disneyland andTokyo DisneySea); four Disney-branded hotels; six independently operated hotels; Ikspiari, a retail, dining and entertainment complex; and Bon Voyage, a Disney-themed merchandise location.
The Company earns royalties on revenues generated by the Tokyo Disney Resort, which is owned and operated by Oriental Land Co., Ltd. (OLC), aJapanese corporation in which the Company has no equity interest.
Tokyo Disneyland — Tokyo Disneyland consists of seven themed areas: Adventureland, Critter Country, Fantasyland, Tomorrowland, Toontown,Westernland and World Bazaar.
Tokyo DisneySea — Tokyo DisneySea, adjacent to Tokyo Disneyland, is divided into seven “ports of call,” including American Waterfront, Arabian Coast,Lost River Delta, Mediterranean Harbor, Mermaid Lagoon, Mysterious Island and Port Discovery.
Hotels and Other Resort Facilities — Tokyo Disney Resort includes four Disney-branded hotels with a total of more than 2,400 rooms and a monorail,which links the theme parks and resort hotels with Ikspiari.
OLC has announced multi-year development plans for Tokyo Disney Resort, which include the expansion of Fantasyland at Tokyo Disneyland.
Disney Vacation Club
Disney Vacation Club (DVC) offers ownership interests in 13 resort facilities located at the Walt Disney World Resort; Disneyland Resort; Aulani; VeroBeach, Florida; and Hilton Head Island, South Carolina. Available units at each facility are offered for sale under a vacation ownership plan and are operated ashotel rooms when not occupied by vacation club members. The Company’s vacation club units consist of a mix of units ranging from deluxe studios to three-bedroom grand villas. Unit counts in this document are presented in terms of two-bedroom equivalents. DVC had approximately 3,800 vacation club units as ofOctober 1, 2016 . The Company is currently constructing its 14th vacation club property, Copper Creek Villas & Cabins at Disney’s Wilderness Lodge at the WaltDisney World Resort.
Disney Cruise Line
Disney Cruise Line is a four-ship vacation cruise line, which operates out of ports in North America and Europe. The Disney Magic and the Disney Wonderare approximately 85,000-ton 877-stateroom ships, and the Disney Dream and the Disney Fantasy are 130,000-ton 1,250-stateroom ships. The ships cater tofamilies, children, teenagers and adults, with distinctly-themed areas and activities for each group. Many cruise vacations include a visit to Disney’s Castaway Cay,a 1,000-acre private Bahamian island. The Company is expanding its cruise business by adding two new ships, one to be delivered in calendar 2021 and the otherin 2023. The new ships will be 135,000 tons with 1,250 staterooms.
Adventures by Disney
Adventures by Disney offers all-inclusive guided vacation tour packages predominantly at non-Disney sites around the world. The Company offered 33different tour packages during 2016.
Walt Disney Imagineering
Walt Disney Imagineering provides master planning, real estate development, attraction, entertainment and show design, engineering support, productionsupport, project management and other development services, including research and development for the Company’s Parks and Resorts operations.
Competition and Seasonality
The Company’s theme parks and resorts as well as Disney Cruise Line and Disney Vacation Club compete with other forms of entertainment, lodging,tourism and recreational activities. The profitability of the leisure-time industry may be
11

TABLE OF CONTENTS
influenced by various factors that are not directly controllable, such as economic conditions including business cycle and exchange rate fluctuations, travel industrytrends, amount of available leisure time, oil and transportation prices, weather patterns and natural disasters.
All of the theme parks and the associated resort facilities are operated on a year-round basis. Typically, theme park attendance and resort occupancy fluctuatebased on the seasonal nature of vacation travel and leisure activities. Peak attendance and resort occupancy generally occur during the summer months when schoolvacations occur and during early-winter and spring-holiday periods.
STUDIO ENTERTAINMENT
The Studio Entertainment segment produces and acquires live-action and animated motion pictures, direct-to-video content, musical recordings and livestage plays.
The businesses in the Studio Entertainment segment generate revenue from distribution of films in the theatrical, home entertainment and television markets,stage play ticket sales, distribution of recorded music and licensing of Company intellectual property for use in live entertainment productions. Significantoperating expenses include film cost amortization, which consists of production cost and participations and residuals expense amortization, distribution expensesand costs of sales.
The Company distributes films primarily under the Walt Disney Pictures, Pixar, Marvel, Lucasfilm and Touchstone banners.
In August 2009, the Company entered into an agreement with DreamWorks Studios (DreamWorks) to distribute live-action motion pictures produced byDreamWorks for seven years under the Touchstone Pictures banner for which the Company received a distribution fee. In fiscal 2016, the Company entered into anagreement to end the 2009 distribution agreement and acquired all rights, titles, and interests in thirteen previously released DreamWorks films. In exchange, theCompany forgave loans and terminated financing previously available to DreamWorks. The Company distributed three DreamWorks films in fiscal 2016.
Prior to the Company’s acquisition of Marvel, Marvel had licensed the rights to third-party studios to produce and distribute feature films based on certainMarvel properties including Spider-Man, The Fantastic Four and X-Men. Under the licensing arrangements, the third-party studios incur the costs to produce anddistribute the films and the Company retains the merchandise licensing rights. Under the licensing arrangement for Spider-Man, the Company pays the third-partystudio a licensing fee based on each film’s box office receipts, subject to specified limits. Under the licensing arrangements for The Fantastic Four and X-Men, thethird-party studio pays the Company a licensing fee, and the third-party studio receives a share of the Company’s merchandise revenue on these properties. TheCompany distributes all Marvel-produced films with the exception of The Incredible Hulk , which is distributed by a third-party studio.
Prior to the Company’s acquisition of Lucasfilm, Lucasfilm produced six Star Wars films (Episodes 1 through 6). Lucasfilm retained the rights to consumerproducts related to all of those films and the rights related to television and electronic distribution formats for all of those films, with the exception of the rights forEpisode 4, which are owned by a third-party studio. All of those films are distributed by a third-party studio in the theatrical and home entertainment markets. Thetheatrical and home entertainment distribution rights for these films revert back to Lucasfilm in May 2020 with the exception of Episode 4, for which thesedistribution rights are retained in perpetuity by the third-party studio.
Lucasfilm also includes Industrial Light & Magic and Skywalker Sound, which provide visual and audio effects and other post-production services to theCompany and third-party producers.
Theatrical Market
We produce and distribute both live-action films and full-length animated films. In the domestic theatrical market, we generally distribute and market ourfilmed products directly. In most major international markets, we distribute our filmed products directly while in other markets our films are distributed byindependent distribution companies or joint ventures. During fiscal 2017, we expect to release eight of our own produced feature films. Cumulatively throughOctober 1, 2016 the Company has released domestically approximately 1,000 full-length live-action features and 100 full-length animated features.
The Company incurs significant marketing and advertising costs before and throughout the theatrical release of a film in an effort to generate publicawareness of the film, to increase the public’s intent to view the film and to help generate consumer interest in the subsequent home entertainment and otherancillary markets. These costs are expensed as incurred. Therefore, we may incur a loss on a film in the theatrical markets, including in periods prior to thetheatrical release of the film.
12

TABLE OF CONTENTS
Home Entertainment Market
In the domestic market, we distribute home entertainment releases directly under each of our motion picture banners. In international markets, we distributehome entertainment releases under our motion picture banners both directly and through independent distribution companies. We also produce original contentdomestically and acquire content internationally for direct-to-video release.
Domestic and international home entertainment distribution typically starts three to six months after the theatrical release in each market. Homeentertainment releases are distributed in physical (DVD and Blu-ray) and electronic formats. Electronic formats may be released up to four weeks ahead of thephysical release. Physical formats are generally sold to retailers, such as Wal-Mart and Target and electronic formats are sold through e-tailers, such as Apple andAmazon. Titles are also sold to physical rental services, such as Netflix. However, distribution by physical rental services may be delayed up to 28 days after thestart of home entertainment distribution.
As of October 1, 2016 , we had approximately 1,400 active produced and acquired titles, including 1,000 live-action titles and 400 animated titles, in thedomestic home entertainment marketplace and approximately 2,200 active produced and acquired titles, including 1,600 live-action titles and 600 animated titles,in the international marketplace.
Television Market
In the television market, we license our films to cable and broadcast networks, television stations and other service providers, which may provide the contentto viewers on televisions or a variety of internet-connected devices.
Video-on-Demand (VOD) — Concurrently with physical home entertainment distribution, we license titles to VOD service providers for electronic deliveryto consumers for a specified rental period.
Pay Television (Pay 1) — In the U.S., there are two or three pay television windows. The first window is generally eighteen months in duration and followsthe VOD window. The Company has licensed exclusive domestic pay television rights to Netflix, which operates a subscription video on demand (SVOD) service,for all films released theatrically during calendar years 2016 through 2018, with the exception of DreamWorks films. Most films released theatrically prior tocalendar year 2016 have been licensed to the Starz pay television service. DreamWorks titles that are distributed by the Company are licensed to Showtime under aseparate agreement.
Free Television (Free 1) — The Pay 1 window is followed by a television window that may last up to 84 months. Motion pictures are usually sold in theFree 1 window to basic cable networks.
Pay Television 2 (Pay 2) and Free Television 2 (Free 2) — In the U.S., Free 1 is generally followed by a twelve-month to nineteen-month Pay 2 windowunder our license arrangements with Netflix, Starz and Showtime. The Pay 2 window is followed by a Free 2 window, whereby films are licensed to basic cablenetworks, SVOD services and to television station groups.
Pay Television 3 (Pay 3) and Free Television 3 (Free 3) — In the U.S., Free 2 is sometimes followed by a seven-month Pay 3 window, and then by a Free3 window. In the Free 3 window, films are licensed to basic cable networks, SVOD services and to television station groups.
International Television — The Company also licenses its films outside of the U.S. The typical windowing sequence is consistent with the domestic cyclesuch that titles premiere on VOD services and then on pay TV or SVOD services before airing in free TV. Windowing strategies are developed in response to localmarket practices and conditions, and the exact sequence and length of each window can vary country by country.
Disney Music Group
The Disney Music Group (DMG) commissions new music for the Company’s motion pictures and television programs and develops, produces, markets anddistributes recorded music worldwide either directly or through license agreements. DMG also licenses the songs and recording copyrights to others for printedmusic, records, audio-visual devices, public performances and digital distribution and produces live musical concerts. DMG includes Walt Disney Records,Hollywood Records, Disney Music Publishing and Buena Vista Concerts.
13

TABLE OF CONTENTS
Disney Theatrical Group
Disney Theatrical Group develops, produces and licenses live entertainment events on Broadway and around the world, including The Lion King , Aladdin,Newsies, Mary Poppins (a co-production with Cameron Mackintosh Ltd), Beauty and the Beast, Elton John & Tim Rice’s Aida , TARZAN ® and The LittleMermaid .
Disney Theatrical Group also licenses the Company’s intellectual property to Feld Entertainment, the producer of Disney On Ice and Marvel Universe Live! .
Competition and Seasonality
The Studio Entertainment businesses compete with all forms of entertainment. A significant number of companies produce and/or distribute theatrical andtelevision films, exploit products in the home entertainment market, provide pay television and SVOD programming services, produce music and sponsor livetheater. We also compete to obtain creative and performing talents, story properties, advertiser support and broadcast rights that are essential to the success of ourStudio Entertainment businesses.
The success of Studio Entertainment operations is heavily dependent upon public taste and preferences. In addition, Studio Entertainment operating resultsfluctuate due to the timing and performance of releases in the theatrical, home entertainment and television markets. Release dates are determined by severalfactors, including competition and the timing of vacation and holiday periods.
CONSUMER PRODUCTS & INTERACTIVE MEDIA
The Consumer Products & Interactive Media segment licenses the Company’s trade names, characters and visual and literary properties to variousmanufacturers, game developers, publishers and retailers throughout the world. We also develop and publish games, primarily for mobile platforms, and books,magazines and comic books. The segment also distributes branded merchandise directly through retail, online and wholesale businesses. These activities areperformed through our Merchandise Licensing, Retail, Games and Publishing businesses. In addition, the segment’s operations include website management anddesign, primarily for other Company businesses, and the development and distribution of online video content.
The Consumer Products & Interactive Media segment generates revenue primarily from:• licensing characters and content from our film, television and other properties to third parties for use on consumer merchandise, published materials and
in multi-platform games;• selling merchandise through our retail stores, internet shopping sites and wholesale business;• sales of games through app distributors and online and through consumers’ in-game purchases;• wholesale sales of self-published children’s books and magazines and comic books;• charging tuition at English language learning centers in China; and• advertising through the distribution of online video content.
Significant costs include costs of goods sold and distribution expenses, operating labor and retail occupancy costs, product development and marketing.
Merchandise Licensing
The Company’s merchandise licensing operations cover a diverse range of product categories, the most significant of which are: toys, apparel, home décorand furnishings, accessories, stationery, food, health and beauty, footwear and consumer electronics. The Company licenses characters from its film, television andother properties for use on third-party products in these categories and earns royalties, which are usually based on a fixed percentage of the wholesale or retailselling price of the products. Some of the major properties licensed by the Company include: Star Wars, Mickey and Minnie, Frozen, Avengers , Disney Princess,Disney Channel characters , Spider-Man, Cars, Finding Dory/Finding Nemo, Winnie the Pooh and Disney Classics.
Retail
The Company markets Disney-, Marvel- and Lucasfilm-themed products through retail stores operated under the Disney Store name and through internetsites in North America (DisneyStore.com and MarvelStore.com), Western Europe, Japan and
14

TABLE OF CONTENTS
China. The stores are generally located in leading shopping malls and other retail complexes. The Company currently owns and operates 223 stores in NorthAmerica, 78 stores in Europe, 48 stores in Japan and one store in China. The Company also offers retailers merchandise under wholesale arrangements.
Games
The Company licenses properties to third-party game developers. We also develop and publish games, primarily for play on internet-connected devices, andwhich are available to consumers to download from third-party distributors or play online.
Publishing
The Company creates, distributes, licenses and publishes children’s books, comic books and graphic novel collections of comic books, magazine andlearning products in print and digital formats, and storytelling apps in multiple countries and languages based on the Company’s branded franchises. DisneyEnglish develops and delivers an English language learning curriculum for Chinese children using Disney content in 27 learning centers in eight cities acrossChina.
Other Content
The Company’s operations include Maker Studios, a leading network and developer of online video content distributed primarily on YouTube and otherdigital platforms. Revenues and costs generated by Maker Studios have been allocated primarily to the Media Networks and Studio Entertainment segments. TheCompany also licenses Disney properties and content to mobile phone carriers in Japan. In addition, the Company develops, publishes and distributes interactivefamily content through Disney.com, Disney on YouTube, Babble.com and various Disney-branded apps.
Competition and Seasonality
The Consumer Products & Interactive Media businesses compete with other licensors, retailers and publishers of character, brand and celebrity names, aswell as other licensors, publishers and developers of game software, online video content, internet websites, other types of home entertainment and retailers of toysand kids merchandise. Operating results are influenced by seasonal consumer purchasing behavior, consumer preferences, levels of marketing and promotion andby the timing and performance of theatrical and game releases and cable programming broadcasts.
INTELLECTUAL PROPERTY PROTECTION
The Company’s businesses throughout the world are affected by its ability to exploit and protect against infringement of its intellectual property, includingtrademarks, trade names, copyrights, patents and trade secrets. Important intellectual property includes rights in the content of motion pictures, televisionprograms, electronic games, sound recordings, character likenesses, theme park attractions, books and magazines. Risks related to the protection and exploitationof intellectual property rights are set forth in Item 1A – Risk Factors.
AVAILABLE INFORMATION
Our annual report on Form 10-K, quarterly reports on Form 10-Q, current reports on Form 8-K and amendments to those reports are available without chargeon our website, www.disney.com/investors, as soon as reasonably practicable after they are filed electronically with the Securities and Exchange Commission(SEC). We are providing the address to our internet site solely for the information of investors. We do not intend the address to be an active link or to otherwiseincorporate the contents of the website into this report.
ITEM 1A. Risk Factors
For an enterprise as large and complex as the Company, a wide range of factors could materially affect future developments and performance. In addition tothe factors affecting specific business operations identified in connection with the description of these operations and the financial results of these operationselsewhere in this report, the most significant factors affecting our operations include the following:
15

TABLE OF CONTENTS
Changes in U.S., global, or regional economic conditions could have an adverse effect on the profitability of some or all of our businesses.
A decline in economic activity in the U.S. and other regions of the world in which we do business can adversely affect demand for any of our businesses,thus reducing our revenue and earnings. Past declines in economic conditions reduced spending at our parks and resorts, purchase of and prices for advertising onour broadcast and cable networks and owned stations, performance of our home entertainment releases, and purchases of Company-branded consumer products,and similar impacts can be expected should such conditions recur. A decline in economic conditions could also reduce attendance at our parks and resorts, pricesthat MVPDs pay for our cable programming or subscription levels for our cable programming. Recent instability in non-U.S. economies has had some of these andsimilar impacts on some of our domestic and overseas operations. Economic conditions can also impair the ability of those with whom we do business to satisfytheir obligations to us. In addition, an increase in price levels generally, or in price levels in a particular sector such as the energy sector, could result in a shift inconsumer demand away from the entertainment and consumer products we offer, which could also adversely affect our revenues and, at the same time, increaseour costs. Changes in exchange rates for foreign currencies may reduce international demand for our products or increase our labor or supply costs in non-U.S.markets, and recent changes have reduced the U.S. dollar value of revenue we receive and expect to receive from other markets. Economic or political conditionsin a country could also reduce our ability to hedge exposure to currency fluctuations in the country or our ability to repatriate revenue from the country.
Changes in public and consumer tastes and preferences for entertainment and consumer products could reduce demand for our entertainment offeringsand products and adversely affect the profitability of any of our businesses.
Our businesses create entertainment, travel and consumer products whose success depends substantially on consumer tastes and preferences that change inoften unpredictable ways. The success of our businesses depends on our ability to consistently create and distribute filmed entertainment, broadcast and cableprogramming, online material, electronic games, theme park attractions, hotels and other resort facilities and travel experiences and consumer products that meetthe changing preferences of the broad consumer market and respond to competition from an expanding array of choices facilitated by technological developmentsin the delivery of content. Many of our businesses increasingly depend on acceptance of our offerings and products by consumers outside the U.S., and theirsuccess therefore depends on our ability to successfully predict and adapt to changing consumer tastes and preferences outside as well as inside the U.S. Moreover,we must often invest substantial amounts in film production, broadcast and cable programming, electronic games, theme park attractions, cruise ships or hotels andother resort facilities before we learn the extent to which these products will earn consumer acceptance. If our entertainment offerings and products do not achievesufficient consumer acceptance, our revenue from advertising sales (which are based in part on ratings for the programs in which advertisements air) orsubscription fees for broadcast and cable programming and online services, from theatrical film receipts or home entertainment or electronic game sales, fromtheme park admissions, hotel room charges and merchandise, food and beverage sales, from sales of licensed consumer products or from sales of our otherconsumer products and services may decline or fail to grow to the extent we anticipate when making investment decisions and thereby adversely affect theprofitability of one or more of our businesses.
Changes in technology and in consumer consumption patterns may affect demand for our entertainment products, the revenue we can generate fromthese products or the cost of producing or distributing products.
The media entertainment and internet businesses in which we participate increasingly depend on our ability to successfully adapt to shifting patterns ofcontent consumption through the adoption and exploitation of new technologies. New technologies affect the demand for our products, the manner in which ourproducts are distributed to consumers, the sources and nature of competing content offerings, the time and manner in which consumers acquire and view some ofour entertainment products and the options available to advertisers for reaching their desired audiences. This trend has impacted the business model for certaintraditional forms of distribution, as evidenced by the industry-wide decline in ratings for broadcast television, the reduction in demand for home entertainmentsales of theatrical content, the development of alternative distribution channels for broadcast and cable programming and declines in subscriber levels across theindustry, including for a number of our networks. In order to respond to these developments, we regularly consider and from time to time implement changes toour business models and there can be no assurance that we will successfully respond to these changes, that we will not experience disruption as we respond to thechanges, or that the business models we develop will be as profitable as our current business models. As a result, the income from our entertainment offerings maydecline or increase at slower rates than our historical experience or our expectations when we make investments in products.
16

TABLE OF CONTENTS
The success of our businesses is highly dependent on the existence and maintenance of intellectual property rights in the entertainment products andservices we create.
The value to us of our intellectual property rights is dependent on the scope and duration of our rights as defined by applicable laws in the U.S. and abroadand the manner in which those laws are construed. If those laws are drafted or interpreted in ways that limit the extent or duration of our rights, or if existing lawsare changed, our ability to generate revenue from our intellectual property may decrease, or the cost of obtaining and maintaining rights may increase.
The unauthorized use of our intellectual property may increase the cost of protecting rights in our intellectual property or reduce our revenues. Newtechnologies such as the convergence of computing, communication, and entertainment devices, the falling prices of devices incorporating such technologies,increased broadband internet speed and penetration and increased availability and speed of mobile data transmission have made the unauthorized digital copyingand distribution of our films, television productions and other creative works easier and faster and enforcement of intellectual property rights more challenging.The unauthorized use of intellectual property in the entertainment industry generally continues to be a significant challenge for intellectual property rights holders.Inadequate laws or weak enforcement mechanisms to protect intellectual property in one country can adversely affect the results of the Company’s operationsworldwide, despite the Company’s efforts to protect its intellectual property rights. These developments require us to devote substantial resources to protecting ourintellectual property against unlicensed use and present the risk of increased losses of revenue as a result of unlicensed distribution of our content.
With respect to intellectual property developed by the Company and rights acquired by the Company from others, the Company is subject to the risk ofchallenges to our copyright, trademark and patent rights by third parties. Successful challenges to our rights in intellectual property may result in increased costsfor obtaining rights or the loss of the opportunity to earn revenue from the intellectual property that is the subject of challenged rights.
Protection of electronically stored data is costly and if our data is compromised in spite of this protection, we may incur additional costs, lostopportunities and damage to our reputation.
We maintain information necessary to conduct our business, including confidential and proprietary information as well as personal information regarding ourcustomers and employees, in digital form. Data maintained in digital form is subject to the risk of intrusion, tampering and theft. We develop and maintain systemsin an effort to prevent intrusion, tampering and theft, but the development and maintenance of these systems is costly and requires ongoing monitoring andupdating as technologies change and efforts to overcome security measures become more sophisticated. Accordingly, despite our efforts, the possibility ofintrusion, tampering and theft cannot be eliminated entirely, and risks associated with each of these remain. In addition, we provide confidential, proprietary andpersonal information to third parties when it is necessary to pursue business objectives. While we obtain assurances that these third parties will protect thisinformation and, where we believe appropriate, monitor the protections employed by these third parties, there is a risk the confidentiality of data held by thirdparties may be compromised. If our data systems are compromised, our ability to conduct our business may be impaired, we may lose profitable opportunities orthe value of those opportunities may be diminished and, as described above, we may lose revenue as a result of unlicensed use of our intellectual property. Ifpersonal information of our customers or employees is misappropriated, our reputation with our customers and employees may be injured resulting in loss ofbusiness or morale, and we may incur costs to remediate possible injury to our customers and employees or to pay fines or take other action with respect to judicialor regulatory actions arising out of the incident.
A variety of uncontrollable events may reduce demand for our products and services, impair our ability to provide our products and services or increasethe cost of providing our products and services.
Demand for our products and services, particularly our theme parks and resorts, is highly dependent on the general environment for travel and tourism. Theenvironment for travel and tourism, as well as demand for other entertainment products, can be significantly adversely affected in the U.S., globally or in specificregions as a result of a variety of factors beyond our control, including: adverse weather conditions arising from short-term weather patterns or long-term change,catastrophic events or natural disasters (such as excessive heat or rain, hurricanes, typhoons, floods, tsunamis and earthquakes); health concerns; international,political or military developments; and terrorist attacks. These events and others, such as fluctuations in travel and energy costs and computer virus attacks,intrusions or other widespread computing or telecommunications failures, may also damage our ability to provide our products and services or to obtain insurancecoverage with respect to these events. In addition, we derive royalties from the sales of our licensed goods and services by third parties and the management ofbusinesses operated under brands licensed from the Company, and we are therefore dependent on the successes of those third parties for that portion of ourrevenue. A wide variety of factors could influence the success of those third parties and if negative factors significantly impacted a sufficient number of ourlicensees, the profitability of one or more of our businesses could be adversely affected. We obtain insurance against the risk of losses relating to some of theseevents,
17

TABLE OF CONTENTS
generally including physical damage to our property and resulting business interruption, certain injuries occurring on our property and some liabilities for allegedbreach of legal responsibilities. When insurance is obtained it is subject to deductibles, exclusions, terms, conditions and limits of liability. The types and levels ofcoverage we obtain vary from time to time depending on our view of the likelihood of specific types and levels of loss in relation to the cost of obtaining coveragefor such types and levels of loss.
Changes in our business strategy or restructuring of our businesses may increase our costs or otherwise affect the profitability of our businesses.
As changes in our business environment occur we may adjust our business strategies to meet these changes or we may otherwise decide to restructure ouroperations or particular businesses or assets. In addition, external events including changing technology, changing consumer patterns, acceptance of our theatricalofferings and changes in macroeconomic conditions may impair the value of our assets. When these changes or events occur, we may incur costs to change ourbusiness strategy and may need to write down the value of assets. We also make investments in existing or new businesses, including investments in internationalexpansion of our business and in new business lines. In recent years, such investments have included expansion and renovation of certain of our theme parkattractions and investment in Shanghai Disney Resort. Some of these investments may have short-term returns that are negative or low and the ultimate businessprospects of the businesses may be uncertain. In any of these events, our costs may increase, we may have significant charges associated with the write-down ofassets or returns on new investments may be lower than prior to the change in strategy or restructuring.
Turmoil in the financial markets could increase our cost of borrowing and impede access to or increase the cost of financing our operations andinvestments.
Past disruptions in the U.S. and global credit and equity markets made it difficult for many businesses to obtain financing on acceptable terms. Theseconditions tended to increase the cost of borrowing and if they recur, our cost of borrowing could increase and it may be more difficult to obtain financing for ouroperations or investments. In addition, our borrowing costs can be affected by short- and long-term debt ratings assigned by independent rating agencies that arebased, in part, on the Company’s performance as measured by credit metrics such as interest coverage and leverage ratios. A decrease in these ratings would likelyincrease our cost of borrowing and/or make it more difficult for us to obtain financing. Past disruptions in the global financial markets also impacted some of thefinancial institutions with which we do business. A similar decline in the financial stability of financial institutions could affect our ability to secure credit-worthycounterparties for our interest rate and foreign currency hedging programs, could affect our ability to settle existing contracts and could also affect the ability of ourbusiness customers to obtain financing and thereby to satisfy their obligations to us.
Increased competitive pressures may reduce our revenues or increase our costs.
We face substantial competition in each of our businesses from alternative providers of the products and services we offer and from other forms ofentertainment, lodging, tourism and recreational activities. We also must compete to obtain human resources, programming and other resources we require inoperating our business. For example:
• Our broadcast and cable networks, stations and online offerings compete for viewers with other broadcast, cable and satellite services as well as withhome entertainment products, new sources of broadband and mobile delivered content and internet usage.
• Our broadcast and cable networks and stations compete for the sale of advertising time with other broadcast, cable and satellite services, and internet andmobile delivered content, as well as with newspapers, magazines, billboards and radio stations.
• Our cable networks compete for carriage of their programming with other programming providers.• Our studio operations, broadcast and cable networks compete to obtain creative and performing talent, sports and other programming, story properties,
advertiser support and market share with other studio operations, broadcast and cable networks and new sources of broadband delivered content.• Our theme parks and resorts compete for guests with all other forms of entertainment, lodging, tourism and recreation activities.• Our studio operations compete for customers with all other forms of entertainment.• Our Consumer Products & Interactive Media segment competes with other licensors, publishers and retailers of character, brand and celebrity names.• Our interactive media operations compete with other licensors and publishers of console, online and mobile games and other types of home entertainment.
18

TABLE OF CONTENTS
Competition in each of these areas may increase as a result of technological developments and changes in market structure, including consolidation ofsuppliers of resources and distribution channels. Increased competition may divert consumers from our creative or other products, or to other products or otherforms of entertainment, which could reduce our revenue or increase our marketing costs. Such competition may also reduce, or limit growth in, prices for ourproducts and services, including advertising rates and subscription fees at our media networks, parks and resorts admissions and room rates, and prices forconsumer products from which we derive license revenues. Competition for the acquisition of resources can increase the cost of producing our products andservices.
Sustained increases in costs of pension and postretirement medical and other employee health and welfare benefits may reduce our profitability.
With approximately 195,000 employees, our profitability is substantially affected by costs of pension benefits and current and postretirement medicalbenefits. We may experience significant increases in these costs as a result of macro-economic factors, which are beyond our control, including increases in thecost of health care. In addition, changes in investment returns and discount rates used to calculate pension expense and related assets and liabilities can be volatileand may have an unfavorable impact on our costs in some years. These macroeconomic factors as well as a decline in the fair value of pension and postretirementmedical plan assets may put upward pressure on the cost of providing pension and postretirement medical benefits and may increase future funding requirements.Although we have actively sought to control increases in these costs, there can be no assurance that we will succeed in limiting cost increases, and continuedupward pressure could reduce the profitability of our businesses.
Our results may be adversely affected if long-term programming or carriage contracts are not renewed on sufficiently favorable terms.
We enter into long-term contracts for both the acquisition and the distribution of media programming and products, including contracts for the acquisition ofprogramming rights for sporting events and other programs, and contracts for the distribution of our programming to content distributors. As these contracts expire,we must renew or renegotiate the contracts, and if we are unable to renew them on acceptable terms, we may lose programming rights or distribution rights. Even ifthese contracts are renewed, the cost of obtaining programming rights may increase (or increase at faster rates than our historical experience) or programmingdistributors, facing pressures resulting from increased subscription fees and alternative distribution challenges, may demand terms (including pricing and thebreadth of distribution) that reduce our revenue from distribution of programs (or increase revenue at slower rates than our historical experience). Moreover, ourability to renew these contracts on favorable terms may be affected by recent consolidation in the market for program distribution. With respect to the acquisitionof programming rights, particularly sports programming rights, the impact of these long-term contracts on our results over the term of the contracts depends on anumber of factors, including the strength of advertising markets, subscription levels and rates for programming, effectiveness of marketing efforts and the size ofviewer audiences. There can be no assurance that revenues from programming based on these rights will exceed the cost of the rights plus the other costs ofproducing and distributing the programming.
Changes in regulations applicable to our businesses may impair the profitability of our businesses.
Our broadcast networks and television stations are highly regulated, and each of our other businesses is subject to a variety of U.S. and overseas regulations.These regulations include:
• U.S. FCC regulation of our television and radio networks, our national programming networks, and our owned television stations. See Item 1 — Business— Media Networks, Federal Regulation.
• Federal, state and foreign privacy and data protection laws and regulations.• Regulation of the safety of consumer products and theme park operations.• Environmental protection regulations.• Imposition by foreign countries of trade restrictions, restrictions on the manner in which content is currently licensed and distributed, ownership
restrictions, currency exchange controls or motion picture or television content requirements or quotas.• Domestic and international wage laws, tax laws or currency controls.
Changes in any of these regulations or regulatory activities in any of these areas may require us to spend additional amounts to comply with the regulations,or may restrict our ability to offer products and services in ways that are profitable.
19

TABLE OF CONTENTS
Our operations outside the United States may be adversely affected by the operation of laws in those jurisdictions.
Our operations in non-U.S. jurisdictions are in many cases subject to the laws of the jurisdictions in which they operate rather than U.S. law. Laws in somejurisdictions differ in significant respects from those in the U.S. These differences can affect our ability to react to changes in our business, and our rights or abilityto enforce rights may be different than would be expected under U.S. law. Moreover, enforcement of laws in some overseas jurisdictions can be inconsistent andunpredictable, which can affect both our ability to enforce our rights and to undertake activities that we believe are beneficial to our business. In addition, thebusiness and political climate in some jurisdictions may encourage corruption, which could reduce our ability to compete successfully in those jurisdictions whileremaining in compliance with local laws or United States anti-corruption laws applicable to our businesses. As a result, our ability to generate revenue and ourexpenses in non-U.S. jurisdictions may differ from what would be expected if U.S. law governed these operations.
Labor disputes may disrupt our operations and adversely affect the profitability of any of our businesses.
A significant number of employees in various of our businesses are covered by collective bargaining agreements, including employees of our theme parksand resorts as well as writers, directors, actors, production personnel and others employed in our media networks and studio operations. In addition, the employeesof licensees who manufacture and retailers who sell our consumer products, and employees of providers of programming content (such as sports leagues) may becovered by labor agreements with their employers. In general, a labor dispute involving our employees or the employees of our licensees or retailers who sell ourconsumer products or providers of programming content may disrupt our operations and reduce our revenues, and resolution of disputes may increase our costs.
The seasonality of certain of our businesses could exacerbate negative impacts on our operations.
Each of our businesses is normally subject to seasonal variations, as follows: • Revenues in our Media Networks segment are subject to seasonal advertising patterns and changes in viewership levels. In general, advertising revenues
are somewhat higher during the fall and somewhat lower during the summer months. Affiliate fees are typically collected ratably throughout the year.• Revenues in our Parks and Resorts segment fluctuate with changes in theme park attendance and resort occupancy resulting from the seasonal nature of
vacation travel and leisure activities. Peak attendance and resort occupancy generally occur during the summer months when school vacations occur andduring early-winter and spring-holiday periods.
• Revenues in our Studio Entertainment segment fluctuate due to the timing and performance of releases in the theatrical, home entertainment andtelevision markets. Release dates are determined by several factors, including competition and the timing of vacation and holiday periods.
• Revenues in our Consumer Products & Interactive Media segments are influenced by seasonal consumer purchasing behavior, which generally results inhigher revenues during the Company’s first fiscal quarter, and by the timing and performance of theatrical and game releases and cable programmingbroadcasts.
Accordingly, if a short-term negative impact on our business occurs during a time of high seasonal demand (such as hurricane damage to our parks duringthe summer travel season), the effect could have a disproportionate effect on the results of that business for the year.
ITEM 1B. Unresolved Staff Comments
The Company has received no written comments regarding its periodic or current reports from the staff of the SEC that were issued 180 days or morepreceding the end of its 2016 fiscal year and that remain unresolved.
20

TABLE OF CONTENTS
ITEM 2. Properties
The Walt Disney World Resort, Disneyland Resort and other properties of the Company and its subsidiaries are described in Item 1 under the caption Parksand Resorts . Film library properties are described in Item 1 under the caption Studio Entertainment . Television stations owned by the Company are described inItem 1 under the caption Media Networks . Retail store locations leased by the Company are described in Item 1 under the caption Consumer Products &Interactive Media .
The Company and its subsidiaries own and lease properties throughout the world. In addition to the properties noted above, the table below provides a briefdescription of other significant properties and the related business segment.
Location Property /
Approximate Size Use Business Segment (1)
Burbank, CA & surroundingcities (2)
Land (201 acres) & Buildings(4,725,000 ft 2 )
Owned Office/Production/Warehouse(includes 255,000 ft 2 sublet to third-partytenants)
Corp/Studio/Media/CPIM/P&R
Burbank, CA & surrounding
cities (2) Buildings (1,556,000 ft 2 )
Leased Office/Warehouse
Corp/Studio/Media/CPIM/P&R
Los Angeles, CA
Land (22 acres) & Buildings(600,000 ft 2 )
Owned Office/Production/Technical
Media/Studio
Los Angeles, CA Buildings (519,000 ft 2 ) Leased Office/Production/Technical/Theater Media/Studio New York, NY
Land (5 acres) & Buildings(1,418,000 ft 2 )
Owned Office/Production/Technical
Media/Corp
New York, NY
Buildings (250,000 ft 2 )
LeasedOffice/Production/Theater/Warehouse(includes 14,000 ft 2 sublet to third-partytenants)
Corp/Studio/Media/CPIM
Bristol, CT
Land (117 acres) & Buildings(1,174,000 ft 2 )
Owned Office/Production/Technical
Media
Bristol, CT Buildings (512,000 ft 2 ) Leased Office/Warehouse/Technical Media Emeryville, CA
Land (20 acres) & Buildings(430,000 ft 2 )
Owned Office/Production/Technical
Studio
Emeryville, CA Buildings (88,000 ft 2 ) Leased Office/Storage Studio San Francisco, CA
Buildings (741,000 ft 2 )
Leased Office/Production/Technical/Theater(includes 64,000 ft 2 sublet to third-partytenants)
Corp/Studio/Media/CPIM/P&R
USA & Canada
Land and Buildings (Multiplesites and sizes)
Owned and Leased Office/Production/Transmitter/Theaters/Warehouse
Corp/Studio/Media/CPIM/P&R
Hammersmith, England
Building (279,500 ft 2 )
Leased Office
Corp/Studio/Media/CPIM/P&R
Europe, Asia, Australia & Latin
America Buildings (Multiple sites andsizes)
Leased Office/Warehouse/Retail
Corp/Studio/Media/CPIM/P&R
(1) Corp – Corporate, CPIM – Consumer Products & Interactive Media, P&R – Parks and Resorts(2) Surrounding cities include Glendale, CA, North Hollywood, CA and Sun Valley, CA
21

TABLE OF CONTENTS
ITEM 3. Legal Proceedings
As disclosed in Note 14 to the Consolidated Financial Statements, the Company is engaged in certain legal matters, and the disclosure set forth in Note 14relating to certain legal matters is incorporated herein by reference.
The Company, together with, in some instances, certain of its directors and officers, is a defendant or codefendant in various other legal actions involvingcopyright, breach of contract and various other claims incident to the conduct of its businesses. Management does not expect the Company to suffer any materialliability by reason of these actions.
ITEM 4. Mine Safety Disclosures
Not applicable.
Executive Officers of the Company
The executive officers of the Company are elected each year at the organizational meeting of the Board of Directors, which follows the annual meeting of theshareholders, and at other Board of Directors meetings, as appropriate. Each of the executive officers has been employed by the Company in the position orpositions indicated in the list and pertinent notes below. Each of the executive officers has been employed by the Company for more than five years.
At October 1, 2016 , the executive officers of the Company were as follows:
Name Age Title Executive
Officer SinceRobert A. Iger 65 Chairman and Chief Executive Officer (1) 2000Alan N. Braverman 68 Senior Executive Vice President, General Counsel and Secretary 2003Kevin A. Mayer 54 Senior Executive Vice President and Chief Strategy Officer (2) 2005Christine M. McCarthy 61 Senior Executive Vice President and Chief Financial Officer (3) 2005M. Jayne Parker 55 Executive Vice President and Chief Human Resources Officer 2009
(1) Mr. Iger was appointed Chairman of the Board and Chief Executive Officer effective March 13, 2012. He was President and Chief Executive Officerfrom October 2, 2005 through that date.
(2) Mr. Mayer was appointed Senior Executive Vice President and Chief Strategy Officer effective June 30, 2015. He was previously Executive VicePresident, Corporate Strategy and Business Development of the Company from 2005 to 2015.
(3) Ms. McCarthy was appointed Senior Executive Vice President and Chief Financial Officer effective June 30, 2015. She was previously Executive VicePresident, Corporate Real Estate, Alliances and Treasurer of the Company from 2000 to 2015.
22

TABLE OF CONTENTS
PART II
ITEM 5. Market for the Company’s Common Equity, Related Stockholder Matters and Issuer Purchases of Equity Securities
The Company’s common stock is listed on the New York Stock Exchange under the ticker symbol “DIS”. The following table shows, for the periodsindicated, the high and low sales prices per share of common stock as reported in the Bloomberg Financial markets services.
Sales Price High Low2016
4th Quarter $ 100.80 $ 91.193rd Quarter 106.75 94.002nd Quarter 103.43 86.251st Quarter 120.65 102.61
2015 4th Quarter $ 122.08 $ 90.003rd Quarter 115.28 104.252nd Quarter 108.94 90.061st Quarter 95.31 78.54
On June 24, 2015, the Company declared a $0.66 per share dividend ($1.1 billion) for the first half of fiscal 2015 for shareholders of record on July 6, 2015,which was paid on July 29, 2015. On December 2, 2015, the Company declared a $0.71 per share dividend ($1.2 billion) for the second half of fiscal 2015 forshareholders of record on December 14, 2015, which was paid on January 11, 2016.
On June 29, 2016, the Company declared a $0.71 per share dividend ($1.1 billion) for the first half of fiscal 2016 for shareholders of record on July 11, 2016,which was paid on July 28, 2016. The Board of Directors has not declared a dividend related to the second half of fiscal 2016 as of the date of this report.
As of October 1, 2016 , the approximate number of common shareholders of record was 890,200.
The following table provides information about Company purchases of equity securities that are registered by the Company pursuant to Section 12 of theExchange Act during the quarter ended October 1, 2016 :
Period
Total Numberof Shares
Purchased (1)
WeightedAverage PricePaid per Share
Total Number of Shares Purchasedas Part of Publicly
Announced Plans or Programs
Maximum Number of Shares that May Yet Be
PurchasedUnder thePlans or
Programs (2)
July 3, 2016 – July 31, 2016 4,864,650 $ 98.59 4,840,000 293 millionAugust 1, 2016 – August 31, 2016 6,654,889 96.24 6,423,739 287 millionSeptember 1, 2016 – October 1, 2016 5,336,204 93.44 5,305,000 282 millionTotal 16,855,743 96.03 16,568,739 282 million
(1) 287,004 shares were purchased on the open market to provide shares to participants in the Walt Disney Investment Plan (WDIP). These purchases werenot made pursuant to a publicly announced repurchase plan or program.
(2) Under a share repurchase program implemented effective June 10, 1998, the Company is authorized to repurchase shares of its common stock. OnJanuary 30, 2015, the Company’s Board of Directors increased the repurchase authorization to a total of 400 million shares as of that date. The repurchaseprogram does not have an expiration date.
23

TABLE OF CONTENTS
ITEM 6. Selected Financial Data
(in millions, except per share data)
2016 (1) 2015 (2) 2014 (3) 2013 (4) 2012 (5)
Statements of income Revenues $ 55,632 $ 52,465 $ 48,813 $ 45,041 $ 42,278Net income 9,790 8,852 8,004 6,636 6,173Net income attributable to Disney 9,391 8,382 7,501 6,136 5,682Per common share
Earnings attributable to Disney Diluted $ 5.73 $ 4.90 $ 4.26 $ 3.38 $ 3.13Basic 5.76 4.95 4.31 3.42 3.17
Dividends (6) 1.42 1.81 0.86 0.75 0.60Balance sheets
Total assets $ 92,033 $ 88,182 $ 84,141 $ 81,197 $ 74,863Long-term obligations 24,189 19,142 18,573 17,293 17,841Disney shareholders’ equity 43,265 44,525 44,958 45,429 39,759
Statements of cash flows Cash provided (used) by:
Operating activities $ 13,213 $ 10,909 $ 9,780 $ 9,452 $ 7,966Investing activities (5,758) (4,245) (3,345) (4,676) (4,759)Financing activities (6,991) (5,514) (6,710) (4,214) (2,985)
(1) The fiscal 2016 results include the Company’s share of a net gain recognized by A+E in connection with an acquisition of an interest in Vice ($0.13 per dilutedshare) (see Note 3 to the Consolidated Financial Statements), restructuring and impairment charges ($0.07 per diluted share) and a charge in connection withthe discontinuation of our Infinity console game business ($0.05 per diluted share). These items collectively resulted in a net benefit of $0.01 per diluted share.
(2) The fiscal 2015 results include the write-off of a deferred tax asset as a result of the Disneyland Paris recapitalization ($0.23 per diluted share) (see Note 6 tothe Consolidated Financial Statements) and restructuring and impairment charges ($0.02 per diluted share), which collectively resulted in a net adverse impactof $0.25 per diluted share.
(3) The fiscal 2014 results include a loss resulting from the foreign currency translation of net monetary assets denominated in Venezuelan currency ($0.05 perdiluted share) (see Note 4 to the Consolidated Financial Statements), restructuring and impairment charges ($0.05 per diluted share), a gain on the sale ofproperty ($0.03 per diluted share) and a portion of a settlement of an affiliate contract dispute ($0.01 per diluted share). These items collectively resulted in anet adverse impact of $0.06 per diluted share.
(4) During fiscal 2013, the Company completed a $4.1 billion cash and stock acquisition of Lucasfilm Ltd. LLC. In addition, results for the year include a chargerelated to the Celador litigation ($0.11 per diluted share), restructuring and impairment charges ($0.07 per diluted share), a charge related to an equityredemption by Hulu ($0.02 per diluted share), favorable tax adjustments related to an increase in the amount of prior-year foreign earnings considered to beindefinitely reinvested outside of the United States and favorable tax adjustments related to pre-tax earnings of prior years ($0.12 per diluted share) and gains inconnection with the sale of our equity interest in ESPN STAR Sports and certain businesses ($0.08 per diluted share). These items collectively resulted in a netadverse impact of $0.01 per diluted share.
(5) The fiscal 2012 results include a non-cash gain in connection with the acquisition of a controlling interest in UTV ($0.06 per diluted share), a recovery of apreviously written-off receivable from Lehman Brothers ($0.03 per diluted share), restructuring and impairment charges ($0.03 per diluted share) and costsrelated to refinancing Disneyland Paris debt (rounded to $0.00 per diluted share). These items collectively resulted in a net benefit of $0.06 per diluted share.
(6) In fiscal 2015, the Company began paying dividends on a semiannual basis. Accordingly, fiscal 2015 includes dividend payments related to fiscal 2014 and thefirst half of fiscal 2015 (see Note 11 to the Consolidated Financial Statements).
24

TABLE OF CONTENTS
ITEM 7. Management’s Discussion and Analysis of Financial Condition and Results of Operations
CONSOLIDATED RESULTS(in millions, except per share data)
% Change
Better/(Worse)
2016 2015 2014
2016 vs.
2015
2015 vs.
2014 Revenues:
Services $ 47,130 $ 43,894 $ 40,246 7 % 9 % Products 8,502 8,571 8,567 (1)% — %
Total revenues 55,632 52,465 48,813 6 % 7 % Costs and expenses:
Cost of services (exclusive of depreciation andamortization) (24,653) (23,191) (21,356) (6)% (9)%
Cost of products (exclusive of depreciationand amortization) (5,340) (5,173) (5,064) (3)% (2)%
Selling, general, administrative and other (8,754) (8,523) (8,565) (3)% — % Depreciation and amortization (2,527) (2,354) (2,288) (7)% (3)%
Total costs and expenses (41,274) (39,241) (37,273) (5)% (5)% Restructuring and impairment charges (156) (53) (140) >(100)% 62 % Other expense, net — — (31) nm 100 % Interest income/(expense), net (260) (117) 23 >(100)% nm Equity in the income of investees 926 814 854 14 % (5)% Income before income taxes 14,868 13,868 12,246 7 % 13 % Income taxes (5,078) (5,016) (4,242) (1)% (18)% Net income 9,790 8,852 8,004 11 % 11 % Less: Net income attributable to noncontrolling
interests (399) (470) (503) 15 % 7 % Net income attributable to The Walt Disney
Company (Disney) $ 9,391 $ 8,382 $ 7,501 12 % 12 %
Earnings per share attributable to Disney: Diluted $ 5.73 $ 4.90 $ 4.26 17 % 15 % Basic $ 5.76 $ 4.95 $ 4.31 16 % 15 %
Weighted average number of common and
common equivalent shares outstanding: Diluted 1,639 1,709 1,759 Basic 1,629 1,694 1,740
25

TABLE OF CONTENTS
Organization of Information
Management’s Discussion and Analysis provides a narrative on the Company’s financial performance and condition that should be read in conjunction withthe accompanying financial statements. It includes the following sections:
• Consolidated Results and Non-Segment Items• Business Segment Results — 2016 vs. 2015• Business Segment Results — 2015 vs. 2014• Corporate and Unallocated Shared Expenses• Pension and Postretirement Medical Benefit Costs• Liquidity and Capital Resources• Contractual Obligations, Commitments and Off Balance Sheet Arrangements• Critical Accounting Policies and Estimates• Forward-Looking Statements
CONSOLIDATED RESULTS AND NON-SEGMENT ITEMS
2016 vs. 2015
Revenues for fiscal 2016 increased 6% , or $3.2 billion, to $55.6 billion ; net income attributable to Disney increased 12% , or $1.0 billion, to $9.4 billion ;and diluted earnings per share attributable to Disney (EPS) for the year increased 17% , or $0.83 to $5.73 . The EPS increase in fiscal 2016 was due to segmentoperating income growth driven by Studio Entertainment, Parks and Resorts and Consumer Products & Interactive Media, a decrease in weighted average sharesoutstanding as a result of our share repurchase program, a decrease in our effective income tax rate, which reflected a deferred tax asset write-off in the prior year,and the benefit of the Vice Gain (See Note 3 to the Consolidated Financial Statements). These increases were partially offset by higher net interest expense, theInfinity Charge (see Note 1 to the Consolidated Financial Statements) and higher restructuring and impairment charges in the current year. Segment operatingresults benefited from growth in services, partially offset by the impact of foreign currency translation due to the movement of the U.S. dollar against majorcurrencies including the impact of our hedging program (FX Impact).
Fiscal 2016 included fifty-two weeks of operations, while fiscal 2015 results included the benefit from a fifty-third week of operations (Fiscal Period Impact)due to the timing of our fiscal period end. The estimated EPS impact of the additional week of operations in the prior year was approximately $0.13 and themajority of the impact was at our cable networks business, followed by our parks and resorts and, to a lesser extent, consumer products businesses.
Revenues
Service revenues for fiscal 2016 increased 7% , or $3.2 billion, to $47.1 billion , due to higher theatrical distribution revenues. The increase in servicerevenue was also driven by higher merchandise and game licensing revenue, average guest spending and attendance growth at our domestic parks and resorts,higher affiliate fees, growth in TV/ subscription video on demand (SVOD), revenues from the opening of Shanghai Disney Resort, growth in digital distribution offilm content and higher advertising revenue. These increases were partially offset by lower attendance at Disneyland Paris. Service revenue growth reflected anapproximate 1 percentage point decrease due to an unfavorable FX Impact.
Product revenues for fiscal 2016 decreased 1% , or $69 million, to $8.5 billion , due to the discontinuation of the Infinity business and lower retail storevolumes, partially offset by higher average guest spending at our domestic parks and resorts, higher net effective pricing at home entertainment and revenues fromthe opening of Shanghai Disney Resort. Lower product revenue reflected an approximate 1 percentage point decline due to an unfavorable FX Impact.
Costs and expenses
Cost of services for fiscal 2016 increased 6% , or $1.5 billion, to $24.7 billion , due to higher film cost amortization and distribution expense, increasedmedia programming and production costs, the impact of the opening of Shanghai Disney Resort and cost inflation and higher infrastructure and labor costs at ourdomestic parks and resorts. These increases were partially offset by efficiency initiatives at our domestic parks and resorts. Cost of services reflected anapproximate 1 percentage point benefit due to a favorable FX Impact.
26

TABLE OF CONTENTS
Cost of products for fiscal 2016 increased 3% , or $167 million, to $5.3 billion , due to the Infinity Charge, higher guest spending and cost inflation at ourdomestic parks and resorts and higher film cost amortization due to home entertainment revenue growth, partially offset by lower costs from the discontinuation ofthe Infinity business.
Selling, general, administrative and other costs for the fiscal year increased 3% , or $231 million, to $8.8 billion , driven by increased marketing costs at ourStudio Entertainment segment, partially offset by lower marketing spend at our Media Networks segment. Selling, general, administrative and other costs reflectedan approximate 1 percentage point benefit due to a favorable FX Impact.
Depreciation and amortization costs increased 7% , or $173 million, to $2.5 billion due to the opening of Shanghai Disney Resort and depreciation of newattractions at our domestic parks and resorts.
Restructuring and Impairment Charges
The Company recorded $156 million and $53 million of restructuring and impairment charges in fiscal years 2016 and 2015 , respectively. Charges in fiscal2016 were due to asset impairments and severance and contract termination costs. Charges in fiscal 2015 were primarily due to a contract termination andseverance costs.
Interest Income/(Expense), net
Interest income/(expense), net is as follows:
(in millions) 2016 2015 % Change
Better/(Worse) Interest expense $ (354) $ (265) (34)% Interest and investment income 94 148 (36)% Interest income/(expense), net $ (260) $ (117) >(100)%
The increase in interest expense was due to higher average debt balances and an increase in our effective interest rate, partially offset by higher capitalizedinterest.
The decrease in interest and investment income was due to lower gains on sales of publicly traded investments.
Equity in the Income of Investees
Equity in the income of investees increased 14% or $112 million, to $0.9 billion due to the $332 million Vice Gain (See Note 3 to the Consolidated FinancialStatements). The benefit of the Vice Gain was partially offset by a higher loss at Hulu and lower operating results at A+E. The increased equity loss at Hulu wasdue to higher programming, marketing and labor costs, partially offset by growth in subscription and advertising revenues. The decrease at A+E was due to loweradvertising revenue and the impact of the conversion of the H2 channel to Viceland.
Effective Income Tax Rate
2016 2015 Change
Better/(Worse)Effective income tax rate 34.2% 36.2% 2.0 ppt
The decrease in the effective income tax rate was primarily due to a write-off of a $399 million deferred income tax asset in the prior year as a result of theincrease in the Company’s ownership of Euro Disney S.C.A. in connection with the Disneyland Paris recapitalization (Disneyland Paris Tax Asset Write-off) (SeeNotes 6 and 9 to the Consolidated Financial Statements for further discussion). This decrease was partially offset by an increase in foreign losses for which we arenot recognizing a tax benefit.
Noncontrolling Interests
Net income attributable to noncontrolling interests for the year decreased $71 million to $399 million due to higher pre-opening expenses at Shanghai DisneyResort and a decrease related to Disneyland Paris, partially offset by higher results at ESPN. The decrease related to Disneyland Paris was driven by lower results,partially offset by the impact of an increase in the Company’s ownership interest.
27

TABLE OF CONTENTS
Net income attributable to noncontrolling interests is determined on income after royalties and management fees, financing costs and income taxes.
2015 vs. 2014
Revenues for fiscal 2015 increased 7% , or $3.7 billion, to $52.5 billion ; net income attributable to Disney increased 12% , or $881 million, to $8.4 billion ;and EPS for the year increased 15% , or $0.64 to $4.90 . The EPS increase in fiscal 2015 reflected growth at all our operating segments and a decrease in theweighted average shares outstanding as a result of our share repurchase program, partially offset by the Disneyland Paris Tax Asset Write-off and lower investmentgains. Results for fiscal 2015 also include the benefit of a favorable Fiscal Period Impact.
Revenues
Service revenues for fiscal 2015 increased 9% , or $3.7 billion, to $43.9 billion , primarily due to higher affiliate fees, volume growth and higher averageguest spending at our domestic parks and resorts, higher SVOD sales of our television and film properties, an increase in merchandise licensing and advertisingrevenue growth. Service revenue growth reflected an approximate 2 percentage point decrease due to an unfavorable FX Impact.
Product revenues for fiscal 2015 were comparable to fiscal 2014 as higher food, beverage and merchandise volumes and average guest spending at ourdomestic parks and resorts and increased revenues at our retail business were offset by lower worldwide home entertainment and console game volumes. Productrevenue growth reflected an approximate 2 percentage point decrease due to an unfavorable FX Impact.
Costs and expenses
Cost of services for fiscal 2015 increased 9% , or $1.8 billion, to $23.2 billion primarily due to higher sports programming costs and inflation and operationssupport cost growth at our domestic parks and resorts. Cost of services reflected an approximate 1 percentage point benefit due to a favorable FX Impact.
Cost of products for fiscal 2015 increased 2% , or $109 million, to $5.2 billion , driven by volume growth at domestic parks and resorts and our retailbusiness and inflation at our domestic parks and resorts. These increases were partially offset by lower home entertainment and console game unit sales. Cost ofproducts reflected an approximate 2 percentage point benefit due to a favorable FX Impact.
Selling, general, administrative and other costs in fiscal 2015 were comparable to fiscal 2014 as higher labor costs driven by the ABC Television Network,ESPN and Corporate and higher information technology costs at domestic parks and resorts were offset by lower marketing costs and a favorable FX Impact. Thedecrease in marketing costs was due to lower spending for theatrical and home entertainment marketing, partially offset by increases at ABC, ESPN and ourmerchandise licensing business.
Depreciation and amortization costs increased 3% , or $66 million, to $2.4 billion , driven by new theme park attractions and, to a lesser extent, newbroadcast facilities and equipment. Depreciation and amortization costs reflected an approximate 2 percentage point benefit due to a favorable FX Impact.
Restructuring and Impairment Charges
The Company recorded $53 million and $140 million of restructuring and impairment charges in fiscal years 2015 and 2014 , respectively. Charges in fiscal2015 were primarily due to a contract termination and severance. Charges in fiscal 2014 were primarily due to severance costs across various of our segments andradio FCC license impairments, which were determined in connection with a plan to sell Radio Disney stations.
Other Expense, net
Other expense, net is as follows (see Note 4 to the Consolidated Financial Statements):
(in millions) 2015 2014Venezuelan foreign currency translation loss $ — $ (143)Gain on sale of property and other — 112
Other expense, net $ — $ (31)
28

TABLE OF CONTENTS
Interest Income/(Expense), net
Interest income/(expense), net is as follows:
(in millions) 2015 2014 % Change
Better/(Worse) Interest expense $ (265) $ (294) 10 % Interest and investment income 148 317 (53)% Interest income/(expense), net $ (117) $ 23 nm
The decrease in interest expense was due to higher capitalized interest driven by the continued development of the Shanghai Disney Resort and loweraverage debt balances, partially offset by an unfavorable Fiscal Period Impact and higher effective interest rates.
The decrease in interest and investment income was due to lower gains on sales of investments and income on late payments recognized in fiscal 2014 inconnection with the settlement of an affiliate contract dispute.
Equity in the Income of Investees
Equity in the income of investees decreased 5%, or $40 million, to $0.8 billion primarily due to a decrease at Hulu, partially offset by an increase at A+E.
Effective Income Tax Rate
2015 2014 Change
Better/(Worse) Effective income tax rate 36.2% 34.6% (1.6) ppt
The increase in the effective income tax rate was primarily due to the Disneyland Paris Tax Asset Write-off. This increase was partially offset by a benefitfrom an increase in earnings from foreign operations indefinitely reinvested outside the United States, which are subject to tax rates lower than the federal statutoryincome tax rate.
Noncontrolling Interests
Net income attributable to noncontrolling interests for fiscal 2015 decreased $33 million to $470 million due to lower operating results at Hong KongDisneyland Resort and higher pre-opening expenses at Shanghai Disney Resort, partially offset by an increase related to Disneyland Paris. The increase related toDisneyland Paris was driven by higher net income, partially offset by the impact of the Company’s change in ownership interest.
Certain Items Impacting Comparability
Results for fiscal 2016 were impacted by the following:• The $332 million Vice Gain• Restructuring and impairment charges totaling $156 million• The $129 million Infinity Charge
Results for fiscal 2015 were impacted by the following:• The $399 million Disneyland Paris Tax Asset Write-off• Restructuring and impairment charges totaling $53 million
Results for fiscal 2014 were impacted by the following:• A Venezuelan foreign currency translation loss of $143 million• Restructuring and impairment charges totaling $140 million• A $77 million gain on the sale of a property• Income of $29 million representing a portion of a settlement of an affiliate contract dispute
29

TABLE OF CONTENTS
A summary of the impact of these items on EPS is as follows:
(in millions, except per share data)Pre-Tax
Income/(Loss) Tax Benefit/(Expense)
(1) After-Tax
Income/(Loss) EPS Favorable/(Adverse)
(2)
Year Ended October 1, 2016: Vice Gain $ 332 $ (122) $ 210 $ 0.13Restructuring and impairment charges (156) 43 (113) (0.07)Infinity Charge (3) (129) 47 (82) (0.05)
Total $ 47 $ (32) $ 15 $ 0.01
Year Ended October 3, 2015: Disneyland Paris Tax Asset Write-off $ — $ (399) $ (399) $ (0.23)Restructuring and impairment charges (53) 20 (33) (0.02)
Total $ (53) $ (379) $ (432) $ (0.25)
Year Ended September 27, 2014: Venezuela foreign currency translation loss (4) $ (143) $ 53 $ (90) $ (0.05)Restructuring and impairment charges (140) 48 (92) (0.05)Gain on sale of property 77 (28) 49 0.03Settlement income and other 35 (13) 22 0.01
Total $ (171) $ 60 $ (111) $ (0.06)
(1) Tax benefit/expense adjustments are determined using the tax rate applicable to the individual item affecting comparability.(2) EPS is net of noncontrolling interest share, where applicable. Total may not equal the sum of the column due to rounding.(3) Recorded in “Cost of products” in the Consolidated Statements of Income. See Note 1 to the Consolidated Financial Statements.(4) Recorded in “Other expense, net” in the Consolidated Statements of Income. See Note 4 to the Consolidated Financial Statements.
BUSINESS SEGMENT RESULTS — 2016 vs. 2015
Below is a discussion of the major revenue and expense categories for our business segments. Costs and expenses for each segment consist of operatingexpenses, selling, general, administrative and other costs and depreciation and amortization. Selling, general, administrative and other costs include third-party andinternal marketing expenses.
Our Media Networks segment generates revenue from affiliate fees, ad sales and other revenues, which include the sale and distribution of televisionprogramming. Significant operating expenses include amortization of programming, production, participations and residuals costs, technical support costs,operating labor and distribution costs.
Our Parks and Resorts segment generates revenue from the sale of admissions to theme parks, the sale of food, beverage and merchandise, charges for roomnights at hotels, sales of cruise vacation packages and sales and rentals of vacation club properties. Revenues are also generated from sponsorships and co-brandingopportunities, real estate rent and sales, and royalties from Tokyo Disney Resort. Significant operating expenses include operating labor, infrastructure costs, costsof sales and other operating expenses. Infrastructure costs include information systems expense, repairs and maintenance, utilities and fuel, property taxes,insurance and transportation and other operating expenses include costs for such items as supplies, commissions and entertainment offerings.
Our Studio Entertainment segment generates revenue from the distribution of films in the theatrical, home entertainment and television and SVOD markets(TV/SVOD), ticket sales for live stage plays, music distribution and licensing of our intellectual property for use in live entertainment events. Significant operatingexpenses include amortization of production, participations and residuals costs, distribution expenses and costs of sales.
30

TABLE OF CONTENTS
Our Consumer Products & Interactive Media segment generates revenue from licensing characters from our film, television and other properties to thirdparties for use on consumer merchandise, published materials and in multi-platform games and from operating retail stores and internet shopping sites. We alsogenerate revenue from the sales of games through app distributors and online, from consumers’ in-game purchases, wholesale sales of self-published children’sbooks and magazines and comic books, and from operating English language learning centers. Significant operating expenses include costs of goods sold anddistribution expenses, operating labor and retail occupancy costs, product development and marketing.
The following is a summary of segment revenue and operating income:
% Change
Better/(Worse)
(in millions) 2016 2015 2014
2016 vs.
2015
2015 vs.
2014 Revenues:
Media Networks $ 23,689 $ 23,264 $ 21,152 2 % 10% Parks and Resorts 16,974 16,162 15,099 5 % 7% Studio Entertainment 9,441 7,366 7,278 28 % 1% Consumer Products & Interactive Media 5,528 5,673 5,284 (3)% 7%
$ 55,632 $ 52,465 $ 48,813 6 % 7% Segment operating income:
Media Networks $ 7,755 $ 7,793 $ 7,321 — % 6% Parks and Resorts 3,298 3,031 2,663 9 % 14% Studio Entertainment 2,703 1,973 1,549 37 % 27% Consumer Products & Interactive Media 1,965 1,884 1,472 4 % 28%
$ 15,721 $ 14,681 $ 13,005 7 % 13%
The Company evaluates the performance of its operating segments based on segment operating income, and management uses aggregate segment operatingincome as a measure of the overall performance of the operating businesses. Aggregate segment operating income is not a financial measure defined by GAAP,should be reviewed in conjunction with the relevant GAAP financial measure and may not be comparable to similarly titled measures reported by other companies.The Company believes that information about aggregate segment operating income assists investors by allowing them to evaluate changes in the operating resultsof the Company’s portfolio of businesses separate from factors other than business operations that affect net income. The following table reconciles segmentoperating income to income before income taxes.
% Change
Better/(Worse)
(in millions) 2016 2015 2014
2016 vs.
2015
2015 vs.
2014 Segment operating income $ 15,721 $ 14,681 $ 13,005 7 % 13 % Corporate and unallocated shared expenses (640) (643) (611) — % (5)% Restructuring and impairment charges (156) (53) (140) >(100)% 62 % Other expense, net — — (31) nm 100 % Interest income/(expense), net (260) (117) 23 >(100)% nm Vice Gain (1) 332 — — nm nm Infinity Charge (2) (129) — — nm nm Income before income taxes $ 14,868 $ 13,868 $ 12,246 7 % 13 %
(1) See Note 3 to the Consolidated Financial Statements for a discussion of the Vice Gain.(2) See Note 1 to the Consolidated Financial Statements for a discussion of the Infinity Charge.
31

TABLE OF CONTENTS
Media Networks
Operating results for the Media Networks segment are as follows:
Year Ended % ChangeBetter /(Worse)(in millions) October 1, 2016 October 3, 2015
Revenues Affiliate fees $ 12,259 $ 12,029 2 % Advertising 8,509 8,361 2 % TV/SVOD distribution and other 2,921 2,874 2 %
Total revenues 23,689 23,264 2 % Operating expenses (13,571) (13,150) (3)% Selling, general, administrative and other (2,705) (2,869) 6 % Depreciation and amortization (255) (266) 4 % Equity in the income of investees 597 814 (27)% Operating Income $ 7,755 $ 7,793 — %
RevenuesThe increase in affiliate fees reflected an increase of 7% from higher contractual rates, partially offset by decreases of 2% from subscribers, 2% from an
unfavorable Fiscal Period Impact and 1% from an unfavorable FX Impact.
The increase in advertising revenues was due to increase s of $117 million at Cable Networks, from $4,334 million to $4,451 million , and $31 million atBroadcasting, from $4,027 million to $4,058 million . The increase at Cable Networks was due to a 3% increase from higher rates and a 1% increase from higherimpressions, partially offset by a decrease of 1% from an unfavorable Fiscal Period Impact. The increase in impressions was due to an increase in units sold,partially offset by lower ratings. Growth at Broadcasting was due to increases of 6% from higher network rates and 1% from the addition of the Emmy Awardsshow, which were largely offset by decreases of 5% from lower impressions and 2% from an unfavorable Fiscal Period Impact. The decrease in impressions wasdue to lower network ratings, partially offset by higher digital impressions and an increase in network units sold. Impressions is a measure of the number of peoplean advertisement has reached.
TV/SVOD distribution and other revenue increase d $47 million from $2,874 million to $2,921 million due to an increase in program sales, partially offset byan unfavorable FX Impact. The increase in program sales was due to higher sales of ABC programs, partially offset by lower sales of cable programs.
Costs and ExpensesOperating expenses include programming and production costs, which increase d $386 million from $11,977 million to $12,363 million . At Broadcasting,
programming and production costs increase d $306 million due to a higher average amortization rate, the impact of higher program sales, as well as an increase incost write-downs for network programming. These increases were partially offset by a favorable Fiscal Period Impact. At Cable Networks, programming andproduction costs increase d $80 million due to rate increases and contract renewals for sports programming, partially offset by the absence of rights costs forNASCAR and British Open, a favorable Fiscal Period Impact and a favorable FX Impact.
Selling, general, administrative and other costs decrease d $164 million from $2,869 million to $2,705 million due to a favorable FX Impact and lowermarketing and labor costs.
Equity in the Income of InvesteesIncome from equity investees decrease d $217 million from $814 million to $597 million due to a higher loss at Hulu and lower operating results at A+E.
The increased equity loss at Hulu was due to higher programming, marketing and labor costs, partially offset by growth in subscription and advertising revenues.The decrease at A+E was due to lower advertising revenue and the impact of the conversion of the H2 channel to Viceland.
Segment Operating IncomeSegment operating income decrease d $38 million , to $7,755 million due to lower income from equity investees and an unfavorable FX Impact, partially
offset by increases at ESPN and the ABC TV Network.
32

TABLE OF CONTENTS
The following table provides supplemental revenue and operating income detail for the Media Networks segment:
Year Ended % ChangeBetter /(Worse)(in millions) October 1, 2016 October 3, 2015
Revenues Cable Networks $ 16,632 $ 16,581 — % Broadcasting 7,057 6,683 6 %
$ 23,689 $ 23,264 2 % Segment operating income
Cable Networks $ 6,748 $ 6,787 (1)% Broadcasting 1,007 1,006 — %
$ 7,755 $ 7,793 — %
Starting in fiscal 2017, the Company will report Media Networks results with equity in the income of investees separate from Cable Networks andBroadcasting. The following table shows segment operating income on this basis:
Year Ended % ChangeBetter /(Worse)(in millions) October 1, 2016 October 3, 2015
Segment operating income Cable Networks $ 5,965 $ 5,891 1 % Broadcasting 1,193 1,088 10 % Equity in the income of investees 597 814 (27)%
$ 7,755 $ 7,793 — %
Restructuring and impairment chargesThe Company recorded charges of $87 million, $62 million and $78 million related to Media Networks for fiscal years 2016 , 2015 and 2014 , respectively,
that were reported in “Restructuring and impairment charges” in the Consolidated Statements of Income. The charges in fiscal 2016 were due to an investmentimpairment and contract termination and severance costs. The charges in fiscal 2015 were due to a contract termination and severance costs. The charges in fiscal2014 were due to radio FCC license and investment impairments and severance costs.
Parks and Resorts
Operating results for the Parks and Resorts segment are as follows:
Year Ended % ChangeBetter /(Worse)(in millions) October 1, 2016 October 3, 2015
Revenues Domestic $ 14,242 $ 13,611 5 % International 2,732 2,551 7 %
Total revenues 16,974 16,162 5 % Operating expenses (10,039) (9,730) (3)% Selling, general, administrative and other (1,913) (1,884) (2)% Depreciation and amortization (1,721) (1,517) (13)% Equity in the loss of investees (3) — nm Operating Income $ 3,298 $ 3,031 9 %
RevenuesParks and Resorts revenues increase d 5% , or $812 million , to $17.0 billion due to increase s of $631 million at our domestic operations and $181 million at
our international operations.
Revenue growth of 5% at our domestic operations reflected an increase of 5% from higher average guest spending, partially offset by a decrease of 1% fromlower volumes. The increase in average guest spending was due to higher average
33
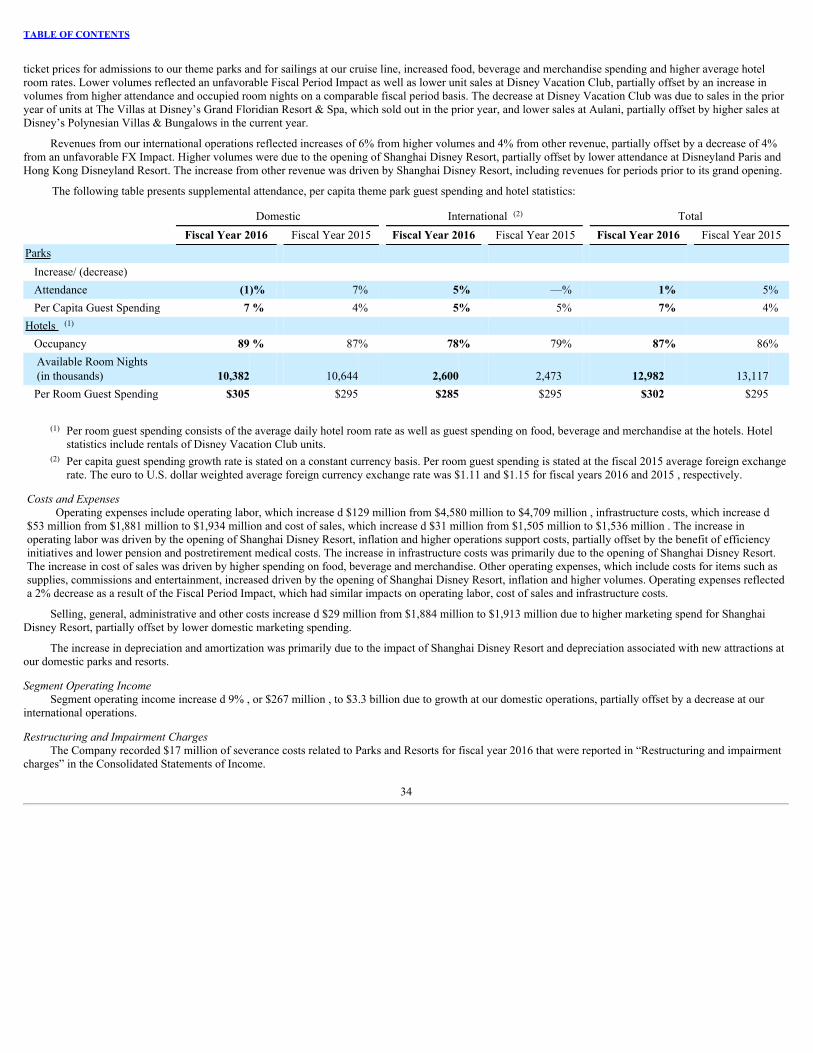
TABLE OF CONTENTS
ticket prices for admissions to our theme parks and for sailings at our cruise line, increased food, beverage and merchandise spending and higher average hotelroom rates. Lower volumes reflected an unfavorable Fiscal Period Impact as well as lower unit sales at Disney Vacation Club, partially offset by an increase involumes from higher attendance and occupied room nights on a comparable fiscal period basis. The decrease at Disney Vacation Club was due to sales in the prioryear of units at The Villas at Disney’s Grand Floridian Resort & Spa, which sold out in the prior year, and lower sales at Aulani, partially offset by higher sales atDisney’s Polynesian Villas & Bungalows in the current year.
Revenues from our international operations reflected increases of 6% from higher volumes and 4% from other revenue, partially offset by a decrease of 4%from an unfavorable FX Impact. Higher volumes were due to the opening of Shanghai Disney Resort, partially offset by lower attendance at Disneyland Paris andHong Kong Disneyland Resort. The increase from other revenue was driven by Shanghai Disney Resort, including revenues for periods prior to its grand opening.
The following table presents supplemental attendance, per capita theme park guest spending and hotel statistics:
Domestic International (2) Total
Fiscal Year 2016 Fiscal Year 2015 Fiscal Year 2016 Fiscal Year 2015 Fiscal Year 2016 Fiscal Year 2015Parks
Increase/ (decrease) Attendance (1)% 7% 5% —% 1% 5%Per Capita Guest Spending 7 % 4% 5% 5% 7% 4%
Hotels (1) Occupancy 89 % 87% 78% 79% 87% 86%Available Room Nights(in thousands) 10,382 10,644 2,600 2,473 12,982 13,117Per Room Guest Spending $305 $295 $285 $295 $302 $295
(1) Per room guest spending consists of the average daily hotel room rate as well as guest spending on food, beverage and merchandise at the hotels. Hotelstatistics include rentals of Disney Vacation Club units.
(2) Per capita guest spending growth rate is stated on a constant currency basis. Per room guest spending is stated at the fiscal 2015 average foreign exchangerate. The euro to U.S. dollar weighted average foreign currency exchange rate was $1.11 and $1.15 for fiscal years 2016 and 2015 , respectively.
Costs and ExpensesOperating expenses include operating labor, which increase d $129 million from $4,580 million to $4,709 million , infrastructure costs, which increase d
$53 million from $1,881 million to $1,934 million and cost of sales, which increase d $31 million from $1,505 million to $1,536 million . The increase inoperating labor was driven by the opening of Shanghai Disney Resort, inflation and higher operations support costs, partially offset by the benefit of efficiencyinitiatives and lower pension and postretirement medical costs. The increase in infrastructure costs was primarily due to the opening of Shanghai Disney Resort.The increase in cost of sales was driven by higher spending on food, beverage and merchandise. Other operating expenses, which include costs for items such assupplies, commissions and entertainment, increased driven by the opening of Shanghai Disney Resort, inflation and higher volumes. Operating expenses reflecteda 2% decrease as a result of the Fiscal Period Impact, which had similar impacts on operating labor, cost of sales and infrastructure costs.
Selling, general, administrative and other costs increase d $29 million from $1,884 million to $1,913 million due to higher marketing spend for ShanghaiDisney Resort, partially offset by lower domestic marketing spending.
The increase in depreciation and amortization was primarily due to the impact of Shanghai Disney Resort and depreciation associated with new attractions atour domestic parks and resorts.
Segment Operating IncomeSegment operating income increase d 9% , or $267 million , to $3.3 billion due to growth at our domestic operations, partially offset by a decrease at our
international operations.
Restructuring and Impairment ChargesThe Company recorded $17 million of severance costs related to Parks and Resorts for fiscal year 2016 that were reported in “Restructuring and impairment
charges” in the Consolidated Statements of Income.
34

TABLE OF CONTENTS
Studio Entertainment
Operating results for the Studio Entertainment segment are as follows:
Year Ended % ChangeBetter /(Worse)(in millions) October 1, 2016 October 3, 2015
Revenues Theatrical distribution $ 3,672 $ 2,321 58 % Home entertainment 2,108 1,799 17 % TV/SVOD distribution and other 3,661 3,246 13 %
Total revenues 9,441 7,366 28 % Operating expenses (3,991) (3,050) (31)% Selling, general, administrative and other (2,622) (2,204) (19)% Depreciation and amortization (125) (139) 10 % Operating Income $ 2,703 $ 1,973 37 %
RevenuesThe increase in theatrical distribution revenue was primarily due to the performance of Star Wars: The Force Awakens . Other significant titles in the current
year included Captain America: Civil War, Finding Dory , Zootopia and The Jungle Book , whereas the prior year included Avengers: Age of Ultron , Inside Out,Big Hero 6 and Cinderella.
The increase in home entertainment revenue was due to increases of 14% from higher unit sales and 7% from higher average net effective pricing, partiallyoffset by a decrease of 4% from an unfavorable FX Impact. The higher unit sales and net effective pricing were due to the strong performance of Star Wars: TheForce Awakens . Other significant titles included Inside Out , Zootopia, Captain America: Civil War, The Good Dinosaur and Ant-Man in the current yearcompared to Guardians of the Galaxy , Big Hero 6, Frozen, Maleficent and Avengers: Age of Ultron in the prior year. The current year also reflected higherrevenues from Star Wars Classic titles. Net effective pricing is the wholesale selling price adjusted for discounts, sales incentives and returns.
The increase in TV/SVOD distribution and other revenue was due to increases of 9% from TV/SVOD distribution and 7% from higher revenue share withthe Consumer Products & Interactive Media segment, partially offset by a decrease of 3% from an unfavorable FX Impact. The increase in TV/SVOD distributionrevenue was due to international growth, a sale of Star Wars Classic titles in the current year and two Pixar VOD availabilities in the current year compared tonone in the prior year. Higher revenue share with the Consumer Products & Interactive Media segment was due to the success of merchandise based on Star Wars:The Force Awakens in the current year , partially offset by lower sales of Frozen merchandise.
Costs and ExpensesOperating expenses include an increase of $833 million in film cost amortization, from $1,790 million to $2,623 million due to the impact of higher revenues
and a higher average film cost amortization rate in the current year. Operating expenses also include cost of goods sold and distribution costs, which increase d$108 million , from $1,260 million to $1,368 million due to higher theatrical distribution costs and an increase in home entertainment unit sales, partially offset bya favorable FX Impact. Higher theatrical distribution costs were primarily due to the release of Star Wars: The Force Awakens in the current year whereas the prioryear had no comparable title.
Selling, general, administrative and other costs increase d $418 million from $2,204 million to $2,622 million primarily due to theatrical marketing expensefor Star Wars: The Force Awakens as well as two Pixar titles and two DreamWorks titles in the current year compared to one Pixar title and no DreamWorks titlesin the prior year. This was partially offset by higher theatrical marketing expense for two Marvel titles in the prior year compared to one Marvel title in the currentyear.
Segment Operating IncomeSegment operating income increase d 37% , or $730 million to $2,703 million due to growth from theatrical and home entertainment results, an increase in
TV/SVOD distribution and higher revenue share with the Consumer Products & Interactive Media segment.
Restructuring and impairment charges and Other expense, netThe Company recorded $38 million of asset impairments related to Studio Entertainment for fiscal year 2016 that were reported in “Restructuring and
impairment charges” in the Consolidated Statements of Income.
35

TABLE OF CONTENTS
Consumer Products & Interactive Media
Operating results for the Consumer Products & Interactive Media segment are as follows:
Year Ended % ChangeBetter /(Worse)(in millions) October 1, 2016 October 3, 2015
Revenues Licensing, publishing and games $ 3,819 $ 3,850 (1)% Retail and other 1,709 1,823 (6)%
Total revenues 5,528 5,673 (3)% Operating expenses (2,263) (2,434) 7 % Selling, general, administrative and other (1,125) (1,172) 4 % Depreciation and amortization (175) (183) 4 % Operating Income $ 1,965 $ 1,884 4 %
RevenuesThe decrease in licensing, publishing and games revenue was due to a 5% decrease from our games business, partially offset by a 4% increase from our
merchandise licensing business. Lower games revenues were due to the discontinuation of the Infinity business, lower performance of our Frozen Free Fall mobilegame and an unfavorable FX Impact, partially offset by revenues from Star Wars Battlefront, which was released by a licensee in the current year. Highermerchandise licensing revenues were primarily due to the performance of merchandise based on Star Wars and Finding Dory/Nemo, partially offset by higherrevenue share with the Studio Entertainment segment, a decrease in revenues from Frozen merchandise and an unfavorable FX Impact.
The decrease in retail and other revenue was primarily due to a decrease of 4% from our retail business due to lower comparable store sales in Europe andNorth America, an unfavorable Fiscal Period Impact and an unfavorable FX Impact, partially offset by the benefit of new stores in North America.
Costs and ExpensesOperating expenses included a $107 million decrease in cost of goods sold and distribution costs, from $1,447 million to $1,340 million , a $5 million
decrease in labor and occupancy costs, from $544 million to $539 million , and a $49 million decrease in product development expense, from $367 million to $ 318million . The decrease in cost of goods sold and distribution costs was due to the discontinuation of Infinity, lower Frozen Free Fall co-developer fees and afavorable Fiscal Period Impact, partially offset by higher average per unit costs at our retail business in North America and Europe and higher game inventoryreserves. The decrease in product development expense was due to the discontinuation of Infinity.
Selling, general, administrative and other costs decrease d $47 million from $1,172 million to $1,125 million due to the discontinuation of Infinity, partiallyoffset by higher marketing costs at our merchandise licensing business.
Segment Operating IncomeSegment operating income increase d 4% to $2.0 billion due to higher results at our merchandise licensing and games businesses, partially offset by a
decrease at our retail business.
Restructuring and impairment chargesThe Company recorded charges of $143 million, credits of $4 million and charges of $44 million for fiscal years 2016 , 2015 and 2014 , respectively.
Charges in fiscal 2016 included the Infinity Charge of $129 million, which was reported in “Cost of Products” in the Consolidated Statement of Income. Theremaining charges of $14 million in fiscal year 2016 and the charges in fiscal 2014 were primarily due to severance costs and were reported in “Restructuring andimpairment charges” in the Consolidated Statements of Income.
36

TABLE OF CONTENTS
BUSINESS SEGMENT RESULTS – 2015 vs. 2014
Media Networks
Operating results for the Media Networks segment are as follows:
Year Ended % ChangeBetter /(Worse)(in millions) October 3, 2015 September 27, 2014
Revenues Affiliate fees $ 12,029 $ 10,632 13 % Advertising 8,361 8,031 4 % TV/SVOD distribution and other 2,874 2,489 15 %
Total revenues 23,264 21,152 10 % Operating expenses (13,150) (11,794) (11)% Selling, general, administrative and other (2,869) (2,643) (9)% Depreciation and amortization (266) (250) (6)% Equity in the income of investees 814 856 (5)% Operating Income $ 7,793 $ 7,321 6 %
RevenuesThe 13% increase in affiliate fee revenue was due to an increase of 8% from higher contractual rates, 3% from an increase in subscribers, 2% from the
benefit of a favorable Fiscal Period Impact and 1% from new contractual provisions. These increases were partially offset by a decrease of 2% due to anunfavorable FX Impact. The increase in subscribers was due to the launch of the SEC Network in the fourth quarter of fiscal 2014, partially offset by a decline insubscribers at certain of our cable networks.
The 4% increase in advertising revenues was due to an increase of $206 million at Cable Networks, from $4,128 million to $4,334 million, and an increaseof $124 million at Broadcasting, from $3,903 million to $4,027 million. The increase at Cable Networks was due to a 3% increase from rates and 1% from thebenefit of a favorable Fiscal Period Impact. Impressions were relatively flat as a decrease in ratings was offset by an increase in units sold. The increase atBroadcasting was due to a 2% increase from network rates and a 2% increase from a favorable Fiscal Period Impact. Impressions is a measure of the number ofpeople an advertisement has reached.
TV/SVOD distribution and other revenue increase d $385 million from $ 2,489 million to $ 2,874 million due to higher SVOD sales in fiscal 2015.
Costs and ExpensesOperating expenses include programming and production costs, which increased $1,367 million from $10,610 million to $11,977 million. At Cable
Networks, programming and production costs increased $1,056 million primarily due to higher rights costs for NFL programming (including a wild card playoffgame) and college football, and the addition of the SEC Network, partially offset by the end of the NASCAR contract in the first quarter of fiscal 2015. AtBroadcasting, programming and production costs increased $311 million primarily due to higher program sales and an unfavorable Fiscal Period Impact.
Selling, general, administrative and other costs increase d $226 million from $ 2,643 million to $ 2,869 million driven by higher labor and marketing costs.
Equity in the Income of InvesteesIncome from equity investees decreased $42 million from $856 million to $814 million primarily due to a decrease at Hulu driven by higher programming
and marketing costs, partially offset by an increase at A+E. The increase at A+E was due to lower programming and marketing costs, partially offset by a decreasein advertising revenue.
Segment Operating IncomeSegment operating income increased 6% , or $472 million , to $7,793 million due to increases at the Disney Channels, ESPN, the owned television stations
and the ABC Television Network.
37

TABLE OF CONTENTS
The following table provides supplemental revenue and operating income detail for the Media Networks segment:
Year Ended % ChangeBetter /(Worse)(in millions) October 3, 2015 September 27, 2014
Revenues Cable Networks $ 16,581 $ 15,110 10% Broadcasting 6,683 6,042 11%
$ 23,264 $ 21,152 10% Segment operating income
Cable Networks $ 6,787 $ 6,467 5% Broadcasting 1,006 854 18%
$ 7,793 $ 7,321 6%
Other expense, netThe Company recorded a $100 million loss related to Media Networks in fiscal 2014 resulting from the foreign currency translation of net monetary assets
denominated in Venezuelan currency, which was reported in “Other expense, net” in the Consolidated Statements of Income.
Parks and Resorts
Operating results for the Parks and Resorts segment are as follows:
Year Ended % ChangeBetter /(Worse)(in millions) October 3, 2015 September 27, 2014
Revenues Domestic $ 13,611 $ 12,329 10 % International 2,551 2,770 (8)%
Total revenues 16,162 15,099 7 % Operating expenses (9,730) (9,106) (7)% Selling, general, administrative and other (1,884) (1,856) (2)% Depreciation and amortization (1,517) (1,472) (3)% Equity in the loss of investees — (2) 100 % Operating Income $ 3,031 $ 2,663 14 %
RevenuesParks and Resorts revenues increase d 7% , or $1.1 billion , to $16.2 billion due to an increase of $1.3 billion at our domestic operations, partially offset by a
decrease of $219 million at our international operations.
Revenue growth of 10% at our domestic operations reflected increases of 5% from higher volumes and 5% from higher average guest spending. Highervolumes were due to attendance growth and higher occupied room nights. Increased guest spending was primarily due to higher average ticket prices foradmissions at our theme parks and for sailings at our cruise line, increased food, beverage and merchandise spending and higher average hotel room rates.Revenues also benefited from a favorable Fiscal Period Impact.
Revenues at our international operations reflected an 11% decrease from foreign currency translation, partially offset by a 4% increase from higher averageguest spending. Guest spending growth was due to higher food, beverage and merchandise spending, an increase in average ticket prices and higher average hotelroom rates. Volumes at our international operations were essentially flat, as higher attendance and occupied room nights at Disneyland Paris were offset by lowerattendance and occupied room nights at Hong Kong Disneyland Resort.
38

TABLE OF CONTENTS
The following table presents supplemental attendance, per capita theme park guest spending and hotel statistics:
Domestic International (2) Total
Fiscal Year 2015 Fiscal Year 2014 Fiscal Year 2015 Fiscal Year 2014 Fiscal Year 2015 Fiscal Year 2014Parks
Increase/ (decrease) Attendance 7% 3% —% (3)% 5% 1%Per Capita Guest Spending 4% 7% 5% 7 % 4% 7%
Hotels (1) Occupancy 87% 83% 79% 78 % 86% 82%Available Room Nights (in thousands) 10,644 10,470 2,473 2,466 13,117 12,936Per Room Guest Spending $295 $280 $335 $328 $302 $289
(1) Per room guest spending consists of the average daily hotel room rate as well as guest spending on food, beverage and merchandise at the hotels. Hotelstatistics include rentals of Disney Vacation Club units.
(2) Per capita guest spending growth rate is stated on a constant currency basis. Per room guest spending is stated at the fiscal 2014 average foreign currencyexchange rate. The euro to U.S. dollar weighted average foreign currency exchange rate was $1.15 and $1.36 for fiscal years 2015 and 2014, respectively.
Costs and ExpensesOperating expenses include operating labor, which increased $ 347 million from $ 4,233 million to $ 4,580 million , cost of sales, which increased $ 80
million from $ 1,425 million to $ 1,505 million , and infrastructure costs, which increased $ 27 million from $ 1,854 million to $ 1,881 million . The increase inoperating labor was due to inflation, higher employee benefit costs and increased labor hours. The increase in employee benefit costs included higher pension andpostretirement medical costs. The increase in labor hours was driven by higher volumes and new guest offerings, such as the 60th Anniversary Celebration atDisneyland Resort. Higher cost of sales was due to volume growth and inflation. Infrastructure cost increases were driven by higher information technologyexpense and operations support costs, partially offset by costs incurred in fiscal 2014 in connection with the launch of MyMagic+ . Other operating expenses,which include costs for such items as supplies, commissions and entertainment offerings, increased primarily due to inflation, higher operations support costs andpre-opening costs for Shanghai Disney Resort. Operating expenses reflected a 2% decrease from a favorable FX Impact, partially offset by a 2% increase as aresult of an unfavorable Fiscal Period Impact, both of which had similar impacts on operating labor, cost of sales and infrastructure costs.
Selling, general, administrative and other costs increased $28 million from $1,856 million to $1,884 million primarily due to information technologyinitiatives, partially offset by a favorable FX Impact.
The increase in depreciation and amortization was driven by new attractions, partially offset by a favorable FX Impact.
Segment Operating IncomeSegment operating income increase d 14%, or $368 million , to $3.0 billion due to growth at our domestic operations, partially offset by a decrease at our
international operations.
39

TABLE OF CONTENTS
Studio Entertainment
Operating results for the Studio Entertainment segment are as follows:
Year Ended % ChangeBetter /(Worse)(in millions) October 3, 2015 September 27, 2014
Revenues Theatrical distribution $ 2,321 $ 2,431 (5)% Home entertainment 1,799 2,094 (14)% TV/SVOD distribution and other 3,246 2,753 18 %
Total revenues 7,366 7,278 1 % Operating expenses (3,050) (3,137) 3 % Selling, general, administrative and other (2,204) (2,456) 10 % Depreciation and amortization (139) (136) (2)% Operating Income $ 1,973 $ 1,549 27 %
RevenuesThe 5% decrease in theatrical distribution revenue was due to an unfavorable FX Impact and the impact of having no DreamWorks titles in fiscal 2015
compared to four in fiscal 2014. These decreases were partially offset by the performance of Inside Out and Big Hero 6 in fiscal 2015 compared to Frozen andPlanes: Fire and Rescue in fiscal 2014, as well as one additional Disney live-action release in fiscal 2015. Significant Disney live-action releases in fiscal 2015included Cinderella and Into the Woods , whereas fiscal 2014 included Maleficent. The performance of Avengers: Age of Ultron and Ant-Man in fiscal 2015 wascomparable to the fiscal 2014 performance of Guardians of the Galaxy , Captain America: The Winter Soldier and Thor: The Dark World .
The 14% decrease in home entertainment revenue was due to decreases of 9% from lower unit sales and 4% from lower average net effective pricing, both ofwhich reflected the strong performance of Frozen in fiscal 2014. Net effective pricing is the wholesale selling price adjusted for discounts, sales incentives andreturns.
The 18% increase in TV/SVOD distribution and other revenue was due to increases of 9% from higher revenue share with the Consumer Products &Interactive Media segment due to the success of merchandise based on Frozen and 7% from TV/SVOD distribution. TV/SVOD distribution revenue growth wasprimarily due to worldwide pay television, which included the benefit of more titles available domestically and sales of Star Wars titles internationally, along withgrowth from international SVOD sales.
Costs and ExpensesOperating expenses include a decrease of $12 million in film cost amortization, from $1,802 million to $1,790 million, primarily due to decreased film cost
impairments, partially offset by the impact of higher revenues and a higher average film cost amortization rate for theatrical releases in fiscal 2015 due to thesuccess of Frozen in fiscal 2014. Operating expenses also include cost of goods sold and distribution costs, which decreased $75 million, from $1,335 million to$1,260 million due to lower home entertainment per unit costs and unit sales.
Selling, general, administrative and other costs decrease d $252 million from $2,456 million to $2,204 million due to lower theatrical and home entertainmentmarketing expense. Lower theatrical marketing expense was primarily due to four DreamWorks titles in release in fiscal 2014 compared to none in fiscal 2015 anda favorable FX Impact. The decrease in home entertainment marketing expense was driven by spending on Monsters University in fiscal 2014 compared to noPixar title in fiscal 2015.
Segment Operating IncomeSegment operating income increased $424 million to $2.0 billion due to higher revenue share with the Consumer Products & Interactive Media segment,
increases in TV/SVOD and theatrical distribution and lower film cost impairments, partially offset by a decrease in home entertainment.
40

TABLE OF CONTENTS
Consumer Products & Interactive Media
Operating results for the Consumer Products & Interactive Media segment are as follows:
Year Ended % ChangeBetter /(Worse)(in millions) October 3, 2015 September 27, 2014
Revenues Licensing, publishing and games $ 3,850 $ 3,594 7 % Retail and other 1,823 1,690 8 %
Total revenues 5,673 5,284 7 % Operating expenses (2,434) (2,383) (2)% Selling, general, administrative and other (1,172) (1,238) 5 % Depreciation and amortization (183) (191) 4 % Operating Income $ 1,884 $ 1,472 28 %
RevenuesThe 7% increase in licensing, publishing and games revenues was due to a 9% increase from our merchandise licensing business, partially offset by a 2%
decrease from our games business. Higher merchandise licensing revenues were primarily due to the performance of merchandise based on Frozen , Avengers andStar Wars, partially offset by an unfavorable FX Impact. The decrease in games revenue was due to lower sales of catalog titles, Avengers Alliance and Infinity anda decrease in Club Penguin subscribers. These decreases were partially offset by the success of Tsum Tsum and Star Wars Commander in fiscal 2015.
The 8% increase in retail and other revenue was driven by a 9% increase from our retail business due to comparable store and online sales growth, growth inour wholesale distribution business and a favorable Fiscal Period Impact, partially offset by an unfavorable FX Impact.
Costs and ExpensesOperating expenses include an increase of $52 million in cost of goods sold and distribution costs, from $1,395 million to $1,447 million, a $3 million
increase in labor and occupancy costs, from $541 million to $544 million, and a $16 million decrease in product development expense, from $383 million to $367million. The increase in cost of goods sold and distribution costs was due to higher sales at our retail business and higher per unit costs and cost mix of Infinityproducts, partially offset by lower sales of catalog titles, a favorable FX Impact and lower third-party royalty expense at our merchandise licensing business. Thehigher per unit costs for Infinity included the impact of inventory obsolescence charges. Product development expense decreased due to fewer titles indevelopment.
Selling, general, administrative and other costs decreased $66 million from $1,238 million to $1,172 million driven by lower marketing costs and a favorableFX Impact. The decrease in marketing costs was primarily due to a decrease at our mobile phone business in Japan and fewer game titles in release, partially offsetby an increase at our merchandise licensing business.
Segment Operating IncomeSegment operating income increased 28% to $1,884 million due to an increase at our merchandise licensing business and, to a lesser extent, at our games and
retail businesses.
Other expense, netThe Company recorded a $16 million loss related to Consumer Products & Interactive Media in fiscal 2014 resulting from the foreign currency translation of
net monetary assets denominated in Venezuelan currency, which was reported in “Other expense, net” in the Consolidated Statements of Income.
41

TABLE OF CONTENTS
CORPORATE AND UNALLOCATED SHARED EXPENSES
Corporate and unallocated shared expenses are as follows:
% Change
Better/(Worse)
(in millions) 2016 2015 2014
2016 vs.
2015
2015 vs.
2014 Corporate and unallocated shared expenses $ (640) $ (643) $ (611) —% (5)%
Corporate and unallocated shared expenses in fiscal 2015 increased $32 million from fiscal 2014 due to higher labor costs.
PENSION AND POSTRETIREMENT MEDICAL BENEFIT COSTS
Pension and postretirement medical benefit plan costs affect results in all of our segments, with approximately 40% of these costs being borne by the Parksand Resorts segment. The Company recognized pension and postretirement medical benefit plan expenses of $319 million, $457 million and $309 million for fiscalyears 2016 , 2015 and 2014 , respectively. The decrease in fiscal 2016 was primarily due to a change in our approach to measuring service and interest costs (seeNote 10 to the Consolidated Financial Statements for further discussion of plan assumptions). This change does not affect the measurement of our plan obligationsnor the funded status of our plans.
In fiscal 2017 , we expect pension and postretirement medical costs to increase by $68 million to $387 million due to the impact of a lower assumed discountrate, partially offset by higher estimated investment income, which is driven by higher plan assets in fiscal 2017.
In fiscal 2016 , the underfunded status of our plans increased from $4.0 billion to $5.2 billion and the unrecognized expense increased from $3.9 billion ($2.5 billion after tax) to $5.8 billion ( $3.6 billion after tax) due to a lower assumed discount rate. If discount rates do not increase and/or our future investmentreturns do not exceed our long-term expected returns, a significant portion of the unrecognized expense will be recognized as a net actuarial loss in our incomestatement over approximately the next 9 years. See Note 10 to the Consolidated Financial Statements for further details of the impacts of our pension andpostretirement medical plans on our financial statements.
During fiscal 2016 , the Company contributed $900 million to its pension and postretirement medical plans. In the first quarter of fiscal 2017, we contributed$1.3 billion and do not expect to make any additional material contributions for the remainder of fiscal 2017. However, final minimum funding requirements forfiscal 2017 will be determined based on our January 1, 2017 funding actuarial valuation, which will be available in late fiscal 2017 . See “Item 1A – Risk Factors”for the impact of factors affecting pension and postretirement medical costs.
LIQUIDITY AND CAPITAL RESOURCES
The change in cash and cash equivalents is as follows:
(in millions) 2016 2015 2014Cash provided by operations $ 13,213 $ 10,909 $ 9,780Cash used in investing activities (5,758) (4,245) (3,345)Cash used in financing activities (6,991) (5,514) (6,710)Impact of exchange rates on cash and cash equivalents (123) (302) (235)Change in cash and cash equivalents $ 341 $ 848 $ (510)
Operating Activities
Cash provided by operating activities for fiscal 2016 increased 21% or $2.3 billion to $13.2 billion compared to fiscal 2015. The increase in operating cashflow was due to higher operating cash receipts at Studio Entertainment, Media Networks and Parks and Resorts driven by revenue growth. These increases werepartially offset by higher operating cash disbursements at Studio Entertainment and an increase in pension and postretirement medical plan contributions.
Cash provided by operating activities for fiscal 2015 increased 12% or $1.1 billion to $10.9 billion compared to fiscal 2014 driven by higher operating cashflow at our Media Networks and Studio Entertainment segments, partially offset by an
42

TABLE OF CONTENTS
increase in income taxes paid. Higher operating cash flow at Media Networks was due to increased operating receipts driven by affiliate fee growth, partially offsetby higher disbursements for operating expenses and sports programming costs. The increase in payments for sports programming costs was primarily due tocollege football, partially offset by the impact of a change in payment terms for certain sports rights in fiscal 2014. Studio Entertainment cash flow benefited fromlower operating cash disbursements driven by lower theatrical and home entertainment marketing expense.
Depreciation expense is as follows:
(in millions) 2016 2015 2014Media Networks
Cable Networks $ 147 $ 150 $ 145Broadcasting 90 95 93
Total Media Networks 237 245 238Parks and Resorts
Domestic 1,273 1,169 1,117International 445 345 353
Total Parks and Resorts 1,718 1,514 1,470Studio Entertainment 51 55 48Consumer Products & Interactive Media 63 69 69Corporate 251 249 239Total depreciation expense $ 2,320 $ 2,132 $ 2,064
Amortization of intangible assets is as follows:
(in millions) 2016 2015 2014Media Networks $ 18 $ 21 $ 12Parks and Resorts 3 3 2Studio Entertainment 74 84 88Consumer Products & Interactive Media 112 114 122Corporate — — —Total amortization of intangible assets $ 207 $ 222 $ 224
Film and Television CostsThe Company’s Studio Entertainment and Media Networks segments incur costs to acquire and produce feature film and television programming. Film and
television production costs include all internally produced content such as live-action and animated feature films, animated direct-to-video programming, televisionseries, television specials, theatrical stage plays or other similar product. Programming costs include film or television product licensed for a specific period fromthird parties for airing on the Company’s broadcast, cable networks and television stations. Programming assets are generally recorded when the programmingbecomes available to us with a corresponding increase in programming liabilities. Accordingly, we analyze our programming assets net of the related liability.
43

TABLE OF CONTENTS
The Company’s film and television production and programming activity for fiscal years 2016 , 2015 and 2014 are as follows:
(in millions) 2016 2015 2014Beginning balances:
Production and programming assets $ 7,353 $ 6,386 $ 5,417Programming liabilities (989) (875) (928)
6,364 5,511 4,489Spending:
Television program licenses and rights 6,585 6,335 6,241Film and television production 4,632 4,701 4,221
11,217 11,036 10,462Amortization:
Television program licenses and rights (6,678) (6,482) (5,678)Film and television production (4,438) (3,632) (3,820)
(11,116) (10,114) (9,498)Change in film and television production and
programming costs 101 922 964Other non-cash activity 19 (69) 58Ending balances:
Production and programming assets 7,547 7,353 6,386Programming liabilities (1,063) (989) (875)
$ 6,484 $ 6,364 $ 5,511
Investing Activities
Investing activities consist principally of investments in parks, resorts and other property and acquisition and divestiture activity. The Company’sinvestments in parks, resorts and other property for fiscal years 2016 , 2015 and 2014 are as follows:
(in millions) 2016 2015 2014Media Networks
Cable Networks $ 86 $ 127 $ 172Broadcasting 80 71 88
Parks and Resorts Domestic 2,180 1,457 1,184International 2,035 2,147 1,504
Studio Entertainment 86 107 63Consumer Products & Interactive Media 53 87 48Corporate 253 269 252
$ 4,773 $ 4,265 $ 3,311
Capital expenditures for the Parks and Resorts segment are principally for theme park and resort expansion, new attractions, cruise ships, capitalimprovements and systems infrastructure. The increase at our domestic parks and resorts in fiscal 2016 compared to fiscal 2015 was due to spending on newattractions at Walt Disney World Resort and Disneyland Resort, while the increase in fiscal 2015 compared to fiscal 2014 was driven by spending on newattractions at Walt Disney World Resort. The decrease in capital expenditures at our international parks and resorts in fiscal 2016 compared to fiscal 2015 was dueto lower spending at Shanghai Disney Resort, which opened in June 2016, partially offset by higher spending at Hong Kong Disneyland Resort, while the increasein fiscal 2015 compared to fiscal 2014 was due to higher spending for the Shanghai Disney Resort.
Capital expenditures at Media Networks primarily reflect investments in facilities and equipment for expanding and upgrading broadcast centers, productionfacilities and television station facilities.
Capital expenditures at Corporate primarily reflect investments in corporate facilities, information technology infrastructure and equipment.
44

TABLE OF CONTENTS
The Company currently expects its fiscal 2017 capital expenditures will be approximately $0.5 billion higher than fiscal 2016 capital expenditures of $4.8billion due to increased investments at our domestic parks and resorts partially offset by decreased investments at our international parks and resorts.
Other Investing ActivitiesDuring fiscal 2016, acquisitions totaled $850 million due to the acquisition of a 15% interest in BAMTech and an 11% interest in Vice. In addition, the
Company made $109 million of contributions to joint ventures and investment purchases and paid $74 million in premiums for foreign currency option contracts inconnection with our commitment to acquire two new cruise ships.
During fiscal 2015, contributions to joint ventures totaled $151 million and proceeds from the sale of investments and dispositions totaled $166 million.
During fiscal 2014, acquisitions totaled $402 million due to the acquisition of Maker Studios, and proceeds from the sales of investments and dispositions ofassets totaled $395 million.
Financing Activities
Cash used in financing activities was $ 7.0 billion in fiscal 2016 compared to $ 5.5 billion in fiscal 2015 . The net use of cash in the current year was due to$7.5 billion of common stock repurchases and $2.3 billion in dividends, partially offset by net borrowings of $2.9 billion .
Cash used in financing activities of $ 7.0 billion was $1.5 billion more than the cash used in fiscal 2015 . The increase in cash used in financing activitieswas driven by:
Increases due to:• Higher common stock repurchases of $1.4 billion ( $7.5 billion in the fiscal 2016 compared to $6.1 billion in fiscal 2015 )• Lower contributions from non-controlling interest holders (zero in fiscal 2016 compared to $1.0 billion in fiscal 2015 )Partially offset by decreases due to:• Lower dividend payments of $0.8 billion as a result of moving from an annual dividend to a semi-annual dividend. In fiscal 2015, we paid our full year
fiscal year 2014 dividend and the first half of the fiscal 2015 dividend. In the current year, we paid the dividend for the second half of fiscal 2015 and thefirst half of fiscal 2016.
• Higher net borrowings of $0.2 billion ( $2.9 billion in fiscal 2016 compared to $2.7 billion in fiscal 2015 )
Cash used in financing activities was $ 5.5 billion in fiscal 2015 compared to $6.7 billion in fiscal 2014 . The net use of cash in fiscal 2015 was due to $6.1billion of common stock repurchases and $3.1 billion in dividends, partially offset by net borrowings of $2.7 billion and contributions from noncontrolling interestholders of $1.0 billion .
Cash used in financing activities of $5.5 billion in fiscal 2015 was $1.2 billion lower than cash used in fiscal 2014. The decrease in cash used in financingactivities was driven by:
Decreases due to:• Higher net borrowings of $2.1 billion ( $2.7 billion in fiscal 2015 compared to $0.6 billion in fiscal 2014 )• Higher contributions from non-controlling interest holders ( $1.0 billion in fiscal 2015 compared to $0.6 billion in fiscal 2014 )Partially offset by an increase in dividend payments of $1.6 billion as a result of moving from an annual dividend to a semi-annual dividend and an increase
in the per share dividend related to fiscal 2014.
45

TABLE OF CONTENTS
During the year ended October 1, 2016 , the Company’s borrowing activity was as follows:
(in millions) October 3, 2015 Borrowings Payments Other
Activity October 1, 2016Commercial paper with original maturities less than threemonths, net (1) $ 2,330 $ — $ (1,559) $ 6 $ 777
Commercial paper with original maturities greater than threemonths 100 4,794 (4,155) 5 744
U.S. medium-term notes 13,873 4,948 (2,000) 6 16,827International Theme Parks borrowings (2) 319 896 — (128) 1,087Foreign currency denominated debt and other obligations (3) 714 221 (205) 5 735
Total $ 17,336 $ 10,859 $ (7,919) $ (106) $ 20,170
(1) Borrowings and reductions of borrowings are reported net.(2) The other activity is primarily the conversion of Hong Kong Disneyland Resort debt into equity and the impact of changes in foreign currency exchange
rates. See Note 6 to the Consolidated Financial Statements for further discussion of this transaction.(3) The other activity is primarily market value adjustments for debt with qualifying hedges.
See Note 8 to the Consolidated Financial Statements for information regarding the Company’s bank facilities. The Company may use commercial paperborrowings up to the amount of its unused bank facilities, in conjunction with term debt issuance and operating cash flow, to retire or refinance other borrowingsbefore or as they come due.
See Note 11 to the Consolidated Financial Statements for a summary of the Company’s dividends and share repurchases in fiscal 2016 , 2015 and 2014 .
We believe that the Company’s financial condition is strong and that its cash balances, other liquid assets, operating cash flows, access to debt and equitycapital markets and borrowing capacity, taken together, provide adequate resources to fund ongoing operating requirements and future capital expenditures relatedto the expansion of existing businesses and development of new projects. However, the Company’s operating cash flow and access to the capital markets can beimpacted by macroeconomic factors outside of its control. See “Item 1A – Risk Factors”. In addition to macroeconomic factors, the Company’s borrowing costscan be impacted by short- and long-term debt ratings assigned by independent rating agencies, which are based, in significant part, on the Company’s performanceas measured by certain credit metrics such as interest coverage and leverage ratios. As of October 1, 2016 , Moody’s Investors Service’s long- and short-term debtratings for the Company were A2 and P-1, respectively, with stable outlook; Standard & Poor’s long- and short-term debt ratings for the Company were A and A-1, respectively, with stable outlook; and Fitch’s long- and short-term debt ratings for the Company were A and F-1, respectively, with stable outlook. TheCompany’s bank facilities contain only one financial covenant, relating to interest coverage, which the Company met on October 1, 2016 , by a significant margin.The Company’s bank facilities also specifically exclude certain entities, including the International Theme Parks, from any representations, covenants or events ofdefault.
CONTRACTUAL OBLIGATIONS, COMMITMENTS AND OFF BALANCE SHEET ARRANGEMENTS
The Company has various contractual obligations, which are recorded as liabilities in our consolidated financial statements. Other items, such as certainpurchase commitments and other executory contracts are not recognized as liabilities in our consolidated financial statements but are required to be disclosed in thefootnotes to the financial statements. For example, the Company is contractually committed to acquire broadcast programming and make certain minimum leasepayments for the use of property under operating lease agreements.
46

TABLE OF CONTENTS
The following table summarizes our significant contractual obligations and commitments on an undiscounted basis at October 1, 2016 and the future periodsin which such obligations are expected to be settled in cash. In addition, the table reflects the timing of principal and interest payments on outstanding borrowingsbased on their contractual maturities. Additional details regarding these obligations are provided in the Notes to the Consolidated Financial Statements, asreferenced in the table:
Payments Due by Period
(in millions) Total Less than
1 Year 1-3
Years 4-5
Years More than
5 YearsBorrowings (Note 8) (1) $ 26,985 $ 4,176 $ 5,484 $ 3,781 $ 13,544Operating lease commitments (Note 14) 3,106 477 705 505 1,419Capital lease obligations (Note 14) 601 35 41 30 495Sports programming commitments (Note 14) 48,693 5,761 11,697 12,296 18,939Broadcast programming commitments (Note 14) 2,317 358 539 434 986
Total sports and other broadcast programming commitments 51,010 6,119 12,236 12,730 19,925Other (2) 6,647 1,880 1,508 692 2,567
Total contractual obligations (3) $ 88,349 $ 12,687 $ 19,974 $ 17,738 $ 37,950
(1) Amounts exclude market value adjustments totaling $146 million , which are recorded in the balance sheet. Amounts include interest payments based oncontractual terms for fixed rate debt and on current interest rates for variable rate debt. In 2023, the Company has the ability to call a debt instrument priorto its scheduled maturity, which if exercised by the Company would reduce future interest payments by $1.1 billion.
(2) Other commitments primarily comprise contractual commitments for the construction of two new cruise ships, creative talent and employmentagreements and unrecognized tax benefits. Creative talent and employment agreements include obligations to actors, producers, sports, television andradio personalities and executives.
(3) Contractual commitments include the following:
Liabilities recorded on the balance sheet $ 20,807Commitments not recorded on the balance sheet 67,542
$ 88,349
The Company also has obligations with respect to its pension and postretirement medical benefit plans. See Note 10 to the Consolidated FinancialStatements.
Contingent Commitments and Contractual GuaranteesSee Notes 3, 6 and 14 to the Consolidated Financial Statements for information regarding the Company’s contingent commitments and contractual
guarantees.
Legal and Tax MattersAs disclosed in Notes 9 and 14 to the Consolidated Financial Statements, the Company has exposure for certain tax and legal matters.
CRITICAL ACCOUNTING POLICIES AND ESTIMATES
We believe that the application of the following accounting policies, which are important to our financial position and results of operations requiresignificant judgments and estimates on the part of management. For a summary of our significant accounting policies, including the accounting policies discussedbelow, see Note 2 to the Consolidated Financial Statements.
Film and Television Revenues and CostsWe expense film and television production, participation and residual costs over the applicable product life cycle based upon the ratio of the current period’srevenues to the estimated remaining total revenues (Ultimate Revenues) for each production. If our estimate of Ultimate Revenues decreases, amortization of filmand television costs may be accelerated. Conversely, if our estimate of Ultimate Revenues increases, film and television cost amortization may be slowed. For filmproductions, Ultimate Revenues include revenues from all sources that will be earned within ten years from the date of the initial theatrical release.
47

TABLE OF CONTENTS
For television series, Ultimate Revenues include revenues that will be earned within ten years from delivery of the first episode, or if still in production, five yearsfrom delivery of the most recent episode, if later.
With respect to films intended for theatrical release, the most sensitive factor affecting our estimate of Ultimate Revenues (and therefore affecting future filmcost amortization and/or impairment) is theatrical performance. Revenues derived from other markets subsequent to the theatrical release (e.g., the homeentertainment or television markets) have historically been highly correlated with the theatrical performance. Theatrical performance varies primarily based uponthe public interest and demand for a particular film, the popularity of competing films at the time of release and the level of marketing effort. Upon a film’s releaseand determination of the theatrical performance, the Company’s estimates of revenues from succeeding windows and markets are revised based on historicalrelationships and an analysis of current market trends. The most sensitive factor affecting our estimate of Ultimate Revenues for released films is the level ofexpected home entertainment sales. Home entertainment sales vary based on the number and quality of competing home entertainment products, as well as themanner in which retailers market and price our products.
With respect to television series or other television productions intended for broadcast, the most sensitive factors affecting estimates of Ultimate Revenuesare program ratings and the strength of the advertising market. Program ratings, which are an indication of market acceptance, directly affect the Company’s abilityto generate advertising revenues during the airing of the program. In addition, television series with greater market acceptance are more likely to generateincremental revenues through the licensing of program rights worldwide to television distributors, SVOD services and in home entertainment formats.Alternatively, poor ratings may result in cancellation of the program, which would require an immediate write-down of any unamortized production costs. Asignificant decline in the advertising market would also negatively impact our estimates.
We expense the cost of television broadcast rights for acquired series, movies and other programs based on the number of times the program is expected tobe aired or on a straight-line basis over the useful life, as appropriate. Amortization of those television programming assets being amortized on a number of airingsbasis may be accelerated if we reduce the estimated future airings and slowed if we increase the estimated future airings. The number of future airings of aparticular program is impacted primarily by the program’s ratings in previous airings, expected advertising rates and availability and quality of alternativeprogramming. Accordingly, planned usage is reviewed periodically and revised if necessary. We amortize rights costs for multi-year sports programmingarrangements during the applicable seasons based on the estimated relative value of each year in the arrangement. The estimated value of each year is based on ourprojections of revenues over the contract period, which include advertising revenue and an allocation of affiliate revenue. If the annual contractual paymentsrelated to each season approximate each season’s estimated relative value, we expense the related contractual payments during the applicable season. If plannedusage patterns or estimated relative values by year were to change significantly, amortization of our sports rights costs may be accelerated or slowed.
Costs of film and television productions are subject to regular recoverability assessments, which compare the estimated fair values with the unamortizedcosts. The net realizable values of television broadcast program licenses and rights are reviewed using a daypart methodology. A daypart is defined as anaggregation of programs broadcast during a particular time of day or programs of a similar type. The Company’s dayparts are: primetime, daytime, late night, newsand sports (includes broadcast and cable networks). The net realizable values of other cable programming assets are reviewed on an aggregated basis for each cablenetwork. Individual programs are written off when there are no plans to air or sublicense the program. Estimated values are based upon assumptions about futuredemand and market conditions. If actual demand or market conditions are less favorable than our projections, film, television and programming cost write-downsmay be required.
Revenue RecognitionThe Company has revenue recognition policies for its various operating segments that are appropriate to the circumstances of each business. See Note 2 to
the Consolidated Financial Statements for a summary of these revenue recognition policies.
We reduce home entertainment and game revenues for estimated future returns of merchandise and for customer programs and sales incentives. Theseestimates are based upon historical return experience, current economic trends and projections of customer demand for and acceptance of our products. If weunderestimate the level of returns or sales incentives in a particular period, we may record less revenue in later periods when returns or sales incentives exceed theestimated amount. Conversely, if we overestimate the level of returns or sales incentives for a period, we may have additional revenue in later periods when returnsor sales incentives are less than estimated.
We recognize revenues from advance theme park ticket sales when the tickets are used. We recognize revenues from expiring multi-use tickets ratably overthe estimated usage period. The estimated usage periods are derived from historical
48

TABLE OF CONTENTS
usage patterns. If actual usage is different than our estimated usage, revenues may not be recognized in the periods the related services are rendered. In addition, achange in usage patterns would impact the timing of revenue recognition.
Pension and Postretirement Medical Plan Actuarial AssumptionsThe Company’s pension and postretirement medical benefit obligations and related costs are calculated using a number of actuarial assumptions. Two critical
assumptions, the discount rate and the expected return on plan assets, are important elements of expense and/or liability measurement, which we evaluate annually.Other assumptions include the healthcare cost trend rate and employee demographic factors such as retirement patterns, mortality, turnover and rate ofcompensation increase.
The discount rate enables us to state expected future cash payments for benefits as a present value on the measurement date. A lower discount rate increasesthe present value of benefit obligations and increases pension expense. The guideline for setting this rate is a high-quality long-term corporate bond rate. Wedecreased our discount rate to 3.73% at the end of fiscal 2016 from 4.47% at the end of fiscal 2015 to reflect market interest rate conditions at our fiscal 2016 yearend measurement date. The Company’s discount rate was determined by considering yield curves constructed of a large population of high-quality corporate bondsand reflects the matching of plans’ liability cash flows to the yield curves. A one percentage point decrease in the assumed discount rate would increase totalbenefit expense for fiscal 2017 by approximately $271 million and would increase the projected benefit obligation at October 1, 2016 by approximately $2.9billion . A one percentage point increase in the assumed discount rate would decrease total benefit expense and the projected benefit obligation by approximately$235 million and $2.4 billion , respectively.
To determine the expected long-term rate of return on the plan assets, we consider the current and expected asset allocation as well as historical and expectedreturns on each plan asset class. Our expected return on plan assets is 7.50%. A lower expected rate of return on pension plan assets will increase pension expense.A one percentage point change in the long-term asset return assumption would impact fiscal 2017 annual benefit expense by approximately $123 million .
For fiscal 2016, we changed the approach we used to determine the service and interest cost components of pension and other postretirement benefit expense.See Note 10 to the Consolidated Financial Statements for more information on our pension and postretirement medical plans.
Goodwill, Other Intangible Assets, Long-Lived Assets and InvestmentsThe Company is required to test goodwill and other indefinite-lived intangible assets for impairment on an annual basis and if current events or
circumstances require, on an interim basis. Goodwill is allocated to various reporting units, which are generally an operating segment or one level below theoperating segment. The Company compares the fair value of each reporting unit to its carrying amount to determine if there is a potential goodwill impairment. Ifthe fair value of a reporting unit is less than its carrying value, an impairment loss is recorded to the extent that the fair value of the goodwill within the reportingunit is less than the carrying value of the goodwill.
To determine the fair value of our reporting units, we generally use a present value technique (discounted cash flows) corroborated by market multiples whenavailable and as appropriate. We apply what we believe to be the most appropriate valuation methodology for each of our reporting units. The discounted cash flowanalyses are sensitive to our estimates of future revenue growth and margins for these businesses. We include in the projected cash flows an estimate of therevenue we believe the reporting unit would receive if the intellectual property developed by the reporting unit that is being used by other reporting units waslicensed to an unrelated third party at its fair market value. These amounts are not necessarily the same as those included in segment operating results. We believeour estimates of fair value are consistent with how a marketplace participant would value our reporting units.
In times of adverse economic conditions in the global economy, the Company’s long-term cash flow projections are subject to a greater degree of uncertaintythan usual. If we had established different reporting units or utilized different valuation methodologies or assumptions, the impairment test results could differ, andwe could be required to record impairment charges.
The Company is required to compare the fair values of other indefinite-lived intangible assets to their carrying amounts. If the carrying amount of anindefinite-lived intangible asset exceeds its fair value, an impairment loss is recognized for the excess. Fair values of other indefinite-lived intangible assets aredetermined based on discounted cash flows or appraised values, as appropriate.
The Company tests long-lived assets, including amortizable intangible assets, for impairment whenever events or changes in circumstances (triggeringevents) indicate that the carrying amount may not be recoverable. Once a triggering event has occurred, the impairment test employed is based on whether theintent is to hold the asset for continued use or to hold the asset for sale. The impairment test for assets held for use requires a comparison of cash flows expected tobe generated over the useful life of an asset group to the carrying value of the asset group. An asset group is established by identifying the lowest
49

TABLE OF CONTENTS
level of cash flows generated by a group of assets that are largely independent of the cash flows of other assets and could include assets used across multiplebusinesses or segments. If the carrying value of an asset group exceeds the estimated undiscounted future cash flows, an impairment would be measured as thedifference between the fair value of the group’s long-lived assets and the carrying value of the group’s long-lived assets. The impairment is allocated to the long-lived assets of the group on a pro rata basis using the relative carrying amounts, but only to the extent the carrying value of each asset is above its fair value. Forassets held for sale, to the extent the carrying value is greater than the asset’s fair value less costs to sell, an impairment loss is recognized for the difference.Determining whether a long-lived asset is impaired requires various estimates and assumptions, including whether a triggering event has occurred, theidentification of the asset groups, estimates of future cash flows and the discount rate used to determine fair values. If we had established different asset groups orutilized different valuation methodologies or assumptions, the impairment test results could differ, and we could be required to record impairment charges.
The Company has cost and equity investments. The fair value of these investments is dependent on the performance of the investee companies as well asvolatility inherent in the external markets for these investments. In assessing the potential impairment of these investments, we consider these factors as well as theforecasted financial performance of the investees and market values, where available. If these forecasts are not met or market values indicate an other-than-temporary decline in value, impairment charges may be required.
The Company tested its goodwill and other indefinite-lived intangible assets, investments and long-lived assets for impairment and recorded non-cashimpairment charges of $7 million , $10 million and $46 million in fiscal years 2016, 2015 and 2014, respectively. The fiscal 2014 impairment charges related toradio FCC licenses held by businesses in the Media Networks segment. The fair values of the radio FCC licenses were derived from market transactions. Theseimpairment charges were recorded in “Restructuring and impairment charges” in the Consolidated Statements of Income.
Allowance for Doubtful AccountsWe evaluate our allowance for doubtful accounts and estimate collectability of accounts receivable based on our analysis of historical bad debt experience in
conjunction with our assessment of the financial condition of individual companies with which we do business. In times of domestic or global economic turmoil,our estimates and judgments with respect to the collectability of our receivables are subject to greater uncertainty than in more stable periods. If our estimate ofuncollectible accounts is too low, costs and expenses may increase in future periods, and if it is too high, costs and expenses may decrease in future periods.
Contingencies and LitigationWe are currently involved in certain legal proceedings and, as required, have accrued estimates of the probable and estimable losses for the resolution of
these proceedings. These estimates are based upon an analysis of potential results, assuming a combination of litigation and settlement strategies and have beendeveloped in consultation with outside counsel as appropriate. From time to time, we may also be involved in other contingent matters for which we have accruedestimates for a probable and estimable loss. It is possible, however, that future results of operations for any particular quarterly or annual period could be materiallyaffected by changes in our assumptions or the effectiveness of our strategies related to legal proceedings or our assumptions regarding other contingent matters.See Note 14 to the Consolidated Financial Statements for more detailed information on litigation exposure.
Income Tax AuditsAs a matter of course, the Company is regularly audited by federal, state and foreign tax authorities. From time to time, these audits result in proposed
assessments. Our determinations regarding the recognition of income tax benefits are made in consultation with outside tax and legal counsel, where appropriate,and are based upon the technical merits of our tax positions in consideration of applicable tax statutes and related interpretations and precedents and upon theexpected outcome of proceedings (or negotiations) with taxing and legal authorities. The tax benefits ultimately realized by the Company may differ from thoserecognized in our future financial statements based on a number of factors, including the Company’s decision to settle rather than litigate a matter, relevant legalprecedent related to similar matters and the Company’s success in supporting its filing positions with taxing authorities.
New Accounting PronouncementsSee Note 18 to the Consolidated Financial Statements for information regarding new accounting pronouncements.
FORWARD-LOOKING STATEMENTS
The Private Securities Litigation Reform Act of 1995 provides a safe harbor for forward-looking statements made by or on behalf of the Company. We mayfrom time to time make written or oral statements that are “forward-looking,” including statements contained in this report and other filings with the SEC and inreports to our shareholders. Such statements may, for
50

TABLE OF CONTENTS
example, express expectations or projections about future actions that we may take, including restructuring or strategic initiatives, or about developments beyondour control including changes in domestic or global economic conditions. These statements are made on the basis of management’s views and assumptions as ofthe time the statements are made and we undertake no obligation to update these statements. There can be no assurance, however, that our expectations willnecessarily come to pass. Significant factors affecting these expectations are set forth under Item 1A – Risk Factors of this Report on Form 10-K.
ITEM 7A. Quantitative and Qualitative Disclosures About Market Risk
The Company is exposed to the impact of interest rate changes, foreign currency fluctuations, commodity fluctuations and changes in the market values of itsinvestments.
Policies and Procedures
In the normal course of business, we employ established policies and procedures to manage the Company’s exposure to changes in interest rates, foreigncurrencies and commodities using a variety of financial instruments.
Our objectives in managing exposure to interest rate changes are to limit the impact of interest rate volatility on earnings and cash flows and to lower overallborrowing costs. To achieve these objectives, we primarily use interest rate swaps to manage net exposure to interest rate changes related to the Company’sportfolio of borrowings. By policy, the Company targets fixed-rate debt as a percentage of its net debt between minimum and maximum percentages.
Our objective in managing exposure to foreign currency fluctuations is to reduce volatility of earnings and cash flow in order to allow management to focuson core business issues and challenges. Accordingly, the Company enters into various contracts that change in value as foreign exchange rates change to protect theU.S. dollar equivalent value of its existing foreign currency assets, liabilities, commitments and forecasted foreign currency revenues and expenses. The Companyutilizes option strategies and forward contracts that provide for the purchase or sale of foreign currencies to hedge probable, but not firmly committed, transactions.The Company also uses forward and option contracts to hedge foreign currency assets and liabilities. The principal foreign currencies hedged are the euro, Britishpound, Japanese yen and Canadian dollar. Cross-currency swaps are used to effectively convert foreign currency denominated borrowings to U.S. dollardenominated borrowings. By policy, the Company maintains hedge coverage between minimum and maximum percentages of its forecasted foreign exchangeexposures generally for periods not to exceed four years. The gains and losses on these contracts offset changes in the U.S. dollar equivalent value of the relatedexposures. The economic or political conditions in a country could reduce our ability to hedge exposure to currency fluctuations in the country or our ability torepatriate revenue from the country.
Our objectives in managing exposure to commodity fluctuations are to use commodity derivatives to reduce volatility of earnings and cash flows arisingfrom commodity price changes. The amounts hedged using commodity swap contracts are based on forecasted levels of consumption of certain commodities, suchas fuel oil and gasoline.
It is the Company’s policy to enter into foreign currency and interest rate derivative transactions and other financial instruments only to the extent considerednecessary to meet its objectives as stated above. The Company does not enter into these transactions or any other hedging transactions for speculative purposes.
Value at Risk (VAR)
The Company utilizes a VAR model to estimate the maximum potential one-day loss in the fair value of its interest rate, foreign exchange, commodities andmarket sensitive equity financial instruments. The VAR model estimates were made assuming normal market conditions and a 95% confidence level. Variousmodeling techniques can be used in a VAR computation. The Company’s computations are based on the interrelationships between movements in various interestrates, currencies, commodities and equity prices (a variance/co-variance technique). These interrelationships were determined by observing interest rate, foreigncurrency, commodity and equity market changes over the preceding quarter for the calculation of VAR amounts at each fiscal quarter end. The model includes allof the Company’s debt as well as all interest rate and foreign exchange derivative contracts, commodities and market sensitive equity investments. Forecastedtransactions, firm commitments, and accounts receivable and payable denominated in foreign currencies, which certain of these instruments are intended to hedge,were excluded from the model.
The VAR model is a risk analysis tool and does not purport to represent actual losses in fair value that will be incurred by the Company, nor does it considerthe potential effect of favorable changes in market factors.
VAR on a combined basis increased to $113 million at October 1, 2016 from $109 million at October 3, 2015 .
51

TABLE OF CONTENTS
The estimated maximum potential one-day loss in fair value, calculated using the VAR model, is as follows (unaudited, in millions):
Fiscal Year 2016
Interest RateSensitiveFinancial
Instruments
CurrencySensitiveFinancial
Instruments
Equity SensitiveFinancial
Instruments
CommoditySensitive Financial
Instruments CombinedPortfolio
Year end fiscal 2016 VAR $ 74 $ 60 $ 3 $ 2 $ 113Average VAR $ 69 $ 65 $ 1 $ 3 $ 99Highest VAR $ 76 $ 73 $ 3 $ 5 $ 113Lowest VAR $ 52 $ 60 $ 1 $ 2 $ 88Year end fiscal 2015 VAR $ 65 $ 64 $ 2 $ 3 $ 109
The VAR for Disneyland Paris, Hong Kong Disneyland Resort and Shanghai Disney Resort is immaterial as of October 1, 2016 and accordingly has beenexcluded from the above table.
ITEM 8. Financial Statements and Supplementary Data
See Index to Financial Statements and Supplemental Data on page 58.
ITEM 9. Changes in and Disagreements with Accountants on Accounting and Financial Disclosure
None.
ITEM 9A. Controls and Procedures
Evaluation of Disclosure Controls and Procedures
We have established disclosure controls and procedures to ensure that the information required to be disclosed by the Company in the reports that it files orsubmits under the Securities Exchange Act of 1934 is recorded, processed, summarized and reported within the time periods specified in SEC rules and forms andthat such information is accumulated and made known to the officers who certify the Company’s financial reports and to other members of senior management andthe Board of Directors as appropriate to allow timely decisions regarding required disclosure.
Based on their evaluation as of October 1, 2016 , the principal executive officer and principal financial officer of the Company have concluded that theCompany’s disclosure controls and procedures (as defined in Rules 13a-15(e) and 15d-15(e) under the Securities Exchange Act of 1934) are effective.
Management’s Report on Internal Control Over Financial Reporting
Management’s report set forth on page 59 is incorporated herein by reference.
Changes in Internal Controls
There have been no changes in our internal control over financial reporting during the fourth quarter of the fiscal year ended October 1, 2016 , that havematerially affected, or are reasonably likely to materially affect, our internal control over financial reporting.
ITEM 9B. Other Information
None.
52

TABLE OF CONTENTS
PART III
ITEM 10. Directors, Executive Officers and Corporate Governance
Information regarding Section 16(a) compliance, the Audit Committee, the Company’s code of ethics, background of the directors and director nominationsappearing under the captions “Section 16(a) Beneficial Ownership Reporting Compliance,” “Committees,” “Governing Documents,” “Director Selection Process”and “Election of Directors” in the Company’s Proxy Statement for the 2017 annual meeting of Shareholders is hereby incorporated by reference.
Information regarding executive officers is included in Part I of this Form 10-K as permitted by General Instruction G(3).
ITEM 11. Executive Compensation
Information appearing under the captions “Director Compensation,” “Compensation Discussion and Analysis” and “Compensation Tables” in the 2017Proxy Statement (other than the “Compensation Committee Report,” which is deemed furnished herein by reference) is hereby incorporated by reference.
ITEM 12. Security Ownership of Certain Beneficial Owners and Management and Related Stockholder Matters
Information setting forth the security ownership of certain beneficial owners and management appearing under the caption “Stock Ownership” andinformation appearing under the caption “Equity Compensation Plans” in the 2017 Proxy Statement is hereby incorporated by reference.
ITEM 13. Certain Relationships and Related Transactions, and Director Independence
Information regarding certain related transactions appearing under the captions “Certain Relationships and Related Person Transactions” and informationregarding director independence appearing under the caption “Director Independence” in the 2017 Proxy Statement is hereby incorporated by reference.
ITEM 14. Principal Accounting Fees and Services
Information appearing under the captions “Auditor Fees and Services” and “Policy for Approval of Audit and Permitted Non-Audit Services” in the 2017Proxy Statement is hereby incorporated by reference.
53

TABLE OF CONTENTS
PART IV
ITEM 15. Exhibits and Financial Statement Schedules
(1) Financial Statements and SchedulesSee Index to Financial Statements and Supplemental Data on page 58.
(2) Exhibits
The documents set forth below are filed herewith or incorporated herein by reference to the location indicated.
Exhibit Location3.1 Restated Certificate of Incorporation of the Company Filed herewith3.2
Bylaws of the Company
Exhibit 3.2 to the Current Report on Form 8-K of the Companyfiled June 29, 2016
4.1
Five-Year Credit Agreement dated as of March 14, 2014
Exhibit 10.12 to the Current Report on Form 8-K of the Company,filed March 20, 2014
4.2
Five-Year Credit Agreement dated as of March 11, 2016
Exhibit 10.2 to the Current Report on Form 8-K of the Companyfiled March 14, 2016
4.3
364 Day Credit Agreement dated as of March 11, 2016
Exhibit 10.1 to the Current Report on Form 8-K of the Companyfiled March 14, 2016
4.4
Senior Debt Securities Indenture, dated as of September 24, 2001,between the Company and Wells Fargo Bank, N.A., as Trustee
Exhibit 4.1 to the Current Report on Form 8-K of the Company,filed September 24, 2001
4.5
Other long-term borrowing instruments are omitted pursuant to Item601(b)(4)(iii) of Regulation S-K. The Company undertakes to furnishcopies of such instruments to the Commission upon request
10.1
Amended and Restated Employment Agreement, dated as of October 6,2011, between the Company and Robert A. Iger
Exhibit 10.1 to the Form 10-K of the Company for the fiscal yearended October 1, 2011
10.2
Amendment dated July 1, 2013 to Amended and Restated EmploymentAgreement, dated as of October 6, 2011, between the Company andRobert A. Iger
Exhibit 10.1 to the Current Report on Form 8-K of the Companyfiled July 1, 2013
10.3
Amendment dated October 2, 2014 to Amended and RestatedEmployment Agreement, dated as of October 6, 2011, between theCompany and Robert A. Iger
Exhibit 10.1 to the Current Report on Form 8-K of the Companyfiled October 3, 2014
10.4
Employment Agreement dated as of February 4, 2015 between theCompany and Thomas O. Staggs
Exhibit 10.1 to the Current Report on Form 8-K of the Companyfiled February 5, 2015
10.5
Employment Agreement, dated as of September 27, 2013 between theCompany and Alan N. Braverman
Exhibit 10.1 to the Current Report on Form 8-K of the Companyfiled October 2, 2013
10.6
Amendment dated February 4, 2015 to the Employment Agreementdated as of September 27, 2013 between the Company and Alan N.Braverman
Exhibit 10.2 to the Current Report on Form 8-K of the Companyfiled February 5, 2015
10.7
Employment Agreement dated as of July 1, 2015 between the Companyand Kevin A. Mayer
Exhibit 10.2 to the Current Report on Form 8-K of the Companyfiled June 30, 2015
10.8
Employment Agreement dated November 16, 2012 and effective as ofSeptember 1, 2012 between the Company and Jayne Parker
Exhibit 10.1 to the Form 10-K of the Company for the fiscal yearended September 29, 2012
10.9
Employment Agreement dated as of July 1, 2015 between the Companyand Christine M. McCarthy
Exhibit 10.1 to the Current Report on Form 8-K of the Companyfiled June 30, 2015
10.10
Voluntary Non-Qualified Deferred Compensation Plan
Exhibit 10.1 to the Current Report on Form 8-K of the Companyfiled December 23, 2014
10.11
Description of Directors Compensation
Exhibit 10.1 to the Form 10-Q of the Company for the quarterended July 2, 2016
10.12
Form of Indemnification Agreement for certain officers and directors
Annex C to the Proxy Statement for the 1987 annual meeting ofDEI
54

TABLE OF CONTENTS
Exhibit Location10.13
1995 Stock Option Plan for Non-Employee Directors
Exhibit 20 to the Form S-8 Registration Statement (No. 33-57811)of DEI, dated Feb. 23, 1995
10.14
Amended and Restated 2002 Executive Performance Plan
Annex A to the Proxy Statement for the 2013 Annual Meeting ofthe Registrant
10.15
Management Incentive Bonus Program
The portions of the tables labeled “Performance based Bonus” inthe sections of the Proxy Statement for the 2016 annual meeting ofthe Company titled “2015 Total Direct Compensation” and“Compensation Process” and the section of the Proxy Statementtitled “Performance Goals”
10.16
Amended and Restated 1997 Non-Employee Directors Stock andDeferred Compensation Plan
Annex II to the Proxy Statement for the 2003 annual meeting of theCompany
10.17
Amended and Restated The Walt Disney Company/Pixar 2004 EquityIncentive Plan
Exhibit 10.1 to the Current Report on Form 8-K of the Companyfiled December 1, 2006
10.18 Amended and Restated 2011 Stock Incentive Plan Exhibit 10.1 to the Form 8-K of the Company filed March 16, 201210.19
Disney Key Employees Retirement Savings Plan
Exhibit 10.1 to the Form 10-Q of the Company for the quarterended July 2, 2011
10.20
Amendments dated April 30, 2015 to the Amended and Restated TheWalt Disney Productions and Associated Companies Key EmployeesDeferred Compensation and Retirement Plan, Amended and RestatedBenefit Equalization Plan of ABC, Inc. and Disney Key EmployeesRetirement Savings Plan
Exhibit 10.3 to the Form 10-Q of the Company for the quarterended March 28, 2015
10.21
Group Personal Excess Liability Insurance Plan
Exhibit 10(x) to the Form 10-K of the Company for the periodended September 30, 1997
10.22
Amended and Restated Severance Pay Plan
Exhibit 10.4 to the Form 10-Q of the Company for the quarterended December 27, 2008
10.23
Form of Restricted Stock Unit Award Agreement (Time-Based Vesting)
Exhibit 10(aa) to the Form 10-K of the Company for the periodended September 30, 2004
10.24
Form of Performance-Based Stock Unit Award Agreement (Section162(m) Vesting Requirement)
Exhibit 10.2 to the Form 10-Q of the Company for the quarterended April 2, 2011
10.25
Form of Performance-Based Stock Unit Award Agreement (Three-YearVesting subject to Total Shareholder Return/EPS Growth Tests/Section 162(m) Vesting Requirement)
Exhibit 10.1 to the Current Report on Form 8-K of the Companyfiled January 11, 2013
10.26
Form of Non-Qualified Stock Option Award Agreement
Exhibit 10.4 to the Form 10-Q of the Company for the quarterended April 2, 2011
10.27
Disney Savings and Investment Plan as Amended and RestatedEffective January 1, 2010
Exhibit 10.1 to the Form 10-Q of the Company for the quarterended July 3, 2010
10.28
First Amendment dated December 13, 2011 to the Disney Savings andInvestment Plan as amended and restated effective January 1, 2010
Exhibit 10.1 to the Form 10-Q of the Company for the quarterended December 31, 2011
10.29
Second Amendment dated December 3, 2012 to the Disney Savings andInvestment Plan
Exhibit 10.2 to the Form 10-Q of the Company for the quarterended December 29, 2012
10.30
Third Amendment dated December 18, 2014 to the Disney Savings andInvestment Plan
Exhibit 10.4 to the Form 10-Q of the Company for the quarterended March 28, 2015
10.31
Fourth Amendment dated April 30, 2015 to the Disney Savings andInvestment Plan
Exhibit 10.5 to the Form 10-Q of the Company for the quarterended March 28, 2015
55

TABLE OF CONTENTS
Exhibit Location12.1 Ratio of earnings to fixed charges Filed herewith
21 Subsidiaries of the Company Filed herewith23 Consent of PricewaterhouseCoopers LLP Filed herewith
31(a)
Rule 13a-14(a) Certification of Chief Executive Officer of the Companyin accordance with Section 302 of the Sarbanes-Oxley Act of 2002
Filed herewith
31(b)
Rule 13a-14(a) Certification of Chief Financial Officer of the Companyin accordance with Section 302 of the Sarbanes-Oxley Act of 2002
Filed herewith
32(a)
Section 1350 Certification of Chief Executive Officer of the Companyin accordance with Section 906 of the Sarbanes-Oxley Act of 2002*
Furnished herewith
32(b)
Section 1350 Certification of Chief Financial Officer of the Company inaccordance with Section 906 of the Sarbanes-Oxley Act of 2002*
Furnished herewith
101
The following materials from the Company’s Annual Report on Form10-K for the year ended October 1, 2016 formatted in ExtensibleBusiness Reporting Language (XBRL): (i) the Consolidated Statementsof Income, (ii) the Consolidated Statements of Comprehensive Income,(iii) the Consolidated Balance Sheets, (iv) the Consolidated Statementsof Cash Flows, (v) the Consolidated Statements of Equity and(vi) related notes
Filed herewith
* A signed original of this written statement required by Section 906 has been provided to the Company and will be retained by the Company and furnished
to the SEC or its staff upon request.
56

TABLE OF CONTENTS
SIGNATURES
Pursuant to the requirements of Section 13 or 15(d) of the Securities Exchange Act of 1934, the registrant has duly caused this report to be signed on itsbehalf by the undersigned, thereunto duly authorized.
THE WALT DISNEY COMPANY (Registrant)
Date: November 23, 2016 By: /s/ ROBERT A. IGER (Robert A. Iger, Chairman and Chief Executive Officer)
Pursuant to the requirements of the Securities Exchange Act of 1934, this report has been signed below by the following persons on behalf of the registrantand in the capacities and on the dates indicated.
Signature Title Date Principal Executive Officer /s/ ROBERT A. IGER Chairman and Chief Executive Officer November 23, 2016(Robert A. Iger) Principal Financial and Accounting Officers /s/ CHRISTINE M. MCCARTHY Senior Executive Vice President
and Chief Financial Officer November 23, 2016
(Christine M. McCarthy) /s/ BRENT A. WOODFORD Executive Vice President-Controllership, Financial Planning
and Tax November 23, 2016
(Brent A. Woodford) Directors /s/ SUSAN E. ARNOLD Director November 23, 2016(Susan E. Arnold) /s/ JOHN S. CHEN Director November 23, 2016(John S. Chen) /s/ JACK DORSEY Director November 23, 2016(Jack Dorsey) /s/ ROBERT A. IGER Chairman of the Board and Director November 23, 2016(Robert A. Iger) /s/ MARIA ELENA LAGOMASINO Director November 23, 2016(Maria Elena Lagomasino) /s/ FRED H. LANGHAMMER Director November 23, 2016(Fred H. Langhammer) /s/ AYLWIN B. LEWIS Director November 23, 2016(Aylwin B. Lewis) /s/ ROBERT W. MATSCHULLAT Director November 23, 2016(Robert W. Matschullat) /s/ MARK G. PARKER Director November 23, 2016(Mark G. Parker) /s/ SHERYL SANDBERG Director November 23, 2016(Sheryl Sandberg) /s/ ORIN C. SMITH Director November 23, 2016(Orin C. Smith)
57

TABLE OF CONTENTS
THE WALT DISNEY COMPANY AND SUBSIDIARIESINDEX TO FINANCIAL STATEMENTS AND SUPPLEMENTAL DATA
PageManagement’s Report on Internal Control Over Financial Reporting 59Report of Independent Registered Public Accounting Firm 60Consolidated Financial Statements of The Walt Disney Company and Subsidiaries
Consolidated Statements of Income for the Years Ended October 1, 2016, October 3, 2015 and September 27, 2014 61Consolidated Statements of Comprehensive Income for the Years Ended October 1, 2016, October 3, 2015 and September 27, 2014 62Consolidated Balance Sheets as of October 1, 2016 and October 3, 2015 63Consolidated Statements of Cash Flows for the Years Ended October 1, 2016, October 3, 2015 and September 27, 2014 64Consolidated Statements of Shareholders’ Equity for the Years Ended October 1, 2016, October 3, 2015 and September 27, 2014 65
Notes to Consolidated Financial Statements 66Quarterly Financial Summary (unaudited) 106
All schedules are omitted for the reason that they are not applicable or the required information is included in the financial statements or notes.
58

TABLE OF CONTENTS
MANAGEMENT’S REPORT ON INTERNAL CONTROL OVER FINANCIAL REPORTING
Management is responsible for establishing and maintaining adequate internal control over financial reporting, as such term is defined in Exchange Act Rule13a-15(f). The Company’s internal control over financial reporting includes those policies and procedures that (i) pertain to the maintenance of records that, inreasonable detail, accurately and fairly reflect the transactions and dispositions of the assets of the Company; (ii) provide reasonable assurance that transactions arerecorded as necessary to permit preparation of financial statements in accordance with generally accepted accounting principles, and that receipts and expendituresof the Company are being made only in accordance with authorizations of management and directors of the Company; and (iii) provide reasonable assuranceregarding prevention or timely detection of unauthorized acquisition, use, or disposition of the Company’s assets that could have a material effect on the financialstatements.
Internal control over financial reporting is designed to provide reasonable assurance regarding the reliability of financial reporting and the preparation offinancial statements prepared for external purposes in accordance with generally accepted accounting principles. Because of its inherent limitations, internalcontrol over financial reporting may not prevent or detect misstatements. Also, projections of any evaluation of effectiveness to future periods are subject to therisk that controls may become inadequate because of changes in conditions, or that the degree of compliance with the policies or procedures may deteriorate.
Under the supervision and with the participation of management, including our principal executive officer and principal financial officer, we conducted anevaluation of the effectiveness of our internal control over financial reporting based on the framework in Internal Control - Integrated Framework issued by theCommittee of Sponsoring Organizations of the Treadway Commission in 2013. Based on our evaluation under the framework in Internal Control - IntegratedFramework, management concluded that our internal control over financial reporting was effective as of October 1, 2016 .
The effectiveness of our internal control over financial reporting as of October 1, 2016 has been audited by PricewaterhouseCoopers LLP, an independentregistered public accounting firm, as stated in their report, which is included herein.
59

TABLE OF CONTENTS
REPORT OF INDEPENDENT REGISTERED PUBLIC ACCOUNTING FIRM
To the Board of Directors and Shareholders of The Walt Disney Company
In our opinion, the accompanying consolidated balance sheets and the related consolidated statements of income, comprehensive income, shareholders’equity and cash flows present fairly, in all material respects, the financial position of The Walt Disney Company and its subsidiaries (the Company) at October 1,2016 and October 3, 2015 , and the results of their operations and their cash flows for each of the three years in the period ended October 1, 2016 in conformitywith accounting principles generally accepted in the United States of America. Also in our opinion, the Company maintained, in all material respects, effectiveinternal control over financial reporting as of October 1, 2016 , based on criteria established in Internal Control - Integrated Framework (2013) issued by theCommittee of Sponsoring Organizations of the Treadway Commission (COSO). The Company’s management is responsible for these financial statements, formaintaining effective internal control over financial reporting and for its assessment of the effectiveness of internal control over financial reporting, included in theaccompanying Management’s Report on Internal Control over Financial Reporting. Our responsibility is to express opinions on these financial statements and onthe Company’s internal control over financial reporting based on our integrated audits. We conducted our audits in accordance with the standards of the PublicCompany Accounting Oversight Board (United States).Those standards require that we plan and perform the audits to obtain reasonable assurance about whetherthe financial statements are free of material misstatement and whether effective internal control over financial reporting was maintained in all material respects.Our audits of the financial statements included examining, on a test basis, evidence supporting the amounts and disclosures in the financial statements, assessingthe accounting principles used and significant estimates made by management, and evaluating the overall financial statement presentation. Our audit of internalcontrol over financial reporting included obtaining an understanding of internal control over financial reporting, assessing the risk that a material weakness exists,and testing and evaluating the design and operating effectiveness of internal control based on the assessed risk. Our audits also included performing such otherprocedures as we considered necessary in the circumstances. We believe that our audits provide a reasonable basis for our opinions.
A company’s internal control over financial reporting is a process designed to provide reasonable assurance regarding the reliability of financial reportingand the preparation of financial statements for external purposes in accordance with generally accepted accounting principles. A company’s internal control overfinancial reporting includes those policies and procedures that (i) pertain to the maintenance of records that, in reasonable detail, accurately and fairly reflect thetransactions and dispositions of the assets of the company; (ii) provide reasonable assurance that transactions are recorded as necessary to permit preparation offinancial statements in accordance with generally accepted accounting principles, and that receipts and expenditures of the company are being made only inaccordance with authorizations of management and directors of the company; and (iii) provide reasonable assurance regarding prevention or timely detection ofunauthorized acquisition, use, or disposition of the company’s assets that could have a material effect on the financial statements.
Because of its inherent limitations, internal control over financial reporting may not prevent or detect misstatements. Also, projections of any evaluation ofeffectiveness to future periods are subject to the risk that controls may become inadequate because of changes in conditions, or that the degree of compliance withthe policies or procedures may deteriorate.
/s/PRICEWATERHOUSECOOPERS LLP
Los Angeles, CaliforniaNovember 23, 2016
60

TABLE OF CONTENTS
CONSOLIDATED STATEMENTS OF INCOME(in millions, except per share data)
2016 2015 2014Revenues:
Services $ 47,130 $ 43,894 $ 40,246Products 8,502 8,571 8,567
Total revenues 55,632 52,465 48,813Costs and expenses:
Cost of services (exclusive of depreciation and amortization) (24,653) (23,191) (21,356)Cost of products (exclusive of depreciation and amortization) (5,340) (5,173) (5,064)Selling, general, administrative and other (8,754) (8,523) (8,565)Depreciation and amortization (2,527) (2,354) (2,288)
Total costs and expenses (41,274) (39,241) (37,273)Restructuring and impairment charges (156) (53) (140)Other expense, net — — (31)Interest income/(expense), net (260) (117) 23Equity in the income of investees 926 814 854Income before income taxes 14,868 13,868 12,246Income taxes (5,078) (5,016) (4,242)Net income 9,790 8,852 8,004Less: Net income attributable to noncontrolling interests (399) (470) (503)Net income attributable to The Walt Disney Company (Disney) $ 9,391 $ 8,382 $ 7,501
Earnings per share attributable to Disney: Diluted $ 5.73 $ 4.90 $ 4.26
Basic $ 5.76 $ 4.95 $ 4.31
Weighted average number of common and common equivalent sharesoutstanding: Diluted 1,639 1,709 1,759
Basic 1,629 1,694 1,740
Dividends declared per share $ 1.42 $ 1.81 $ 0.86
See Notes to Consolidated Financial Statements
61

TABLE OF CONTENTS
CONSOLIDATED STATEMENTS OF COMPREHENSIVE INCOME(in millions)
2016 2015 2014Net Income $ 9,790 $ 8,852 $ 8,004Other comprehensive income/(loss), net of tax:
Market value adjustments for investments 13 (87) 5Market value adjustments for hedges (359) 130 121Pension and postretirement medical plan adjustments (1,154) (301) (925)Foreign currency translation and other (156) (272) (18)
Other comprehensive income/(loss) (1,656) (530) (817)Comprehensive income 8,134 8,322 7,187Less: Net income attributable to noncontrolling interests (399) (470) (503)Less: Other comprehensive (income)/loss attributable to noncontrolling interests 98 77 36Comprehensive income attributable to Disney $ 7,833 $ 7,929 $ 6,720
See Notes to Consolidated Financial Statements
62

TABLE OF CONTENTS
CONSOLIDATED BALANCE SHEETS(in millions, except per share data)
October 1, 2016 October 3, 2015ASSETS Current assets
Cash and cash equivalents $ 4,610 $ 4,269Receivables 9,065 8,019Inventories 1,390 1,571Television costs and advances 1,208 1,170Deferred income taxes — 767Other current assets 693 962
Total current assets 16,966 16,758Film and television costs 6,339 6,183Investments 4,280 2,643Parks, resorts and other property
Attractions, buildings and equipment 50,270 42,745Accumulated depreciation (26,849) (24,844)
23,421 17,901Projects in progress 2,684 6,028Land 1,244 1,250
27,349 25,179Intangible assets, net 6,949 7,172Goodwill 27,810 27,826Other assets 2,340 2,421
Total assets $ 92,033 $ 88,182LIABILITIES AND EQUITY Current liabilities
Accounts payable and other accrued liabilities $ 9,130 $ 7,844Current portion of borrowings 3,687 4,563Unearned royalties and other advances 4,025 3,927
Total current liabilities 16,842 16,334Borrowings 16,483 12,773Deferred income taxes 3,679 4,051Other long-term liabilities 7,706 6,369Commitments and contingencies (Note 14) Equity
Preferred stock, $.01 par value Authorized – 100 million shares, Issued – none — —Common stock, $.01 par value, Authorized – 4.6 billion shares, Issued – 2.9 billion shares at October 1,
2016 and 2.8 billion shares at October 3, 2015 35,859 35,122Retained earnings 66,088 59,028Accumulated other comprehensive loss (3,979) (2,421)
97,968 91,729Treasury stock, at cost, 1.3 billion shares at October 1, 2016 and 1.2 billion shares at October 3, 2015 (54,703) (47,204)
Total Disney Shareholders’ equity 43,265 44,525Noncontrolling interests 4,058 4,130
Total equity 47,323 48,655Total liabilities and equity $ 92,033 $ 88,182
See Notes to Consolidated Financial Statements
63

TABLE OF CONTENTS
CONSOLIDATED STATEMENTS OF CASH FLOWS(in millions)
2016 2015 2014OPERATING ACTIVITIES
Net income $ 9,790 $ 8,852 $ 8,004Depreciation and amortization 2,527 2,354 2,288Gains on sales of investments and dispositions (26) (91) (299)Deferred income taxes 1,214 (102) 517Equity in the income of investees (926) (814) (854)Cash distributions received from equity investees 799 752 718Net change in film and television costs and advances (101) (922) (964)Equity-based compensation 393 410 408Other 445 341 234Changes in operating assets and liabilities:
Receivables (393) (211) (480)Inventories 186 1 (81)Other assets (137) 34 (151)Accounts payable and other accrued liabilities 40 (49) 536Income taxes (598) 354 (96)
Cash provided by operations 13,213 10,909 9,780
INVESTING ACTIVITIES Investments in parks, resorts and other property (4,773) (4,265) (3,311)Sales of investments/proceeds from dispositions 45 166 395Acquisitions (850) — (402)Other (180) (146) (27)Cash used in investing activities (5,758) (4,245) (3,345)
FINANCING ACTIVITIES Commercial paper borrowings/(repayments), net (920) 2,376 50Borrowings 6,065 2,550 2,231Reduction of borrowings (2,205) (2,221) (1,648)Dividends (2,313) (3,063) (1,508)Repurchases of common stock (7,499) (6,095) (6,527)Proceeds from exercise of stock options 259 329 404Contributions from noncontrolling interest holders — 1,012 608Other (378) (402) (320)Cash used in financing activities (6,991) (5,514) (6,710)
Impact of exchange rates on cash and cash equivalents (123) (302) (235)
Change in cash and cash equivalents 341 848 (510)Cash and cash equivalents, beginning of year 4,269 3,421 3,931Cash and cash equivalents, end of year $ 4,610 $ 4,269 $ 3,421
Supplemental disclosure of cash flow information: Interest paid $ 395 $ 314 $ 310Income taxes paid $ 4,133 $ 4,396 $ 3,483
See Notes to Consolidated Financial Statements
64

TABLE OF CONTENTS
CONSOLIDATED STATEMENTS OF SHAREHOLDERS’ EQUITY(in millions)
Equity Attributable to Disney
Shares Common
Stock RetainedEarnings
AccumulatedOther
ComprehensiveIncome(Loss)
TreasuryStock
TotalDisneyEquity
Non-controllingInterests Total Equity
Balance at September 28, 2013 1,773 $ 33,440 $ 47,758 $ (1,187) $ (34,582) $ 45,429 $ 2,721 $ 48,150
Comprehensive income — — 7,501 (781) — 6,720 467 7,187
Equity compensation activity 18 844 — — — 844 — 844
Common stock repurchases (84) — — — (6,527) (6,527) — (6,527)
Dividends — 17 (1,525) — — (1,508) — (1,508)
Contributions — — — — — — 608 608
Distributions and other — — — — — — (576) (576)
Balance at September 27, 2014 1,707 $ 34,301 $ 53,734 $ (1,968) $ (41,109) $ 44,958 $ 3,220 $ 48,178
Comprehensive income — — 8,382 (453) — 7,929 393 8,322
Equity compensation activity 14 828 — — — 828 — 828
Common stock repurchases (60) — — — (6,095) (6,095) — (6,095)
Dividends — 24 (3,087) — — (3,063) — (3,063)
Contributions — — — — — — 1,012 1,012
Distributions and other — (31) (1) — — (32) (495) (527)
Balance at October 3, 2015 1,661 $ 35,122 $ 59,028 $ (2,421) $ (47,204) $ 44,525 $ 4,130 $ 48,655
Comprehensive income — — 9,391 (1,558) — 7,833 301 8,134
Equity compensation activity 10 726 — — — 726 — 726
Common stock repurchases (74) — — — (7,499) (7,499) — (7,499)
Dividends — 15 (2,328) — — (2,313) — (2,313)
Distributions and other — (4) (3) — — (7) (373) (380)
Balance at October 1, 2016 1,597 $ 35,859 $ 66,088 $ (3,979) $ (54,703) $ 43,265 $ 4,058 $ 47,323
See Notes to Consolidated Financial Statements
65
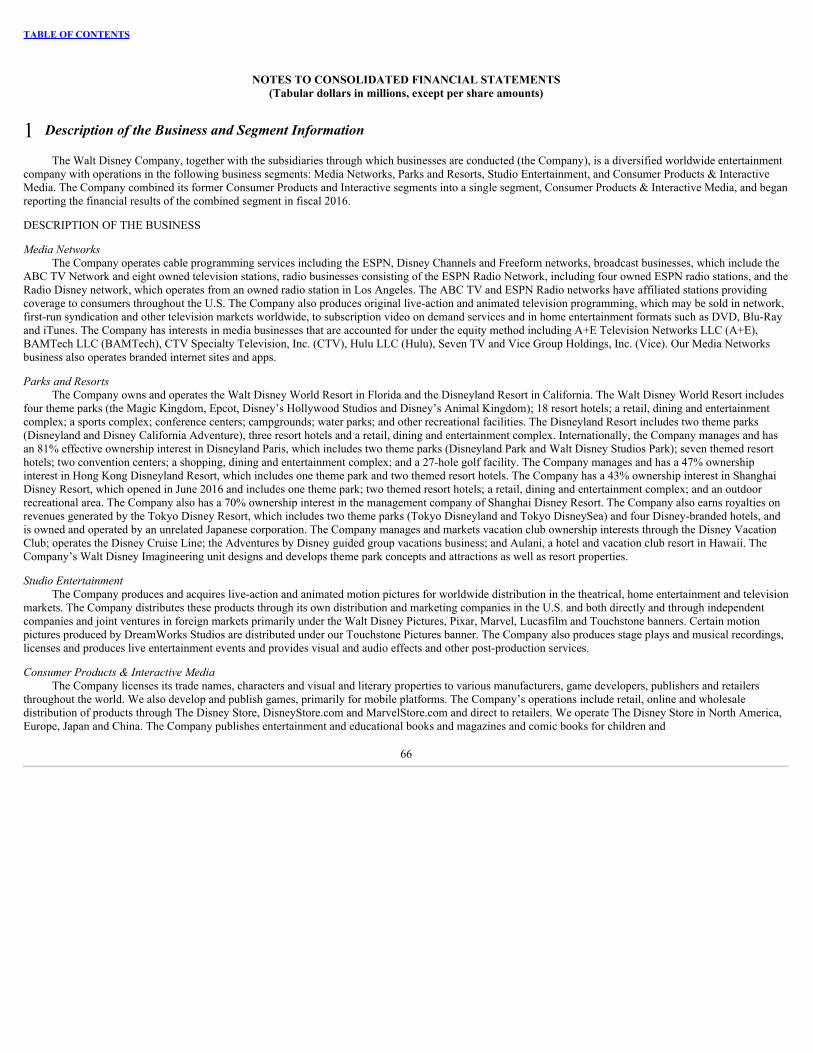
TABLE OF CONTENTS
NOTES TO CONSOLIDATED FINANCIAL STATEMENTS(Tabular dollars in millions, except per share amounts)
1 Description of the Business and Segment Information
The Walt Disney Company, together with the subsidiaries through which businesses are conducted (the Company), is a diversified worldwide entertainmentcompany with operations in the following business segments: Media Networks, Parks and Resorts, Studio Entertainment, and Consumer Products & InteractiveMedia. The Company combined its former Consumer Products and Interactive segments into a single segment, Consumer Products & Interactive Media, and beganreporting the financial results of the combined segment in fiscal 2016.
DESCRIPTION OF THE BUSINESS
Media NetworksThe Company operates cable programming services including the ESPN, Disney Channels and Freeform networks, broadcast businesses, which include the
ABC TV Network and eight owned television stations, radio businesses consisting of the ESPN Radio Network, including four owned ESPN radio stations, and theRadio Disney network, which operates from an owned radio station in Los Angeles. The ABC TV and ESPN Radio networks have affiliated stations providingcoverage to consumers throughout the U.S. The Company also produces original live-action and animated television programming, which may be sold in network,first-run syndication and other television markets worldwide, to subscription video on demand services and in home entertainment formats such as DVD, Blu-Rayand iTunes. The Company has interests in media businesses that are accounted for under the equity method including A+E Television Networks LLC (A+E),BAMTech LLC (BAMTech), CTV Specialty Television, Inc. (CTV), Hulu LLC (Hulu), Seven TV and Vice Group Holdings, Inc. (Vice). Our Media Networksbusiness also operates branded internet sites and apps.
Parks and ResortsThe Company owns and operates the Walt Disney World Resort in Florida and the Disneyland Resort in California. The Walt Disney World Resort includes
four theme parks (the Magic Kingdom, Epcot, Disney’s Hollywood Studios and Disney’s Animal Kingdom); 18 resort hotels; a retail, dining and entertainmentcomplex; a sports complex; conference centers; campgrounds; water parks; and other recreational facilities. The Disneyland Resort includes two theme parks(Disneyland and Disney California Adventure), three resort hotels and a retail, dining and entertainment complex. Internationally, the Company manages and hasan 81% effective ownership interest in Disneyland Paris, which includes two theme parks (Disneyland Park and Walt Disney Studios Park); seven themed resorthotels; two convention centers; a shopping, dining and entertainment complex; and a 27-hole golf facility. The Company manages and has a 47% ownershipinterest in Hong Kong Disneyland Resort, which includes one theme park and two themed resort hotels. The Company has a 43% ownership interest in ShanghaiDisney Resort, which opened in June 2016 and includes one theme park; two themed resort hotels; a retail, dining and entertainment complex; and an outdoorrecreational area. The Company also has a 70% ownership interest in the management company of Shanghai Disney Resort. The Company also earns royalties onrevenues generated by the Tokyo Disney Resort, which includes two theme parks (Tokyo Disneyland and Tokyo DisneySea) and four Disney-branded hotels, andis owned and operated by an unrelated Japanese corporation. The Company manages and markets vacation club ownership interests through the Disney VacationClub; operates the Disney Cruise Line; the Adventures by Disney guided group vacations business; and Aulani, a hotel and vacation club resort in Hawaii. TheCompany’s Walt Disney Imagineering unit designs and develops theme park concepts and attractions as well as resort properties.
Studio EntertainmentThe Company produces and acquires live-action and animated motion pictures for worldwide distribution in the theatrical, home entertainment and television
markets. The Company distributes these products through its own distribution and marketing companies in the U.S. and both directly and through independentcompanies and joint ventures in foreign markets primarily under the Walt Disney Pictures, Pixar, Marvel, Lucasfilm and Touchstone banners. Certain motionpictures produced by DreamWorks Studios are distributed under our Touchstone Pictures banner. The Company also produces stage plays and musical recordings,licenses and produces live entertainment events and provides visual and audio effects and other post-production services.
Consumer Products & Interactive MediaThe Company licenses its trade names, characters and visual and literary properties to various manufacturers, game developers, publishers and retailers
throughout the world. We also develop and publish games, primarily for mobile platforms. The Company’s operations include retail, online and wholesaledistribution of products through The Disney Store, DisneyStore.com and MarvelStore.com and direct to retailers. We operate The Disney Store in North America,Europe, Japan and China. The Company publishes entertainment and educational books and magazines and comic books for children and
66

TABLE OF CONTENTS
families and operates English language learning centers in China. In addition, the segment’s operations include website management and design, primarily forother Company businesses. We also develop and distribute online video content, which includes content developed by Maker Studios. Revenues and costsgenerated by Maker Studios have been allocated primarily to the Media Networks and Studio Entertainment segments.
SEGMENT INFORMATION
The operating segments reported below are the segments of the Company for which separate financial information is available and for which segment resultsare evaluated regularly by the Chief Executive Officer in deciding how to allocate resources and in assessing performance.
Segment operating results reflect earnings before corporate and unallocated shared expenses, restructuring and impairment charges, other expense, interestincome/(expense), income taxes and noncontrolling interests. Segment operating income includes equity in the income of investees. Corporate and unallocatedshared expenses principally consist of corporate functions, executive management and certain unallocated administrative support functions.
Equity in the income of investees included in segment operating results is as follows:
2016 2015 2014Media Networks
Cable Networks $ 783 $ 896 $ 895Broadcasting (186) (82) (39)
Parks and Resorts (3) — (2)Equity in the income of investees included in segment operating income $ 594 $ 814 $ 854Vice Gain 332 — —Total equity in the income of investees $ 926 $ 814 $ 854
During fiscal 2016 , the Company recognized its share of a net gain recorded by A+E, a joint venture owned 50% by the Company, in connection with A+E’sacquisition of an interest in Vice (Vice Gain). The Company’s $332 million share of the Vice Gain is recorded in “Equity in the income of investees” in theConsolidated Statement of Income but is not included in segment operating income. See Note 3 for further discussion of the transaction.
The following segment results include allocations of certain costs, including information technology, pension, legal and other shared services costs, whichare allocated based on metrics designed to correlate with consumption. These allocations are agreed-upon amounts between the businesses and may differ fromamounts that would be negotiated in arm’s length transactions. In addition, all significant intersegment transactions have been eliminated except that StudioEntertainment revenues and operating income include an allocation of Consumer Products & Interactive Media revenues, which is meant to reflect royalties onrevenue generated by Consumer Products & Interactive Media on merchandise based on intellectual property from certain Studio Entertainment films.
67
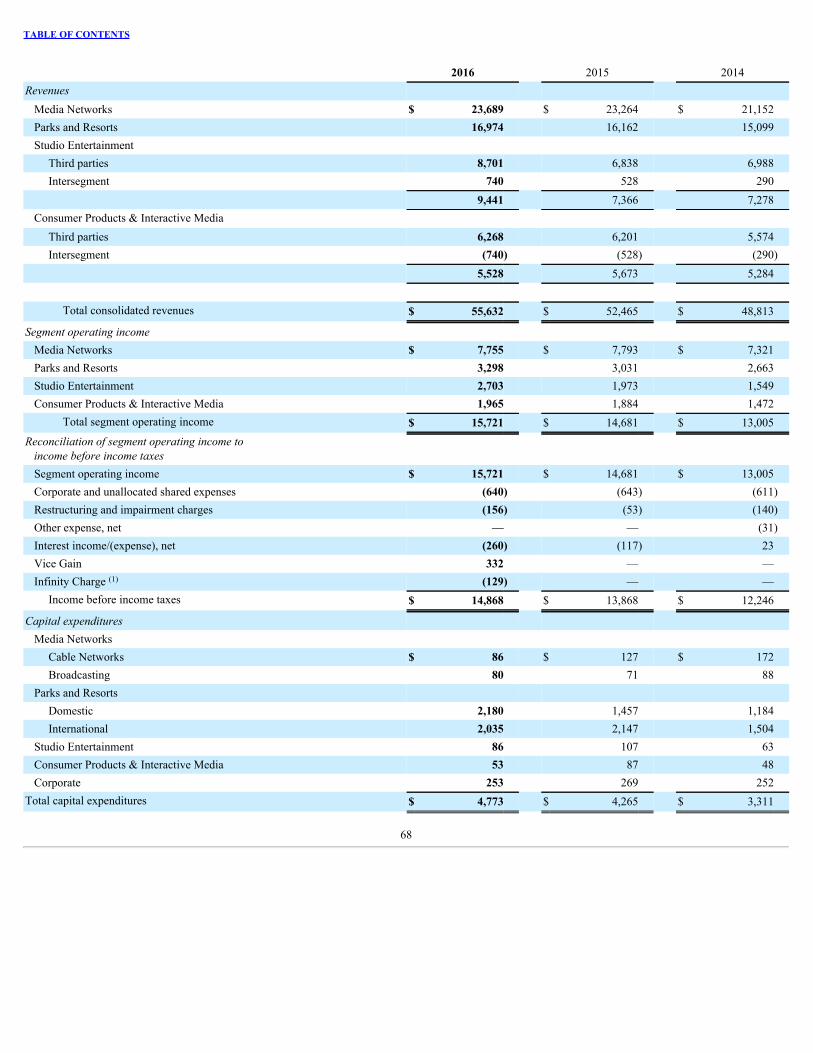
TABLE OF CONTENTS
2016 2015 2014Revenues
Media Networks $ 23,689 $ 23,264 $ 21,152Parks and Resorts 16,974 16,162 15,099Studio Entertainment
Third parties 8,701 6,838 6,988Intersegment 740 528 290
9,441 7,366 7,278Consumer Products & Interactive Media
Third parties 6,268 6,201 5,574Intersegment (740) (528) (290)
5,528 5,673 5,284
Total consolidated revenues $ 55,632 $ 52,465 $ 48,813
Segment operating income Media Networks $ 7,755 $ 7,793 $ 7,321Parks and Resorts 3,298 3,031 2,663Studio Entertainment 2,703 1,973 1,549Consumer Products & Interactive Media 1,965 1,884 1,472
Total segment operating income $ 15,721 $ 14,681 $ 13,005Reconciliation of segment operating income to income before income taxes
Segment operating income $ 15,721 $ 14,681 $ 13,005Corporate and unallocated shared expenses (640) (643) (611)Restructuring and impairment charges (156) (53) (140)Other expense, net — — (31)Interest income/(expense), net (260) (117) 23Vice Gain 332 — —Infinity Charge (1) (129) — —
Income before income taxes $ 14,868 $ 13,868 $ 12,246
Capital expenditures Media Networks
Cable Networks $ 86 $ 127 $ 172Broadcasting 80 71 88
Parks and Resorts Domestic 2,180 1,457 1,184International 2,035 2,147 1,504
Studio Entertainment 86 107 63Consumer Products & Interactive Media 53 87 48Corporate 253 269 252
Total capital expenditures $ 4,773 $ 4,265 $ 3,311
68

TABLE OF CONTENTS
2016 2015 2014Depreciation expense
Media Networks $ 237 $ 245 $ 238Parks and Resorts
Domestic 1,273 1,169 1,117International 445 345 353
Studio Entertainment 51 55 48Consumer Products & Interactive Media 63 69 69Corporate 251 249 239
Total depreciation expense $ 2,320 $ 2,132 $ 2,064
Amortization of intangible assets Media Networks $ 18 $ 21 $ 12Parks and Resorts 3 3 2Studio Entertainment 74 84 88Consumer Products & Interactive Media 112 114 122Corporate — — —
Total amortization of intangible assets $ 207 $ 222 $ 224
Identifiable assets (2) Media Networks $ 32,706 $ 30,638 Parks and Resorts 28,275 25,510 Studio Entertainment 15,359 15,334 Consumer Products & Interactive Media 9,332 9,678 Corporate (3) 6,361 7,022
Total consolidated assets $ 92,033 $ 88,182
Supplemental revenue data Affiliate fees $ 12,259 $ 12,029 $ 10,632Advertising 8,649 8,499 8,094Retail merchandise, food and beverage 6,116 5,986 5,598Theme park admissions 5,900 5,483 5,114
Revenues United States and Canada $ 42,616 $ 40,320 $ 36,769Europe 6,714 6,507 6,505Asia Pacific 4,582 3,958 3,930Latin America and Other 1,720 1,680 1,609
$ 55,632 $ 52,465 $ 48,813
Segment operating income United States and Canada $ 12,139 $ 10,820 $ 9,594Europe 1,815 1,964 1,581Asia Pacific 1,324 1,365 1,342Latin America and Other 443 532 488
$ 15,721 $ 14,681 $ 13,005
69

TABLE OF CONTENTS
2016 2015Long-lived assets (4)
United States and Canada $ 56,388 $ 53,976Europe 8,125 8,254Asia Pacific 8,228 6,817Latin America and Other 210 182
$ 72,951 $ 69,229(1) In fiscal 2016, the Company discontinued its Infinity console game business, which is reported in the Consumer Products & Interactive Media segment,
and recorded a charge primarily to write down inventory. The charge also included severance and other asset impairments. The charge was reported in“Cost of products” in the Consolidated Statement of Income.
(2) Identifiable assets include amounts associated with equity method investments, goodwill and intangible assets. Equity method investments by segment areas follows:
2016 2015Media Networks $ 4,032 $ 2,454Parks and Resorts 22 9Studio Entertainment 3 2Consumer Products & Interactive Media — 1Corporate 25 17
$ 4,082 $ 2,483
Goodwill and intangible assets by segment are as follows:
2016 2015Media Networks $ 18,153 $ 18,186Parks and Resorts 373 376Studio Entertainment 8,450 8,538Consumer Products & Interactive Media 7,653 7,768Corporate 130 130
$ 34,759 $ 34,998(3) Primarily fixed assets, cash and cash equivalents, deferred tax assets and investments.(4) Long-lived assets are total assets less the following: current assets, long-term receivables, deferred taxes, financial investments and derivatives.
2 Summary of Significant Accounting Policies
Principles of ConsolidationThe consolidated financial statements of the Company include the accounts of The Walt Disney Company and its majority-owned and controlled
subsidiaries. Intercompany accounts and transactions have been eliminated in consolidation.
The Company enters into relationships or investments with other entities that may be a variable interest entity (VIE). A VIE is consolidated in the financialstatements if the Company has the power to direct activities that most significantly impact the economic performance of the VIE and has the obligation to absorblosses or the right to receive benefits from the VIE that could potentially be significant to the VIE (as defined by ASC 810-10-25-38). Disneyland Paris, HongKong Disneyland Resort and Shanghai Disney Resort (collectively the International Theme Parks) are VIEs. Company subsidiaries (the Management Companies)have management agreements with the International Theme Parks, which provide the Management Companies, subject to certain protective rights of joint venturepartners, with the ability to direct the day-to-day operating activities and the development of business strategies that we believe most significantly impact theeconomic performance of the International Theme Parks. In addition, the Management Companies receive management fees under these arrangements that webelieve could be significant to the International Theme Parks. Therefore, the Company has consolidated the International Theme Parks in its financial statements.
70

TABLE OF CONTENTS
Reporting PeriodThe Company’s fiscal year ends on the Saturday closest to September 30 and consists of fifty-two weeks with the exception that approximately every six
years, we have a fifty-three week year. When a fifty-three week year occurs, the Company reports the additional week in the fourth quarter. Fiscal 2016 and 2014were fifty-two week years. Fiscal 2015 was a fifty-three week year.
ReclassificationsCertain reclassifications have been made in the fiscal 2015 and fiscal 2014 financial statements and notes to conform to the fiscal 2016 presentation.
Use of EstimatesThe preparation of financial statements in conformity with generally accepted accounting principles requires management to make estimates and
assumptions that affect the amounts reported in the financial statements and footnotes thereto. Actual results may differ from those estimates.
Revenues and Costs from Services and ProductsThe Company generates revenue from the sale of both services and tangible products and revenues and operating costs are classified under these two
categories in the Consolidated Statements of Income. Certain costs related to both the sale of services and tangible products are not specifically allocated betweenthe service or tangible product revenue streams but are instead attributed to the principal revenue stream. The cost of services and tangible products excludedepreciation and amortization.
Significant service revenues include:• Affiliate fees• Advertising revenues• Revenue from the licensing and distribution of film and television properties• Admissions to our theme parks, charges for room nights at hotels and sales of cruise vacation packages• Licensing of intellectual property for use on consumer merchandise, published materials and in multi-platform games
Significant operating costs related to the sale of services include:• Amortization of programming, production, participations and residuals costs• Distribution costs• Operating labor• Facilities and infrastructure costs
Significant tangible product revenues include:• The sale of food, beverage and merchandise at our retail locations• The sale of DVDs, Blu-ray discs and video game discs and accessories• The sale of books, comic books and magazines
Significant operating costs related to the sale of tangible products include:• Costs of goods sold• Amortization of programming, production, participations and residuals costs• Distribution costs• Operating labor• Retail occupancy costs• Game development costs
Revenue RecognitionTelevision advertising revenues are recognized when commercials are aired. Affiliate fee revenue is recognized as services are provided based on per
subscriber rates set out in agreements with Multi-channel Video Programming Distributors (MVPD) and the number of subscribers reported by the MVPDs.
Revenues from advance theme park ticket sales are recognized when the tickets are used. Revenues from expiring multi-use tickets are recognized ratablyover the estimated usage period. The estimated usage periods are derived from historical usage patterns.
71

TABLE OF CONTENTS
Revenues from the theatrical distribution of motion pictures are recognized when motion pictures are exhibited. Revenues from home entertainment andvideo game sales, net of anticipated returns and customer incentives, are recognized on the later of the delivery date or the date that the product can be sold byretailers. Revenues from the licensing of feature films and television programming are recorded when the content is available for telecast by the licensee and whencertain other conditions are met. Revenues from the sale of electronic formats of feature films and television programming are recognized when the product isreceived by the consumer.
Merchandise licensing advances and guarantee royalty payments are recognized based on the contractual royalty rate when the licensed product is sold bythe licensee. Non-refundable advances and minimum guarantee royalty payments in excess of royalties earned are generally recognized as revenue at the end of thecontract period.
Revenues from our branded online and mobile operations are recognized as services are rendered. Advertising revenues at our internet operations orassociated with the distribution of our video content online are recognized when advertisements are viewed online.
Taxes collected from customers and remitted to governmental authorities are presented in the Consolidated Statements of Income on a net basis.
Allowance for Doubtful AccountsThe Company maintains an allowance for doubtful accounts to reserve for potentially uncollectible receivables. The allowance for doubtful accounts is
estimated based on our analysis of trends in overall receivables aging, specific identification of certain receivables that are at risk of not being paid, past collectionexperience and current economic trends.
Advertising ExpenseAdvertising costs are expensed as incurred. Advertising expense for fiscal years 2016 , 2015 and 2014 was $2.9 billion , $2.6 billion and $2.8 billion ,
respectively.
Cash and Cash EquivalentsCash and cash equivalents consist of cash on hand and marketable securities with original maturities of three months or less.
InvestmentsDebt securities that the Company has the positive intent and ability to hold to maturity are classified as “held-to-maturity” and reported at amortized cost.
Debt securities not classified as held-to-maturity and marketable equity securities are considered “available-for-sale” and recorded at fair value with unrealizedgains and losses included in accumulated other comprehensive income/(loss) (AOCI). All other equity securities are accounted for using either the cost method orthe equity method.
The Company regularly reviews its investments to determine whether a decline in fair value below the cost basis is other-than-temporary. If the decline infair value is determined to be other-than-temporary, the cost basis of the investment is written down to fair value.
Translation PolicyThe U.S. dollar is the functional currency for the majority of our international operations. The local currency is the functional currency for the International
Theme Parks, international locations of The Disney Stores, our UTV businesses in India, our English language learning centers in China and certain internationalequity method investments.
For U.S. dollar functional currency locations, foreign currency assets and liabilities are remeasured into U.S. dollars at end-of-period exchange rates, exceptfor non-monetary balance sheet accounts, which are remeasured at historical exchange rates. Revenue and expenses are remeasured at average exchange rates ineffect during each period, except for those expenses related to the non-monetary balance sheet amounts, which are remeasured at historical exchange rates. Gainsor losses from foreign currency remeasurement are included in income.
For local currency functional locations, assets and liabilities are translated at end-of-period rates while revenues and expenses are translated at average ratesin effect during the period. Equity is translated at historical rates and the resulting cumulative translation adjustments are included as a component of AOCI.
InventoriesInventory primarily includes vacation timeshare units, merchandise, food, materials and supplies. Carrying amounts of vacation ownership units are recorded
at the lower of cost or net realizable value. Carrying amounts of merchandise, food, materials and supplies inventories are generally determined on a movingaverage cost basis and are recorded at the lower of cost or market.
72

TABLE OF CONTENTS
Film and Television CostsFilm and television costs include capitalizable production costs, production overhead, interest, development costs and acquired production costs and are
stated at the lower of cost, less accumulated amortization, or fair value. Acquired programming costs for the Company’s cable and broadcast television networksare stated at the lower of cost, less accumulated amortization, or net realizable value. Acquired television broadcast program licenses and rights are recorded whenthe license period begins and the program is available for use. Marketing, distribution and general and administrative costs are expensed as incurred.
Film and television production, participation and residual costs are expensed over the applicable product life cycle based upon the ratio of the currentperiod’s revenues to estimated remaining total revenues (Ultimate Revenues) for each production. For film productions, Ultimate Revenues include revenues fromall sources that will be earned within ten years from the date of the initial theatrical release. For television series, Ultimate Revenues include revenues that will beearned within ten years from delivery of the first episode, or if still in production, five years from delivery of the most recent episode, if later. For acquired filmlibraries, remaining revenues include amounts to be earned for up to twenty years from the date of acquisition. Costs of film and television productions are subjectto regular recoverability assessments, which compare the estimated fair values with the unamortized costs. The Company bases these fair value measurements onthe Company’s assumptions about how market participants would price the assets at the balance sheet date, which may be different than the amounts ultimatelyrealized in future periods. The amount by which the unamortized costs of film and television productions exceed their estimated fair values is written off. Filmdevelopment costs for projects that have been abandoned or have not been set for production within three years are generally written off.
The costs of television broadcast rights for acquired series, movies and other programs are expensed based on the number of times the program is expected tobe aired or on a straight-line basis over the useful life, as appropriate. Rights costs for multi-year sports programming arrangements are amortized during theapplicable seasons based on the estimated relative value of each year in the arrangement. The estimated value of each year is based on our projections of revenuesover the contract period, which include advertising revenue and an allocation of affiliate revenue. If the annual contractual payments related to each seasonapproximate each season’s estimated relative value, we expense the related contractual payments during the applicable season. Individual programs are written offwhen there are no plans to air or sublicense the program.
The net realizable values of network television broadcast program licenses and rights are reviewed for recoverability using a daypart methodology. A daypartis defined as an aggregation of programs broadcast during a particular time of day or programs of a similar type. The Company’s dayparts are: primetime, daytime,late night, news and sports (includes broadcast and cable networks). The net realizable values of other cable programming assets are reviewed on an aggregatedbasis for each cable network.
Internal-Use Software CostsThe Company expenses costs incurred in the preliminary project stage of developing or acquiring internal use software, such as research and feasibility
studies as well as costs incurred in the post-implementation/operational stage, such as maintenance and training. Capitalization of software development costsoccurs only after the preliminary-project stage is complete, management authorizes the project and it is probable that the project will be completed and the softwarewill be used for the function intended. As of October 1, 2016 and October 3, 2015 , capitalized software costs, net of accumulated depreciation, totaled $714million and $753 million , respectively. The capitalized costs are amortized on a straight-line basis over the estimated useful life of the software, ranging from 3 -10 years.
Software Product Development CostsSoftware product development costs incurred prior to reaching technological feasibility are expensed. We have determined that technological feasibility of
our video game software is generally not established until substantially all product development is complete.
Parks, Resorts and Other PropertyParks, resorts and other property are carried at historical cost. Depreciation is computed on the straight-line method over estimated useful lives as follows:
Attractions 25 – 40 yearsBuildings and improvements 20 – 40 yearsLeasehold improvements Life of lease or asset life if lessLand improvements 20 – 40 yearsFurniture, fixtures and equipment 3 – 25 years
73

TABLE OF CONTENTS
Goodwill, Other Intangible Assets and Long-Lived AssetsThe Company is required to test goodwill and other indefinite-lived intangible assets for impairment on an annual basis and if current events or
circumstances require, on an interim basis. Goodwill is allocated to various reporting units, which are generally an operating segment or one level below theoperating segment. The Company compares the fair value of each reporting unit to its carrying amount to determine if there is a potential goodwill impairment. Ifthe fair value of a reporting unit is less than its carrying value, an impairment loss is recorded to the extent that the fair value of the goodwill within the reportingunit is less than the carrying value of the goodwill.
To determine the fair value of our reporting units, we generally use a present value technique (discounted cash flows) corroborated by market multiples whenavailable and as appropriate. We apply what we believe to be the most appropriate valuation methodology for each of our reporting units. We include in theprojected cash flows an estimate of the revenue we believe the reporting unit would receive if the intellectual property developed by the reporting unit that is beingused by other reporting units was licensed to an unrelated third party at its fair market value. These amounts are not necessarily the same as those included insegment operating results.
In times of adverse economic conditions in the global economy, the Company’s long-term cash flow projections are subject to a greater degree of uncertaintythan usual. If we had established different reporting units or utilized different valuation methodologies or assumptions, the impairment test results could differ, andwe could be required to record impairment charges.
The Company is required to compare the fair values of other indefinite-lived intangible assets to their carrying amounts. If the carrying amount of anindefinite-lived intangible asset exceeds its fair value, an impairment loss is recognized for the excess. Fair values of other indefinite-lived intangible assets aredetermined based on discounted cash flows or appraised values, as appropriate. The Company has determined that there are currently no legal, competitive,economic or other factors that materially limit the useful life of our FCC licenses and trademarks.
Amortizable intangible assets are generally amortized on a straight-line basis over periods up to 40 years . The costs to periodically renew our intangibleassets are expensed as incurred.
The Company tests long-lived assets, including amortizable intangible assets, for impairment whenever events or changes in circumstances (triggeringevents) indicate that the carrying amount may not be recoverable. Once a triggering event has occurred, the impairment test employed is based on whether theintent is to hold the asset for continued use or to hold the asset for sale. The impairment test for assets held for use requires a comparison of cash flows expected tobe generated over the useful life of an asset group to the carrying value of the asset group. An asset group is established by identifying the lowest level of cashflows generated by a group of assets that are largely independent of the cash flows of other assets and could include assets used across multiple businesses orsegments. If the carrying value of an asset group exceeds the estimated undiscounted future cash flows, an impairment would be measured as the differencebetween the fair value of the group’s long-lived assets and the carrying value of the group’s long-lived assets. The impairment is allocated to the long-lived assetsof the group on a pro rata basis using the relative carrying amounts, but only to the extent the carrying value of each asset is above its fair value. For assets held forsale, to the extent the carrying value is greater than the asset’s fair value less costs to sell, an impairment loss is recognized for the difference.
The Company tested its goodwill and other indefinite-lived intangible assets, investments and long-lived assets for impairment and recorded non-cashimpairment charges of $7 million , $10 million and $46 million in fiscal years 2016, 2015 and 2014, respectively. The fiscal 2014 impairment charges related toradio FCC licenses held by businesses in the Media Networks segment. The fair values of the radio FCC licenses were derived from market transactions. Theseimpairment charges were recorded in “Restructuring and impairment charges” in the Consolidated Statements of Income.
The Company expects its aggregate annual amortization expense for existing amortizable intangible assets for fiscal years 2017 through 2021 to be asfollows:
2017 $ 1922018 1912019 1862020 1802021 175
74

TABLE OF CONTENTS
Risk Management ContractsIn the normal course of business, the Company employs a variety of financial instruments (derivatives) including interest rate and cross-currency swap
agreements and forward and option contracts to manage its exposure to fluctuations in interest rates, foreign currency exchange rates and commodity prices.
The Company formally documents all relationships between hedges and hedged items as well as its risk management objectives and strategies forundertaking various hedge transactions. The Company primarily enters into two types of derivatives: hedges of fair value exposure and hedges of cash flowexposure. Hedges of fair value exposure are entered into in order to hedge the fair value of a recognized asset, liability, or a firm commitment. Hedges of cash flowexposure are entered into in order to hedge a forecasted transaction (e.g. forecasted revenue) or the variability of cash flows to be paid or received, related to arecognized liability or asset (e.g. floating rate debt).
The Company designates and assigns the derivatives as hedges of forecasted transactions, specific assets or specific liabilities. When hedged assets orliabilities are sold or extinguished or the forecasted transactions being hedged occur or are no longer expected to occur, the Company recognizes the gain or loss onthe designated derivatives.
The Company’s hedge positions are measured at fair value on the balance sheet. Realized gains and losses from hedges are classified in the income statementconsistent with the accounting treatment of the items being hedged. The Company accrues the differential for interest rate swaps to be paid or received under theagreements as interest rates change as adjustments to interest expense over the lives of the swaps. Gains and losses on the termination of effective swapagreements, prior to their original maturity, are deferred and amortized to interest expense over the remaining term of the underlying hedged transactions.
The Company enters into derivatives that are not designated as hedges and do not qualify for hedge accounting. These derivatives are intended to offsetcertain economic exposures of the Company and are carried at fair value with changes in value recorded in earnings. Cash flows from hedging activities areclassified in the Consolidated Statements of Cash Flows under the same category as the cash flows from the related assets, liabilities or forecasted transactions (seeNotes 8 and 16).
Income TaxesDeferred income tax assets and liabilities are recorded with respect to temporary differences in the accounting treatment of items for financial reporting
purposes and for income tax purposes. Where, based on the weight of available evidence, it is more likely than not that some amount of recorded deferred taxassets will not be realized, a valuation allowance is established for the amount that, in management’s judgment, is sufficient to reduce the deferred tax asset to anamount that is more likely than not to be realized.
A tax position must meet a minimum probability threshold before a financial statement benefit is recognized. The minimum threshold is defined as a taxposition that is more likely than not to be sustained upon examination by the applicable taxing authority, including resolution of any related appeals or litigationprocesses, based on the technical merits of the position. The tax benefit to be recognized is measured as the largest amount of benefit that is greater than fiftypercent likely of being realized upon ultimate settlement.
Earnings Per ShareThe Company presents both basic and diluted earnings per share (EPS) amounts. Basic EPS is calculated by dividing net income attributable to Disney by
the weighted average number of common shares outstanding during the year. Diluted EPS is based upon the weighted average number of common and commonequivalent shares outstanding during the year, which is calculated using the treasury-stock method for equity-based awards (Awards). Common equivalent sharesare excluded from the computation in periods for which they have an anti-dilutive effect. Stock options for which the exercise price exceeds the average marketprice over the period are anti-dilutive and, accordingly, are excluded from the calculation.
A reconciliation of the weighted average number of common and common equivalent shares outstanding and the number of Awards excluded from thediluted earnings per share calculation, as they were anti-dilutive, are as follows:
2016 2015 2014Weighted average number of common and common equivalent shares outstanding
(basic) 1,629 1,694 1,740Weighted average dilutive impact of Awards 10 15 19Weighted average number of common and common equivalent shares outstanding
(diluted) 1,639 1,709 1,759
Awards excluded from diluted earnings per share 6 3 6
75

TABLE OF CONTENTS
3 Acquisitions
BAMTechIn August 2016, the Company acquired a 15% interest in BAMTech, an entity which holds Major League Baseball’s streaming technology and content
delivery businesses, for $450 million . The Company is committed to acquire an additional 18% interest for $557 million in January 2017. The Company accountsfor its interest in BAMTech as an equity method investment. In addition, the Company has an option to increase its ownership to 66% by acquiring additionalshares at fair market value from Major League Baseball between August 2020 and August 2023.
Vice/A+EVice is a media company targeting a millennial audience through news and pop culture content and creative brand integration. During fiscal 2016, A+E
acquired an 8% interest in Vice in exchange for a 49.9% interest in one of A+E’s cable channels, H2, which has been rebranded as Viceland and programmed withVice content. As a result of this exchange, A+E recognized a net non-cash gain based on the estimated fair value of H2. The Company’s share of the Vice Gaintotaled $332 million and was recorded in “Equity in the income of investees” in the Consolidated Statement of Income in fiscal 2016. At October 1, 2016 , A+Ehad a 20% interest in Vice.
In addition, during fiscal 2016, the Company acquired an 11% interest in Vice for $400 million of cash.
The Company accounts for its interests in A+E and Vice as equity method investments.
Maker StudiosOn May 7, 2014, the Company acquired Maker Studios, Inc. (Maker), a leading network of online video content, for approximately $500 million of cash
consideration. Maker shareholders were eligible to receive up to $450 million of additional cash upon Maker’s achievement of certain performance targets forcalendar years 2014 and 2015. At the date of the acquisition, the Company recorded a $198 million liability for the fair value of the contingent consideration(determined by a probability weighting of potential payouts). In fiscal 2015 and fiscal 2016, the Company paid $105 million and $70 million , respectively, for thecontingent consideration. The majority of the purchase price was allocated to goodwill, which is not deductible for tax purposes. Goodwill reflects the synergiesexpected from enhancing the presence of Disney’s franchises and brands through the use of Maker’s distribution platform, advanced technology and businessintelligence capability. The revenue and net income of Maker included in the Company’s Consolidated Statements of Income for fiscal years 2016, 2015 and 2014were not material.
HuluAt the end of fiscal 2015, the Company had a 33% interest in Hulu, a joint venture owned one-third each by the Company, Twenty-First Century Fox, Inc.
and Comcast Corporation. In August 2016, Time Warner, Inc. (TW) acquired a 10% interest in the venture from Hulu for $583 million diluting the Company’sownership interest to 30% , which results in a deemed sale by the Company. For not more than 36 months from August 2016, TW may put its shares to Hulu orHulu may call the shares from TW under certain limited circumstances arising from regulatory review. The Company and Twenty-First Century Fox, Inc. haveagreed to make a capital contribution for up to approximately $300 million each if required to fund the repurchase of shares from TW. The Company expects torecognize a gain of approximately $175 million associated with the deemed sale of a portion of its ownership interest in Hulu if the put and call options are notexercised.
In addition, the Company has guaranteed $113 million of Hulu’s $338 million term loan, which expires in October 2017.
The Company accounts for its interest in Hulu as an equity method investment.
76

TABLE OF CONTENTS
GoodwillThe changes in the carrying amount of goodwill for the years ended October 1, 2016 and October 3, 2015 are as follows:
Media
Networks Parks andResorts
StudioEntertainment
ConsumerProducts & Interactive
Media Total
Balance at Sept. 27, 2014 $ 16,378 $ 291 $ 6,856 $ 4,356 $ 27,881Acquisitions 3 — 2 — 5Dispositions — — — (1) (1)Other, net (27) — (22) (10) (59)
Balance at Oct. 3, 2015 $ 16,354 $ 291 $ 6,836 $ 4,345 $ 27,826Acquisitions 1 — 1 — 2Dispositions — — — — —Other, net (10) — (7) (1) (18)
Balance at Oct. 1, 2016 $ 16,345 $ 291 $ 6,830 $ 4,344 $ 27,810
4 Dispositions and Other Expense, net
Other expense, net is as follows:
2016 2015 2014Venezuelan foreign currency translation loss $ — $ — $ (143)Gain on sale of property and other — — 112
Other expense, net $ — $ — $ (31)
Venezuela foreign currency lossThe Company has operations in Venezuela, including film and television distribution and merchandise licensing and has net monetary assets denominated in
Venezuelan bolivares (BsF), which primarily consist of cash. The Venezuelan government (Government) has foreign currency exchange controls, which providedifferent exchange mechanisms that impact the Company’s ability to convert its BsF denominated monetary assets to U.S. dollars. During fiscal 2014, theGovernment launched a new currency exchange mechanism, and the Company began translating its BsF denominated net monetary assets at the rates determinedin this market resulting in a loss of $143 million reported in “Other expense, net” in the Consolidated Statement of Income. In fiscal 2015 and 2016, theGovernment introduced additional exchange mechanisms (including the Divisa Comercial “DICOM”) resulting in immaterial losses in those fiscal years, which areincluded in “Costs and expenses” in the Consolidated Statements of Income. At October 1, 2016, the Company translated its approximately 4.3 billion BsFdenominated net monetary assets using rates determined by the Venezuelan DICOM market ( 656 BsF per U.S. dollar).
Gain on sale of property and otherIn fiscal 2014, the Company recognized $83 million of gains primarily due to the sale of a property and $29 million for a portion of a settlement of an
affiliate contract dispute.
5 Investments
Investments consist of the following:
October 1,
2016 October 3,
2015Investments, equity basis $ 4,082 $ 2,483Investments, other 198 160
$ 4,280 $ 2,643
77
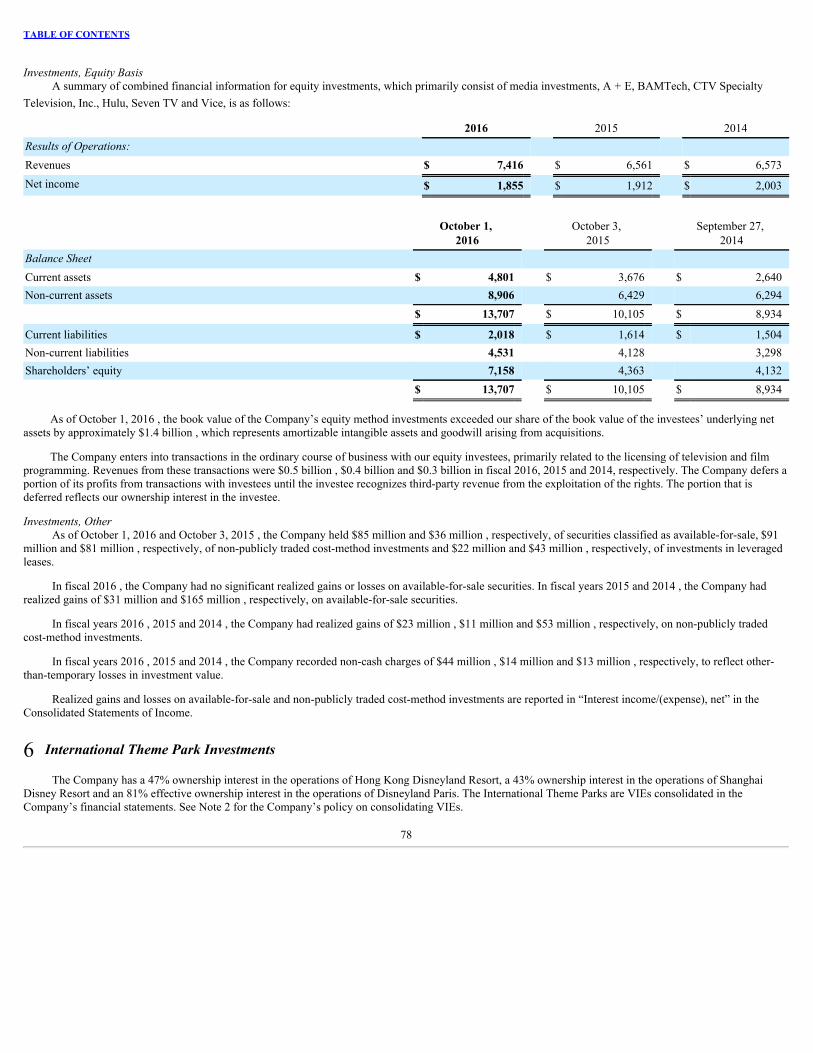
TABLE OF CONTENTS
Investments, Equity BasisA summary of combined financial information for equity investments, which primarily consist of media investments, A + E, BAMTech, CTV Specialty
Television, Inc., Hulu, Seven TV and Vice, is as follows:
2016 2015 2014Results of Operations: Revenues $ 7,416 $ 6,561 $ 6,573Net income $ 1,855 $ 1,912 $ 2,003
October 1,
2016 October 3,
2015 September 27,
2014Balance Sheet Current assets $ 4,801 $ 3,676 $ 2,640Non-current assets 8,906 6,429 6,294
$ 13,707 $ 10,105 $ 8,934
Current liabilities $ 2,018 $ 1,614 $ 1,504Non-current liabilities 4,531 4,128 3,298Shareholders’ equity 7,158 4,363 4,132
$ 13,707 $ 10,105 $ 8,934
As of October 1, 2016 , the book value of the Company’s equity method investments exceeded our share of the book value of the investees’ underlying netassets by approximately $1.4 billion , which represents amortizable intangible assets and goodwill arising from acquisitions.
The Company enters into transactions in the ordinary course of business with our equity investees, primarily related to the licensing of television and filmprogramming. Revenues from these transactions were $0.5 billion , $0.4 billion and $0.3 billion in fiscal 2016, 2015 and 2014, respectively. The Company defers aportion of its profits from transactions with investees until the investee recognizes third-party revenue from the exploitation of the rights. The portion that isdeferred reflects our ownership interest in the investee.
Investments, OtherAs of October 1, 2016 and October 3, 2015 , the Company held $85 million and $36 million , respectively, of securities classified as available-for-sale, $91
million and $81 million , respectively, of non-publicly traded cost-method investments and $22 million and $43 million , respectively, of investments in leveragedleases.
In fiscal 2016 , the Company had no significant realized gains or losses on available-for-sale securities. In fiscal years 2015 and 2014 , the Company hadrealized gains of $31 million and $165 million , respectively, on available-for-sale securities.
In fiscal years 2016 , 2015 and 2014 , the Company had realized gains of $23 million , $11 million and $53 million , respectively, on non-publicly tradedcost-method investments.
In fiscal years 2016 , 2015 and 2014 , the Company recorded non-cash charges of $44 million , $14 million and $13 million , respectively, to reflect other-than-temporary losses in investment value.
Realized gains and losses on available-for-sale and non-publicly traded cost-method investments are reported in “Interest income/(expense), net” in theConsolidated Statements of Income.
6 International Theme Park Investments
The Company has a 47% ownership interest in the operations of Hong Kong Disneyland Resort, a 43% ownership interest in the operations of ShanghaiDisney Resort and an 81% effective ownership interest in the operations of Disneyland Paris. The International Theme Parks are VIEs consolidated in theCompany’s financial statements. See Note 2 for the Company’s policy on consolidating VIEs.
78

TABLE OF CONTENTS
The following table summarizes the carrying amounts of the International Theme Parks’ assets and liabilities included in the Company’s consolidatedbalance sheets as of October 1, 2016 and October 3, 2015 :
International Theme Parks
October 1, 2016 October 3, 2015Cash and cash equivalents $ 1,008 $ 781Other current assets 331 252
Total current assets 1,339 1,033Parks, resorts and other property 9,270 7,748Other assets 88 62
Total assets $ 10,697 $ 8,843
Current liabilities $ 1,499 $ 1,027Borrowings - long-term 1,087 319Other long-term liabilities 256 195
Total liabilities $ 2,842 $ 1,541
The following table summarizes the International Theme Parks’ revenues and costs and expenses included in the Company’s consolidated statements ofincome as of October 1, 2016 :
October 1, 2016Revenues $ 2,455Costs and expenses (2,754)
Royalty and management fees from the International Theme Parks recognized by the Company totaled $148 million for fiscal 2016. Royalty andmanagement fees are eliminated in consolidation but are considered in calculating earnings allocated to noncontrolling interests.
Fiscal 2016 International Theme Parks’ cash flows included in the Company’s consolidated cash flow statement are $0.4 billion generated from operatingactivities, $2.1 billion used in investing activities and $0.9 billion generated from financing activities.
Disneyland ParisDuring calendar 2015, Disneyland Paris completed a recapitalization consisting of the following:• In February 2015, Disneyland Paris completed a €0.4 billion equity rights offering at €1.00 per share of which the Company funded €0.2 billion . The
Company purchased shares that were unsubscribed by other Disneyland Paris shareholders, which increased the Company’s effective ownership byapproximately four percentage points.
• In February 2015, the Company converted €0.6 billion of its loans to Disneyland Paris into equity at a conversion price of €1.25 per share. The conversionincreased the Company’s effective ownership by an additional 23 percentage points. In addition, Disneyland Paris repaid €0.3 billion that was outstandingunder then existing lines of credit from the Company. These lines of credit were replaced by a new €0.4 billion line of credit from the Company bearinginterest at EURIBOR plus 2% and maturing in 2023 .
• In September 2015, the Company completed a mandatory tender offer to the other Disneyland Paris shareholders and acquired €0.1 billion in shares at€1.25 per share, which increased the Company’s effective ownership by an additional eight percentage points.
• In November 2015, to offset the dilution caused by the loan conversion, Disneyland Paris shareholders purchased €0.05 billion in shares from theCompany at €1.25 per share, which decreased the Company’s effective ownership by four percentage points, resulting in an 81% effective ownershipinterest in Disneyland Paris.
As a result of the recapitalization, in fiscal 2015 the Company wrote off a $399 million deferred income tax asset (see Note 9).
The Company has term loans to Disneyland Paris with outstanding balances totaling €1.0 billion at October 1, 2016 bearing interest at a 4% fixed rate andmaturing in 2024. In addition, €130 million is outstanding under the line of credit at October 1, 2016 .
79

TABLE OF CONTENTS
The Company has waived payment of royalties and management fees for the fourth quarter of fiscal 2016 through the third quarter of fiscal 2018.
Hong Kong Disneyland ResortAt October 1, 2016 , the Government of the Hong Kong Special Administrative Region (HKSAR) and the Company had 53% and 47% equity interests in
Hong Kong Disneyland Resort, respectively. HKSAR has the right to receive additional shares over time to the extent Hong Kong Disneyland Resort exceedscertain return on asset performance targets. The amount of additional shares HKSAR can receive is capped on both an annual and cumulative basis and coulddecrease the Company’s equity interest by up to an additional 7 percentage points over a period no shorter than 16 years .
As part of financing the construction of a third hotel, which we expect to open in 2017, the Company contributed $113 million of equity in fiscal 2016.HKSAR also converted $113 million of a loan to equity, leaving a balance at October 1, 2016 of HK $0.4 billion ( $45 million ) (see Note 8 for further details ofthis loan). In addition, the Company and HKSAR have committed to provide additional loans up to $149 million and $104 million , respectively. At October 1,2016 , the additional loans provided by the Company and HKSAR are $116 million and $77 million , respectively, bearing interest at a rate of three month HIBORplus 2% and mature in September 2025.
The net impact to HKSAR and the Company’s ownership of Hong Kong Disneyland Resort during fiscal 2016 and 2015 as a result of the above activitieswas not material.
Shanghai Disney ResortShanghai Disney Resort is owned through two joint venture companies, in which Shanghai Shendi (Group) Co., Ltd (Shendi) owns 57% and the Company
owns 43% . A management company, in which the Company has a 70% interest and Shendi a 30% interest, is responsible for operating Shanghai Disney Resort.The investment in Shanghai Disney Resort has been funded in accordance with each shareholder’s ownership percentage, with approximately 67% from equitycontributions and 33% from shareholder loans.
The Company has provided Shanghai Disney Resort with term loans totaling $757 million , bearing interest at rates up to 8% and maturing in 2036. Inaddition, the Company has an outstanding balance of $318 million due from Shanghai Disney Resort related to development and pre-opening costs of the resort,which is anticipated to be paid by the end of 2018. The Company has also provided Shanghai Disney Resort with a $157 million line of credit bearing interest at8% . There is no outstanding balance under the line of credit at October 1, 2016.
Shendi has provided Shanghai Disney Resort with term loans totaling 6.4 billion yuan (approximately $1.0 billion ), bearing interest at rates up to 8% andmaturing in 2036; however, early repayment is permitted. Shendi has also provided Shanghai Disney Resort with a 1.4 billion yuan (approximately $205 million )line of credit bearing interest at 8% . There is no outstanding balance under the line of credit at October 1, 2016.
80

TABLE OF CONTENTS
7 Film and Television Costs and Advances
Film and television costs and advances are as follows:
October 1, 2016 October 3, 2015Theatrical film costs
Released, less amortization $ 1,677 $ 1,445Completed, not released — —In-process 2,179 2,499In development or pre-production 336 304
4,192 4,248Television costs
Released, less amortization 1,015 895Completed, not released 365 395In-process 417 352In development or pre-production 13 10
1,810 1,652Television programming rights and advances 1,545 1,453 7,547 7,353Less current portion 1,208 1,170Non-current portion $ 6,339 $ 6,183
Based on management’s total gross revenue estimates as of October 1, 2016 , approximately 79% of unamortized film and television costs for releasedproductions (excluding amounts allocated to acquired film and television libraries) are expected to be amortized during the next three years. By the end of fiscal2020, we will have reached on a cumulative basis, 80% amortization of the October 1, 2016 balance of unamortized film and television costs. Approximately $0.9billion of accrued participation and residual liabilities will be paid in fiscal year 2017 . The Company expects to amortize, based on current estimates,approximately $1.4 billion in capitalized film and television production costs during fiscal 2017 .
At October 1, 2016 , acquired film and television libraries have remaining unamortized costs of $200 million , which are generally amortized straight-lineover a weighted-average remaining period of approximately 14 years .
81

TABLE OF CONTENTS
8 Borrowings
The Company’s borrowings at October 1, 2016 and October 3, 2015 , including the impact of interest rate and cross-currency swaps, are summarized below:
2016
2016 2015
StatedInterestRate (1)
Pay FloatingInterest rate and
Cross-Currency Swaps
(2)
EffectiveInterestRate (3)
SwapMaturities
Commercial paper $ 1,521 $ 2,430 — $ — 0.54% U.S. medium-term notes (4) 16,827 13,873 2.80% 8,275 2.58% 2017-2026Foreign currency denominated debt 448 447 4.88% 249 4.83% 2017Capital Cities/ABC debt 107 108 8.75% — 6.01% Other (5) 180 159 — 19,083 17,017 2.66% 8,524 2.49% International Theme Parks borrowings 1,087 319 1.92% — 4.30% Total borrowings 20,170 17,336 2.62% 8,524 2.59% Less current portion 3,687 4,563 1.24% 1,500 1.47%
Total long-term borrowings $ 16,483 $ 12,773 $ 7,024 (1) The stated interest rate represents the weighted-average coupon rate for each category of borrowings. For floating rate borrowings, interest rates are the
rates in effect at October 1, 2016 ; these rates are not necessarily an indication of future interest rates.(2) Amounts represent notional values of interest rate and cross-currency swaps outstanding as of October 1, 2016 .(3) The effective interest rate includes the impact of existing and terminated interest rate and cross-currency swaps, purchase accounting adjustments and debt
issuance premiums, discounts and costs.(4) Includes net debt issuance premiums, discounts and costs totaling $132 million and $88 million at October 1, 2016 and October 3, 2015 , respectively.(5) Includes market value adjustments for debt with qualifying hedges totaling $146 million and $131 million at October 1, 2016 and October 3, 2015 ,
respectively.
Commercial PaperThe Company has bank facilities with a syndicate of lenders to support commercial paper borrowings as follows:
CommittedCapacity
CapacityUsed
UnusedCapacity
Facility expiring March 2017 $ 1,500 $ — $ 1,500Facility expiring March 2019 2,250 — 2,250Facility expiring March 2021 2,250 — 2,250
Total $ 6,000 $ — $ 6,000
All of the above bank facilities allow for borrowings at LIBOR-based rates plus a spread depending on the credit default swap spread applicable to theCompany’s debt, subject to a cap and floor that vary with the Company’s debt rating assigned by Moody’s Investors Service and Standard and Poor’s. The spreadabove LIBOR can range from 0.23% to 1.63%. The Company also has the ability to issue up to $800 million of letters of credit under the facility expiring in March2019 , which if utilized, reduces available borrowings under this facility. As of October 1, 2016 , the Company has $169 million of outstanding letters of credit, ofwhich none were issued under this facility. The facilities specifically exclude certain entities, including the International Theme Parks, from any representations,covenants, or events of default and contain only one financial covenant, relating to interest coverage, which the Company met on October 1, 2016 by a significantmargin.
82

TABLE OF CONTENTS
Commercial paper activity is as follows:
Commercial paper withoriginal maturities lessthan three months, net
(1)
Commercial paper withoriginal maturitiesgreater than three
months TotalBalance at Sept 27, 2014 $ 50 $ — $ 50
Additions 2,277 3,019 5,296Payments — (2,920) (2,920)Other Activity 3 1 4
Balance at Oct 3, 2015 $ 2,330 $ 100 $ 2,430Additions — 4,794 4,794Payments (1,559) (4,155) (5,714)Other Activity 6 5 11
Balance at Oct 1, 2016 $ 777 $ 744 $ 1,521(1) Borrowings and reductions of borrowings are reported net.
Credit facility for cruise shipsIn October 2016, the Company entered into two credit facilities to finance new cruise ships, which are expected to be delivered in 2021 and 2023. The
financing may be used for up to 80% of the contract price of the cruise ships. Under the agreements, $1.0 billion in financing is available beginning in April 2021and $1.1 billion is available beginning in April 2023. If utilized, the interest rates will be fixed at 3.48% and 3.74% , respectively, and payable semi-annually. Theloans will be repaid in 24 equal installments over a 12-year period from the borrowing date. Early repayment is permitted subject to cancellation fees.
Shelf Registration StatementThe Company has a shelf registration statement in place, which allows the Company to issue various types of debt instruments, such as fixed or floating rate
notes, U.S. dollar or foreign currency denominated notes, redeemable notes, global notes, and dual currency or other indexed notes. Issuances under the shelfregistration will require the filing of a prospectus supplement identifying the amount and terms of the securities to be issued. Our ability to issue debt is subject tomarket conditions and other factors impacting our borrowing capacity.
U.S. Medium-Term Note ProgramAt October 1, 2016 , the total debt outstanding under the U.S. medium-term note program was $16.8 billion with maturities ranging from 1 to 77 years. The
debt outstanding includes $16.1 billion of fixed rate notes, which have stated interest rates that range from 0.88% to 7.55% and $660 million of floating rate notesthat bear interest at U.S. LIBOR plus or minus a spread. At October 1, 2016 , the effective rate on floating rate notes was 1.10% .
European Medium-Term Note ProgramThe Company has a European medium-term note program, which allows the Company to issue various types of debt instruments such as fixed or floating
rate notes, U.S. dollar or foreign currency denominated notes, redeemable notes and index linked or dual currency notes. Capacity under the program is $4.0 billion, subject to market conditions and other factors impacting our borrowing capacity. Capacity under the program replenishes as outstanding debt under the programis repaid. The Company had no outstanding borrowings under the program at October 1, 2016 .
Foreign Currency Denominated DebtAt October 1, 2016 , the Company had Canadian $ 328 million ( $249 million ) of debt outstanding, which bears interest at the Canadian Dealer Offered Rate
plus 0.83% ( 1.72% at October 1, 2016 ) and matures in 2017 .
The Company has short-term credit facilities of Indian rupee (INR) 11.6 billion ( $173 million ), which bear interest at rates determined at the time ofdrawdown and expire in 2017 . At October 1, 2016 , the outstanding balance was INR 3.6 billion ( $54 million ), which bears interest at an average rate of 8.35% .
At October 1, 2016 , the Company had long-term credit facilities of INR 9.6 billion ( $144 million ). In October 2016, the balance was repaid and thefacilities were canceled.
83

TABLE OF CONTENTS
Capital Cities/ABC DebtIn connection with the Capital Cities/ABC, Inc. acquisition in 1996, the Company assumed debt previously issued by Capital Cities/ABC, Inc. At October 1,
2016 , the outstanding balance was $107 million , which includes unamortized fair value adjustments recorded in purchase accounting. The debt matures in 2021and has a stated interest rate of 8.75% .
International Theme Parks BorrowingsAs part of financing the construction of a third hotel at Hong Kong Disneyland Resort, HKSAR converted $113 million of a loan to equity, leaving a balance
at October 1, 2016 of HK$ 0.4 billion ( $45 million ). The interest rate on this loan is subject to biannual revisions and determined based on the Hong Kong primerate less 0.875 %, but is capped at an annual rate of 7.625% until March 2022 . After March 2022, the interest rate is based on the Hong Kong prime rate but iscapped at an annual rate of 8.50% . As of October 1, 2016 , the rate on the loan was 4.13% . Debt service payments will be made depending on sufficient availablefunds. Repayment is required by September 30, 2022 ; however, early repayment is permitted.
In addition, HKSAR provided Hong Kong Disneyland Resort with a loan facility totaling HK $0.8 billion ( $104 million ) that bears interest at a rate of threemonth HIBOR plus 2% and matures in 2025 ; however, earlier repayment is permitted. At October 1, 2016, Hong Kong Disneyland Resort had borrowed HK $0.6billion ( $77 million ) under the loan facility, which bears interest at a rate of 2.57% .
Shendi has provided Shanghai Disney Resort with term loans totaling 6.4 billion yuan (approximately $1.0 billion ) bearing interest at rates up to 8% andmaturing in 2036; however, early repayment is permitted. Shendi has also provided Shanghai Disney Resort with a 1.4 billion yuan (approximately $205 million )line of credit bearing interest at 8% . There is no outstanding balance under the line of credit at October 1, 2016.
Total borrowings, excluding market value adjustments and debt issuance premiums, discounts and costs, have the following scheduled maturities:
Before InternationalTheme ParksConsolidation
International Theme Parks Total
2017 $ 3,686 $ — $ 3,6862018 1,804 11 1,8152019 2,759 — 2,7592020 896 — 8962021 2,100 17 2,117Thereafter 7,824 1,059 8,883
$ 19,069 $ 1,087 $ 20,156
The Company capitalizes interest on assets constructed for its parks and resorts and on theatrical productions. In fiscal years 2016 , 2015 and 2014 , totalinterest capitalized was $139 million , $110 million and $73 million , respectively. Interest expense, net of capitalized interest, for fiscal years 2016 , 2015 and2014 was $354 million , $265 million and $294 million , respectively.
84

TABLE OF CONTENTS
9 Income Taxes
2016 2015 2014Income Before Income Taxes Domestic (including U.S. exports) $ 14,018 $ 12,825 $ 11,376Foreign subsidiaries 850 1,043 870
$ 14,868 $ 13,868 $ 12,246
Income Tax Expense/(Benefit) Current
Federal $ 3,146 $ 4,182 $ 2,932State 154 333 206Foreign (1) 533 525 600
3,833 5,040 3,738Deferred
Federal 1,172 82 409State 100 (52) 81Foreign (27) (54) 14
1,245 (24) 504
$ 5,078 $ 5,016 $ 4,242
(1) Includes foreign withholding taxes
October 1, 2016 October 3, 2015Components of Deferred Tax Assets and Liabilities Deferred tax assets
Accrued liabilities $ (2,385) $ (2,244)Net operating losses and tax credit carryforwards (1,567) (1,396)Other (917) (945)
Total deferred tax assets (4,869) (4,585)Deferred tax liabilities
Depreciable, amortizable and other property 5,682 5,260Foreign subsidiaries 348 583Licensing revenues 480 396Other 295 297
Total deferred tax liabilities 6,805 6,536Net deferred tax liability before valuation allowance 1,936 1,951Valuation allowance 1,602 1,288Net deferred tax liability $ 3,538 $ 3,239
At October 1, 2016 and October 3, 2015, the valuation allowance primarily related to $1.2 billion and $1.1 billion , respectively, of deferred tax assets forInternational Theme Parks’s net operating losses primarily in France and Hong Kong, and to a lesser extent, China. The noncontrolling interest share of the netoperating losses were $0.4 billion and $0.4 billion at October 1, 2016 and October 3, 2015, respectively. The International Theme Parks net operating losses havean indefinite carryforward period in France and Hong Kong and a five-year carryforward period in China .
In the prior year, the Company had a $399 million deferred income tax asset on the difference between the Company’s tax basis in its investment inDisneyland Paris and the Company’s financial statement carrying value of Disneyland Paris. As a result of the Disneyland Paris recapitalization and the increase inthe Company’s ownership interest (see Note 6 for further discussion of this transaction), the deferred tax asset was written off to income tax expense in fiscal 2015.
As of October 1, 2016 , the Company had undistributed earnings of foreign subsidiaries of approximately $3.4 billion for which deferred U.S. federal incometaxes have not been provided. The Company intends to reinvest these earnings for the foreseeable future. If these amounts were distributed to the U.S., in the formof dividends or otherwise, the Company would be
85

TABLE OF CONTENTS
subject to additional U.S. income taxes. Assuming these foreign earnings were repatriated under laws and rates applicable at 2016 fiscal year end, the incrementalfederal tax applicable to the earnings would be approximately $0.7 billion .
A reconciliation of the effective income tax rate to the federal rate is as follows:
2016 2015 2014Federal income tax rate 35.0 % 35.0 % 35.0 %State taxes, net of federal benefit 1.8 1.9 2.0Domestic production activity deduction (1.6) (1.9) (2.1)Earnings in jurisdictions taxed at rates different from the statutory U.S.
federal rate (1.1) (1.5) (0.7)Disneyland Paris recapitalization — 2.9 —Other, including tax reserves and related interest 0.1 (0.2) 0.4
34.2 % 36.2 % 34.6 %
A reconciliation of the beginning and ending amount of gross unrecognized tax benefits, excluding the related accrual for interest, is as follows:
2016 2015 2014Balance at the beginning of the year $ 912 $ 803 $ 1,120
Increases for current year tax positions 71 98 51Increases for prior year tax positions 142 280 133Decreases in prior year tax positions (158) (193) (487)Settlements with taxing authorities (123) (76) (14)
Balance at the end of the year $ 844 $ 912 $ 803
The fiscal year-end 2016 , 2015 and 2014 balances include $469 million , $501 million and $453 million , respectively, that if recognized, would reduce ourincome tax expense and effective tax rate. These amounts are net of the offsetting benefits from other tax jurisdictions.
As of the end of fiscal 2016 , 2015 and 2014 , the Company had $221 million , $231 million and $216 million , respectively, in accrued interest and penaltiesrelated to unrecognized tax benefits. During fiscal years 2016 , 2015 and 2014 , the Company accrued additional interest and penalties of $22 million , $68 millionand $25 million , respectively, and recorded reductions in accrued interest and penalties of $32 million , $54 million and $21 million , respectively, as a result ofaudit settlements and other prior-year adjustments. The Company’s policy is to report interest and penalties as a component of income tax expense.
The Company is no longer subject to U.S. federal examination for years prior to 2013 and is no longer subject to examination in any of its major state orforeign tax jurisdictions for years prior to 2006.
In the next twelve months, it is reasonably possible that our unrecognized tax benefits could change due to the resolution of certain tax matters, which couldinclude payments on those tax matters. These resolutions and payments could reduce our unrecognized tax benefits by $143 million .
In fiscal years 2016 , 2015 and 2014 , income tax benefits attributable to equity-based compensation transactions exceeded the amounts recorded based ongrant date fair value. Accordingly, $207 million , $313 million and $255 million were credited to shareholders’ equity, respectively, in these years.
10 Pension and Other Benefit Programs
The Company maintains pension and postretirement medical benefit plans covering certain of its employees not covered by union or industry-wide plans.The Company’s defined benefit pension plans cover employees hired prior to January 1, 2012. For employees hired after this date, the Company has a definedcontribution plan. Benefits under these pension plans are generally based on years of service and/or compensation and generally require 3 years of vesting service.Employees generally hired after January 1, 1987 for certain of our media businesses and other employees generally hired after January 1, 1994 are not eligible forpostretirement medical benefits.
86

TABLE OF CONTENTS
Defined Benefit PlansThe Company measures the actuarial value of its benefit obligations and plan assets for its defined benefit pension and postretirement medical benefit plans
at September 30 and adjusts for any plan contributions or significant events between September 30 and our fiscal year end.
The following chart summarizes the benefit obligations, assets, funded status and balance sheet impacts associated with the defined benefit pension andpostretirement medical benefit plans:
Pension Plans Postretirement Medical Plans
October 1, 2016 October 3, 2015 October 1, 2016 October 3,
2015Projected benefit obligations
Beginning obligations $ (12,379) $ (12,190) $ (1,590) $ (1,567)Service cost (318) (332) (11) (14)Interest cost (458) (521) (61) (68)Actuarial gain / (loss) (1,769) (176) (142) 33Plan amendments and other 8 28 (9) (9)Benefits paid (1) 436 812 54 35Ending obligations $ (14,480) $ (12,379) $ (1,759) $ (1,590)
Fair value of plans’ assets Beginning fair value $ 9,415 $ 9,765 $ 568 $ 538Actual return on plan assets 624 163 34 9Contributions 839 337 61 48Benefits paid (1) (436) (812) (54) (35)Expenses and other (41) (38) 5 8Ending fair value $ 10,401 $ 9,415 $ 614 $ 568
Underfunded status of the plans $ (4,079) $ (2,964) $ (1,145) $ (1,022)
Amounts recognized in the balance sheet Non-current assets $ — $ 3 $ — $ —Current liabilities (40) (36) — (13)Non-current liabilities (4,039) (2,931) (1,145) (1,009)
$ (4,079) $ (2,964) $ (1,145) $ (1,022)(1) Fiscal 2015 pension plans include $340 million of payments under a plan offered for a limited time to certain former employees who had vested benefits
in our qualified defined benefit pension plans. These employees elected to receive an immediate lump-sum distribution in lieu of benefits they would havereceived following their retirement.
The components of net periodic benefit cost are as follows:
Pension Plans Postretirement Medical Plans
2016 2015 2014 2016 2015 2014Service cost $ 318 $ 332 $ 277 $ 11 $ 14 $ 10Interest cost 458 521 488 61 68 65Expected return on plan assets (747) (711) (645) (45) (39) (36)Amortization of prior year service costs 14 16 14 (1) (1) (2)Recognized net actuarial loss / (gain) 242 247 145 8 10 (7)Net periodic benefit cost $ 285 $ 405 $ 279 $ 34 $ 52 $ 30
87

TABLE OF CONTENTS
Key assumptions are as follows:
Pension Plans Postretirement Medical Plans
2016 2015 2014 2016 2015 2014Discount rate used to determine the
benefit obligation 3.73% 4.47% 4.40% 3.73% 4.47% 4.40%Discount rate used to determine the net
periodic benefit cost 3.81% 4.40% 5.00% 3.81% 4.40% 5.00%Rate of return on plan assets 7.50% 7.50% 7.50% 7.50% 7.50% 7.50%Rate of salary increase 4.00% 4.00% 4.00% n/a n/a n/aYear 1 increase in cost of benefits n/a n/a n/a 7.00% 7.00% 7.00%Rate of increase to which the cost of
benefits is assumed to decline (theultimate trend rate) n/a n/a n/a 4.25% 4.25% 4.25%
Year that the rate reaches the ultimatetrend rate n/a n/a n/a 2030 2029 2028
In addition to the assumptions in the above table, assumed mortality is also a key assumption in determining benefit obligations. Net periodic benefit cost isbased on assumptions determined at the prior-year end measurement date.
AOCI, before tax, as of October 1, 2016 consists of the following amounts that have not yet been recognized in net periodic benefit cost:
Pension Plans PostretirementMedical Plans Total
Prior service cost $ (56) $ — $ (56)Net actuarial loss (5,470) (263) (5,733)Total amounts included in AOCI (5,526) (263) (5,789)Prepaid / (accrued) pension cost 1,447 (882) 565
Net balance sheet liability $ (4,079) $ (1,145) $ (5,224)
Amounts included in AOCI, before tax, as of October 1, 2016 that are expected to be recognized as components of net periodic benefit cost during fiscal2017 are:
Pension Plans PostretirementMedical Plans Total
Prior service cost $ (11) $ — $ (11)Net actuarial loss (403) (16) (419)Total $ (414) $ (16) $ (430)
Plan Funded StatusThe projected benefit obligation, accumulated benefit obligation and aggregate fair value of plan assets for pension plans with accumulated benefit
obligations in excess of plan assets were $13.4 billion , $12.4 billion and $9.5 billion , respectively, as of October 1, 2016 and $11.5 billion , $10.6 billion and $8.5billion as of October 3, 2015 , respectively.
For pension plans with projected benefit obligations in excess of plan assets, the projected benefit obligation and aggregate fair value of plan assets were$14.5 billion and $10.4 billion , respectively, as of October 1, 2016 and $12.4 billion and $9.4 billion as of October 3, 2015 , respectively.
The Company’s total accumulated pension benefit obligations at October 1, 2016 and October 3, 2015 were $13.3 billion and $11.4 billion , respectively, ofwhich 99% and 98% , respectively, was vested.
The accumulated postretirement medical benefit obligations and fair value of plan assets for postretirement medical plans with accumulated postretirementmedical benefit obligations in excess of plan assets were $1.8 billion and $0.6 billion , respectively, at October 1, 2016 and $1.6 billion and $0.6 billion ,respectively, at October 3, 2015 .
88

TABLE OF CONTENTS
Plan AssetsA significant portion of the assets of the Company’s defined benefit plans are managed in a third-party master trust. The investment policy and allocation of
the assets in the master trust were approved by the Company’s Investment and Administrative Committee, which has oversight responsibility for the Company’sretirement plans. The investment policy ranges for the major asset classes are as follows:
Asset Class Minimum Maximum Equity investments 30% 60%Fixed income investments 20% 40%Alternative investments 10% 30%Cash & money market funds 0% 10%
The primary investment objective for the assets within the master trust is the prudent and cost effective management of assets to satisfy benefit obligations toplan participants. Financial risks are managed through diversification of plan assets, selection of investment managers and through the investment guidelinesincorporated in investment management agreements. Assets are monitored to ensure that investment returns are commensurate with risks taken.
The long-term asset allocation policy for the master trust was established taking into consideration a variety of factors that include, but are not limited to, theaverage age of participants, the number of retirees, the duration of liabilities and the expected payout ratio. Liquidity needs of the master trust are generallymanaged using cash generated by investments or by liquidating securities.
Assets are generally managed by external investment managers, and we have investment management agreements with respect to securities in the mastertrust. These agreements include account guidelines that establish permitted securities and risk controls commensurate with the account’s investment strategy. Someagreements permit the use of derivative securities (futures, options, interest rate swaps, credit default swaps) that enable investment managers to enhance returnsand manage exposures within their accounts.
Fair Value Measurements of Plan AssetsFair value is defined as the amount that would be received for selling an asset or paid to transfer a liability in an orderly transaction between market
participants and is classified in one of the following three categories:
Level 1 – Quoted prices for identical instruments in active marketsLevel 2 – Quoted prices for similar instruments in active markets; quoted prices for identical or similar instruments in markets that are not active; and model-
derived valuations in which all significant inputs and significant value drivers are observable in active marketsLevel 3 – Valuations derived from valuation techniques in which one or more significant inputs or significant value drivers are unobservable
The following is a description of the valuation methodologies used for assets reported at fair value. There have been no changes in the methodologies used atOctober 1, 2016 and October 3, 2015 .
Level 1 investments are valued based on reported market prices on the last trading day of the year. Investments in common and preferred stocks are valuedbased on the securities exchange-listed price or a broker’s quote in an active market. Investments in U.S. Treasury securities are valued based on a broker’s quotein an active market.
Level 2 investments in government and federal agency bonds, mortgage-backed securities (MBS), asset-backed securities and corporate bonds are valuedusing a broker’s quote in a non-active market or an evaluated price based on a compilation of reported market information, such as benchmark yield curves, creditspreads and estimated default rates. Derivative financial instruments are valued based on models that incorporate observable inputs for the underlying securities,such as interest rates or foreign currency exchange rates. Shares in money market and mutual funds and certain alternative investments are valued at the net assetvalue of the shares held by the Plan at year-end based on the fair value of the underlying investments.
Level 3 investments primarily consist of investments in limited partnerships, which are valued based on the master trust’s pro-rata share of the partnerships’underlying net investment holdings as reported in the partnerships’ financial statements. The investments held by the partnerships are recorded at fair value, andthe partnerships’ financial statements are generally audited annually. The fair values of the underlying investments are estimated using significant unobservableinputs (e.g., discounted
89

TABLE OF CONTENTS
cash flow models or relative valuation methods that incorporate comparable market information such as earnings and cash flow multiples from similar publiclytraded companies or real estate properties).
The Company’s defined benefit plan assets are summarized by level in the following tables:
As of October 1, 2016Description Level 1 Level 2 Level 3 Total Plan Asset Mix
Cash & money market funds $ 116 $ 916 $ — $ 1,032 9%Common and preferred stocks (1) 2,238 945 — 3,183 29%Mutual funds 636 232 — 868 8%Common collective funds 13 558 — 571 5%Government and federal agency
bonds, notes and MBS 2,114
458
—
2,572
24%
Corporate bonds — 577 — 577 5%Mortgage- and asset-backed
securities —
86
—
86
1%
Alternative investments 84 975 1,067 2,126 19%Derivatives and other, net (1) 1 — — —%
Total $ 5,200 $ 4,748 $ 1,067 $ 11,015 100%
As of October 3, 2015Description Level 1 Level 2 Level 3 Total Plan Asset Mix
Cash & money market funds $ 56 $ 1,036 $ — $ 1,092 11%Common and preferred stocks (1) 2,000 883 — 2,883 29%Mutual funds 476 215 — 691 7%Common collective funds 13 476 — 489 5%Government and federal agency
bonds, notes and MBS 1,090
483
—
1,573
16%
Corporate bonds — 671 — 671 7%Mortgage- and asset-backed securities — 137 — 137 1%Alternative investments 80 952 1,200 2,232 22%Derivatives and other, net 212 3 — 215 2%
Total $ 3,927 $ 4,856 $ 1,200 $ 9,983 100%(1) Includes 2.8 million shares of Company common stock valued at $264 million ( 2% of total plan assets) and 2.8 million shares valued at $290 million (
3% of total plan assets) at October 1, 2016 and October 3, 2015 , respectively.
Changes in Level 3 assets are as follows:
Year Ended October 1, 2016 October 3, 2015Balance, beginning of year $ 1,200 $ 1,266
Additions 174 168Distributions (300) (332)Gain / (Loss) (7) 98
Balance, end of year $ 1,067 $ 1,200
90
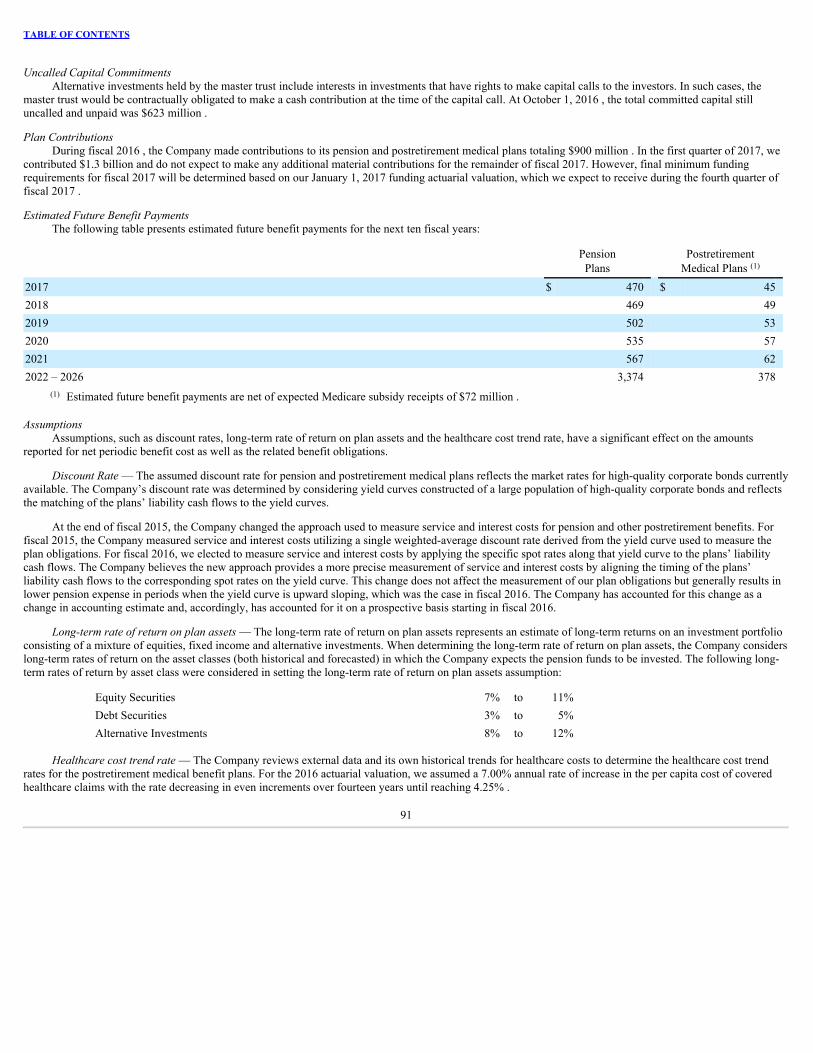
TABLE OF CONTENTS
Uncalled Capital CommitmentsAlternative investments held by the master trust include interests in investments that have rights to make capital calls to the investors. In such cases, the
master trust would be contractually obligated to make a cash contribution at the time of the capital call. At October 1, 2016 , the total committed capital stilluncalled and unpaid was $623 million .
Plan ContributionsDuring fiscal 2016 , the Company made contributions to its pension and postretirement medical plans totaling $900 million . In the first quarter of 2017, we
contributed $1.3 billion and do not expect to make any additional material contributions for the remainder of fiscal 2017. However, final minimum fundingrequirements for fiscal 2017 will be determined based on our January 1, 2017 funding actuarial valuation, which we expect to receive during the fourth quarter offiscal 2017 .
Estimated Future Benefit PaymentsThe following table presents estimated future benefit payments for the next ten fiscal years:
PensionPlans
PostretirementMedical Plans (1)
2017 $ 470 $ 452018 469 492019 502 532020 535 572021 567 622022 – 2026 3,374 378
(1) Estimated future benefit payments are net of expected Medicare subsidy receipts of $72 million .
AssumptionsAssumptions, such as discount rates, long-term rate of return on plan assets and the healthcare cost trend rate, have a significant effect on the amounts
reported for net periodic benefit cost as well as the related benefit obligations.
Discount Rate — The assumed discount rate for pension and postretirement medical plans reflects the market rates for high-quality corporate bonds currentlyavailable. The Company’s discount rate was determined by considering yield curves constructed of a large population of high-quality corporate bonds and reflectsthe matching of the plans’ liability cash flows to the yield curves.
At the end of fiscal 2015, the Company changed the approach used to measure service and interest costs for pension and other postretirement benefits. Forfiscal 2015, the Company measured service and interest costs utilizing a single weighted-average discount rate derived from the yield curve used to measure theplan obligations. For fiscal 2016, we elected to measure service and interest costs by applying the specific spot rates along that yield curve to the plans’ liabilitycash flows. The Company believes the new approach provides a more precise measurement of service and interest costs by aligning the timing of the plans’liability cash flows to the corresponding spot rates on the yield curve. This change does not affect the measurement of our plan obligations but generally results inlower pension expense in periods when the yield curve is upward sloping, which was the case in fiscal 2016. The Company has accounted for this change as achange in accounting estimate and, accordingly, has accounted for it on a prospective basis starting in fiscal 2016.
Long-term rate of return on plan assets — The long-term rate of return on plan assets represents an estimate of long-term returns on an investment portfolioconsisting of a mixture of equities, fixed income and alternative investments. When determining the long-term rate of return on plan assets, the Company considerslong-term rates of return on the asset classes (both historical and forecasted) in which the Company expects the pension funds to be invested. The following long-term rates of return by asset class were considered in setting the long-term rate of return on plan assets assumption:
Equity Securities 7% to 11%Debt Securities 3% to 5%Alternative Investments 8% to 12%
Healthcare cost trend rate — The Company reviews external data and its own historical trends for healthcare costs to determine the healthcare cost trendrates for the postretirement medical benefit plans. For the 2016 actuarial valuation, we assumed a 7.00% annual rate of increase in the per capita cost of coveredhealthcare claims with the rate decreasing in even increments over fourteen years until reaching 4.25% .
91

TABLE OF CONTENTS
Sensitivity — A one percentage point (ppt) change in the key assumptions would have the following effects on the projected benefit obligations for pensionand postretirement medical plans as of October 1, 2016 and on cost for fiscal 2017 :
Discount Rate
ExpectedLong-Term
Rate of ReturnOn Assets
Assumed HealthcareCost Trend Rate
Increase/(decrease)BenefitExpense
Projected BenefitObligations
BenefitExpense
Net PeriodicPostretirement Medical
Cost Projected Benefit
Obligations1 ppt decrease $ 271 $ 2,853 $ 123 $ (25) $ (233)1 ppt increase (235) (2,401) (123) 41 287
Multiemployer Benefit PlansThe Company participates in a number of multiemployer pension plans under union and industry-wide collective bargaining agreements that cover our
union-represented employees and expenses its contributions to these plans as incurred. These plans generally provide for retirement, death and/or terminationbenefits for eligible employees within the applicable collective bargaining units, based on specific eligibility/participation requirements, vesting periods and benefitformulas. The risks of participating in these multiemployer plans are different from single-employer plans. For example:
• Assets contributed to the multiemployer plan by one employer may be used to provide benefits to employees of other participating employers.• If a participating employer stops contributing to the multiemployer plan, the unfunded obligations of the plan may become the obligation of the remaining
participating employers.• If the Company chooses to stop participating in these multiemployer plans, the Company may be required to pay those plans an amount based on the
underfunded status of the plan.
The Company also participates in several multiemployer health and welfare plans that cover both active and retired employees. Health care benefits areprovided to participants who meet certain eligibility requirements under the applicable collective bargaining unit.
The following table sets forth our contributions to multiemployer pension and health and welfare benefit plans that were expensed during the fiscal years2016 , 2015 and 2014 , respectively:
2016 2015 2014Pension plans $ 126 $ 128 $ 115Health & welfare plans 167 173 158
Total contributions $ 293 $ 301 $ 273
Defined Contribution PlansThe Company has defined contribution retirement plans for domestic employees who began service after December 31, 2011 and are not eligible to
participate in the defined benefit pension plans. In general, the Company contributes from 3% to 9% of an employee’s compensation depending on the employee’sage and years of service with the Company up to plan limits. The Company has savings and investment plans that allow eligible employees to contribute up to 50%of their salary through payroll deductions depending on the plan in which the employee participates. The Company matches 50% of the employee’s contribution upto plan limits. In fiscal years 2016 , 2015 and 2014 , the costs of these defined contribution plans were $131 million , $110 million and $87 million , respectively.The Company also has defined contribution retirement plans for employees in our international operations. In each of fiscal years 2016 , 2015 and 2014 , the costsof these defined contribution plans were $19 million .
92

TABLE OF CONTENTS
11 Equity
The Company paid the following dividends in fiscal 2016 , 2015 and 2014 :
Per Share Total Paid Payment Timing Related to Fiscal Period$0.71 $1.1 billion Fourth Quarter of Fiscal 2016 First Half 2016$0.71 $1.2 billion Second Quarter of Fiscal 2016 Second Half 2015$0.66 $1.1 billion Fourth Quarter of Fiscal 2015 First Half 2015$1.15 $1.9 billion Second Quarter of Fiscal 2015 2014$0.86 $1.5 billion Second Quarter of Fiscal 2014 2013
The Company repurchased its common stock in fiscal 2016 , 2015 and 2014 as follows:
Fiscal year Shares acquired Total paid2016 74 million $7.5 billion2015 60 million $6.1 billion2014 84 million $6.5 billion
On January 30, 2015, the Company’s Board of Directors increased the amount of shares that can be repurchased to 400 million shares as of that date. As ofOctober 1, 2016 , the Company had remaining authorization in place to repurchase 282 million additional shares. The repurchase program does not have anexpiration date.
The following table summarizes the changes in each component of AOCI including our proportional share of equity method investee amounts, net of 37%estimated tax:
Market Value Adjustments UnrecognizedPension and
PostretirementMedical Expense
ForeignCurrency
Translationand Other AOCI Investments
Cash FlowHedges
Balance at Sept. 28, 2013 $ 95 $ 83 $ (1,271) $ (94) $ (1,187)Unrealized gains (losses)
arising during the period 109 169 (1,022) 18 (726)Reclassifications of realized
net (gains) losses to netincome (104) (48) 97 — (55)
Balance at Sept. 27, 2014 100 204 (2,196) (76) (1,968)Unrealized gains (losses)
arising during the period (37) 421 (474) (195) (285)Reclassifications of realized
net (gains) losses to netincome (50) (291) 173 — (168)
Balance at Oct. 3, 2015 13 334 (2,497) (271) (2,421)Unrealized gains (losses)
arising during the period 13 (193) (1,321) (58) (1,559)Reclassifications of realized
net (gains) losses to netincome — (166) 167 — 1
Balance at Oct. 1, 2016 $ 26 $ (25) $ (3,651) $ (329) $ (3,979)
93

TABLE OF CONTENTS
Details about AOCI components reclassified to net income are as follows:
Gains/(losses) in net income: Affected line item in the Consolidated
Statements of Income: 2016 2015 2014Investments, net Interest income/(expense), net $ — $ 79 $ 165Estimated tax Income taxes — (29) (61) — 50 104 Cash flow hedges Primarily revenue 264 462 76Estimated tax Income taxes (98) (171) (28) 166 291 48 Pension and postretirement medical expense Cost and expenses (265) (274) (154)Estimated tax Income taxes 98 101 57 (167) (173) (97) Total reclassifications for the period $ (1) $ 168 $ 55
At October 1, 2016 and October 3, 2015 , the Company held available-for-sale investments in unrecognized gain positions totaling $49 million and $21million , respectively, and no investments in significant unrecognized loss positions.
12 Equity-Based Compensation
Under various plans, the Company may grant stock options and other equity-based awards to executive, management and creative personnel. The Company’sapproach to long-term incentive compensation contemplates awards of stock options and restricted stock units (RSUs). Certain RSUs awarded to senior executivesvest based upon the achievement of market or performance conditions (Performance RSUs).
Stock options are generally granted at exercise prices equal to or exceeding the market price at the date of grant and become exercisable ratably over a four -year period from the grant date. The contractual terms for our outstanding stock option grants are 10 years. At the discretion of the Compensation Committee of theCompany’s Board of Directors, options can occasionally extend up to 15 years after date of grant. RSUs generally vest ratably over four years and PerformanceRSUs fully vest after three years, subject to achieving market or performance conditions. Equity-based award grants generally provide continued vesting, in theevent of termination, for employees that reach age 60 or greater, have at least ten years of service and have held the award for at least one year.
Each share granted subject to a stock option award reduces the number of shares available under the Company’s stock incentive plans by one share whileeach share granted subject to a RSU award reduces the number of shares available by two shares. As of October 1, 2016 , the maximum number of shares availablefor issuance under the Company’s stock incentive plans (assuming all the awards are in the form of stock options) was approximately 77 million shares and thenumber available for issuance assuming all awards are in the form of RSUs was approximately 39 million shares. The Company satisfies stock option exercisesand vesting of RSUs with newly issued shares. Stock options and RSUs are generally forfeited by employees who terminate prior to vesting.
Each year, during the first half of the year, the Company awards stock options and restricted stock units to a broad-based group of management and creativepersonnel. The fair value of options is estimated based on the binomial valuation model. The binomial valuation model takes into account variables such asvolatility, dividend yield and the risk-free interest rate. The binomial valuation model also considers the expected exercise multiple (the multiple of exercise priceto grant price at which exercises are expected to occur on average) and the termination rate (the probability of a vested option being canceled due to the terminationof the option holder) in computing the value of the option.
94

TABLE OF CONTENTS
In fiscal years 2016 , 2015 and 2014 , the weighted average assumptions used in the option-valuation model were as follows:
2016 2015 2014Risk-free interest rate 2.3% 2.1% 3.0%Expected volatility 26% 24% 25%Dividend yield 1.32% 1.37% 1.37%Termination rate 4.0% 3.2% 3.2%Exercise multiple 1.62 1.48 1.48
Although the initial fair value of stock options is not adjusted after the grant date, changes in the Company’s assumptions may change the value of, andtherefore the expense related to, future stock option grants. The assumptions that cause the greatest variation in fair value in the binomial valuation model are theexpected volatility and expected exercise multiple. Increases or decreases in either the expected volatility or expected exercise multiple will cause the binomialoption value to increase or decrease, respectively. The volatility assumption considers both historical and implied volatility and may be impacted by theCompany’s performance as well as changes in economic and market conditions.
Compensation expense for RSUs and stock options is recognized ratably over the service period of the award. Compensation expense for RSUs is based onthe market price of the shares underlying the awards on the grant date. Compensation expense for Performance RSUs reflects the estimated probability that themarket or performance conditions will be met.
The impact of stock options/rights and RSUs on income and cash flows for fiscal years 2016 , 2015 and 2014 , was as follows:
2016 2015 2014Stock option/rights compensation expense (1) $ 93 $ 102 $ 102RSU compensation expense 293 309 312Total equity-based compensation expense (2) 386 411 414Tax impact (131) (134) (139)
Reduction in net income $ 255 $ 277 $ 275
Equity-based compensation expense capitalized during the period $ 78 $ 57 $ 49
Tax benefit reported in cash flow from financing activities $ 208 $ 313 $ 255(1) Includes stock appreciation rights.(2) Equity-based compensation expense is net of capitalized equity-based compensation and excludes amortization of previously capitalized equity-based
compensation costs.
The following table summarizes information about stock option transactions (shares in millions):
2016
Shares
Weighted Average
Exercise PriceOutstanding at beginning of year 29 $ 54.93Awards forfeited (1) 91.27Awards granted 4 112.69Awards exercised (7) 39.13Awards expired/canceled — —
Outstanding at end of year 25 66.91
Exercisable at end of year 14 $ 49.65
95

TABLE OF CONTENTS
The following tables summarize information about stock options vested and expected to vest at October 1, 2016 (shares in millions):
Vested
Range of Exercise Prices Number of
Options
WeightedAverage
Exercise Price
Weighted Average
RemainingYears of
Contractual Life
$ 0 — $ 35 2 $ 30.44 3.2$ 36 — $ 45 6 39.10 4.9$ 46 — $ 90 5 58.20 6.6$ 91 — $ 115 1 92.40 8.2
14
Expected to Vest
Range of Exercise Prices Number ofOptions (1)
WeightedAverage
Exercise Price
Weighted Average
RemainingYears of
Contractual Life
$ 0 — $ 55 2 $ 50.97 6.3$ 56 — $ 75 3 72.50 7.2$ 76 — $ 95 3 92.09 8.2$ 96 — $ 115 3 113.06 9.2
11 (1) Number of options expected to vest is total unvested options less estimated forfeitures.
The following table summarizes information about RSU transactions (shares in millions):
2016
Units
WeightedAverage
Grant-Date Fair Value
Unvested at beginning of year 12 $ 68.71Granted (1) 4 112.49Vested (5) 58.51Forfeited (1) 88.77Unvested at end of year (2) 10 $ 88.84
(1) Includes 0.2 million Performance RSUs.(2) Includes 0.7 million Performance RSUs.
The weighted average grant-date fair values of options granted during fiscal 2016 , 2015 and 2014 were $30.93 , $22.65 and $19.21 , respectively. The totalintrinsic value (market value on date of exercise less exercise price) of options exercised and RSUs vested during fiscal 2016 , 2015 and 2014 totaled $981 million, $1,332 million and $1,257 million , respectively. The aggregate intrinsic values of stock options vested and expected to vest at October 1, 2016 were $603 millionand $127 million , respectively.
As of October 1, 2016 , unrecognized compensation cost related to unvested stock options and RSUs was $129 million and $469 million , respectively. Thatcost is expected to be recognized over a weighted-average period of 1.8 years for stock options and 1.6 years for RSUs.
96

TABLE OF CONTENTS
Cash received from option exercises for fiscal 2016 , 2015 and 2014 was $259 million , $329 million and $404 million , respectively. Tax benefits realizedfrom tax deductions associated with option exercises and RSUs vesting for fiscal 2016 , 2015 and 2014 totaled $342 million , $457 million and $431 million ,respectively.
13 Detail of Certain Balance Sheet Accounts
October 1,
2016 October 3,
2015Current receivables
Accounts receivable $ 8,458 $ 7,613Other 760 563Allowance for doubtful accounts (153) (157)
$ 9,065 $ 8,019
Other current assets Prepaid expenses $ 449 $ 469Other 244 493
$ 693 $ 962
Parks, resorts and other property Attractions, buildings and improvements $ 27,930 $ 21,556Leasehold improvements 830 769Furniture, fixtures and equipment 16,912 16,068Land improvements 4,598 4,352
50,270 42,745Accumulated depreciation (26,849) (24,844)Projects in progress 2,684 6,028Land 1,244 1,250
$ 27,349 $ 25,179
Intangible assets Character/franchise intangibles and copyrights $ 5,829 $ 5,830Other amortizable intangible assets 893 901Accumulated amortization (1,635) (1,426)
Net amortizable intangible assets 5,087 5,305FCC licenses 624 629Trademarks 1,218 1,218Other indefinite lived intangible assets 20 20
$ 6,949 $ 7,172
Other non-current assets Receivables $ 1,651 $ 1,589Prepaid expenses 229 211Other 460 621
$ 2,340 $ 2,421
Accounts payable and other accrued liabilities Accounts payable $ 6,860 $ 5,504Payroll and employee benefits 1,747 1,797Other 523 543
$ 9,130 $ 7,844
97

TABLE OF CONTENTS
Other long-term liabilities Pension and postretirement medical plan liabilities $ 5,184 $ 3,940Other 2,522 2,429
$ 7,706 $ 6,369
14 Commitments and Contingencies
CommitmentsThe Company has various contractual commitments for broadcast rights for sports, feature films and other programming, totaling approximately $51.0
billion , including approximately $0.4 billion for available programming as of October 1, 2016 , and approximately $48.7 billion related to sports programmingrights, primarily college football (including bowl games and the College Football Playoff) and basketball, NBA, NFL, MLB, US Open Tennis, various soccerrights, the Wimbledon Championships and the Masters golf tournament.
The Company has entered into operating leases for various real estate and equipment needs, including retail outlets and distribution centers for consumerproducts, broadcast equipment and office space for general and administrative purposes. Rental expense for operating leases during fiscal years 2016 , 2015 and2014 , including common-area maintenance and contingent rentals, was $847 million , $859 million and $883 million , respectively.
The Company also has contractual commitments for two new cruise ships, creative talent and employment agreements and unrecognized tax benefits.Creative talent and employment agreements include obligations to actors, producers, sports, television and radio personalities and executives.
Contractual commitments for broadcast programming rights, future minimum lease payments under non-cancelable operating leases, cruise ships, creativetalent and other commitments totaled $60.8 billion at October 1, 2016 , payable as follows:
Broadcast
Programming Operating
Leases Other Total2017 $ 6,119 $ 477 $ 1,880 $ 8,4762018 6,015 376 1,006 7,3972019 6,221 329 502 7,0522020 6,416 278 486 7,1802021 6,314 227 206 6,747Thereafter 19,925 1,419 2,567 23,911
$ 51,010 $ 3,106 $ 6,647 $ 60,763
Certain contractual commitments, principally broadcast programming rights and operating leases, have payments that are variable based primarily onrevenues and are not included in the table above.
98

TABLE OF CONTENTS
The Company has non-cancelable capital leases, primarily for land and broadcast equipment, which had gross carrying values of $464 million and $469million at October 1, 2016 and October 3, 2015 , respectively. Accumulated amortization related to these capital leases totaled $216 million and $196 million atOctober 1, 2016 and October 3, 2015 , respectively. Future payments under these leases as of October 1, 2016 are as follows:
2017 $ 352018 242019 172020 152021 15Thereafter 495Total minimum obligations 601
Less amount representing interest (407)Present value of net minimum obligations 194
Less current portion (20)Long-term portion $ 174
Contractual GuaranteesThe Company has guaranteed bond issuances by the Anaheim Public Authority that were used by the City of Anaheim to finance construction of
infrastructure and a public parking facility adjacent to the Disneyland Resort. Revenues from sales, occupancy and property taxes from the Disneyland Resort andnon-Disney hotels are used by the City of Anaheim to repay the bonds. In the event of a debt service shortfall, the Company will be responsible to fund theshortfall. As of October 1, 2016 , the remaining debt service obligation guaranteed by the Company was $316 million , of which $51 million was principal. To theextent that tax revenues exceed the debt service payments in subsequent periods, the Company would be reimbursed for any previously funded shortfalls. To date,tax revenues have exceeded the debt service payments for the Anaheim bonds.
Legal MattersBeef Products, Inc. v. American Broadcasting Companies, Inc. On September 13, 2012, plaintiffs filed an action in South Dakota state court against certain
subsidiaries and employees of the Company and others, asserting claims for defamation arising from alleged false statements and implications, statutory andcommon law product disparagement, and tortious interference with existing and prospective business relationships. The claims arise out of ABC News reportspublished in March and April 2012 about a product, Lean Finely Textured Beef, that was included in ground beef and hamburger meat. Plaintiffs’ complaintsought actual and consequential damages in excess of $400 million (which in March 2016 they asserted could be as much as $1.9 billion ), statutory damages(including treble damages) pursuant to South Dakota’s Agricultural Food Products Disparagement Act, and punitive damages. Trial is set for June 2017. At thistime, the Company is not able to predict the ultimate outcome of this matter, nor can it estimate the range of possible loss.
The Company, together with, in some instances, certain of its directors and officers, is a defendant or codefendant in various other legal actions involvingcopyright, breach of contract and various other claims incident to the conduct of its businesses.
Management does not believe that the Company has incurred a probable material loss by reason of any of the above actions.
Long-Term Receivables and the Allowance for Credit LossesThe Company has accounts receivable with original maturities greater than one year related to the sale of television program rights and vacation ownership
units. Allowances for credit losses are established against these receivables as necessary.
The Company estimates the allowance for credit losses related to receivables from the sale of television programs based upon a number of factors, includinghistorical experience and the financial condition of individual companies with which we do business. The balance of television program sales receivables recordedin other non-current assets, net of an immaterial allowance for credit losses, was $0.9 billion as of October 1, 2016 . Fiscal 2016 activity related to the allowancefor credit losses was not material.
The Company estimates the allowance for credit losses related to receivables from sales of its vacation ownership units based primarily on historicalcollection experience. Estimates of uncollectible amounts also consider the economic environment and the age of receivables. The balance of mortgage receivablesrecorded in other non-current assets, net of a related allowance
99

TABLE OF CONTENTS
for credit losses of approximately 4% , was $0.7 billion as of October 1, 2016 . Fiscal 2016 activity related to the allowance for credit losses was not material.
15 Fair Value Measurement
The Company’s assets and liabilities measured at fair value are summarized in the following tables by fair value measurement Level. See Note 10 for thedefinitions of fair value and each Level within the fair value hierarchy.
Fair Value Measurement at October 1, 2016Description Level 1 Level 2 Level 3 Total
Assets Investments $ 85 $ — $ — $ 85Derivatives
Interest rate — 132 — 132Foreign exchange — 596 — 596Other — 6 — 6
Liabilities Derivatives
Interest rate — (13) — (13)Foreign exchange — (510) — (510)Other — (4) — (4)
Total recorded at fair value $ 85 $ 207 $ — $ 292
Fair value of borrowings $ — $ 19,500 $ 1,579 $ 21,079
Fair Value Measurement at October 3, 2015Description Level 1 Level 2 Level 3 Total
Assets Investments $ 36 $ — $ — $ 36Derivatives
Interest rate — 101 — 101Foreign exchange — 910 — 910
Liabilities Derivatives
Foreign exchange — (178) — (178)Other — (38) — (38)
Other — — (96) (96)Total recorded at fair value $ 36 $ 795 $ (96) $ 735
Fair value of borrowings $ — $ 17,036 $ 752 $ 17,788
The fair values of Level 2 derivatives are primarily determined by internal discounted cash flow models that use observable inputs such as interest rates,yield curves and foreign currency exchange rates. Counterparty credit risk, which is mitigated by master netting agreements and collateral posting arrangementswith certain counterparties, did not have a material impact on derivative fair value estimates.
Level 2 borrowings, which include commercial paper and U.S. medium-term notes, are valued based on quoted prices for similar instruments in activemarkets.
The fair value of the Level 3 other liabilities represented the estimated fair value of the contingent consideration for Maker, which was settled in fiscal 2016.
Level 3 borrowings, which include International Theme Park borrowings and other foreign currency denominated borrowings, are generally valued based onhistorical market transactions, prevailing market interest rates and the Company’s current borrowing cost and credit risk.
100
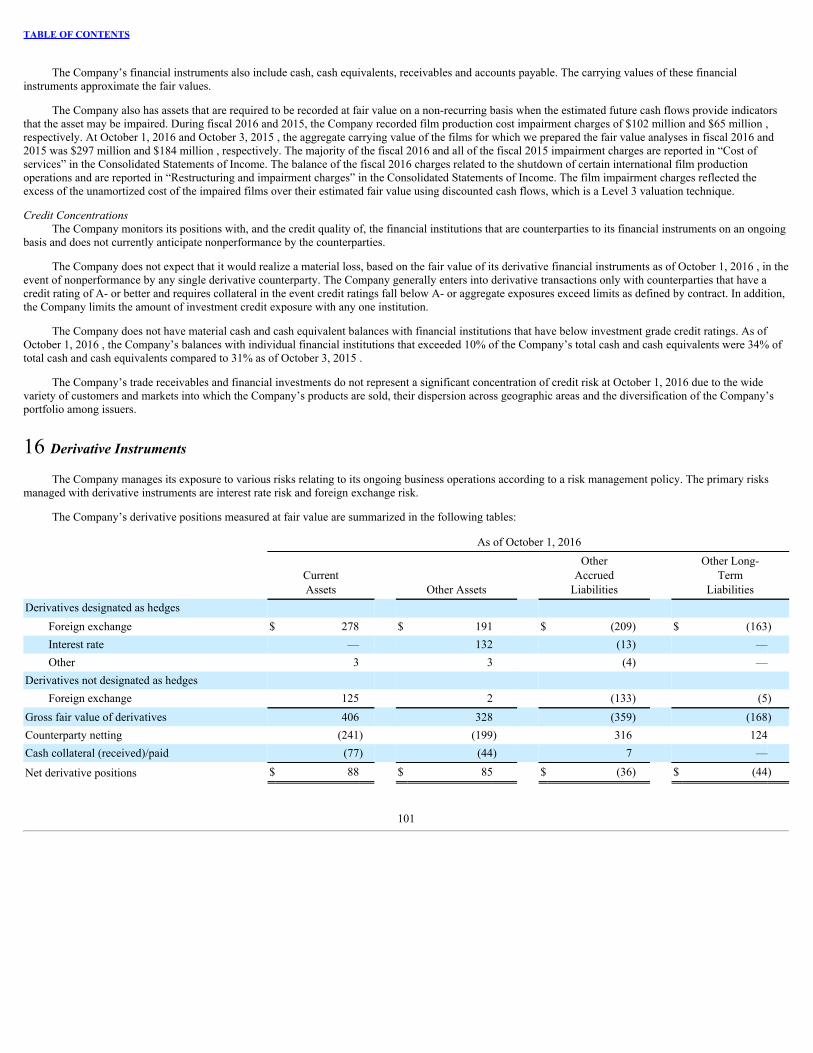
TABLE OF CONTENTS
The Company’s financial instruments also include cash, cash equivalents, receivables and accounts payable. The carrying values of these financialinstruments approximate the fair values.
The Company also has assets that are required to be recorded at fair value on a non-recurring basis when the estimated future cash flows provide indicatorsthat the asset may be impaired. During fiscal 2016 and 2015, the Company recorded film production cost impairment charges of $102 million and $65 million ,respectively. At October 1, 2016 and October 3, 2015 , the aggregate carrying value of the films for which we prepared the fair value analyses in fiscal 2016 and2015 was $297 million and $184 million , respectively. The majority of the fiscal 2016 and all of the fiscal 2015 impairment charges are reported in “Cost ofservices” in the Consolidated Statements of Income. The balance of the fiscal 2016 charges related to the shutdown of certain international film productionoperations and are reported in “Restructuring and impairment charges” in the Consolidated Statements of Income. The film impairment charges reflected theexcess of the unamortized cost of the impaired films over their estimated fair value using discounted cash flows, which is a Level 3 valuation technique.
Credit ConcentrationsThe Company monitors its positions with, and the credit quality of, the financial institutions that are counterparties to its financial instruments on an ongoing
basis and does not currently anticipate nonperformance by the counterparties.
The Company does not expect that it would realize a material loss, based on the fair value of its derivative financial instruments as of October 1, 2016 , in theevent of nonperformance by any single derivative counterparty. The Company generally enters into derivative transactions only with counterparties that have acredit rating of A- or better and requires collateral in the event credit ratings fall below A- or aggregate exposures exceed limits as defined by contract. In addition,the Company limits the amount of investment credit exposure with any one institution.
The Company does not have material cash and cash equivalent balances with financial institutions that have below investment grade credit ratings. As ofOctober 1, 2016 , the Company’s balances with individual financial institutions that exceeded 10% of the Company’s total cash and cash equivalents were 34% oftotal cash and cash equivalents compared to 31% as of October 3, 2015 .
The Company’s trade receivables and financial investments do not represent a significant concentration of credit risk at October 1, 2016 due to the widevariety of customers and markets into which the Company’s products are sold, their dispersion across geographic areas and the diversification of the Company’sportfolio among issuers.
16 Derivative Instruments
The Company manages its exposure to various risks relating to its ongoing business operations according to a risk management policy. The primary risksmanaged with derivative instruments are interest rate risk and foreign exchange risk.
The Company’s derivative positions measured at fair value are summarized in the following tables:
As of October 1, 2016
CurrentAssets Other Assets
OtherAccrued
Liabilities
Other Long-Term
LiabilitiesDerivatives designated as hedges
Foreign exchange $ 278 $ 191 $ (209) $ (163)Interest rate — 132 (13) —Other 3 3 (4) —
Derivatives not designated as hedges Foreign exchange 125 2 (133) (5)
Gross fair value of derivatives 406 328 (359) (168)Counterparty netting (241) (199) 316 124Cash collateral (received)/paid (77) (44) 7 —
Net derivative positions $ 88 $ 85 $ (36) $ (44)
101

TABLE OF CONTENTS
As of October 3, 2015
CurrentAssets Other Assets
OtherAccrued
Liabilities
Other Long-Term
LiabilitiesDerivatives designated as hedges
Foreign exchange $ 406 $ 271 $ (54) $ (17)Interest rate — 101 — —Other — — (18) (3)
Derivatives not designated as hedges Foreign exchange 146 87 (102) (5)Other — — — (17)
Gross fair value of derivatives 552 459 (174) (42)Counterparty netting (136) (56) 169 23Cash collateral received (238) (191) — —
Net derivative positions $ 178 $ 212 $ (5) $ (19)
Interest Rate Risk ManagementThe Company is exposed to the impact of interest rate changes primarily through its borrowing activities. The Company’s objective is to mitigate the impact
of interest rate changes on earnings and cash flows and on the market value of its borrowings. In accordance with its policy, the Company targets its fixed-rate debtas a percentage of its net debt between a minimum and maximum percentage. The Company typically uses pay-floating and pay-fixed interest rate swaps tofacilitate its interest rate management activities.
The Company designates pay-floating interest rate swaps as fair value hedges of fixed-rate borrowings effectively converting fixed-rate borrowings tovariable rate borrowings indexed to LIBOR. As of October 1, 2016 and October 3, 2015 , the total notional amount of the Company’s pay-floating interest rateswaps was $8.3 billion and $6.4 billion , respectively. The following table summarizes adjustments related to fair value hedges included in “Interestincome/(expense), net” in the Consolidated Statements of Income.
2016 2015 2014Gain (loss) on interest rate swaps $ 18 $ 60 $ (38)Gain (loss) on hedged borrowings (18) (60) 38
In addition, the Company realized net benefits of $94 million , $97 million and $93 million for fiscal years 2016 , 2015 and 2014 , respectively, in “Interestincome/(expense), net” related to the pay-floating interest rate swaps.
The Company may designate pay-fixed interest rate swaps as cash flow hedges of interest payments on floating-rate borrowings. Pay-fixed swaps effectivelyconvert floating rate borrowings to fixed-rate borrowings. The unrealized gains or losses from these cash flow hedges are deferred in AOCI and recognized ininterest expense as the interest payments occur. The Company did not have pay-fixed interest rate swaps that were designated as cash flow hedges of interestpayments at October 1, 2016 or at October 3, 2015 , and gains and losses related to pay-fixed swaps recognized in earnings for fiscal years 2016 , 2015 and 2014were not material.
Foreign Exchange Risk ManagementThe Company transacts business globally and is subject to risks associated with changing foreign currency exchange rates. The Company’s objective is to
reduce earnings and cash flow fluctuations associated with foreign currency exchange rate changes, enabling management to focus on core business issues andchallenges.
The Company enters into option and forward contracts that change in value as foreign currency exchange rates change to protect the value of its existingforeign currency assets, liabilities, firm commitments and forecasted but not firmly committed foreign currency transactions. In accordance with policy, theCompany hedges its forecasted foreign currency transactions for periods generally not to exceed four years within an established minimum and maximum range ofannual exposure. The gains and losses on these contracts offset changes in the U.S. dollar equivalent value of the related forecasted transaction, asset, liability orfirm commitment. The principal currencies hedged are the euro, Japanese yen, Canadian dollar and British pound. Cross-currency swaps are used to effectivelyconvert foreign currency-denominated borrowings into U.S. dollar denominated borrowings.
102
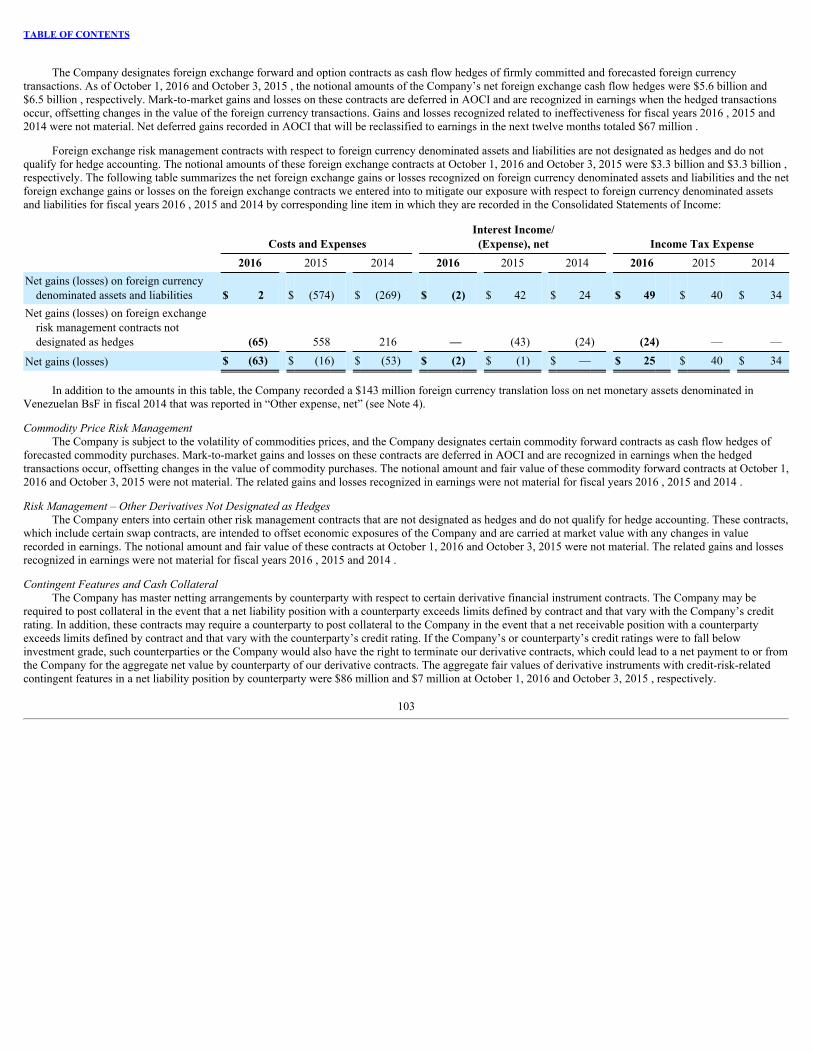
TABLE OF CONTENTS
The Company designates foreign exchange forward and option contracts as cash flow hedges of firmly committed and forecasted foreign currencytransactions. As of October 1, 2016 and October 3, 2015 , the notional amounts of the Company’s net foreign exchange cash flow hedges were $5.6 billion and$6.5 billion , respectively. Mark-to-market gains and losses on these contracts are deferred in AOCI and are recognized in earnings when the hedged transactionsoccur, offsetting changes in the value of the foreign currency transactions. Gains and losses recognized related to ineffectiveness for fiscal years 2016 , 2015 and2014 were not material. Net deferred gains recorded in AOCI that will be reclassified to earnings in the next twelve months totaled $67 million .
Foreign exchange risk management contracts with respect to foreign currency denominated assets and liabilities are not designated as hedges and do notqualify for hedge accounting. The notional amounts of these foreign exchange contracts at October 1, 2016 and October 3, 2015 were $3.3 billion and $3.3 billion ,respectively. The following table summarizes the net foreign exchange gains or losses recognized on foreign currency denominated assets and liabilities and the netforeign exchange gains or losses on the foreign exchange contracts we entered into to mitigate our exposure with respect to foreign currency denominated assetsand liabilities for fiscal years 2016 , 2015 and 2014 by corresponding line item in which they are recorded in the Consolidated Statements of Income:
Costs and Expenses Interest Income/(Expense), net Income Tax Expense
2016 2015 2014 2016 2015 2014 2016 2015 2014Net gains (losses) on foreign currency
denominated assets and liabilities $ 2 $ (574) $ (269) $ (2) $ 42 $ 24 $ 49 $ 40 $ 34Net gains (losses) on foreign exchange
risk management contracts notdesignated as hedges (65) 558 216 — (43) (24) (24) — —
Net gains (losses) $ (63) $ (16) $ (53) $ (2) $ (1) $ — $ 25 $ 40 $ 34
In addition to the amounts in this table, the Company recorded a $143 million foreign currency translation loss on net monetary assets denominated inVenezuelan BsF in fiscal 2014 that was reported in “Other expense, net” (see Note 4).
Commodity Price Risk ManagementThe Company is subject to the volatility of commodities prices, and the Company designates certain commodity forward contracts as cash flow hedges of
forecasted commodity purchases. Mark-to-market gains and losses on these contracts are deferred in AOCI and are recognized in earnings when the hedgedtransactions occur, offsetting changes in the value of commodity purchases. The notional amount and fair value of these commodity forward contracts at October 1,2016 and October 3, 2015 were not material. The related gains and losses recognized in earnings were not material for fiscal years 2016 , 2015 and 2014 .
Risk Management – Other Derivatives Not Designated as HedgesThe Company enters into certain other risk management contracts that are not designated as hedges and do not qualify for hedge accounting. These contracts,
which include certain swap contracts, are intended to offset economic exposures of the Company and are carried at market value with any changes in valuerecorded in earnings. The notional amount and fair value of these contracts at October 1, 2016 and October 3, 2015 were not material. The related gains and lossesrecognized in earnings were not material for fiscal years 2016 , 2015 and 2014 .
Contingent Features and Cash CollateralThe Company has master netting arrangements by counterparty with respect to certain derivative financial instrument contracts. The Company may be
required to post collateral in the event that a net liability position with a counterparty exceeds limits defined by contract and that vary with the Company’s creditrating. In addition, these contracts may require a counterparty to post collateral to the Company in the event that a net receivable position with a counterpartyexceeds limits defined by contract and that vary with the counterparty’s credit rating. If the Company’s or counterparty’s credit ratings were to fall belowinvestment grade, such counterparties or the Company would also have the right to terminate our derivative contracts, which could lead to a net payment to or fromthe Company for the aggregate net value by counterparty of our derivative contracts. The aggregate fair values of derivative instruments with credit-risk-relatedcontingent features in a net liability position by counterparty were $86 million and $7 million at October 1, 2016 and October 3, 2015 , respectively.
103

TABLE OF CONTENTS
17 Restructuring and Impairment Charges
The Company recorded $156 million , $53 million and $140 million of restructuring and impairment charges in fiscal years 2016 , 2015 and 2014 ,respectively. Charges in fiscal 2016 were primarily due to an investment impairment, asset impairments associated with shutting down certain international filmproduction operations and severance and contract termination costs. Charges in fiscal 2015 were primarily due to a contract termination and severance. Charges infiscal 2014 were primarily due to severance and radio FCC license impairments.
18 New Accounting Pronouncements
Restricted CashIn November 2016, the Financial Accounting Standards Board (FASB) issued guidance that requires restricted cash to be presented with cash and cash
equivalents in the statement of cash flows. The guidance is required to be adopted retrospectively, and is effective beginning in the first quarter of the Company’s2019 fiscal year (with early adoption permitted). At October 1, 2016 and October 3, 2015, the Company held restricted cash of $150 million and $456 million ,respectively, primarily associated with collateral received from counterparties to its derivative contracts. The Company’s restricted cash balances are presented inthe Consolidated Balance Sheets as Other current assets and Other assets based on the maturity dates of the related derivatives. Under the new guidance, changes inthe Company’s restricted cash will continue to be classified as either operating activities or investing activities in the Consolidated Statements of Cash Flows,depending on the nature of the activities that gave rise to the restriction.Intra-Entity Transfers of Assets Other Than Inventory
In October 2016, the FASB issued guidance that requires the income tax consequences of an intra-entity transfer of an asset other than inventory to berecognized when the transfer occurs instead of when the asset is sold to an outside party. The new guidance is effective beginning with the first quarter of theCompany’s 2019 fiscal year (with early adoption permitted as of the beginning of an annual period). The guidance is required to be adopted retrospectively byrecording a cumulative-effect adjustment to retained earnings as of the beginning of the adoption period. The Company is assessing the potential impact thisguidance will have on its financial statements.Stock Compensation - Employee Share-based Payments
In March 2016, the FASB issued guidance to amend certain aspects of accounting for employee share-based awards, including accounting for income taxesrelated to those transactions. This guidance will require recognizing excess tax benefits and deficiencies (that result from an increase or decrease in the fair value ofan award from grant date to the vesting date or exercise date) on share-based compensation arrangements in the tax provision, instead of in equity as under thecurrent guidance. In addition, these amounts will be classified as an operating activity in the statement of cash flows, instead of as a financing activity. TheCompany reported excess tax benefits of approximately $0.2 billion , $0.3 billion and $0.3 billion in fiscal 2016, 2015 and 2014, respectively. In addition, cashpaid for shares withheld to satisfy employee taxes will be classified as a financing activity, instead of as an operating activity. Cash paid for employee taxes wasapproximately $0.2 billion , $0.3 billion and $0.3 billion in fiscal 2016, 2015 and 2014, respectively. The fiscal 2016, 2015 and 2014 amounts of excess taxbenefits and cash paid for employee taxes are not necessarily indicative of future amounts that may arise in years following implementation of the new accountingpronouncement. The guidance is effective beginning in the first quarter of the Company’s 2018 fiscal year (with early adoption permitted) and is required to beadopted as follows:
• Prospectively for the recognition of excess tax benefits and deficiencies in the tax provision• Retrospectively or prospectively for the classification of excess tax benefits and deficiencies in the statement of cash flows• Retrospectively for the classification of cash paid for shares withheld to satisfy employee taxes in the statement of cash flows
LeasesIn February 2016, the FASB issued a new lease accounting standard, which requires the present value of committed operating lease payments to be recorded
as right-of-use lease assets and lease liabilities on the balance sheet. As of October 1, 2016, the Company had an estimated $3.1 billion in undiscounted futureminimum lease commitments. The Company is currently assessing the impact of the new guidance on its financial statements. The guidance is required to beadopted retrospectively, and is effective beginning in the first quarter of the Company’s 2020 fiscal year (with early adoption permitted).
Income Taxes
In November 2015, the FASB issued guidance to simplify the presentation of deferred income taxes by reporting the net amount of deferred tax assets andliabilities on a jurisdiction by jurisdiction basis as non-current on the balance sheet. The
104

TABLE OF CONTENTS
Company adopted the provisions of this guidance on a prospective basis in the first quarter of fiscal 2016 by reclassifying $0.8 billion in current assets andreporting them as a reduction to non-current liabilities.
Revenue from Contracts with CustomersIn May 2014, the FASB issued guidance that replaces the existing accounting standards for revenue recognition with a single comprehensive five-step
model. The core principle is to recognize revenue upon the transfer of goods or services to customers at an amount that reflects the consideration expected to bereceived. Since its issuance, the FASB has amended several aspects of the new guidance, including provisions that address revenue recognition associated with thelicensing of intellectual property. The new guidance, including the amendments, is effective beginning with the first quarter of the Company’s 2019 fiscal year(with early adoption permitted beginning fiscal year 2018). The guidance may be adopted either by restating all years presented in the Company’s financialstatements or by recording the impact of adoption as an adjustment to retained earnings at the beginning of the year of adoption. The Company is assessing thepotential impact this guidance will have on its financial statements.
105

TABLE OF CONTENTS
QUARTERLY FINANCIAL SUMMARY(in millions, except per share data)
(unaudited) Q1 (1) Q2 (2) Q3 (3) Q4 (4)
2016 Revenues $ 15,244 $ 12,969 $ 14,277 $ 13,142Segment operating income (5) 4,267 3,822 4,456 3,176Net income 2,910 2,276 2,712 1,892Net income attributable to Disney 2,880 2,143 2,597 1,771Earnings per share:
Diluted $ 1.73 $ 1.30 $ 1.59 $ 1.10Basic 1.74 1.31 1.60 1.10
2015 Revenues $ 13,391 $ 12,461 $ 13,101 $ 13,512Segment operating income (5) 3,545 3,482 4,120 3,534Net income 2,244 2,228 2,639 1,741Net income attributable to Disney 2,182 2,108 2,483 1,609Earnings per share:
Diluted $ 1.27 $ 1.23 $ 1.45 $ 0.95Basic 1.28 1.24 1.46 0.96
(1) Results for the first quarter of fiscal 2016 included the Vice Gain, which had a favorable impact of $0.13 on earnings per diluted share, partially offset by
restructuring and impairment charges ( $0.03 per diluted share). These items resulted in a net positive benefit of $0.10 on diluted earnings per share.(2) Results for the second quarter of fiscal 2016 included an adverse impact of $0.06 on diluted earnings per share due to the Infinity Charge.(3) Results for the third quarter of fiscal 2016 included restructuring and impairment charges, which had an adverse impact of $0.03 on diluted earnings per share.(4) Results for the fourth quarter of fiscal 2016 included a favorable adjustment to the Infinity Charge taken in the second quarter ( $0.01 per diluted share),
partially offset by restructuring and impairment charges ( $0.01 per diluted share). Results for the fourth quarter of fiscal 2015 included a non-cash charge inconnection with the write-off of a deferred tax asset as a result of the Disneyland Paris recapitalization ( $0.24 per diluted share) and restructuring andimpairment charges ( $0.02 per diluted share), which collectively resulted in a net adverse impact of $0.25 per diluted share.
(5) Segment operating results reflect earnings before the Infinity Charge, corporate and unallocated shared expenses, restructuring and impairment charges, otherexpense, interest income/(expense), income taxes and noncontrolling interests. Segment operating income includes equity in the income of investees exceptfor the Vice Gain.
106

RESTATED CERTIFICATE OF INCORPORATION
OF
THE WALT DISNEY COMPANY
ARTICLE I
NAME
The name of the Corporation is The Walt Disney Company.
ARTICLE II
ADDRESS OF REGISTERED OFFICE;NAME OF REGISTERED AGENT
The address of the registered office of the Corporation in the State of Delaware is 2711 Centerville Road, Suite 400, City ofWilmington 19808, County of New Castle. The name of its registered agent at that address is Corporation Service Company.
ARTICLE III
PURPOSE
The purpose of the Corporation is to engage in any lawful act or activity for which a corporation may now or hereafter be organizedunder the General Corporation Law of the State of Delaware as set forth in Title 8 of the Delaware Code, as in effect from time to time (the“DGCL”).
ARTICLE IV
CAPITAL STOCK
1. Authorization.
The total number of shares of stock which the Corporation shall have authority to issue is 4,700,000,000 , of which 4,600,000,000shares shall be shares of common stock having a par value of $.01 per share (“Common Stock”) and 100,000,000 shares shall be shares ofpreferred stock having a par value of $.01 per share (“Preferred Stock”) and issuable in one or more classes or series as hereinafter provided.
The number of authorized shares of any class or classes of capital stock of the Corporation may be increased or decreased (but notbelow the number of shares thereof then outstanding) by the
1
affirmative vote of the holders of a majority of the voting power of the stock of the Corporation entitled to vote generally in the election ofdirectors.
2. Common Stock
The voting powers, preferences and relative, participating, optional or other special rights of the Common Stock, and thequalifications and restrictions thereon, shall be as follows in this Section 2.
2.1 Dividends
Subject to any preferences and relative, participating, optional or other special rights of any outstanding series of Preferred Stockand any qualifications or restrictions on the Common Stock created thereby, dividends may be declared and paid upon Common Stock uponsuch terms as the Board of Directors may determine out of the funds of the Corporation legally available therefor.
2.2 Voting Powers
Except as otherwise provided by law or by the terms of any outstanding series of Preferred Stock or any provision of the RestatedCertificate of Incorporation or Bylaws of the Corporation, the entire voting power of the stockholders of the Corporation shall be vested inthe holders of Common Stock of the Corporation, who shall be entitled to vote on any matter on which the holders of stock of the Corporationshall, by law or by the provisions of the Restated Certificate of Incorporation or Bylaws of the Corporation, be entitled to vote. On eachmatter to be voted on by the holders of Common Stock each outstanding share of Common Stock shall have one vote.
2.3 Liquidation Rights
In the event of the voluntary or involuntary dissolution of the Corporation or the liquidation and winding up of the Corporation,after payment or provision for payment of the debts and other liabilities of the Corporation and the full preferential amounts (including anyaccumulated and unpaid dividends) to which the holders of Preferred Stock are entitled, unless otherwise provided in respect of a series ofPreferred Stock by the resolution of the Board of Directors fixing the liquidation rights and preferences of such series of Preferred Stock, theholders of the outstanding shares of Common Stock shall be entitled to receive the remaining assets of the Corporation on a per share basis.Neither the merger nor consolidation of the Corporation into or with any other company, nor the merger or consolidation of any othercompany into or with the Corporation, nor a sale, transfer or lese of all or any part of the assets of the Corporation, shall, alone, be deemed aliquidation or winding up of the Corporation, or cause the dissolution of the Corporation, for purposes of this subsection 2.3.
3. Preferred Stock
Shares of the Preferred Stock of the Corporation may be issued from time to time in one or more classes or series, each of which classor series shall have such distinctive designation, number of shares, or title as shall be fixed by the Board of Directors prior to the issuance ofany shares thereof. Each such class or series of Preferred Stock shall consist of such number of shares, and have such voting powers, full orlimited, or no voting powers, and such preferences and relative, participating, optional or other special rights and such qualifications,limitations, or restrictions
2
thereof, as shall be stated in such resolution or resolutions providing for the issue of such series of Preferred Stock as may be adopted fromtime to time by the Board of Directors prior to the issuance of any shares thereof pursuant to the authority hereby expressly vested in it, all inaccordance with the laws of the State of Delaware. By Certificate of Designations dated November 17, 1999, the Corporation authorized theissuance of Series A Voting Preferred Stock, a copy of which Certificate of Designations is attached hereto as Exhibit A.
ARTICLE V
BOARD OF DIRECTORS
1. Number of Directors.
The business and affairs of the Corporation shall be managed by or under the direction of a Board of Directors consisting of not lessthan nine directors or more than twenty-one (21) directors, the exact number of directors to be determined from time to time solely byresolution adopted by the Board of Directors.
2. Term of Office .
All directors shall be of one class and serve for a term ending at the annual meeting following the annual meeting at which thedirector was elected. In no case shall a decrease in the number of directors shorten the term of any incumbent director. Each director shallhold office after the annual meeting at which his or her term is scheduled to end until his or her successor shall be elected and shall qualify,subject, however, to prior death, resignation, disqualification or removal from office.
3. Vacancies.
Any newly created directorship resulting from an increase in the number of directors may be filled by a majority of the Board ofDirectors then in office, provided that a quorum is present, and any other vacancy on the Board of Directors may be filled by a majority of thedirectors then in office, even if less than a quorum, or by a sole remaining director.
4. Special Voting Rights of Preferred Stock Holders.
Notwithstanding the foregoing provisions, whenever the holders of any one or more classes or series of Preferred Stock issued by theCorporation shall have the right, voting separately by class or series, to elect directors at an annual or special meeting of stockholders, theelection, term of office, filling of vacancies and other features of such directorships shall be governed by the terms of this Restated Certificateof Incorporation or the resolution or resolutions adopted by the Board of Directors pursuant to Article IV applicable thereto.
5. Selection by Written Ballot.
Elections of directors at an annual or special meeting of stockholders shall be by written ballot unless the Bylaws of the Corporationshall otherwise provide.
3

ARTICLE VI
SPECIAL MEETINGS OF STOCKHOLDERS
A special meeting of the stockholders of the Corporation may be called only by (i) the Board of Directors, (ii) the Chairman of theBoard of Directors, (iii) the Chief Executive Officer, or (iv) solely to the extent required by the Bylaws of the Corporation, the Secretary ofthe Corporation at the request in proper form of stockholders who have continuously held as stockholders of record a net long position inshares of Common Stock representing in the aggregate at least twenty-five percent (25%) of the outstanding shares of Common Stock for atleast one year prior to the date such request is delivered to the Secretary. Special meetings of the stockholders of the Corporation may not becalled by any other person or persons.
ARTICLE VII
INDEMNIFICATION; LIMITATION ON LIABILITY OF DIRECTORS
1. Indemnification .
The Corporation shall indemnify to the full extent authorized or permitted by law (as now or hereinafter in effect) any person made,or threatened to be made, a defendant or witness to any action, suit or proceeding (whether civil or criminal or otherwise) by reason of thefact that he, his testator or intestate, is or was a director or officer of the Corporation or by reason of the fact that such director or officer, atthe request of the Corporation, is or was serving any other corporation, partnership, joint venture, trust, employee benefit plan or otherenterprise, in any capacity. Nothing contained herein shall affect any rights to indemnification to which employees other than directors andofficers may be entitled by law. No amendment or repeal of this subsection 1 of this Article VII shall apply to or have any effect on any rightto indemnification provided hereunder with respect to any acts or omissions occurring prior to such amendment or repeal.
2. Limitation of Liability.
A director of this Corporation shall not be liable to the Corporation or its stockholders for monetary damages for breach of fiduciaryduty as a director, except to the extent such exemption from liability or limitation thereof is not permitted under the DGCL. Any repeal ormodification of the foregoing sentence shall not adversely affect any right or protection of a director of the Corporation existing hereunderwith respect to any act or omission occurring prior to such repeal or modification.
3. Insurance, Trust Funds.
In furtherance and not in limitation of the powers conferred by statute:
3.1 the Corporation may purchase and maintain insurance on behalf of any person who is or was a director, officer, employee oragent of the Corporation, or is serving at the request of the Corporation as a director, officer, employee or agent of another corporation,partnership, joint venture, trust, employee benefit plan or other enterprise against any liability asserted against him and incurred by him in anysuch capacity, or arising out of his status as such, whether or not the Corporation would have the power to indemnify him against suchliability under the provisions of
4

law; and
3.2 the Corporation may create a trust fund, grant a security interest and/or use other means (including, without limitation, letters ofcredit, surety bonds, and/or other similar arrangements), as well as enter into contracts providing indemnification to the full extent authorizedor permitted by law and including as part thereof provisions with respect to any or all of the foregoing to ensure the payment of such amountsas may become necessary to effect indemnification as provided therein, or elsewhere.
ARTICLE VIII
BYLAWS
In furtherance and not in limitation of the powers conferred by statute, the Board of Directors is expressly authorized to adopt, repeal,alter, amend or rescind the Bylaws of the Corporation. In addition, the Bylaws of the Corporation may be adopted, repealed, altered, amendedor rescinded by the affirmative vote of a majority of the outstanding stock of the Corporation entitled to vote thereon.
ARTICLE IX
AMENDMENT OF CERTIFICATE OF INCORPORATION
The Corporation reserves the right to repeal, alter, amend or rescind any provision contained in this Restated Certificate ofIncorporation, in the manner now or hereafter prescribed by statute, and all rights conferred on stockholders herein are granted subject to thisreservation.
5

Exhibit A
CERTIFICATE OF DESIGNATION
OF
SERIES A VOTING PREFERRED STOCK
OF
THE WALT DISNEY COMPANY
(Pursuant to Section 151 of the Delaware General Corporation Law)
THE WALT DISNEY COMPANY, a corporation organized and existing under the General Corporation Law of the State ofDelaware (the “Corporation”), DOES HEREBY CERTIFY that pursuant to the authority vested in the Board of Directors of the Corporation(the “Board of Directors” or the “Board”) by the Restated Certificate of Incorporation of the Corporation (the “Restated Certificate ofIncorporation”) and in accordance with the provisions of Section 151 of the General Corporation Law of the State of Delaware, the Board ofDirectors on July 9, 1999 adopted a resolution providing for the authorization of a series of preferred stock as follows:
RESOLVED, that pursuant to the authority granted to and vested in the Board of Directors in accordance with the provisions of theRestated Certificate of Incorporation, the Board hereby creates a series of preferred stock, par value $.01 per share, of the Corporation andhereby states the designation and number of shares, and fixes the relative rights, preferences and limitations thereof, as follows:
Designation and Amount . The designation of the series of the preferred stock shall be “Series A Voting Preferred Stock” and thenumber of shares constituting the Series A Voting Preferred Stock shall be 237,310. Such number of shares may be increased or decreased byresolution of the Board of Directors; provided , however , that no decrease shall reduce the number of shares of Series A Voting PreferredStock to a number less than the number of shares then outstanding plus the number of shares reserved for issuance upon the exercise ofoutstanding options, rights or warrants or upon the conversion of any outstanding securities issued by the Corporation convertible into SeriesA Voting Preferred Stock.
Dividends .(i) Holders of outstanding shares of Series A Voting Preferred Stock shall be entitled to receive cumulative preferential cash
dividends, if, as and when declared by the Board of Directors, out of funds legally available therefor, in an amount per annum equal to theproduct of the “Par Rate” and the Liquidation Preference (as defined below). The “Par Rate,” which shall be determined before the closingdate (the “Closing Date”) of the transactions contemplated by that certain Agreement and Plan of Reorganization, dated as of July 10, 1999(the “Reorganization Agreement”), by and among Infoseek Corporation, the Corporation and Bingo Acquisition Corp., based on the advice ofa reputable investment bank selected by the Corporation and shall be a single fixed rate equal to the highest end of the range of dividend ratesat which the Series A Voting Preferred Stock would be expected to trade at its Liquidation Preference on or about the Closing Date.
(ii) Dividends shall be payable semi-annually in arrears on or before June 30 and December 31 each year or, if not a day, other thana Saturday or Sunday, that is neither a legal holiday nor a day on which banking institutions in New York City are authorized or required bylaw, regulation or executive order to close (each, a “Business Day”), then the next succeeding Business Day (each, a “Dividend Payment
A-1
Date”), commencing on first June 30 or December 31 following the Closing Date. The amount of dividends payable on the Series A VotingPreferred Stock for each full semi-annual period from, and including the applicable Divided Payment Date to, but excluding the nextsucceeding Dividend Payment Date (each, a “Dividend Period”), shall be computed by dividing by two the annual dividend rate set forth inparagraph (i) above. Dividends payable in respect of the period between the date the Corporation first issued shares of Series A VotingPreferred Stock (the “Initial Issue Date”) and the first Dividend Payment Date thereafter (the “Initial Dividend Period”) and any subsequentperiod between Dividend Payment Dates which is less than a full Dividend Period in length will be computed on the basis of a 360-day yearconsisting of twelve 30-day months. Dividends shall be paid to holders of record as their names appear on the stock register of theCorporation at the close of business on the first day of the calendar month in which the applicable Dividend Payment Date falls or on suchother date designated by the Board of Directors for the payment of dividends that is not more than 30 nor less than 10 days prior to suchDividend Payment Date (each, a “Record Date”). Dividends in respect of any past Dividend Periods that are in arrears may be authorized andpaid at any time to holders of record on the Record Date thereof. Any dividend payment made to holders of Series A Voting Preferred Stockshall be first credited against the earliest accrued but unpaid dividend due which remains payable.
(iii) Dividends shall be fully cumulative and shall accrue (whether or not declared), with additional payments thereon, from the firstday of the Dividend Period in which such dividend may be payable as herein provided on all shares of Series A Voting Preferred Stock issuedand outstanding on the first day of such Dividend Period, except that with respect to the Initial Dividend Period, such dividend shall accruefrom the Initial Issue Date.
(iv) All dividends paid with respect to shares of Series A Voting Preferred Stock pursuant to paragraph (ii) above shall be paid prorata to the holders entitled thereto.
(v) If at any time the Corporation shall have failed to pay all dividends which have accrued on any outstanding shares of any otherclass or series of preferred stock having cumulative dividend rights ranking on parity with the shares of Series A Voting Preferred Stock atthe times such dividends are payable, no cash dividend shall be declared by the Board of Directors or paid or set apart for payment by theCorporation on shares of Series A Voting Preferred Stock unless prior to or concurrently with such declaration, payment, or setting apart forpayment, all accrued and unpaid dividends on all outstanding shares of such other series of preferred stock shall have been or be declared,paid or set apart for payment with additional payments thereon, if any; provided , however , that in the event such failure to pay accrueddividends is with respect only to the outstanding shares of Series A Voting Preferred Stock and any outstanding shares of any other class orseries of preferred stock having cumulative dividend rights on parity with the shares of Series A Voting Preferred Stock, cash dividends maybe declared, paid or set apart for payment, with additional payments thereon, pro rata on shares of Series A Voting Preferred Stock and sharesof such other class or series of preferred stock so that the amounts of any cash dividends declared, paid or set apart for payment on shares ofSeries A Voting Preferred Stock and shares of such other series of preferred stock shall in all cases bear to each other the same ratio that, atthe time of such declaration, payment or setting apart for payment, all accrued but unpaid cash dividends on shares of Series A VotingPreferred Stock and shares of such other series of preferred stock bear to each other. Any dividend not paid pursuant to paragraph (ii) aboveor this paragraph (v) shall be fully cumulative and shall accrue (whether or not declared), with additional payments thereon, as set forth inparagraph (iii) above, even if such dividend is not paid pursuant to paragraph (vii) below.
(vi) (a) Holders of shares of Series A Voting Preferred Stock shall be entitled to receive dividends provided for herein in preferenceto and in priority over any dividends, other than dividends
A-2

paid in stock ranking junior to Series A Voting Preferred Stock (the “Junior Stock”) upon any of the Junior Stock.
(b) So long as any shares of Series A Voting Preferred Stock are outstanding, the Corporation shall not declare, pay or setapart for payment, any dividend on any of the Junior Stock (other than dividends paid in such Junior Stock) or make any payment on accountof, or set apart for payment money for a sinking or other similar fund for, the purchase, redemption or other retirement of, any of the JuniorStock or any warrants, rights, calls or options exercisable for any of the Junior Stock, or make any distribution in respect thereof, eitherdirectly or indirectly, and whether in cash, obligations or shares of the capital stock of the Corporation or other property (other thandistributions or dividends in stock to the holders of such stock), and shall not permit any corporation or other entity directly or indirectlycontrolled by the Corporation to purchase or redeem any of the Junior Stock or any warrants, rights, calls or options exercisable for any of theJunior Stock, unless prior to or concurrently with such declaration, payment, setting apart for payment, purchase or distribution, as the casemay be, all accrued and unpaid cash dividends, including additional payments thereon, on shares of Series A Voting Preferred Stock not paidon the dates provided for in paragraph (ii) above shall have been or be paid; provided , however , that nothing contained herein shall preventthe Corporation from repurchasing shares of the Common Stock (as defined in the Restated Certificate of Incorporation) as required by law orby the terms of any employee stock ownership plan of the Corporation.
(vii) Subject to the foregoing provisions of this section, the Board of Directors may declare and the Corporation may pay or setapart for payment dividends and other distributions on any of the Junior Stock, and may purchase or otherwise redeem any of the JuniorStock or any warrants, rights or options exercisable for any of the Junior Stock, and the holders of the shares of Series A Voting PreferredStock shall not be entitled to share therein.
Liquidation Preference .(i) In the event of any voluntary or involuntary liquidation, dissolution or winding up of the affairs of the Corporation, the holders
of shares of Series A Voting Preferred Stock then outstanding shall be entitled to be paid in cash out of the assets of the Corporation availablefor distribution to its stockholders (x) a fixed amount per share determined on the Closing Date equal to 100 multiplied by the higher of (a)the closing price of common stock, par value $.001 per share (“Infoseek Common Stock”), of Infoseek Corporation as quoted on the NasdaqNational Market (“Nasdaq”) on July 9, 1999 or (B) the closing price of Infoseek Common Stock as quoted on Nasdaq on the last trading dateimmediately prior to the Closing Date, plus (y) an amount equal to all accrued but unpaid dividends on the Series A Voting Preferred Stock tothe date fixed for the liquidation (collectively, the “Liquidation Preference”), before any payment shall be made or any assets distributed tothe holders of any of the Junior Stock. If the assets of the Corporation are not sufficient to pay in full the liquidation payments payable to theholders of outstanding shares of Series A Voting Preferred Stock and any other class or series of preferred stock having liquidation rights onparity with the shares of Series A Voting Preferred Stock, then the holders of all such shares shall share ratably in such distribution of assetsin accordance with the amount which would be payable on such distribution if the amounts to which the holders of outstanding shares ofSeries A Voting Preferred Stock and all the holders of outstanding shares of such other series of preferred stock are entitled were paid in full.
(ii) For the purpose of this section, neither the voluntary sale, conveyance, exchange or transfer (for cash, shares of stock, securitiesor other consideration) of all or substantially all the property or assets of the Corporation, nor the consolidation or merger of the Corporationwith one or more other corporations shall be deemed to be a liquidation, dissolution or winding up, voluntary or involuntary, unless such
A-3

voluntary sale, conveyance, exchange or transfer shall be in connection with a dissolution or winding up of the business of the Corporation.
(iii) The sale, lease or conveyance of all or substantially all of the Corporation’s assets or the merger or consolidation of theCorporation which results in the holders of the Common Stock receiving in exchange for such Common Stock either cash or notes,debentures or other evidences of indebtedness or obligations to pay cash or preferred stock of the surviving entity which ranks on parity withSeries A Voting Preferred Stock in liquidation or dividends shall be deemed to be a liquidation, dissolution or winding up of the affairs of theCorporation within the meaning of this section. In the cases of merger or consolidation of the Corporation where holders of the CommonStock receive, in exchange for such Common Stock, common stock or preferred stock which is junior in liquidation and dividends to Series AVoting Preferred Stock in the surviving entity (whether or not the surviving entity is the Corporation) of such merger or consolidation orpreferred stock of another entity (in either case, such preferred stock to be received in exchange for Common Stock is herein referred to inthis paragraph (iii) as “Exchanged Preferred Stock”) the Series A Voting Preferred Stock shall be deemed to be preferred stock of suchsurviving entity or other entity, as the case may be, with the same dividend rate and equivalent rights to the rights set forth herein. In theevent of a merger or consolidation of the Corporation where the consideration received by the holders of the Common Stock consists of twoor more of the types of consideration set forth above, the holders of Series A Voting Preferred Stock shall be entitled to receive either cash orsecurities based upon the foregoing in the same proportion as the holders of the Common Stock of the Corporation are receiving cash or debtsecurities, or equity securities in the surviving entity or another entity.
Redemption . The Series A Voting Preferred Stock shall not be subject to redemption.
Voting Rights . Except as set forth herein and subject to applicable law, the holders of shares of Series A Voting Preferred Stock shallbe entitled to vote together with the holders of Common Stock and any other class or series of stock entitled to vote with Common Stock as asingle class on all matters to be voted upon by the Common Stock and shall not have any additional voting or veto rights. Each holder ofshares of Series A Voting Preferred Stock shall be entitled to one hundred (100) votes for each share of such stock held by such holder.
Consent . No consent of holders of Series A Voting Preferred Stock shall be required for (i) the creation of any indebtedness of anykind of the Corporation, (ii) the creation of any class of stock of the Corporation ranking junior as to dividends and upon liquidation to theSeries A Voting Preferred Stock, (iii) any increase or decrease in the amount of authorized Common Stock or any increase, decrease orchange from par value to no par value or (iv) the taking of any other action of the Corporation, other than such action as is specificallydescribed herein as requiring the consent of holders of Series A Voting Preferred Stock or as otherwise required by applicable law.
Transfer . Disney Enterprises, Inc. (“DEI”) shall not transfer, convey or sell any shares of Series A Voting Preferred Stock to any“Related Person” (as hereinafter defined) and any purported transfer, conveyance or sale to any Related Person shall be null and void. DEImay, however, transfer, convey or sell shares of Series A Voting Preferred Stock to any person that is not a Related Person. For purposes ofthis section, “Related Person” shall mean the Corporation and any person that bears a relationship to the Corporation described in Section267(b) or Section 707(b) of the Internal Revenue Code of 1986, as amended.
Rank . The Series A Voting Preferred Stock shall, with respect to dividend rights and rights on liquidation, winding up or dissolutionrank (i) on parity with any other class or series of preferred stock
A-4

established by the Board of Directors, the terms of which shall specifically provide that such class or series shall rank on parity with theSeries A Voting Preferred Stock with respect to dividend rights and rights on liquidation, winding up or dissolution, and (ii) prior to any otherequity securities of the Corporation, including the Common Stock, with respect to dividend rights and rights on liquidation, winding up ordissolution.
Amendment . The Restated Certificate of Incorporation of the Corporation shall not be amended in any manner which wouldmaterially alter or change the powers, preferences or special rights of the Series A Voting Preferred Stock so as to affect them adverselywithout the affirmative vote of the holders of at least a majority of the outstanding shares of Series A Voting Preferred Stock, voting togetheras a single class.
A-5

Exhibit 12.1
THE WALT DISNEY COMPANYRATIO OF EARNINGS TO FIXED CHARGES(AMOUNTS IN MILLIONS, EXCEPT RATIOS)
Fiscal Year Ended
2016 2015 2014 2013 2012EARNINGS Income from continuing operations before income taxes $ 14,868 $ 13,868 $ 12,246 $ 9,620 $ 9,260Equity in the income of investees (926) (814) (854) (688) (627)Cash distributions received from equity investees 799 752 718 694 663Interest expense, amortization of debt discounts and
premiums on all indebtedness and amortization ofcapitalized interest 433 325 360 415 525
Imputed interest on operating leases (1) 282 286 294 292 288TOTAL EARNINGS $ 15,456 $ 14,417 $ 12,764 $ 10,333 $ 10,109
FIXED CHARGES Interest expense and amortization of debt discounts and
premiums on all indebtedness $ 354 $ 265 $ 294 $ 349 $ 472Capitalized interest 139 110 73 77 92Imputed interest on operating leases (1) 282 286 294 292 288TOTAL FIXED CHARGES $ 775 $ 661 $ 661 $ 718 $ 852RATIO OF EARNINGS TO FIXED CHARGES (2) 19.9 21.8 19.3 14.4 11.9 (1) The portion of operating rental expense which management believes is representative of the interest component of rent expense.
(2) The ratio does not adjust for interest on unrecognized tax benefits that are recorded as a component of income tax expense.

Exhibit 21
Name of Subsidiary Country of IncorporationABC Cable Networks Group United StatesABC Family Worldwide, Inc. United StatesAmerican Broadcasting Companies, Inc. United StatesBuena Vista Home Entertainment, Inc. United StatesBuena Vista International, Inc. United StatesBuena Vista Pay Television, Inc. United StatesBuena Vista Television, LLC United StatesBuena Vista Theatrical Group Ltd. United StatesBuena Vista Video On Demand United StatesCable LT Holdings, Inc. United StatesDisney Channels (Benelux) B. V. NetherlandsDisney Enterprises, Inc. United StatesDisney Online United StatesDisney Vacation Development, Inc. United StatesDisney/ABC International Television, Inc. United StatesEDL Corporation S.A.S. FranceESPN Enterprises, Inc. United StatesESPN, Inc. United StatesESPN Productions, Inc. United StatesEuro Disney Investments S.A.S. FranceEuro Disney S.A.S. FranceHong Kong Disneyland Management Limited Hong KongImprint, Inc. United StatesInternational Family Entertainment, Inc. United StatesLucasfilm Entertainment Company Ltd. LLC United StatesLucasfilm Ltd. LLC United StatesMagical Cruise Company, Limited United KingdomMaker Studios, Inc. United StatesMarvel Characters B.V. NetherlandsMarvel Entertainment, LLC United StatesMarvel Studios LLC United StatesMVL Film Finance LLC United StatesMVL International C.V. NetherlandsPixar United StatesShanghai International Theme Park Associated Facilities Limited ChinaShanghai International Theme Park Company Limited ChinaThe Walt Disney Company Limited United KingdomTouchstone Television Productions, LLC United StatesTWDC Investment Enterprise, LLC United StatesUTV Software Communications Limited IndiaWalt Disney Parks & Resorts U.S., Inc. United StatesWalt Disney Pictures United StatesWalt Disney Pictures Productions, LLC United States

Exhibit 21
Walt Disney Travel Co., Inc. United StatesWD Holdings (Shanghai), LLC United StatesWedco Global Ventures Three LP United KingdomWedco International Holdings, Inc. United StatesWedco One (Luxembourg) S.a.r.l. Participations S.C.A. Luxembourg

Exhibit 23
CONSENT OF INDEPENDENT REGISTERED PUBLIC ACCOUNTING FIRM
We hereby consent to the incorporation by reference in the Registration Statements on Form S-8 (No. 333-116952, 333-128860, 333-133840, 333-176194, and333-183125) and Form S-3 (No. 333-212597, 333-211269, and 333-186484) of The Walt Disney Company of our report dated November 23, 2016 relating to thefinancial statements and the effectiveness of internal control over financial reporting, which appears in this Form 10-K.
/s/ PRICEWATERHOUSECOOPERS LLP
Los Angeles, CaliforniaNovember 23, 2016

Exhibit 31(a)
RULE 13a-14(a) CERTIFICATION INACCORDANCE WITH SECTION 302
OF THE SARBANES-OXLEY ACT OF 2002
I, Robert A. Iger, Chairman and Chief Executive Officer of The Walt Disney Company (the “Company”), certify that:
1. I have reviewed this annual report on Form 10-K of the Company;
2. Based on my knowledge, this annual report does not contain any untrue statement of a material fact or omit to state a material fact necessary to make thestatements made, in light of the circumstances under which such statements were made, not misleading with respect to the period covered by this annualreport;
3. Based on my knowledge, the financial statements, and other financial information included in this annual report, fairly present in all material respects thefinancial condition, results of operations and cash flows of the registrant as of, and for, the periods presented in this annual report;
4. The registrant’s other certifying officer and I are responsible for establishing and maintaining disclosure controls and procedures (as defined in ExchangeAct Rules 13a-15(e) and 15d-15(e)) and internal control over financial reporting (as defined in Exchange Act Rules 13a-15(f) and 15d-15(f)) for theregistrant and have:
a) designed such disclosure controls and procedures, or caused such disclosure controls and procedures to be designed under our supervision, toensure that material information relating to the registrant, including its consolidated subsidiaries, is made known to us by others within thoseentities, particularly during the period in which this report is being prepared;
b) designed such internal control over financial reporting, or caused such internal control over financial reporting to be designed under oursupervision, to provide reasonable assurance regarding the reliability of financial reporting and the preparation of financial statements forexternal purposes in accordance with generally accepted accounting principles;
c) evaluated the effectiveness of the registrant’s disclosure controls and procedures and presented in this report our conclusions about theeffectiveness of the disclosure controls and procedures, as of the end of the period covered by this report based on such evaluation; and
d) disclosed in this report any change in the registrant’s internal control over financial reporting that occurred during the registrant’s most recentfiscal quarter (the registrant’s fourth fiscal quarter in the case of an annual report) that has materially affected, or is reasonably likely tomaterially affect, the registrant’s internal control over financial reporting; and
5. The registrant’s other certifying officer and I have disclosed, based on our most recent evaluation of internal control over financial reporting, to theregistrant’s auditors and the audit committee of the registrant’s board of directors (or persons performing the equivalent functions):
a) all significant deficiencies and material weaknesses in the design or operation of internal control over financial reporting which are reasonablylikely to adversely affect the registrant’s ability to record, process, summarize and report financial information; and
b) any fraud, whether or not material, that involves management or other employees who have a significant role in the registrant’s internal controlover financial reporting.
Date: November 23, 2016 By: /s/ ROBERT A. IGER Robert A. Iger Chairman and Chief Executive Officer

Exhibit 31(b)
RULE 13a-14(a) CERTIFICATION INACCORDANCE WITH SECTION 302
OF THE SARBANES-OXLEY ACT OF 2002
I, Christine M. McCarthy, Senior Executive Vice President and Chief Financial Officer of The Walt Disney Company (the “Company”), certify that:
1. I have reviewed this annual report on Form 10-K of the Company;
2. Based on my knowledge, this annual report does not contain any untrue statement of a material fact or omit to state a material fact necessary to make thestatements made, in light of the circumstances under which such statements were made, not misleading with respect to the period covered by this annualreport;
3. Based on my knowledge, the financial statements, and other financial information included in this annual report, fairly present in all material respects thefinancial condition, results of operations and cash flows of the registrant as of, and for, the periods presented in this annual report;
4. The registrant’s other certifying officer and I are responsible for establishing and maintaining disclosure controls and procedures (as defined in ExchangeAct Rules 13a-15(e) and 15d-15(e)) and internal control over financial reporting (as defined in Exchange Act Rules 13a-15(f) and 15d-15(f)) for theregistrant and have:
a) designed such disclosure controls and procedures, or caused such disclosure controls and procedures to be designed under our supervision, toensure that material information relating to the registrant, including its consolidated subsidiaries, is made known to us by others within thoseentities, particularly during the period in which this report is being prepared;
b) designed such internal control over financial reporting, or caused such internal control over financial reporting to be designed under oursupervision, to provide reasonable assurance regarding the reliability of financial reporting and the preparation of financial statements forexternal purposes in accordance with generally accepted accounting principles;
c) evaluated the effectiveness of the registrant’s disclosure controls and procedures and presented in this report our conclusions about theeffectiveness of the disclosure controls and procedures, as of the end of the period covered by this report based on such evaluation; and
d) disclosed in this report any change in the registrant’s internal control over financial reporting that occurred during the registrant’s most recentfiscal quarter (the registrant’s fourth fiscal quarter in the case of an annual report) that has materially affected, or is reasonably likely tomaterially affect, the registrant’s internal control over financial reporting; and
5. The registrant’s other certifying officer and I have disclosed, based on our most recent evaluation of internal control over financial reporting, to theregistrant’s auditors and the audit committee of the registrant’s board of directors (or persons performing the equivalent functions):
a) all significant deficiencies and material weaknesses in the design or operation of internal control over financial reporting which are reasonablylikely to adversely affect the registrant’s ability to record, process, summarize and report financial information; and
b) any fraud, whether or not material, that involves management or other employees who have a significant role in the registrant’s internal controlover financial reporting.
Date: November 23, 2016 By: /s/ CHRISTINE M. MCCARTHY Christine M. McCarthy
Senior Executive Vice Presidentand Chief Financial Officer

Exhibit 32(a)
CERTIFICATION PURSUANT TOSECTION 906 OF THE SARBANES-OXLEY ACT OF 2002*
In connection with the Annual Report of The Walt Disney Company (the “Company”) on Form 10-K for the fiscal year ended October 1, 2016 as filed withthe Securities and Exchange Commission on the date hereof (the “Report”), I, Robert A. Iger, Chairman and Chief Executive Officer of the Company, certify,pursuant to 18 U.S.C. §1350, as adopted pursuant to §906 of the Sarbanes-Oxley Act of 2002, that:
1. The Report fully complies with the requirements of Section 13(a) or 15(d), as applicable, of the Securities Exchange Act of 1934; and
2. The information contained in the Report fairly presents, in all material respects, the financial condition and result of operations of the Company.
By: /s/ ROBERT A. IGER Robert A. Iger Chairman and Chief Executive Officer November 23, 2016
* A signed original of this written statement required by Section 906 has been provided to The Walt Disney Company and will be retained by The WaltDisney Company and furnished to the Securities and Exchange Commission or its staff upon request.

Exhibit 32(b)
CERTIFICATION PURSUANT TOSECTION 906 OF THE SARBANES-OXLEY ACT OF 2002*
In connection with the Annual Report of The Walt Disney Company (the “Company”) on Form 10-K for the fiscal year ended October 1, 2016 as filed withthe Securities and Exchange Commission on the date hereof (the “Report”), I, Christine M. McCarthy, Senior Executive Vice President and Chief Financial Officerof the Company, certify, pursuant to 18 U.S.C. §1350, as adopted pursuant to §906 of the Sarbanes-Oxley Act of 2002, that:
1. The Report fully complies with the requirements of Section 13(a) or 15(d), as applicable, of the Securities Exchange Act of 1934; and
2. The information contained in the Report fairly presents, in all material respects, the financial condition and result of operations of the Company.
By: /s/ CHRISTINE M. MCCARTHY Christine M. McCarthy
Senior Executive Vice Presidentand Chief Financial Officer
November 23, 2016
* A signed original of this written statement required by Section 906 has been provided to The Walt Disney Company and will be retained by The WaltDisney Company and furnished to the Securities and Exchange Commission or its staff upon request.