Midterm Corrections Quiz 3 Solutions - Donald Bren School ...

1
THE VISUAL SYSTEM
Visual PerceptionAditi Majumder, UCI
Slide 2 Aditi Majumder, UCI
Visual System
Eye - sensorLateral geniculate nucleusStriate cortex
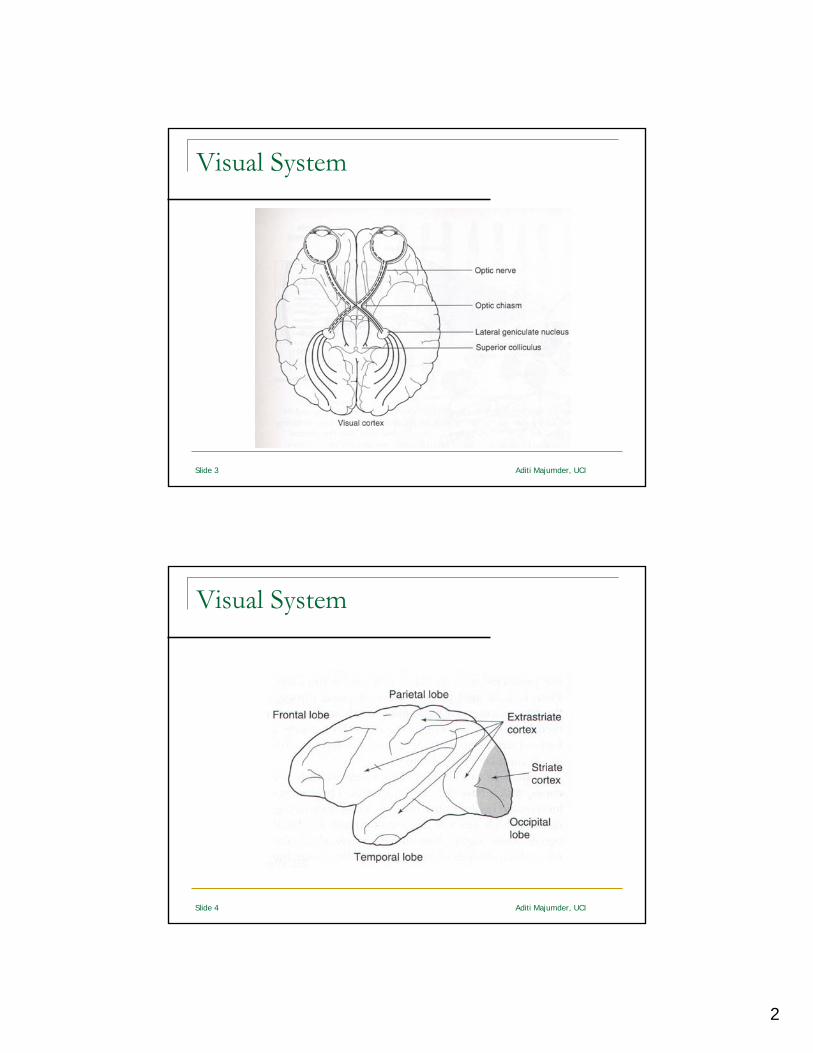
Striped AppearanceExtra striate cortex
2
Slide 3 Aditi Majumder, UCI
Visual System
Slide 4 Aditi Majumder, UCI
Visual System

3
Eye : The Sensor
Slide 6 Aditi Majumder, UCI
Eye : Structure

4
Slide 7 Aditi Majumder, UCI
Eye : Accommodation
Accommodation : Flexible focusing abilityCornea – 80% of focusing abilityLens – 20% adaptable focusing ability
Focus at one depth at a timeLimitation
Depth of fieldNear and far point
Slide 8 Aditi Majumder, UCI
Myopia/Presbyopia
Far and near point is different for different individuals
If near point is far: presbyopiaIf far point is near: myopia
5
Slide 9 Aditi Majumder, UCI
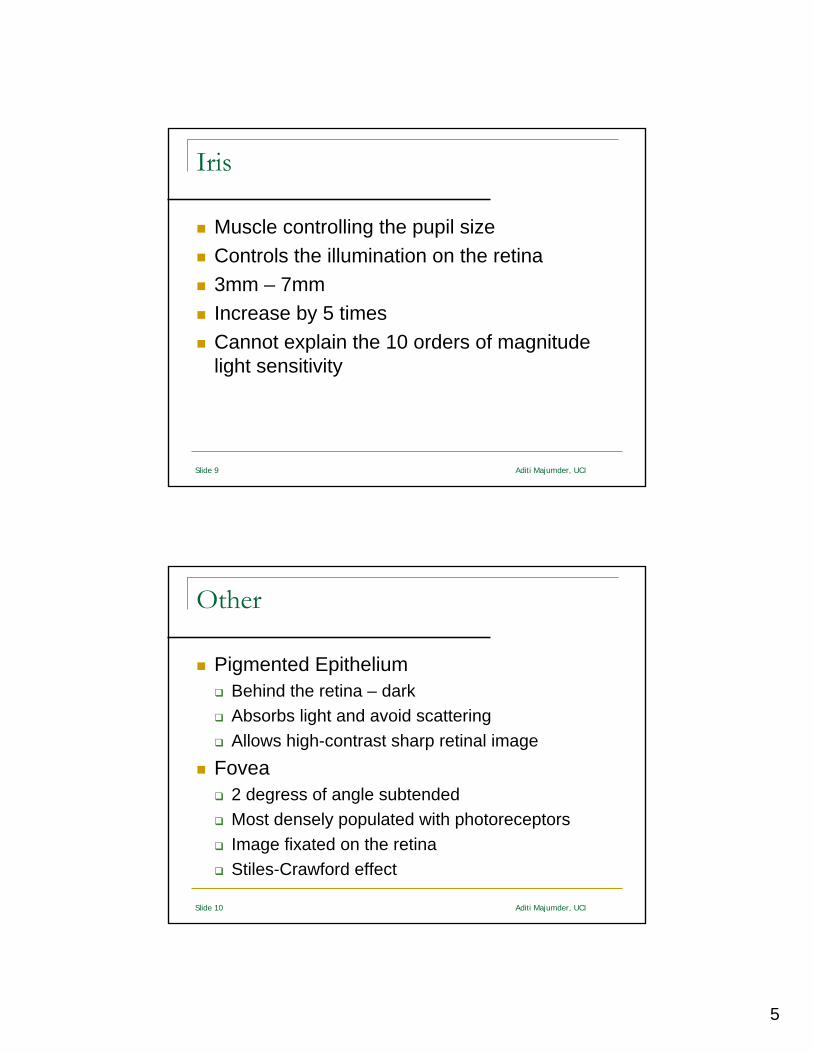
Iris
Muscle controlling the pupil sizeControls the illumination on the retina3mm – 7mmIncrease by 5 timesCannot explain the 10 orders of magnitude light sensitivity
Slide 10 Aditi Majumder, UCI
Other
Pigmented EpitheliumBehind the retina – darkAbsorbs light and avoid scatteringAllows high-contrast sharp retinal image
Fovea2 degress of angle subtendedMost densely populated with photoreceptorsImage fixated on the retinaStiles-Crawford effect
6
Receptors in Eye
Slide 12 Aditi Majumder, UCI
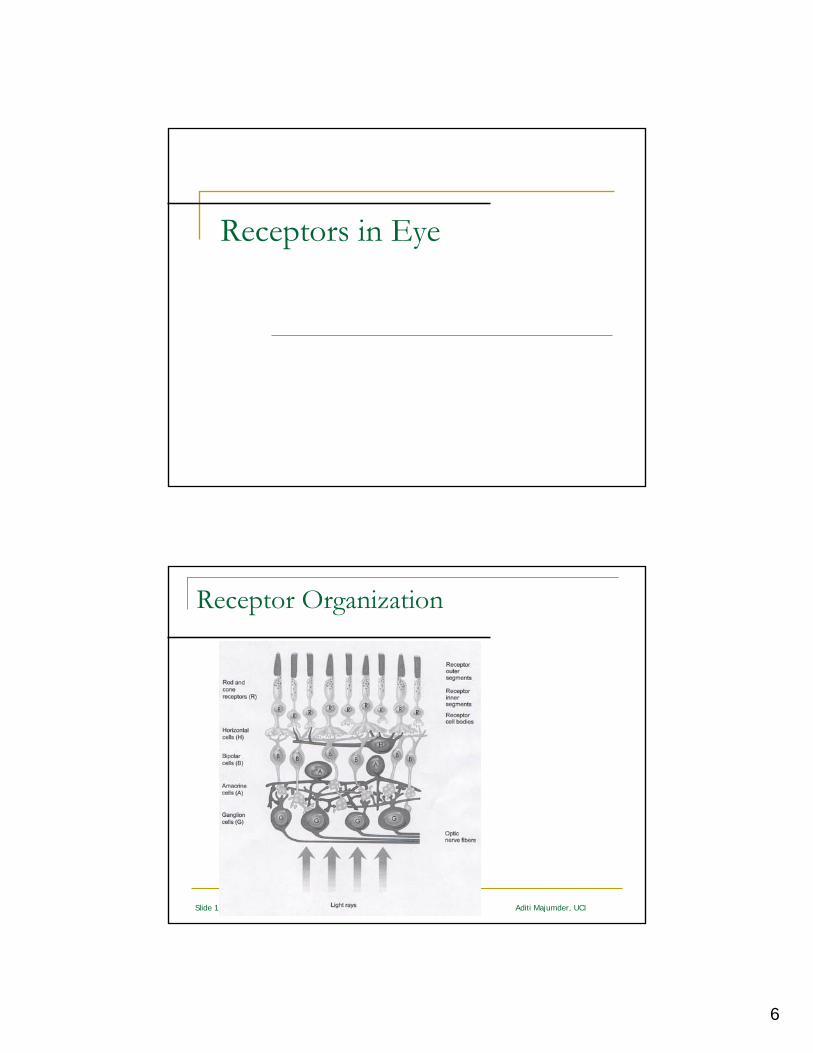
Receptor Organization
7
Slide 13 Aditi Majumder, UCI
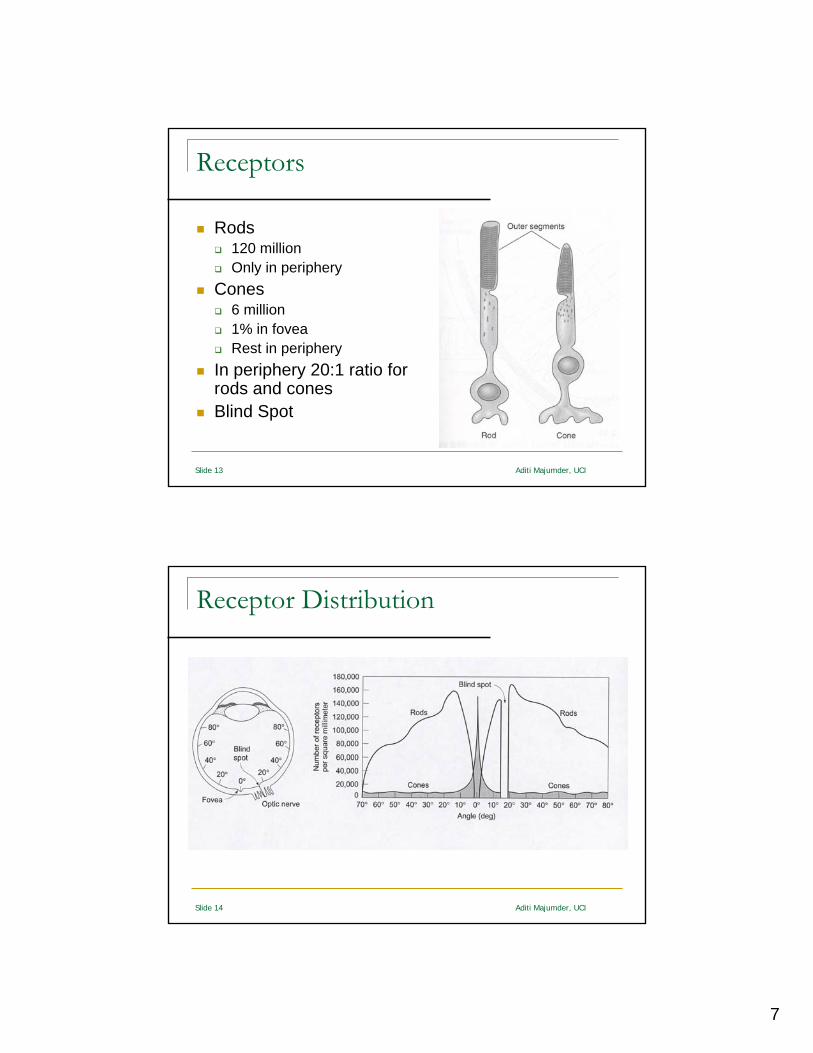
Receptors
Rods120 million Only in periphery
Cones6 million1% in fovea Rest in periphery
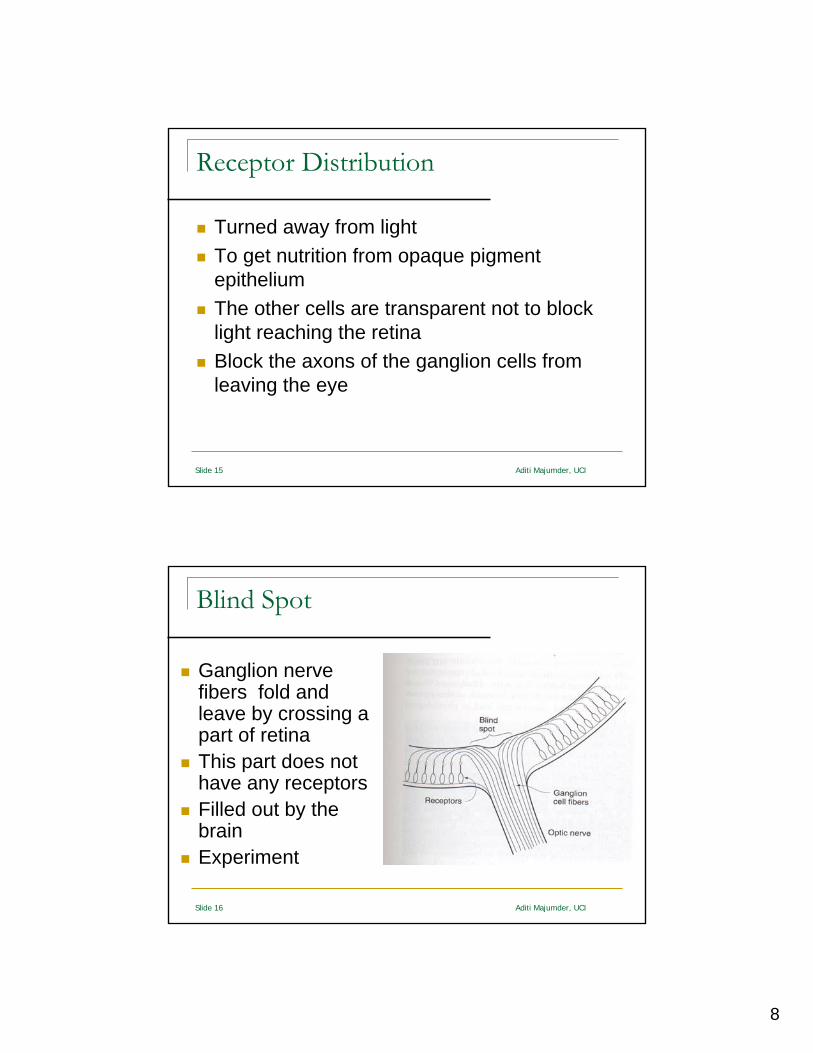
In periphery 20:1 ratio for rods and conesBlind Spot
Slide 14 Aditi Majumder, UCI
Receptor Distribution
8
Slide 15 Aditi Majumder, UCI
Receptor Distribution
Turned away from lightTo get nutrition from opaque pigment epitheliumThe other cells are transparent not to block light reaching the retinaBlock the axons of the ganglion cells from leaving the eye
Slide 16 Aditi Majumder, UCI
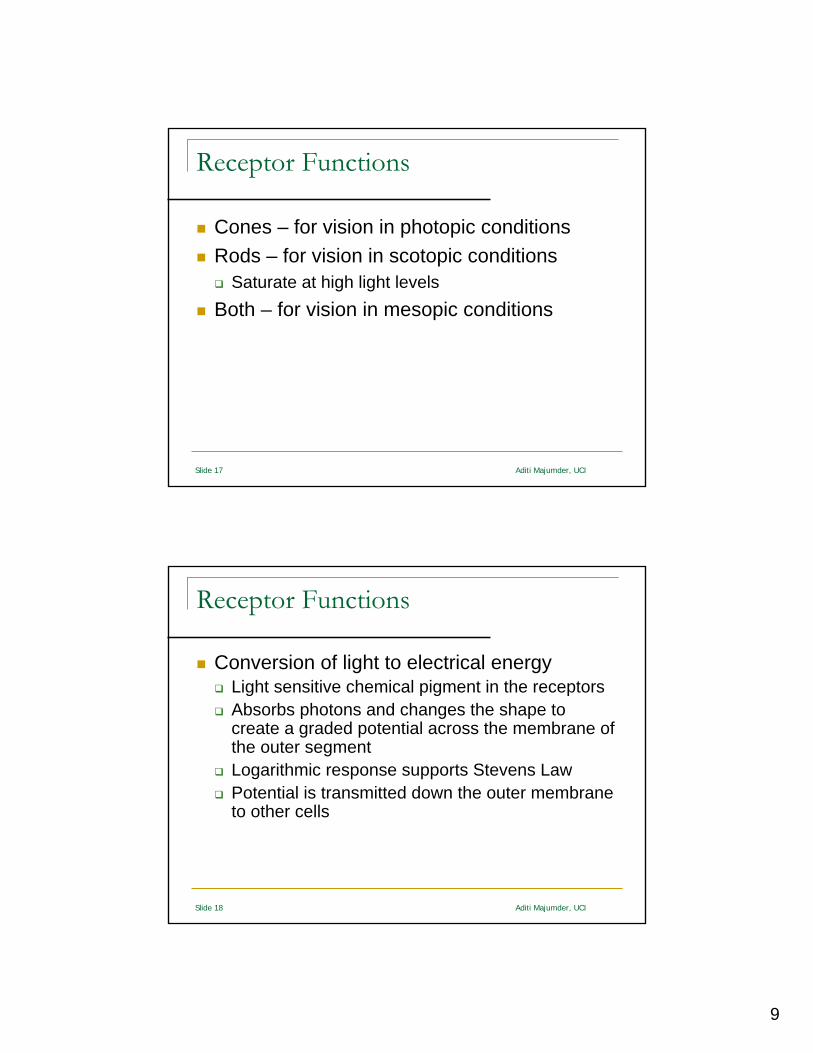
Blind Spot
Ganglion nerve fibers fold and leave by crossing a part of retinaThis part does not have any receptorsFilled out by the brainExperiment
9
Slide 17 Aditi Majumder, UCI
Receptor Functions
Cones – for vision in photopic conditionsRods – for vision in scotopic conditions
Saturate at high light levelsBoth – for vision in mesopic conditions
Slide 18 Aditi Majumder, UCI
Receptor Functions
Conversion of light to electrical energyLight sensitive chemical pigment in the receptorsAbsorbs photons and changes the shape to create a graded potential across the membrane of the outer segmentLogarithmic response supports Stevens LawPotential is transmitted down the outer membrane to other cells
10
Slide 19 Aditi Majumder, UCI
Receptor Functions
Pigment BleachingPigment Regeneration
30 minutes for rods and 6 minutes for cone
Effects of Visual Pigments on Perception
11
Slide 21 Aditi Majumder, UCI
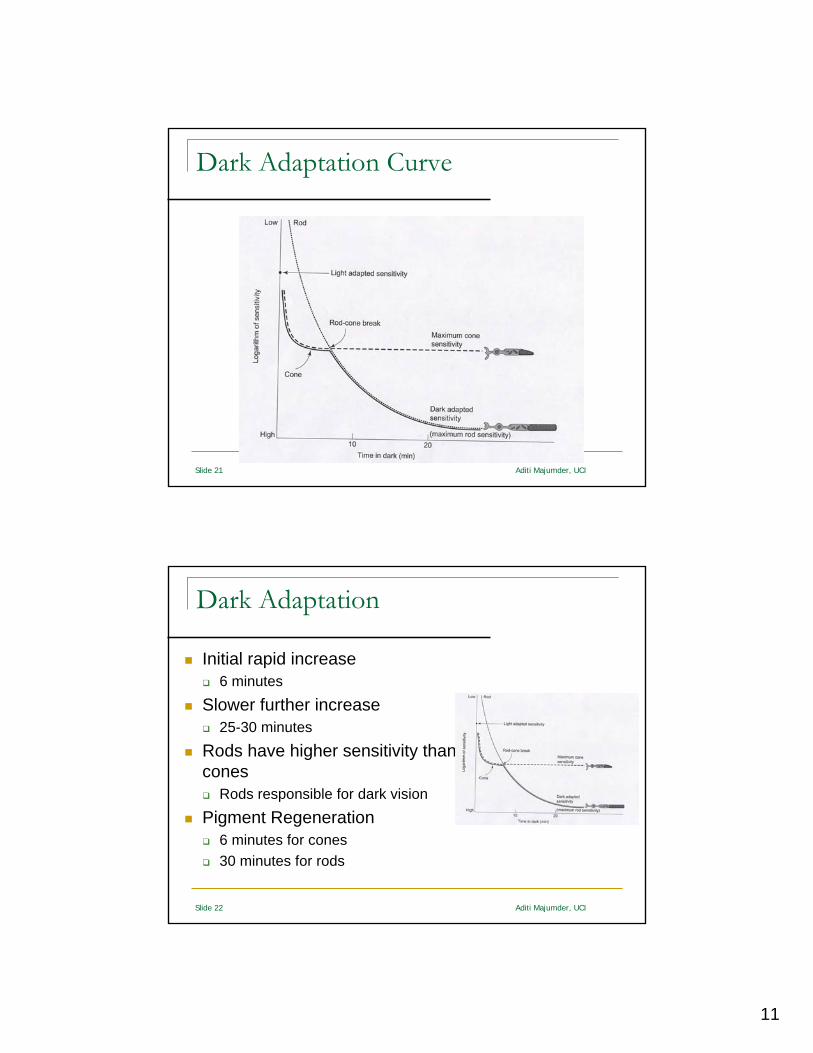
Dark Adaptation Curve
Slide 22 Aditi Majumder, UCI
Dark Adaptation
Initial rapid increase 6 minutes
Slower further increase25-30 minutes
Rods have higher sensitivity than cones
Rods responsible for dark vision
Pigment Regeneration6 minutes for cones30 minutes for rods
12
Slide 23 Aditi Majumder, UCI
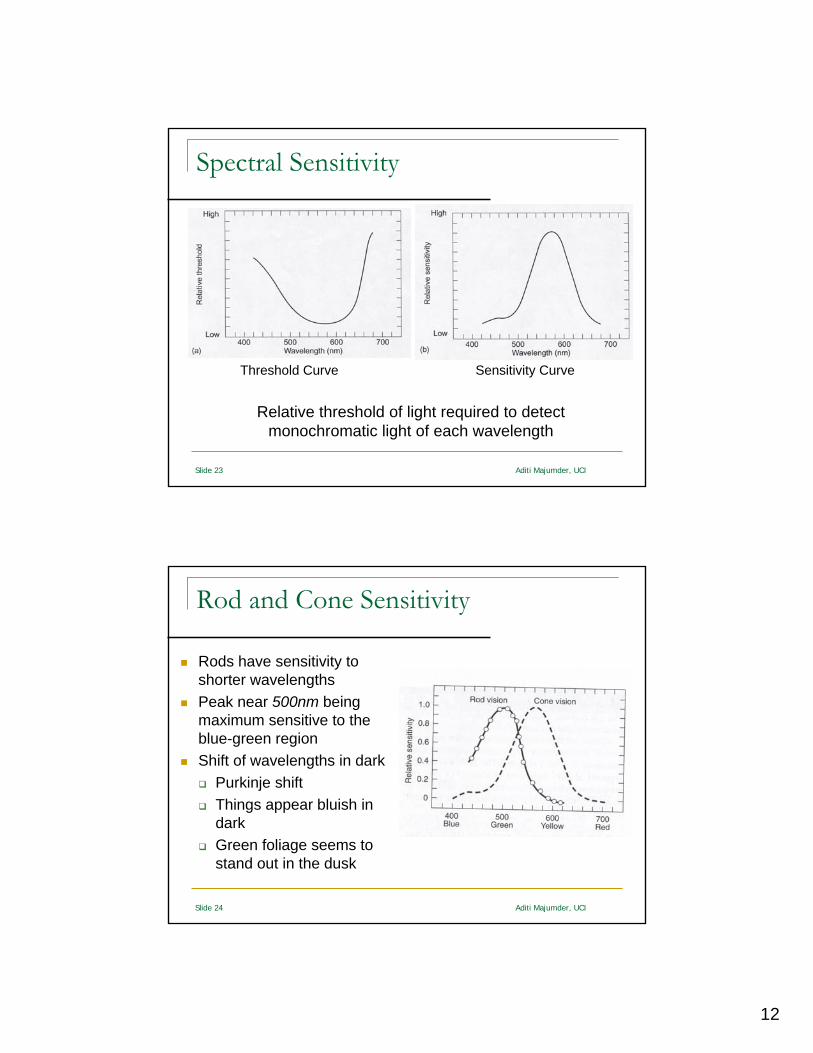
Spectral Sensitivity
Threshold Curve Sensitivity Curve
Relative threshold of light required to detect monochromatic light of each wavelength
Slide 24 Aditi Majumder, UCI
Rod and Cone Sensitivity
Rods have sensitivity to shorter wavelengthsPeak near 500nm being maximum sensitive to the blue-green regionShift of wavelengths in dark
Purkinje shiftThings appear bluish in darkGreen foliage seems to stand out in the dusk
13
Slide 25 Aditi Majumder, UCI
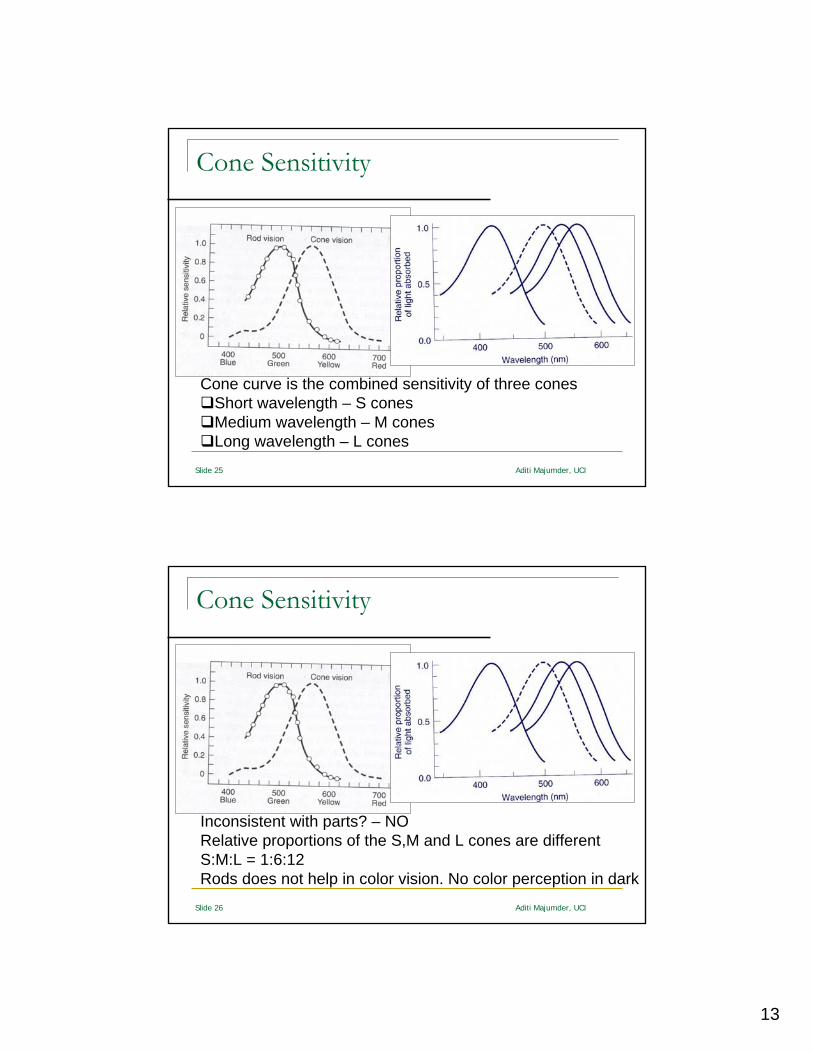
Cone Sensitivity
Cone curve is the combined sensitivity of three conesShort wavelength – S conesMedium wavelength – M conesLong wavelength – L cones
Slide 26 Aditi Majumder, UCI
Cone Sensitivity
Inconsistent with parts? – NORelative proportions of the S,M and L cones are differentS:M:L = 1:6:12Rods does not help in color vision. No color perception in dark
14
Slide 27 Aditi Majumder, UCI
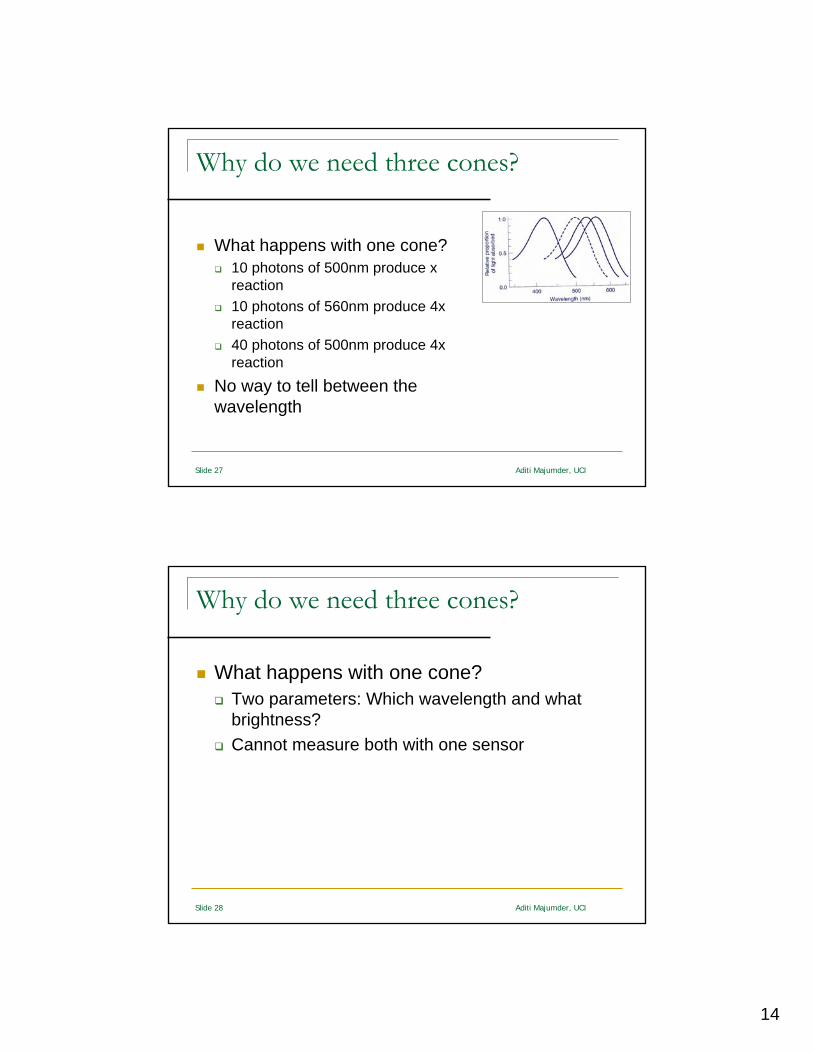
Why do we need three cones?
What happens with one cone?10 photons of 500nm produce x reaction10 photons of 560nm produce 4x reaction40 photons of 500nm produce 4x reaction
No way to tell between the wavelength
Slide 28 Aditi Majumder, UCI
Why do we need three cones?
What happens with one cone?Two parameters: Which wavelength and what brightness?Cannot measure both with one sensor
15
Slide 29 Aditi Majumder, UCI
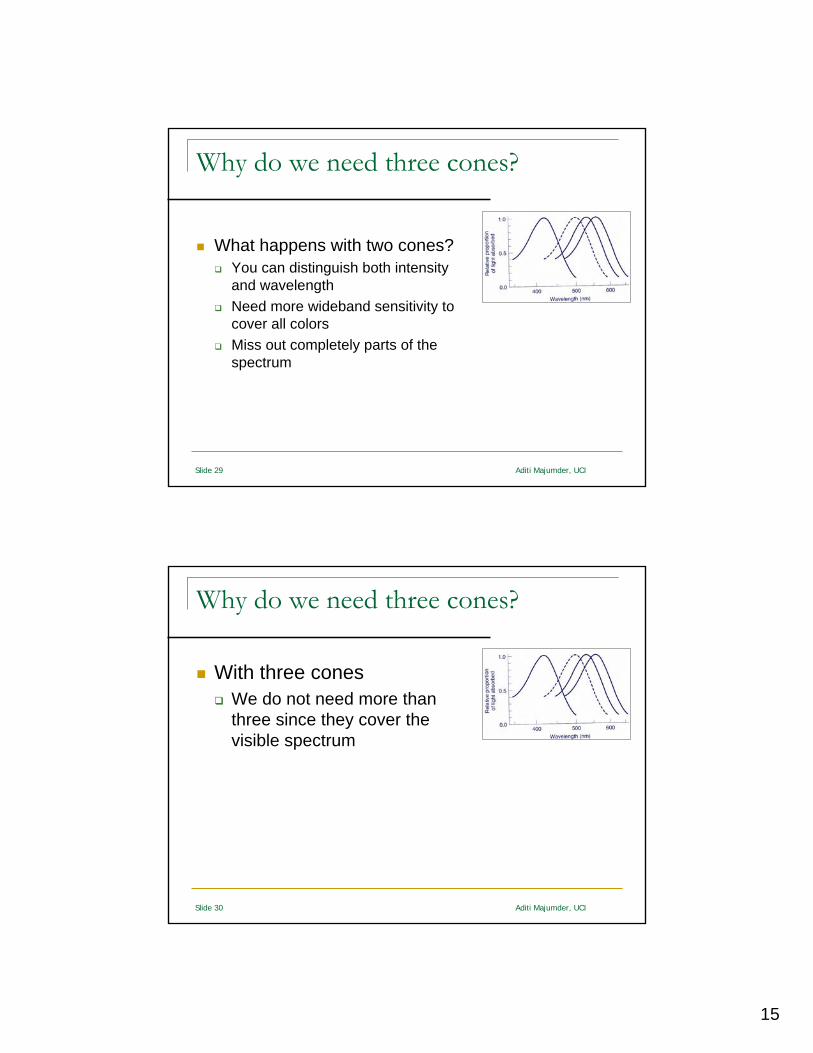
Why do we need three cones?
What happens with two cones?You can distinguish both intensity and wavelengthNeed more wideband sensitivity to cover all colorsMiss out completely parts of the spectrum
Slide 30 Aditi Majumder, UCI
Why do we need three cones?
With three conesWe do not need more than three since they cover the visible spectrum
16
Slide 31 Aditi Majumder, UCI
Why rods not considered as the fourth cone?
Spatial distribution and nature of convergence are completely differentThey are activated usually in completely different light conditions
Effects of Neural Processing on Perception
17
Slide 33 Aditi Majumder, UCI
Convergence
Measured number of neuron synapse on another neuron
Eye : Number of receptor neuron synapses on a ganglion cell
Each ganglion cell receives many synapsesRods to cones convergence ratio is 20:11 million ganglion cells, 120 million rods and 6 million conesRods have higher convergence than cones
Slide 34 Aditi Majumder, UCI
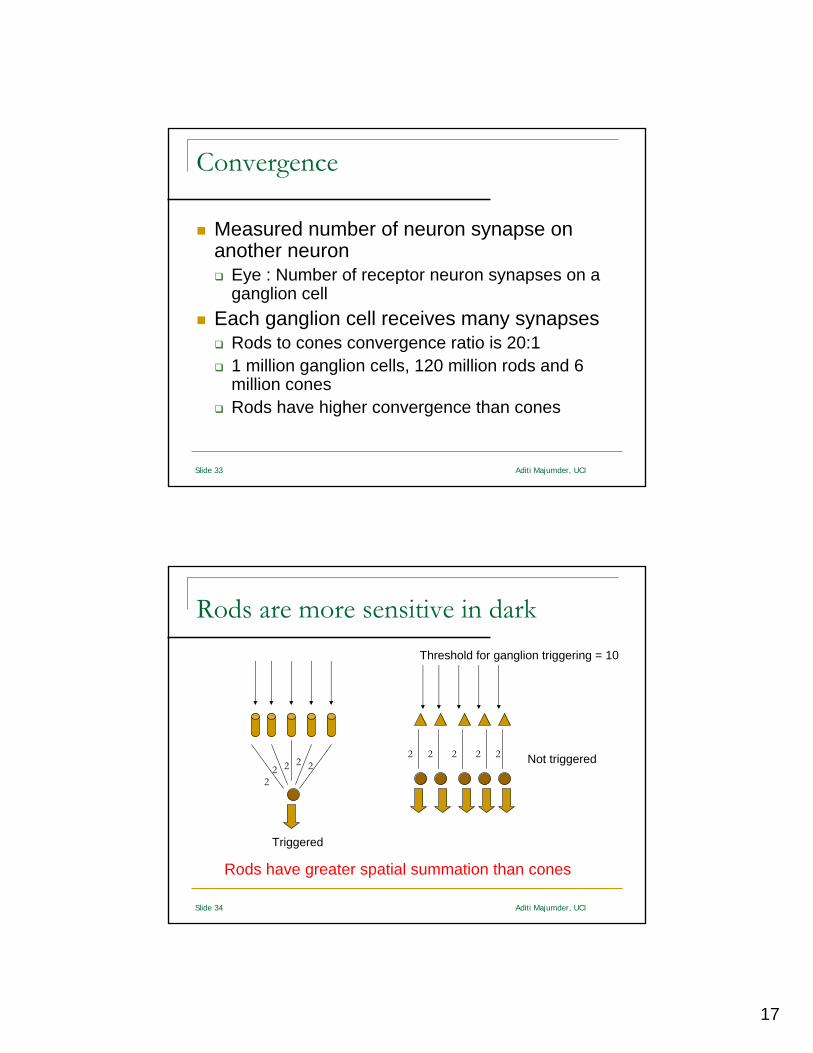
Rods are more sensitive in dark
Triggered
2 2 2 222
2
222
Threshold for ganglion triggering = 10
Not triggered
Rods have greater spatial summation than cones
18
Slide 35 Aditi Majumder, UCI
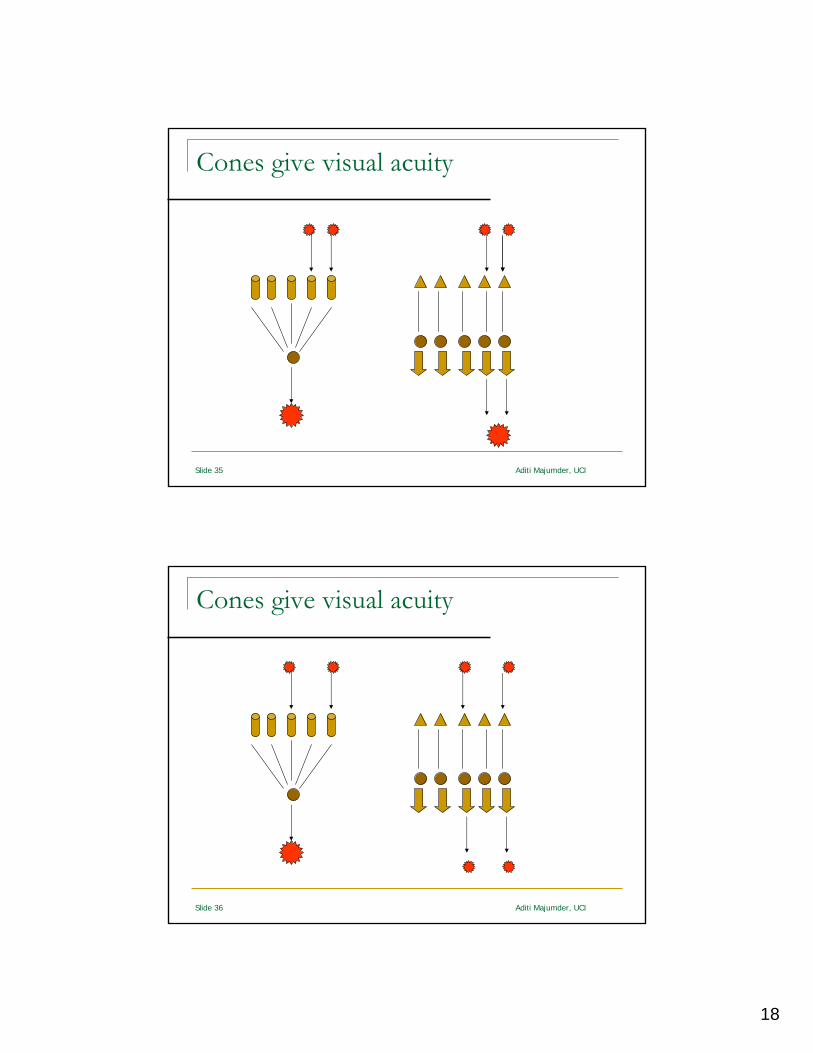
Cones give visual acuity
Slide 36 Aditi Majumder, UCI
Cones give visual acuity

19
Neural Circuits and their Effects on Perception
Slide 38 Aditi Majumder, UCI
Neural Circuits
Many neurons connected through convergenceSmall – a few neuronsLarge – a few hundred thousand neurons
20
Slide 39 Aditi Majumder, UCI
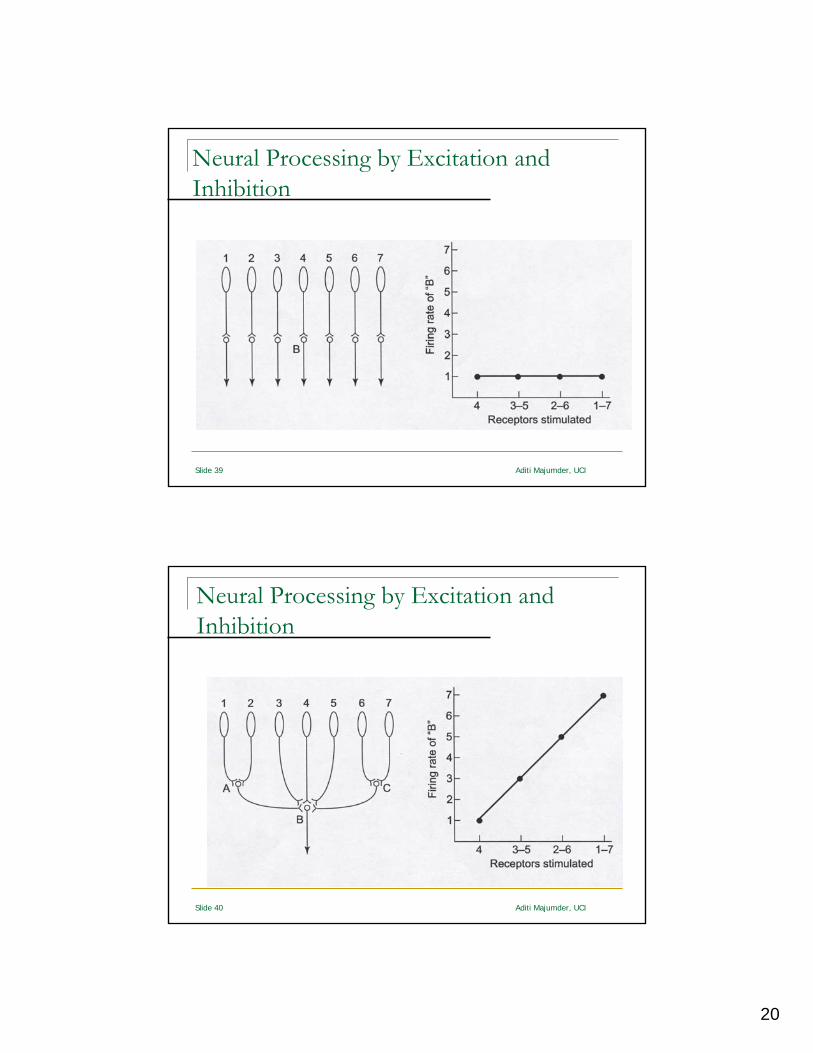
Neural Processing by Excitation and Inhibition
Slide 40 Aditi Majumder, UCI
Neural Processing by Excitation and Inhibition
21
Slide 41 Aditi Majumder, UCI
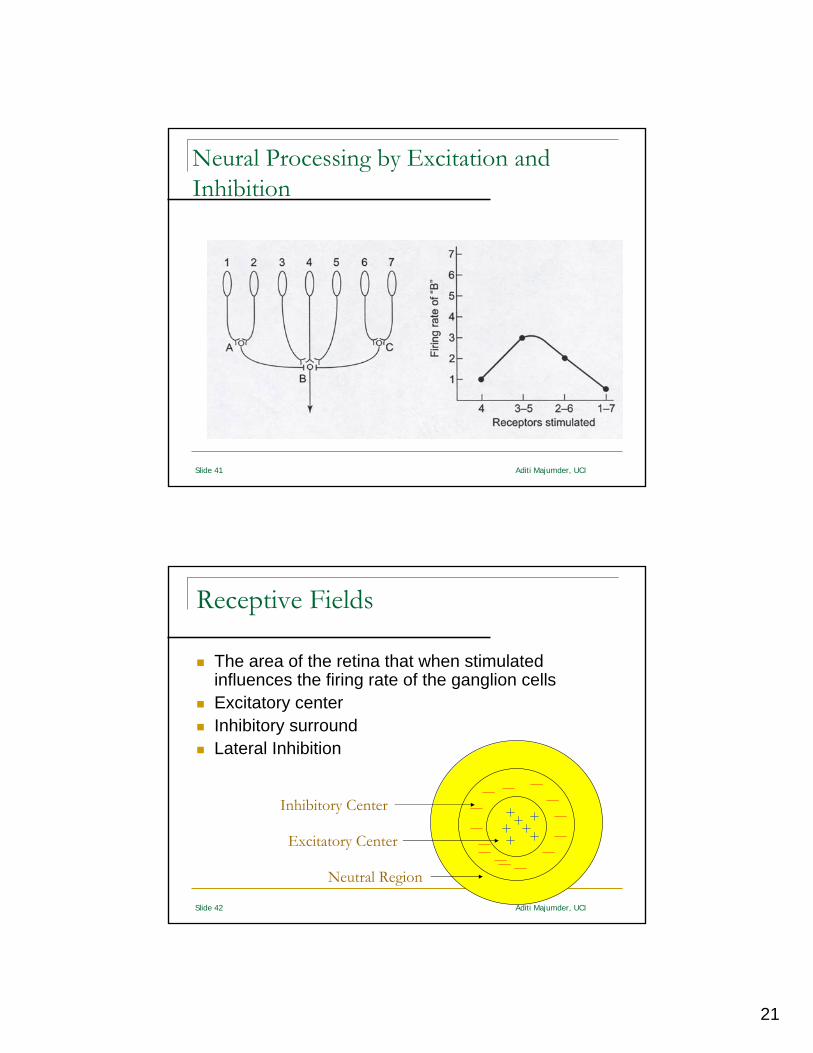
Neural Processing by Excitation and Inhibition
Slide 42 Aditi Majumder, UCI
Receptive Fields
The area of the retina that when stimulated influences the firing rate of the ganglion cellsExcitatory centerInhibitory surroundLateral Inhibition
Excitatory Center
Inhibitory Center
Neutral Region

22
Slide 43 Aditi Majumder, UCI
Hermann Grid
Slide 44 Aditi Majumder, UCI
Explanation : Lateral Inhibition
23
Slide 45 Aditi Majumder, UCI
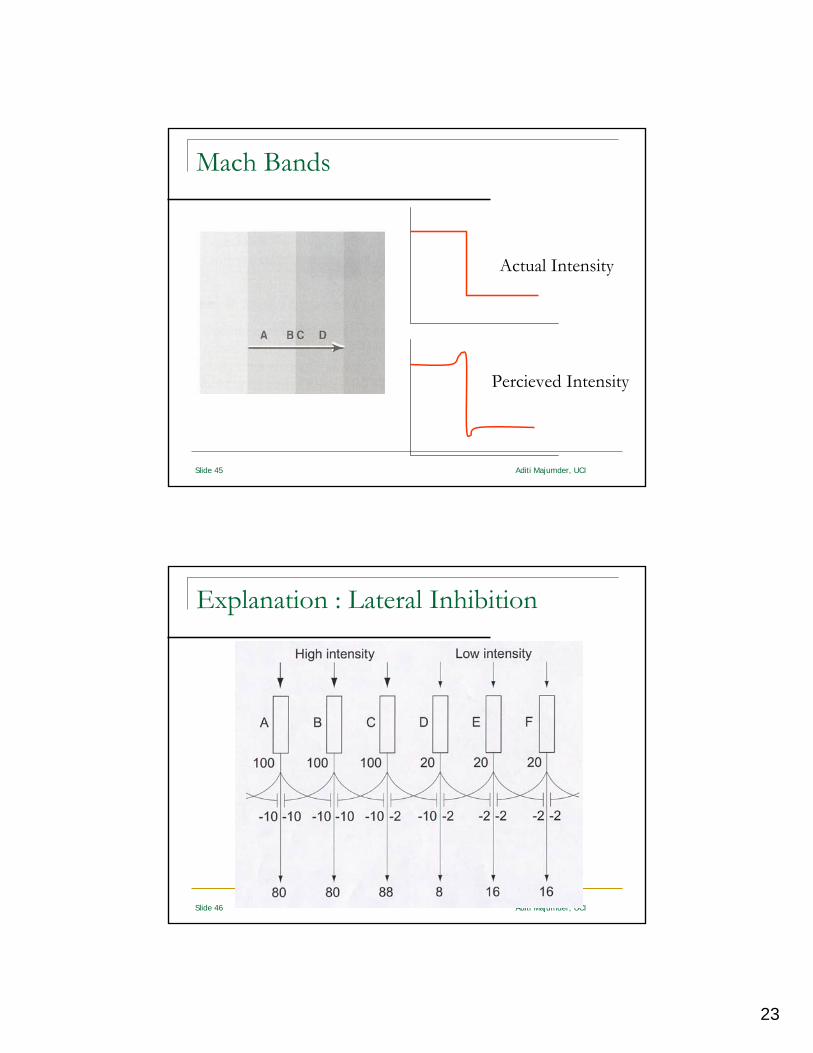
Mach Bands
Actual Intensity
Percieved Intensity
Slide 46 Aditi Majumder, UCI
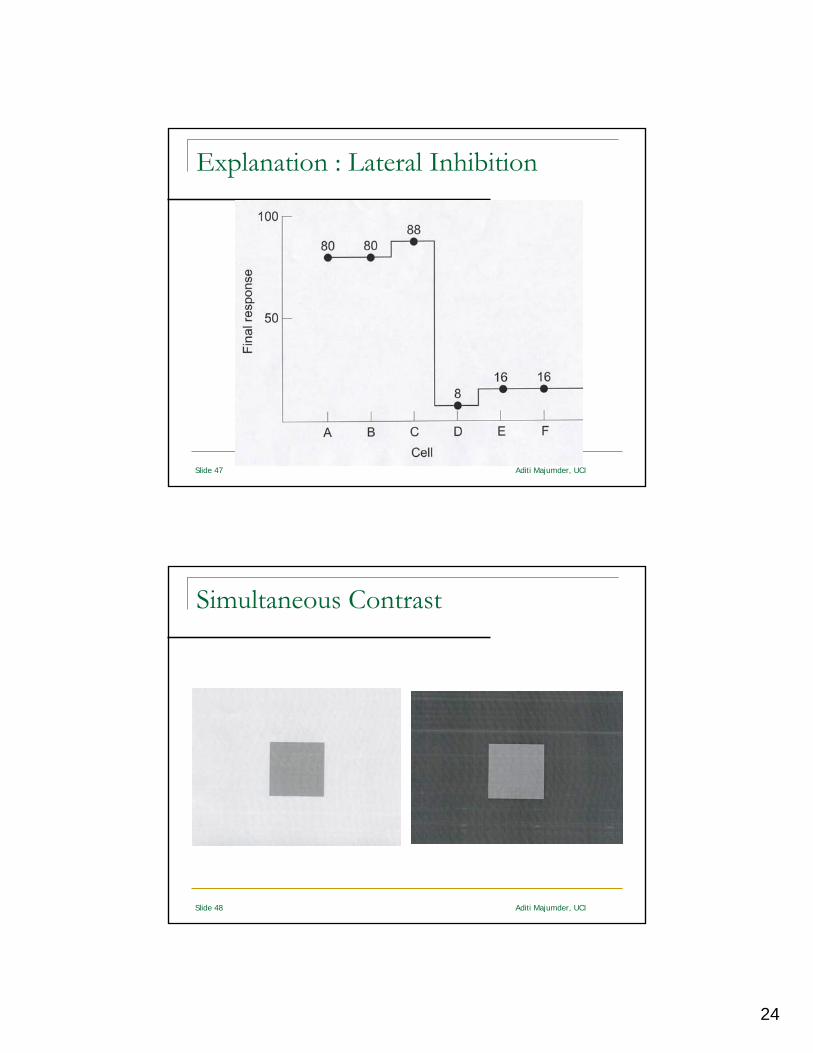
Explanation : Lateral Inhibition
24
Slide 47 Aditi Majumder, UCI
Explanation : Lateral Inhibition
Slide 48 Aditi Majumder, UCI
Simultaneous Contrast
25
Slide 49 Aditi Majumder, UCI
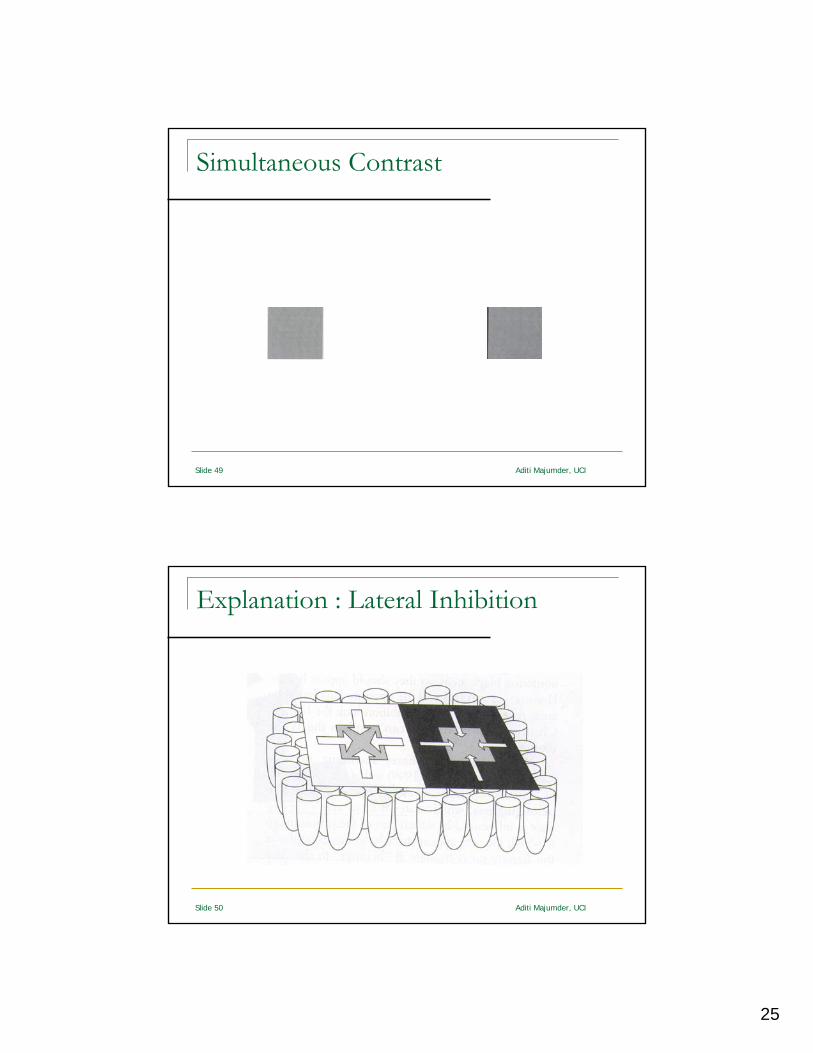
Simultaneous Contrast
Slide 50 Aditi Majumder, UCI
Explanation : Lateral Inhibition
26
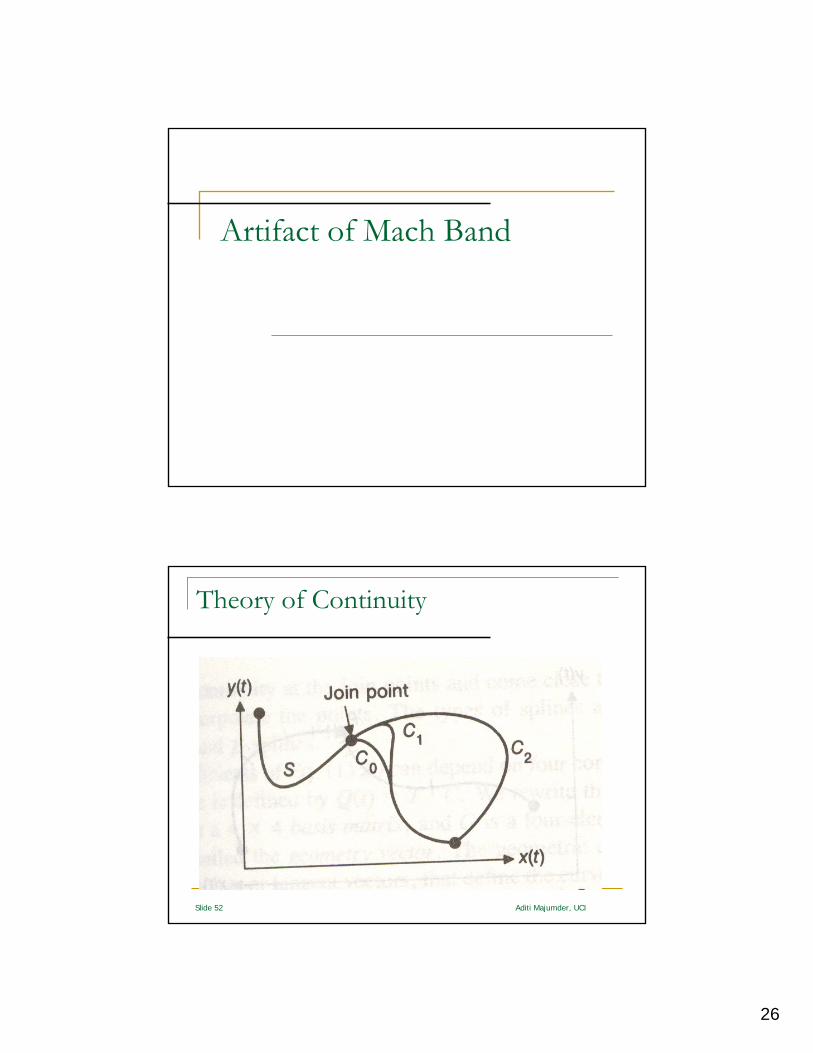
Artifact of Mach Band
Slide 52 Aditi Majumder, UCI
Theory of Continuity
27
Slide 53 Aditi Majumder, UCI
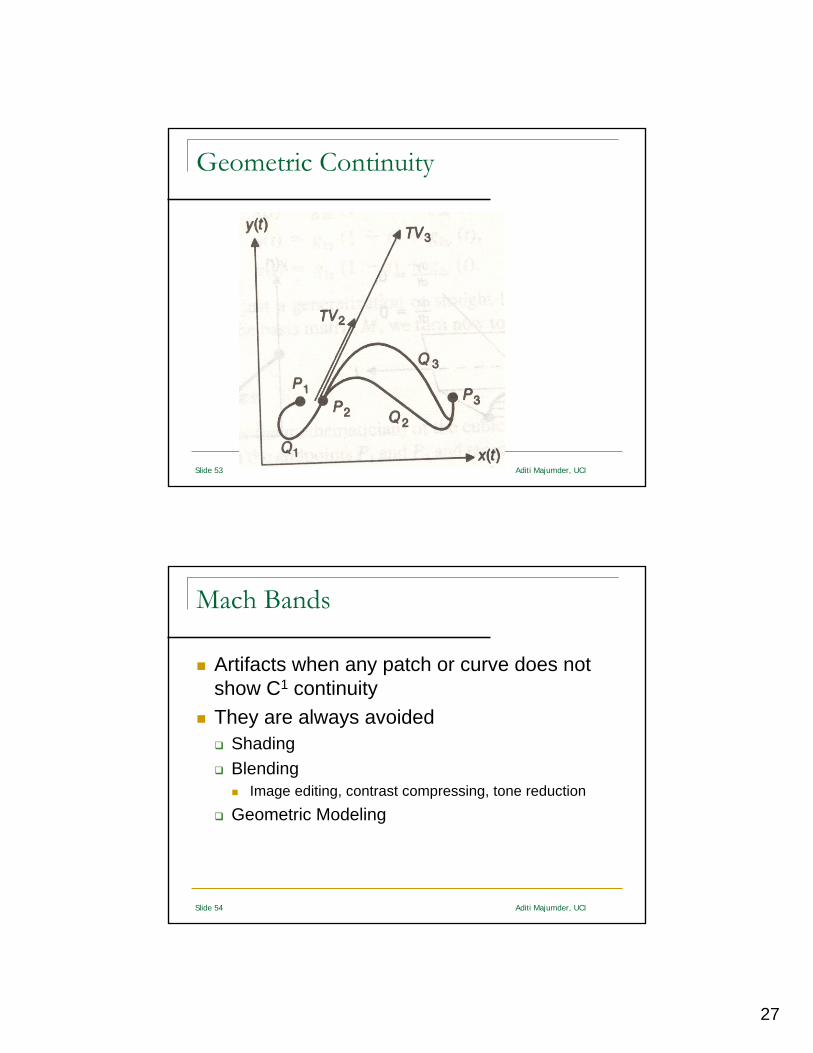
Geometric Continuity
Slide 54 Aditi Majumder, UCI
Mach Bands
Artifacts when any patch or curve does not show C1 continuityThey are always avoided
ShadingBlending
Image editing, contrast compressing, tone reduction
Geometric Modeling
28
Slide 55 Aditi Majumder, UCI
Shading
Id = kd (L . N)Is = ks (2N (L . N) – L) . V
Slide 56 Aditi Majumder, UCI
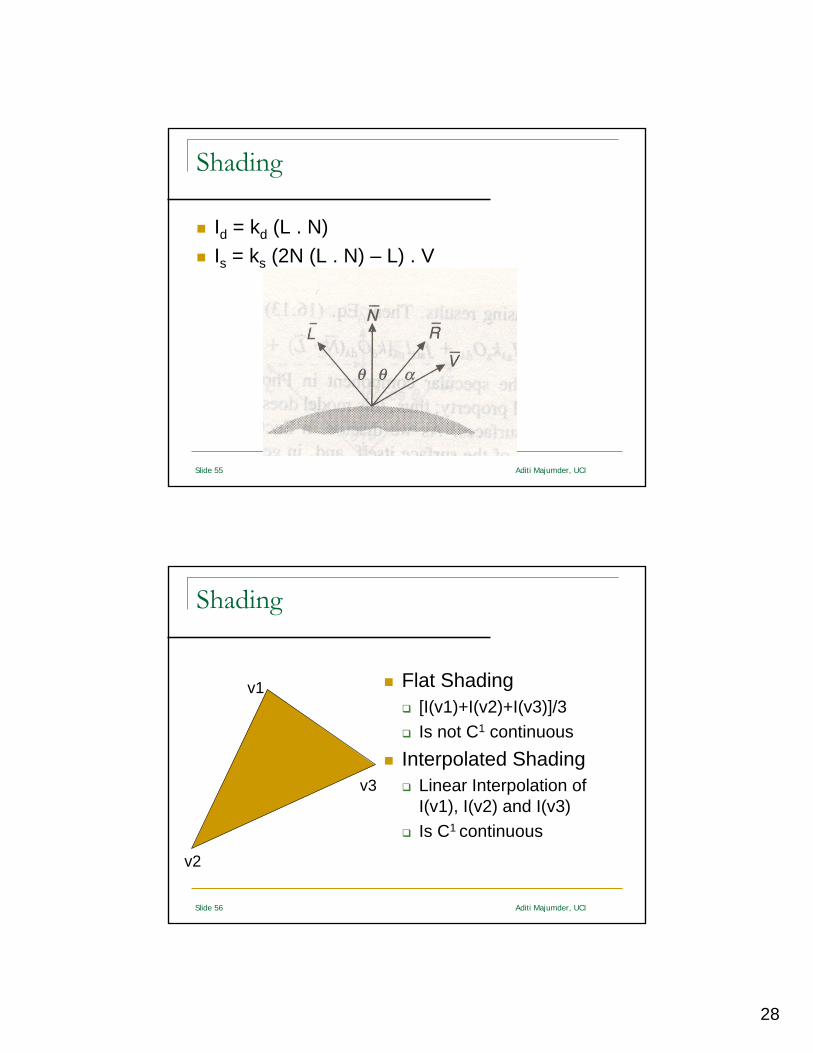
Shading
Flat Shading[I(v1)+I(v2)+I(v3)]/3Is not C1 continuous
Interpolated ShadingLinear Interpolation of I(v1), I(v2) and I(v3) Is C1 continuous
v1
v2
v3

29
Slide 57 Aditi Majumder, UCI
Shading
Flat Shading – Mach Bands Interpolated Shading
Slide 58 Aditi Majumder, UCI
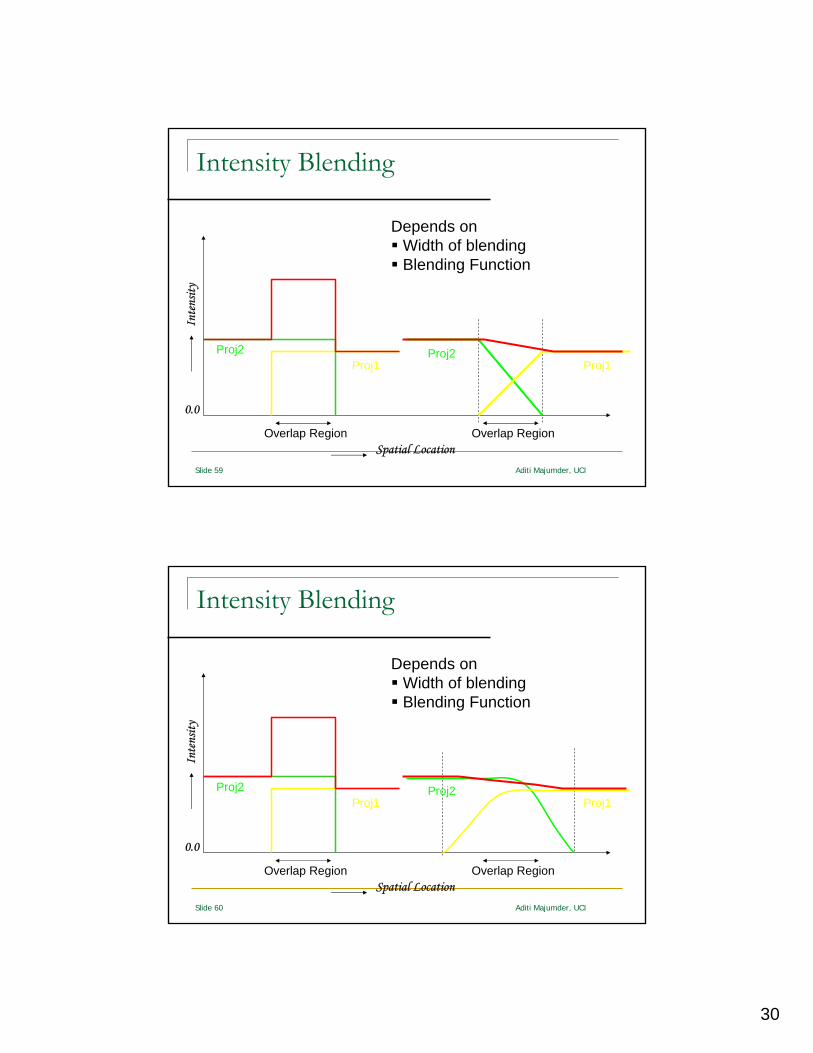
Intensity Blending
Proj1Proj2
Proj1Proj2
Overlap Region Overlap Region
Inte
nsity
0.0
Spatial Location
Depends onWidth of blendingBlending Function
30
Slide 59 Aditi Majumder, UCI
Intensity Blending
Proj1Proj2
Proj1Proj2
Overlap Region Overlap Region
Inte
nsity
0.0
Spatial Location
Depends onWidth of blendingBlending Function
Slide 60 Aditi Majumder, UCI
Intensity Blending
Proj1Proj2
Proj1Proj2
Overlap Region Overlap Region
Inte
nsity
0.0
Spatial Location
Depends onWidth of blendingBlending Function
31
Slide 61 Aditi Majumder, UCI
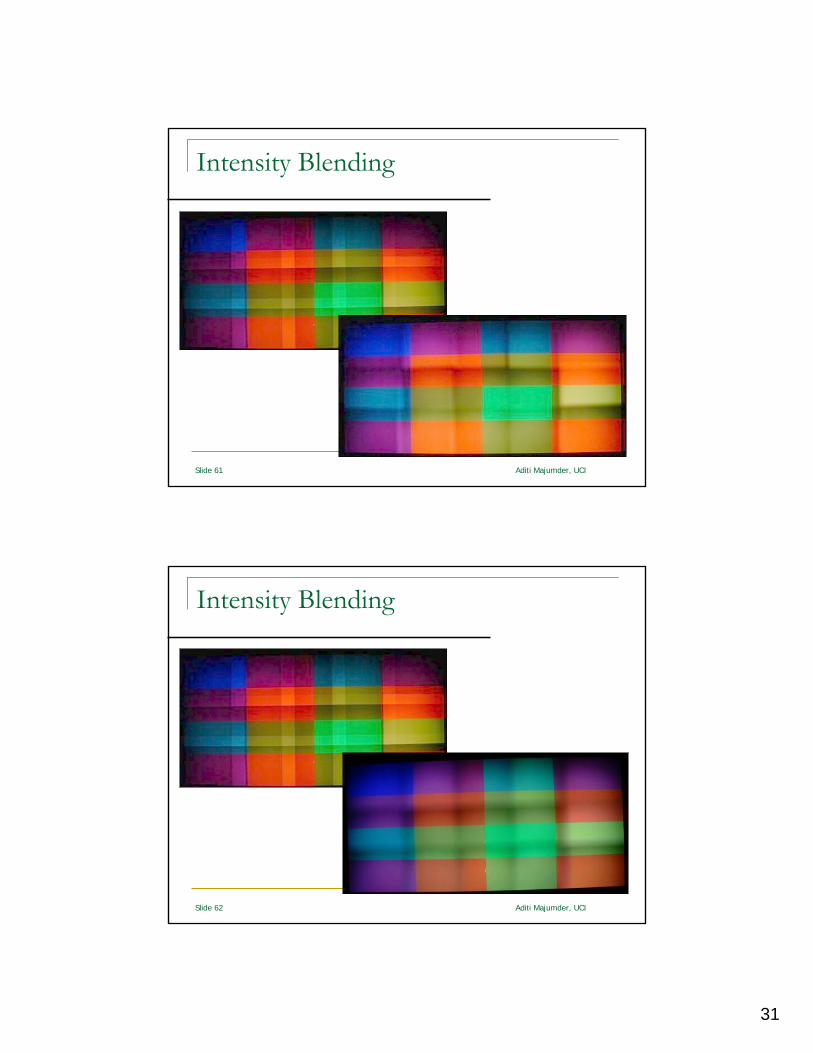
Intensity Blending
Slide 62 Aditi Majumder, UCI
Intensity Blending
32
Slide 63 Aditi Majumder, UCI
Image MosaicsMulti-Projector DisplaysImage Editing
Applications
Slide 64 Aditi Majumder, UCI
Geometric Modeling Primitives
Three propertiesContinuousContinuous with transformationsContinuous with subdivisions