
The Virtual Customer - Massachusetts Institute of...
54
The Virtual Customer Ely Dahan and John R. Hauser September 2001 Ely Dahan is an Assistant Professor of Marketing and Management Science, E56-323, Sloan School of Management, Massachusetts Institute of Technology, 38 Memorial Drive, Cambridge, MA 02142-1307, (617) 253-0492, [email protected]. John Hauser is the Kirin Professor of Marketing and Management Science, E56-314, Sloan School of Management, Massachusetts Institute of Technology, 38 Memorial Drive, Cambridge, MA 02142-1307, (617) 253-2929, [email protected]. The authors thank the MIT Center for Innovation in Product Development and the MIT Center for eBusiness for financial support. The authors also wish to thank Nicholas Chan, Wendell Gil- land, Rob Hardy, Adlar Kim, Leonard Lee, Bryant Lin, Meghan McArdle, Olivier Toubia and Limor Weisberg for their contributions and for communicating concepts using computers. Profs. Andrew Lo, Tomaso Poggio, Dražen Prelec, Duncan Simester, and V. Seenu Srinivasan were key contributors to some of the methods described herein. This article has benefited from semi- nars at Columbia University, Georgetown University, Harvard University, M.I.T., University of Texas at Austin, and the Wharton School as well as presentations at the CIPD Spring Research Review, the Epoch Foundation Workshop, the Center for e-Business at MIT, the MIT ILP Sym- posium on “Managing Corporate Innovation,” the AMA Advanced Research Techniques A/R/T Forum in Amelia Island, Florida, and the Marketing Science Conference in Wiesbaden, Ger- many. Demonstrations of the methods discussed in this article, open-source software to imple- ment the methods, and many of the working papers referenced in this article are available at mitsloan.mit.edu/vc.
-
Upload
nguyentruc -
Category
Documents
-
view
214 -
download
0
Transcript of The Virtual Customer - Massachusetts Institute of...
The Virtual Customer
Ely Dahan and John R. Hauser
September 2001
Ely Dahan is an Assistant Professor of Marketing and Management Science, E56-323, Sloan School of Management, Massachusetts Institute of Technology, 38 Memorial Drive, Cambridge, MA 02142-1307, (617) 253-0492, [email protected].
John Hauser is the Kirin Professor of Marketing and Management Science, E56-314, Sloan School of Management, Massachusetts Institute of Technology, 38 Memorial Drive, Cambridge, MA 02142-1307, (617) 253-2929, [email protected].
The authors thank the MIT Center for Innovation in Product Development and the MIT Center for eBusiness for financial support. The authors also wish to thank Nicholas Chan, Wendell Gil-land, Rob Hardy, Adlar Kim, Leonard Lee, Bryant Lin, Meghan McArdle, Olivier Toubia and Limor Weisberg for their contributions and for communicating concepts using computers. Profs. Andrew Lo, Tomaso Poggio, Dražen Prelec, Duncan Simester, and V. Seenu Srinivasan were key contributors to some of the methods described herein. This article has benefited from semi-nars at Columbia University, Georgetown University, Harvard University, M.I.T., University of Texas at Austin, and the Wharton School as well as presentations at the CIPD Spring Research Review, the Epoch Foundation Workshop, the Center for e-Business at MIT, the MIT ILP Sym-posium on “Managing Corporate Innovation,” the AMA Advanced Research Techniques A/R/T Forum in Amelia Island, Florida, and the Marketing Science Conference in Wiesbaden, Ger-many. Demonstrations of the methods discussed in this article, open-source software to imple-ment the methods, and many of the working papers referenced in this article are available at mitsloan.mit.edu/vc.
The Virtual Customer
Author Biographies
Ely Dahan is Assistant Professor of Management Science at MIT's Sloan School of Man-agement. His article with V. Seenu Srinivasan on Internet Concept Testing won the Thomas P. Hustad Best Paper award in the Journal for Product Innovation Management. He completed his PhD in the Operations & IT program at Stanford Business School, where he was a Department of Energy Fellow, an AACSB Doctoral Fellow, and a recipient of the Jaedicke Fellowship for scholarly achievement from Stanford. He researches internet-based market research methods, mathematical models of parallel and sequential prototyping, the economics of cost reduction, and models of mass customization. Dahan received a Bachelor's degree in Civil Engineering from MIT and an MBA from Harvard. He was national product manager for W.R. Grace and NEC until 1984, when he founded a computer networking company in Maryland, serving as CEO until the firm was acquired in 1993.
John R. Hauser is the Kirin Professor of Marketing and Head of the Marketing Group at M.I.T.'s Sloan School of Management where he teaches new product development, marketing management, and research methodology. He is the co-author of Design and Marketing of New Products and has published over sixty scientific papers. He has consulted for a variety of corpo-rations on product development, marketing research, and voice of the customer implementation. He is one of the founders of Applied Marketing Sciences, Inc His awards include the Converse Award for contributions to the science of marketing and the Parlin Award for contributions to marketing research. He has won numerous awards from the AMA and INFORMS for his scien-tific papers and his students have won major thesis awards including the Brooke's Prize, the Zannetos' Prize, the American Marketing Association dissertation award, and the INFORMS Bass Award. Current interests include metrics for product development, new methods for target-ing customer needs, and new applications of reinforcement learning to automate marketing tac-tics and product design.
The Virtual Customer
Abstract
Communication and information technologies are adding new capabilities for rapid and
inexpensive customer input to all stages of the product development (PD) process. In this article
we review six web-based methods of customer input as examples of the improved Internet capa-
bilities of communication, conceptualization, and computation. For each method we give exam-
ples of user-interfaces, initial applications, and validity tests. We critique the applicability of the
methods for use in the various stages of PD and discuss how they complement existing methods.
For example, during the fuzzy front end of PD the information pump enables customers
to interact with each other in a web-based game that provides incentives for truth-telling and
thinking hard, thus providing new ways for customers to verbalize the product features that are
important to them. Fast polyhedral adaptive conjoint estimation enables PD teams to screen lar-
ger numbers of product features inexpensively to identify and measure the importance of the
most promising features for further development. Meanwhile, interactive web-based conjoint
analysis interfaces are moving this proven set of methods to the web while exploiting new capa-
bilities to present products, features, product use, and marketing elements in streaming multime-
dia representations. User design exploits the interactivity of the web to enable users to design
their own virtual products thus enabling the PD team to understand complex feature interactions
and enabling customers to learn their own preferences for new products. These methods can be
valuable for identifying opportunities, improving the design and engineering of products, and
testing ideas and concepts much earlier in the process when less time and money is at risk. As
products move toward pretesting and testing, virtual concept testing on the web enables PD
teams to test concepts without actually building the product. Further, by combining virtual con-
cepts and the ability of customers to interact with one another in a stock-market-like game, secu-
rities trading of concepts provides a novel way to identify winning concepts.
Prototypes of all six methods are available and have been tested with real products and
real customers. These tests demonstrate reliability for web-based conjoint analysis, polyhedral
methods, virtual concept testing, and stock-market-like trading; external validity for web-based
conjoint analysis and polyhedral methods; and consistency for web-based conjoint analysis vs.
user design. We report on these tests, commercial applications, and other evaluations.

THE VIRTUAL CUSTOMER PAGE 1
The Virtual Customer
Introduction
New communications and information technologies such as the Internet, the World-Wide
Web (web), and high-speed, broadband connections are transforming product development (PD).
The PD process itself is transforming into an activity that is dispersed and global with cross-
functional PD team members spread across multiple locations and time zones and interconnected
through a services marketplace. For example, Wallace, Abrahamson, Senin, and Sferro [85] re-
port on a system that enables engineers to redesign critical components in weeks or even days –
redesigns that once took six months. These and other changes put an emphasis on fast and accu-
rate input from a variety of sources, including rapid input from customers [1, 13, 14, 20, 32, 52,
67]. At the same time, today’s spiral and stage-gate processes require input from customers it-
eratively at many times during the development process including the rapid evaluation of ideas
early in the process, the identification of important “delighter” features as the product concept is
refined, detailed measures of the importances of customer needs as the product is engineered,
and accurate evaluation of prototypes as the product nears pretest and test marketing [11, 12, 15,
16, 37, 52, 53, 66, 73, 77, 87].
While information technology transforms internal PD processes within firms, it also im-
pacts firms’ external interactions with potential consumers of new products. Customers’ broad-
band connections at home and work, combined with emerging Internet panels of willing
respondents, mean that PD teams can reach customers more quickly and, ultimately, less expen-
sively. Media rich computing and communication mean that product stimuli can include more
realistic virtual prototypes and more realistic product features. And powerful, server-based soft-
ware and downloadable applets mean that web-based methods can be more adaptive to customer
input and change questioning procedures on the fly.
In this article we review six web-based customer input methods. For simplicity, we call
this set of methods the “virtual customer.” Some of these methods simply move paper-and-
pencil or central-location interviewing methods to the web. Others exploit the new communica-
tions and computing power to provide capabilities that were not feasible previously. Each of
these methods has been implemented and pilot tested and some of the methods have been used to
design products that have now been launched. However, we caution the reader that web-based
THE VIRTUAL CUSTOMER PAGE 2
methods of gathering customer input continue to evolve. We and other researchers continue to
test these methods in new applications and to explore new web-based methods to discover their
strengths and weaknesses. In some applications, the virtual customer methods will replace exist-
ing methods, but in most instances they will complement existing methods for expanded capabil-
ity.
We organize the article as follows. We begin with a discussion of the three dimensions
of web-based customer input. This structure is useful to (1) show how the web-based methods
complement traditional market research and (2) suggest how web-based research will evolve.
We then describe each of the six methods providing examples and, when they are available, ini-
tial applications and tests. Finally, we review how each method can be used in the various stages
of an iterative PD process. Demonstrations of these methods, open-source software, technical
reports, and theses are available at the virtual-customer website: mitsloan.mit.edu/vc.
Communication, Conceptualization, and Computation
Figure 1 depicts three capabilities of web-based customer input. The capabilities extend
and enhance the trends that we have seen over the past ten years as computer-aided interviewing
(CAI) has enhanced traditional telephone and central-location interviewing. The web has made
these capabilities more powerful and is putting these capabilities directly into the hands of the
PD team.
Communication includes much more rapid interaction not only between the PD team and
the respondents, but also between the respondents themselves. PD-team-with-respondent com-
munication reduces the time required to conduct studies, and enhances understanding of the re-
spondents’ task through interactive, hyperlinked help systems incorporated into the website.
With this rapid communication it is now theoretically possible to gather sophisticated market in-
formation in a few days rather than the 4-6 weeks that are typical with traditional methods. For
example, we completed a user design study of over 300 respondents over a weekend.
To get to customers quickly, both new and traditional market research firms are forming
panels of web-enabled respondents who can complete on-line tasks. National Family Opinion
Interactive, Inc. (NFOi) has a balanced panel of over 500,000 web-enabled respondents. Digital
Marketing Services, Inc., (DMS), a subsidiary of AOL, uses “Opinion Place” to recruit respon-
dents dynamically and claims to be interviewing over 1 million respondents per year. Knowl-
edge Networks has recruited 100,000 Internet enabled respondents. Greenfield Online, Inc. has
THE VIRTUAL CUSTOMER PAGE 3
an on-line panel of 1.2 million households (3 million respondents). Harris Interactive, Inc. has an
on-line panel of 6.5 million respondents [4, 25, 56].
These market research firms are aware of the fact that the Internet is still diffusing and
are competing on ways to ensure representativeness of these panels. For example, NFO has had
fifty years of experience balancing their traditional panels and NFOi is using that same technol-
ogy to balance its Internet panel. DMS reports on 150 side-by-side tests of on-line vs.
phone/mail/mall interviewing and states that “a rather extensive body of comparability work
documents the consistent business direction finding [25].” Gonier [25] presents data that the
DMS respondents have demographics close to the US population and can be balanced to match
the US population. Knowledge Networks addresses representativeness by recruiting respondents
with random digit dialing methods and provides them with web access if they do not already
have it. In a more independent test, Willkie, Adams, and Girnius [86] conducted 50 parallel tests
and found a high degree of correlation between mall-intercept and web-panel respondents.
These panels also make it possible to gather customer input in multiple countries simul-
taneously. For example, Harris Interactive claims panelists in 200 countries and Greenfield On-
line claims panelists in 162 countries [56]. Our own experience with NFOi suggests that it is
relatively easy to field studies in multiple languages simultaneously. Although independent rep-
resentativeness tests are still rare, we can take confidence in the fact that firms such as Apple
Computers, Avon, Beecham, BMW, Hewlett Packard, IBM, Kodak, Microsoft, Pfizer, Procter &
Gamble, Ralston Purina, and Xerox now use these panels (www.nfoi.com,
www.greenfield.com). In fact, General Mills now claims to do 60% of their market research on-
line [50].
As of this writing, these panels have focused on the consumer market. Although Harris
Interactive does have a successful physician panel, recruiting has proven much more difficult for
business-to-business panels. To date, most of the business-to-business on-line interviewing has
required study-specific recruiting, thus mitigating some of the cost and time advantages. How-
ever, cost and time might decrease with experience and competitive pressure.
To help PD teams implement studies quickly, application service providers (ASP’s) are
developing web-based menu-driven systems by which teams can create customized surveys. For
example, Faura [23] demonstrates a system in which a PD team member need only visit a web-
site to choose the features and feature levels to be tested in conjoint analysis. The website then
THE VIRTUAL CUSTOMER PAGE 4
sets up the web-page to which respondents can come, sets up the database, and provides analysis
summaries – all automatically. Faura’s system is only a proof-of-concept rather than a commer-
cial system, but other ASP’s, such as zoomerang.com, are now in common use for web-based
surveys, and Sawtooth Software, Inc. has recently announced commercial software for the design
of web-based interviewing systems.
The web also facilitates respondent-to-respondent communication that might also im-
prove the quality of information gathered, particularly for product categories (e.g., automobiles
and communication devices) in which customers may influence one another’s choices. Real-
time respondent-to-respondent communication can inform inter-subjectivity just as the wide-
spread availability of real-time stock market quotations informs individual traders about the state
of the financial world. PD teams can now observe respondent-to-respondent interactions to gain
insight into customer needs and better estimate a new concept’s potential. Although respondent-
to-respondent capability has always been possible in face-to-face interviews such as focus
groups, the web enables this communication to take place among larger numbers of customers
and web-based interviewing enables the PD team to gather this information more rapidly. Addi-
tionally, web-based methods such as the information pump and securities trading of concepts are
designed to be less susceptible to social influences than in-person focus groups.
There is, however, a downside to rapid communication. With customers providing feed-
back on-line from the comfort of their homes or workplaces, the alternative uses of their time are
high. Unlike in a central facility, web-based respondents are free to terminate the interview if
they are bored or if they do not feel that the incentives (if any) justify their time. It is more diffi-
cult for some web-based survey methods to obtain the same response rates as mail/phone/mall
interviewing. A web-based environment places a premium on interfaces that are interesting and
engaging and which gather information using as few questions as is feasible. It is not enough to
simply port existing methods to the web; they must be designed with the web in mind.
Conceptualization utilizes the graphic and audio capabilities of multimedia computers to
depict virtual products and product features. Concept evaluation has long been possible with
physical prototypes, but such methods are expensive and time-consuming [47, 55, 58, 65, 79].
With rich virtual prototypes, PD teams can test their ideas and preliminary designs earlier in the
process, well before physical prototypes are built. Although prior research has used virtual pro-
totypes and information acceleration in central-location interviewing [78, 81 and Sawtooth
THE VIRTUAL CUSTOMER PAGE 5
Technologies’ multimedia Sensus capability, www.sawtooth.com], these capabilities are now
becoming available on the web. Further, new software and hardware is making the multimedia
prototypes easier to develop and more realistic. These interactive, media-rich depictions also en-
hance respondents’ understanding and enjoyment of the task. Conceptualization may include
multiple sensory inputs such as 2-D and 3-D visualization, interactivity, sound and music, and,
eventually, touch, smell, and even taste through peripherals that are now being developed. Even
for products or prototypes that exist in physical reality, virtual depictions have a cost and speed
advantage over physical prototypes.
Naturally, PD teams realize these advantages only if the data collected based on virtual
prototypes replicates that which can be obtained with physical prototypes, and only if web-based
interviewing replicates that which can be obtained with more traditional central-location inter-
viewing. Although capabilities will improve with further experience, the initial tests reported in
this article suggest that sufficient accuracy and reliability can be obtained.
Computation enables improvement over fixed survey designs by dynamically adapting
web-pages in real time, based on mathematical algorithms, while participants are responding.
For example, adaptive conjoint analysis (ACA) has long adapted paired-comparison preference
questions to each respondent based upon their answers to earlier questions [29, 41, 57, 62]. Not
only has ACA moved to the web, but more computationally intensive optimization methods (de-
scribed later) are being used to select stimuli. Even the multimedia stimuli themselves can be
created on the fly. Suppose that the PD team was considering 50 alternative features for a prod-
uct. Even with an efficient experimental orthogonal design for this 250 problem, the number of
stimuli that would need to be created would be huge. With today’s software tools that enable
layering of “puzzle pieces,” we can now create stimuli automatically as they are needed.
Real-time computation also enables stimuli to become dynamic, interactive, and more in-
formative. For example, instantaneous computation of price and performance as a function of
design choices provides key feedback during the user design process. In this way, the end-user
can better learn about tradeoffs and his or her personal preferences, thereby improving the accu-
racy of decisions about an “ideal design.”
Virtual Customer Methods
We now describe six virtual customer methods representative of the type of web-based
customer input systems that are evolving. We chose these six methods as representative of the
THE VIRTUAL CUSTOMER PAGE 6
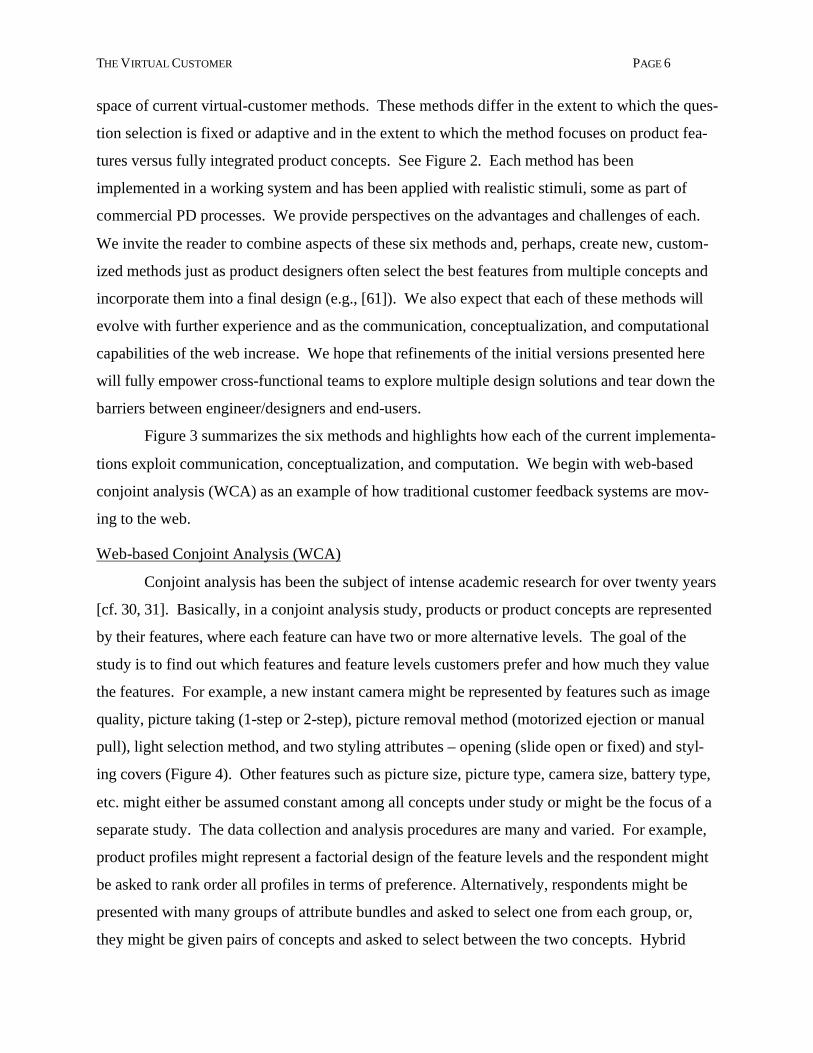
space of current virtual-customer methods. These methods differ in the extent to which the ques-
tion selection is fixed or adaptive and in the extent to which the method focuses on product fea-
tures versus fully integrated product concepts. See Figure 2. Each method has been
implemented in a working system and has been applied with realistic stimuli, some as part of
commercial PD processes. We provide perspectives on the advantages and challenges of each.
We invite the reader to combine aspects of these six methods and, perhaps, create new, custom-
ized methods just as product designers often select the best features from multiple concepts and
incorporate them into a final design (e.g., [61]). We also expect that each of these methods will
evolve with further experience and as the communication, conceptualization, and computational
capabilities of the web increase. We hope that refinements of the initial versions presented here
will fully empower cross-functional teams to explore multiple design solutions and tear down the
barriers between engineer/designers and end-users.
Figure 3 summarizes the six methods and highlights how each of the current implementa-
tions exploit communication, conceptualization, and computation. We begin with web-based
conjoint analysis (WCA) as an example of how traditional customer feedback systems are mov-
ing to the web.
Web-based Conjoint Analysis (WCA)
Conjoint analysis has been the subject of intense academic research for over twenty years
[cf. 30, 31]. Basically, in a conjoint analysis study, products or product concepts are represented
by their features, where each feature can have two or more alternative levels. The goal of the
study is to find out which features and feature levels customers prefer and how much they value
the features. For example, a new instant camera might be represented by features such as image
quality, picture taking (1-step or 2-step), picture removal method (motorized ejection or manual
pull), light selection method, and two styling attributes – opening (slide open or fixed) and styl-
ing covers (Figure 4). Other features such as picture size, picture type, camera size, battery type,
etc. might either be assumed constant among all concepts under study or might be the focus of a
separate study. The data collection and analysis procedures are many and varied. For example,
product profiles might represent a factorial design of the feature levels and the respondent might
be asked to rank order all profiles in terms of preference. Alternatively, respondents might be
presented with many groups of attribute bundles and asked to select one from each group, or,
they might be given pairs of concepts and asked to select between the two concepts. Hybrid
THE VIRTUAL CUSTOMER PAGE 7
methods ask customers to rate the importance of the features directly and then update those im-
portance measurements with data from profile ranks, choices, or paired comparisons. All of
these methods work with either rank-order data or a rating scale that is designed to measure the
intensity of preference.
Although new analysis methods are being developed that exploit new computational al-
gorithms (described later), the primary focus in web-based conjoint analysis has been the user
interface. Among the challenges are (a) the limited screen “real estate” of most computer moni-
tors which constrains the number of profiles that can be viewed, (b) the limited time and concen-
tration that most respondents commit to the task, and (c) the fact that instructions and tasks must
be understood without the researcher present. On the other hand, the web offers multiple bene-
fits including: (1) enhanced stimuli that are visual, animated, interactive, and hyperlinked, (2)
flexibility to enable respondents to participate at their convenience from the comfort of their
homes or workplaces, and (3) the engaging ease and speed with which respondents can express
their preferences through simple clicking, without requiring typing. An effective user interface
exploits web-based benefits to address the challenges as they relate to: the respondents’ task, the
number of features, the number of levels, the number of stimuli, and the depiction of concepts.
We illustrate two web-based interfaces. The first collects paired-comparison data and the
second gathers ranks on full profiles of features. These methods are extendable to customization
with self-explicated importance ratings, other intensity measures, or choice-based tasks.
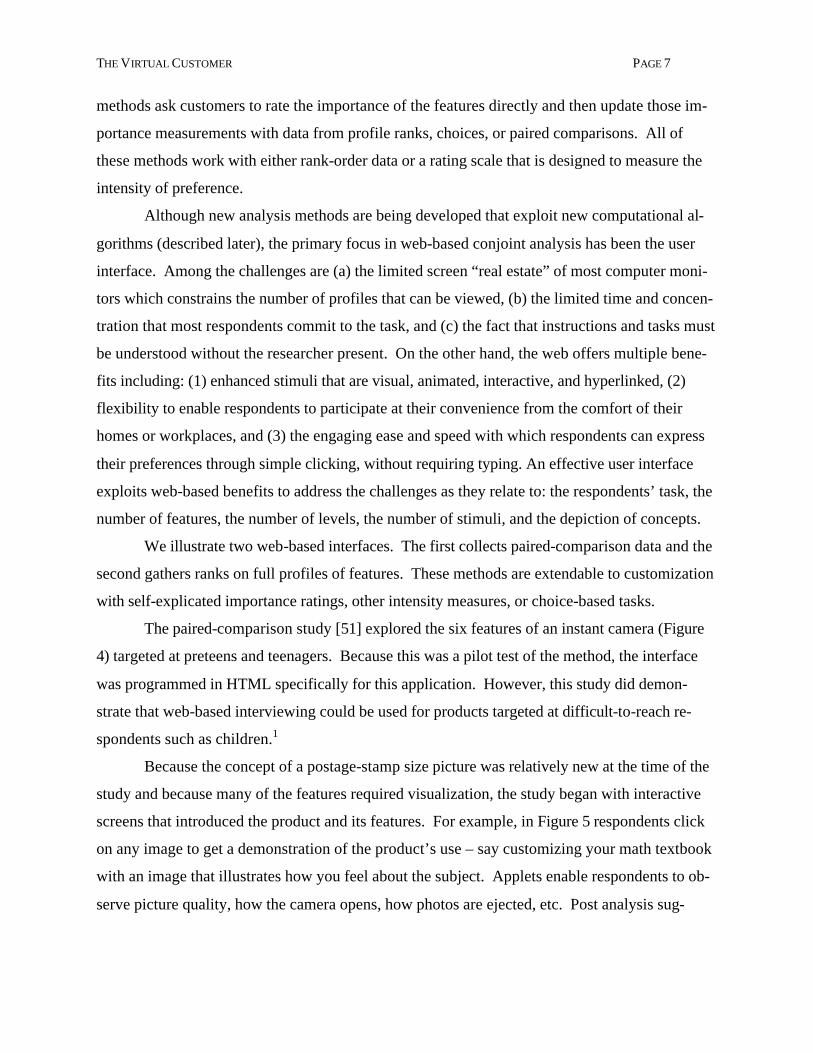
The paired-comparison study [51] explored the six features of an instant camera (Figure
4) targeted at preteens and teenagers. Because this was a pilot test of the method, the interface
was programmed in HTML specifically for this application. However, this study did demon-
strate that web-based interviewing could be used for products targeted at difficult-to-reach re-
spondents such as children.1
Because the concept of a postage-stamp size picture was relatively new at the time of the
study and because many of the features required visualization, the study began with interactive
screens that introduced the product and its features. For example, in Figure 5 respondents click
on any image to get a demonstration of the product’s use – say customizing your math textbook
with an image that illustrates how you feel about the subject. Applets enable respondents to ob-
serve picture quality, how the camera opens, how photos are ejected, etc. Post analysis sug-

THE VIRTUAL CUSTOMER PAGE 8
gested that the children enjoyed the task (“kind of fun”) and found it to be about the right length
[51].
After the product- and feature-instruction screens, respondents completed the paired-
comparison task in Figure 6. The task was made easier for the respondent by animating the 9-
point scale and by making detailed feature descriptions or product demonstrations available with
a single click. While paired-comparison questions fit the need for clarity and limited screen size
quite well, pretests and prior studies suggested that they became monotonous after 10-15 ques-
tions [8]. Thus, the children were asked only eight paired-comparison questions. This limited the
data analysis to aggregate (segment-level) estimates of feature importance and concept share.
While this was sufficient for the application in which only six features (plus price) varied, it be-
came clear to both the firm and to us that new adaptive methods were necessary for more com-
plex problems. These methods are described later in this article.
The application was considered a success by the firm. The PD team felt that the data had
high face validity and internal consistency. Because the firm had previously relied on mall-
intercept interviewing, a parallel study was completed in which respondents were recruited in a
mall and brought to a central facility to complete the conjoint analysis tasks. The partworth es-
timates from the two studies were highly correlated (0.80 correlation significant at the 0.01
level). Despite some slight differences, the basic managerial message was the same and implied
the same camera design, thus suggesting that the more rapid web-based interviewing could sub-
stitute adequately for traditional mall-based interviewing. Furthermore, the percentage of re-
spondents who answered the survey completely without task neglect was 85% in the mall and
86% at home suggesting that the interface was engaging and that the task was not too onerous.
However, the percent of respondents who visited the website after being recruited was 38% sug-
gesting a need for improvement relative to the 50% that is typical for telephone interviewing [89,
90].2
The study identified at least one feature that was a “delighter” to teenagers, but not an-
ticipated by the adult PD team – removable styling covers. The camera was launched as the
“iZone Convertible Camera” with “fashion-forward faceplates” in multiple styles and colors
(www.izone.com). The study also identified features that were not important to children and
could be eliminated from the camera to keep the design within the price target. In particular, it
THE VIRTUAL CUSTOMER PAGE 9
did not appear that teenagers valued a folding camera or one that ejected the pictures automati-
cally.
Full-profile Evaluation Interface for Web-based Conjoint Analysis (WCA)
The paired-comparison task is ideally suited for CAI. It underlies Sawtooth’s widely-
used version of ACA, and CAI conjoint examples with paired comparisons have been in the aca-
demic literature for twenty years (e.g., [35, 36]). However, ranks of full-profile concepts remain
the most common form of conjoint analysis among practitioners accounting for over 60% of the
applications [7, 46, 91]. Not surprisingly, ranking many concepts puts high demands on screen
real estate and requires a creative user interface. Such interfaces are still being developed and
refined; we present one that has now been applied for crossover vehicles, ski resorts, tape backup
systems, digital cameras, automobile telematics, pocket PCs, high-speed color printers/copiers,
and ultra-light portable computers. Respondents find the task intuitive, interesting, and easy-to-
complete.
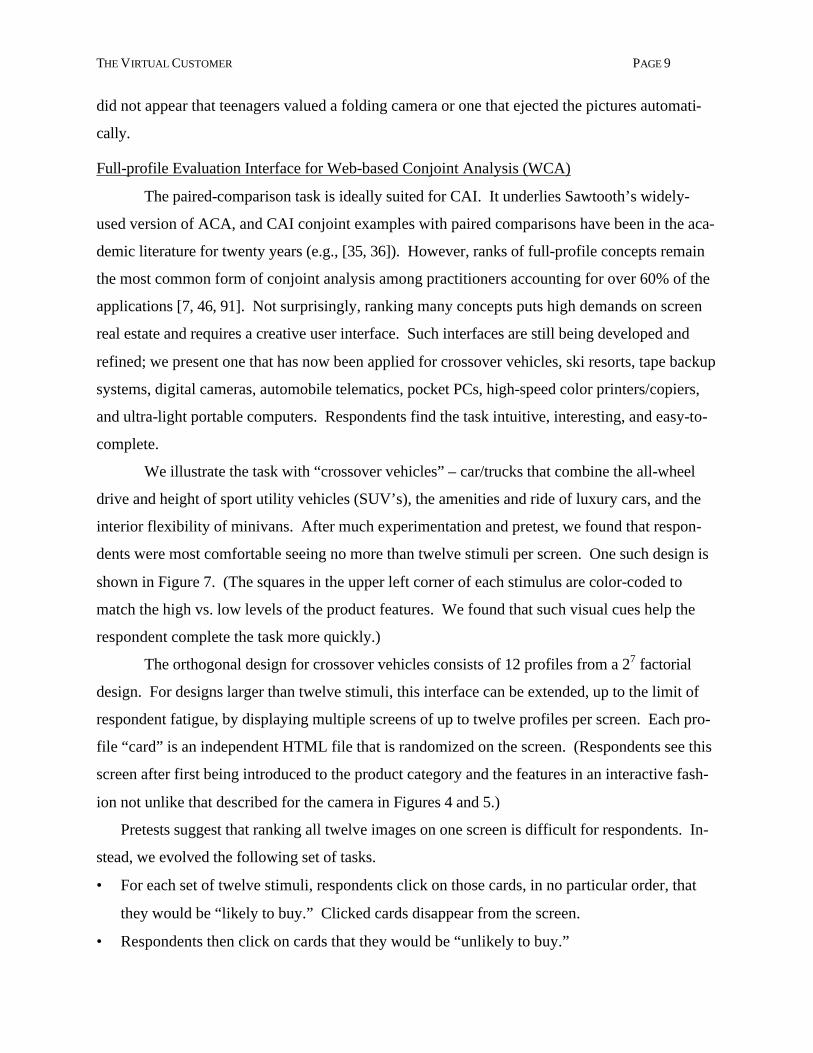
We illustrate the task with “crossover vehicles” – car/trucks that combine the all-wheel
drive and height of sport utility vehicles (SUV’s), the amenities and ride of luxury cars, and the
interior flexibility of minivans. After much experimentation and pretest, we found that respon-
dents were most comfortable seeing no more than twelve stimuli per screen. One such design is
shown in Figure 7. (The squares in the upper left corner of each stimulus are color-coded to
match the high vs. low levels of the product features. We found that such visual cues help the
respondent complete the task more quickly.)
The orthogonal design for crossover vehicles consists of 12 profiles from a 27 factorial
design. For designs larger than twelve stimuli, this interface can be extended, up to the limit of
respondent fatigue, by displaying multiple screens of up to twelve profiles per screen. Each pro-
file “card” is an independent HTML file that is randomized on the screen. (Respondents see this
screen after first being introduced to the product category and the features in an interactive fash-
ion not unlike that described for the camera in Figures 4 and 5.)
Pretests suggest that ranking all twelve images on one screen is difficult for respondents. In-
stead, we evolved the following set of tasks.
• For each set of twelve stimuli, respondents click on those cards, in no particular order, that
they would be “likely to buy.” Clicked cards disappear from the screen.
• Respondents then click on cards that they would be “unlikely to buy.”
THE VIRTUAL CUSTOMER PAGE 10
• Remaining cards are automatically added to a “not sure” group.
• Respondents then rank order stimuli within each of the “likely,” “not sure,” or “unlikely”
groups by clicking on profiles in order of preference. Each clicked profile disappears from
the screen, so respondents are always clicking on their most preferred remaining profile.
• The rare groups with more than twelve cards require scrolling within the browser window.
• To check for errors and to iterate if necessary, respondents are asked paired-comparison
questions that compare the least preferred “likely” profile to the most preferred “not sure”
profile, and the least preferred “not sure” profile to the most preferred “unlikely” profile.
• Finally, the “likely,” “not sure,” and “unlikely” groups are “stitched” together to create the
rank order of all stimuli for analysis.
In addition to the rank orders, this user interface also identifies “likely” and “unlikely” profiles
with which to estimate minimum utility cutoffs. Such screening has been shown to improve es-
timation accuracy [49].
Initial tests of this interface suggest strong internal consistency. Groups of students and
eBusiness executives yielded mean violated pairs (mean number of pairs of profiles ordered in-
consistently with the estimated utility function prediction) of only 2.7% of the possible pairs as
compared with the 12.6% that would result under a random ordering (n = 158 respondents in
four separate studies). Although the interface is promising as a means to port full-profile con-
joint analysis to the web, it is limited to six to ten features because respondents appear to have
difficulty making simultaneous evaluations of more than this number of features and due to
screen real estate constraints. Because conjoint analysis has a long history, we expect that the
reliability and validity of web-based methods will be refined to match that of central-facility
methods. We provide one external validity test of the paired-comparison interface when we re-
view the newer polyhedral adaptive conjoint analysis method in the next section of this article.
The paired-comparison and full-profile user interfaces represent two web-based conjoint
analysis applications that enable the PD team to get rapid feedback about feature importances
from customers. Both applications have high face validity and provide valuable insight for the
design of the product in question. However, to date, these interfaces are limited by potential re-
spondent wear out and, hence, have been applied to relatively small designs. These are certainly
not the only interfaces possible and, given the large academic and industry interest in conjoint
analysis, we expect these interfaces to be refined over the next few years. Such refinement
THE VIRTUAL CUSTOMER PAGE 11
should soon make it feasible to use web-based hybrid designs that can deal with the fifty or more
parameters that are possible with central-facility interviewing (cf. [88]).
Fast Polyhedral Adaptive Conjoint Estimation (FastPace)
Concern about respondent burden in conjoint analysis is not new. As early as 1978,
Carmone, Green, and Jain [5, p. 300] cautioned that most conjoint applications required more
parameters to be estimated than the number of profiles that customers could rank comfortably.
Other researchers suggested that, due to respondent wear out, accuracy degrades as the number
of questions increases [2, 27, 28, 39, 44, 48, 49, 54, 72]. Over the past twenty years many re-
searchers have proposed methods to simplify the experimental design, simply the respondents’
task, eliminate profiles or features, and use hybrid methods that mix individual-level and seg-
ment-level data (cf. [26, 70]). In particular, adaptive conjoint analysis (ACA) has enjoyed wide
use. Green, Krieger, and Agarwal [29] claim that ACA has grown quickly to become one of the
most widely used conjoint analysis methods. ACA seeks to reduce the number of questions re-
quired by using respondents’ earlier answers to customize later questions [62].
In ACA, respondents first state the importance of each feature (self-explicated phase) and
then indicate their relative preferences between pairs of partial profiles (paired-comparison
phase). The resulting utility estimates are then scaled to predict choice based on respondents’
self-stated probability of purchase for several full product profiles (purchase intention phase). In
the adaptive phase (paired comparisons), profiles are chosen such that both profiles in a pair are
nearly equal in utility, subject to constraints that make the overall design as orthogonal as possi-
ble. ACA has proven accurate under the right circumstances, and the adaptive phase has proven
to add incremental information relative to the self-explicated phase of the interview [39, 40, 57].
In addition, Johnson [42] proposes that the accuracy of ACA can be improved by post-analyzing
the data with a hierarchical Bayes algorithm. See further discussion in Green, Krieger, and
Agarwal [29] who suggest when ACA is appropriate and when caution is due.
To date, although ACA is a CAI system, most applications have required a central facility
to which customers are recruited. Recently, Sawtooth Software introduced web-enabled ACA
and claims seventy-five applications in beta testing of their web-based interviewing system
which includes ACA as a tool (www.sawtoothsoftware.com). However, even with the adaptive
portion, ACA does not fully solve the need for a reduced number of questions – a need that be-
comes more acute on the web due to the need to hold a respondent’s attention. If a conjoint
THE VIRTUAL CUSTOMER PAGE 12
analysis study requires p parameters to be estimated – e.g., for p features at two levels each –
then ACA requires approximately 3p questions: p self-explicated questions plus 2p paired-
comparison questions, as well as the purchase intent questions. While this is sometimes a dra-
matic improvement over non-adaptive methods, it might still be a large burden for the typical
web-based respondent.
Fortunately, new computation developments have the potential to improve adaptive con-
joint questioning for web-based respondents. In particular, a revolution in mathematical pro-
gramming begun by Karmarkar [43] in 1984 enables researchers to design robust heuristic
algorithms that obtain excellent approximations to complex computational problems. Most im-
portantly, these algorithms run extremely fast. These algorithms, coupled with today’s fast com-
puters mean that adaptive paired-comparison questions can be found such that they provide
conjoint-analysis estimates with fewer questions. In some cases, the self-explicated questions
can be skipped entirely and good approximations can be found with fewer than p questions.
While such estimates do not have the nice theoretical statistical properties of estimates based on
least-squares or maximum-likelihood estimation, there is some evidence that when respondent
fatigue is a concern, estimates based on fewer questions might actually be more accurate [74].
The heuristic algorithms are surprisingly accurate and hold promise when PD teams seek to iden-
tify quickly which features are among the most important. Hence, the fast polyhedral methods
are most useful in the early stages of PD when the team is trying to winnow the list of important
features of a new product in order to identify exciting new concepts.
We describe here the concepts underlying one such “interior-point” algorithm based on
proportional ellipsoids and the analytic center [24, 68, 69, 82]. Toubia, Simester, and Hauser
[74] propose that each respondent be described by a vector of the relative importances that he or
she ascribes to each of p features. If these importances are scaled between 0 and 100, then the
feasible set of relative importances is a hypercube in p dimensions. The trick is to ask questions
that shrink the feasible set of parameter values as quickly as possible. At any given point in
time, say after q questions, the best estimate for a respondent’s feature importances is then speci-
fied by the analytic center of the remaining feasible set.3 The exact algorithm (and how the au-
thors model measurement error) is beyond the scope of this article. However, the algorithm is
sufficiently fast that respondents experience minimal computational delays between the paired-
comparison questions.4

THE VIRTUAL CUSTOMER PAGE 13
The algorithm was tested initially using Monte Carlo simulation of 1,000 respondents
each for ACA, an efficient fixed factorial design, and the authors’ algorithm, which they dub
FastPace (FP). In simulation, FP is more accurate than fixed designs for any number of ques-
tions up to 1.5 times the number of parameters and gets close to the “correct” answers in fewer
questions. For example, after only ten questions FP’s mean absolute error is only 46% higher
than that obtained with an efficient design of twenty fixed pairs. The comparison with ACA is
more complex because ACA requires p initial self-stated importance questions. However, in one
example the authors show that if the self-stated importances are relatively noisy, then FP can ob-
tain the same accuracy in ten paired-comparison questions as ACA obtains in twenty paired-
comparison questions plus ten self-stated importances. If the self-stated importances are not
noisy, then ACA is more accurate initially than FP, but a hybrid that incorporates self-stated im-
portances into the FP algorithm is even more accurate than ACA. The authors conclude that FP
is particularly promising when PD teams are limited to relatively few questions, when respon-
dent wear out is a significant concern, and/or when self-stated importances are noisy.
FP was then tested in a validation experiment by Dahan, Hauser, Simester, and Toubia
[17]. Respondents compared pairs of laptop computer bags using an interface similar to that in
Figure 6, with additional questions as required by ACA. The bags varied on nine features plus
price. Approximately one-half of the respondents were randomly assigned to an FP-based sur-
vey (n=162), approximately one-fourth to an ACA-based survey (n=80), and approximately one-
fourth (n=88) to a survey based on an efficient fixed design. After completing the survey and
then a filler task, the respondents were given the choice of five laptop bags that varied on fea-
tures and price. (The five bags were chosen randomly from a factorial design of sixteen bags.)
The choice was real – the respondents were given the bag they chose plus any change from $100.
Respondents ranked all five bags under the belief that they would be given lower choices if their
top choices were not available.
Table 1 reports the results of validity tests. The first sixteen paired-comparison questions
were chosen by the method being tested. Respondents then completed four additional paired-
comparison holdout questions, providing a test of internal validity. The external validity test
compared the ability of each method to forecast the respondents’ choices of bags. Since the
forecasts are based directly on the estimation of the importances of the products’ features, they
implicitly test the ability of the various methods to accurately assign importances to product fea-
THE VIRTUAL CUSTOMER PAGE 14
tures. Based on this initial experiment, FP appears to be significantly better (0.01 level) than both
ACA and fixed designs for estimates based on eight questions and for estimates based on sixteen
questions. Furthermore, the eight-question FP results appear to do as well as the sixteen-
question ACA or fixed-design results. Further analysis suggests that these estimates can be im-
proved with at least two hybrid methods, one that combines self-stated importances with the FP
algorithm and one that uses an alternative ACA estimation algorithm.5 Based on these tests, the
new computational algorithms appear to hold promise for further developments that could enable
PD teams to test more features with fewer questions.
User Design (UD)
We now turn to the final feature-based method that complements WCA and FP. Both
WCA and FP exploit some of the web-based interactivity to provide estimates for each respon-
dent of the relative importances of product features. These data enable the PD team to forecast
customer reaction to any combination of product features, not just those tested directly. How-
ever, even with adaptive methods, the number of parameters that can be estimated is limited by
the patience of the respondents. If features have interactions, such as a respondent valuing cargo
capacity more in a seven-seat vehicle than in a five-seat vehicle, then even more questions must
be asked to identify relative importances, ultimately leading to respondent fatigue. This further
limits the number of features that can be tested. (For example, two independent three-level fea-
tures require four parameters but two interacting three-level features require eight parameters.)
User design (UD) sacrifices the generality of conjoint-based methods in order to handle
more features that might possibly interact. Because UD data gathers only the ideal feature com-
bination for each respondent, it does not have WCA’s and FP’s abilities to simulate how respon-
dents will react to any feature combination. However, UD can be used to determine which
features are most desired by customers, which features interact, and which feature combinations
are viewed as ideal by customers. In addition, the interface is enjoyable to the respondent and
relatively easy to implement. It has been applied to cameras, copier finishers, laptop bags, auto-
mobile telematics, toys (GI Joe and Mr. Potato Head), custom shotguns, and laundry products.
UD relies heavily on the web to exploit the proven ability of customers to design their own prod-
ucts. (See Urban and von Hippel [80] and von Hippel [83, 84] for examples of user input in the
PD process.)
THE VIRTUAL CUSTOMER PAGE 15
Specifically, the web provides user interfaces that enable customers to select interactively
those features that they prefer in their ideal product. In many ways UD is similar to product
“configurators” used by websites such as Dell.com and Gateway.com, in which customers order
products by selecting features from drop-down menus. The key differences are (1) that UD uses
real and virtual features in a visually integrated format and (2) that the displayed product
changes interactively. These differences enable the PD team to determine which features to offer
customers. Van Buiten [75] describes such an approach applied to the design of future helicop-
ters, which improves on the usability of traditional configurators by enabling respondents to
drag-and-drop (DnD) their preferred features onto a design palette that illustrates the fully inte-
grated product.
For example, in Figure 8 respondents are shown the same six camera features from Fig-
ure 5. Respondents indicate which features they want in their camera by dragging features from
the “what you can buy” column to the “what your camera has” column. To remove features they
drag features from “what your camera has” to “what you can buy.” As respondents make these
choices, tradeoffs such as price, appearance, and performance are instantly visible and updated.
The respondents iteratively and interactively learn their preferences and reconfigure the design
until an “ideal” configuration is identified. The method can include full configuration logic, so
that only feasible designs can be generated – choices on one feature can preclude or interact with
choices on other features. For example, Figure 9 illustrates the use of UD in the design of a cop-
ier finisher. In this application, some features (C-fold and Z-fold) could not be chosen simulta-
neously. Beyond final feature choices, researchers observe click stream patterns and completion
times.
UD provides an engaging method of collecting data on customer tradeoffs. These data
can be used to narrow the set of features or determine which features should be standard and
which should be optional. The reduced set of features can then form the basis of a more exten-
sive conjoint analysis. While UD may be especially appropriate for “lead users” who are open to
exploring innovative solutions to address their acute needs [83, 84], we have found that the
method works well with “normal” users (even kids), once they have been briefed (via the web)
on the solution space and potential benefits of the product.
If PD teams are to use UD for the rapid screening of features, we would like to know
whether or not UD provides data that are consistent with the more intensive WCA and FP meth-

THE VIRTUAL CUSTOMER PAGE 16
ods. Specifically, how well does UD identify important features and predict customer choice?
We begin by examining internal consistency with data from the camera WCA. Recall that only
eight WCA paired-comparison questions were asked per respondent in Figure 6, thus, we could
only obtain estimates of feature importance at the segment level. Because there were no signifi-
cant differences found among segments (male vs. female, pre-teen vs. teen) we compare popula-
tion-level estimates. In a parallel camera UD we recorded the number of customers who
included each of the six features in their ideal design. These percentages are shown on the hori-
zontal axis of Figure 10. To place the WCA estimates on the same scale we used logistic regres-
sion to map the partworth values and price to the choice percentages. These are shown on the
vertical axis of Figure 10. The correlation was quite high (0.91) and was significant at the 0.01
level.6
Although the camera UD-WCA comparison demonstrated consistency in a real product
that is now launched, it was limited to the aggregate level only. To test the consistency of UD
with WCA we completed two additional tests. One was based on the copier finisher in Figure 9
and another was based on the crossover vehicles in Figure 7. In each case we used WCA to es-
timate feature importances and price sensitivity for each respondent and used that data to predict
whether or not they would select that feature at the price shown in the UD. The WCA for the
copier finisher was based on an older interface similar to that used in virtual concept testing
(Figure 12). Respondents found this interface cumbersome for WCA and felt that this interface
overemphasized price. This led to the improved interface that was illustrated with crossover ve-
hicles (Figure 7). Thus, we were not surprised when the new interface was more consistent with
UD than the old interface. In particular, the older WCA was able to predict feature preference
correctly for 61.3% of the respondent-feature combinations (n=245 respondents x three features).
This improved to 66.0% when we readjusted overall price sensitivity with a logit model. How-
ever, with the newer interface the ability of WCA to predict feature preference improved to
73.1% (n=130 respondents x six features) without any adjustments. All of these predictions are
significantly higher than random at the 0.01 level.
We also examined the consistency of UD and WCA by using feature importances from
WCA to estimate a rank ordering of all potential UD combinations of non-price features, with
price a function of the other features. In the crossover vehicle example, UD yielded sixty-four
possible vehicle designs (26 possible configurations of six features at two levels each). Figure 11
THE VIRTUAL CUSTOMER PAGE 17
reports the percentile rank of the UD selection for each respondent – 60% of the respondents
configured a vehicle that was in their top decile as predicted by WCA; 85% of the configurations
were in the top quartile.
Firms and researchers are just beginning to experiment with UD as a PD tool. Because
respondents find the interface easy to use, enjoyable, and fast, UD has the potential for screening
large numbers of features while highlighting interactions. For example, a UD for laptop bags
highlighted that logos were more likely to be preferred on bags that were offered in respondents’
school colors and that those respondents who chose cell-phone holders were more likely to
choose a PDA holder. In our applications we have assigned fixed prices to each feature, but
prices are easily randomized to enable measurement of price sensitivity. Liechty, Ramaswamy,
and Cohen [45] demonstrate one such approach in the context of a web-based Yellow Pages ser-
vice, and show how multiple UD exercises allow estimation of part worths at the individual
level.
The UD interface is also beginning to be used by manufacturers who sell mass-
customized goods over the web. One example is the website used by a laptop computer bag
manufacturer, Timbuk2.com. UD capability also opens new research opportunities for academ-
ics and new persuasive tools for marketing professionals. For example, Cattani, Dahan and
Schmidt [6] employ data from the laptop bag example to optimize mass customization. Park,
Jun, and MacInnis [59] demonstrate that customers arrive at different “ideal configurations” de-
pending on whether they are asked to add options to a base model or subtract options from a
fully loaded model. As these phenomena are better understood, site designers might enhance
sales effectiveness with the initial configuration of a UD website (in the case of mass-customized
e-commerce). This developing research also cautions market researchers that initial feature lev-
els that are presented to customers as defaults could influence measures of customer interest in
features.
Virtual Concept Testing (VCT)
Not all products can be completely decomposed into features. For example, while the
WCA in Figure 7 is useful to gain an understanding of how consumers value features in cross-
over vehicles, we would not expect those six features to fully describe a crossover vehicle. Styl-
ing is clearly important, as is brand and the manufacturer’s reputation for reliability and service.
THE VIRTUAL CUSTOMER PAGE 18
Because holistic descriptions are critical to ultimate customer purchase decisions, PD teams of-
ten need to move beyond feature-based methods, especially later in the PD design process.
In virtual concept testing (VCT), respondents view new product concepts and express
their preferences by “buying” their most preferred concepts at varying prices. These choices are
converted into preferences for each concept by conjoint-analysis-like methods in which the rank-
order selections are explained with the two variables, price and concept, as in Dahan and Srini-
vasan [19]. The interface is illustrated in Figure 12 where each of eight crossover vehicles are
represented by brand name, pictures, and ratings on seven features. The respondent decides se-
quentially which concept they would buy at each of three prices, $25K, $35K and $45K. Be-
cause this method has already been published in the Journal of Product Innovation Management
we refer the reader to Dahan and Srinivasan [19] who demonstrate that VCT preferences are
highly correlated with concept tests based on physical prototypes. We replicated their approach
with eight crossover vehicles using three independent groups of respondents, two student groups
(n=43, 49) and a group of eBusiness executives (n=42), using the VCT task in Figure 12. The
forecast market shares had high reliability (Cronbach’s α = 0.95) for both first-preference shares
and for shares of the top three vehicles.
Our experience suggests that VCT complements WCA, FP, and UD. While WCA, FP,
and UD help the PD team identify the most important features, VCT enables evaluation of full
concepts, complete with pictures and other multimedia representations. We expect VCT to grow
in power and applicability over the next few years. With further development of multimedia
concept representation, more realistic and practical CAD renderings, and increased Internet
bandwidth, VCT methods have the potential to reduce the cost and time devoted to concept test-
ing and/or to increase the number of concepts that can be tested earlier in the PD process.
Securities Trading of Concepts (STOC)
We now review two methods that exploit the web’s ability to enhance communication
among customers and measure the preferences of a group of respondents. By structuring incen-
tives carefully so that customers act in their own best interests, one method (Securities Trading
of Concepts, STOC) uses the computational capability of web-based servers to monitor customer
interactions in a manner that attempts to reveal customers’ “true” preferences. Another method
(the Information Pump, IP) focuses on the language that respondents use to evaluate concepts
THE VIRTUAL CUSTOMER PAGE 19
and features and, hence, provides an interesting complement to voice-of-the-customer methods
[33].
These interactive, incentive-compatible “games” have the potential to address the criti-
cisms of response biases and demand artifacts in survey research [63, 64]. Further, by observing
customer-to-customer interaction, these methods might extend virtual customer methods to those
products for which customers may be influenced by others’ opinions and choices – an externality
that is not easily accounted for with traditional concept testing methods. Both methods are rela-
tively new and, as such, we cannot yet report the same level of reliability and validity testing that
is available for the customer-feedback methods. Instead, we present both methods as examples
of the new ideas emerging from research on web-based customer-to-customer interaction.
The STOC method sets up a market in concepts through which “traders” reveal market
preferences as they buy and sell securities in a free market. A system implemented by Chan,
Dahan, Lo, and Poggio [9] uses fifteen or more respondents who simultaneously log onto a se-
cure website to engage in a trading game.7 Traders (respondents) are not asked their preferences
directly. Rather each trader is told to maximize the value of his or her portfolio of concepts.
Traders whose portfolios have higher values at the end of trading receive higher rewards.
The trading begins with an introduction to the product concepts (securities) where prod-
uct diagrams, photos, performance ratings, and textual information are provided in a web-based
interactive format. Figure 13 provides two examples – bike pumps and crossover vehicles. Af-
ter the securities briefing, traders are introduced to the STOC trading user interface in Figure 14.
It includes a buy-and-sell order entry form in the upper right, transaction monitoring in the center
right, a portfolio summary in the lower right, updated prices, spreads, and volumes in the lower
left, and a stock-by-stock graphical history in the upper left. This interface simulates the capa-
bilities available to Wall Street traders. Stock prices are strictly determined by exchanges be-
tween buyers and sellers. If the market is efficient, these valuations will depend upon traders’
personal evaluations of the securities, their expectations of others’ valuations, and the current
price of each stock. The innovation here is that the securities represent competing concepts
within a product category, similar to the Iowa Electronic Market (www.biz.uiowa.edu/iem/) in
which securities represent political candidacies and the Hollywood Exchange (www.HSX.com)
in which securities represent individual movies, actors, and directors. STOC uses the price
mechanism to rapidly disseminate preference information to enable the “market” to value win-
THE VIRTUAL CUSTOMER PAGE 20
ning and losing product concepts. STOC builds on the IEM and HSX approaches, adding the
important element of virtual concepts including those that do not currently, nor might ever, exist.
In an initial test of the STOC method, we compared the outcomes of several trading game
experiments for a specific set of products with the outcomes of more traditional concept-testing
methods for those same products. Specifically, nine portable bicycle pump concepts from Dahan
and Srinivasan [19] were traded in two STOC games. The outcomes are plotted in Figure 15.8
Although the original preferences are based on a large sample survey of west coast students and
the STOC (median) prices are based on a smaller sample of east coast students two years later,
the top three “winners” are consistent across methods. The correlations between preferences and
STOC median prices are 0.88 and 0.82, both of which were significant at the 0.01 level. STOC
was then replicated using crossover vehicle concepts with two MBA student groups (n=43, 49)
and a group of eBusiness executives (n=42). The market shares, as forecast using the STOC me-
dian price and the STOC volume-weighted average price, were reliable (Cronbach’s α of 0.85
for each measure separately; 0.94 for the combined measures). Although no external measure of
market share was available, the shares forecast by STOC correlated well with first preference
shares (0.74, 0.01 level).
The potential advantages of STOC are (1) its ability to measure preference in situations
where one consumer’s preference depends upon the “market’s” preference (e.g., products in
which fashion and styling are important), (2) an ability to gather opinions quickly from custom-
ers through an enjoyable “game” experience, (3) incentive compatibility, and (4) several “price”
measures indicating each concept’s relative strength. Initial tests suggest that securities trading
can be taught to college-educated respondents quickly and naturally. However, STOC needs fur-
ther testing prior to full-scale adoption. In particular, the authors plan further usability testing
with a broader group of respondents and reliability and validity testing beyond that suggested by
Figure 15. This testing should isolate the “price” measures that are most predictive of ultimate
market shares. Experiments to date suggest that the closing prices and the maximum prices are
subject to manipulation by experienced “gamers.” In contrast, median, minimum, and volume-
weighted-average prices appear to be more accurate and robust predictors. Other experiments
will vary the information given to the “traders.” For example, the traders can be given informa-
tion from previous STOC tests and/or prior customer-feedback tests such as WCA, UD, FP, or
VCT.
THE VIRTUAL CUSTOMER PAGE 21
The Information Pump (IP)
Most of the research on web-based methods has focused on the importance of alternative
product features and on concept evaluation, but the ability of the web to enhance customer-to-
customer communication can also be used to learn the voice of the customer in new and creative
ways. Prelec’s [60] information pump (IP) is a web-based customer input method that is focused
on the fuzzy front end of product development when the PD team is trying to understand the vo-
cabulary and descriptions that customers use for both existing products and new concepts. The
IP is, in essence, a virtual focus group but with some interesting twists based on the computa-
tional capabilities of today’s web interfaces. In particular, the task and the incentives in the IP
are fine-tuned so that the respondents think hard and provide honest answers.
The initial applications of the IP have been in the context of concept tests – respondents
are presented with virtual concepts, often with multimedia demonstrations, and are asked to de-
scribe these concepts. There are three roles in the “game” – encoder, decoder, and dummy. The
encoders and decoders see the concept but the dummy does not. The dummy remains the
dummy throughout the game, but the other respondents cycle through the roles of encoder and
decoder. Encoder/decoders each see the same basic concept, but are given different photographs
or renderings of the same concept. This way, when they communicate, they are forced to com-
municate about the fundamental characteristics of the concept, such as “the concept is a car for
young people,” rather than superficial features, such as “the car is in the middle of the photo.”
In any given round of the game, the encoder offers a true/false statement about the con-
cept, and states whether the statement is true or false. For example, the encoder might state that
a concept car is “good for city driving” and that the answer is “true.” The decoders then state
whether they perceive the statement as “true” or “false” and indicate their confidence in their an-
swer. If the concept really is “good for city driving” compared to an average automobile, then
the decoders will answer true with high confidence. The dummy views the statement (but not
the concept) and guesses the answer to the question. The dummy may or may not be able to
guess the answer correctly and may or may not be confident in his or her answer. If the state-
ment does not discriminate among cars (“has four wheels”) or if the statement is redundant with
previous statements (“an urban vehicle”), then the dummy can guess the answers as well as the
decoders. If the statement accurately describes the concept (i.e., is clearly true or false) and if
the statement provides a new and different description relative to previous statements in the

THE VIRTUAL CUSTOMER PAGE 22
game, then the decoders will be able to figure out the answer better than the dummy, and with
higher confidence. To encourage truth telling, the decoders are rewarded on the accuracy of
their answers. They are rewarded more if they are more confident. To encourage the dummy to
think hard, the dummy is also rewarded on the accuracy and confidence of his or her answers. To
encourage the encoder to generate non-redundant, descriptive statements, the encoder is re-
warded on the accuracy and confidence of the decoders’ answers relative to the accuracy and
confidence of the dummy’s answers. Detailed rules of the game, an example reward structure,
and sample applications are available on the virtual customer website.
Figure 16 illustrates a typical user interface. A discussion log keeps respondents in-
formed of others' reactions and reinforces the rewards of the game. The specific reward structure
and the psychology behind the reward structure are based on the theories of truth-inducing loga-
rithmic scoring for non-zero-sum, non-cooperative games. They are beyond the scope of this
article but contained in Prelec [60].
The novel aspect of the scoring system is that the IP rewards participants for the quality
of the questions that they contribute to the exercise. A “good” question, according to the scoring
system, satisfies two criteria. First, it identifies something distinctive and descriptive about the
concept presented. Second, it is a new contribution to the discussion about this particular con-
cept. Questions that merely reformulate information contained in earlier items will not be re-
warded. As the game progresses the list of statements grows – each statement adds a new and
different perspective on the concept. Encoders have strong incentives to express needs clearly,
potentially making the IP effective at eliciting difficult-to-articulate needs and identifying re-
spondents who are skilled at doing so. Decoders have strong incentives to answer truthfully
about their perceptions of the product, thus making the IP an interesting new way to elicit re-
spondents’ true perceptions of concepts.
The IP has been pilot tested with concept cars and visual advertising materials and has
been benchmarked against a control procedure, which has the same “look and feel” as the infor-
mation pump, but without the interactive scoring system. Early indications suggest that the IP
provides customer statements that independent judges evaluate as more creative [60]. Currently,
the IP is limited by its need for respondents to play the game simultaneously, however, work is
underway to develop an asynchronous version in which respondents can visit a secure website at
their own convenience over the course of a study.
THE VIRTUAL CUSTOMER PAGE 23
Virtual Customer Discussion
Web-based interviewing is a relatively new development that has the potential to trans-
form the way PD teams gather information from and interact with customers. It relies on ad-
vances in communication, conceptualization, and computation that increase the effectiveness and
efficiency of linking the voice of the customer directly to the capabilities of the PD team. How-
ever, there are many challenges to overcome. Like other disruptive technologies, the initial ap-
plications may not perform as well on traditional measures as do existing methodologies [3, 10].
Initially, PD teams will have to make tradeoffs; the old and the new will co-exist, with each be-
ing used for its unique advantages. However, as more researchers and more firms evolve web-
based customer input methods, we expect the weaknesses to be overcome and the strengths to
improve. We expect web-based interviewing soon to become an important paradigm for fulfill-
ing many of the customer-input requirements of the PD team.
While virtual customer methods may be used at every stage of product development, not
every method will be used at every stage. Figure 17 is based on our early experiences and is one
example of how the six methods might be used synergistically throughout the PD process. The
“PD funnel” in the center of Figure 17 is an abstract representation of the stages of PD as prod-
ucts move from ideas, to concepts, to design & engineering, to testing, and to launch. The ovals
in the funnel represent products that are winnowed, refined, and improved at each stage based on
customer input and other analyses. The four groups of products separated by dotted lines ab-
stract the concept of parallel development and product-platform development. For simplicity,
Figure 17 has the look and feel of a stage-gate process, but the applicability of virtual customer
methods is equally as strong for the new spiral PD processes.
The IP’s strength is its ability to gather the language of the customer, including features
and needs that are difficult for customers to articulate. One use is to identify opportunities and
ideas and to focus engineering teams on customer needs as seen through the lens of the custom-
ers’ language. Similarly, FP can be applied early in the PD process. Its strength is the ability to
screen large numbers of potential product features quickly. Because reasonable estimates can be
obtained with fewer questions than there are unknown parameters, the PD team can trade off a
small amount of accuracy for the ability to direct design attention toward a small, high-leverage
set of product features.
THE VIRTUAL CUSTOMER PAGE 24
As the product moves from concept generation to design & engineering, the PD team
needs more accuracy and a deeper understanding of the tradeoffs that customers make when
evaluating products. Here WCA shines. The methods are built upon over twenty years of con-
joint-analysis research and application. The new interfaces rely on proven estimation methods
while bringing advanced conceptualization to virtual features so that they might be tested earlier
in the process and with greater speed. UD complements conjoint analysis by providing a means
by which customers design their own products. UD is particularly suited to products where the
features interact and where a conjoint-analysis application would need a large, complex experi-
mental design to estimate the interactions. In such situations, the PD team might be willing to
sacrifice the ability to measure detailed feature importances for each respondent. UD is also
suited to instances where customers need to learn their own preferences for really new products,
and might even be used as a training step prior to WCA or FP.
Once fully integrated product concepts are “developed,” they need to be tested. Here the
web brings a greater ability to evaluate multiple virtual concepts quickly. VCT enables the PD
team to get rapid and inexpensive feedback on the Product (with a big P) that includes descrip-
tions of the product and its features, illustrations of the product in use, and marketing elements
such as brochures, magazine articles, advertisements, and simulated word of mouth. In the early
1990s, virtual Product testing relied on expensive clinics in which customers were brought to a
central location and shown video tapes and other media [55, 58, 65, 79]. Such clinics often cost
hundreds of thousands of dollars. In the mid 1990s, virtual Product testing moved to computer-
based methods called information acceleration. However these, too, were expensive and difficult
to implement [78, 81]. As web access and web panels improve, web-based VCT promises to re-
duce these costs dramatically and to reduce time delays from weeks (or months) to days. New
software tools are making development less expensive, broadband communications are making it
feasible to stream multimedia experiences to customers, and pre-recruited panels (for consumer
goods) are making it quick.
STOC provides an alternative concept screening method, especially when the PD team is
dealing with a product in which customers’ preferences might depend upon what other customers
prefer (e.g., a fashion watch or personal communication device). However, while STOC pro-
vides reliable estimates, it is too early to tell whether STOC will realize the external validity of
more proven concept-testing methods.
THE VIRTUAL CUSTOMER PAGE 25
The six virtual customer techniques reviewed in this article are just of sampling of the
methods that will evolve as information and communication technologies advance. For example,
Urban [75] is experimenting with virtual engineers that can “listen in” to customers as they
search the web for products to buy. His early work with truck purchasing is promising.
What is clear, however, is that the new information and communications technologies are
expanding the efficient frontier of the accuracy vs. cost/time tradeoff. In many situations, web-
based methods are cost efficient and their lower entry barriers put their capabilities directly into
the hands of the PD team. A day might come when conducting virtual customer tests is almost
as common as performing “what if” analyses with spreadsheet software.
Besides bringing more customer input to the PD process, virtual customer methods might
encourage a greater number of concepts to be explored and tested with customers. Srinivasan,
Lovejoy, and Beach [71] suggest further that PD teams will undertake more parallel concept test-
ing prior to “freezing” the design of a new product. Dahan and Mendelson [18] quantify the ar-
gument and suggest that under certain distributions of profit uncertainty, the optimal number of
concepts to be explored grows dramatically as (1) the cost per test declines and (2) when the up-
side profit opportunity declines at a slower-than-exponential (i.e., “fat-upper-tailed”) manner.
Current virtual customer methods have their weaknesses. They rely on virtual prototypes
rather than physical prototypes; software development is still embryonic, often requiring custom
programming for each application; panels are still being developed and their representativeness
is still being tested; and experience with the methods pales compared to experience with tradi-
tional methods. Initial tests suggest high face validity and good internal validity, but only WCA
and FP have been subjected to tests of external validity. Nonetheless, we are optimistic that
these challenges will be overcome by the product-development community and that virtual cus-
tomer methods will emerge as an integral component in the practice of product development.
THE VIRTUAL CUSTOMER, REFERENCES PAGE R1
References
1. Anthony, Michael T. and Jonathon McKay (1992), “Balancing the Product Development Process: Achieving Product and Cycle Time Excellence in High-Technology Industries,” 9, 140-147.
2. Bateson, John E. G., David Reibstein, and William Boulding (1987), “Conjoint Analysis Re-liability and Validity: A Framework for Future Research,” Review of Marketing, Michael Houston, Ed., pp. 451-481.
3. Bower, Joseph L and Clayton M. Christensen (1995), “Disruptive Technologies: Catching the Wave,” Harvard Business Review, (January-February), 43-53.
4. Buckman, Rebecca (2000), “Knowledge Networks’ Internet Polls Will Expand to Track Web Surfers,” Wall Street Journal, (September 7).
5. Carmone, Frank J., Paul E. Green, and Arun K. Jain (1978), “Robustness of Conjoint Analy-sis: Some Monte Carlo Results,” Journal of Marketing Research, 15, (May), 300-303.
6. Cattani, Kyle, Ely Dahan, and Glen M. Schmidt (2001), “Is Mass Customization Made-to-Order for Manufacturing and Marketing?,” working paper, Cambridge, MA: MIT Sloan School.
7. Cattin, Philippe and Dick R. Wittink (1982), “Commercial Use of Conjoint Analysis: A Sur-vey,” Journal of Marketing, 46, (Summer), 44-53.
8. Chan, Christine W. Y. (1999), “Measuring Non-Monetary Incentives Using Conjoint Analy-sis,” M.Eng. EECS Thesis, (Cambridge, MA: Massachusetts Institute of Technology), June.
9. Chan, Nicholas, Ely Dahan, Andrew Lo, and Tomaso Poggio (2000), “Securities Trading of Concepts (STOC),” working paper, Cambridge, MA: MIT Sloan School.
10. Christensen, Clayton (1998), The Innovator's Dilemma : When New Technologies Cause Great Firms to Fail (Boston, MA: Harvard Business School Press).
11. Clausing, Don (1994), Total Quality Development, (New York, NY: ASME Press), 121-124.
12. Cooper, Robert G. (1990), “Stage-Gate Systems: A New Tool for Managing New Products,” Business Horizons, (May-June), 44-54.
13. ______ and Elko Kleinschmidt (1994), “Determinants of Timeliness in Product Develop-ment,” Journal of Product Innovation Management, 11, 381-396.
14. Cusumano, Michael A. and David B. Yoffie (1998). Competing on Internet Time, (New York, NY; The Free Press).
15. ______ and Richard W. Selby (1995), Microsoft Secrets, (New York, NY: The Free Press).
16. Dahan, Ely and John R. Hauser (2000), “Managing a Dispersed Product Development Proc-ess,” forthcoming chapter in the Handbook of Marketing, Barton Weitz and Robin Wen-sley, Editors.
17. ______, ______, Duncan Simester, and Olivier Toubia (2001), “Comparative Validity Test of FastPace and Adaptive Conjoint Analysis,” working paper, Cambridge, MA: Center for Innovation in Product Development, MIT, (June).
THE VIRTUAL CUSTOMER, REFERENCES PAGE R2
18. ______ and Haim Mendelson (2001), “An Extreme Value Model of Concept Testing,” Man-agement Science (Special Issue on New Product Development), Vol. 47, No. 1, (January), 102-116.
19. ______ and V. Srinivasan (2000), “The Predictive Power of Internet-Based Product Concept Testing Using Visual Depiction and Animation,” Journal of Product Innovation Man-agement, 17, (March), 99-109.
20. Datar, Srikant, C. Clark Jordan, Sunder Kekre, Surendra Rajiv, and Kannan Srinivasan (1997), “Advantages of Time-Based New Product Development in a Fast-Cycle Industry, Journal of Marketing Research, 34, 1, (February), 36-49.
21. Dawes, Robin M. and Bernard Corrigan (1974), “Linear Models in Decision Making,” Psy-chological Bulletin, 81, (March), 95-106.
22. Einhorn, Hillel J. (1971), “Use of Nonlinear, Noncompensatory Models as a Function of Task and Amount of Information,” Organizational Behavior and Human Performance, 6, 1-27,
23. Faura, Julio (2000), "Contribution to Web-based Conjoint Analysis for Market Research," Management of Technology S. M. Thesis, Cambridge, MA: MIT (June).
24. Freund, Robert (1993), “Projective Transformations for Interior-Point Algorithms, and a Su-perlinearly Convergent Algorithm for the W-Center Problem,” Mathematical Program-ming, 58, 385-414.
25. Gonier, Dennis E. (1999), “The Emperor Gets New Clothes,” Paper presented at the Adver-tising Research Foundation’s On-line Research Day and available at www.dmsdallas.com. (January).
26. Green, Paul E., (1984), “Hybrid Models for Conjoint Analysis: An Expository Review,” Journal of Marketing Research, pp. 155-169.
27. ______, J. Douglas Carroll, and Stephen M. Goldberg (1981), “A General Approach to Prod-uct Design Optimization via Conjoint Analysis,” Journal of Marketing, 45, (Summer), 17-37.
28. ______, Stephen M. Goldberg, and Mila Montemayor (1981), “A Hybrid Utility Estimation Model for Conjoint Analysis,” Journal of Marketing, pp. 33-41.
29. ______, Abba Krieger and Manoj K. Agarwal (1991), “Adaptive Conjoint Analysis: Some Caveats and Suggestions,” Journal of Marketing Research, pp. 215-222.
30. ______ and V. Srinivasan (1978), “Conjoint Analysis in Consumer Research: Issues and Outlook,” Journal of Consumer Research, 5, 2, (September), 103-123.
31. ______ and ______ (1990), “Conjoint Analysis in Marketing: New Developments With Im-plications for Research and Practice,” Journal of Marketing, pp. 3-19.
32. Griffin, Abbie J. (1997), “The Effect of Project and Process Characteristics on Product De-velopment Cycle Time,” Journal of Marketing Research, 34, 24-35.
33. ______ and John R. Hauser (1993), "The Voice of the Customer," Marketing Science, vol. 12, No. 1, (Winter), 1-27.
THE VIRTUAL CUSTOMER, REFERENCES PAGE R3
34. Hagerty, Michael R. and V. Srinivasan (1991), "Comparing the Predictive Powers of Alternative Multiple Regression Models," Psychometrika, 56 (March), pp. 77-85.
35. Hauser, John R., and Steven M. Shugan (1980), "Intensity Measures of Consumer Prefer-ence," Operation Research, Vol. 28, No. 2, (March-April), 278-320.
36. ______ and Patricia Simmie (1981), "Profit Maximizing Perceptual Positions: An Integrated Theory for the Selection of Product Features and Price," Management Science, Vol. 27, No. 2, (January), 33-56.
37. Holmes, Maurice (1999), “Product Development in the New Millennium - a CIPD Vision,” Proceedings of the Product Development Management Association Conference, Marco Island (October).
38. Huber, Joel, (1975), “Predicting Preferences on Experimental Bundles of Attributes: A Com-parison of Models,” Journal of Marketing Research, 12, (August), pp. 290-297.
39. Huber, Joel, Dick R. Wittink, John A. Fiedler, and Richard Miller (1993), “The Effectiveness of Alternative Preference Elicitation Procedures in Predicting Choice,” Journal of Mar-keting Research, pp. 105-114.
40. Johnson, Richard (1987), “Accuracy of Utility Estimation in ACA,” Working Paper, Saw-tooth Software, Sequim, WA, (April).
41. ______ (1991), “Comment on `Adaptive Conjoint Analysis: Some Caveats and Suggestions,” Journal of Marketing Research, 28, (May), 223-225.
42. ______ (1999), “The Joys and Sorrows of Implementing HB Methods for Conjoint Analy-sis,” (Sequim, WA: Sawtooth Software) (November).
43. Karmarkar, N. (1984), “A New Polynomial Time Algorithm for Linear Programming,” Combinatorica, 4, 373-395.
44. Lenk, Peter J., Wayne S. DeSarbo, Paul E. Green, and Martin R. Young (1996), “Hierarchi-cal Bayes Conjoint Analysis: Recovery of Partworth Heterogeneity from Reduced Ex-perimental Designs,” Marketing Science, 15, 2, 173-191.
45. Liechty, John, Venkatram Ramaswamy, Steven Cohen (2001), “Choice-Menus for Mass Customization: An Experimental Approach for Analyzing Customer Demand With an Application to a Web-based Information Service,” Journal of Marketing Research, 38, 2, (May).
46. Mahajan, Vijay and Jerry Wind (1992), “New Product Models: Practice, Shortcomings and Desired Improvements,” Journal of Product Innovation Management, 9, 128-139.
47. _______ and _______ (1988), "New Product Forecasting Models, Directions for Research and Implementation", International Journal of Forecasting, 4, 341-358.
48. Malhotra, Naresh (1982), “Structural Reliability and Stability of Nonmetric Conjoint Analy-sis,” Journal of Marketing Research, 19, (May), 1999-207.
49. ______ (1986), “An Approach to the Measurement of Consumer Preferences Using Limited Information,” Journal of Marketing Research, 23, (February), 33-40.
50. Marketing News (2000), “Critical Mass 2000,” Marketing News, December 4, 11.

THE VIRTUAL CUSTOMER, REFERENCES PAGE R4
51. McArdle, Meghan (2000), "Internet-based Rapid Customer Feedback for Design Feature Tradeoff Analysis," LFM Thesis, Cambridge, MA: Massachusetts Institute of Technol-ogy (June).
52. McGrath, Michael E. (1996), Setting the Pace in Product Development: A guide to Product and Cycle-Time Excellence, (Boston, MA: Butterworth-Heinemann).
53. Moore, William L. and Edgar A. Pessemier (1993), Product Planning and Management: Designing and Delivering Value, (New York, NY: McGraw-Hill, Inc.).
54. ______ and Richard J. Semenik (1988), “Measuring Preferences with Hybrid Conjoint Analysis: The Impact of a Different Number of Attributes in the Master Design,” Journal of Business Research, pp. 261-274.
55. Narasimhan, Chakravarthi and Subrata K. Sen (1983), “New Product Models for Test Market Data,” Journal of Marketing, 47, 1, (Winter), 11-24.
56. Nadilo, Rudy (1999), “On-line Research: The Methodology for the Next Millennium,” Advertising Research Foundation Journal, (Spring). Available at www.greenfield.com.
57. Orme, Bryan (1999), “ACA, CBC, of Both?: Effective Strategies for Conjoint Research,” (Sequim, WA: Sawtooth Software).
58. Ozer, Muanmmer (1999), “A Survey of New Product Evaluation Models,” Journal of Prod-uct Innovation Management, 16, 1, (January), 77-94.
59. Park, C. Whan, Sung Youl Jun, and Deborah J. MacInnis (2000), “Choosing What I Want versus Rejecting What I Don’t Want: An Application of Decision Framing to Product Option Choice Decisions,” Journal of Marketing Research, 37: 5, May, pp. 187-202.
60. Prelec, Draž en (2001), “A Two-person Scoring Rule for Subjective Reports,” Working Pa-per, Center for Innovation in Product Development, (Cambridge, MA, Massachusetts In-stitute of Technology), February.
61. Pugh, Stuart (1996), Creating Innovative Products Using Total Design: The Living Legacy of Stuart Pugh, Editors: Don Clausing and Ron Andrade, (Reading, MA: Addison-Wesley, Inc.).
62. Sawtooth Software, Inc. (1996), “ACA System: Adaptive Conjoint Analysis,” ACA Manual, (Sequim, WA: Sawtooth Software, Inc.).
63. Sawyer, Alan G. (1975), “Demand Artifacts in Laboratory Experiments in Consumer Re-search,” Journal of Consumer Research, 1. (March), 20-30.
64. Shimp, Terry, Eva Hyatt, and David Snyder (1991), “A critical Appraisal of Demand Arti-facts in Laboratory Experiments in Consumer Research,” Journal of Consumer Research, 18, (December), 273-283.
65. Shocker, Allan D. and William G. Hall (1986), “Pretest Market Models: A Critical Evalua-tion,” Journal of Product Innovation Management, 3, 3, (June), 86-108.
66. ______ and V. Srinivasan (1979), “Multiattribute Approaches to Product Concept Evaluation and Generation: A Critical Review,” Journal of Marketing Research, 16, (May), 159-180.
67. Smith, Preston G. and Donald G. Reinertsen (1998), Developing Products in Half the Time, 2E, (New York, NY: John Wiley & Sons, Inc.).
THE VIRTUAL CUSTOMER, REFERENCES PAGE R5
68. Sonnevend, G. (1985a), “An ‘Analytic’ Center for Polyhedrons and New Classes of Global Algorithms for Linear (Smooth, Convex) Programming,” Proceedings of the 12th IFIP Conference on System Modeling and Optimization, Budapest.
69. ______ (1985b), “A New Method for Solving a Set of Linear (Convex) Inequalities and its Applications for Identification and Optimization,” Preprint, Department of Numerical Analysis, Institute of Mathematics, Eötvös University, Budapest, 1985.
70. Srinivasan, V. (1988), “A Conjunctive-Compensatory Approach to the Self-Explication of Multiattributed Preferences,” Decision Sciences, 19, 295-305.
71. ______, William S. Lovejoy, and David Beach (1997), “Integrated Product Design for Mar-ketability and Manufacturing,” Journal of Marketing Research, Volume 34, February, pp. 154-163.
72. ______ and Chan Su Park (1997), “Surprising Robustness of the Self-Explicated Approach to Customer Preference Structure Measurement,” Journal of Marketing Research, 34, (May), 286-291.
73. Tessler, Amy, Norm Wada, and Robert L. Klein (1993), “QFD at PG&E,” Transactions from The Fifth Symposium on Quality Function Deployment, (June).
74. Toubia, Olivier, Duncan Simester, John R. Hauser (2001), “Fast Polyhedral Adaptive Con-joint Estimation,” working paper, Cambridge, MA: Center for Innovation in Product De-velopment, MIT, (May).
75. Van Buiten, Christopher (1998), " Putting Your Customers to Work: The Design of Internet Environments to Facilitate Customer Participation in the Conceptual Design of New Products," Systems Design and Management S. M. Thesis, Cambridge, MA: MIT (De-cember).
76. Urban, Glen L. (2000), “Listening In to Customer Dialogues on the Web,” working paper, Cambridge, MA: Center for Innovation in Product Development, MIT.
77. ______ and John R. Hauser, Design and Marketing of New Products, 2E, (Englewood Cliffs, NJ: Prentice Hall, Inc.).
78. ______, ______, William J. Qualls, Bruce D. Weinberg, Jonathan D. Bohlmann and Roberta A. Chicos (1997), "Validation and Lessons from the Field: Applications of Information Accel-eration," Journal of Marketing Research, 34, 1, (February), 143-153.
79. ______, ______ and John. H. Roberts (1990), "Prelaunch Forecasting of New Automobiles: Models and Implementation," Management Science, 36, 4, (April), 401-421.
80. ______ and Eric von Hippel (1988), “Lead User Analysis for the Development of New In-dustrial Products,” Management Science, 34, 5, (May), 569-582.
81. ______, Bruce Weinberg, and John R. Hauser (1996), "Premarket Forecasting of Really-New Products," Journal of Marketing, 60,1, (January), 47-60. Abstracted in the Journal of Fi-nancial Abstracts, 2, 23A, (June) 1995.
82. Vaidja, P. (1989), “A Locally Well-Behaved Potential Function and a Simple Newton-Type Method for Finding the Center of a Polytope,” in: N. Megiddo, ed., Progress in Mathe-matical Programming: Interior Points and Related Methods, Springer: New York, 79-90.

THE VIRTUAL CUSTOMER, REFERENCES PAGE R6
83. von Hippel, Eric (1986), “Lead Users: A Source of Novel Product Concepts,” Management Science, 32, 791-805.
84. ______ (1988), The Sources of Innovation, (New York, NY: Oxford University Press).
85. Wallace, David, Shaun Abrahamson, Nicola Senin, Peter Sferro (2000), “Integrated Design in a Service Marketplace,” Computer-aided Design, 32: 2, 97-107.
86. Willkie, Joseph., Adams, Christine and Azra Girnius (1999), “First Systematic Comparison Between Mall-Intercept and Internet Interviewing,” European Society for Opinion and Marketing Research, Worldwide Internet Conference, London UK, (February 21).
87. Wind, Jerry (1982), Product Policy, (Reading, MA: Addison-Wesley, Inc.).
88. ______, Paul E. Green, Douglas Shifflet, and Marsha Scarbrough (1989), “Courtyard by Marriott: Designing a Hotel Facility with Consumer-Based Marketing Models,” Inter-faces, pp. 25-47.
89. Wiseman, Frederick and Philip McDonald, “The Non-response Problem in Consumer Tele-phone Surveys,” Marketing Science Institute Report No. 78-116, November 1978.
90. ______ and ______, “Toward the Development of Industry Standards for Response and Non-response Rates,” Marketing Science Institute Report No. 80-101, March 1980.
91. Wittink, Dick R. and Philippe Cattin (1981), “Alternative Estimation Methods for Conjoint Analysis: A Monte Carlo Study,” Journal of Marketing Research, 18, (February), 101-106.
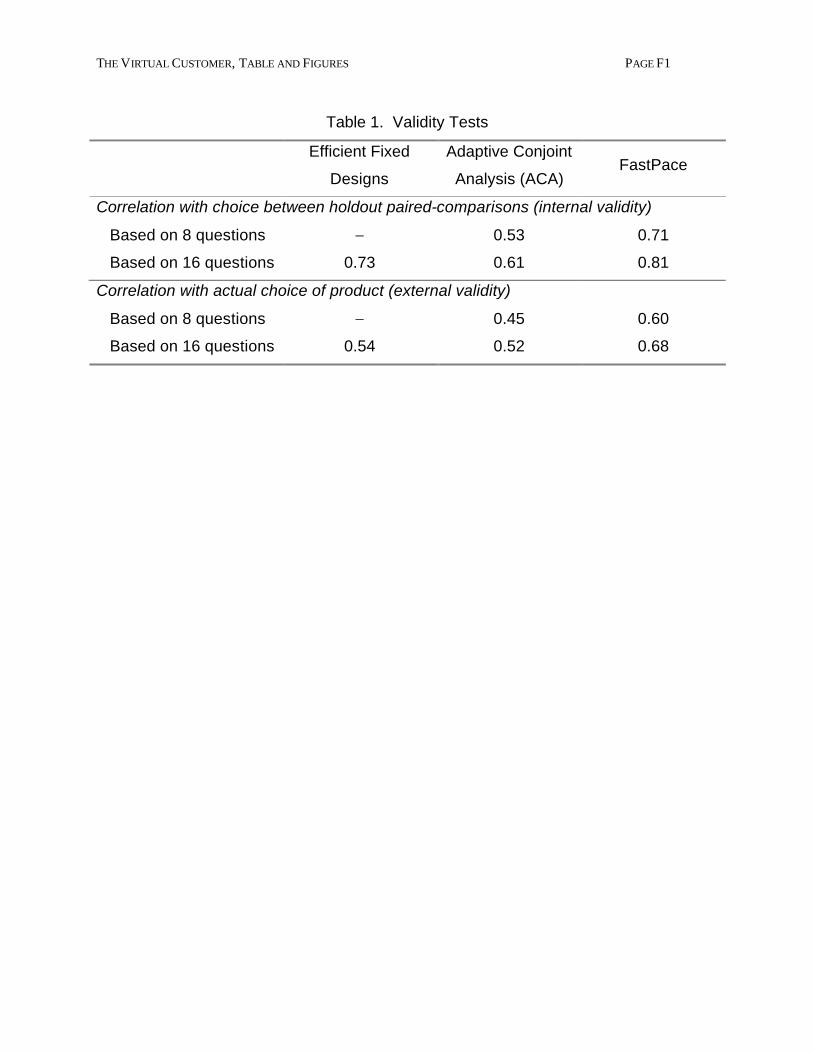
THE VIRTUAL CUSTOMER, TABLE AND FIGURES PAGE F1
Table 1. Validity Tests
Efficient Fixed
Designs
Adaptive Conjoint
Analysis (ACA) FastPace
Correlation with choice between holdout paired-comparisons (internal validity)
Based on 8 questions – 0.53 0.71
Based on 16 questions 0.73 0.61 0.81
Correlation with actual choice of product (external validity)
Based on 8 questions – 0.45 0.60
Based on 16 questions 0.54 0.52 0.68
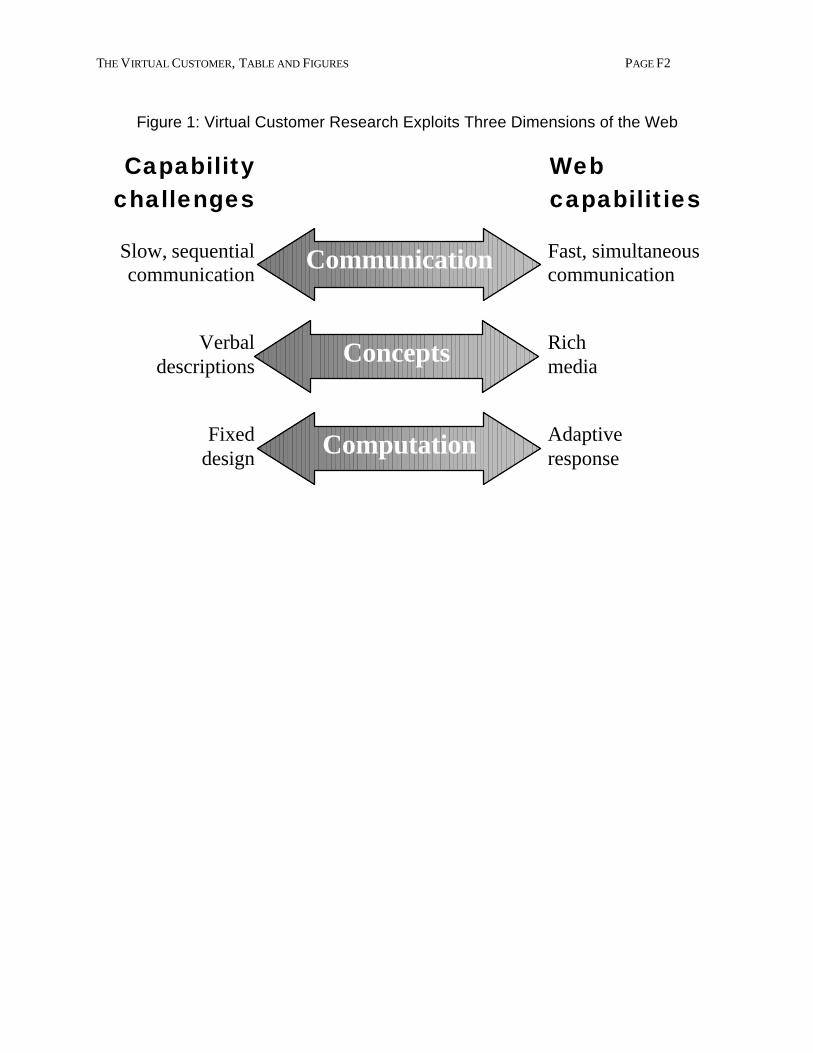
THE VIRTUAL CUSTOMER, TABLE AND FIGURES PAGE F2
Figure 1: Virtual Customer Research Exploits Three Dimensions of the Web
Communication Slow, sequentialcommunication
Fast, simultaneous communication
Capabilitychallenges
Web capabilities
Concepts Verbaldescriptions
Rich media
Computation Fixeddesign
Adaptive response
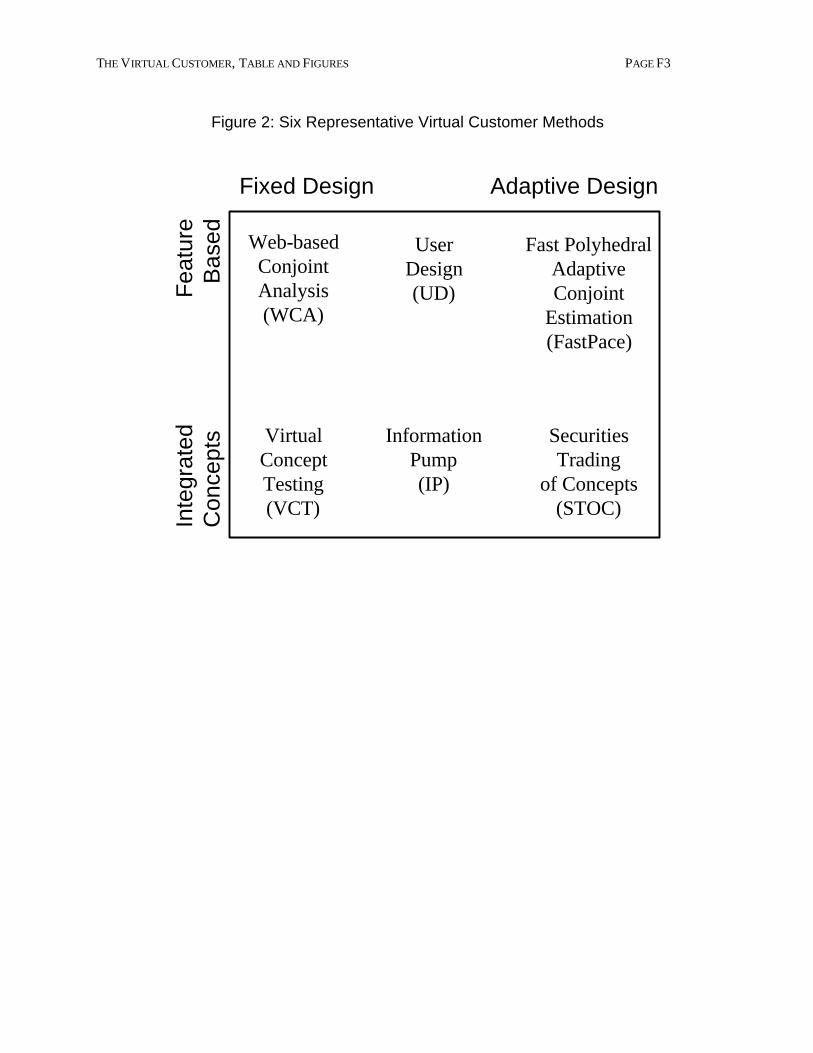
THE VIRTUAL CUSTOMER, TABLE AND FIGURES PAGE F3
Figure 2: Six Representative Virtual Customer Methods
Adaptive DesignFixed DesignF
eatu
reB
ased
Inte
grat
edC
once
pts
Web-basedConjointAnalysis(WCA)
UserDesign(UD)
Fast PolyhedralAdaptiveConjoint
Estimation(FastPace)
VirtualConceptTesting(VCT)
InformationPump(IP)
SecuritiesTrading
of Concepts(STOC)
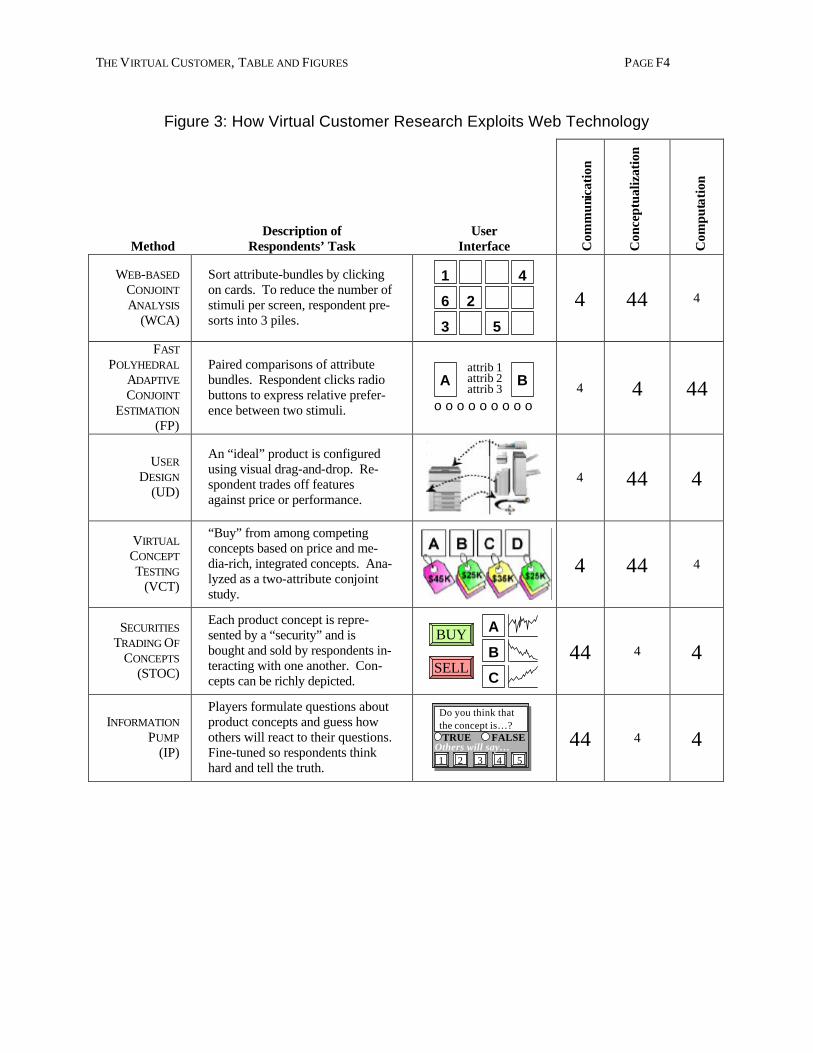
THE VIRTUAL CUSTOMER, TABLE AND FIGURES PAGE F4
Figure 3: How Virtual Customer Research Exploits Web Technology
Method Description of
Respondents’ Task User
Interface Com
mun
icat
ion
Con
cept
ualiz
atio
n
Com
puta
tion
WEB-BASED CONJOINT ANALYSIS
(WCA)
Sort attribute-bundles by clicking on cards. To reduce the number of stimuli per screen, respondent pre-sorts into 3 piles.
1
6 2
3 5
4
4 44 4
FAST
POLYHEDRAL
ADAPTIVE
CONJOINT ESTIMATION
(FP)
Paired comparisons of attribute bundles. Respondent clicks radio buttons to express relative prefer-ence between two stimuli.
A B
o o o o o o o o o
attrib 1 attrib 2 attrib 3
4 4 44
USER DESIGN
(UD)
An “ideal” product is configured using visual drag-and-drop. Re-spondent trades off features against price or performance.
4 44 4
VIRTUAL CONCEPT TESTING
(VCT)
“Buy” from among competing concepts based on price and me-dia-rich, integrated concepts. Ana-lyzed as a two-attribute conjoint study.
4 44 4
SECURITIES TRADING OF
CONCEPTS (STOC)
Each product concept is repre-sented by a “security” and is bought and sold by respondents in-teracting with one another. Con-cepts can be richly depicted.
A
B
C
BUY
SELL
44 4 4
INFORMATION PUMP
(IP)
Players formulate questions about product concepts and guess how others will react to their questions. Fine-tuned so respondents think hard and tell the truth.
Do you think thatthe concept is…?
1 2 3 4 5Others will say…
TRUE FALSE
Do you think thatthe concept is…?
1 2 3 4 5Others will say…
TRUE FALSE
44 4 4
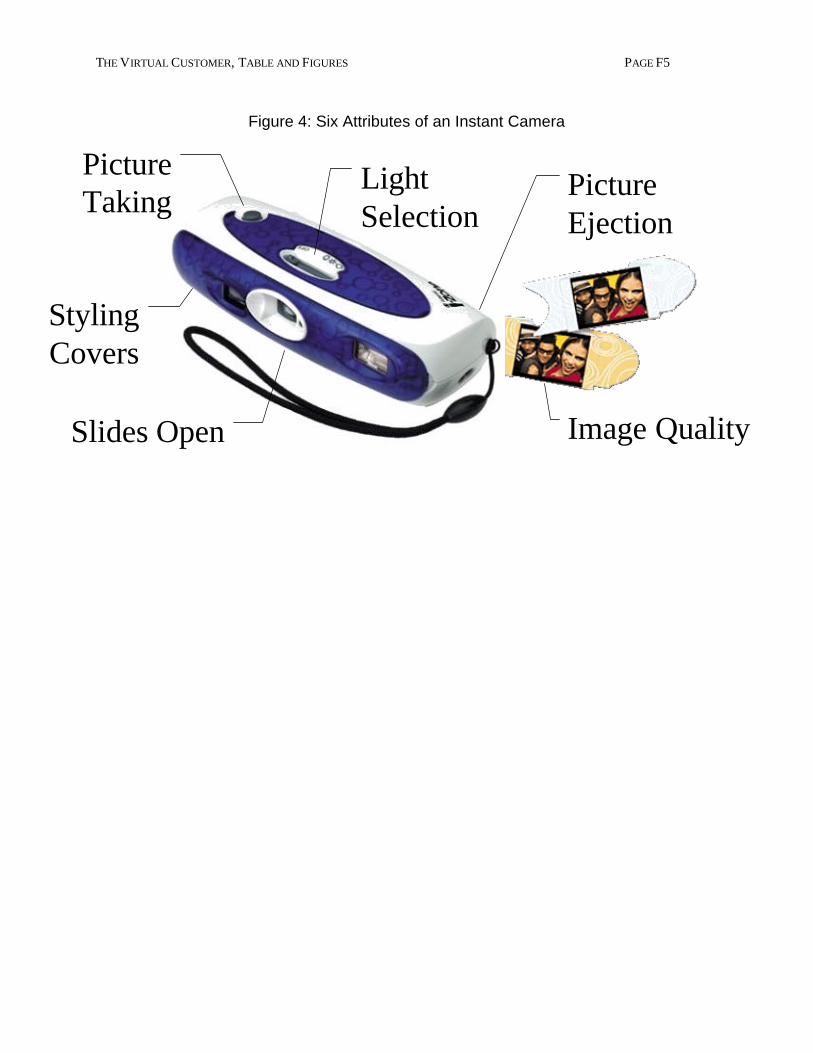
THE VIRTUAL CUSTOMER, TABLE AND FIGURES PAGE F5
Figure 4: Six Attributes of an Instant Camera
LightSelection
PictureEjection
PictureTaking
StylingCovers
Slides Open Image Quality
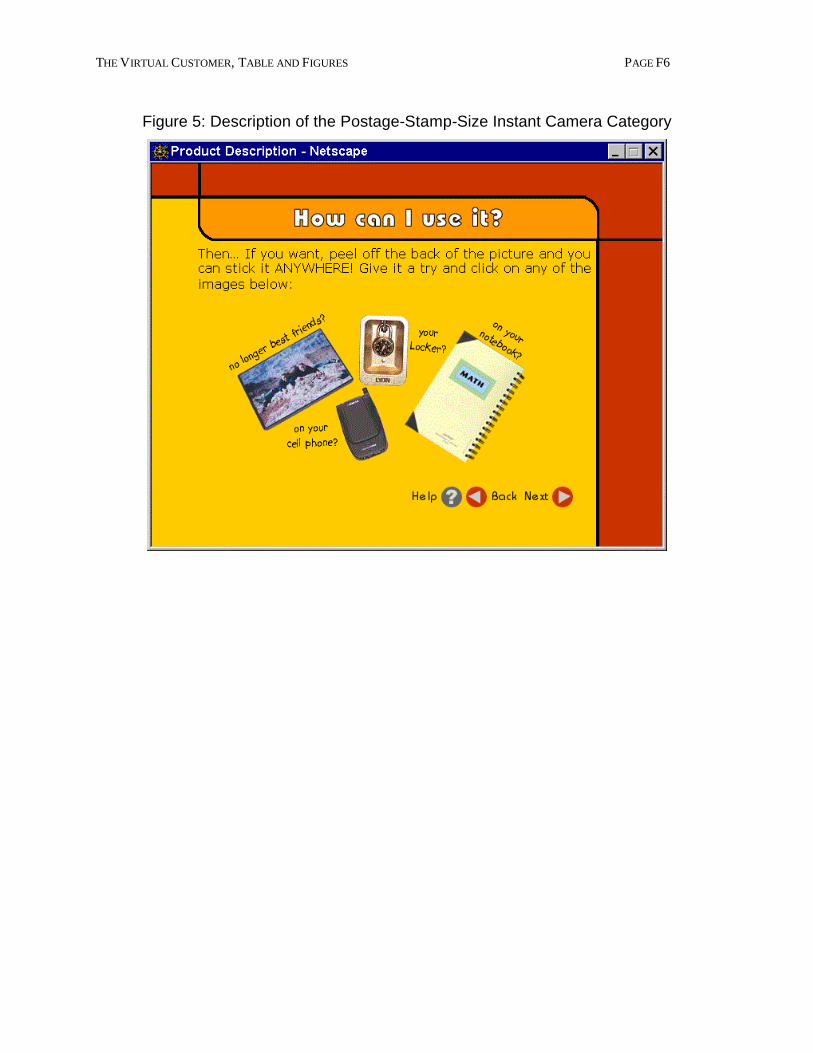
THE VIRTUAL CUSTOMER, TABLE AND FIGURES PAGE F6
Figure 5: Description of the Postage-Stamp-Size Instant Camera Category

THE VIRTUAL CUSTOMER, TABLE AND FIGURES PAGE F7
Figure 6: Paired-comparison Task for an Instant Camera
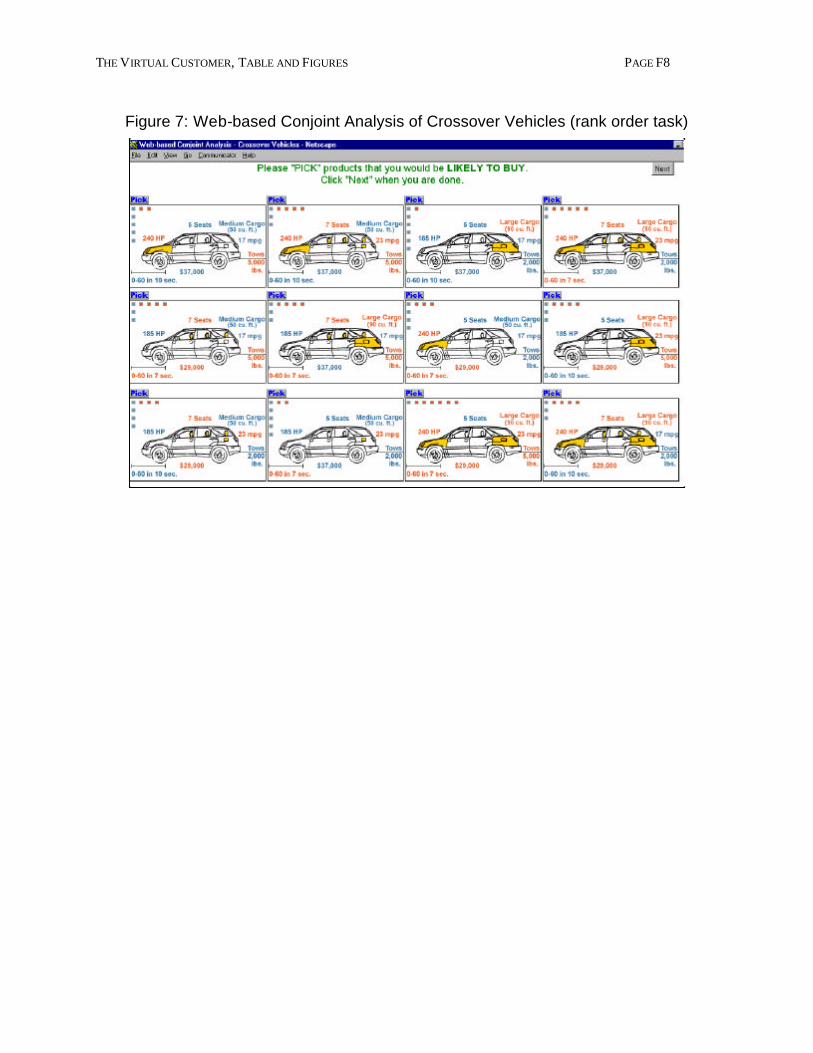
THE VIRTUAL CUSTOMER, TABLE AND FIGURES PAGE F8
Figure 7: Web-based Conjoint Analysis of Crossover Vehicles (rank order task)

THE VIRTUAL CUSTOMER, TABLE AND FIGURES PAGE F9
Figure 8: User Design of an Instant Camera
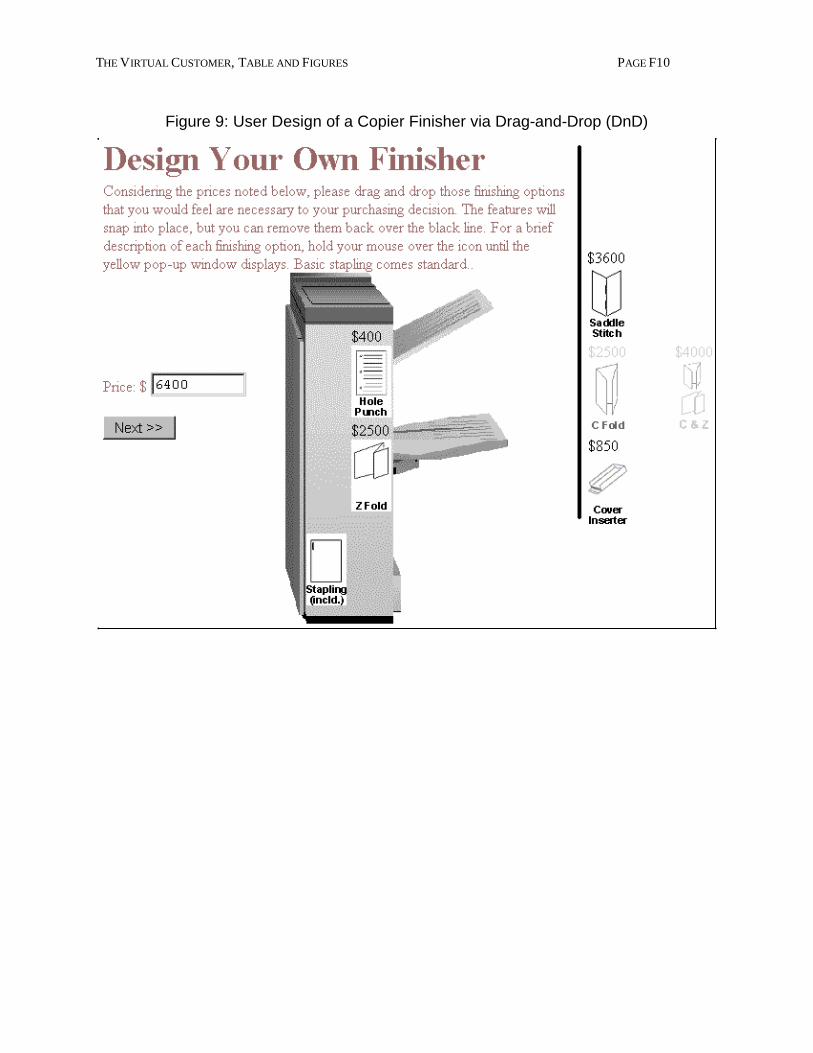
THE VIRTUAL CUSTOMER, TABLE AND FIGURES PAGE F10
Figure 9: User Design of a Copier Finisher via Drag-and-Drop (DnD)
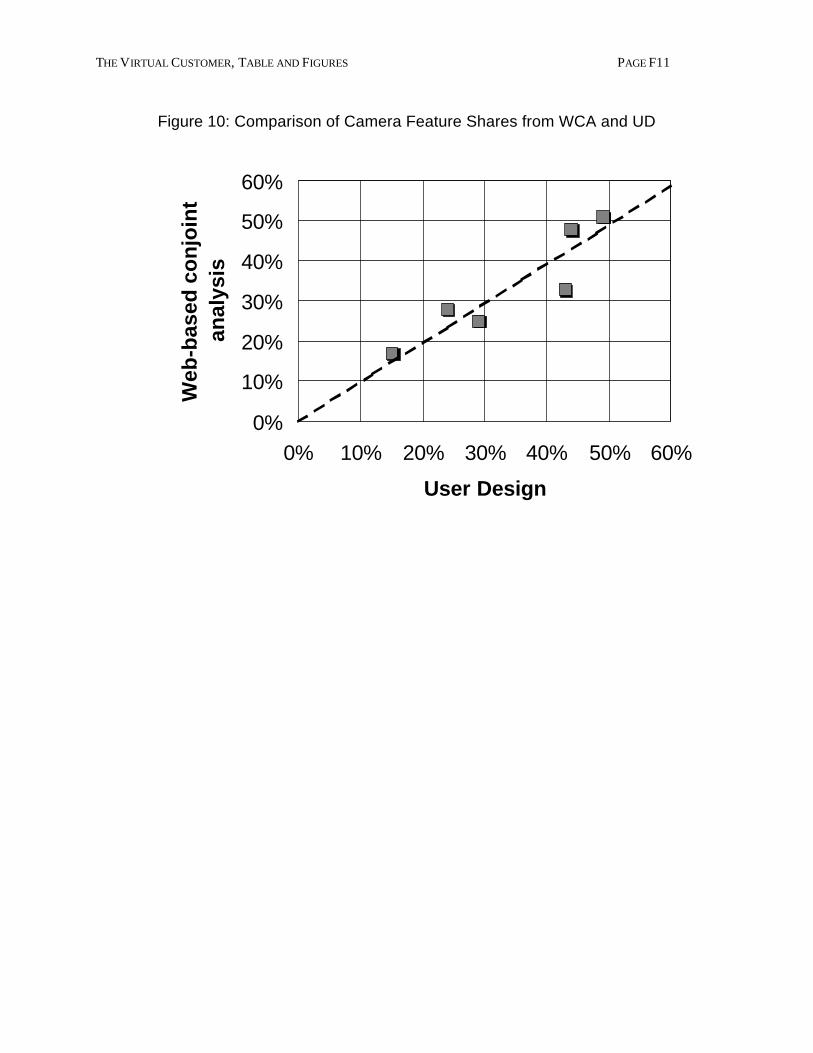
THE VIRTUAL CUSTOMER, TABLE AND FIGURES PAGE F11
Figure 10: Comparison of Camera Feature Shares from WCA and UD
0%
10%
20%
30%
40%
50%
60%
0% 10% 20% 30% 40% 50% 60%
User Design
Web
-bas
ed c
on
join
t an
alys
is
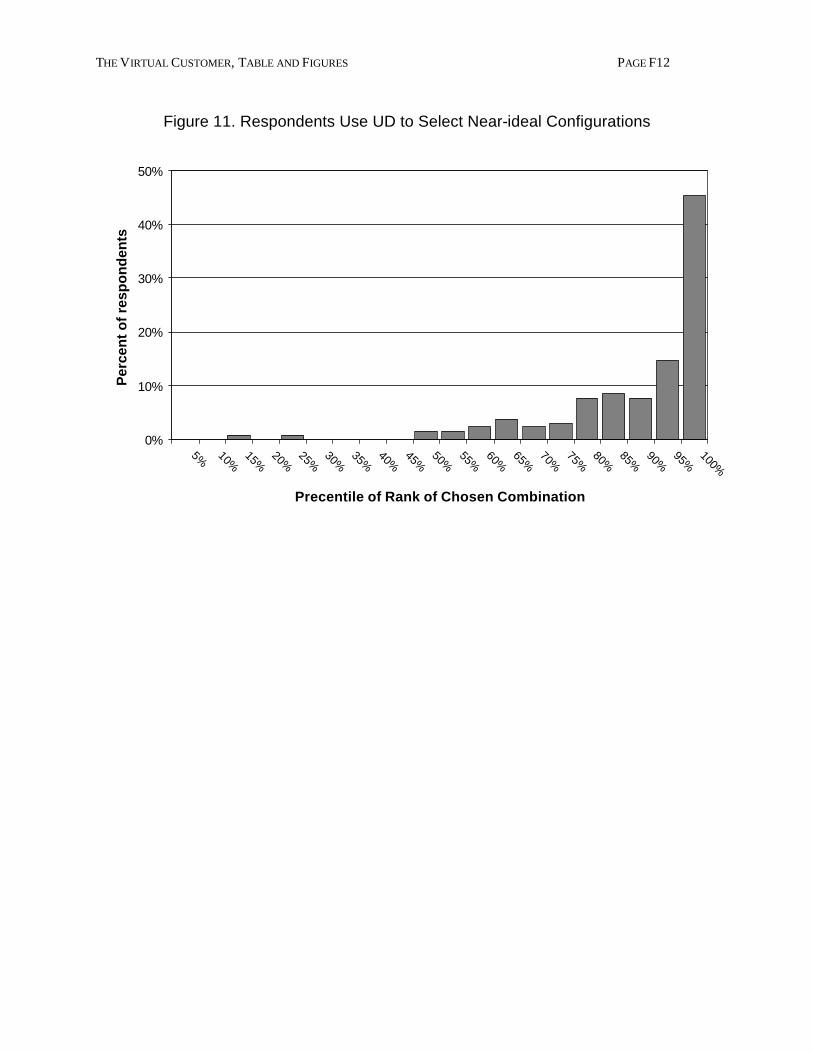
THE VIRTUAL CUSTOMER, TABLE AND FIGURES PAGE F12
Figure 11. Respondents Use UD to Select Near-ideal Configurations
0%
10%
20%
30%
40%
50%
5% 10%15%
20%25%
30%35%
40%45%
50%55%
60%65%
70%75%
80%85%
90%95%
100%
Precentile of Rank of Chosen Combination
Per
cen
t o
f re
spo
nd
ents
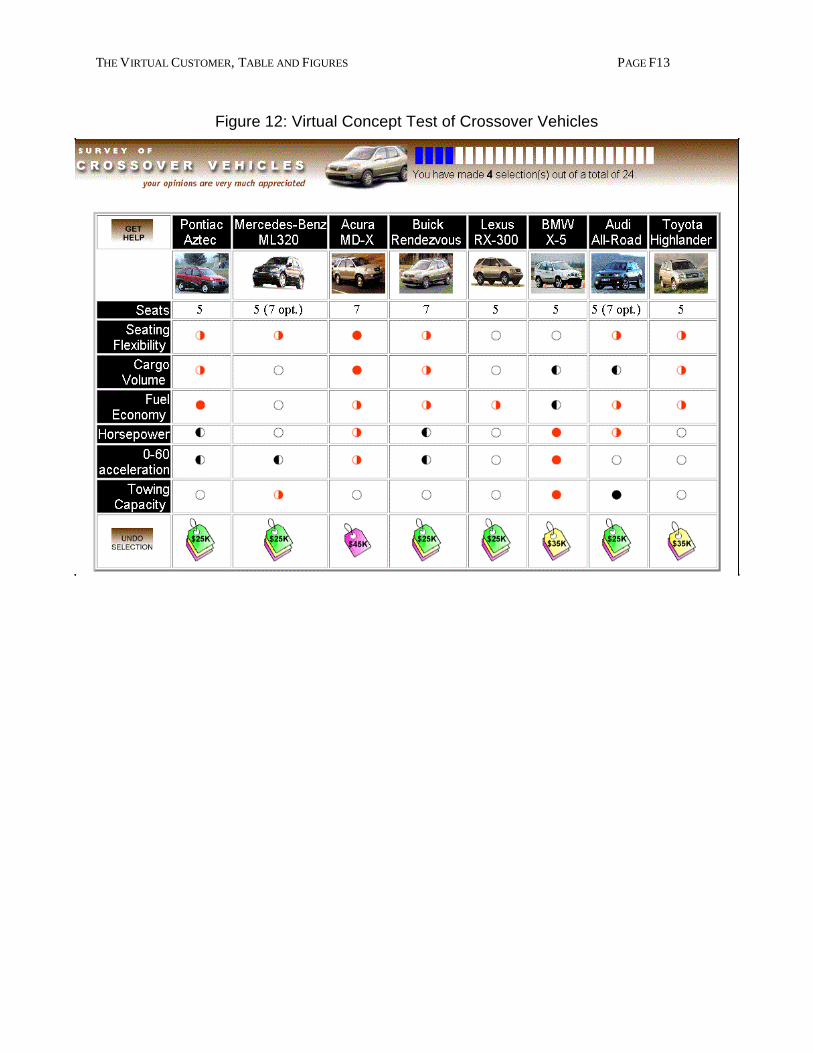
THE VIRTUAL CUSTOMER, TABLE AND FIGURES PAGE F13
Figure 12: Virtual Concept Test of Crossover Vehicles
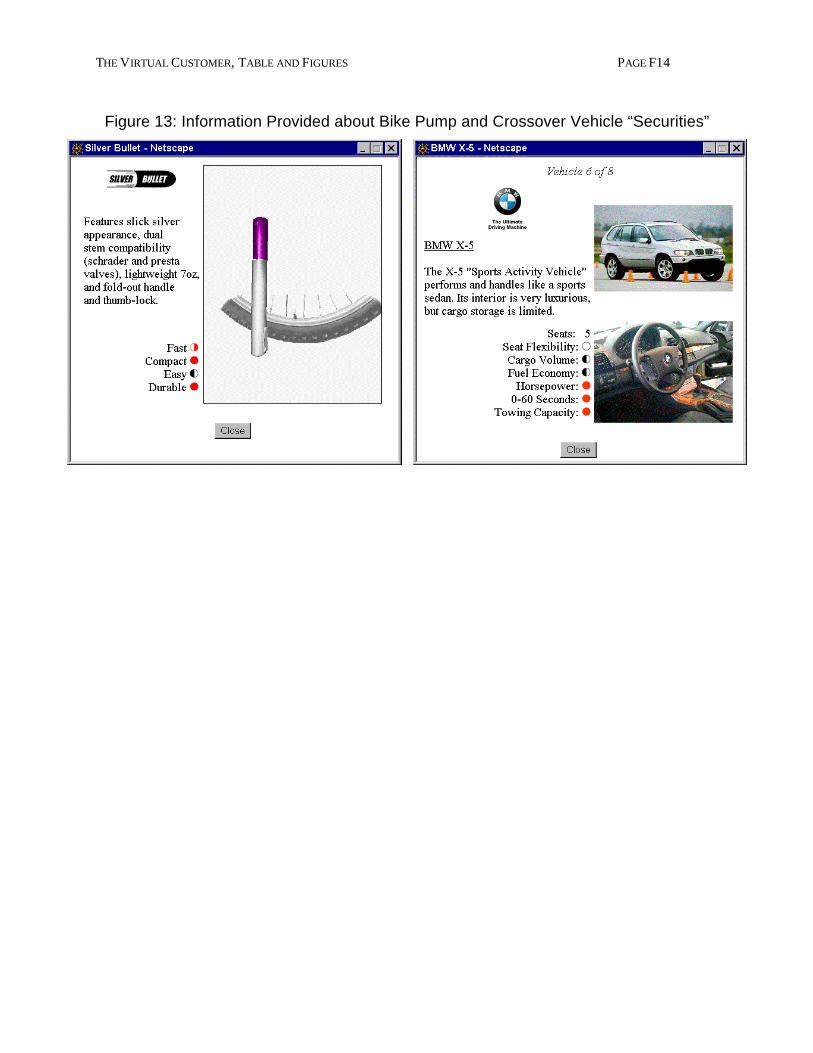
THE VIRTUAL CUSTOMER, TABLE AND FIGURES PAGE F14
Figure 13: Information Provided about Bike Pump and Crossover Vehicle “Securities”
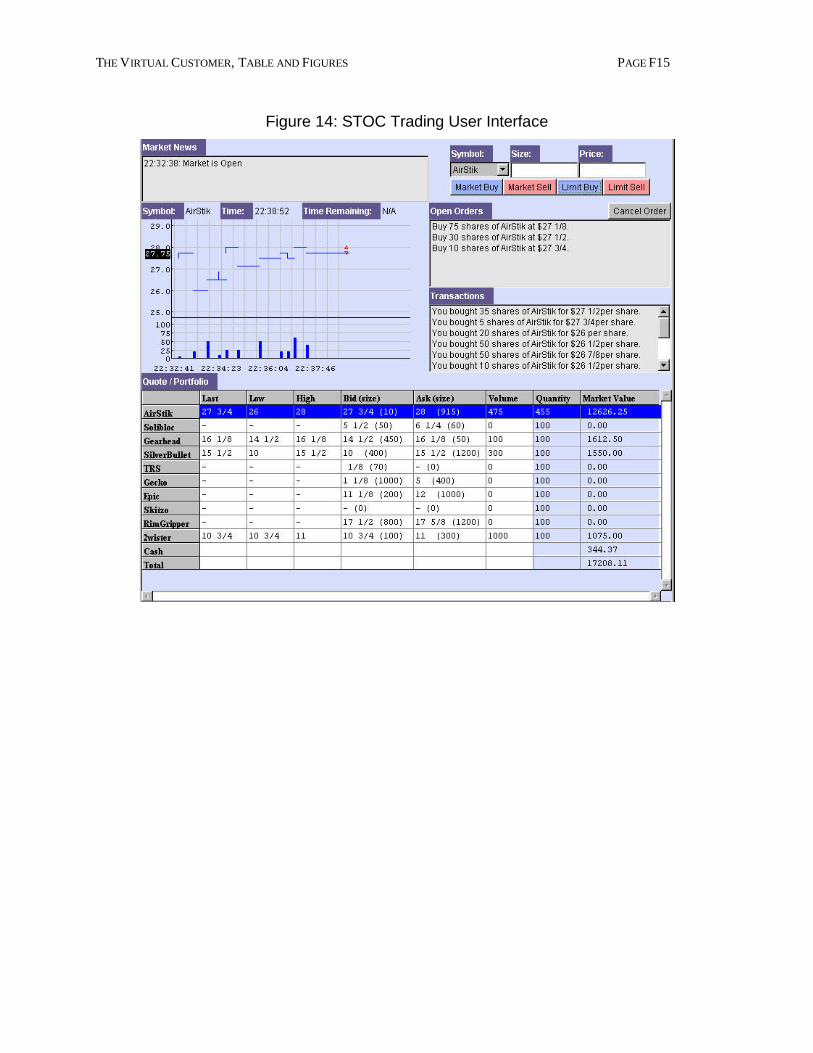
THE VIRTUAL CUSTOMER, TABLE AND FIGURES PAGE F15
Figure 14: STOC Trading User Interface
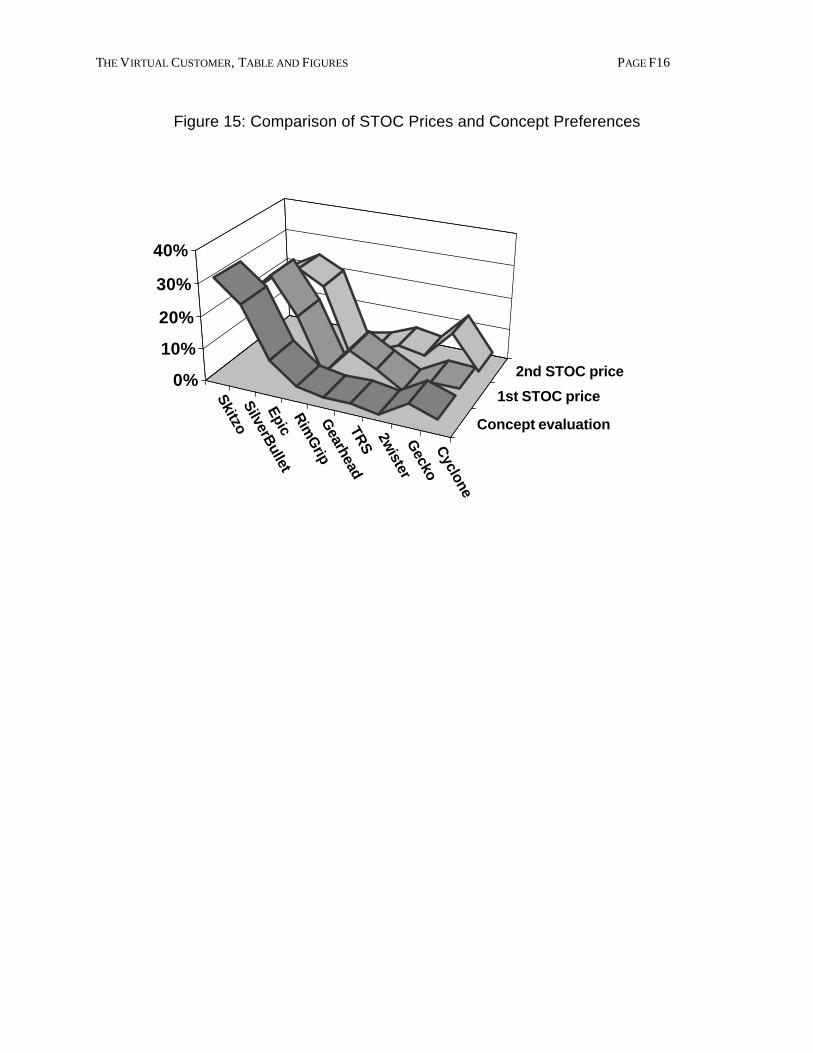
THE VIRTUAL CUSTOMER, TABLE AND FIGURES PAGE F16
Figure 15: Comparison of STOC Prices and Concept Preferences
Skitzo SilverB
ulletEpic R
imG
ripG
earheadTR
S 2w
isterG
ecko C
yclone
Concept evaluation
1st STOC price
2nd STOC price0%
10%
20%
30%
40%
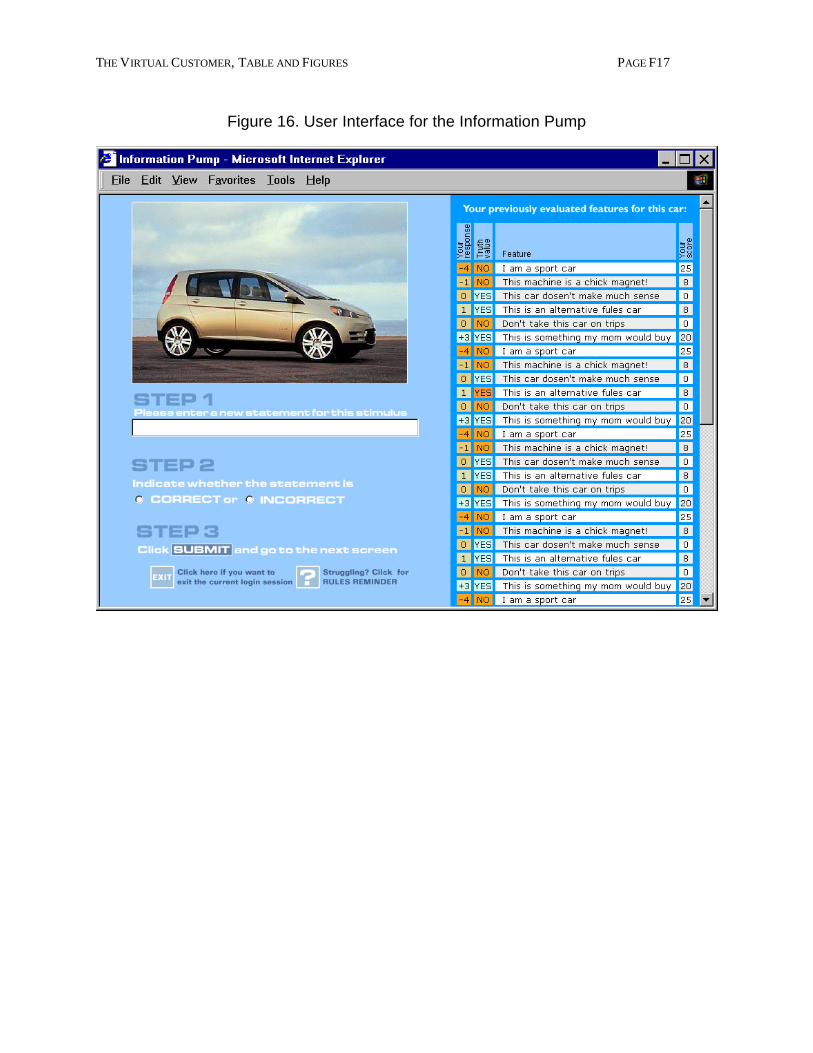
THE VIRTUAL CUSTOMER, TABLE AND FIGURES PAGE F17
Figure 16. User Interface for the Information Pump
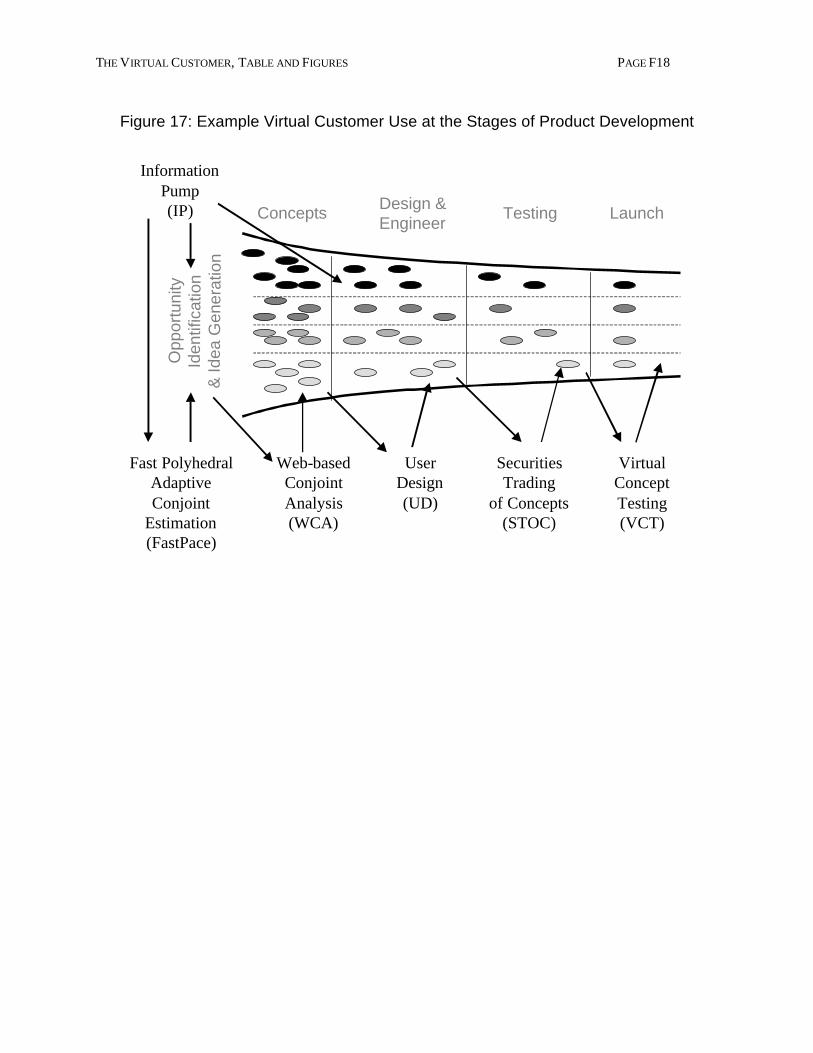
THE VIRTUAL CUSTOMER, TABLE AND FIGURES PAGE F18
Figure 17: Example Virtual Customer Use at the Stages of Product Development
Opp
ortu
nity
Iden
tific
atio
n&
Idea
Gen
erat
ion
Concepts Design &Engineer
Testing Launch
Web-basedConjointAnalysis(WCA)
UserDesign(UD)
Fast PolyhedralAdaptiveConjoint
Estimation(FastPace)
VirtualConceptTesting(VCT)
SecuritiesTrading
of Concepts(STOC)
InformationPump(IP)
THE VIRTUAL CUSTOMER, ENDNOTES PAGE E1
Endnotes
1 Because of legal and moral requirements, we obtained parental permission for all interviews.
2 In 1999 some respondents were lost because they did not have Java script capability as required
by the camera website. Under today’s conditions, where Java capability is almost universal, this
response rate would have been 41-42%. 3 Selecting the center of the set is not unlike using equally weighted importances as a null hy-
pothesis. This is not an unreasonable null hypothesis given the proven robustness of the linear
model [21, 22, 34, 38, 54]. 4 For a demonstration with a 10-parameter problem and for software to implement the algorithm
see the virtual customer website. 5 Metric conjoint analysis (regression) cannot obtain estimates with fixed designs of eight ques-
tions because there are more parameters than there are degrees of freedom. For this product
category, features were easily separable and, hence, self-stated importances did well. Thus, the
FP and ACA algorithms that placed more emphasis on self-stated importances were able to im-
prove predictions. However, simulations suggest that this may not apply to all product catego-
ries. 6 The correlation is based on the six features; the underlying data is based on 75 respondents. 7 Chan, Dahan, Lo, and Poggio [9] speculate that STOC requires at least fifteen respondents for
the market to work well. However, STOC has been run with almost fifty respondents simultane-
ously. In theory, the software could handle thousands of respondents simultaneously.
8 For ease of reference, the STOC prices in Figure 15 are scaled to preferences via regression
(adjusted R2 of 0.71 and 0.64, respectively). This scaling does not affect the observed correla-
tions. The concept evaluation comes from Dahan and Srinivasan’s VCT [19].