The vertical separation of mainshock rupture and ...johne/publications/pdfs/nissen-etal...The...
14
The vertical separation of mainshock rupture and microseismicity at Qeshm island in the Zagros fold-and-thrust belt, Iran E. Nissen a, ⁎, F. Yamini-Fard b , M. Tatar b , A. Gholamzadeh b,1 , E. Bergman c , J.R. Elliott d , J.A. Jackson a , B. Parsons d a COMET, Bullard Laboratories, Department of Earth Sciences, University of Cambridge, Madingley Road, Cambridge CB3 0EZ, UK b International Institute of Earthquake Engineering and Seismology, PO Box 19395-3913, Tehran, Iran c Department of Physics, University of Colorado, Boulder, CO 80309-0390, USA d COMET, Department of Earth Sciences, University of Oxford, Parks Road, Oxford OX1 3PR, UK abstract article info Article history: Received 11 January 2010 Received in revised form 24 March 2010 Accepted 24 April 2010 Available online 9 June 2010 Editor: T.M. Harrison Keywords: Zagros InSAR earthquakes source parameters folding We investigate the depth and geometry of faulting within a cluster of buried, reverse faulting earthquakes that struck Qeshm island, in the Zagros fold-and-thrust belt, over a four year period between November 2005 and July 2009. Of particular interest is our observation that there was a vertical separation between the largest two earthquakes (M w 5.8 and 5.9), which ruptured the lower parts of a ∼ 10-km thick sedimentary cover, and microseismicity recorded by a local network after the first, M w 5.8 event, which was concentrated within the underlying basement at depths of 10–20 km. Although measured in different ways — the largest three earthquakes using radar interferometry, moderate-sized events with teleseismically-recorded, long- period waveforms, and the microseismicity using data from a local seismic network — we used consistent velocity and elastic parameters in all our modelling, and the observed vertical separation is robust and resolvable. We suggest that it reflects the influence of the Proterozoic Hormuz salt, a weak layer at the base of the sedimentary cover across which rupture failed to propagate. Because the full thickness of the seismogenic layer failed to rupture during the largest earthquakes in the sequence, the lower, unruptured part may constitute a continued seismic hazard to the region. Considering the rarity of earthquakes larger than M w 6.2 in the Zagros Simply Folded Belt, we suggest that the Hormuz salt forms an important, regional barrier to rupture, not just a local one. Finally, we note that buried faulting involved in the largest earthquakes is almost perpendicular to the trend of an anticline exposed at the surface immediately above them. This suggests that locally, faulting and folding are decoupled, probably along a weak layer of marls or evaporites in the middle part of the sedimentary cover. Crown Copyright © 2010 Published by Elsevier B.V. All rights reserved. 1. Introduction The Zagros mountains in south-western Iran are one of the most rapidly-deforming and seismically-active fold-and-thrust belts in the world, accommodating almost half of the present-day shortening between Arabia and Eurasia (Fig. 1). Because direct observations of earthquake faulting are possible here, and can be made relatively frequently, the Zagros potentially provides a superb present-day analogue for fold-and-thrust belts elsewhere on the continents, including those which are no longer active. However, earthquakes in the Zagros only very rarely rupture the surface and so far, most observations of faulting in moderate-sized earthquakes have been inferred from seismology (e.g. Adams et al., 2009; Talebian and Jackson, 2004). Errors in the best teleseismically-recorded epicenters and waveform-constrained depths — 10–15 km and ∼4 km, respectively (Engdahl et al., 2006) — are such that the precise location and geometry of earthquake faulting, and thus its relationship to the geological structure, have proven difficult to ascertain. One important issue which remains unresolved, and which is the focus of this study, concerns the relative behaviour and seismogenic potential of the crystalline basement and the overlying sedimentary cover. The cover is up to 10–15-km thick and encompasses a mixture of strong units (mainly platform carbonates) and weaker evaporites, marls and shales. Although the occurrence of small and moderate magnitude earthquakes (M w 4.5–5.5) at these shallow depths is well resolved (Adams et al., 2009; Lohman and Simons, 2005; Roustaei et al., 2010; Talebian and Jackson, 2004), it is not clear whether the cover is strong enough to generate larger events (M w ∼6), or whether these are restricted to the basement. There has also been much debate about the Earth and Planetary Science Letters 296 (2010) 181–194 ⁎ Corresponding author. E-mail address: [email protected] (E. Nissen). 1 Present address: University of Hormozgan, Bandar Abbas, Iran. 0012-821X/$ – see front matter. Crown Copyright © 2010 Published by Elsevier B.V. All rights reserved. doi:10.1016/j.epsl.2010.04.049 Contents lists available at ScienceDirect Earth and Planetary Science Letters journal homepage: www.elsevier.com/locate/epsl
Transcript of The vertical separation of mainshock rupture and ...johne/publications/pdfs/nissen-etal...The...
Earth and Planetary Science Letters 296 (2010) 181–194
Contents lists available at ScienceDirect
Earth and Planetary Science Letters
j ourna l homepage: www.e lsev ie r.com/ locate /eps l
The vertical separation of mainshock rupture and microseismicity at Qeshm island inthe Zagros fold-and-thrust belt, Iran
E. Nissen a,⁎, F. Yamini-Fard b, M. Tatar b, A. Gholamzadeh b,1, E. Bergman c, J.R. Elliott d,J.A. Jackson a, B. Parsons d
a COMET, Bullard Laboratories, Department of Earth Sciences, University of Cambridge, Madingley Road, Cambridge CB3 0EZ, UKb International Institute of Earthquake Engineering and Seismology, PO Box 19395-3913, Tehran, Iranc Department of Physics, University of Colorado, Boulder, CO 80309-0390, USAd COMET, Department of Earth Sciences, University of Oxford, Parks Road, Oxford OX1 3PR, UK
⁎ Corresponding author.E-mail address: [email protected] (E. Nissen).
1 Present address: University of Hormozgan, Bandar A
0012-821X/$ – see front matter. Crown Copyright © 20doi:10.1016/j.epsl.2010.04.049
a b s t r a c t
a r t i c l e i n f oArticle history:Received 11 January 2010Received in revised form 24 March 2010Accepted 24 April 2010Available online 9 June 2010
Editor: T.M. Harrison
Keywords:ZagrosInSARearthquakessource parametersfolding
We investigate the depth and geometry of faulting within a cluster of buried, reverse faulting earthquakesthat struck Qeshm island, in the Zagros fold-and-thrust belt, over a four year period between November 2005and July 2009. Of particular interest is our observation that there was a vertical separation between thelargest two earthquakes (Mw 5.8 and 5.9), which ruptured the lower parts of a ∼10-km thick sedimentarycover, and microseismicity recorded by a local network after the first, Mw 5.8 event, which was concentratedwithin the underlying basement at depths of 10–20 km. Although measured in different ways — the largestthree earthquakes using radar interferometry, moderate-sized events with teleseismically-recorded, long-period waveforms, and the microseismicity using data from a local seismic network — we used consistentvelocity and elastic parameters in all our modelling, and the observed vertical separation is robust andresolvable. We suggest that it reflects the influence of the Proterozoic Hormuz salt, a weak layer at the baseof the sedimentary cover across which rupture failed to propagate. Because the full thickness of theseismogenic layer failed to rupture during the largest earthquakes in the sequence, the lower, unrupturedpart may constitute a continued seismic hazard to the region. Considering the rarity of earthquakes largerthan Mw 6.2 in the Zagros Simply Folded Belt, we suggest that the Hormuz salt forms an important, regionalbarrier to rupture, not just a local one. Finally, we note that buried faulting involved in the largestearthquakes is almost perpendicular to the trend of an anticline exposed at the surface immediately abovethem. This suggests that locally, faulting and folding are decoupled, probably along a weak layer of marls orevaporites in the middle part of the sedimentary cover.
Crown Copyright © 2010 Published by Elsevier B.V. All rights reserved.
1. Introduction
The Zagros mountains in south-western Iran are one of the mostrapidly-deforming and seismically-active fold-and-thrust belts in theworld, accommodating almost half of the present-day shorteningbetween Arabia and Eurasia (Fig. 1). Because direct observations ofearthquake faulting are possible here, and can be made relativelyfrequently, the Zagros potentially provides a superb present-dayanalogue for fold-and-thrust belts elsewhere on the continents,including those which are no longer active. However, earthquakes inthe Zagros only very rarely rupture the surface and so far, mostobservations of faulting in moderate-sized earthquakes have been
bbas, Iran.
10 Published by Elsevier B.V. All ri
inferred from seismology (e.g. Adams et al., 2009; Talebian and Jackson,2004). Errors in the best teleseismically-recorded epicenters andwaveform-constrained depths — 10–15 km and ∼4 km, respectively(Engdahl et al., 2006)— are such that the precise location and geometryof earthquake faulting, and thus its relationship to the geologicalstructure, have proven difficult to ascertain.
One important issue which remains unresolved, and which is thefocus of this study, concerns the relative behaviour and seismogenicpotential of the crystalline basement and the overlying sedimentarycover. The cover is up to 10–15-km thick and encompasses amixture ofstrongunits (mainly platformcarbonates) andweaker evaporites,marlsand shales. Although the occurrence of small and moderate magnitudeearthquakes (Mw 4.5–5.5) at these shallow depths is well resolved(Adams et al., 2009; Lohman and Simons, 2005; Roustaei et al., 2010;Talebian and Jackson, 2004), it is not clear whether the cover is strongenough to generate larger events (Mw ∼6), or whether these arerestricted to the basement. There has also been much debate about the
ghts reserved.
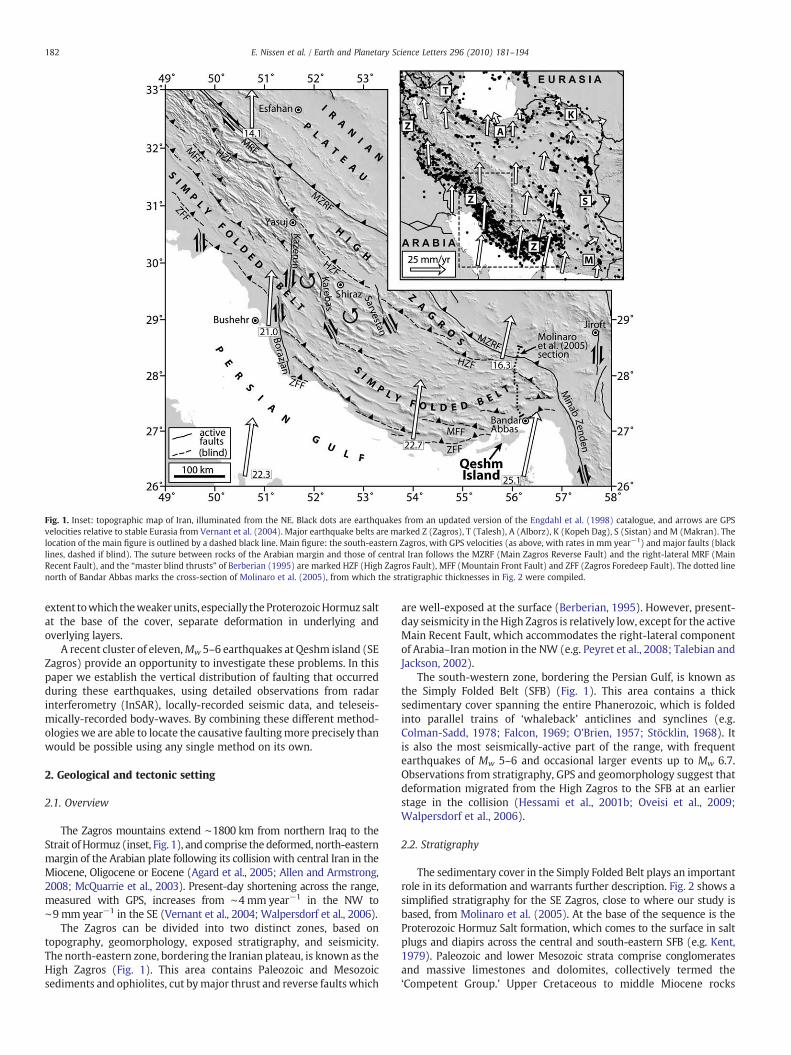
Fig. 1. Inset: topographic map of Iran, illuminated from the NE. Black dots are earthquakes from an updated version of the Engdahl et al. (1998) catalogue, and arrows are GPSvelocities relative to stable Eurasia from Vernant et al. (2004). Major earthquake belts are marked Z (Zagros), T (Talesh), A (Alborz), K (Kopeh Dag), S (Sistan) and M (Makran). Thelocation of the main figure is outlined by a dashed black line. Main figure: the south-eastern Zagros, with GPS velocities (as above, with rates in mm year−1) and major faults (blacklines, dashed if blind). The suture between rocks of the Arabian margin and those of central Iran follows the MZRF (Main Zagros Reverse Fault) and the right-lateral MRF (MainRecent Fault), and the “master blind thrusts” of Berberian (1995) are marked HZF (High Zagros Fault), MFF (Mountain Front Fault) and ZFF (Zagros Foredeep Fault). The dotted linenorth of Bandar Abbas marks the cross-section of Molinaro et al. (2005), from which the stratigraphic thicknesses in Fig. 2 were compiled.
182 E. Nissen et al. / Earth and Planetary Science Letters 296 (2010) 181–194
extent towhich theweakerunits, especially the ProterozoicHormuz saltat the base of the cover, separate deformation in underlying andoverlying layers.
A recent cluster of eleven,Mw 5–6 earthquakes at Qeshm island (SEZagros) provide an opportunity to investigate these problems. In thispaper we establish the vertical distribution of faulting that occurredduring these earthquakes, using detailed observations from radarinterferometry (InSAR), locally-recorded seismic data, and teleseis-mically-recorded body-waves. By combining these different method-ologies we are able to locate the causative faultingmore precisely thanwould be possible using any single method on its own.
2. Geological and tectonic setting
2.1. Overview
The Zagros mountains extend ∼1800 km from northern Iraq to theStrait of Hormuz (inset, Fig. 1), and comprise the deformed, north-easternmargin of the Arabian plate following its collision with central Iran in theMiocene, Oligocene or Eocene (Agard et al., 2005; Allen and Armstrong,2008; McQuarrie et al., 2003). Present-day shortening across the range,measured with GPS, increases from ∼4 mm year−1 in the NW to∼9 mm year−1 in the SE (Vernant et al., 2004; Walpersdorf et al., 2006).
The Zagros can be divided into two distinct zones, based ontopography, geomorphology, exposed stratigraphy, and seismicity.The north-eastern zone, bordering the Iranian plateau, is known as theHigh Zagros (Fig. 1). This area contains Paleozoic and Mesozoicsediments and ophiolites, cut bymajor thrust and reverse faults which
are well-exposed at the surface (Berberian, 1995). However, present-day seismicity in the High Zagros is relatively low, except for the activeMain Recent Fault, which accommodates the right-lateral componentof Arabia–Iran motion in the NW (e.g. Peyret et al., 2008; Talebian andJackson, 2002).
The south-western zone, bordering the Persian Gulf, is known asthe Simply Folded Belt (SFB) (Fig. 1). This area contains a thicksedimentary cover spanning the entire Phanerozoic, which is foldedinto parallel trains of ‘whaleback’ anticlines and synclines (e.g.Colman-Sadd, 1978; Falcon, 1969; O'Brien, 1957; Stöcklin, 1968). Itis also the most seismically-active part of the range, with frequentearthquakes of Mw 5–6 and occasional larger events up to Mw 6.7.Observations from stratigraphy, GPS and geomorphology suggest thatdeformation migrated from the High Zagros to the SFB at an earlierstage in the collision (Hessami et al., 2001b; Oveisi et al., 2009;Walpersdorf et al., 2006).
2.2. Stratigraphy
The sedimentary cover in the Simply Folded Belt plays an importantrole in its deformation and warrants further description. Fig. 2 shows asimplified stratigraphy for the SE Zagros, close to where our study isbased, from Molinaro et al. (2005). At the base of the sequence is theProterozoic Hormuz Salt formation, which comes to the surface in saltplugs and diapirs across the central and south-eastern SFB (e.g. Kent,1979). Paleozoic and lower Mesozoic strata comprise conglomeratesand massive limestones and dolomites, collectively termed the‘Competent Group.’ Upper Cretaceous to middle Miocene rocks
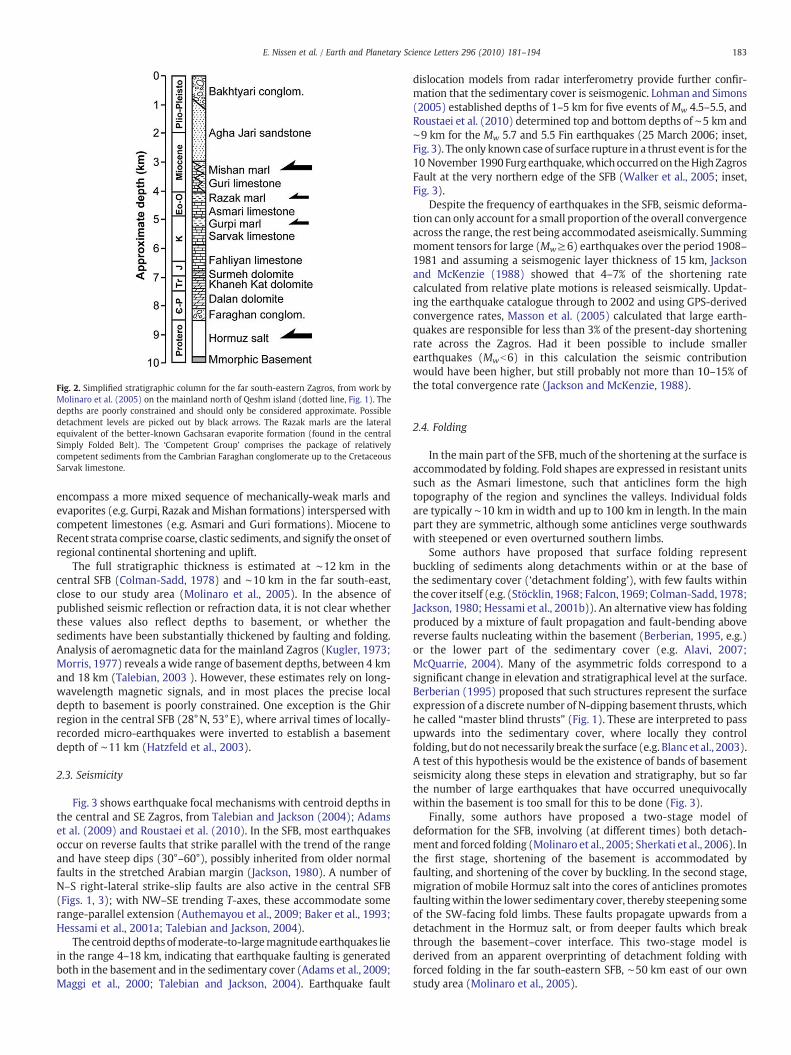
Fig. 2. Simplified stratigraphic column for the far south-eastern Zagros, from work byMolinaro et al. (2005) on the mainland north of Qeshm island (dotted line, Fig. 1). Thedepths are poorly constrained and should only be considered approximate. Possibledetachment levels are picked out by black arrows. The Razak marls are the lateralequivalent of the better-known Gachsaran evaporite formation (found in the centralSimply Folded Belt). The ‘Competent Group’ comprises the package of relativelycompetent sediments from the Cambrian Faraghan conglomerate up to the CretaceousSarvak limestone.
183E. Nissen et al. / Earth and Planetary Science Letters 296 (2010) 181–194
encompass a more mixed sequence of mechanically-weak marls andevaporites (e.g. Gurpi, Razak andMishan formations) interspersedwithcompetent limestones (e.g. Asmari and Guri formations). Miocene toRecent strata comprise coarse, clastic sediments, and signify the onset ofregional continental shortening and uplift.
The full stratigraphic thickness is estimated at ∼12 km in thecentral SFB (Colman-Sadd, 1978) and ∼10 km in the far south-east,close to our study area (Molinaro et al., 2005). In the absence ofpublished seismic reflection or refraction data, it is not clear whetherthese values also reflect depths to basement, or whether thesediments have been substantially thickened by faulting and folding.Analysis of aeromagnetic data for the mainland Zagros (Kugler, 1973;Morris, 1977) reveals a wide range of basement depths, between 4 kmand 18 km (Talebian, 2003 ). However, these estimates rely on long-wavelength magnetic signals, and in most places the precise localdepth to basement is poorly constrained. One exception is the Ghirregion in the central SFB (28°N, 53°E), where arrival times of locally-recorded micro-earthquakes were inverted to establish a basementdepth of ∼11 km (Hatzfeld et al., 2003).
2.3. Seismicity
Fig. 3 shows earthquake focal mechanisms with centroid depths inthe central and SE Zagros, from Talebian and Jackson (2004); Adamset al. (2009) and Roustaei et al. (2010). In the SFB, most earthquakesoccur on reverse faults that strike parallel with the trend of the rangeand have steep dips (30°–60°), possibly inherited from older normalfaults in the stretched Arabian margin (Jackson, 1980). A number ofN–S right-lateral strike-slip faults are also active in the central SFB(Figs. 1, 3); with NW–SE trending T-axes, these accommodate somerange-parallel extension (Authemayou et al., 2009; Baker et al., 1993;Hessami et al., 2001a; Talebian and Jackson, 2004).
The centroiddepthsofmoderate-to-largemagnitudeearthquakes liein the range 4–18 km, indicating that earthquake faulting is generatedboth in the basement and in the sedimentary cover (Adams et al., 2009;Maggi et al., 2000; Talebian and Jackson, 2004). Earthquake fault
dislocation models from radar interferometry provide further confir-mation that the sedimentary cover is seismogenic. Lohman and Simons(2005) established depths of 1–5 km for five events ofMw 4.5–5.5, andRoustaei et al. (2010) determined top and bottom depths of ∼5 km and∼9 km for the Mw 5.7 and 5.5 Fin earthquakes (25 March 2006; inset,Fig. 3). The only known case of surface rupture in a thrust event is for the10 November 1990 Furg earthquake,whichoccurredon theHighZagrosFault at the very northern edge of the SFB (Walker et al., 2005; inset,Fig. 3).
Despite the frequency of earthquakes in the SFB, seismic deforma-tion can only account for a small proportion of the overall convergenceacross the range, the rest being accommodated aseismically. Summingmoment tensors for large (Mw≥6) earthquakes over the period 1908–1981 and assuming a seismogenic layer thickness of 15 km, Jacksonand McKenzie (1988) showed that 4–7% of the shortening ratecalculated from relative plate motions is released seismically. Updat-ing the earthquake catalogue through to 2002 and using GPS-derivedconvergence rates, Masson et al. (2005) calculated that large earth-quakes are responsible for less than 3% of the present-day shorteningrate across the Zagros. Had it been possible to include smallerearthquakes (Mwb6) in this calculation the seismic contributionwould have been higher, but still probably not more than 10–15% ofthe total convergence rate (Jackson and McKenzie, 1988).
2.4. Folding
In themain part of the SFB, much of the shortening at the surface isaccommodated by folding. Fold shapes are expressed in resistant unitssuch as the Asmari limestone, such that anticlines form the hightopography of the region and synclines the valleys. Individual foldsare typically ∼10 km in width and up to 100 km in length. In the mainpart they are symmetric, although some anticlines verge southwardswith steepened or even overturned southern limbs.
Some authors have proposed that surface folding representbuckling of sediments along detachments within or at the base ofthe sedimentary cover (‘detachment folding’), with few faults withinthe cover itself (e.g. (Stöcklin, 1968; Falcon, 1969; Colman-Sadd, 1978;Jackson, 1980; Hessami et al., 2001b)). An alternative view has foldingproduced by a mixture of fault propagation and fault-bending abovereverse faults nucleating within the basement (Berberian, 1995, e.g.)or the lower part of the sedimentary cover (e.g. Alavi, 2007;McQuarrie, 2004). Many of the asymmetric folds correspond to asignificant change in elevation and stratigraphical level at the surface.Berberian (1995) proposed that such structures represent the surfaceexpression of a discrete number of N-dipping basement thrusts, whichhe called “master blind thrusts” (Fig. 1). These are interpreted to passupwards into the sedimentary cover, where locally they controlfolding, but donot necessarily break the surface (e.g. Blanc et al., 2003).A test of this hypothesis would be the existence of bands of basementseismicity along these steps in elevation and stratigraphy, but so farthe number of large earthquakes that have occurred unequivocallywithin the basement is too small for this to be done (Fig. 3).
Finally, some authors have proposed a two-stage model ofdeformation for the SFB, involving (at different times) both detach-ment and forced folding (Molinaro et al., 2005; Sherkati et al., 2006). Inthe first stage, shortening of the basement is accommodated byfaulting, and shortening of the cover by buckling. In the second stage,migration of mobile Hormuz salt into the cores of anticlines promotesfaultingwithin the lower sedimentary cover, thereby steepening someof the SW-facing fold limbs. These faults propagate upwards from adetachment in the Hormuz salt, or from deeper faults which breakthrough the basement–cover interface. This two-stage model isderived from an apparent overprinting of detachment folding withforced folding in the far south-eastern SFB, ∼50 km east of our ownstudy area (Molinaro et al., 2005).
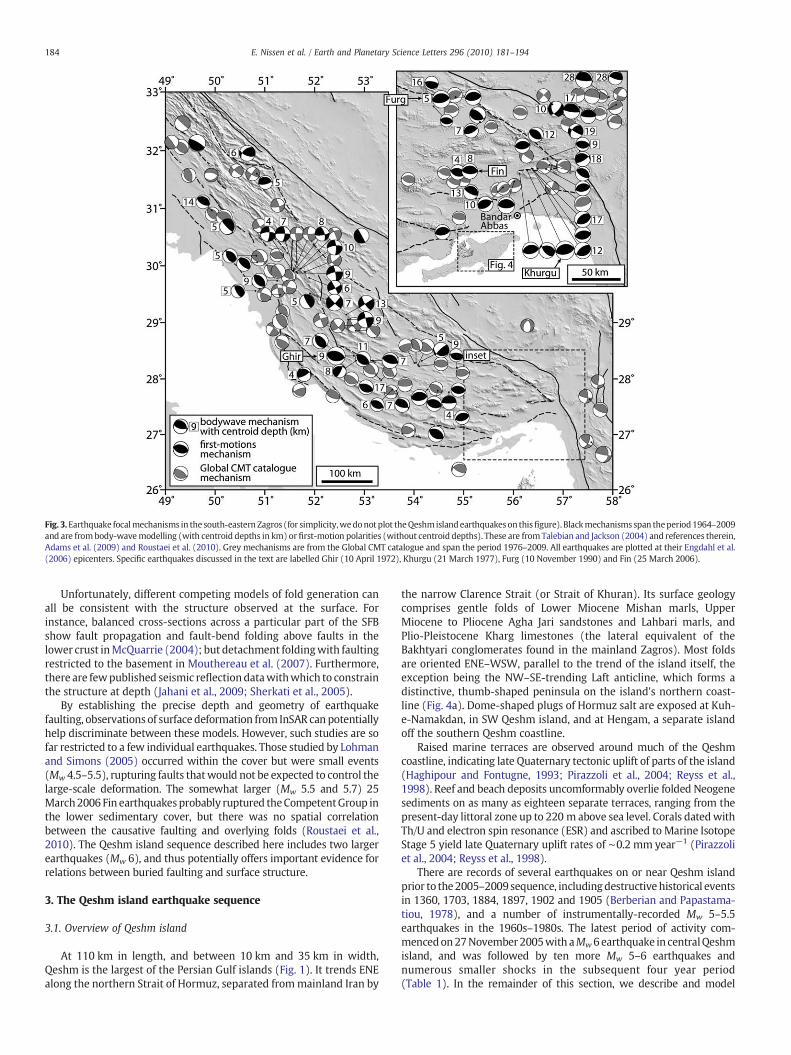
Fig. 3.Earthquake focalmechanisms in the south-eastern Zagros (for simplicity,wedonot plot theQeshmislandearthquakeson thisfigure). Blackmechanisms span theperiod1964–2009and are frombody-wavemodelling (with centroid depths in km) or first-motion polarities (without centroid depths). These are fromTalebian and Jackson (2004) and references therein,Adams et al. (2009) and Roustaei et al. (2010). Grey mechanisms are from the Global CMT catalogue and span the period 1976–2009. All earthquakes are plotted at their Engdahl et al.(2006) epicenters. Specific earthquakes discussed in the text are labelled Ghir (10 April 1972), Khurgu (21 March 1977), Furg (10 November 1990) and Fin (25 March 2006).
184 E. Nissen et al. / Earth and Planetary Science Letters 296 (2010) 181–194
Unfortunately, different competing models of fold generation canall be consistent with the structure observed at the surface. Forinstance, balanced cross-sections across a particular part of the SFBshow fault propagation and fault-bend folding above faults in thelower crust inMcQuarrie (2004); but detachment foldingwith faultingrestricted to the basement in Mouthereau et al. (2007). Furthermore,there are fewpublished seismic reflectiondatawithwhich to constrainthe structure at depth (Jahani et al., 2009; Sherkati et al., 2005).
By establishing the precise depth and geometry of earthquakefaulting, observations of surface deformation from InSAR can potentiallyhelp discriminate between these models. However, such studies are sofar restricted to a few individual earthquakes. Those studied by Lohmanand Simons (2005) occurred within the cover but were small events(Mw 4.5–5.5), rupturing faults thatwould not be expected to control thelarge-scale deformation. The somewhat larger (Mw 5.5 and 5.7) 25March2006 Fin earthquakesprobably ruptured theCompetentGroup inthe lower sedimentary cover, but there was no spatial correlationbetween the causative faulting and overlying folds (Roustaei et al.,2010). The Qeshm island sequence described here includes two largerearthquakes (Mw 6), and thus potentially offers important evidence forrelations between buried faulting and surface structure.
3. The Qeshm island earthquake sequence
3.1. Overview of Qeshm island
At 110 km in length, and between 10 km and 35 km in width,Qeshm is the largest of the Persian Gulf islands (Fig. 1). It trends ENEalong the northern Strait of Hormuz, separated frommainland Iran by
the narrow Clarence Strait (or Strait of Khuran). Its surface geologycomprises gentle folds of Lower Miocene Mishan marls, UpperMiocene to Pliocene Agha Jari sandstones and Lahbari marls, andPlio-Pleistocene Kharg limestones (the lateral equivalent of theBakhtyari conglomerates found in the mainland Zagros). Most foldsare oriented ENE–WSW, parallel to the trend of the island itself, theexception being the NW–SE-trending Laft anticline, which forms adistinctive, thumb-shaped peninsula on the island's northern coast-line (Fig. 4a). Dome-shaped plugs of Hormuz salt are exposed at Kuh-e-Namakdan, in SW Qeshm island, and at Hengam, a separate islandoff the southern Qeshm coastline.
Raised marine terraces are observed around much of the Qeshmcoastline, indicating late Quaternary tectonic uplift of parts of the island(Haghipour and Fontugne, 1993; Pirazzoli et al., 2004; Reyss et al.,1998). Reef and beach deposits uncomformably overlie folded Neogenesediments on as many as eighteen separate terraces, ranging from thepresent-day littoral zone up to 220 m above sea level. Corals datedwithTh/U and electron spin resonance (ESR) and ascribed to Marine IsotopeStage 5 yield late Quaternary uplift rates of ∼0.2 mm year−1 (Pirazzoliet al., 2004; Reyss et al., 1998).
There are records of several earthquakes on or near Qeshm islandprior to the2005–2009sequence, includingdestructivehistorical eventsin 1360, 1703, 1884, 1897, 1902 and 1905 (Berberian and Papastama-tiou, 1978), and a number of instrumentally-recorded Mw 5–5.5earthquakes in the 1960s–1980s. The latest period of activity com-mencedon27November 2005with aMw6earthquake in centralQeshmisland, and was followed by ten more Mw 5–6 earthquakes andnumerous smaller shocks in the subsequent four year period(Table 1). In the remainder of this section, we describe and model
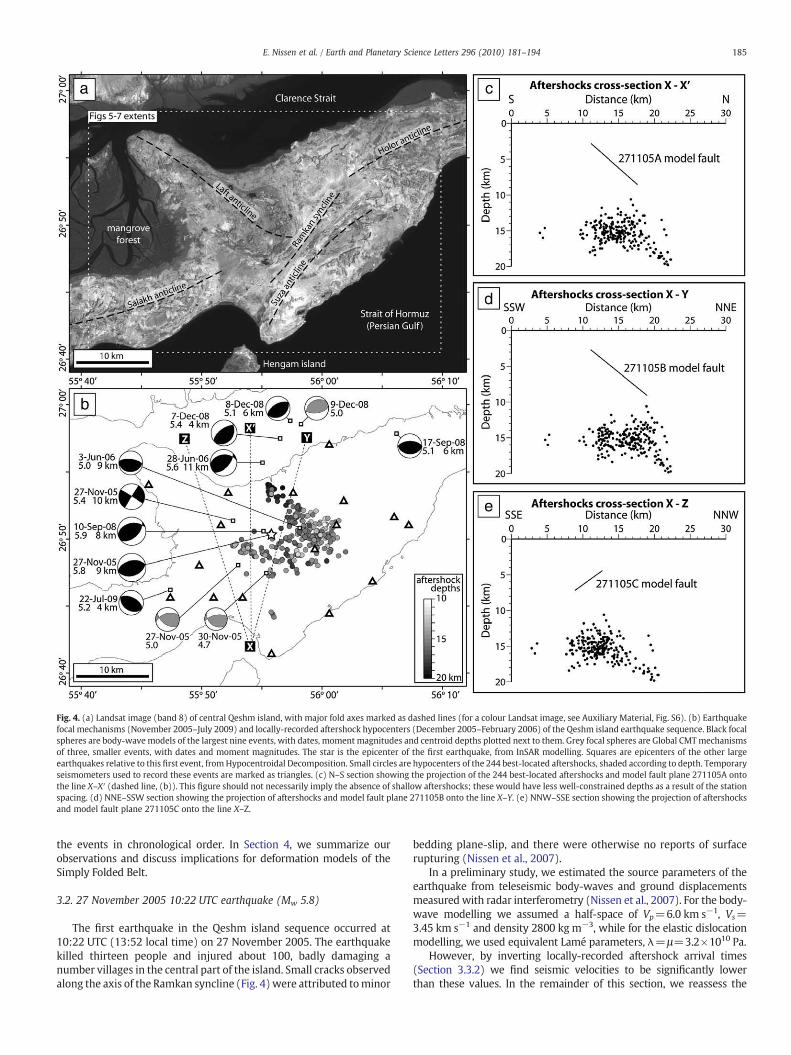
Fig. 4. (a) Landsat image (band 8) of central Qeshm island, with major fold axes marked as dashed lines (for a colour Landsat image, see Auxiliary Material, Fig. S6). (b) Earthquakefocal mechanisms (November 2005–July 2009) and locally-recorded aftershock hypocenters (December 2005–February 2006) of the Qeshm island earthquake sequence. Black focalspheres are body-wave models of the largest nine events, with dates, moment magnitudes and centroid depths plotted next to them. Grey focal spheres are Global CMTmechanismsof three, smaller events, with dates and moment magnitudes. The star is the epicenter of the first earthquake, from InSAR modelling. Squares are epicenters of the other largeearthquakes relative to this first event, fromHypocentroidal Decomposition. Small circles are hypocenters of the 244 best-located aftershocks, shaded according to depth. Temporaryseismometers used to record these events are marked as triangles. (c) N–S section showing the projection of the 244 best-located aftershocks and model fault plane 271105A ontothe line X–X′ (dashed line, (b)). This figure should not necessarily imply the absence of shallow aftershocks; these would have less well-constrained depths as a result of the stationspacing. (d) NNE–SSW section showing the projection of aftershocks and model fault plane 271105B onto the line X–Y. (e) NNW–SSE section showing the projection of aftershocksand model fault plane 271105C onto the line X–Z.
185E. Nissen et al. / Earth and Planetary Science Letters 296 (2010) 181–194
the events in chronological order. In Section 4, we summarize ourobservations and discuss implications for deformation models of theSimply Folded Belt.
3.2. 27 November 2005 10:22 UTC earthquake (Mw 5.8)
The first earthquake in the Qeshm island sequence occurred at10:22 UTC (13:52 local time) on 27 November 2005. The earthquakekilled thirteen people and injured about 100, badly damaging anumber villages in the central part of the island. Small cracks observedalong the axis of the Ramkan syncline (Fig. 4)were attributed tominor
bedding plane-slip, and there were otherwise no reports of surfacerupturing (Nissen et al., 2007).
In a preliminary study, we estimated the source parameters of theearthquake from teleseismic body-waves and ground displacementsmeasured with radar interferometry (Nissen et al., 2007). For the body-wave modelling we assumed a half-space of Vp=6.0 km s−1, Vs=3.45 km s−1 and density 2800 kg m−3, while for the elastic dislocationmodelling, we used equivalent Lamé parameters, λ=μ=3.2×10¹⁰ Pa.
However, by inverting locally-recorded aftershock arrival times(Section 3.3.2) we find seismic velocities to be significantly lowerthan these values. In the remainder of this section, we reassess the
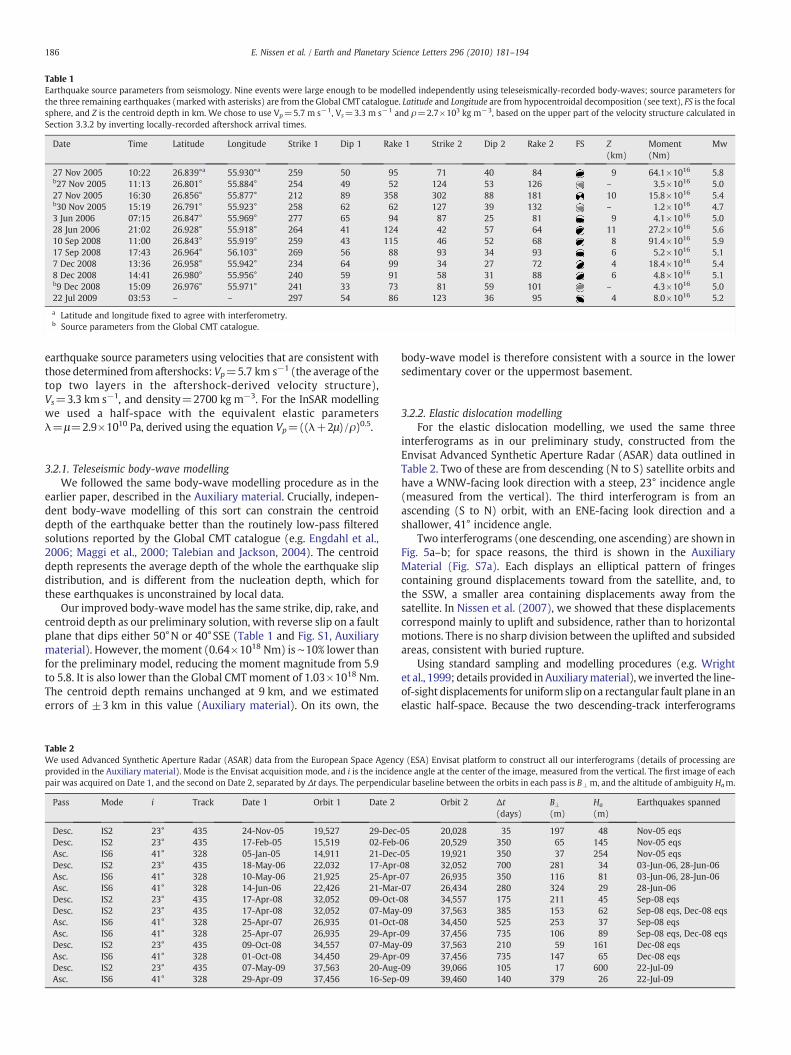
Table 1Earthquake source parameters from seismology. Nine events were large enough to be modelled independently using teleseismically-recorded body-waves; source parameters forthe three remaining earthquakes (marked with asterisks) are from the Global CMT catalogue. Latitude and Longitude are from hypocentroidal decomposition (see text), FS is the focalsphere, and Z is the centroid depth in km. We chose to use Vp=5.7 m s−1, Vs=3.3 m s−1 and ρ=2.7×10³ kg m−3, based on the upper part of the velocity structure calculated inSection 3.3.2 by inverting locally-recorded aftershock arrival times.
Date Time Latitude Longitude Strike 1 Dip 1 Rake 1 Strike 2 Dip 2 Rake 2 FS Z(km)
Moment(Nm)
Mw
27 Nov 2005 10:22 26.839°a 55.930°a 259 50 95 71 40 84 9 64.1×10¹⁶ 5.8b27 Nov 2005 11:13 26.801° 55.884° 254 49 52 124 53 126 – 3.5×10¹⁶ 5.027 Nov 2005 16:30 26.856° 55.877° 212 89 358 302 88 181 10 15.8×10¹⁶ 5.4b30 Nov 2005 15:19 26.791° 55.923° 258 62 62 127 39 132 – 1.2×10¹⁶ 4.73 Jun 2006 07:15 26.847° 55.969° 277 65 94 87 25 81 9 4.1×10¹⁶ 5.028 Jun 2006 21:02 26.928° 55.918° 264 41 124 42 57 64 11 27.2×10¹⁶ 5.610 Sep 2008 11:00 26.843° 55.919° 259 43 115 46 52 68 8 91.4×10¹⁶ 5.917 Sep 2008 17:43 26.964° 56.103° 269 56 88 93 34 93 6 5.2×10¹⁶ 5.17 Dec 2008 13:36 26.958° 55.942° 234 64 99 34 27 72 4 18.4×10¹⁶ 5.48 Dec 2008 14:41 26.980° 55.956° 240 59 91 58 31 88 6 4.8×10¹⁶ 5.1b9 Dec 2008 15:09 26.976° 55.971° 241 33 73 81 59 101 – 4.3×10¹⁶ 5.022 Jul 2009 03:53 – – 297 54 86 123 36 95 4 8.0×10¹⁶ 5.2
a Latitude and longitude fixed to agree with interferometry.b Source parameters from the Global CMT catalogue.
186 E. Nissen et al. / Earth and Planetary Science Letters 296 (2010) 181–194
earthquake source parameters using velocities that are consistent withthose determined fromaftershocks: Vp=5.7 km s−1 (the average of thetop two layers in the aftershock-derived velocity structure),Vs=3.3 km s−1, and density=2700 kg m−3. For the InSAR modellingwe used a half-space with the equivalent elastic parametersλ=μ=2.9×10¹⁰ Pa, derived using the equation Vp=((λ+2μ)/ρ)0.5.
3.2.1. Teleseismic body-wave modellingWe followed the same body-wave modelling procedure as in the
earlier paper, described in the Auxiliary material. Crucially, indepen-dent body-wave modelling of this sort can constrain the centroiddepth of the earthquake better than the routinely low-pass filteredsolutions reported by the Global CMT catalogue (e.g. Engdahl et al.,2006; Maggi et al., 2000; Talebian and Jackson, 2004). The centroiddepth represents the average depth of the whole the earthquake slipdistribution, and is different from the nucleation depth, which forthese earthquakes is unconstrained by local data.
Our improved body-wavemodel has the same strike, dip, rake, andcentroid depth as our preliminary solution, with reverse slip on a faultplane that dips either 50°N or 40°SSE (Table 1 and Fig. S1, Auxiliarymaterial). However, themoment (0.64×10¹⁸ Nm) is ∼10% lower thanfor the preliminary model, reducing the moment magnitude from 5.9to 5.8. It is also lower than the Global CMTmoment of 1.03×10¹⁸ Nm.The centroid depth remains unchanged at 9 km, and we estimatederrors of ±3 km in this value (Auxiliary material). On its own, the
Table 2We used Advanced Synthetic Aperture Radar (ASAR) data from the European Space Agencprovided in the Auxiliary material). Mode is the Envisat acquisition mode, and i is the incidepair was acquired on Date 1, and the second on Date 2, separated by Δt days. The perpendicu
Pass Mode i Track Date 1 Orbit 1 Date 2
Desc. IS2 23° 435 24-Nov-05 19,527 29-Dec-Desc. IS2 23° 435 17-Feb-05 15,519 02-Feb-Asc. IS6 41° 328 05-Jan-05 14,911 21-Dec-Desc. IS2 23° 435 18-May-06 22,032 17-Apr-Asc. IS6 41° 328 10-May-06 21,925 25-Apr-Asc. IS6 41° 328 14-Jun-06 22,426 21-MarDesc. IS2 23° 435 17-Apr-08 32,052 09-Oct-Desc. IS2 23° 435 17-Apr-08 32,052 07-MayAsc. IS6 41° 328 25-Apr-07 26,935 01-Oct-Asc. IS6 41° 328 25-Apr-07 26,935 29-Apr-Desc. IS2 23° 435 09-Oct-08 34,557 07-MayAsc. IS6 41° 328 01-Oct-08 34,450 29-Apr-Desc. IS2 23° 435 07-May-09 37,563 20-Aug-Asc. IS6 41° 328 29-Apr-09 37,456 16-Sep-
body-wave model is therefore consistent with a source in the lowersedimentary cover or the uppermost basement.
3.2.2. Elastic dislocation modellingFor the elastic dislocation modelling, we used the same three
interferograms as in our preliminary study, constructed from theEnvisat Advanced Synthetic Aperture Radar (ASAR) data outlined inTable 2. Two of these are from descending (N to S) satellite orbits andhave a WNW-facing look direction with a steep, 23° incidence angle(measured from the vertical). The third interferogram is from anascending (S to N) orbit, with an ENE-facing look direction and ashallower, 41° incidence angle.
Two interferograms (one descending, one ascending) are shown inFig. 5a–b; for space reasons, the third is shown in the AuxiliaryMaterial (Fig. S7a). Each displays an elliptical pattern of fringescontaining ground displacements toward from the satellite, and, tothe SSW, a smaller area containing displacements away from thesatellite. In Nissen et al. (2007), we showed that these displacementscorrespond mainly to uplift and subsidence, rather than to horizontalmotions. There is no sharp division between the uplifted and subsidedareas, consistent with buried rupture.
Using standard sampling and modelling procedures (e.g. Wrightet al., 1999; details provided in Auxiliarymaterial), we inverted the line-of-sight displacements for uniformslip on a rectangular fault plane in anelastic half-space. Because the two descending-track interferograms
y (ESA) Envisat platform to construct all our interferograms (details of processing arence angle at the center of the image, measured from the vertical. The first image of eachlar baseline between the orbits in each pass is B⊥ m, and the altitude of ambiguity Ham.
Orbit 2 Δt(days)
B⊥(m)
Ha
(m)Earthquakes spanned
05 20,028 35 197 48 Nov-05 eqs06 20,529 350 65 145 Nov-05 eqs05 19,921 350 37 254 Nov-05 eqs08 32,052 700 281 34 03-Jun-06, 28-Jun-0607 26,935 350 116 81 03-Jun-06, 28-Jun-06-07 26,434 280 324 29 28-Jun-0608 34,557 175 211 45 Sep-08 eqs-09 37,563 385 153 62 Sep-08 eqs, Dec-08 eqs08 34,450 525 253 37 Sep-08 eqs09 37,456 735 106 89 Sep-08 eqs, Dec-08 eqs-09 37,563 210 59 161 Dec-08 eqs09 37,456 735 147 65 Dec-08 eqs09 39,066 105 17 600 22-Jul-0909 39,460 140 379 26 22-Jul-09
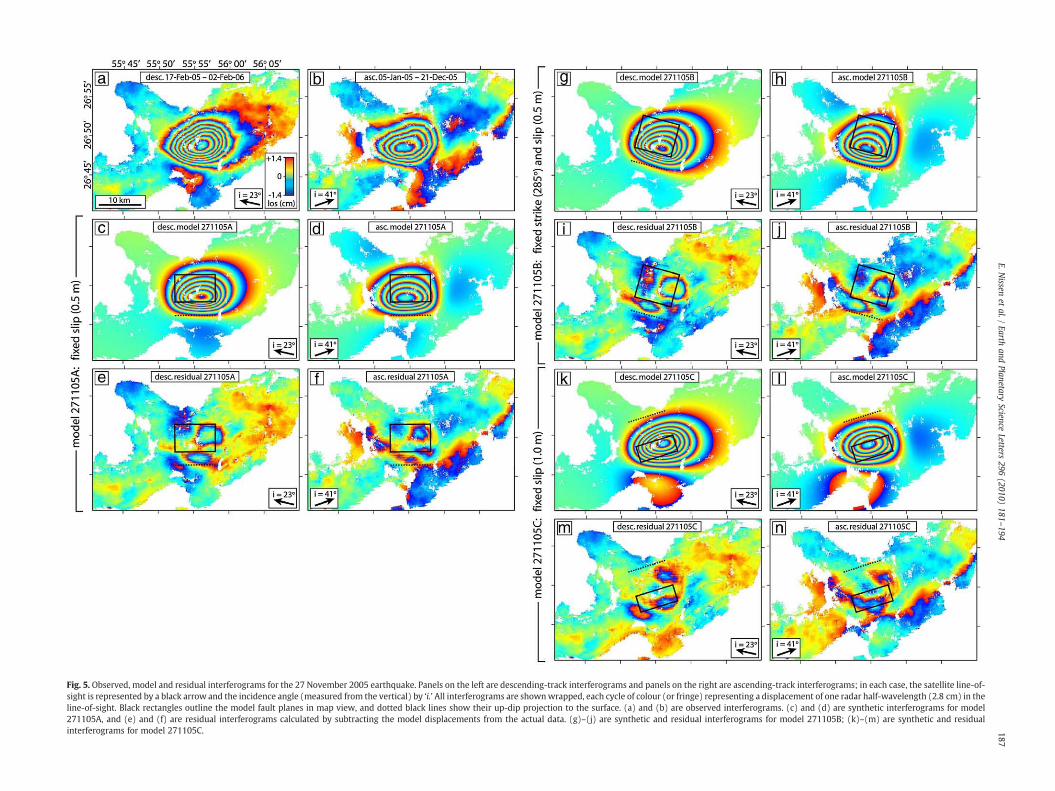
Fig. 5. Observed, model and residual interferograms for the 27 November 2005 earthquake. Panels on the left are descending-track interferograms and panels on the right are ascending-track interferograms; in each case, the satellite line-of-sight is represented by a black arrow and the incidence angle (measured from the vertical) by ‘i.’ All interferograms are shownwrapped, each cycle of colour (or fringe) representing a displacement of one radar half-wavelength (2.8 cm) in theline-of-sight. Black rectangles outline the model fault planes in map view, and dotted black lines show their up-dip projection to the surface. (a) and (b) are observed interferograms. (c) and (d) are synthetic interferograms for model271105A, and (e) and (f) are residual interferograms calculated by subtracting the model displacements from the actual data. (g)–(j) are synthetic and residual interferograms for model 271105B; (k)–(m) are synthetic and residualinterferograms for model 271105C. 187
E.Nissen
etal./
Earthand
PlanetaryScience
Letters296
(2010)181
–194
188 E. Nissen et al. / Earth and Planetary Science Letters 296 (2010) 181–194
share the same look direction, they were each given half the weightingof the single, ascending-track interferogram in the inversion.
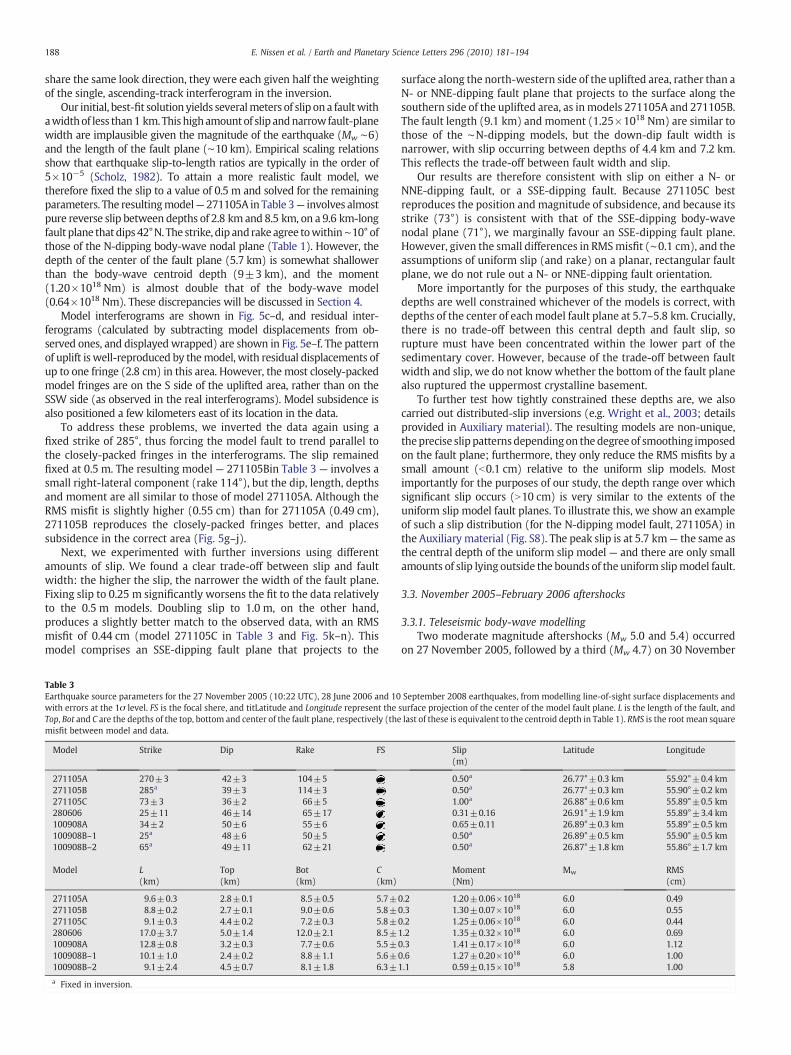
Our initial, best-fit solution yields severalmeters of slip on a faultwithawidthof less than1 km.Thishighamountof slip andnarrowfault-planewidth are implausible given the magnitude of the earthquake (Mw ∼6)and the length of the fault plane (∼10 km). Empirical scaling relationsshow that earthquake slip-to-length ratios are typically in the order of5×10−5 (Scholz, 1982). To attain a more realistic fault model, wetherefore fixed the slip to a value of 0.5 m and solved for the remainingparameters. The resultingmodel— 271105A in Table 3— involves almostpure reverse slip between depths of 2.8 km and 8.5 km, on a 9.6 km-longfault plane that dips 42°N. The strike, dip andrake agree towithin∼10° ofthose of the N-dipping body-wave nodal plane (Table 1). However, thedepth of the center of the fault plane (5.7 km) is somewhat shallowerthan the body-wave centroid depth (9±3 km), and the moment(1.20×10¹⁸ Nm) is almost double that of the body-wave model(0.64×10¹⁸ Nm). These discrepancies will be discussed in Section 4.
Model interferograms are shown in Fig. 5c–d, and residual inter-ferograms (calculated by subtracting model displacements from ob-served ones, and displayedwrapped) are shown in Fig. 5e–f. The patternof uplift is well-reproduced by themodel, with residual displacements ofup to one fringe (2.8 cm) in this area. However, the most closely-packedmodel fringes are on the S side of the uplifted area, rather than on theSSW side (as observed in the real interferograms). Model subsidence isalso positioned a few kilometers east of its location in the data.
To address these problems, we inverted the data again using afixed strike of 285°, thus forcing the model fault to trend parallel tothe closely-packed fringes in the interferograms. The slip remainedfixed at 0.5 m. The resulting model — 271105Bin Table 3 — involves asmall right-lateral component (rake 114°), but the dip, length, depthsand moment are all similar to those of model 271105A. Although theRMS misfit is slightly higher (0.55 cm) than for 271105A (0.49 cm),271105B reproduces the closely-packed fringes better, and placessubsidence in the correct area (Fig. 5g–j).
Next, we experimented with further inversions using differentamounts of slip. We found a clear trade-off between slip and faultwidth: the higher the slip, the narrower the width of the fault plane.Fixing slip to 0.25 m significantly worsens the fit to the data relativelyto the 0.5 m models. Doubling slip to 1.0 m, on the other hand,produces a slightly better match to the observed data, with an RMSmisfit of 0.44 cm (model 271105C in Table 3 and Fig. 5k–n). Thismodel comprises an SSE-dipping fault plane that projects to the
Table 3Earthquake source parameters for the 27 November 2005 (10:22 UTC), 28 June 2006 and 10with errors at the 1σ level. FS is the focal shere, and titLatitude and Longitude represent theTop, Bot and C are the depths of the top, bottom and center of the fault plane, respectively (themisfit between model and data.
Model Strike Dip Rake FS
271105A 270±3 42±3 104±5271105B 285a 39±3 114±3271105C 73±3 36±2 66±5280606 25±11 46±14 65±17100908A 34±2 50±6 55±6100908B–1 25a 48±6 50±5100908B–2 65a 49±11 62±21
Model L(km)
Top(km)
Bot(km)
C(km)
271105A 9.6±0.3 2.8±0.1 8.5±0.5 5.7±271105B 8.8±0.2 2.7±0.1 9.0±0.6 5.8±271105C 9.1±0.3 4.4±0.2 7.2±0.3 5.8±280606 17.0±3.7 5.0±1.4 12.0±2.1 8.5±100908A 12.8±0.8 3.2±0.3 7.7±0.6 5.5±100908B–1 10.1±1.0 2.4±0.2 8.8±1.1 5.6±100908B–2 9.1±2.4 4.5±0.7 8.1±1.8 6.3±
a Fixed in inversion.
surface along the north-western side of the uplifted area, rather than aN- or NNE-dipping fault plane that projects to the surface along thesouthern side of the uplifted area, as inmodels 271105A and 271105B.The fault length (9.1 km) and moment (1.25×10¹⁸ Nm) are similar tothose of the ∼N-dipping models, but the down-dip fault width isnarrower, with slip occurring between depths of 4.4 km and 7.2 km.This reflects the trade-off between fault width and slip.
Our results are therefore consistent with slip on either a N- orNNE-dipping fault, or a SSE-dipping fault. Because 271105C bestreproduces the position and magnitude of subsidence, and because itsstrike (73°) is consistent with that of the SSE-dipping body-wavenodal plane (71°), we marginally favour an SSE-dipping fault plane.However, given the small differences in RMSmisfit (∼0.1 cm), and theassumptions of uniform slip (and rake) on a planar, rectangular faultplane, we do not rule out a N- or NNE-dipping fault orientation.
More importantly for the purposes of this study, the earthquakedepths are well constrained whichever of the models is correct, withdepths of the center of eachmodel fault plane at 5.7–5.8 km. Crucially,there is no trade-off between this central depth and fault slip, sorupture must have been concentrated within the lower part of thesedimentary cover. However, because of the trade-off between faultwidth and slip, we do not knowwhether the bottom of the fault planealso ruptured the uppermost crystalline basement.
To further test how tightly constrained these depths are, we alsocarried out distributed-slip inversions (e.g. Wright et al., 2003; detailsprovided in Auxiliary material). The resulting models are non-unique,theprecise slip patternsdependingon the degree of smoothing imposedon the fault plane; furthermore, they only reduce the RMS misfits by asmall amount (b0.1 cm) relative to the uniform slip models. Mostimportantly for the purposes of our study, the depth range over whichsignificant slip occurs (N10 cm) is very similar to the extents of theuniform slip model fault planes. To illustrate this, we show an exampleof such a slip distribution (for the N-dipping model fault, 271105A) inthe Auxiliary material (Fig. S8). The peak slip is at 5.7 km— the same asthe central depth of the uniform slip model — and there are only smallamounts of slip lying outside the bounds of the uniform slipmodel fault.
3.3. November 2005–February 2006 aftershocks
3.3.1. Teleseismic body-wave modellingTwo moderate magnitude aftershocks (Mw 5.0 and 5.4) occurred
on 27 November 2005, followed by a third (Mw 4.7) on 30 November
September 2008 earthquakes, from modelling line-of-sight surface displacements andsurface projection of the center of the model fault plane. L is the length of the fault, andlast of these is equivalent to the centroid depth in Table 1). RMS is the root mean square
Slip(m)
Latitude Longitude
0.50a 26.77°±0.3 km 55.92°±0.4 km0.50a 26.77°±0.3 km 55.90°±0.2 km1.00a 26.88°±0.6 km 55.89°±0.5 km0.31±0.16 26.91°±1.9 km 55.89°±3.4 km0.65±0.11 26.89°±0.3 km 55.89°±0.5 km0.50a 26.89°±0.5 km 55.90°±0.5 km0.50a 26.87°±1.8 km 55.86°±1.7 km
Moment(Nm)
Mw RMS(cm)
0.2 1.20±0.06×10¹⁸ 6.0 0.490.3 1.30±0.07×10¹⁸ 6.0 0.550.2 1.25±0.06×10¹⁸ 6.0 0.441.2 1.35±0.32×10¹⁸ 6.0 0.690.3 1.41±0.17×10¹⁸ 6.0 1.120.6 1.27±0.20×10¹⁸ 6.0 1.001.1 0.59±0.15×10¹⁸ 5.8 1.00
189E. Nissen et al. / Earth and Planetary Science Letters 296 (2010) 181–194
(Table 1). These events cannot be distinguished from the much largermainshock in the interferograms, but focal mechanisms are availablein the Global CMT catalogue, and the 27 November, 16:30 UTCearthquake is also large enough for independent body-wave model-ling to constrain the centroid depth. Our solution for this event isshown in the AuxiliaryMaterial (Fig. S1) and its source parameters arelisted in Table 1. We obtained a strike–slip mechanism with a similarP-axis to that of the 10:22 mainshock, but it is not clear which nodalplane represents the fault. From the centroid depth of 10±3 km, it isalso uncertain whether the earthquake occurred in the uppermostbasement or the lower sedimentary cover. Global CMT parameters forthe smaller two events are also listed in Table 1; both involvedoblique-slip, but precise depths are not available.
We used the Hypocentroidal Decomposition (HDC) method(Jordan and Sverdrup, 1981) to determine the positions of these(and subsequent) earthquakes relative to the 10:22 mainshock. Themainshock hypocenter was fixed at the center of the model 271105Afault plane (star, Fig. 4b). Positions of later, moderate magnitudeearthquakes, relative to the mainshock, are shown as squares onFig. 4b, linked to their focal mechanisms by black lines. Horizontalerrors in these relative locations are typically 3–5 km. The 27 and 30November earthquake hypocenters lie ∼5 km from the mainshock, totheW (27 November, 16:30 UTC), SW (27 November, 11:13 UTC) andS (30 November, 15:19 UTC).
3.3.2. Locally-recorded aftershocksWe also determined the distribution of smaller aftershocks using
data collected from a local network of nineteen portable, three-component seismometers. These were deployed in early December2005 and recorded until late February 2006. Details of the instrumentsand data processing techniques can be found in Tatar et al. (2005).
During the seven week period recorded by our network, morethan 1700 individual shocks were detected, ranging in magnitudefrom 1–4. At first, these were located using the Hypocenter 3.2program (Lienert and Havskov, 1995), assuming a simple half-space ofVp=6.0 km s−1.We then selected a subset of 244 earthquakeswith anazimuthal gap of ≤180°, an RMS residual (the difference betweenobserved and calculated arrival times) of ≤0.2 s, and at least 15separate S and P phase recordings.We inverted the arrival times of thissubset using the VELEST program (Kissling, 1988), which simulta-neously calculates improved hypocenters and a best-fit, layeredvelocity structure, and used randomly perturbed starting models toensure convergence to the final structure (e.g. Hatzfeld et al., 2003).
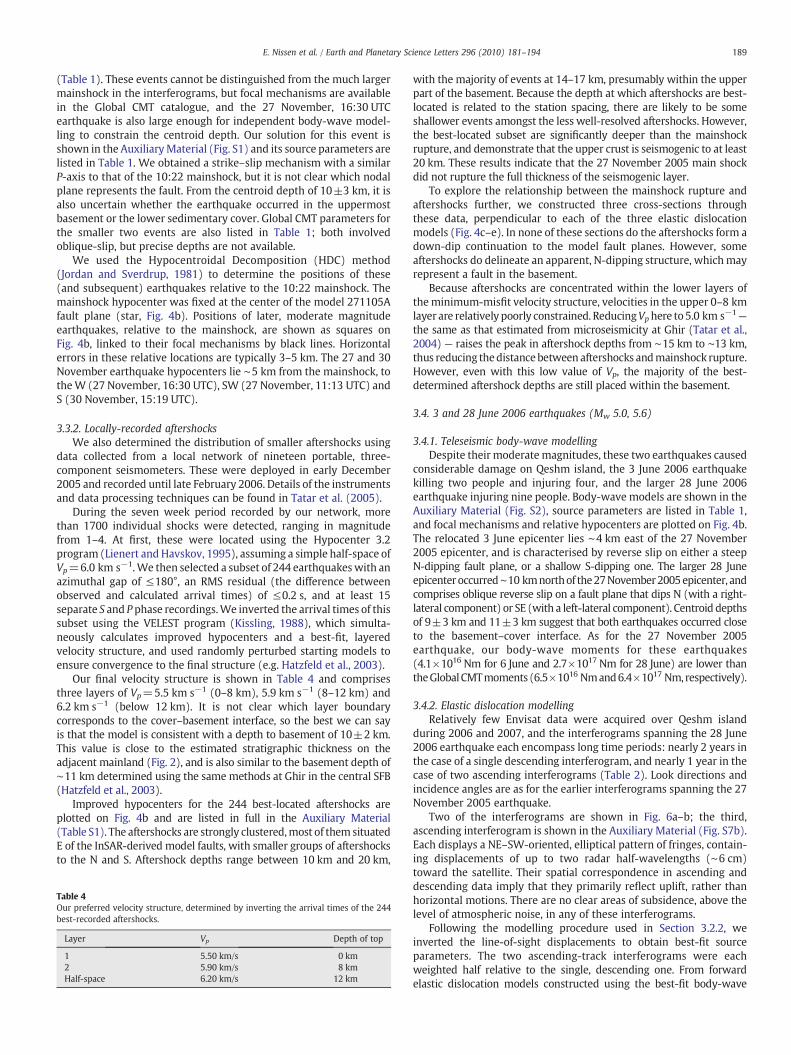
Our final velocity structure is shown in Table 4 and comprisesthree layers of Vp=5.5 km s−1 (0–8 km), 5.9 km s−1 (8–12 km) and6.2 km s−1 (below 12 km). It is not clear which layer boundarycorresponds to the cover–basement interface, so the best we can sayis that the model is consistent with a depth to basement of 10±2 km.This value is close to the estimated stratigraphic thickness on theadjacent mainland (Fig. 2), and is also similar to the basement depth of∼11 km determined using the same methods at Ghir in the central SFB(Hatzfeld et al., 2003).
Improved hypocenters for the 244 best-located aftershocks areplotted on Fig. 4b and are listed in full in the Auxiliary Material(Table S1). The aftershocks are strongly clustered,most of them situatedE of the InSAR-derived model faults, with smaller groups of aftershocksto the N and S. Aftershock depths range between 10 km and 20 km,
Table 4Our preferred velocity structure, determined by inverting the arrival times of the 244best-recorded aftershocks.
Layer Vp Depth of top
1 5.50 km/s 0 km2 5.90 km/s 8 kmHalf-space 6.20 km/s 12 km
with the majority of events at 14–17 km, presumably within the upperpart of the basement. Because the depth at which aftershocks are best-located is related to the station spacing, there are likely to be someshallower events amongst the less well-resolved aftershocks. However,the best-located subset are significantly deeper than the mainshockrupture, and demonstrate that the upper crust is seismogenic to at least20 km. These results indicate that the 27 November 2005 main shockdid not rupture the full thickness of the seismogenic layer.
To explore the relationship between the mainshock rupture andaftershocks further, we constructed three cross-sections throughthese data, perpendicular to each of the three elastic dislocationmodels (Fig. 4c–e). In none of these sections do the aftershocks form adown-dip continuation to the model fault planes. However, someaftershocks do delineate an apparent, N-dipping structure, whichmayrepresent a fault in the basement.
Because aftershocks are concentrated within the lower layers oftheminimum-misfit velocity structure, velocities in the upper 0–8 kmlayer are relatively poorly constrained. ReducingVphere to5.0 km s−1—
the same as that estimated from microseismicity at Ghir (Tatar et al.,2004) — raises the peak in aftershock depths from ∼15 km to ∼13 km,thus reducing thedistancebetween aftershocks andmainshock rupture.However, even with this low value of Vp, the majority of the best-determined aftershock depths are still placed within the basement.
3.4. 3 and 28 June 2006 earthquakes (Mw 5.0, 5.6)
3.4.1. Teleseismic body-wave modellingDespite their moderate magnitudes, these two earthquakes caused
considerable damage on Qeshm island, the 3 June 2006 earthquakekilling two people and injuring four, and the larger 28 June 2006earthquake injuring nine people. Body-wave models are shown in theAuxiliary Material (Fig. S2), source parameters are listed in Table 1,and focal mechanisms and relative hypocenters are plotted on Fig. 4b.The relocated 3 June epicenter lies ∼4 km east of the 27 November2005 epicenter, and is characterised by reverse slip on either a steepN-dipping fault plane, or a shallow S-dipping one. The larger 28 Juneepicenteroccurred∼10 kmnorthof the27November2005epicenter, andcomprises oblique reverse slip on a fault plane that dips N (with a right-lateral component) or SE (with a left-lateral component). Centroid depthsof 9±3 km and 11±3 km suggest that both earthquakes occurred closeto the basement–cover interface. As for the 27 November 2005earthquake, our body-wave moments for these earthquakes(4.1×10¹⁶ Nm for 6 June and 2.7×10¹⁷ Nm for 28 June) are lower thantheGlobalCMTmoments (6.5×10¹⁶ Nmand6.4×1017 Nm, respectively).
3.4.2. Elastic dislocation modellingRelatively few Envisat data were acquired over Qeshm island
during 2006 and 2007, and the interferograms spanning the 28 June2006 earthquake each encompass long time periods: nearly 2 years inthe case of a single descending interferogram, and nearly 1 year in thecase of two ascending interferograms (Table 2). Look directions andincidence angles are as for the earlier interferograms spanning the 27November 2005 earthquake.
Two of the interferograms are shown in Fig. 6a–b; the third,ascending interferogram is shown in the Auxiliary Material (Fig. S7b).Each displays a NE–SW-oriented, elliptical pattern of fringes, contain-ing displacements of up to two radar half-wavelengths (∼6 cm)toward the satellite. Their spatial correspondence in ascending anddescending data imply that they primarily reflect uplift, rather thanhorizontal motions. There are no clear areas of subsidence, above thelevel of atmospheric noise, in any of these interferograms.
Following the modelling procedure used in Section 3.2.2, weinverted the line-of-sight displacements to obtain best-fit sourceparameters. The two ascending-track interferograms were eachweighted half relative to the single, descending one. From forwardelastic dislocation models constructed using the best-fit body-wave
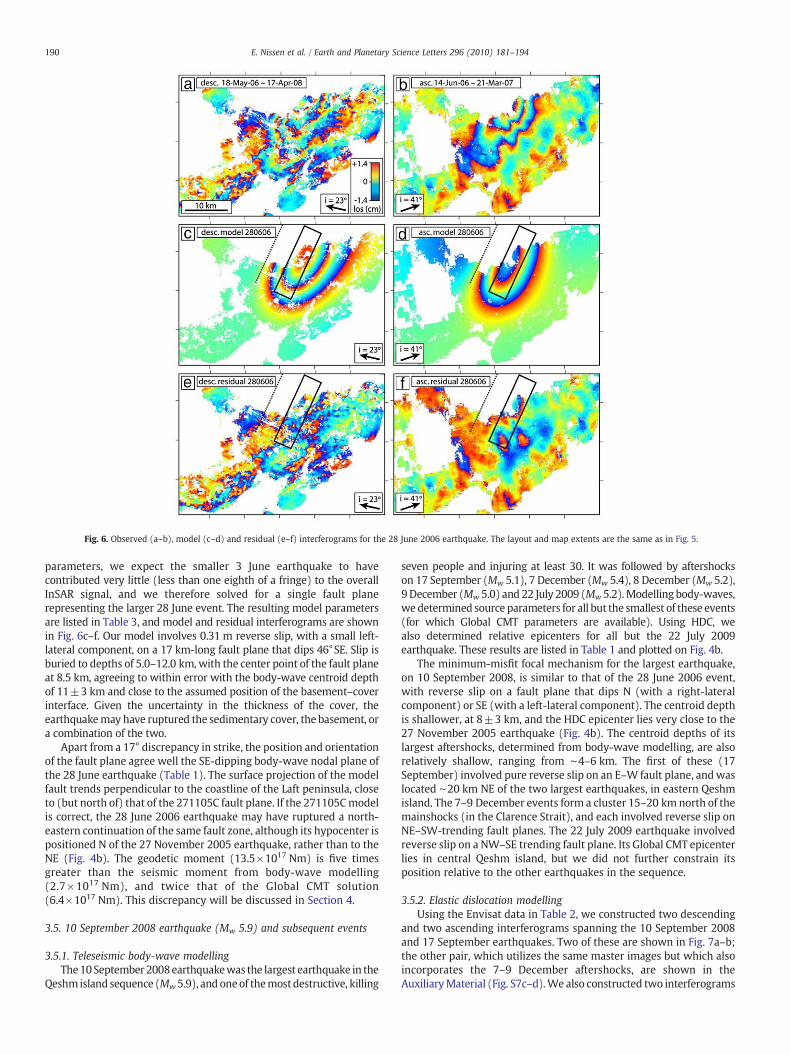
Fig. 6. Observed (a–b), model (c–d) and residual (e–f) interferograms for the 28 June 2006 earthquake. The layout and map extents are the same as in Fig. 5.
190 E. Nissen et al. / Earth and Planetary Science Letters 296 (2010) 181–194
parameters, we expect the smaller 3 June earthquake to havecontributed very little (less than one eighth of a fringe) to the overallInSAR signal, and we therefore solved for a single fault planerepresenting the larger 28 June event. The resulting model parametersare listed in Table 3, and model and residual interferograms are shownin Fig. 6c–f. Our model involves 0.31 m reverse slip, with a small left-lateral component, on a 17 km-long fault plane that dips 46°SE. Slip isburied to depths of 5.0–12.0 km, with the center point of the fault planeat 8.5 km, agreeing to within error with the body-wave centroid depthof 11±3 km and close to the assumed position of the basement–coverinterface. Given the uncertainty in the thickness of the cover, theearthquakemay have ruptured the sedimentary cover, the basement, ora combination of the two.
Apart from a 17° discrepancy in strike, the position and orientationof the fault plane agree well the SE-dipping body-wave nodal plane ofthe 28 June earthquake (Table 1). The surface projection of the modelfault trends perpendicular to the coastline of the Laft peninsula, closeto (but north of) that of the 271105C fault plane. If the 271105Cmodelis correct, the 28 June 2006 earthquake may have ruptured a north-eastern continuation of the same fault zone, although its hypocenter ispositioned N of the 27 November 2005 earthquake, rather than to theNE (Fig. 4b). The geodetic moment (13.5×10¹⁷ Nm) is five timesgreater than the seismic moment from body-wave modelling(2.7×10¹⁷ Nm), and twice that of the Global CMT solution(6.4×10¹⁷ Nm). This discrepancy will be discussed in Section 4.
3.5. 10 September 2008 earthquake (Mw 5.9) and subsequent events
3.5.1. Teleseismic body-wave modellingThe10September 2008earthquakewas the largest earthquake in the
Qeshm island sequence (Mw 5.9), and oneof themost destructive, killing
seven people and injuring at least 30. It was followed by aftershockson 17 September (Mw 5.1), 7 December (Mw 5.4), 8 December (Mw 5.2),9 December (Mw 5.0) and 22 July 2009 (Mw 5.2).Modelling body-waves,we determined source parameters for all but the smallest of these events(for which Global CMT parameters are available). Using HDC, wealso determined relative epicenters for all but the 22 July 2009earthquake. These results are listed in Table 1 and plotted on Fig. 4b.
The minimum-misfit focal mechanism for the largest earthquake,on 10 September 2008, is similar to that of the 28 June 2006 event,with reverse slip on a fault plane that dips N (with a right-lateralcomponent) or SE (with a left-lateral component). The centroid depthis shallower, at 8±3 km, and the HDC epicenter lies very close to the27 November 2005 earthquake (Fig. 4b). The centroid depths of itslargest aftershocks, determined from body-wave modelling, are alsorelatively shallow, ranging from ∼4–6 km. The first of these (17September) involved pure reverse slip on an E–W fault plane, andwaslocated ∼20 km NE of the two largest earthquakes, in eastern Qeshmisland. The 7–9 December events form a cluster 15–20 km north of themainshocks (in the Clarence Strait), and each involved reverse slip onNE–SW-trending fault planes. The 22 July 2009 earthquake involvedreverse slip on a NW–SE trending fault plane. Its Global CMT epicenterlies in central Qeshm island, but we did not further constrain itsposition relative to the other earthquakes in the sequence.
3.5.2. Elastic dislocation modellingUsing the Envisat data in Table 2, we constructed two descending
and two ascending interferograms spanning the 10 September 2008and 17 September earthquakes. Two of these are shown in Fig. 7a–b;the other pair, which utilizes the same master images but which alsoincorporates the 7–9 December aftershocks, are shown in theAuxiliaryMaterial (Fig. S7c–d).We also constructed two interferograms
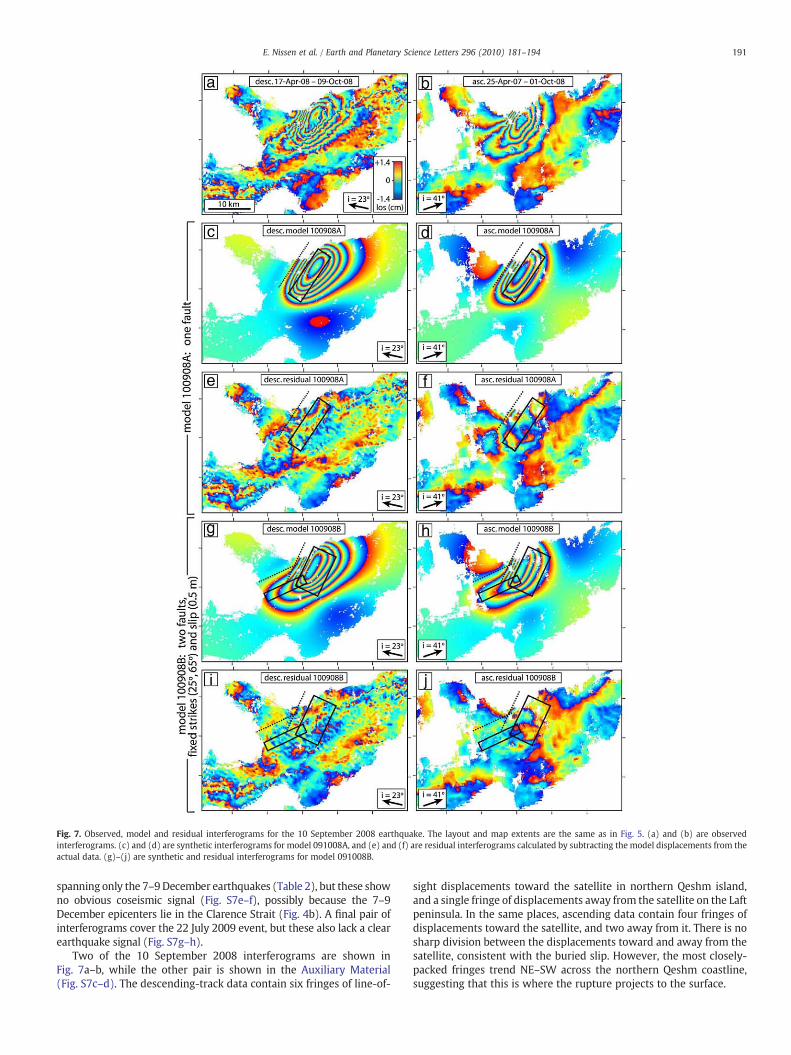
Fig. 7. Observed, model and residual interferograms for the 10 September 2008 earthquake. The layout and map extents are the same as in Fig. 5. (a) and (b) are observedinterferograms. (c) and (d) are synthetic interferograms for model 091008A, and (e) and (f) are residual interferograms calculated by subtracting the model displacements from theactual data. (g)–(j) are synthetic and residual interferograms for model 091008B.
191E. Nissen et al. / Earth and Planetary Science Letters 296 (2010) 181–194
spanning only the 7–9December earthquakes (Table 2), but these showno obvious coseismic signal (Fig. S7e–f), possibly because the 7–9December epicenters lie in the Clarence Strait (Fig. 4b). A final pair ofinterferograms cover the 22 July 2009 event, but these also lack a clearearthquake signal (Fig. S7g–h).
Two of the 10 September 2008 interferograms are shown inFig. 7a–b, while the other pair is shown in the Auxiliary Material(Fig. S7c–d). The descending-track data contain six fringes of line-of-
sight displacements toward the satellite in northern Qeshm island,and a single fringe of displacements away from the satellite on the Laftpeninsula. In the same places, ascending data contain four fringes ofdisplacements toward the satellite, and two away from it. There is nosharp division between the displacements toward and away from thesatellite, consistent with the buried slip. However, the most closely-packed fringes trend NE–SW across the northern Qeshm coastline,suggesting that this is where the rupture projects to the surface.
192 E. Nissen et al. / Earth and Planetary Science Letters 296 (2010) 181–194
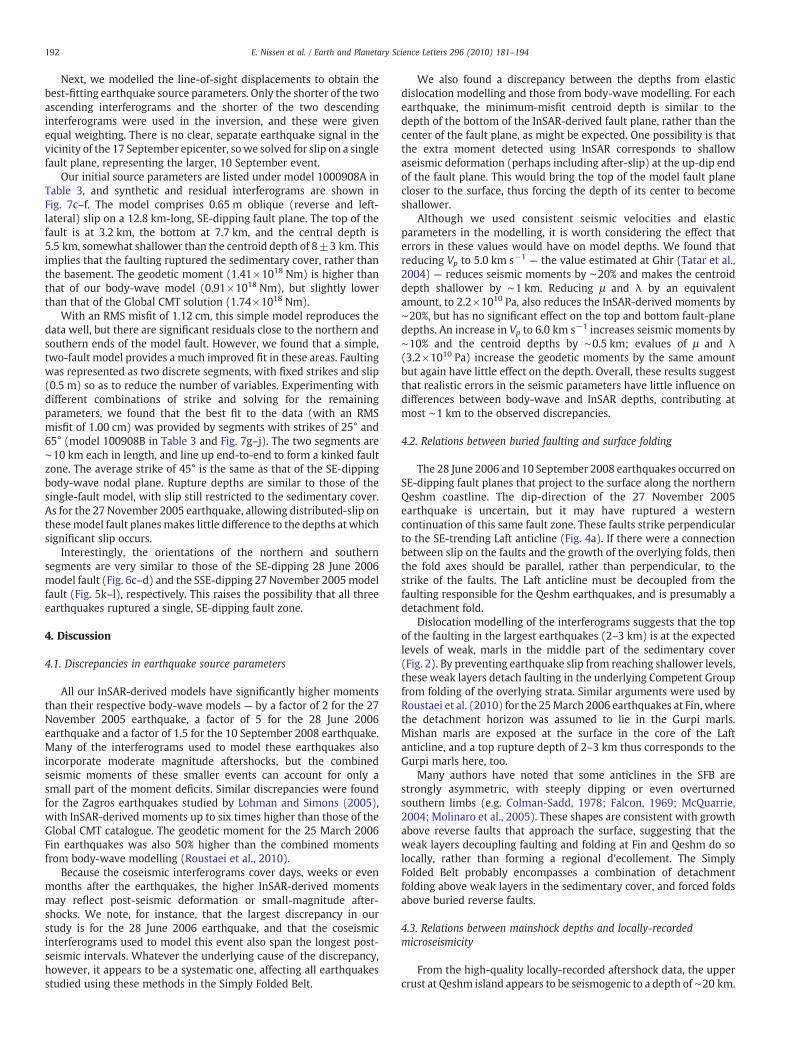
Next, we modelled the line-of-sight displacements to obtain thebest-fitting earthquake source parameters. Only the shorter of the twoascending interferograms and the shorter of the two descendinginterferograms were used in the inversion, and these were givenequal weighting. There is no clear, separate earthquake signal in thevicinity of the 17 September epicenter, sowe solved for slip on a singlefault plane, representing the larger, 10 September event.
Our initial source parameters are listed under model 1000908A inTable 3, and synthetic and residual interferograms are shown inFig. 7c–f. The model comprises 0.65 m oblique (reverse and left-lateral) slip on a 12.8 km-long, SE-dipping fault plane. The top of thefault is at 3.2 km, the bottom at 7.7 km, and the central depth is5.5 km, somewhat shallower than the centroid depth of 8±3 km. Thisimplies that the faulting ruptured the sedimentary cover, rather thanthe basement. The geodetic moment (1.41×10¹⁸ Nm) is higher thanthat of our body-wave model (0.91×10¹⁸ Nm), but slightly lowerthan that of the Global CMT solution (1.74×10¹⁸ Nm).
With an RMS misfit of 1.12 cm, this simple model reproduces thedata well, but there are significant residuals close to the northern andsouthern ends of the model fault. However, we found that a simple,two-fault model provides a much improved fit in these areas. Faultingwas represented as two discrete segments, with fixed strikes and slip(0.5 m) so as to reduce the number of variables. Experimenting withdifferent combinations of strike and solving for the remainingparameters, we found that the best fit to the data (with an RMSmisfit of 1.00 cm) was provided by segments with strikes of 25° and65° (model 100908B in Table 3 and Fig. 7g–j). The two segments are∼10 km each in length, and line up end-to-end to form a kinked faultzone. The average strike of 45° is the same as that of the SE-dippingbody-wave nodal plane. Rupture depths are similar to those of thesingle-fault model, with slip still restricted to the sedimentary cover.As for the 27 November 2005 earthquake, allowing distributed-slip onthesemodel fault planes makes little difference to the depths at whichsignificant slip occurs.
Interestingly, the orientations of the northern and southernsegments are very similar to those of the SE-dipping 28 June 2006model fault (Fig. 6c–d) and the SSE-dipping 27 November 2005modelfault (Fig. 5k–l), respectively. This raises the possibility that all threeearthquakes ruptured a single, SE-dipping fault zone.
4. Discussion
4.1. Discrepancies in earthquake source parameters
All our InSAR-derived models have significantly higher momentsthan their respective body-wave models — by a factor of 2 for the 27November 2005 earthquake, a factor of 5 for the 28 June 2006earthquake and a factor of 1.5 for the 10 September 2008 earthquake.Many of the interferograms used to model these earthquakes alsoincorporate moderate magnitude aftershocks, but the combinedseismic moments of these smaller events can account for only asmall part of the moment deficits. Similar discrepancies were foundfor the Zagros earthquakes studied by Lohman and Simons (2005),with InSAR-derived moments up to six times higher than those of theGlobal CMT catalogue. The geodetic moment for the 25 March 2006Fin earthquakes was also 50% higher than the combined momentsfrom body-wave modelling (Roustaei et al., 2010).
Because the coseismic interferograms cover days, weeks or evenmonths after the earthquakes, the higher InSAR-derived momentsmay reflect post-seismic deformation or small-magnitude after-shocks. We note, for instance, that the largest discrepancy in ourstudy is for the 28 June 2006 earthquake, and that the coseismicinterferograms used to model this event also span the longest post-seismic intervals. Whatever the underlying cause of the discrepancy,however, it appears to be a systematic one, affecting all earthquakesstudied using these methods in the Simply Folded Belt.
We also found a discrepancy between the depths from elasticdislocation modelling and those from body-wave modelling. For eachearthquake, the minimum-misfit centroid depth is similar to thedepth of the bottom of the InSAR-derived fault plane, rather than thecenter of the fault plane, as might be expected. One possibility is thatthe extra moment detected using InSAR corresponds to shallowaseismic deformation (perhaps including after-slip) at the up-dip endof the fault plane. This would bring the top of the model fault planecloser to the surface, thus forcing the depth of its center to becomeshallower.
Although we used consistent seismic velocities and elasticparameters in the modelling, it is worth considering the effect thaterrors in these values would have on model depths. We found thatreducing Vp to 5.0 km s−1 — the value estimated at Ghir (Tatar et al.,2004) — reduces seismic moments by ∼20% and makes the centroiddepth shallower by ∼1 km. Reducing μ and λ by an equivalentamount, to 2.2×10¹⁰ Pa, also reduces the InSAR-derived moments by∼20%, but has no significant effect on the top and bottom fault-planedepths. An increase in Vp to 6.0 km s−1 increases seismic moments by∼10% and the centroid depths by ∼0.5 km; evalues of μ and λ(3.2×10¹⁰ Pa) increase the geodetic moments by the same amountbut again have little effect on the depth. Overall, these results suggestthat realistic errors in the seismic parameters have little influence ondifferences between body-wave and InSAR depths, contributing atmost ∼1 km to the observed discrepancies.
4.2. Relations between buried faulting and surface folding
The 28 June 2006 and 10 September 2008 earthquakes occurred onSE-dipping fault planes that project to the surface along the northernQeshm coastline. The dip-direction of the 27 November 2005earthquake is uncertain, but it may have ruptured a westerncontinuation of this same fault zone. These faults strike perpendicularto the SE-trending Laft anticline (Fig. 4a). If there were a connectionbetween slip on the faults and the growth of the overlying folds, thenthe fold axes should be parallel, rather than perpendicular, to thestrike of the faults. The Laft anticline must be decoupled from thefaulting responsible for the Qeshm earthquakes, and is presumably adetachment fold.
Dislocation modelling of the interferograms suggests that the topof the faulting in the largest earthquakes (2–3 km) is at the expectedlevels of weak, marls in the middle part of the sedimentary cover(Fig. 2). By preventing earthquake slip from reaching shallower levels,these weak layers detach faulting in the underlying Competent Groupfrom folding of the overlying strata. Similar arguments were used byRoustaei et al. (2010) for the 25March 2006 earthquakes at Fin, wherethe detachment horizon was assumed to lie in the Gurpi marls.Mishan marls are exposed at the surface in the core of the Laftanticline, and a top rupture depth of 2–3 km thus corresponds to theGurpi marls here, too.
Many authors have noted that some anticlines in the SFB arestrongly asymmetric, with steeply dipping or even overturnedsouthern limbs (e.g. Colman-Sadd, 1978; Falcon, 1969; McQuarrie,2004; Molinaro et al., 2005). These shapes are consistent with growthabove reverse faults that approach the surface, suggesting that theweak layers decoupling faulting and folding at Fin and Qeshm do solocally, rather than forming a regional d'ecollement. The SimplyFolded Belt probably encompasses a combination of detachmentfolding above weak layers in the sedimentary cover, and forced foldsabove buried reverse faults.
4.3. Relations between mainshock depths and locally-recordedmicroseismicity
From the high-quality locally-recorded aftershock data, the uppercrust at Qeshm island appears to be seismogenic to a depth of ∼20 km.
193E. Nissen et al. / Earth and Planetary Science Letters 296 (2010) 181–194
This is similar to the maximum depth of locally-recorded microseis-micity at Ghir in the central SFB (Tatar et al., 2004), though slightlyshallower than the maximum depths of ∼25 km recorded at Fin foraftershocks of the 25 March 2006 earthquakes (Roustaei et al., 2010).It is also consistent with the deepest waveform-determined centroiddepths for Mw 5–6 earthquakes in the SFB, which are 17–18 km(Talebian and Jackson, 2004).
Our InSAR-derived models for the two largest earthquakes in theQeshm island sequence are consistent with rupture of the lower partof the sedimentary cover, with bottom fault depths of 7–9 km. Thedepth to basement inferred from locally-recorded aftershock arrivaltimes is 10±2 km (Section 3.3.2). Together, these depths areconsistent with ruptures that were terminated, or at least stronglyattenuated, by the mechanically-weak Hormuz Salt formation at thebase of the sedimentary cover. Rupture in the first earthquake mustnevertheless have caused stresses in the underlying basement, thattriggered the cloud of aftershocks at depths of 10–20 km. There are anumber of possible triggering mechanisms, including loading,Coulomb stress changes, and dynamic stress transfer, but these arebeyond the scope of this study and will be investigated in anotherpaper. A similar pattern was also observed following the 25 March2006 Fin earthquakes (Roustaei et al., 2010), although stationcoverage in the Fin area was relatively poor and the aftershockdepths are consequently less well constrained than for those detectedat Qeshm. However, vertical separations of shallow, mainshockruptures and deeper aftershocks have also been observed outsidethe Simply Folded Belt — at Bam, in eastern Iran (Jackson et al., 2006;Tatar et al., 2005), and at Tottori, in Japan (Semmane et al., 2005). Inthese cases there are no known, mechanically-weak layers at depthwith which to explain the separation.
By considering regional earthquake magnitudes, we can investi-gate whether the Hormuz salt provides a significant barrier to rupturepropagation across the whole SFB, or whether this behaviourmight berestricted to Qeshm and Fin. If the whole 20 km thickness of theseismogenic layer ruptured in a single earthquake, and assuming a dipof 45°, a rupture length equal to its width (28 km), and a slip-to-length ratio of 5×10⁻⁵, one would expect an earthquake of Mw ∼7.0.But if only half the seismogenic layer was ever to rupture in a singleevent, and applying the same scaling arguments, earthquakemagnitudes should be limited to much lower values, of Mw ∼6.3.
The largest instrumentally-recorded events in the Simply FoldedBelt are the Mw 6.7 earthquakes at Ghir (10 April 1972) and Khurgu(21 March 1977). Both these earthquakes are associatedwith stronglyasymmetric anticlines, which expose otherwise rare Paleozoic strataat the surface and acrosswhich significant changes in the stratigraphiclevel and elevation are observed (Berberian, 1995). From ourearthquake scaling arguments, we interpret these as rare earthquakesthat may have ruptured through the basement–cover interface.However, apart from one other event — the Mw 6.5 Furg earthquake(10 November 1990), which ruptured the High Zagros Fault at thenorthern edge of the SFB (Walker et al., 2005)— all other earthquakesin the SFB in the last fifty years havemomentmagnitudes of≤6.2. Thissuggests that across the region, the Hormuz salt (and potentially otherweak horizons) forms an important barrier to rupture, and providesan important upper bound on themagnitudes of most reverse faultingearthquakes.
5. Conclusions
We investigated a cluster of three large earthquakes (27 November2005, 28 June 2006 and 10 September 2008) and numerous smallershocks at Qeshm island in the Zagros Simply Folded Belt. Surfacedisplacements of first earthquake are best explained by buried slip ona SSE-dipping fault, although N- or NE-dipping faults can also accountfor the observed data. Whatever the fault orientation, the top andbottom depths of the rupture surface are consistent with faulting
embedded within the competent, lower part of the sedimentary cover.However, locally-recorded aftershocks are reliably and resolvablylocated at depths of 10–20 km, and were thus concentrated withinthe underlying basement. We suggest that the vertical separation ofmainshock and aftershock reflects the regional influence of the Hormuzsalt, which forms a barrier to rupture at the base of the cover. Theposition of the 28 June 2006 earthquake in relation to this interface isless clear, but the 10 September 2008 earthquake also rupturedthe lower sedimentary cover. These later earthquakes both rupturedSE-dipping faults, possibly a north-eastern continuation of the 27November 2005 fault. The NE strike of this buried fault zone isperpendicular to the SE trend of the overlying Laft anticline, indicatingthat locally, faulting and folding must be decoupled. The top depth ofthe ruptures, at 2–3 km, suggests that this detachment occursamongst mechanically-weak marls in the middle part of the sedimen-tary cover.
Acknowledgments
This work was supported by the Natural Environmental ResearchCouncil (NERC) funding of COMET, which is part of the NationalCenter for Earth Observation (NCEO). All ENVISAT ASAR data arecopyrighted by the European Space Agency and were provided underproject AOE-621. We thank E.R. Engdahl for giving us access to hisupdated EHB catalogue, and we are grateful to Rowena Lohman andan anonymous reviewer for their constructive comments.
Appendix A. Supplementary data
Supplementary data associated with this article can be found, inthe online version, at doi:10.1016/j.epsl.2010.04.049.
References
Adams, A., Brazier, R., Nyblade, A., Rodgers, A., Al-Amri, A., 2009. Source parameters formoderate earthquakes in the Zagros Mountains with implications for the depthextent of seismicity Jun. Bull. Seismol. Soc. Am. 99, 2044–2049.
Agard, P., Omrani, J., Jolivet, L., Mouthereau, F., 2005. Convergence history across Zagros(Iran): constraints from collisional and earlier deformation Jul. Int. J. Earth Sci. 94,401–419.
Alavi, M., 2007. Structures of the Zagros fold–thrust belt in Iran Nov. Am. J. Sci. 307,1064–1095.
Allen, M.B., Armstrong, H.A., 2008. Arabia Eurasia collision and the forcing of mid-Cenozoic global cooling. Palaeogeogr. Palaeoclimatol. Palaeoecol. 265, 52–58.
Authemayou, C., Bellier, O., Chardon, D., Benedetti, L., Malekzade, Z., Claude, C.,Angeletti, B., Shabanian, E., Abbassi, M.R., 2009. Quaternary slip-rates of theKazerun and the Main Recent Faults: active strike–slip partitioning in the Zagrosfold-and-thrust belt Jul. Geophys. J. Int. 178, 524–540.
Baker, C., Jackson, J., Priestley, K., 1993. Earthquakes on the Kazerun Line in the ZagrosMountains of Iran: strike–slip faulting within a fold-and-thrust belt Oct. Geophys.J. Int. 115, 41–61.
Berberian, M., 1995. Master blind thrust faults hidden under the Zagros folds: activebasement tectonics and surface morphotectonics Jan. Tectonophysics 241,193–224.
Berberian, M., Papastamatiou, D., 1978. Khurgu (north Bandar Abbas, Iran) earthquakeof March 21, 1977: a preliminary field report and a seismotectonic discussion Apr.Bull. Seismol. Soc. Am. 68, 411–428.
Blanc, E.J.-P., Allen, M.B., Inger, S., Hassani, H., 2003. Structural styles in the ZagrosSimple Folded Zone, Iran May J. Geol. Soc. London 160, 401–412.
Colman-Sadd, S.P., 1978. Fold development in Zagros simply folded belt, SouthwestIran. Am. Assoc. Pet. Geol. Bull. 62, 984–1003.
Engdahl, E.R., van der Hilst, R.D., Buland, R., 1998. Global teleseismic earthquakerelocation from improved travel times and procedures for depth determination Jun.Bull. Seismol. Soc. Am. 88, 722–743.
Engdahl, R.E., Jackson, J.A., Myers, S.C., Bergman, E.A., Priestley, K., 2006. Relocation andassessment of seismicity in the Iran region Nov. Geophys. J. Int. 167, 761–778.
Falcon, N.L., 1969. Problems of the relationship between surface structure and deepdisplacements illustrated by the Zagros Range. Time and Place in Orogeny. SpecialPublications No. 3. Geological Society of London, pp. 9–21.
Haghipour, A., Fontugne, M., 1993. Quaternary uplift of Qeshm Island (Iran). ComptesRendus de l'Académie des Sciences 317, 419–424.
Hatzfeld, D., Tatar, M., Priestley, K., Ghafory-Ashtiany, M., 2003. Seismologicalconstraints on the crustal structure beneath the Zagros Mountain belt (Iran) Nov.Geophys. J. Int. 155, 403–410.
Hessami, K., Koyi, H.A., Talbot, C.J., 2001a. The significance of strike–slip faulting in thebasement of the Zagros fold and thrust belt. J. Pet. Geol 24, 5–28.
194 E. Nissen et al. / Earth and Planetary Science Letters 296 (2010) 181–194
Hessami, K., Koyi, H.A., Talbot, C.J., Tabasi, H., Shabanian, E., 2001b. Progressiveunconformities within an evolving foreland fold thrust belt, Zagros Mountains.J. Geol. Soc. London 158, 969–981.
Jackson, J., Bouchon, M., Fielding, E., Funning, G., Ghorashi, M., Hatzfeld, D., Nazari, H.,Parsons, B., Priestley, K., Talebian, M., Tatar, M., Walker, R., Wright, T., 2006.Seismotectonic, rupture process, and earthquake-hazard aspects of the 2003December 26 Bam, Iran, earthquake Sep. Geophys. J. Int. 166, 1270–1292.
Jackson, J., McKenzie, D., 1988. The relationship between plate motions and seismicmoment tensors, and the rates of active deformation in the Mediterranean andMiddle East Apr. Geophys. J. Int. 93, 45–73.
Jackson, J.A., 1980. Reactivation of basement faults and crustal shortening in orogenicbelts Jan. Nature 283, 343–346.
Jahani, S., Callot, J.-P., Letouzey, J., Frizon de Lamotte, D., 2009. The eastern terminationof the Zagros fold-and-thrust belt, Iran: Structures, evolution, and relationshipsbetween salt plugs, folding, and faulting. Tectonics 28, TC6004.
Jordan, T.H., Sverdrup, K.A., 1981. Teleseismic location techniques and their application toearthquake clusters in the South-Central Pacific. Bull. Seismol. Soc. Am. 71, 1105–1130.
Kent, P.E., 1979. The emergent Hormuz salt plugs of southern Iran. J. Pet. Geol 2, 117–144.Kissling, E., 1988. Geotomography with local earthquake data Nov. Rev. Geophys. 26,
659–698.Kugler, A., 1973. An interpretation of the Southwest Iran aeromagnetic survey,
unpublished 1205. Oil Service Company of Iran.Lienert, B.R., Havskov, J., 1995. Hypocenter 3.2: a computer program for locating
earthquakes locally, regionally and globally. Seisnol. Res. Lett. 26–36.Lohman, R.B., Simons, M., 2005. Locations of selected small earthquakes in the Zagros
mountains Mar. Geochem. Geophys. Geosyst. 6, Q03001.Maggi, A., Jackson, J.A., Priestley, K., Baker, C., 2000. A re-assessment of focal depth
distributions in southern Iran, the Tien Shan and northern India: do earthquakesreally occur in the continental mantle? Dec. Geophys. J. Int. 143, 629–661.
Masson, F., Chéry, J., Hatzfeld, D., Martinod, J., Vernant, P., Tavakoli, F., Ghafory-Ashtiani, M., 2005. Seismic versus aseismic deformation in Iran inferred from earthquakesand geodetic data Jan. Geophys. J. Int. 160, 217–226.
McQuarrie, N., 2004. Crustal scale geometry of the Zagros fold-thrust belt, Iran Mar.J. Struct. Geol. 26, 519–535.
McQuarrie, N., Stock, J.M., Verdel, C., Wernicke, B.P., 2003. Cenozoic evolution ofNeotethys and implications for the causes of plate motions Oct. Geophys. Res. Lett.30 (20), 2036.
Molinaro, M., Leturmy, P., Guezou, J.-C., Frizon de Lamotte, D., Eshraghi, S.A., 2005. Thestructure and kinematics of the southeastern Zagros fold-thrust belt, Iran: fromthin-skinned to thick-skinned tectonics Jun. Tectonics 24, TC3007.
Morris, P., 1977. Basement structure as suggested by aeromagnetic surveys in SW Iran.Internal report, Oil Serivce Company of Iran.
Mouthereau, F., Tensi, J., Bellahsen, N., Lacombe, O., De Boisgrollier, T., Kargar, S., 2007.Tertiary sequence of deformation in a thin-skinned/thick-skinned collision belt:the Zagros Folded Belt (Fars, Iran) Sep. Tectonics 26, TC5006.
Nissen, E., Ghorashi, M., Jackson, J., Parsons, P., Talebian, M., 2007. The 2005 QeshmIsland earthquake (Iran) — a link between buried reverse faulting and surfacefolding in the Zagros Simply Folded Belt? Oct. Geophys. J. Int. 171, 326–338.
O'Brien, C.A.E., 1957. Salt diapirism in south Persia. Geol. Mijnbouw 19, 357–376.Oveisi, B., Lavé, J., van der Beek, P., Carcaillet, J., Benedetti, L., Aubourg, C., 2009. Thick- and
thin-skinned deformation rates in the central Zagros simple folded zone (Iran)indicated by displacement of geomorphic surfaces Feb. Geophys. J. Int. 176, 627–654.
Peyret, M., Rolandone, F., Dominguez, S., Djamour, Y., Meyer, B., 2008. Source model forthe Mw 6.1, 31 March 2006, Chalan-Chulan Earthquake (Iran) from InSAR. TerraNova 20, 126–133.
Pirazzoli, P., Reyss, J.L., Fontugne, M., Haghipour, A., Hilgers, A., Kasper, H.U., Nazari, H.,Preusser, F., Radtke, U., 2004. Quaternary coral-reef terraces from Kish and QeshmIslands, Persian Gulf: new radiometric ages and tectonic implications. Quat. Int. 120,15–27.
Reyss, J.L., Pirazzoli, P.A., Haghipour, A., Hatt'e, C., Fontugne, M., 1998. Quaternarymarine terraces and tectonic uplift rates on the south coast of Iran. Geol. Soc.London Spec. Publ. 146, 225–237.
Roustaei, M., Nissen, E., Abbassi, M., Gholamzadeh, A., Ghorashi, M., Tatar, M., Yamini-Fard, F., Bergman, E., Jackson, J., Parsons, B., 2010. The 25 March 2006 Finearthquakes (Iran) — insights into the vertical extents of faulting in the ZagrosSimply Folded Belt. Geophys. J. Int. 181, 1275–1291.
Scholz, C.H., 1982. Scaling laws for large earthquakes: consequences for physicalmodels. Bull. Seismol. Soc. Am. 72, 1–14.
Semmane, F., Cotton, F., Campillo, M., 2005. The 2000 Tottori earthquake: a shallowearthquake with no surface rupture and slip properties controlled by depth Mar.J. Geophys. Res. 110 (B9), 03306.
Sherkati, S., Letouzey, J., Frizon de Lamotte, D., 2006. Central Zagros fold-thrust belt(Iran): new insights from seismic data, field observation, and sandbox modelingJul. Tectonics 25, TC4007.
Sherkati, S., Molinaro, M., Frizon de Lamotte, D., Letouzey, J., 2005. Detachment foldingin the Central and Eastern Zagros fold-belt (Iran): salt mobility, multipledetachments and late basement control Sep. J. Struct. Geol. 27, 1680–1696.
Stöcklin, J., 1968. Structural history and tectonics of Iran: a review Jul. Am. Assoc. Pet.Geol. Bull. 52, 1229–1258.
Talebian, M., 2003. Active faulting in the Zagros mountains of Iran. Ph.D. thesis,University of Cambridge.
Talebian, M., Jackson, J., 2002. Offset on the Main Recent Fault of NW Iran andimplications for the late Cenozoic tectonics of the Arabia–Eurasia collision zone.Geophys. J. Int. 150, 422–439.
Talebian, M., Jackson, J., 2004. A reappraisal of earthquake focal mechanisms and activeshortening in the Zagros mountains of Iran Mar. Geophys. J. Int. 156, 506–526.
Tatar, M., Hatzfeld, D., Ghafory-Ashtiany, M., 2004. Tectonics of the Central Zagros(Iran) deduced frommicroearthquake seismicity Feb. Geophys. J. Int. 156, 255–266.
Tatar, M., Hatzfeld, D., Moradi, A.S., Paul, A., 2005. The 2003 December 26 Bamearthquake (Iran), Mw 6.6, aftershock sequence Oct. Geophys. J. Int. 163, 90–105.
Vernant, P., Nilforoushan, F., Hatzfeld, D., Abbassi, M.R., Vigny, C., Masson, F., Nankali, H.,Martinod, J., Ashtiani, A., Bayer, R., Tavakoli, F., Chéry, J., 2004. Present-day crustaldeformation and plate kinematics in the Middle East constrained by GPSmeasurements in Iran and northern Oman Apr. Geophys. J. Int. 157, 381–398.
Walker, R.T., Andalibi, M.J., Gheitanchi, M.R., Jackson, J.A., Karegar, S., Priestley, K., 2005.Seismological and field observations from the 1990 November 6 Furg (Hormozgan)earthquake: a rare case of surface rupture in the Zagros mountains of Iran Nov.Geophys. J. Int. 163, 567–579.
Walpersdorf, A., Hatzfeld, D., Nankali, H., Tavakoli, F., Nilforoushan, F., Tatar, M.,Vernant, P., Chéry, J., Masson, F., 2006. Difference in the GPS deformation pattern ofNorth and Central Zagros (Iran) Dec. Geophys. J. Int. 167, 1077–1088.
Wright, T.J., Lu, Z., Wicks, C., 2003. Source model for theMw 6.7, 23 October 2002, NenanaMountain Earthquake (Alaska) from InSAR Sep. Geophys. Res. Lett. 30 (18), 1974.
Wright, T.J., Parsons, B.E., Jackson, J.A., Haynes, M., Fielding, E.J., England, P.C., Clarke, P.J.,1999. Source parameters of the 1 October 1995 Dinar (Turkey) earthquake fromSAR interferometry and seismic bodywave modelling Oct. Earth Planet. Sci. Lett.172, 23–37.