THE USE OF GEOTECHNICAL INSTRUMENTATION TO MONITOR GROUND ... · dolerite sill. Intact rock...
23
The Southern African Institute of Mining and Metallurgy South African Tunnelling 2012 – Lessons Learnt on Major Projects M. Kellaway, D. Taylor and G.J. Keyter Page 1 THE USE OF GEOTECHNICAL INSTRUMENTATION TO MONITOR GROUND DISPLACEMENTS DURING EXCAVATION OF THE INGULA POWER CAVERNS, FOR MODEL CALIBRATION AND DESIGN VERIFICATION PURPOSES M. Kellaway, D. Taylor and G.J. Keyter Braamhoek Consultants Joint Venture Abstract An extensive programme of geotechnical instrumentation and monitoring was carried out during construction of the Ingula hydro power caverns to validate design assumptions and monitor long term creep effects. This paper supports the use of geotechnical monitoring during construction and discusses the results compared to the predicted convergence and where the monitoring allowed for rapid assessment of problems encountered during construction. Differences between the predicted convergence and the monitoring results necessitated a review of the numerical models used for design, to ascertain the sensitivity of changes in the construction sequencing and geotechnical parameters encountered during construction on the models and derive a new set of predicted convergence. Introduction Construction of the Ingula pumped storage scheme commenced in 2004 and is due for completion in 2015. This paper focuses on construction of the main power caverns, specifically in relation to the use of geotechnical instrumentation to monitor ground displacements during excavation of the Ingula power caverns, for model calibration and design verification purposes. The Ingula powerhouse complex (see Figure 1), comprising a machine hall with 26 m span, a transformer hall with 19 m span and appurtenant busbar tunnels with 11 m diameter, 5 m diameter high pressure penstocks, 9 m diameter main access tunnel and a series of smaller adits and shafts is located at a depth of almost 400 m below ground level, under a prominent mountain ridge off the Drakensberg escarpment between the Free State and KwaZulu Natal provinces, South Africa. The machine hall, 184 m long, has a double curvature profile with a relatively low span: height ratio of 2.5 and is up to 50 m deep in the turbine pits. The adjacent transformer hall, 21 m high, is 176 m long, with a cable and pipe gallery on one side running the length of the cavern and extending another 6 m below operating floor level. Figure 1 also shows the location of main instrumentation arrays that were installed in the main caverns and adjacent tunnels as well as the intersection of a sheared dolerite dyke (green line) with the caverns at turbine floor.
Transcript of THE USE OF GEOTECHNICAL INSTRUMENTATION TO MONITOR GROUND ... · dolerite sill. Intact rock...

The Southern African Institute of Mining and Metallurgy
South African Tunnelling 2012 – Lessons Learnt on Major Projects
M. Kellaway, D. Taylor and G.J. Keyter
Page 1
THE USE OF GEOTECHNICAL INSTRUMENTATION TO
MONITOR GROUND DISPLACEMENTS DURING EXCAVATION
OF THE INGULA POWER CAVERNS, FOR MODEL
CALIBRATION AND DESIGN VERIFICATION PURPOSES
M. Kellaway, D. Taylor and G.J. Keyter
Braamhoek Consultants Joint Venture
Abstract
An extensive programme of geotechnical instrumentation and monitoring was carried
out during construction of the Ingula hydro power caverns to validate design
assumptions and monitor long term creep effects. This paper supports the use of
geotechnical monitoring during construction and discusses the results compared to the
predicted convergence and where the monitoring allowed for rapid assessment of
problems encountered during construction. Differences between the predicted
convergence and the monitoring results necessitated a review of the numerical models
used for design, to ascertain the sensitivity of changes in the construction sequencing
and geotechnical parameters encountered during construction on the models and derive
a new set of predicted convergence.
Introduction
Construction of the Ingula pumped storage scheme commenced in 2004 and is due for
completion in 2015. This paper focuses on construction of the main power caverns,
specifically in relation to the use of geotechnical instrumentation to monitor ground
displacements during excavation of the Ingula power caverns, for model calibration and
design verification purposes.
The Ingula powerhouse complex (see Figure 1), comprising a machine hall with 26 m
span, a transformer hall with 19 m span and appurtenant busbar tunnels with 11 m
diameter, 5 m diameter high pressure penstocks, 9 m diameter main access tunnel and a
series of smaller adits and shafts is located at a depth of almost 400 m below ground
level, under a prominent mountain ridge off the Drakensberg escarpment between the
Free State and KwaZulu Natal provinces, South Africa. The machine hall, 184 m long,
has a double curvature profile with a relatively low span: height ratio of 2.5 and is up to
50 m deep in the turbine pits. The adjacent transformer hall, 21 m high, is 176 m long,
with a cable and pipe gallery on one side running the length of the cavern and extending
another 6 m below operating floor level.
Figure 1 also shows the location of main instrumentation arrays that were installed in
the main caverns and adjacent tunnels as well as the intersection of a sheared dolerite
dyke (green line) with the caverns at turbine floor.

The Southern African Institute of Mining and Metallurgy
South African Tunnelling 2012 – Lessons Learnt on Major Projects
M. Kellaway, D. Taylor and G.J. Keyter
Page 2
Figure 1. Plan View of Power Cavern Complex
Geology
The Ingula power caverns were constructed in horizontally bedded siltstones,
mudstones and carbonaceous mudstones of the Volksrust Formation of the Ecca Group,
Karoo Supergroup. The power caverns are located some 25 m below a 40 m thick
dolerite sill. Intact rock properties derived from field and laboratory testing are
presented schematically in Figure 2 in relation to the powerhouse. A decreasing trend
in intact rock strength and stiffness with depth below the dolerite sill is evident. This
can be attributed to induration effects given the proximity of the sill above as well as
changes in mudrock composition with depth. The durability of mudstones at and above
cavern roof level was classified [1] as ‘good’ to ‘excellent’ and at lower elevations,
further away from the influence of the dolerite sill, as ‘poor’ to ‘fair’.
Faults in the project area generally trend E-W and ESE-WNW with a further two sets of
small displacement faults striking NW-SE and NE-SW. A sub-vertical, sheared and
faulted dolerite dyke with strike orientation NNW-SSE intersects the power caverns and
main access tunnel at an oblique angle (see Figure 1). A normal fault zone comprising
slickensided, striated joints, infilled with calcite and mylonitic material, was intersected
in access tunnels near the powerhouse with a few of these fault planes intersecting the
far eastern end of the transformer hall. A number of bedding parallel shears have also
been identified in boreholes and underground excavations in the powerhouse area and
surrounds, three of which are located in and above the machine hall crown. However,
there are no known seismically active faults in the immediate project area. The Tugela
Fault, which follows the boundary between the Kaapvaal Craton and the Namaqua
Province in this region, is located some 50 km to the south of the project area.

The Southern African Institute of Mining and Metallurgy
South African Tunnelling 2012 – Lessons Learnt on Major Projects
M. Kellaway, D. Taylor and G.J. Keyter
Page 3
Figure 2. Rock Material Properties in relation to the Ingula Power Caverns
In situ ground stress was measured in hydrofracture tests in boreholes and in a small
number of overcoring tests. The minimum horizontal stress is orientated NNW-SSE.
The major horizontal stress is greater, and the minor horizontal stress slightly lower,
than the estimated vertical overburden stress. Hydrofracture tests at cavern level gave a
horizontal / vertical stress ratio (K-ratio) of between 0.5 and 0.9 while overcoring tests
indicated a K-ratio of approximately 1.0 in the powerhouse area.
Time dependent deformation of the rock mass was noted during construction of the
access tunnels to the powerhouse [4]. Taking into account scale effects given the size
of the main power caverns compared to that of the tunnels constructed earlier, most of
this time dependent deformation in the power caverns was expected to occur within
6 months to a year following excavation down to operating floor level and for about a
year in the turbine pits after turbine floor level has been reached.
The rock mass at powerhouse level is characterized by closed joints with a resultant low
rock mass permeability. Virtually no groundwater has been encountered at cavern level
during excavation of the caverns.

The Southern African Institute of Mining and Metallurgy
South African Tunnelling 2012 – Lessons Learnt on Major Projects
M. Kellaway, D. Taylor and G.J. Keyter
Page 4
Cavern support design
Initial estimates of the support required in the Ingula power caverns were based on
precedent experience. The final support design was based on a detailed evaluation of
all available geological and geotechnical information followed by numerical modelling
using UDEC, Phase2 Version 7 and FLAC3D [5, 6]. The convergence of different
points located on the crowns and sidewalls of the main power caverns was estimated on
the basis of the results of this modelling work, for the anticipated excavation sequence
as well as specified timing of support installation [2, 3].
Instrumentation and Monitoring Design
Instrumentation arrays were installed to monitor ground displacements as well as
ground anchor loads during construction of the power caverns and adjacent excavations
with some of this instrumentation being retained after construction to monitor longer
term effects during scheme operation. The instrumentation was deemed critical for
validation of design assumptions and analyses and to timely detect unanticipated cavern
convergence and loads in ground anchorages.
Instrumentation was located based on the results of the modelling work, where areas of
concern were perceived to exist. Instrument arrays comprising multiple point borehole
extensometers (MPBX) shown in Figure 3 were located in each of the turbine pits,
being the deepest part of the cavern complex but also between the pillars of the
appurtenant 12 m diameter busbars. These arrays were complimented by rockbolt,
cable bolt and cable anchor load cells and optical convergence targets. Given the
cavern length and the geometry of the cavern crowns, an additional MPBX array and
single point MPBX’s were located in between the arrays and selected rock anchors
were instrumented to monitor actual anchor loads to provide spatial coverage and
comparison to the MPBX data.
Limits were set on cavern convergence and anchor loads in terms of so-called trigger
levels and based on the anticipated construction sequence as follows, to allow a rapid
but appropriate response to actual monitoring data:
• A baseline level on which the support design is based, with observed excavation
convergence and anchor loads falling within expected limits in line with that
predicted during design.
• A warning level, which is approached when convergence and anchor loads exceed
the baseline level.
• An alarm level, which is approached when convergence and loads exceed the
warning level.
Baseline convergence is satisfied where the measured increase in working load in an
anchor is projected not to exceed 50% of the yield capacity of the anchor on cavern
completion [5]. The warning level is reached where the anchor load is projected to
exceed 50% of the yield capacity of the anchor and the alarm level when the anchor
load is projected to surpass 62.5% of the anchor’s yield capacity on cavern completion.

The Southern African Institute of Mining and Metallurgy
South African Tunnelling 2012 – Lessons Learnt on Major Projects
M. Kellaway, D. Taylor and G.J. Keyter
Page 5
Figure 3. Multiple Point Borehole Extensometer Arrays in Power Caverns
Reading of Instrumentation during Construction
Following installation of a given instrument it was read after each blast advance until
the rapid phase of convergence had passed. Thereafter the frequency and timing of
readings was determined by the geotechnical engineer on site to provide readings at
various stages of construction, for design validation.
Tabulated data and graphical plots were generated for each instrument to allow a rapid
but detailed assessment to be carried out on a regular basis. However, given the
number of instruments installed in the power caverns and adjacent excavations, a
system to monitor the global trends was adopted to provide a high level, monthly
summary whereby two flags were assigned to each instrument installation.

The Southern African Institute of Mining and Metallurgy
South African Tunnelling 2012 – Lessons Learnt on Major Projects
M. Kellaway, D. Taylor and G.J. Keyter
Page 6
FLAG KEYRate of ConvergenceTotal Convergence
Within expected
Within expected
Within expected
Approaching warning level
Approaching warning level
Approaching warning level
Approaching alarm level
Approaching alarm level
Approaching alarm level
Stable
Creep
Blasting nearby / Accelerating
Stable
Creep
Blasting nearby / Accelerating
Stable
Creep
Blasting nearby / Accelerating
Decreasing convergence
The flag status was indicated on an instrumentation plan of the powerhouse complex as
follows:
• A first (or left) flag looking at ‘total convergence’ with a green flag designating
convergence within the baseline; an orange flag convergence approaching the
warning level; and a red flag indicating convergence approaching the alarm level.
• A second (or right) flag looking at ‘rate of convergence’ with a green flag indicating
the excavation is stabilizing; an orange flag that creep deformation is noted; a
magenta flag indicating blasting nearby; and a red flag accelerating convergence.
An extract from this summary with instrumentation flags is shown in Figure 4 for that
part of the machine hall where the dolerite dyke was intersected. This system of flags
allowed for a quick and easy, high level overview of cavern convergence and support
performance in different parts of the cavern. For example, in Figure 4, all the
instruments in the area of the dyke indicate total convergence within the baseline level
(i.e. all the ‘left flags’ are green). However, note that all the instruments on the western
side of the dyke are showing time dependent creep deformation (all the ‘right flags’ on
this side of the dyke are orange) whereas instruments on the eastern side of the dyke are
showing an excavation that is stabilizing (i.e. all the ‘right flags’ on this side of the
dyke are green).
Figure 4. Instrumentation Flags in part of the Machine Hall Cavern
Actual Cavern Convergence and Support Performance
A high level summary of selected MPBX results are presented below to demonstrate the
deformation characteristics of the machine hall (MH) and transformer hall (TH) caverns
and appurtenant main drainage gallery (MDG) complex. Results of other
instrumentation comprising load cells and optical convergence monitoring have not
been included in this paper due to the level of detail and interpretation required to
discuss the results.

The Southern African Institute of Mining and Metallurgy
South African Tunnelling 2012 – Lessons Learnt on Major Projects
M. Kellaway, D. Taylor and G.J. Keyter
Page 7
No significant stability issues, apart from those discussed below, were encountered
during cavern excavation. In comparison with the expected (i.e. modelled)
deformations at design stage, the following general statements can be made with regard
to observed displacements:
• The magnitude of measured displacements was less than that anticipated.
• Sidewall displacements were relatively greater in comparison to that observed in the
crown.
• The rate of displacements dissipated more rapidly as the excavation front became
more distant.
The total magnitude of measured displacements differed considerably at each
instrument location (see Figure 5) and required review on a case-by-case basis, for
detailed interpretation of cavern response to excavation and support sequences and
activities.
Excavation of the Cavern Crowns
The cavern crowns were excavated by driving a central top heading, at which point the
first MPBX’s were installed. The side headings were then removed using a staggered
approach to allow the primary cable bolt installation to take place at between 10 to 15 m
behind the advancing excavation face. MPBX’s were installed in the side headings as
the staggered excavation faces reached the required position. Upon completion of the
top heading, secondary support cable anchors were installed with weldmesh reinforced
shotcrete.
Between 50 and 90% of the total displacement recorded by MPBX’s installed in the
cavern crowns had occurred during the excavation increment in which they were
installed and the immediately adjacent excavation increment as can be seen in Figure 6.
MPBX’s installed in the MH crown generally recorded similar displacements during the
side top heading excavation with some exceptions being explained by the presence of
particular geological conditions.
Slightly higher displacements associated with MPBX E3 (almost double that of other
crown MPBX’s) can be attributed to the presence of the sheared dolerite dyke and
associated shears and joints above the crown at this location.
Localised overbreak along a shear bedding plane developed rapidly whilst excavating
one of the MH side headings [3]. This led locally to overbreak of more than 2 m
beyond the theoretical excavation line. Increases in anchor loads were noted in load
cells in the affected area and a jump in convergence was noted in nearby MPBX E6 in
the cavern crown. By then, cracking of shotcrete developed in the ‘brow’ in the roof as
shown in Figure 7. The displacement was successfully arrested by halting the
excavation, reviewing instrumentation data, exploratory drilling to confirm the ground
conditions above the crown, bringing forward the installation of secondary support and
re-establishing the crown profile with backfill shotcrete. Excavation was restarted and
the monitoring frequency was increased to check the adequacy or otherwise of the
above remedial measures.

The Southern African Institute of Mining and Metallurgy
South African Tunnelling 2012 – Lessons Learnt on Major Projects
M. Kellaway, D. Taylor and G.J. Keyter
Page 8
(a) Machine Hall, Units 3&4 – MPBX Array E6
(b) Transformer Hall, Units 1&2 – MPBX Array E2
Figure 5. Measured Convergence versus Time

The Southern African Institute of Mining and Metallurgy
South African Tunnelling 2012 – Lessons Learnt on Major Projects
M. Kellaway, D. Taylor and G.J. Keyter
Page 9
(a) Machine Hall Crown MPBX’s, EL 1213.50 m
(b) Machine Hall Side Headings MPBX’s, EL 1210.50 m
(c) Machine Hall Side Heading MPBX’s, EL 1208.3 m
Figure 6: Cumulative Displacement of MPBX’s installed in MH Crown

The Southern African Institute of Mining and Metallurgy
South African Tunnelling 2012 – Lessons Learnt on Major Projects
M. Kellaway, D. Taylor and G.J. Keyter
Page 10
Theoretical excavation line
As-built profile
Extent of cracked shotcrete
Bedding shear
Figure 7: Localised Overbreak along Shear Bedding in MH Cavern Crown
Excavation of the Cavern Benches
Following completion of the cavern crowns, further excavation of the power caverns
was carried out bench-by-bench (see Figure 3) with vertical lifts not greater than 6 m
and by excavating a central heading leaving a “rock buttress” against the sides prior to
slashing out the sides. However, for Bench 3 of the MH and Bench 2 of the TH, the
bench was excavated in two parts without a central heading. No significant stability
issues were encountered during the excavation despite persistent over-excavation of the
sidewall profile which subsequently had to be reinstated to the design profile by
application of additional shotcrete.
The relatively larger displacement of MPBX MH E6-N5 is considered to be associated
with poorer rock mass quality in the vicinity of the cross-cutting dolerite dyke (see
Figure 1) and the removal of a large, blast damaged rock buttress between Valve Pits 3
and 4.
The dramatic increase in displacement in MPBX TH E2-N5 occurred as a result of
exposing an unfavourable joint in the pillar between Busbars 1 and 2. Based on the
instrumentation results and the occurrence of geological overbreak along this joint, the
excavation was halted and the installation of primary support cable bolts was brought
forward to stabilise the pillar. This sidewall wedge / block reacted to a lesser extent
when the excavation recommenced but was completely stabilised by later installation of
the secondary support cable anchors.

The Southern African Institute of Mining and Metallurgy
South African Tunnelling 2012 – Lessons Learnt on Major Projects
M. Kellaway, D. Taylor and G.J. Keyter
Page 11
(a) Machine Hall Crane Beam MPBX’s, EL 1203.3 m
(b) Machine Hall Sidewall MPBX’s
Figure 8. Cumulative Displacement of MPBX’s installed in MH Sidewalls
Excavation of the Main Drainage Gallery Complex (MDG)
The bulk of the MDG complex (stairs access tunnels, main drainage sump, oil handling
room and exhaust chambers) located below and immediately to the north of the
machine hall was excavated prior to the excavation of the machine hall. The design of
support for the MDG therefore had to take into consideration the effects of stress
redistribution in the surrounding rock mass as the machine hall excavation proceeded
downwards. Initial support of the mudstones exposed in these excavation only
comprised a flash coat of shotcrete to seal the rock followed by installation of rockbolts
and mesh; this was followed later, on cavern completion, by installation of additional
rockbolts and a more rigid, shotcrete lining. Cracks were noted in the MDG shotcrete
lining as a result of stress induced changes during excavation of the machine hall;
however, the situation was exacerbated by installation of defective support which later
had to be replaced.

The Southern African Institute of Mining and Metallurgy
South African Tunnelling 2012 – Lessons Learnt on Major Projects
M. Kellaway, D. Taylor and G.J. Keyter
Page 12
MPBX’s installed in the Stair Access Tunnels (SAT) immediately below the base of the
machine hall exhibited rapid displacement as the invert of the machine hall heaved
during the downward excavation; some reaching the limit of travel, others being
destroyed when intercepted by the excavation as shown in Figure 9. However,
relatively small displacements were seen in the other MDG complex tunnels that were
not directly below the machine hall.
Interestingly, the invert MDG MPBX’s exhibited much more reaction than the crown.
Being the lowest tunnel in the powerhouse, the invert was frequently flooded and with
the passing of heavy plant, the invert (MDG E2, Figure 9) exhibited rapid heave until it
was protected by placement of blinding concrete. MDG E3 also exhibited relatively
large shallow movements, again with some concerns due to the invert not being
protected, but also clearly in reaction to the deepening of the machine hall.
Back-Analysis and Remodelling
The Phase2 models set up during detailed design of the Ingula power cavern excavation
and support were revised towards the end of excavation of the main power caverns to:
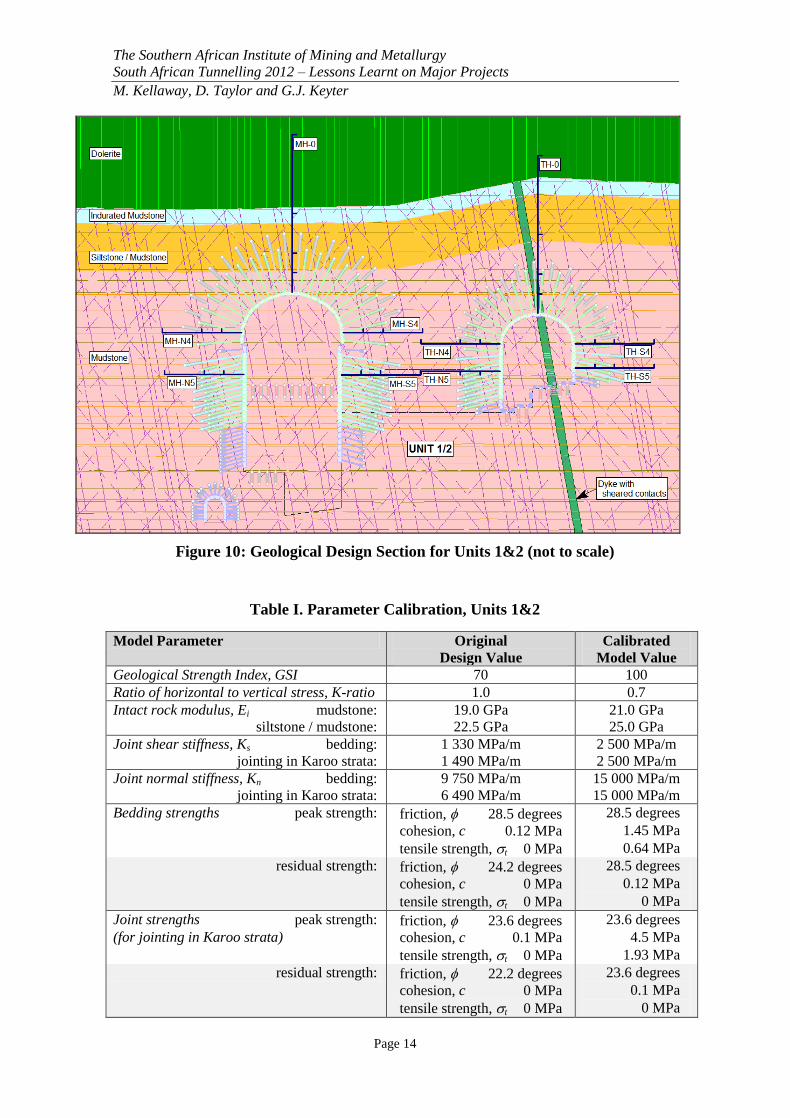
• Better reflect the actual geology encountered in Units 1&2 (Figure 10) and
Units 3&4 along the installed instrumentation arrays, including modelling of the
dyke with sheared contacts which intersects both Ingula power caverns at an oblique
angle.
• The model staging (or excavation and support sequencing) of these Phase2 base
models were revised to simulate the actual excavation and support installation
sequence followed during cavern construction.
• Recalibration of the Phase2 models, taking into account available instrumentation
and convergence monitoring data collected during cavern excavation.
The model calibration was carried out using the Phase2 model for the design section
through Units 1&2 with a ‘best fit’ model convergence, compared to actual cavern
convergence measured during construction, obtained by implementing the parameter
changes listed in I. The MPBXs used for the purposes of this model calibration are
shown schematically in Figure 10.
The changes in bedding and joint strengths for jointing in Karoo strata as outlined in
Table I followed from a consideration of bedding and joint persistence based on
available joint mapping information from the area of the Ingula power caverns. These
open bedding planes and joints are not continuous in the direction of dip as can be seen
in the diagram presented in Figure 10, with small ‘rock bridges’ comprising intact rock
evident between the ends of adjacent discontinuity planes as well as undulations in
bedding planes and joints, all of which will require shearing of intact rock during shear
movements on these discontinuities.

The Southern African Institute of Mining and Metallurgy
South African Tunnelling 2012 – Lessons Learnt on Major Projects
M. Kellaway, D. Taylor and G.J. Keyter
Page 13
(a) Main Drainage Gallery Complex, Crown MPBX’s
(b) Main Drainage Gallery Complex, Invert MPBX’s
Figure 9. MDG Complex Displacement during MH Excavation
The Southern African Institute of Mining and Metallurgy
South African Tunnelling 2012 – Lessons Learnt on Major Projects
M. Kellaway, D. Taylor and G.J. Keyter
Page 14
Figure 10: Geological Design Section for Units 1&2 (not to scale)
Table I. Parameter Calibration, Units 1&2
Model Parameter Original
Design Value
Calibrated
Model Value
Geological Strength Index, GSI 70 100
Ratio of horizontal to vertical stress, K-ratio 1.0 0.7
Intact rock modulus, Ei mudstone:
siltstone / mudstone:
19.0 GPa
22.5 GPa
21.0 GPa
25.0 GPa
Joint shear stiffness, Ks bedding:
jointing in Karoo strata:
1 330 MPa/m
1 490 MPa/m
2 500 MPa/m
2 500 MPa/m
Joint normal stiffness, Kn bedding:
jointing in Karoo strata:
9 750 MPa/m
6 490 MPa/m
15 000 MPa/m
15 000 MPa/m
Bedding strengths peak strength:
friction, 28.5 degrees
cohesion, c 0.12 MPa
tensile strength, t 0 MPa
28.5 degrees
1.45 MPa
0.64 MPa
residual strength: friction, 24.2 degrees
cohesion, c 0 MPa
tensile strength, t 0 MPa
28.5 degrees
0.12 MPa
0 MPa
Joint strengths peak strength:
(for jointing in Karoo strata) friction, 23.6 degrees
cohesion, c 0.1 MPa
tensile strength, t 0 MPa
23.6 degrees
4.5 MPa
1.93 MPa
residual strength: friction, 22.2 degrees
cohesion, c 0 MPa
tensile strength, t 0 MPa
23.6 degrees
0.1 MPa
0 MPa

The Southern African Institute of Mining and Metallurgy
South African Tunnelling 2012 – Lessons Learnt on Major Projects
M. Kellaway, D. Taylor and G.J. Keyter
Page 15
In the case of open bedding planes, such ‘intact rock bridges’ have been estimated to
constitute approximately 5% of what would otherwise have been a throughgoing
bedding plane. In case of joints which are less persistent than bedding planes, intact
rock bridging in the plane increases to about 15%. For model calibration, it was
assumed that the same percentage of rock bridges will also exist in the strike direction
of bedding planes and joints.
The above adjustment in bedding and joint strengths countered the effect of infinitely
long bedding planes and joints along strike in the two-dimensional (2D) Phase2 models.
Without this adjustment, very large rock wedges formed / mobilised in the cavern
crowns and sidewalls in the models. By including this adjustment, the size of rock
wedges forming in the cavern crowns and sidewalls of the models reduced to that of
typical rock wedges which were identified in the cavern crown ([3], also see discussion
above) and sidewalls during construction.
The installation of the various MPBX’s relative to the actual excavation and support
sequence was also taken into account in the calibration process.
The calibrated parameters listed in Table I were then also used in the Phase2 model for
the design section through Units 3&4.
Table II gives a brief comparison of actual crown and sidewall convergence measured
up to the end of construction of the Ingula caverns, with that obtained from the
calibrated Phase2 models. The colour scheme adopted in Table II gives an indication of
the extent of deviation between actual measurements and modelled values. Red shaded
values indicate that measured convergence exceeds modelled convergence at a location;
blue shaded values indicate that modelled convergence exceeds measured convergence.
The darker the shading, the larger the deviation. The modelled results are generally
within 5 to 10 mm from the measured values, with deviations larger than this only
noted at two MPBX locations as follows:
Units 1&2, MPBX TH-S5: Jointing in the southern sidewall of the transformer hall
formed a wedge in the Phase2 model whereas no such sidewall wedge was
identified at this location in the transformer hall underground. Both Phase2 models
appear to overestimate convergence of the southern sidewall in the transformer hall
to some extent but generally not excessively so.
Units 3&4, MPBX MH-N5: A large wedge which formed between the dolerite
dyke and the northern sidewall of the machine hall resulted in measured
convergence of approximately 25 mm at this location underground. The Phase2
model did not give the same amount of deformation for this location. The way the
dolerite dyke was modelled in the calibrated Phase2 model in all likelihood does
not accurately enough reflect the actual dyke geometry underground, resulting in a
more stable sidewall in the Phase2 model.

The Southern African Institute of Mining and Metallurgy
South African Tunnelling 2012 – Lessons Learnt on Major Projects
M. Kellaway, D. Taylor and G.J. Keyter
Page 16
Table II. Model versus Actual Crown and Sidewall Convergence
MPBX
No.
MPBX Location Convergence at Units 1&2 Convergence at Units 3&4
Actual
(mm)
Modelled
(mm)
Actual
(mm)
Modelled
(mm)
MH-0 MH crown, on centreline 11.1 11.7 11.5 11.7
MH-N4 Northern top heading of MH,
just above crane beam level
11.7 10.0 7.7 18.4
MH-S4 Southern top heading of MH,
just above crane beam level
8.6 5.0 9.1 3.3
MH-N5 A few metres above the
operating floor level on
northern MH sidewall
9.2 3.3 24.7 1.6
MH-S5 A few metres above the
operating floor level on
southern MH sidewall
19.9 10.0 15.5 5.0
TH-0 TH crown, on centreline 12.2 13.3 12.1 10.0
TH-N4 Northern sidewall of TH, at
spring line level
12.3 20.0 7.1 11.7
TH-S4 Southern sidewall of TH, at
spring line level
9.7 15.0 3.1 11.6
TH-N5 A few metres above the
operating floor level on the
northern TH sidewall
48.2 41.7 7.1 6.7
TH-S5 A few metres above the
operating floor level on the
southern TH sidewall
2.6 23.3 1.7 6.7
Actual MPBX measurements for the five MPBX installations highlighted by dark
outline in Table II are compared in more detail in Figure 11, graphed against
construction sequence.
As can be seen from these graphs, some of the Phase2 model convergence results give
an almost exact replica of actual convergence observed during construction. In other
instances, the general trend of movements / convergence between the Phase2 model and
what was observed underground is similar but the end values are different.
It is clear from this calibration exercise that the existence of local rock wedges in the
cavern crown and / or sidewalls at the point of measurement – whether in the Phase2
model or in the actual cavern underground – have a significant effect on the total
convergence noted at that location. Typically, where we have a rock wedge both
underground and in the model, the comparison is good. The same can be said where a
rock wedge is absent in both cases. However, where we have a rock wedge in one but
not in the other, the difference in convergence is significant, with the convergence in
the one with a rock wedge typically about twice that of the one without the rock wedge.

The Southern African Institute of Mining and Metallurgy
South African Tunnelling 2012 – Lessons Learnt on Major Projects
M. Kellaway, D. Taylor and G.J. Keyter
Page 17
(a) MH Crown Centre Line,
Units 1&2 – MPBX MH-0
(b) MH Side Heading Above Crane Beam Level,
Units 3&4 – MPBX MH-N4
(c) MH Sidewall Above Operating Floor Level,
Units 1&2 – MPBX MH-S5
(d) TH Crown Centre Line,
Units 1&2 – MPBX TH-0
(e) TH Sidewall above Operating Floor Level,
Units 1&2 – MPBX TH-N5
Figure 11: Actual versus Remodelled Convergence for select MPBX’s
With reference to Table II both Phase2 models appear to somewhat underestimate
sidewall convergence in the machine hall (more red shading) while generally
overestimating sidewall convergence in the transformer hall (more blue shading).
Crown convergence on centreline in both caverns is well reproduced by the Phase2
models.
Nonetheless, despite these differences, the above calibration was considered sufficiently
representative of actual convergence measured in the Ingula caverns to allow
construction defects to be modelled and the impact of such defects on long term cavern
convergence and stability to be assessed.

The Southern African Institute of Mining and Metallurgy
South African Tunnelling 2012 – Lessons Learnt on Major Projects
M. Kellaway, D. Taylor and G.J. Keyter
Page 18
Construction Defects [8]
Defect 1: Invert Floor Dowels
Galvanised invert floor dowels were installed during construction instead of double
corrosion protected invert floor dowels as was specified in the cavern design. Potential
floor heave long term in case of significant corrosion of these floor dowels was a
concern given this construction deviation [7].
The invert floor dowels were included in the original design to counter significant floor
heave during construction as well as to reinforce these excavation inverts during
construction against traffic loading effects which may result in loosening of the rock
mass below the excavated invert prior to casting final concrete floor slabs.
The potential effects of this construction defect were investigated by removing all the
floor dowels installed in the erection bay floor and MIV pit floor in the machine hall as
well as all the floor dowels in the transformer hall at the end of construction using the
calibrated Phase2 models. The results of this modelling work is summarised in
Table III.
Table III. Floor Heave in Phase2 Models on Invert Dowel Removal
Location
Additional Vertical Displacement (mm)
Units 1&2 Units 3&4
MH operating floor / erection bay floor < 0.8 mm no change
MH MIV pit floor no change no change
TH operating floor < 0.8 mm no change
TH cable & pipe gallery invert < 0.8 mm < 0.8 mm
The modelling results showed that these invert floor dowels have very little effect long
term given that floor heave generally will already have occurred by the time these floor
dowels have corroded away - either initially, during construction, or later on as a result
of longer term creep deformations which are generally expected to only last about
6 months to one year after excavation of the turbine pits have been completed [4].
The installation of galvanised floor dowels in the Ingula power cavern inverts instead of
double corrosion protected floor dowels as was specified in the design, will therefore
have no significant impact on the long term stability of structural foundations and / or
relative settlement (or heave) of final concrete floors at erection bay level in the
machine hall or at operating floor level in the transformer hall.
Defect 2: Cable Anchor Hole Deviation
Significant drill hole deviations were noted during construction of the Ingula caverns,
specifically during excavation and support of the northern sidewall of the machine hall,
with cable bolt holes having deflected into the penstock tunnels immediately upstream
of the cavern [7]. Survey of a subsequent check hole suggested that such deviation was
in all likelihood a widespread occurrence during general installation of long anchors in
the Ingula caverns.

The Southern African Institute of Mining and Metallurgy
South African Tunnelling 2012 – Lessons Learnt on Major Projects
M. Kellaway, D. Taylor and G.J. Keyter
Page 19
Drill hole deviations noted generally occurred as a result of: (a) incorrect setting-up
resulting in holes being drilled at incorrect angles to start off with; and (b) deviation
from the start inclination due to poor drilling control and / or anchorage of drill rigs.
Potential damage to double corrosion protection provided in the end anchorages of
permanent anchors may have resulted due to the following:
• Anchor holes being drilled deviating into end anchorages of adjacent cable anchors
already installed, damaging corrosion protection and, possibly, cables in end
anchorages.
• Inadequate corrosion protection due to fixed length tendons not being located
centrally in the grout filled hole.
• Damage to plastic sheathing as a result of anchors being pushed down spiralling
holes, etc.
These construction deviations may result in long term corrosion of individual
anchorages with potential instability of the cavern crown or sidewall being cause for
concern given this construction deviation [7].
All permanent cable anchors installed in the Ingula power caverns passed the specified
acceptance tests in accordance with the requirements of BS 8081 [9], [7]. However,
these acceptance tests were carried out on horizontal rows of installed cable anchors
before drilling of the next horizontal row of anchors to be installed below the anchor
row being tested. A successful acceptance test as such therefore does not provide a
complete guarantee that an anchorage is still in good working order given that drilling
damage to that anchorage, where it has occurred, will have happened after acceptance
testing of the anchor. Successful acceptance test results do however indicate that,
where cable anchors have not been damaged as a result of drill holes deviating into
adjacent anchorages, the load capacity of such anchorages have been proven beyond
any doubt.
Installing cable anchors at angles with the horizontal steeper than what was specified in
the design will have resulted in a reduction in the overall support system capacity. The
risk in this case being that larger key blocks and sidewall wedges will not be as well
retained as would have been the case had the design been executed accurately.
Effective fixed anchorage lengths beyond the critical failure plane will be reduced in
affected permanent cable anchors, resulting in reduced factors of safety for anchorages
thus affected. The extent to which these overall factors of safety have been reduced,
cannot be quantified given a lack of relevant construction data. Mitigation against the
increased residual risk profile in these cavern excavations can only be achieved by
maintaining cavern instrumentation and monitoring installations for the design life of
the scheme, to continue monitoring the stability of the caverns, with appropriate
remedial support to be installed should cavern crown or sidewall instability in whatever
form present itself in the long term.

The Southern African Institute of Mining and Metallurgy
South African Tunnelling 2012 – Lessons Learnt on Major Projects
M. Kellaway, D. Taylor and G.J. Keyter
Page 20
Damaged anchorages were modelled in the calibrated Phase2 model by staged removal
of cable anchors, to assess the potential impact this may have on excavation behaviour.
In the Phase2 model for Units 1&2, staged removal of anchors resulted in a steady
increase in convergence, with most convergence occurring in the transformer sidewalls
as well as at crane beam level in the southern sidewall of the machine hall. However,
removal of a single permanent cable anchor in the northern sidewall of the transformer
hall in the Phase2 model for Units 3&4 resulted in mobilisation of a large sidewall
wedge, also causing two adjacent cable anchors retaining the wedge to fail in tension.
The Phase2 model run did not converge for this stage – that is, the transformer hall
excavation was thereafter not stable anymore.
The Phase2 modelling results confirm what is to be expected, namely that:
• Long term yield failure of some damaged cable anchors may have little impact on
the stability of the cavern excavation, with rock loads being shed to adjacent
anchors as damaged anchors yield and fail.
• However, long term yield failure of a damaged anchor installed at a critical location,
may result in mobilisation of a large key block or wedge in the cavern roof or
sidewall, while working loads in adjacent anchors may already be so high that the
shedding of additional rock loads to such adjacent anchors may simply result in
progressive failure of these already overloaded anchors.
As in the case of anchor holes which have been drilled at incorrect angles, the extent to
which overall factors of safety will reduce long term as damaged anchorages yield or
fail, either (1) as a result of corrosion due to damage to plastic sheaths and / or
(2) overloading or fatigue of damaged cable strands, cannot be quantified given a lack
of relevant construction data. Mitigation against the increased residual risk profile in
these cavern excavations can only be achieved by maintaining cavern instrumentation
and monitoring installations for the design life of the scheme, to continue monitoring
the stability of the caverns, with appropriate remedial support to be installed should
cavern crown or sidewall instability in whatever form present itself in the long term.
Any such remedial work and associated costs which may be required long term will in
all likelihood impact on operation of the Ingula scheme and on associated financial
revenues.
As in the case of anchor holes which have been drilled at incorrect angles, the extent to
which overall factors of safety will reduce long term as damaged anchorages yield or
fail, either (1) as a result of corrosion due to damage to plastic sheaths and / or
(2) overloading or fatigue of damaged cable strands, cannot be quantified given a lack
of relevant construction data.
Mitigation against the increased residual risk profile in these cavern excavations can
only be achieved by maintaining cavern instrumentation and monitoring installations
for the design life of the scheme, to continue monitoring the stability of the caverns.
Appropriate methods of remediation, if required long term, are still being investigated
to further mitigate any risks in this regard.

The Southern African Institute of Mining and Metallurgy
South African Tunnelling 2012 – Lessons Learnt on Major Projects
M. Kellaway, D. Taylor and G.J. Keyter
Page 21
Conclusions
An extensive programme of geotechnical instrumentation and monitoring was carried
out during construction of the Ingula hydro power caverns, to validate design
assumptions and monitor long term creep effects.
Key aspects of instrumentation and monitoring work carried out during excavation of
the Ingula caverns have been presented and actual convergence data and support
performance discussed. Regular reading of monitoring instruments during construction
allowed for rapid assessment of problems encountered during cavern excavation.
Differences between predicted convergence at design stage and monitoring results and
measurements during construction necessitated a recalibration of numerical models
used for design, to assess the sensitivity of changes in the construction sequencing and
geotechnical parameters encountered during construction on the models and derive a
new set of predicted convergence.
Finally, these calibrated numerical models were used to model specific construction
defects, to allow an assessment of the impact of such defects on long term cavern
convergence and stability.
Acknowledgements
This paper could not have been published without permission from the client, ESKOM,
and the support of the Braamhoek Consultants Joint Venture (BCJV). The monitoring
results presented in this paper are based on regular readings of instruments and
presentation of data as prepared by the Contractor for construction of the Main
Underground Works, CMI JV, as submitted to the BCJV site supervision team.
References
1. OLIVIER, H.J. A new engineering-geological rock durability classification, Engineering
Geology 14 (1979), 255–279.
2. KEYTER, G.J. and KELLAWAY, M. Instrumentation and monitoring during construction of
the Ingula powerhouse caverns, The Ingula Pumped Storage Scheme, SANCOT 2010
Symposium, Royal Hotel, Ladysmith, South Africa.
3. KEYTER, G.J., KELLAWAY, M. AND TAYLOR, D. Instrumentation and monitoring during
construction of the Ingula power caverns, Proceedings, 15th
African Regional Conference on
Soil Mechanics and Geotechnical Engineering, C. Quadros and S. W. Jacobsz (Eds), Maputo,
Mozambique, 2011.
4. KEYTER, G.J., RIDGWAY, M. and VARLEY, P.M. Rock engineering aspects of the Ingula
powerhouse caverns, 6th International Symposium on Ground Support in Mining and Civil
Engineering Construction, SAIMM (2008), 409-445.
5. KEYTER, G.J. and VARLEY, P.M. Design of the Ingula powerhouse caverns: General design
considerations, SANCOT Seminar, SAIMM, Ladysmith, South Africa, 2008.
6. KEYTER, G.J. and VARLEY, P.M. Ingula pumped storage scheme: Excavation and support of
the main powerhouse caverns, Braamhoek Consultants Joint Venture, Construction design
brief - Main Underground Works, 2010.

The Southern African Institute of Mining and Metallurgy
South African Tunnelling 2012 – Lessons Learnt on Major Projects
M. Kellaway, D. Taylor and G.J. Keyter
Page 22
7. TAYLOR, D. MH & TH, Acceptance of Defects, Confidential project communications, 2012.
8. KEYTER, G.J. Phase2 modelling results for acceptance of construction defects in the Ingula
power caverns, GeoStable SA Report No. GS0088/2 rev 00, 2012.
9. Civil Engineering and Building Structures Standards Policy Committee, British Standard Code
of Practice for Ground Anchorages, British Standards Institution, London, 1989.

The Southern African Institute of Mining and Metallurgy
South African Tunnelling 2012 – Lessons Learnt on Major Projects
M. Kellaway, D. Taylor and G.J. Keyter
Page 23
PRESENTER’S DETAILS
Full Name: GERHARDUS JOHANNES KEYTER
Company: GeoStable SA
Designation: Geotechnical Engineer
Qualifications: B Eng (Civil), University of Pretoria, South Africa
MSc DIC (Soil Mechanics), Imperial College of Science
Technology and Medicine, London, UK
SHORT HISTORY OF PREVIOUS EXPERIENCE:
Gerhard Keyter has specialised in geotechnical engineering in civil engineering and
mining. He has been involved in the design of open pit mines and other surface
excavations as well as underground mining over the past 18 years and has spent 6 years
working on the design and construction of the underground works of ESKOM’s Ingula
Pumped Storage Scheme. He is co-founder of the firm GeoStable SA and has been
working as an independent consultant in the civil geotechnical and mining engineering
fields since mid-2009.


![Review on Rockburst Theory and Types of Rock Support in ... · planes of weakness and fracture of the intact rock itself (strain burst), usually close to excavation boundaries [5].](https://static.fdocuments.in/doc/165x107/5e6d3ee29b3c78680241855f/review-on-rockburst-theory-and-types-of-rock-support-in-planes-of-weakness-and.jpg)