NORMAN I. NoIuIsH ROCK STRENGTH PROPERTIES...
19
LChapter 14 DUNCAN C. WYLLIE AND NORMAN I. NoIuIsH ROCK STRENGTH PROPERTIES AMD THEIR MEASUREMENT 1. INTRODUCTION T he shear strength developed along potential rupture surfaces within a slope has an impor- tant influence on the stability of rock slopes. In carrying Out stability analyses, it is usually assumed that the rock behaves as a Mohr-Coulomb material in which the shear strength is expressed in terms of the cohesion and friction angle along the rupture surface. The actual values of these two strength parameters are closely related to the geological con- ditions at each site, and any program to determine rock strength should start with a thorough exami- nation of the geology. In this chapter the relation- ship between geology and rock strength is discussed, and methods are described that are used to deter- mine shear strength values. The relationship between the strength of sam- ples that can be tested in the laboratory and the strength of the rock mass is particularly important in determining design strength values for stability analysis. Rock mass is the term used to describe the material along the rupture surface. The rock mass may consist of a continuous fracture, a combina- tion of intact rock and fractures, or solely intact rock. It is rarely possible to test the rock mass in the laboratory because of difficulty iii obtaining a large, undisturbed sample, and there are few machines available with the required load capac- ity. Therefore it is necessary to use a combination of laboratory testing of small samples, eFnpirical analysis, and field observations to determine a strength value, or range of values, that is represen- tative of the rock mass on the rupture surface. 1.1 Examples of Rock Masses Figures 14-1 through 14-4 show four different geo- logical conditions that are commonly encoun- tered in the design and analysis of rock slopes. These are typical examples of rock masses in which the strength of laboratory-size samples may differ significantly from the shear strength along the overall rupture surface. In all four cases, insta- bility occurs as a result of shear movement along a rupture surface that either lies along an existing fracture or passes partially or entirely through intact rock. Figures 14-1 through 14-4 also show that in fractured rock the shape of the rupture sur- face is influenced by the orientation and length of the discontinuities. Figure 14-1 shows a strong, massive sandstone containing a set of continuous bedding surfaces that dip out of the slope face. Because the near- vertical cut face is steeper than the dip of the bedding, the bedding surfaces are exposed, or day- light, on the face and sliding has occurred, with a tension crack opening along the subvertical, orthogonal joint set. Under these circumstances the shear strength used in stability analysis is that of the bedding surfaces. The strength properties of fracture surfaces are discussed in Section 2 and methods of measuring the friction angle in the laboratory are discussed in Section 3. 372
Transcript of NORMAN I. NoIuIsH ROCK STRENGTH PROPERTIES...

LChapter 14 DUNCAN C. WYLLIE AND
NORMAN I. NoIuIsH
ROCK STRENGTH PROPERTIES AMD THEIR MEASUREMENT
1. INTRODUCTION
T he shear strength developed along potential rupture surfaces within a slope has an impor-
tant influence on the stability of rock slopes. In carrying Out stability analyses, it is usually assumed that the rock behaves as a Mohr-Coulomb material in which the shear strength is expressed in terms of the cohesion and friction angle along the rupture surface. The actual values of these two strength parameters are closely related to the geological con-ditions at each site, and any program to determine rock strength should start with a thorough exami-nation of the geology. In this chapter the relation-ship between geology and rock strength is discussed, and methods are described that are used to deter-mine shear strength values.
The relationship between the strength of sam-ples that can be tested in the laboratory and the strength of the rock mass is particularly important in determining design strength values for stability analysis. Rock mass is the term used to describe the material along the rupture surface. The rock mass may consist of a continuous fracture, a combina-tion of intact rock and fractures, or solely intact rock. It is rarely possible to test the rock mass in the laboratory because of difficulty iii obtaining a large, undisturbed sample, and there are few machines available with the required load capac-ity. Therefore it is necessary to use a combination of laboratory testing of small samples, eFnpirical analysis, and field observations to determine a
strength value, or range of values, that is represen-tative of the rock mass on the rupture surface.
1.1 Examples of Rock Masses
Figures 14-1 through 14-4 show four different geo-logical conditions that are commonly encoun-tered in the design and analysis of rock slopes. These are typical examples of rock masses in which the strength of laboratory-size samples may differ significantly from the shear strength along the overall rupture surface. In all four cases, insta-bility occurs as a result of shear movement along a rupture surface that either lies along an existing fracture or passes partially or entirely through intact rock. Figures 14-1 through 14-4 also show that in fractured rock the shape of the rupture sur-face is influenced by the orientation and length of the discontinuities.
Figure 14-1 shows a strong, massive sandstone containing a set of continuous bedding surfaces that dip out of the slope face. Because the near-vertical cut face is steeper than the dip of the bedding, the bedding surfaces are exposed, or day-light, on the face and sliding has occurred, with a tension crack opening along the subvertical, orthogonal joint set. Under these circumstances the shear strength used in stability analysis is that of the bedding surfaces. The strength properties of fracture surfaces are discussed in Section 2 and methods of measuring the friction angle in the laboratory are discussed in Section 3.
372
Rock Strength Properties and Their Measurement
373
Figure 14-2 shows a slope cut in a strong but closely jointed columnar basalt containing a sub-horizontal joint set and numerous vertical joints. Because the joint sets are discontinuous, no single joint controls the stability of the slope. However, if a rupture surface were to develop in this slope, it would follow a stepped path that would partly lie along fracture surfaces and partly pass through intact rock. The shear strength of this complex rupture surface cannot be determined analytically, so a set of empirical equations has been developed from which the cohesion and friction angle can be calculated with respect to the degree of fracturing and the rock strength. This procedure is described in Section 4.
Figure 14-3 shows a slope cut in a weathered rock in which the degree of weathering varies from residual soil in the upper part of the slope to slightly weathered rock near the toe. For these conditions, the rupture surface lies predominantly in the weaker materials in the upper part of the slope, and in the stability analysis it is necessary to use different strength parameters for the upper
and lower portions of the rupture surface. Because the degree of degradation of weathered rock tends to be highly variable, the strength of the rock mass is also variable and can be difficult to deter-mine. Consequently, a means of determining the strength of weathered rock is to carry out a back analysis of slopes in similar material; this approach is described in Section 4.
A fourth geological condition that may be encountered is that of a very weak but intact rock containing essentially no fractures. Figure 14-4 shows a cut face in tuff, a rock formed by the con-solidation of volcanic ash. The photograph shows that a geological hammer can be embedded in the face easily, indicating the low strength of this rock. However, because the rock contains no frac-tures, it has a significant cohesive strength in addi-tion to a moderate friction angle. Therefore, it was possible to cut a stable, vertical face to a height of
FIGURE 14-1 (far left) Planar failure on continuous bedding surface dipping out of slope face.
FIGURE 14-2 (left) Shallow circular failure in closely jointed rock mass.

374
Landslides: Investigation and Mitigation
at least 10 m in this material, prc)vided water pres-sures and erosion were controlled. Slope failure would rend to be restricted to shallow sloughing.
1.2 Mohr-Coulomb Materials
For most shear failures the rock can be assumed to be a Mohr-Coulomh material in which the shear strength of the sliding surface is expressed in terms of the cohesion (c) and the friction angle (4)). When an effective normal stress ' acts on the rupture surface, the shear stress (t) developed is
t=c+a'tan4) (14.1)
Equation 14.1 is expressed in Figure 14-5 as a straight line that shows the influence of both the effective normal stress and the characteristics of the fracture surface on the shear strength. The main component of the effective normal stress is the weight of the rock. However, if water pressures
act on the potential rupture surface, the effective normal stress is diminished. Tensioned rock bolts can be installed across the fracture to increase the normal stress. These concepts are used in the analysis of rock slope stability and the design of rock slope stabilization measures, as discussed in Chapters 15 and 18, respectively.
Figure 14-5 illustrates typical strength parame-ters for five geological conditions that range from a low-strength infilled fracture to relatively high-strength fractured rock containing discontinuous fractures to weak intact rock. These five condi-tions may be described as follows:
I. Infilled fracture: If the infilling is a weak clay or fault gouge, the friction angle (Cl) is likely to be low, but there may be some cohesion if the infilling is undisturbed. Alternatively, if the infilling is a strong calcite, for example, which produces a healed surface, the cohesive strength may be significant (see Section 2.3).
2. Smooth fracture: A smooth, clean fracture has zero cohesion, and the friction angle is that of the rock surfaces (4)). The friction angle of rock
FIGURE 14-3 (right) Circular failure in residual soil and weathered rock.
FIGURE 14-4 (far right) Near-vertical cut in very weak but massive tuff containing no fractures.

Rock Strength Properties and Their Measurement
375
intact, weak rock
Fractured
'4 strong rock
~n]jl
I fracture
L l fracture
cohesion Effective normal stress, a'
is related to the grain size and is generally low in fine-grained rocks and higher in coarse-grained rocks (see Section 2.1). Rough fracture: Clean, rough fracture surfaces have zero cohesion, and the friction angle con- sists of the rock-material friction angle (4)), a component (i) related to the roughness (asperi- ties) of the surface, and the ratio between the rock strength and the normal stress. As the nor-mal stress increases, the asperities are progres-sively sheared off and the total friction angle diminishes (see Section 2.2). Fractured rock mass: The shear strength of a fractured rock mass, in which the rupture surface partially lies on fracture surfaces and partially passes through intact rock, can be expressed as a curved envelope (Figure 14-2). At low normal stresses where there is little confinement of the fractured rock and the indi- vidual fragments may move and rotate, the cohesion is low but the friction angle is high because the sliding surface is effectively rough. At higher normal stresses, crushing of the rock fragments begins to take place, with the result that the friction angle diminishes. The shape of the strength envelope is related to the degree of fracturing and the strength of the intact rock (see Section 4.2). Weak intact rock: Rock such as the tuff shown in Figure 144 is composed of fine-grained material that has a low friction angle. However, because it contains no fractures, the cohesion can be higher than that of a strong but closely fractured rock.
The range of shear strength conditions that may be encountered in rock slopes, as shown in Fig-ures 14-1 through 14-5, clearly demonstrates the importance of examining both the characteristics of the fractures and the rock strength during the site investigation. Surface mapping of outcrops or existing cuts usually provides the most reliable data on rock-mass characteristics because the large exposures show the range of conditions that may be encountered. In contrast, diamond drilling samples only a very small area of the fractures, which may not be representative of the overall fracture characteristics. However, diamond drill-ing may be required when the potential rupture surface lies deep within the slope or there are lim-ited surface outcrops. Investigation methods for rock are discussed in Chapter 10.
2. SHEAR STRENGTH OF FRACTURES
If geological mapping, diamond drilling, or both identify fractures in a slope on which shear or top-pling failures may take place, it will be necessary to determine the friction angle and cohesion of the fracture surface in order to carry Out stability analy-ses and design any necessary remedial work. The investigation program should also obtain informa-tion on characteristics of the fracture surface that may modify the shear strength parameters. Impor-tant fracture characteristics include continuous length, surface roughness, thickness and character-istics of any infilling material, as well as the effect of water on the properties of the infilling.
The shear strength properties of the various frac-ture types are described in the following sections.
2.1 Friction Angle of Rock Surfaces
For a planar, clean (no infilling) fracture, the cohesion is zero and the shear strength is defined solely by the friction angle. The friction angle of the rock material is related to the size and shape of the grains exposed on the fracture surface. Thus, a fine-grained rock and rock with a high mica content tend to have a low friction angle, whereas coarse-grained rock has a high friction angle. Table 14-1 shows typical ranges of friction
FIGURE 14-5 Relationships between shear stress and normal stress on rupture surface for five different geological conditions.
DIlatIon
rI 92 0 \...IlatIonJShearing
Normal Stress
376 Landslides: Investigation and Mitigation
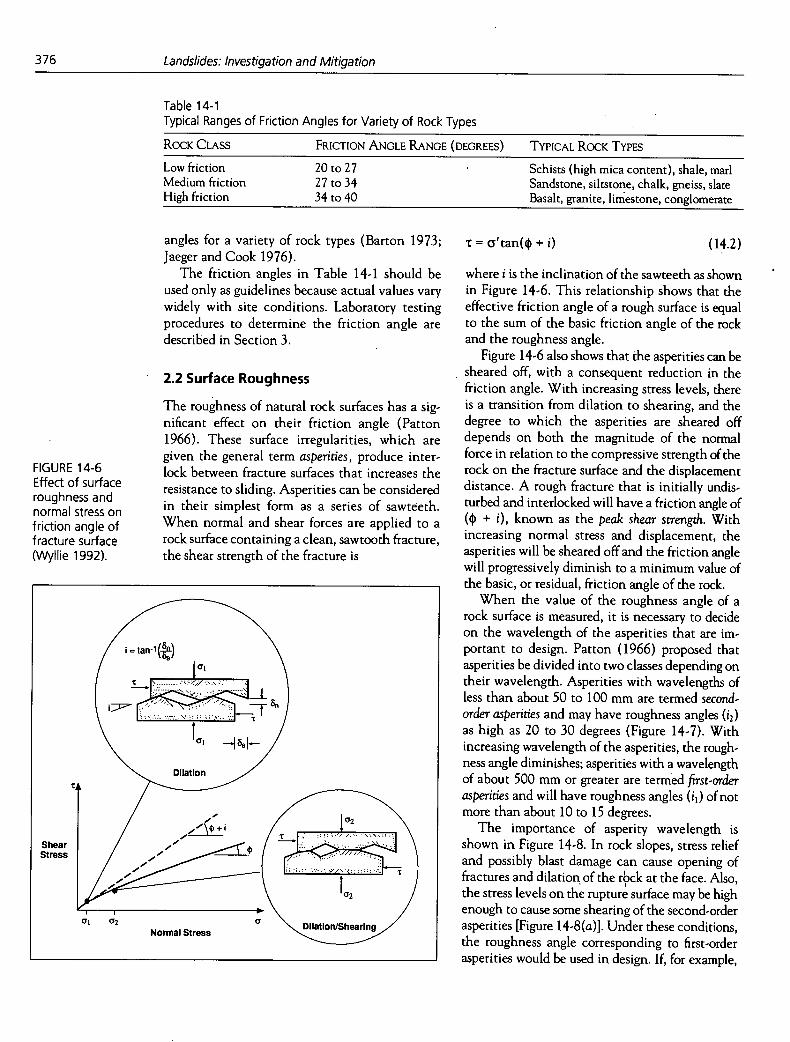
Table 14-1 Typical Ranges of Friction Angles for Variety of Rock Types
ROCK CLASS FRIcrnoN ANGLE RANGE (DEGREES) TYPICAL ROCK TYPES
Low friction 20 to 27 Schists (high mica content), shale, marl Medium friction 27 to 34 Sandstone, siltstone, chalk, gneiss, slate High friction 34 to 40 - Basalt, granite, limestone, conglomerate
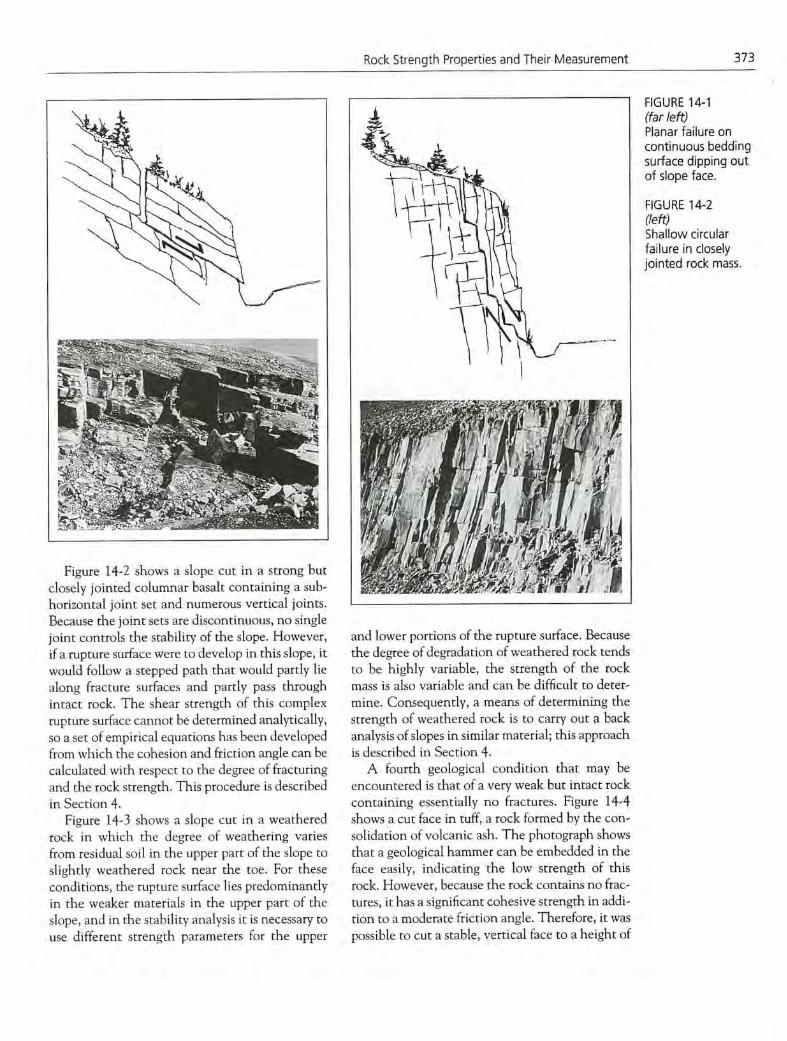
FIGURE 14-6 Effect of surface roughness and normal stress on friction angle of fracture surface (Wyllie 1992).
Shear Stress
angles for a variety of rock types (Barton 1973; Jaeger and Cook 1976).
The friction angles in Table 14-1 should be used only as guidelines because actual values vary widely with site conditions. Laboratory testing procedures to determine the friction angle are described in Section 3.
2.2 Surface Roughness
The roughness of natural rock surfaces has a sig-nificant effect on their friction angle (Patton 1966). These surface irregularities, which are given the general term asperities, produce inter-lock between fracture surfaces that increases the resistance to sliding. Asperities can be considered in their simplest form as a series of sawteth. When normal and shear forces are applied to a rock surface containing a clean, sawtooth fracture, the shear strength of the fracture is
t=cy1 tan(4+i) (14.2)
C
2
where i is the inclination of the sawteeth as shown in Figure 14-6. This relationship shows that the effective friction angle of a rough surface is equal to the sum of the basic friction angle of the rock and the roughness angle.
Figure 14-6 also shows that the asperities can be sheared off, with a consequent reduction in the friction angle. With increasing stress levels, there is a transition from dilation to shearing, and the degree to which the asperities are sheared off depends on both the magnitude of the normal force in relation to the compressive strength of the rock on the fracture surface and the displacement distance. A rough fracture that is initially undis-turbed and interlocked will have a friction angle of (d? + i), known as the peak shear strength. With increasing normal stress and displacement, the asperities will be sheared off and the friction angle will progressively diminish to a minimum value of the basic, or residual, friction angle of the rock.
When the value of the roughness angle of a rock surface is measured, it is necessary to decide on the wavelength of the asperities that are im-portant to design. Patton (1966) proposed that asperities be divided into two classes depending on their wavelength. Asperities with wavelengths of less than about 50 to 100 mm are termed second-order asperities and may have roughness angles (i2 ) as high as 20 to 30 degrees (Figure 14-7). With increasing wavelength of the asperities, the rough-ness angle diminishes; asperities with a wavelength of about 500 mm or greater are termed first-order asperities and will have roughness angles (i1 ) of not more than about 10 to 15 degrees.
The importance of asperity wavelength is shown in Figure 14-8. In rock slopes, stress relief and possibly blast damage can cause opening of fractures and dilation of the rck at the face. Also, the stress levels on the rupture surface may be high enough to cause some shearing of the second-order asperities [Figure 14-8(a)]. Under these conditions, the roughness angle corresponding to first-order asperities would be used in design. If, for example,

100mm
(b) Roughness angles for first-order asperities
FIGURE 14-7 Definition of first- and second-order asperities on natural rough rock surfaces.
Rock Strength Properties and Their Measurement 377
the rupture surface consisted of undulating bed-ding planes in fine-grained sandstone, the total friction angle may be about 30 degrees (4) = 25,
= 5 degrees). Second-order asperities can have an effect on
the stability of reinforced slopes [Figure 14-8(b)]. If the rock mass can be prevented from movement and dilation by the installation of tensioned rock anchors or passive support such as dowels and buttresses (see Chapter 18), interlock along the rupture surface is maintained. Under these con-ditions the second-order asperities contribute to the shear strength of the potential sliding surface, and the total friction angle of the rough rock sur-face may be as high as 55 degrees (4) = 25, i = 30 degrees).
In order to quantify the relationship among the total friction angle (4) + i), the rock strength, and the normal stress acting on the rupture surface, Barton (1976) studied the shear strength behav-ior of artificially produced rough, clean "joints." The study showed that the shear strength of a rough rock surface can be defined by the following empirical equation:
= a'tan[ +JRC logio (--)] (14.3)
where
JRC = joint roughness coefficient, cy1 = compressive strength of the rock at the
fracture surface, and a' = effective normal stress.
The roughness of the fracture surface is defined by the joint roughness coefficient, JRC. Barton carried out direct shear tests on a large number of natural discontinuities and calculated JRC values corresponding to the surface roughness of the dif-ferent shear-test specimens. From these tests a set of typical roughness profiles with specified JRC values was prepared (Figure 14-9). By comparing a fracture surface with these standard profiles, the JRC value can be determined (Barton 1976).
The term [JRC log10 (a,/(;')] is equivalent to the roughness angle i in Equation 14.2. At high stress levels when a1/a' = 1 and the asperities are sheared off, the term [JRC log10 ((Y, Ia')] equals zero. At low stress levels the ratio ((Y, Ia') tends to infinity and the roughness component of the strength becomes very large. In order for realistic values of the roughness component to be used in design, the term (4) + 0 should not exceed about
(a) Roughness angles for second-order asperities
_= 13
Vp I\ ' /
z-- ).:' "2
-05to2m _
—.-- '
a) Shear strength of displaced block controlled by first order '-/// \ '2 = 26
asperities (Ii)
\ /
I
,)¼..5OtolOOmm
b) Tensioned rock bolts prevent dilation along potential sliding surface and produce interlock along second order aspenties 02).
FIGURE 14-8 Roughness angles of first- and second-order asperities on natural rock surface.

Examples of Roughness Profiles
50cm 500cm
A A\' B
/::'..\
C i ' L
I \I
Rough undulating - tension joints, rough sheeting, JRC 20 rough bedding Smooth undulating - smooth sheeting, non-planar JRC =10 foliation, undulating bedding Smooth nearly planar- planar shear joints, planar JRC = 5 foliation, planar bedding
378
Landslides: Investigation and Mitigation
FIGURE 14-9 Definition of joint roughness coefficient, JRC (Barton 1973).
70 degrees and the useful range for the ratio (a1 /(y') is between about 3 and 100.
2.3 Measurement of Surface Roughness
If there are, at a project site, exposures of the frac-ture surfaces on which sliding may occur, mea-surements can be made of the surface roughness. If the exposure is extensive, the actual roughness angle (i) can be measured and used in Equation 14.2 in determining the shear strength of the sur-face. If the exposures are more limited, measure-ments of the JRC value can be made for use in Equation 14.3. Methods of making these measure-ments are described below.
A direct measurement of the roughness angle can be made in the field by measuring the variation in the orientation of the fracture surface (Feckers and Rengers 1971; Wyllie 1992). This procedure consists of measuring, in the direction of sliding, the orientation of the surface with varying base lengths. For short base lengths there may be con-siderable variation in the dip representing a rough surface, whereas for longer base lengths the varia-tion diminishes until the measurements equal the average orientation of the surface. As discussed in Section 2.2, the asperities that would usually be used in design are the second-order asperities with wavelengths of about 500 mm or greater. A plot of base length versus dip angle would show the rela-tionship between these two parameters and pro-vide a guideline for appropriate design values.
When the surface roughness is determined using Equation 14.3, the JRC value can be estimated by visual inspection of the fracture and comparison with standard profiles of known JRC values, as shown in Figure 14-9. However, because visual comparison with the standard profiles is somewhat subjective and prone to error, two quantitative methods of profile measurement have been estab-lished. Tse and Cruden (1979) described a method using a mechanical profilometer, and Mearz et al. (1990) developed a shadow profilometer that records the shape of the surface by means of a video camera and image analyzer.
The method developed by Tse and Cruden is shown in Figure 14-10. The profile is defined by measuring the distance (y1 ) of the surface from a fixed reference line at specified equal intervals (ix) over a length of M intervals. From these measurements the coefficient Z2 is defined as
Z21/2
= M(x)2 (t' +i_')] (14.4)
The coefficient Z2 is then used to calculate the JRC of the fracture surface using the following regression equation:
JRC = 32.2 + 32.47 log(Z2) (14.5)
A study has also been carried out to assess the effect of the size of the sampling interval along the profile on the calculated value of JRC (Yu and Vayssade 1991). This study showed that the sampling interval should not exceed 1 mm, and greater accuracy can be achieved by sampling at an interval of 0.25 mm.
2.4 Fracture Infilling
In the preceding section, the surfaces discussed are rough, clean fracture surfaces with rock-to-rock contact and no infilling, in which the shear strength is derived solely 'from the friction angle of the rock material. However, if the fracture con-tains an infilling, the shear strength properties of the fracture are often modified, with both the cohesion and friction angle of the surface being influenced by the thickness and properties of the infilling. For example, for a clay-filled fault zone in granite, it would be assumed that the shear strength of the fracture would be that of the clay and not the granite. In the case of a healed, calcite-filled fracture, a high cohesion would be used in

s /16. 11
23 I 18...17
///
24
3 / 15 /122 25
12' /
124 19
Clay infillings 13
U Fault gouge, 010 shear zones,
low strength rock - Range of Values
.1420
U18
Rock Strength Properties and Their Measurement
379
design, but only if it was certain that the fracture would remain healed after any disturbance caused by blasting during excavation of the slope.
The presence of infillings along fracture sur-faces can have a significant effect on stability. It is most important that infillings be identified in the investigation program and that appropriate strength parameters be used in design. For exam-ple, one of the contributing factors to the massive landslide into the Vaiont Reservoir in Italy that resulted in the deaths of about 2,000 people was the presence of low-shear-strength clay along the bedding surfaces of the shale (Trollope 1980).
The effect of the infilling on shear strength depends on both the thickness and strength prop-erties of the infilling material. With respect to the thickness, if it is more than about 25 to 50 percent
8000
300 j 6000 0 U) C)
0 0
200 4000
100 -i-- 2000
of the amplitude of the asperities, there will be little or no rock-to-rock contact, and the shear-strength properties of the fracture will be the prop-erties of the infilling (Goodman 1970).
Figure 14-11 is a plot of the results of direct shear tests carried out to determine the peak fric-
FIGURE 14-10 Principle of measuring JRC of rock surface with mechanical profilometer (modified from Tse and Cruden 1979). REPRINTED WITH KIND PERMISSION FROM ELSE VIER SCIENCE LTD, THE BOULEVARD, LANOFORD LANE, KIDLINGTON, UNITED KINGDOM
10 20 30 40
Friction angle (degrees)
Bentonite shale Bentonite seams in chalk Bentonite; thin layers Bentonite triaxial tests Clay, over-consolidated Limestone, 10-20 mm clay infillings Lignite and underlying clay contact Coal measures; clay mylonite seams Limestone; <1 mm clay infillings
Montmorillonite clay Montmorillonite; 80 mm clay seam in chalk Schists/quartzites; stratification, thick clay Schists/quartzites; stratification, thick clay
Basalt; clayey, basaltic breccia Clay shale; triaxial tests Dolomite, altered shale bed Diorite/granodiorite; clay gouge Granite; clay.filled faults Granite; sandy-loam fault fillings Granite; shear zone, rock and gouge Lignite/marl contact Limestone/marl/lignites; lignite layers Limestone; marlaceous joints Ouartz/kaolin/pyrolusite; remolded triaxial Slates; finely laminated and altered Limestone; 10 to 20 mm clay infillings
FIGURE 14-11 Shear strength of filled discontinuities (Barton 1974; Wyllie 1992).
380
Landslides: Investigation and Mitigation
tion angle and cohesion of filled discontinuities (Barton 1974; Wyllie 1992). Examination of the test results shows that the infihlings can be divided approximately into two groups, as follows:
Clays: Montmorillonite and bentonitic clays and clays associated with coal measures have friction angles ranging from about 8 to 20 degrees and cohesion values ranging from 0 to about 200 kPa. Some cohesion values were measured as high as 380 kPa. Faults, shears, and breccias: The material formed in fault zones and shears in rocks such as granite, diorite, basalt, and limestone contains clay as well as granular fragments. These mate-rials have friction angles ranging from about 25 to 45 degrees and cohesion values ranging from 0 to about 100 kPa. Fault gouge derived from coarse-grained rocks such as granites tends to have higher friction angles than those from fine-grained rocks such as limestones.
Some of the tests shown in Figure 14-11 also determined residual shear-strength values. It was found that the residual friction angle was only about 2 to 4 degrees less than the peak friction angle, whereas the residual cohesion was essen-tially zero.
Shear-strength and displacement behavior is an additional factor to consider regarding the shear strength of filled fractures. In the analysis of the stability of slopes, this behavior indicates whether there is likely to be a reduction in shear strength with displacement. In conditions where there is a significant decrease in shear strength with displacement, slope failure can occur sud-denly following a small amount of movement.
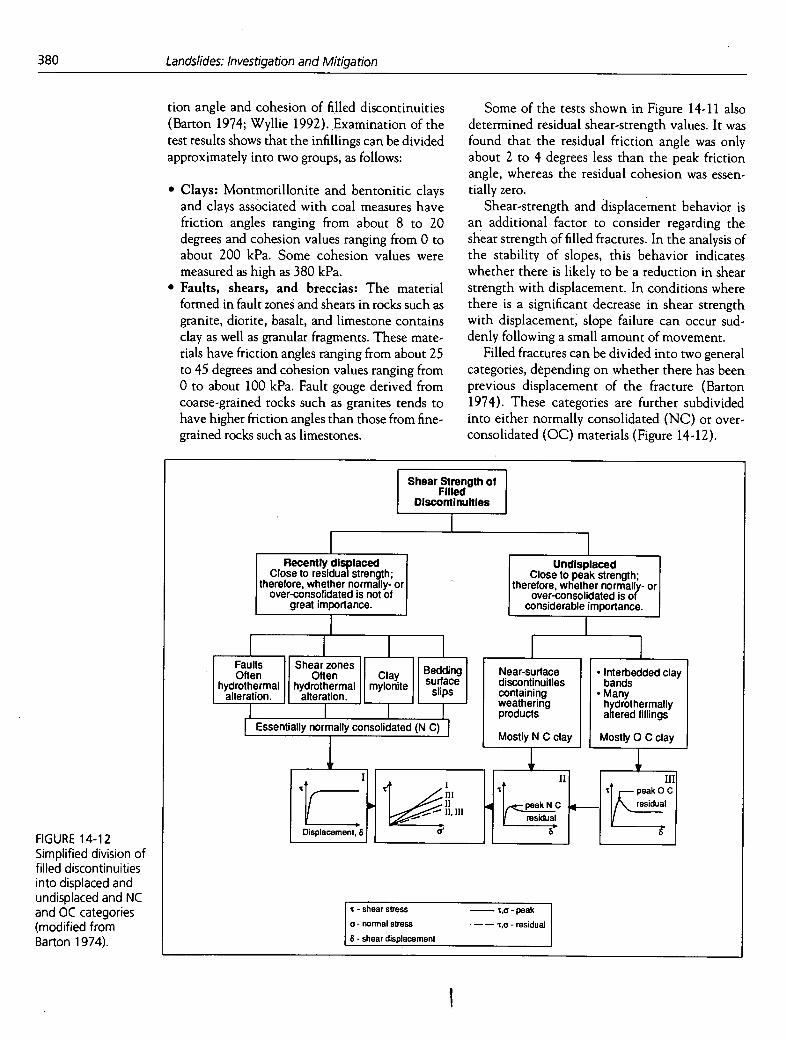
Filled fractures can be divided into two general categories, depending on whether there has been previous displacement of the fracture (Barton 1974). These categories are further subdivided into either normally consolidated (NC) or over-consolidated (OC) materials (Figure 14-12).
FIGURE 14-12
Simplified division of
filled discontinuities
into displaced and
undisplaced and NC
and OC categories
(modified from
Barton 1974).
Shear Strength of Filled
Dlscontinuitles
Recently displaced Undlsplaced
Close to residual strength; Close to peak strength;
therefore, whether normally- or therefore, whether normally, or
over-consolidated is not of over-consolidated is of great importance. considerable importance.
I I I I I I
Near-surface • lnterbedded clay discontinuities bands containing Many weathering hydrothermally I products altered fillings
Essentially normally consolidated (N C) Mostly N C clay Mostly 0 C clay
1I1
H
residual
Displacement, 6 0' 6
-
r~!daC
shear stress - t,o - peak a - normal stress - - ;o - residual 6 - shear displacement
II Shearzones II II I II Often Ii Clay II Bedding I
II surface I II hydrothermal II mylonite slips alteration.
I Faults I Often I hydrothermal I alteration.

Rock Strength Properties and Their Measurement
381
2.4.1 Recently Displaced Fractures
Recently displaced fractures include faults, shear zones, clay mylonites, and bedding-surface slips. In faults and shear zones, the infilling is formed by the shearing process, which may have occurred many times and produced considerable displacement. The gouge formed in this process may include both clay-size particles and breccia with the particle ori-entation and striations of the breccia aligned par-allel to the direction of shearing. In contrast, the mylonites and bedding-surface slips are fractures that were originally clay bearing and along which slip occurred during folding or sliding.
For these types of fractures the shear strength is at or close to the residual strength (Figure 14-12, Graph I). Any cohesive bonds that existed in the clay because of previous overconsolidation will have been destroyed by shearing, and the infilling will be equivalent to the normally consolidated state. In addition, strain softening may occur, with increased water content resulting in a further reduction in strength.
2.4.2 Undisplaced Fractures
Infilled fractures that have undergone no previous displacement include igneous and metamorphic rocks that have weathered along fracture surfaces to form clay layers. For example, diabase weathers to amphibolite and eventually to clay. Other un-displaced fractures include thin beds of clay and weak shales that are found with sandstone in in-terbedded sedimentary formations. Hydrothermal alteration is another process that forms infillings that can include low-strength materials such as montmorillonite and high-strength materials such as quartz and calcite.
The infillings of undisplaced fractures can be divided into NC and OC materials that have sig-nificant differences in peak-strength values. This strength difference is illustrated in Figure 14-12 by Graphs II and III. Although the peak shear strength of OC clay infillings may be high, there can be a significant loss of strength due to soften-ing, swelling, and pore-pressure changes on un-loading. Unloading occurs when rock is excavated for a slope or foundation, for example. Strength loss also occurs on displacement in brittle materi-als such as calcite.
2.5 Effect of Water on Shear Strength
The most significant effect of groundwater on slope stability is the reduction in normal stress produced by water pressures acting within the slope. As shown in Equation 14.1, a reduction in the effective normal stress results in a correspond-ing reduction in the shear strength of the rupture surface. The effect of water pressures on slope design is described in Chapter 15. Generally, the strength properties of rock are the same whether the rock is wet or dry. However, some rocks, such as shales containing swelling clay and evaporites such as gypsum, exhibit a loss of strength in the presence of water.
3. LABORATORY TESTING OF SHEAR STRENGTH
The friction angle of a fracture surface can be determined in the laboratory using a direct shear box of the type shown in Figure 14-13. This is portable equipment that can be used in the field if required and is suited to testing samples with dimensions up to about 75 mm, such as NQ and HQ drill core. The most reliable values are ob-tained if a sample with a smooth, planar surface is used because it is found that with an irregular surface, the effect of surface roughness can make the test results difficult to interpret.
The test procedure consists of using plaster of paris or sulfur to set the two halves of the sample in a pair of steel boxes (International Society for Rock Mechanics 1981b). Particular care is taken to ensure that the two pieces of core are in their original, matched position and the fracture surface is exactly parallel to the direction of the shear force. A normal load is then applied using the cantilever, and the shear load is gradually in-creased until a sliding failure occurs. Measurement of the relative vertical and horizontal displace-ment of the upper block can be made most simply with dial gauges, whereas more precise, continu-ous displacement measurements can be made with linear variable differential transformers (Hencher and Richards 1989).
Each sample is usually tested three or four times with progressively higher normal loads. When the residual shear stress has been established for each normal load, the sample is reset, the normal load increased, and another shear test conducted. The

'382
Landslides: Investigation and Mitigation
displa ment I gauge Normal
load
Leverarm- Topbox Pump \ I\
ac \ I
o e - - V k E1T-_-_\--- -I
Bottom box Shear load I
Ball bearing plate
Hanginweig
Horizontal g Sample displacement
gauge
True vertical displacement = gauge reading x (a/b).
FIGURE 14-13 Simple equipment for performing direct shear tests on rock samples up to about 75 mm in diameter (Wyllie 1992).
test results are expressed as plots of shear displace-ment against shear stress from which the peak and residual shear stress values are determined. Each test produces a pair of shear-stress—normal-stress values, which are plotted to determine the peak and residual friction angles of the surface.
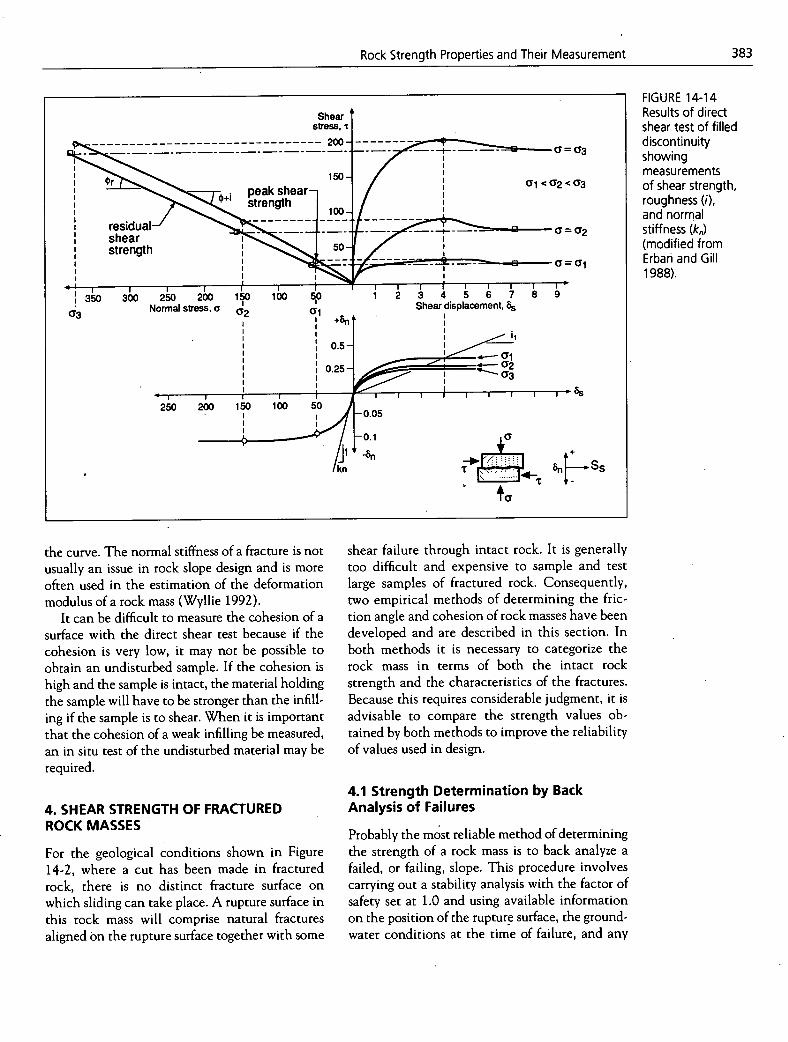
Figure 14-14 shows a typical result of a direct shear test on a fracture with a 4-mm-thick sandy-silt infilling. The curves on the upper right are shear-stress—shear-displacement plots showing an approximate peak shear stress as well as a slightly lower, residual shear stress. The sample was undis-placed, so it exhibited a difference between peak and residual strengths (see Figure 14-12). The normal stresses at the peak and residual shear stress values are calculated from the applied nor-mal load and the contact area. '(fhen the contact area is calculated, an allowance is made for the decrease in area as shear displacement takes place. For diamond drill core in an inclined hole, the fracture surface is in the shape of an ellipse and the formula for calculating the contact area is as follows (Hencher and Richards 1989):
Iub(4a2 - uZ) ]'/2 2absin(--'\ (14.6) A=lcab_[
2a \2a)
where
A = gross area of contact, 2a = major axis of ellipse,
2b = minor axis of ellipse, and u = relative shear displacement.
As a result of the decrease in contact area with shearing, there will be a corresponding increase in the normal stress. This is shown in the upper left diagram of Figure 14-14, where the normal stress for the residual shear strength is greater than that for the peak shear strength.
The measured friction angle is the sum of the friction angle of the rock (4)) and the roughness of the surface (i) at each normal stress level. The roughness of the surface is calculated from the plots of shear and normal displacement (, and 8.1 respectively, on the lower right side of Figure 14-14) as follows:
i=tan_1(--) (14.7)
This value of i is then subtracted from the friction angle calculated from the plot of shear and normal stresses at failure to obtain the friction angle of the rock. Although the shear test can be con-ducted on a sawed sample so that there is no roughness component, there may be some polish-ing of the surface resulting in a low value of the friction angle compared with a natural surface.
As shown in Figure 14-14, it is usual, at a mini-mum, to test each sample at three normal stress levels, with the sample being reset to its original position between tests. When the tests are run at progressively higher normal stress levels, the total friction angle of the surface will diminish with each test if the asperities are progressively sheared. This produces a concave downward normal shear plot as shown in the upper left of Figure 14-14. The degree to which the asperities are sheared off will depend on the level of the normal stress in comparison to the rock strength, that is, the ratio (a1 /(;') in Equation 14.3. The maximum normal stress that is used in the test is usually the maximum stress level that is likely to develop in the slope.
It is also possible to measure the normal stiff-ness of the fracture infilling during the direct shear test, as shown in the lower left of Figure 14-14. Normal stiffness is the ratio of the normal stress to normal displacement, or
k. (14.8)
The plot of (Y against ö,, is highly nonlinear and the value of 5,, is the slope of the initial portion of
Rock Strength Properties and Their Measurement
383
FIGURE 14-14 Results of direct shear test of filled discontinuity showing measurements of shear strength, roughness (I), and normal stiffness (kr )
(modified from Erban and Gill 1988).
Shear stress,
Or Peak shear-
:strength
:
01<02 <03
( residual
strength 50 1 03
Normal stress, a 2 Shear displacement, 8
I +8n
0.5-
ss 20
I
t1_1kn n
-'jJ- . Ess
the curve. The normal stiffness of a fracture is not usually an issue in rock slope design and is more often used in the estimation of the deformation modulus of a rock mass (Wyllie 1992).
It can be difficult to measure the cohesion of a surface with the direct shear test because if the cohesion is very low, it may not be possible to obtain an undisturbed sample. If the cohesion is high and the sample is intact, the material holding the sample will have to be stronger than the infill-ing if the sample is to shear. '(fhen it is important that the cohesion of a weak infilling be measured, an in situ test of the undisturbed material may be required.
4. SHEAR STRENGTH OF FRACTURED ROCK MASSES
For the geological conditions shown in Figure 14-2, where a cut has been made in fractured rock, there is no distinct fracture surface on which sliding can take place. A rupture surface in this rock mass will comprise natural fractures aligned on the rupture surface together with some
shear failure through intact rock. It is generally too difficult and expensive to sample and test large samples of fractured rock. Consequently, two empirical methods of determining the fric-tion angle and cohesion of rock masses have been developed and are described in this section. In both methods it is necessary to categorize the rock mass in terms of both the intact rock strength and the characteristics of the fractures. Because this requires considerable judgment, it is advisable to compare the strength values ob-tained by both methods to improve the reliability of values used in design.
4.1 Strength Determination by Back Analysis of Failures
Probably the most reliable method of determining the strength of a rock mass is to back analyze a failed, or failing, slope. This procedure involves carrying Out a stability analysis with the factor of safety set at 1.0 and using available information on the position of the rupture surface, the ground-water conditions at the time of failure, and any

384 Landslides: Investigation and Mitigation
a
580 Bedding surface
200
200-
b)
150- --S..- I
Cohesion,c 100-
50-
1I0I050 Friction Angle, 4 (degrees)
FIGURE 14-15 Example of back analysis of failed slope to determine shear strength of bedding surface (modified from Hoek and Bray 1981): (a) section showing failed slope; (b) plot of cohesion versus friction angle.
external forces such as foundation loads and earth-quake motion, if applicable. Methods of stability analysis of rock slopes are discussed in Chapter 15.
Figure 14-15(a) shows a back analysis of a slope failure in limestone in which sliding occurred on bedding planes dipping out of the face at an angle of 20 degrees (Hoek and Bray 1981). At the time of failure, the upper bench of the quarry was flooded and the tension crack was full of water, so the forces acting on the slope were known with some confidence.
In back analysis both the friction angle and the cohesion of the rupture surface are unknown, and their values can be estimated by the following method. By carrying out a number of stability analyses with a range of cohesion values, it is pos-sible to calculate a corresponding value for the fric-tion angle (at F = 1). From a plot of cohesion against friction angle [Figure 14-15(b)], it is possi-ble to select values for the cohesion and friction angle that can be used in design. When the friction angle of the rock can be determined in a direct shear test and the roughness of the surface can be
measured in the field, the cohesion of the rupture surface can be determined with some confidence.
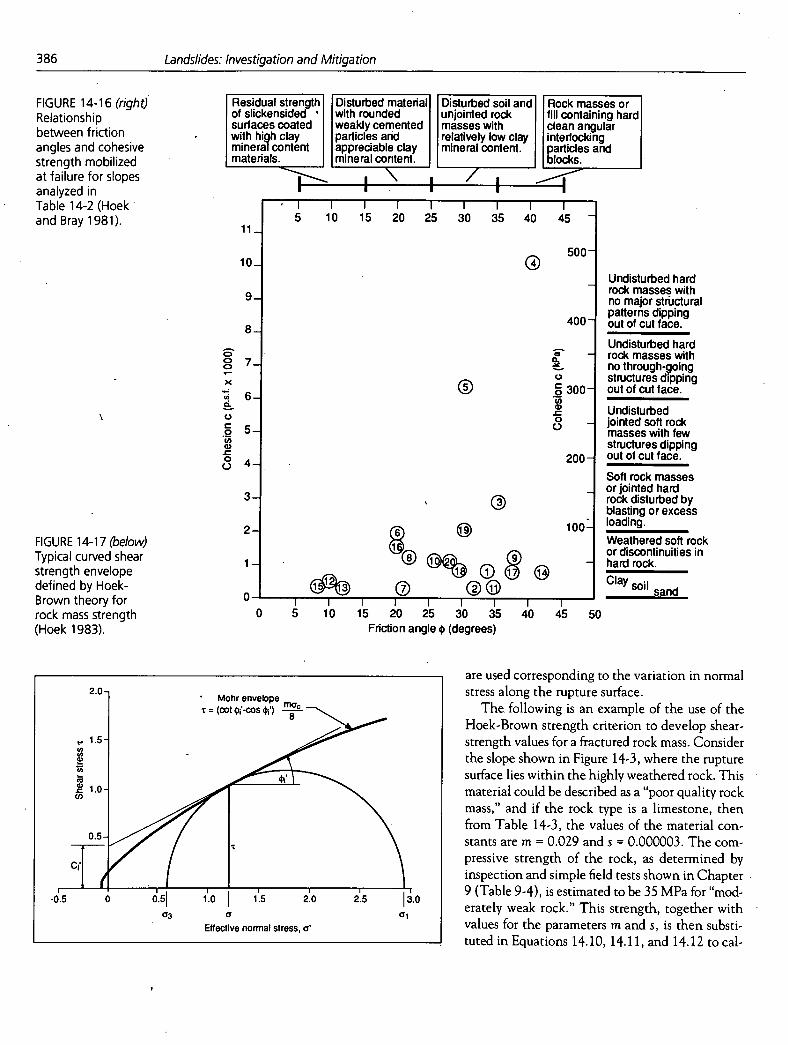
many cases it may not be feasible to carry out a back analysis of a slope in geological conditions similar to those in which the new slope is to be excavated. In these circumstances, published results of rock mass shear strength can be used in design. Figure 14-16 shows the results of back analyses of slope failures in a variety of geological conditions (as described in Table 14-2) and the shear-strength parameters (4)/c values) calculated at failure. By adding points to Figure 14-16 for local geological conditions, it is possible to draw up a readily applicable rock mass strength chart for shear failures.
4.2 Hoek-Brown Strength Criteria for Fractured Rock Masses
As an alternative to back analysis to determine the strength of fractured rock masses, an empirical method was developed by Hoek (1983) and Hoek and Brown (1988) in which the shear strength is represented as a curved envelope (Figure 14-17). This strength criterion was derived from the Griffith crack theory of rock fracture, as well as from observations of the behavior of rock masses in the laboratory and in the field (Marsal 1973; Jaeger 1970).
The three parameters defining the curved strength envelope of the rock mass are the uni-axial strength of the intact rock, q, and two dimensionless constants m and s. The values of m and s are defined in Table 14-3, in which rock types are shown in the columns, and the strength and degree of fracturing are shown in the rows. The rock types are grouped into five classes depending on the grain size and crystal structure. The quality of the rock mass is defined in Table 14-3 either by the brief descriptions of the geol-ogy or by rock-mass rating systems (Bieniawski 1974, 1976) that assign point scores to a number of characteristics of the rock mass.
The equation for the curved shear strength envelope is
. c = (cot4)j' - cosq 1,)
mG---- (14.9)
where t is the shear stress at failure and 4f is the instantaneous friction angle at given values of t and a'. The value of 4)' is the inclination of the

Rock Strength Properties and Their Measurement
385
tangent to the Mohr failure envelope at the point (a',t) as shown in Figure 14-17 and is given by
= arctan{4hcos2[30 + 1/3 arcsin(h312)] - 11_ 11 2 (14.10)
where
h= 1+ 16(ma' + sa)
(14.11) 3m2a
The dimensionless constants m and s depend on the rock type and the degrees of fracturing of the rock mass and are defined in Table 14-3. The instantaneous cohesion (ci') is the intercept of the line defining the friction angle on the shear stress axis and is given by
c1' = r—a'tan4 (14.12)
The features of the curved shear-strength enve-lope are that at low normal-stress levels, the blocks of rock are interlocked and the instan-taneous friction angle is high, whereas at higher normal-stress levels, shearing of the rock is initi-ated with the result that the friction angle dimin-ishes. The instantaneous cohesion progressively increases with the normal stress as a result of the greater confinement and interlock of the rock mass.
The procedure for using the curved strength envelopes in stability analysis is, first, to deter-mine the range of effective normal stresses acting along a potential rupture surface in the slope and, second, to calculate the instantaneous cohesion values and friction angles in this stress range. The stability analysis is carried out in the normal manner except that a number of values of c, and 4
Table 14-2 Sources of Shear-Strength Data Plotted in Figure 14-16
POINT NUMBER MATERIAL LOCATION SLOPE HEIGHT (M) REFERENCE
1 Disturbed slates and Knob Lake, Canada - Coates et al. (1965) quartzites
2 Soil Any location - Whitman and Bailey (1967)
3 Jointed porphyry Rio Tinto, Spain 50-110 Hoek (1970) 4 Ore body hanging wall Grangesberg, Sweden 60-240 Hoek (1974)
in granite rocks 5 Rock slopes with slope Any location 300 Ross-Brown (1973)
angles of 50 to 60 degrees 6 Bedding planes in Somerset, England 60 Roberts and Hoek (1972)
limestone 7 London clay, stiff England - Skempton and
Hutchinson (1969) 8 Gravelly alluvium Pima, Arizona - Hamel (1970) 9 Faulted rhyolite Ruth, Nevada - . Hamel (1971a) 10 Sedimentary series Pittsburgh, - Hamel (1971b)
Pennsylvania 11 Kaolinized granite Cornwall, England 75 Ley (1972) 12 Clay shale Fort Peck Dam, - Middlebrook (1942)
Montana 13 Clay shale Gardiner Dam, - Fleming et al. (1970)
Canada 14 Chalk Chalk Cliffs, England 15 Hutchinson (1972) 15 Bentonite/clay Oahe Dam, South - Fleming etal. (1970)
Dakota 16 Clay Garrison Dam, - Fleming et al. (1970)
North Dakota 17 Weathered granites Hong Kong 13-30 Hoek and Richards (1974) 18 Weathered volcanics Hong Kong 30-100 Hoek and Richards (1974) 19 Sandstone, siltstone Alberta, Canada 240 Wyllie and Munn (1979) 20 Argillite Yukon, Canada 100 Wyllie (unpublished data)
I I I I I I I I 5 10 15 20 25 30 35 40 45 -
500 I-
400
- C)
g300. - U)
0 - 0 -
- 200-
-
100-
I
Undisturbed hard rock masses with no major structural patterns dipping out of cut face.
Undisturbed hard rock masses with no through-9oing structures dipping out of cut face.
Undisturbed jointed soft rock masses with few structures dipping out of cut face.
Soft rock masses or jointed hard rock disturbed by blasting or excess loading.
Weathered soft rock or discontinuities in hard rock. Clay soil
sand
0 5 10 15 20 25 30 35 40 45 50 Friction angle (degrees)
11
10
9
8
3
2
386
Landslides: Investigation and Mitigation
Residual strength Disturbed material Disturbed soil and Rock masses or of slickensided • with rounded unjointed rock fill containing hard surfaces coated weakly cemented masses with clean angular with high clay particles and relatively low clay interlocking mineral content appreciable clay mineral content.particles and materials, mineral content. blocks.
,\ • / 1
FIGURE 14-16 (right) Relationship between friction angles and cohesive strength mobilized at failure for slopes analyzed in Table 14-2 (Hoek and Bray 1981).
FIGURE 14-17 (below) Typical curved shear strength envelope defined by Hoek-Brown theory for rock mass strength (Hoek 1983).
are used corresponding to the variation in normal stress along the rupture surface.
The, following is an example of the use of the Hoek-Brown strength criterion to develop shear-strength values for a fractured rock mass. Consider the slope shown in Figure 14-3, where the rupture surface lies within the highly weathered rock. This material could be described as a "poor quality rock mass," and if the rock type is a limestone, then from Table 14-3, the values of the material con-stants are m = 0.029 and s = 0.000003. The com-pressive strength of the rock, as determined by inspection and simple field tests shown in Chapter 9 (Table 9-4), is estimated to be 35 MPa for "mod-erately weak rock." This strength, together with values for the parameters m and s, is then substi-tuted in Equations 14.10, 14.11, and 14.12 tocal-

TABLE 14-3 Approximate Relationship Between Rock-Mass Quality and Material Constants Used in Defining Nonlinear Strength (Hoek and Brown 1988).
Empirical failure criterion
a 3 +.Jma,1cY +s0 2
= major principal effective stress C.)
a'1 = minor principal effective stress > au(r) = uniaxial compressive strength of .
intact rock, and I c <'C I 2° m and s are empirical constants ' Z
8 <- 'Cv,
cc zO>. cc - I-_u ZZ
INTACT ROCK SAMPLES Laboratory size speciments free m 7.00 10.00 15.00 17.00 25.00
from discontinuities s 1.00 1.00 1.00 1.00 1.00
*CSIR rating: RMR = 100 tNGI rating: Q = 500 VERY GOOD QUALITY ROCK MASS
Tightly interlocking undisturbed rock m 2.40 3.43 5.14 5.82 8.56
with unweathe red joints at 1 to 3 m s 0.082 0.082 0.082 0.082 0.082
CSIR rating: RMR = 85 NGI rating: Q = 100
GOOD QUALITY ROCK MASS Fresh to slightly weathered rock, slightly . in 0.575 0.821 1.231 1.395 2.052
disturbed with joints at Ito 3 m s 0.00293 0.00293 0.00293 0.00293 0.00293
CSIR rating: RMR =65 NGI rating: Q = 10
FAIR QUALITY ROCK MASS Several sets of moderately weathered m 0.128 0.183 0.275 0.311 0.458
joints spaced at 0.3 to im. s 0.00009 0.00009 0.00009 0.00009 0.00009
CSIR rating: RMR = 44
NGI rating: Q = I POOR QUALITY ROCK MASS Numerous weathered joints at 30-500mm m 0.029 0.041 0.061 0.069 0.102
some gouge. Clean compacted waste rock s 0.000003 0.000003 0.000003 0.000003 0.000003
CSIR rating: RMR = 23 NGI raing: Q = 0.1 VERY POOR QUALITY ROCK MASS Numerous heavily weathered joints spaced m 0.007 0.010 0.015 0.017 0.025
<50 mm with gouge. Waste rock with fines s 0.0000001 0.0000001 0.0000001 0.0000001 0.0000001
CSIR rating: RMR = 3 NGI rating: Q = 0.01 - _____
*CSIR Commonwealth Scientific and Industrial Research Organization (I3ieniawslu 19/4)
?NGI Norway Geotechnical Institute (Barton 1974)

388
Landslides: Investigation and Mitigation
culate the cohesion and friction angle at each selected normal-stress value. Table 14-4 shows an example of these calculations using the approxi-mate dimensions of the slope in Figure 14-3.
A5 part of the ongoing development of the Hoek-Brown strength criterion, a revised rock-mass rating system called the Geological Strength Index (GSI) and revised equations for the strength envelope have been proposed (Hoek 1995). For this report the more familiar Nor-wegian Geotechnical Institute (NGI) and Com-monwealth Scientific and Industrial Research Organization (CSIR) ratings have been retained because of their present wide use in practical applications.
These results demonstrate the variation in shear strength along the rupture surface. When a circular stability analysis of this slope is carried out, the effective normal stress at the base of each slice and the corresponding instantaneous shear strength parameters can be calculated as part of the input for the analysis.
S. ROCK DURABILITY AND COMPRESSIVE STRENGTH
The strength parameters that are usually of great-est significance to the analysis of slope stability are the cohesion and friction angle on the rupture surface, as discussed previously in this chapter. However, bath the durability and compressive strength of the rock may be of importance, depen-ding on the geological and stress conditions at the site, as discussed below. Both the procedures discussed next are index tests best used to classify and compare one rock with another; if necessary, the index measurements can be calibrated by more precise tests.
5.1 Slake Durability
A widely occurring class of rock materials, such as shales and mudstone, many of which have a high clay content, are prone to degradation when ex-posed to weathering processes such as wetting and drying cycles. The degradation can take the form of swelling, weakening, and disintegration and can occur within a period of minutes to years after exposure. The effect of degradation on slope stabil-ity can range from surficial sloughing and gradual retreat of the face to slope failures resulting from the loss of strength with time (Wu et al. 1981). In sedimentary formations comprising alternating beds of resistant sandstone and degradable shale, the weathering process can develop overhangs in the sandstone and produce a rock-fall hazard.
A simple index test of the tendency of rock to weather and degrade is the slake durability test (International Society for Rock Mechanics 1981a). It is important that undisturbed samples be used that have not been excessively broken in the sampling procedure or allowed to freeze. The test procedure consists of placing the sample in a wire mesh drum and drying it in an oven at 105°C for 2 to 6 hr. The drum is then partially submerged in water and rotated at 20 revolutions per minute for a period of 10 mm. The drum is dried a second time and the loss of weight is recorded. The test cycle is repeated and the slake durability index is calculated as the percentage ratio of final to initial dry sample masses. A low slake durability index indicates that the rock is susceptible to degrada-tion when exposed. For highly degradable rocks it is useful to carry out soil classification tests such as Atterberg limits and X-ray diffraction tests to identify clay mineral types and determine if swelling clays such as bentonites and montmoril-lonites are present.
Table 14-4 Calculated Values of Instantaneous Cohesion and Friction Angle Using Hoek-Brown Strength Criterion
PARAMETER DIMENSION AND UNITS
CENTER OF RUPTURE SURFACE
UPPER RUPTURE SURFACE
Depth of rupture surface d (m) 12 11 Dip of rupture surface ji (degrees) 30 50 Rock unit weight y (MN/rn3) 24 24 Normal stress Ed y cosj1J (MPa) 250 170 Instantaneous cohesion c (MPa) 3.86 3.16 Instantaneous friction angle (degrees) 42 48

Rock Strength Properties and Their Measurement
389
5.2 Compressive Strength
In many slopes in moderately strong to strong rock, the stress level due to gravity loads is signifi-cantly less than the strength of the rock. There-fore, there is little tendency for intact rock within the slope to fracture, and the compressive strength is a less important design parameter than the shear strength. The compressive strength of the rock on the rupture surface is only used indirectly in sta-bility analysis when determining the roughness of a fracture (Equation 14.3) and in the application of the Hoek-Brown strength criteria (Equations 14.9 to 14.12). For both of these applications it is satisfactory to use an estimate of the compressive strength because the results are not particularly sensitive to the value of this parameter.
The point-load test is an appropriate method to estimate the compressive strength in which both core and lump samples can be tested (Inter-national Society for Rock Mechanics 1981c). The equipment is portable, and tests can be carried out quickly and inexpensively in the field. Because the point-load test provides an index value for the strength, the usual practice is to calibrate the results with a limited number of uniaxial compres-sive tests on prepared core samples.
If no equipment is available to measure the compressive strength, simple field observations can be used to estimate the strength with sufficient accuracy for most purposes. In Chapter 9 (Table 9-4) a series of field index tests and observations for estimating strength is described, and the corre-sponding range of compressive strengths is given.
REFERENCES
Barton, N. R. 1973. Review of a New Shear Strength Criterion for Rock Joints. Engineering Geology, Vol. 7, pp. 287-332.
Barton, N. R. 1974. A Review of the Shear Strength of Filled Discontinuities in Rock. Publication 105. Norwegian Geotechnical Institute, Oslo, 38 pp.
Barton, N. R. 1976. The Shear Strength of Rock and Rock Joints. International Journal of Rock Me-chanics and Mining Sciences & Geomechanics Abstracts, Vol. 13, pp. 255-279.
Bieniawski, Z. T. 1974. Geomechanics Classification of Rock Masses and Its Application in Tunnelling. In Proc., Third International Congress on Rock Me-chanics, Denver, National Academy of Sciences, Washington, D.C., Vol. 2, Part 2, pp. 27-32.
Bieniawski, Z. T. 1976. Rock Mass Classifications in Rock Engineering. In Proc., Symposium on Explor-ation for Rock Engineering (Z. T. Bieniawski, ed.), A.A. Balkema, Rotterdam, Netherlands, Vol. 1, pp. 97-106.
Coates, D. F., M. Gyenge, and J. B. Stubbins. 1965. Slope Stability Studies at Knob Lake. In Proc., Rock Mechanics Symposium, Department of Mines and Technical Surveys, Ottawa, Ontario, Can-ada, pp. 35-46.
Erban, P-J., and K. Gill. 1988. Consideration of the Interaction Between Dam and Bedrock in a Coupled Mechanic-Hydraulic FE-Program. Rock Mechanics and Rock Engineering, Vol. 21, No. 2, pp. 99-118.
Feckers, E., and N. Rengers. 1971. Measurement of Large Scale Roughness of Rock Planes by Means of Profilometer and Geological Compass. In Proc., International Symposium on Rock Fracture, Nancy, France, International Society for Rock Mechanics, Lisbon, Portugal, Paper 1-18.
Fleming, R. W., G. S. Spencer, and D. C. Banks. 1970. Empirical Study of the Behavior of Clay Shale Slopes. Nuclear Cratering Group Technical Report 15. U.S. Department of the Army.
Goodman, R. E. 1970. The Deformability of Joints. In Determination of the In-Situ Modulus of Defor-mation of Rock, Special Technical Publication 477, ASTM, Philadelphia, Pa., pp. 174-196.
Hamel, J. V. 1970. The Pima Mine Slide, Pima County, Arizona. Abstracts with Prograrn.s, Geo-logical Society of America ,Vol. 2, No. 5, p. 335.
Hamel, J. V. 1971a. Kimberley Pit Slope Failure. In Proc., Fourth Pan-American Conference on Soil Mechanics and Foundation Engineering, Puerto Rico, Pan-American Conference on Soil Me-chanics and Foundation Engineering, New York, Vol. 2, pp. 117-127.
Hamel, J. V. 1971b. The Slide at Brilliant Cut. In Proc., 13th Symposium on Rock Mechanics, Ur-bana, Illinois, American Society of Civil Engi-neers, New York, pp. 487-5 10.
Hencher, S. R., and L.R. Richards. 1989. Laboratory Direct Shear Testing of Rock Discontinuities. Ground Engineering, March, pp. 24-31.
Hoek, E. 1970. Estimating the Stability of Excavated Slopes in Opencast Mines. Transactions of the Institution of Mining and Metallurgy, London, Vol. 79, pp. A109-A 132.
Hoek. E. 1974. Progressive Caving Caused by Mining an Inclined Ore Body. Transactions of the Institution of Mining and Metallurgy, London, Vol. 83, pp. A133-A139.

390
Landslides: Investigation and Mitigation
Hoek, E. 1983. Strength of Jointed Rock Masses. Geotechnique, Vol. 33, No. 3, pp. 187-223.
Hoek, E. 1995. Strength of Rock and Rock Masses. News Journal, International Society of Rock Me-chanics, Vol. 2, No. 2, pp. 4-16.
Hoek, E., and J. Bray. 1981. Rock Slope Engineering, 3rd ed. Institution of Mining and Metallurgy, London, 402 pp.
Hoek, E., and E. T. Brown. 1988. The Hoek-Brown Failure Criterion-A 1988 Update. In Proc., 15th Canadian Rock Mechanics Symposium, University of Toronto, Canada.
Hoek, E., and L. R. Richards. 1974. Rock Slope Design Review. Report to the Principal Government Highway Engineer, Hong Kong. Golder Asso-ciates, 150 pp.
Hutchinson, J. N. 1972. Field and Laboratory Studies of a Fall in Upper Chalk Cliffs at Joss Bay, Isle of Thanet. In Stress-Strain Behaviour of Soil: Roscoe Memorial Symposium, Cambridge Uni-versity, G.T. Foulis, United Kingdom.
International Society for Rock Mechanics. 1981 a. Suggested Method for Determination of Slake Durability Index. In Rock Characterization, Testing and Monitoring, Pergamon Press, London, pp. 92-94.
International Society for Rock Mechanics. 1981b. Suggested Method for Determination of Direct Shear Strength. In Rock Characterization, Testing and Monitoring, Pergamon Press, London, pp. 135-137.
International Society for Rock Mechanics. 1981c. Suggested Method for Determination of Uniaxial Compressive Strength of Rock Materials. In Rock Characterization, Testing and Monitoring, Perga-mon Press, London, pp. 113-120.
Jaeger, J. C. 1970. The Behavior of Closely Jointed Rock. In Proc., 11th Symposium on Rock Me-chanics, Berkeley, California, American Society of Civil Engineers, New York, pp. 57-68.
Jaeger, J. C., and N. G. W. Cook. 1976. Funda-mentals of Rock Mechanics. Chapman and Hall, London, 585 pp.
Ley, G. M. M. 1972. The Properties of Hydrothermally Altered Granite and Their Application to Slope Stability in Open Cast Mining. M.Sc. thesis. Lon-don University.
Marsal, R. J. 1973. Mechanical Properties of Rock Fill. In Embankment Dam Engineering-Casa-grande Volume (R. C. Hirschfield and S. J. Paulos, eds.), J. Wiley and Sons, New York, pp. 109-200.
Mearz, N. H., J. A. Franklin, and C. P. Bennett. 1990. Joint Roughness Measurement Using Shadow
Profilometry. International Jour-nal of Rock Me-chanics and Mining Sciences & Geomechanics Abstracts, Vol. 27, No. 5, pp. 329-343.
Middlebrook, T. A. 1942. Fort Peck Slide. Proc., American Society of Civil Engineers, Vol. 107, Paper 2144, pp. 723.
Patton, F. D. 1966. Multiple Modes of Shear Failure in Rock. In Proc., First Congress of the Interna-tional Society for Rock Mechanics, Lisbon, National Laboratory of Civil Engineering, Lisbon, Portu-gal, Vol. 1, pp. 509-5 13.
Roberts, D., and E. Hoek. 1972. A Study of the Stability of a Disused Limestone Quarry Face in the Mendip Hills, England. In Proc., First Inter-national Conference on Stability in Open Pit Mining, Vancouver, Canada, American Institute of Mining Engineers, New York, pp. 239-256.
Ross-Brown, D. R. 1973. Slope Design in Open Cast Mines. Ph.D. thesis. London University, 250 pp.
Skempton, A. W., and J. N. Hutchinson. 1969. Sta-bility of Natural Slopes and Embankment Foun-dations: State of the Art Report. In Proc., Seventh International Conference on Soil Mechanics and Foundation Engineering, Mexico, Mexican Society for Soil Mechanics, Mexico City, Vol. 1, pp. 291-340.
Trollope, D. H. 1980. The Vaiont Slope Failure. Rock Mechanics, Vol. 13, No. 2, pp. 71-88.
Tse, R., and D. M. Cruden. 1979. Estimating Joint Roughness Coefficients. International Journal of Rock Mechanics and Mining Sciences & Geome-chanics Abstracts, Vol. 16, pp. 303-307.
Whitman, R. V., and W. A. Bailey. 1967. Use of Computers for Slope Stability Analysis. Journal of the Soil Mechanics and Foundations Division, ASCE, Vol. 93, pp. 475-498.
Wu, T. H., E. M. Ali, and H. S.U. Pinnaduwa. 1981. Stability of Slopes in Shale and Colluvium. Project No. EES 576. Ohio Department of Trans-portation and Federal Highway Administration, 229 pp.
Wyllie, D. C. 1992. Foundations on Rock. Chapman and Hall, London, 331 pp.
Wyllie, D. C., and F. J. Munn. 1979. Use of Move-ment Monitoring to Minimize Production Losses Due to Pit Slope Failures. In Proc., First Inter-national Symposium on Stability in Coal Mining, Vancouver, Canada, Miller Freeman Publica-tions, pp. 75-94.
Yu, X., and B. Vayssade. 1991. Joint Profiles and Their Roughness Parameters. International Journal of Rock Mechanics and Mining Sciences & Geo-mechanics Abstracts, Vol. 16, No, 4, pp. 333-336.