The Use of Artificial Neural Network (ANN) for Modelling...
21
6 The Use of Artificial Neural Network (ANN) for Modelling, Simulation and Prediction of Advanced Oxidation Process Performance in Recalcitrant Wastewater Treatment Emad S. Elmolla 1 and Malay Chaudhuri 2 1 Dept. of Civil Engineering, Faculty of Engineering, Al-Azhar University, Cairo, 2 Dept. of Civil Engineering, Universiti Teknologi PETRONAS, Tronoh, Perak, 1 Egypt 2 Malaysia 1. Introduction Treatment of recalcitrant wastewater by advanced oxidation processes (AOPs) is influenced by several factors. Due to complexity of the processes, they are difficult to be modelled and simulated using conventional mathematical modelling. Artificial neural network is used in many areas of science and engineering as a promising tool because of its simplicity in simulation, prediction and modelling of process performance (Prakash et al., 2008). The chapter presents artificial neural network and training of artificial neural network, advanced oxidation processes (AOPs), case studies, conclusions and references. 2. Artificial Neural Network (ANN) The ANN is an artificial intelligence technique that mimics the human brain’s biological neural network in the problem solving processes. As humans solve a new problem based on the past experience, a neural network takes previously solved examples, looks for patterns in these examples, learns these patterns and develops the ability to correctly classify new patterns. In addition, the neural network has the ability to resemble human characteristics in problem solving that is difficult to simulate using the logical, analytical techniques of expert system and standard software technologies (Daosud et al., 2005). A neural network is defined as a system of simple processing elements called neurons, which are connected to a network by a set of weights. The neuron is a processing element that takes a number of inputs, weighs them, sums them up, adds a bias and uses the outcome as the argument for a singule-valued function (transfer function) which results in the neuron’s output (Strik et al., 2005). The network is determined by the architecture of the network, the magnitude of the weights and the processing element’s mode of operation. At the start of training, the output of each node tends to be small. Consequently, the derivatives of the transfer function and changes in the connection weights are large with respect to the input. As learning progresses and the network reaches a local minimum in error surface, the node outputs approach stable values. Consequently, the derivatives of the transfer function www.intechopen.com
Transcript of The Use of Artificial Neural Network (ANN) for Modelling...

6
The Use of Artificial Neural Network (ANN) for Modelling, Simulation and Prediction of
Advanced Oxidation Process Performance in Recalcitrant Wastewater Treatment
Emad S. Elmolla1 and Malay Chaudhuri2 1Dept. of Civil Engineering, Faculty of Engineering, Al-Azhar University, Cairo,
2Dept. of Civil Engineering, Universiti Teknologi PETRONAS, Tronoh, Perak, 1Egypt
2Malaysia
1. Introduction
Treatment of recalcitrant wastewater by advanced oxidation processes (AOPs) is influenced by several factors. Due to complexity of the processes, they are difficult to be modelled and simulated using conventional mathematical modelling. Artificial neural network is used in many areas of science and engineering as a promising tool because of its simplicity in simulation, prediction and modelling of process performance (Prakash et al., 2008). The chapter presents artificial neural network and training of artificial neural network, advanced oxidation processes (AOPs), case studies, conclusions and references.
2. Artificial Neural Network (ANN)
The ANN is an artificial intelligence technique that mimics the human brain’s biological neural network in the problem solving processes. As humans solve a new problem based on the past experience, a neural network takes previously solved examples, looks for patterns in these examples, learns these patterns and develops the ability to correctly classify new patterns. In addition, the neural network has the ability to resemble human characteristics in problem solving that is difficult to simulate using the logical, analytical techniques of expert system and standard software technologies (Daosud et al., 2005). A neural network is defined as a system of simple processing elements called neurons, which are connected to a network by a set of weights. The neuron is a processing element that takes a number of inputs, weighs them, sums them up, adds a bias and uses the outcome as the argument for a singule-valued function (transfer function) which results in the neuron’s output (Strik et al., 2005). The network is determined by the architecture of the network, the magnitude of the weights and the processing element’s mode of operation. At the start of training, the output of each node tends to be small. Consequently, the derivatives of the transfer function and changes in the connection weights are large with respect to the input. As learning progresses and the network reaches a local minimum in error surface, the node outputs approach stable values. Consequently, the derivatives of the transfer function
www.intechopen.com

Artificial Neural Networks - Application
106
with respect to input, as well as changes in the connection weights, are small (Maier and Dandy, 1998). The different types of neural network based on their incremental complexity are: feedforward, recurrent, stochastic and modular network (Prakash et al., 2008). The chapter will focus on the feedforward network which is widely used in the area of wastewater treatment.
2.1 Feedforward ANN
The feedforward ANN is composed of two or more layers of processing elements which are linked by weighted connections (Figure 1). The information flow is unidirectional, no feedback connections are present and data are presented to input layer, passed on to hidden layer and passed on to output layer.
Fig. 1. Feedforward ANN
2.2 Training of Artificial Neural Network
According to Artificial neural network tutorial (2008), the learning situation can be categorized as the following.
Supervised learning
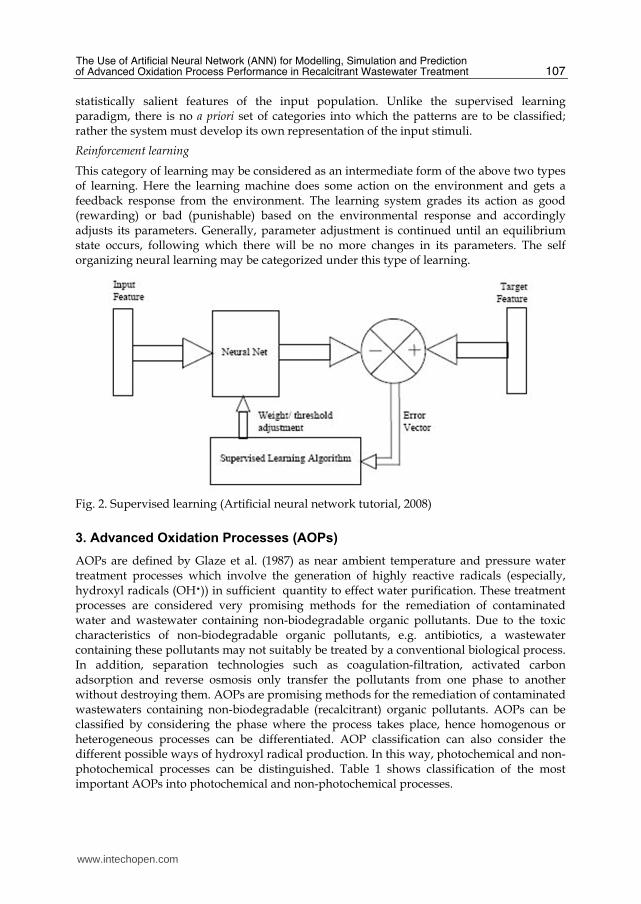
In supervised or associative learning, the network is trained by providing it with input and matching output patterns. Backpropagation is a form of supervised training. Using the actual outputs, the backpropagation training algorithm takes a calculated error and adjusts the weights of the various layers backwards from the output layer to the input layer. It means adjusting the weights in neurons with regard to the difference between the outputs predicted by the model and the actual outputs (Figure 2).
Unsupervised learning
In unsupervised learning or self-organisation, an output unit is trained to respond to clusters of pattern within the input. In this paradigm, the system is supposed to discover
www.intechopen.com
The Use of Artificial Neural Network (ANN) for Modelling, Simulation and Prediction of Advanced Oxidation Process Performance in Recalcitrant Wastewater Treatment
107
statistically salient features of the input population. Unlike the supervised learning paradigm, there is no a priori set of categories into which the patterns are to be classified; rather the system must develop its own representation of the input stimuli.
Reinforcement learning
This category of learning may be considered as an intermediate form of the above two types of learning. Here the learning machine does some action on the environment and gets a feedback response from the environment. The learning system grades its action as good (rewarding) or bad (punishable) based on the environmental response and accordingly adjusts its parameters. Generally, parameter adjustment is continued until an equilibrium state occurs, following which there will be no more changes in its parameters. The self organizing neural learning may be categorized under this type of learning.
Fig. 2. Supervised learning (Artificial neural network tutorial, 2008)
3. Advanced Oxidation Processes (AOPs)
AOPs are defined by Glaze et al. (1987) as near ambient temperature and pressure water treatment processes which involve the generation of highly reactive radicals (especially, hydroxyl radicals (OH�)) in sufficient quantity to effect water purification. These treatment processes are considered very promising methods for the remediation of contaminated water and wastewater containing non-biodegradable organic pollutants. Due to the toxic characteristics of non-biodegradable organic pollutants, e.g. antibiotics, a wastewater containing these pollutants may not suitably be treated by a conventional biological process. In addition, separation technologies such as coagulation-filtration, activated carbon adsorption and reverse osmosis only transfer the pollutants from one phase to another without destroying them. AOPs are promising methods for the remediation of contaminated wastewaters containing non-biodegradable (recalcitrant) organic pollutants. AOPs can be classified by considering the phase where the process takes place, hence homogenous or heterogeneous processes can be differentiated. AOP classification can also consider the different possible ways of hydroxyl radical production. In this way, photochemical and non-photochemical processes can be distinguished. Table 1 shows classification of the most important AOPs into photochemical and non-photochemical processes.
www.intechopen.com

Artificial Neural Networks - Application
108
Photochemical process Non-photochemical process
Photo-Fenton (UV/Fe2+/H2O2) Fenton (Fe2+/H2O2)
UV/O3 O3/H2O2
UV/H2O2 O3/Ultrasound
UV/H2O2/O3 Ozonation (O3/OH-)
Heterogeneous photocatalysis (UV/TiO2) H2O2/Ultrasound
Table 1. Classification of AOPs as photochemical and non-photochemical processes
The chapter will focus on the Fenton, photo-Fenton, UV/H2O2, heterogeneous photocatalysis and ozonation, and these processes are described in the following sections.
3.1 Fenton and photo-Fenton processes
Fenton and photo-Fenton are homogenous advanced oxidation process. The Fundamentals
of these processes as well as the main factors affecting the process are described below.
Fundamentals of Fenton Reactions
The Fenton reaction was discovered by Fenton (1894) and forty year later, the reaction
mechanism was described by Haber and Weiss (1934). In the Fenton reaction, hydroxyl
radicals (OH�) are generated by interaction of H2O2 with ferrous salts as in Reaction (1).
Fe2+ + H2O2 → Fe3+ + OH� + OH- (1)
Generated Fe3+ can be reduced by reaction with exceeding H2O2 to form again ferrous ion
and more radicals. This second process is called Fenton-like and it is slower than Fenton
reaction as in Reactions 2 and 3 (Sychev and Isaak, 1995).
Fe3+ + H2O2 → HO2� + Fe2+ + H+ (2)
Fe3+ + HO2� → Fe2+ + O2 + H+ (3)
Other important dark reactions involving ferrous ion and hydrogen peroxide in absence of
other interfering ions and organic substances are shown in Reactions 4-6.
Fe2+ + HO2� + H+ → Fe3+ + H2O2 (4)
Fe2+ + OH� → Fe3+ + OH- (5)
H2O2 + OH� → HO2� + H2O (6)
The below listed radical-radical reactions, as well as the auto-decomposition of H2O2 are
also part of the complex process as shown in Reactions 7-10.
2H2O2 → 2H2O + O2 (7)
2OH� → H2O2 (8)
2HO2� → H2O2 + O2 (9)
HO2� + OH� → H2O + O2 (10)
www.intechopen.com

The Use of Artificial Neural Network (ANN) for Modelling, Simulation and Prediction of Advanced Oxidation Process Performance in Recalcitrant Wastewater Treatment
109
Fundamentals of Photo-Fenton Reactions
Fenton reaction rate is strongly increased by irradiation with UV/visible light (Kiwi et al., 1994; Huston & Pignatello, 1999). During the reaction, Fe3+ ions accumulate in the system and after Fe2+ are consumed, the reaction practically stops. Photochemical regeneration (Reaction 11) of Fe2+ ions by photoreduction of Fe3+ ions was proposed (Huston & Pignatello, 1999). The newly generated ferrous ion reacts with H2O2 generating a second OH� radical and Fe3+ and the cycle continues.
Fe3+ + H2O + hυ → Fe2+ + OH� (11)
The main factors affecting Fenton and photo-Fenton processes are summarized below.
Initial H2O2 Concentration
Degradation rate of the organics increases with increase of H2O2 concentration. This could be explained by the effect of the additionally produced OH� radicals (Zhao et al., 2004). However, above a certain H2O2 concentration, the reaction rate levels off and sometimes is negatively affected by the increase of H2O2 concentration. This may be due to scavenging of OH� by H2O2 as in Reaction 6 (Kavitha and Palanivelu, 2005). Therefore, H2O2 should be added at an optimal concentration to achieve the best degradation. This optimal H2O2 concentration depends on the nature and concentration of the pollutants and the iron concentration.
Initial Fe2+ Concentration
Degradation rate of the organics increases with increase of iron concentration; however,
above a certain iron concentration the efficiency decreases. This may be due to the
recombination of OH� radicals or increase of turbidity that hinders the absorption of the UV
light required for the photo-Fenton process. Fe2+ reacts with OH� radicals as a scavenger
(Reaction 5). It is desirable for Fe2+ or Fe3+ to be as small as possible, so recombination can be
avoided and iron complex production reduced (Kwon et al., 1999).
pH
The Fenton and photo-Fenton processes have a maximum activity at about pH 3. The pH
value influences the generation of OH� radicals and thus the oxidation efficiency of the
process. At higher pH, generation of OH� radicals decreases and this is due to the decrease
of dissolved iron as well as dissociation and auto-decomposition of H2O2 (Zhao et al., 2004).
At low pH, oxidation efficiency is lower due to solvation of hydrogen peroxide in presence
of high concentration of H+ to form stable oxonium ion (H3O2+), thus reducing substantially
its reactivity with ferrous ions (Kwon et al., 1999).
Temperature
Fenton and photo-Fenton processes are generally conducted at ambient temperature. However, temperature is a key parameter that has to be taken into account because thermal Fenton process is accelerated with increasing temperature (Arasasinghan et al., 1989). But high temperature (above 40 ºC) may decompose hydrogen peroxide to oxygen and water as in Reaction 7 (Nesheiwat & Swanson, 2000).
3.2 UV/H2O2 process
The UV/H2O2 system involves the formation of OH� radicals by hydrogen peroxide photolysis and subsequent propagation reactions. The mechanism most commonly accepted
www.intechopen.com

Artificial Neural Networks - Application
110
for the photolysis of H2O2 is the cleavage of the molecule into hydroxyl radicals as in Reaction 12.
H2O2 + hυ → 2OH� (12)
The major drawback of this process is that if the solution presents a strong absorbance, this can compete with hydrogen peroxide for the radiation. Thus, cloudy water or water containing compounds absorbing UV radiation can present problems in treatment by this method.
3.3 Heterogeneous photocatalysis
Heterogeneous photocatalysis is a technology based on the irradiation of a catalyst, usually a semiconductor, which may be photoexcited to form electron-donor sites (reducing sites) and electron-acceptor sites (oxidizing sites) providing great scope as redox reagents. The bands of interest in photocatalysis are the occupied valence band (VB) and the unoccupied conduction band (CB), separated by an energy distance referred to as the band gap (Ebg). When the semiconductor is illuminated with light of greater energy than that of the band gap, an electron is promoted from the VB to the CB leaving a positive hole in the valence band as illustrated in Figure 3 (Cardona, 2001). After separation, the electron (e-) and hole (h+) pair may recombine generating heat or can become involved in electron transfer reactions with other species in solution.
Fig. 3. Mechanism of semiconductor photocatalysis (Cardona, 2001).
Among the semiconductors, titanium dioxide (TiO2) has proven to be the most suitable for widespread environmental applications. TiO2 is biologically and chemically inert; it is stable to photo and chemical corrosion, and inexpensive. Furthermore, TiO2 is of special interest since it can be photoexcited by natural (solar) UV radiation. This is because TiO2 has an appropriate energetic separation between its valence and conduction bands, which can be surpassed by the energy of a solar photon. The VB and CB energies of the TiO2 are estimated
to be +3.1 and −0.1 eV, respectively, which means that its band gap is 3.2 eV and therefore absorbs in the near UV region (λ<387 nm)
Mechanism of TiO2 Photocatalysis
Reaction mechanisms of photocatalytic processes have been discussed in the literature (Sadik et al., 2007). When a semiconductor such as TiO2 is illuminated by photons having an energy level that exceeds their band gap (hv > Ebg = 3.2 eV in case of TiO2), electrons (e-) are excited from the valence band to the conduction band and holes (h+) are produced in the valence band
www.intechopen.com

The Use of Artificial Neural Network (ANN) for Modelling, Simulation and Prediction of Advanced Oxidation Process Performance in Recalcitrant Wastewater Treatment
111
(Reaction 13). The photogenerated valence band holes react with either water (H2O) or hydroxyl ions (OH-) adsorbed on the catalyst surface to generate OH� radicals which are strong oxidants (Reaction 14 and 15). The hydroxyl radical reacts readily with surface adsorbed organic molecules, either by electron or hydrogen atom abstraction, forming organic radical cations, or by addition reactions to unsaturated bonds (Sadik et al., 2007) (Reaction 16). Since the reaction of the holes on the particle interface is faster than electrons, the particles under illumination contain an excess of electrons. Removal of these excess of electrons is necessary to complete the oxidation reaction, by preventing the recombination of electrons with holes. The most easily available electron acceptor is molecular oxygen and in presence of oxygen the predominant reaction of electrons is that with O2 to form superoxide ions (�O2−) as in Reaction (17). In acidic condition, superoxide ion combines with proton to form a hydroperoxide radical and it reacts with conduction band electron to form hydroperoxide ion. The hydroperoxide ion reacts with proton to form hydrogen peroxide. Cleavage of hydrogen peroxide by the conduction band electrons yields further hydroxyl radicals and hydroxyl ions (Reaction 18). The hydroxyl ions can then react with the valence band holes to form additional hydroxyl radicals. Recombination of the photogenerated electrons and holes may occur and indeed it has been suggested that preadsorption of substrate (organic substance) onto the photocatalyst is a prerequisite for highly efficient degradation.
TiO2+ hv → TiO2 (e- + h+) (13)
h+ + H2O → H+ + OH� (14)
h++ OH− → OH� (15)
Organics + OH� → products (16)
e− + O2 →�O2− (17)
H2O2 + e- → OH�+OH- (18)
Main Factors Affecting Photocatalytic
The main factors affecting photocatalysis reactions are described below.
Catalyst Concentration
The reaction rate is affected by the catalyst concentration; however, above a certain concentration value the reaction rate becomes independent of catalyst concentration. This limit depends on the nature of the pollutant and on the geometry and working conditions of the photoreactor corresponding to the maximum catalyst concentration in which all the particles are totally illuminated. Decrease of reaction rate at higher catalyst concentration may be due to decrease of light penetration or increase of light scattering (Kansal et al., 2007). Agglomeration and sedimentation of catalyst under high catalyst concentration may take place and available catalyst surface for photon absorption may decrease (San et al., 2007).
Temperature and pH
Experimental studies on dependence of the reaction rate of degradation of organic compounds on temperature have been conducted (Evgenidou et al., 2005). Generally, increase in temperature enhances recombination of charge carriers and desorption process of adsorbed reactant species, resulting in decrease of photocatalytic activity.
www.intechopen.com

Artificial Neural Networks - Application
112
Nature of the Photocatalyst
A very important parameter influencing the performance of photocatalyst in photocatalytic oxidation is the surface morphology (Dinga et al., 2005). Numerous forms of photocatalyst have been synthesized by different methods to arrive at a photocatalyst exhibiting desirable physical properties, activity and stability for photocatalytic application (Gao & Liu, 2005). Smaller particle size is reported to give higher degradation of organic compounds (Maira et al., 2001).
Light Intensity
Photocatalytic reaction rate depends largely on the radiation absorption of the photocatalyst (Curcó et al., 2002). The increase of degradation rate with increase of light intensity during photocatalytic degradation have been reported (Qamar et al., 2006).
3.4 Ozonation
Ozonation is the oxidation process based on the use of ozone as basic compound. Ozone may be used alone or with other compounds such as UV radiation, hydrogen peroxide, activated carbon, etc. Ozone formation in the upper atmosphere is based on the photolysis of diatomic oxygen as in the following reaction:
O2 + hυ → 2O� (19)
O2 + 2O� → O3 (20)
The first use of ozone was reported at the end of the 19th century as a disinfectant in water
treatment plants, hospitals, and research centres such as the University of Paris where the
first doctoral thesis on ozonation was presented (Le Paulouë & Langlais 1999). Ozone is
known as a very reactive agent in both air and water and its high reactivity is due to its
electronic configuration. The half-life of ozone in water is highly dependent on the pH and
matrix content of the water. For example, the half-life of ozone in distilled water can vary
from about 102 sec at pH 12 to 105 sec at pH 2 or from 10 sec for secondary wastewater
effluents to 104 sec for certain ground and surface waters (Hoigné, 1998). The fundamentals
of ozonation is beyond the scope of this chapter.
4. Case studies
In this section, eight case studies on use of artificial neural network for modelling, simulation
and prediction of advanced oxidation process (Fenton, photo-Fenton, UV/H2O2, UV/TiO2 and
Ozonation) performance in recalcitrant wastewater treatment are summarized.
4.1 The use of Artificial Neural Network (ANN) for modeling of COD removal from antibiotic aqueous solution by the Fenton process
Elmolla et al. (2010) reported the implementation of artificial neural networks (ANNs) for
the prediction and simulation of antibiotic degradation in aqueous solution by the Fenton
process. Experimental data sets (120) were divided into input matrix [p] and target matrix
[t]. The input variables were reaction time (t), H2O2/COD molar ratio, H2O2/Fe2+ molar
ratio, pH and COD concentration. The corresponding COD removal was used as a target.
Principal component analysis (PCA) was performed on input data to filter out uncorrelated
www.intechopen.com

The Use of Artificial Neural Network (ANN) for Modelling, Simulation and Prediction of Advanced Oxidation Process Performance in Recalcitrant Wastewater Treatment
113
random data. The data sets were divided into training (one half), validation (one fourth) and
test (one fourth) subsets, each of which contained 60, 30 and 30 sets, respectively.
A three-layer backpropagation neural network was optimized to predict and simulate the
degradation of amoxicillin, ampicillin and cloxacillin in aqueous solution in terms of COD
removal. Figure 4 shows the optimized network. It was a three-layer ANN with tangent
sigmoid transfer function (tansig) at hidden layer with (1) neurons, linear transfer function
Fig. 4. Artificial neural network optimized structure (Elmolla et al., 2010)
(purelin) at output layer and Levenberg–Marquardt backpropagation training algorithm
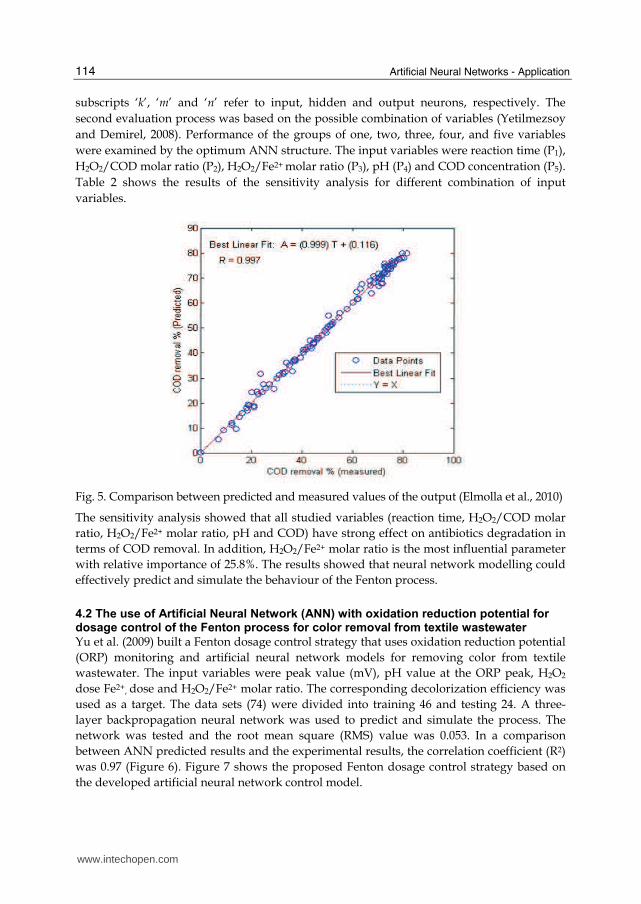
(LMA). The network was tested and the mean square error was 0.000376. In a comparison
between ANN predicted results and the experimental results, the correlation coefficient (R2)
was 0.997 (Figure 5). The sensitivity analysis was conducted using two methods. The first
one was based on the neural net weight matrix and Garson equation (Aleboyeh et al., 2008).
Garson (1991) proposed an equation based on the partitioning of connection weights
ih ih ho
1 1
ih ih ho
1 11
m Nh Ni
jm km mnm k
W W W
jm Nhk Ni Ni
km km mnk km
I
W W W
== =
⎛ ⎞⎛ ⎞÷ ×⎜ ⎟⎜ ⎟⎜ ⎟⎜ ⎟⎝ ⎠⎝ ⎠= === ==
∑ ∑⎧ ⎫⎛ ⎞÷ ×∑ ∑⎨ ⎬⎜ ⎟⎝ ⎠⎩ ⎭∑ (1)
where, Ij is the relative importance of the jth input variable on the output variable, Ni and Nh
are the numbers of input and hidden neurons, respectively, Ws are connection weights, the
superscripts ‘i’, ‘h’ and ‘o’ refer to input, hidden and output layers, respectively, and
www.intechopen.com
Artificial Neural Networks - Application
114
subscripts ‘k’, ‘m’ and ‘n’ refer to input, hidden and output neurons, respectively. The
second evaluation process was based on the possible combination of variables (Yetilmezsoy
and Demirel, 2008). Performance of the groups of one, two, three, four, and five variables
were examined by the optimum ANN structure. The input variables were reaction time (P1),
H2O2/COD molar ratio (P2), H2O2/Fe2+ molar ratio (P3), pH (P4) and COD concentration (P5).
Table 2 shows the results of the sensitivity analysis for different combination of input
variables.
Fig. 5. Comparison between predicted and measured values of the output (Elmolla et al., 2010)
The sensitivity analysis showed that all studied variables (reaction time, H2O2/COD molar
ratio, H2O2/Fe2+ molar ratio, pH and COD) have strong effect on antibiotics degradation in
terms of COD removal. In addition, H2O2/Fe2+ molar ratio is the most influential parameter
with relative importance of 25.8%. The results showed that neural network modelling could
effectively predict and simulate the behaviour of the Fenton process.
4.2 The use of Artificial Neural Network (ANN) with oxidation reduction potential for dosage control of the Fenton process for color removal from textile wastewater
Yu et al. (2009) built a Fenton dosage control strategy that uses oxidation reduction potential
(ORP) monitoring and artificial neural network models for removing color from textile
wastewater. The input variables were peak value (mV), pH value at the ORP peak, H2O2
dose Fe2+, dose and H2O2/Fe2+ molar ratio. The corresponding decolorization efficiency was
used as a target. The data sets (74) were divided into training 46 and testing 24. A three-
layer backpropagation neural network was used to predict and simulate the process. The
network was tested and the root mean square (RMS) value was 0.053. In a comparison
between ANN predicted results and the experimental results, the correlation coefficient (R2)
was 0.97 (Figure 6). Figure 7 shows the proposed Fenton dosage control strategy based on
the developed artificial neural network control model.
www.intechopen.com

The Use of Artificial Neural Network (ANN) for Modelling, Simulation and Prediction of Advanced Oxidation Process Performance in Recalcitrant Wastewater Treatment
115
Combination Mean square
error (MSE)
Epoch Correlation
coefficient (R2)
Best linear equation
P1 365.889 6 0.315 y = 3.71X +880
P2 276.46 8 0.599 y = 7.44X +763
P3* 270.141 10 0.616 y = 8.93X +689
P4 378.575 7 0.395 y = 3.15X +991
P5 404.727 12 0.284 y = 1,7X +953
P1+P2 0.500941 7 0.538 y = 0.409X +29.2
P1+P3 0.451707 8 0.649 y = 0.452X +25.9
P1+P4 0.65364 9 0.451 y = 0.32X +31.8
P1+P5 0.714965 6 0.391 y = 0.30X +38
P2+P3 0.415012 9 0.742 y = 0.528X +25
P2+P4 0.388861 5 0.764 y = 0.528X +24.3
P2+P5 0.552496 5 0.636 y = 0.405X +32.1
P3+P4* 0.304122 9 0.848 y = 0.701X +16.9
P3+P5 0.571864 10 0.646 y = 0.509X +23.5
P4+P5 0.755573 5 0.487 y = 0.232X +40.6
P1+P2+P3 0.313754 16 0.802 y = 0.642X +18.1
P1+P2+P4 0.2901 14 0.825 y = 0.675X +16.4
P1+P2+P5 0.453212 10 0.702 y = 0.675X +25.2
P1+P3+P4 0.141262 25 0.873 y = 0.873X +6.2
P1+P3+P5 0.43797 10 0.69 y = 0.57X +21.1
P1+P4+P5 0.583005 16 0.528 y = 0.57X +32.7
P2+P3+P4* 0.117252 12 0.936 y = 0.849X +9.37
P2+P3+P5 0.379122 47 0.77 y = 0.579X +23.1
P3+P4+P5 0.300483 25 0.85 y = 0.695X +17.1
P1+P2+P3+P4* 0.00278282 34 0.995 y = 0.997X +0.402
P1+P2+P3+P5 0.270749/0 25 0.818 y = 0.679X +15.7
P1+P2+P4+P5 0.264695 15 0.832 y = 0.682X +15.8
P1+P3+P4+P5 0.139748 15 0.912 y = 0.87X +6.27
P2+P3+P4+P5 0.113608 36 0.915 y = 0.862X +8.92
P1+P2+P3+P4+P5* 0.000376 20 0.997 y = 0.999X +0.116
* The best group performances according to number of parameters
Table 2. Evaluation of combination of input variables (Elmolla et al., 2010)
www.intechopen.com

Artificial Neural Networks - Application
116
Fig. 6. Correlation of measured color removal efficiency and control target for real textile
wastewater (Yu et al., 2009)
Fig. 7. Proposed Fenton dosage control strategy based on the developed artificial neural
network control model (Yu et al., 2009)
4.3 The use of Artificial Neural Network (ANN) for modeling of DOC removal from polyvinyl alcohol aqueous solution by the photo-Fenton process
Giroto et al. (2006) reported the implementation of artificial neural network (ANN) for
modelling of DOC removal from polyvinyl alcohol aqueous solution by the photo-Fenton
process. Experimental data sets (432) were divided into input matrix [p] and target matrix
www.intechopen.com

The Use of Artificial Neural Network (ANN) for Modelling, Simulation and Prediction of Advanced Oxidation Process Performance in Recalcitrant Wastewater Treatment
117
[t]. The input variables were reaction time (t), initial DOC, Fe2+ and H2O2 concentrations.
The corresponding DOC removal was used as a target. In a comparison between ANN
calculated DOC and the experimental DOC, the correlation coefficient (R2) was 0.966
(Figure 8).
Fig. 8. Comparison between calculated and experimental DOC (Giroto et al., 2006)
4.4 The use of Artificial Neural Network (ANN) for prediction of azo dye decolorization by UV/H2O2
Aleboyeh et al. (2008) developed an artificial neural network model for the prediction and simulation of photochemical decolorization of C.I. Acid Orange 7 solution by UV/H2O2
process. Experimental data sets were divided into input matrix [p] and target matrix [t]. The input variables were initial concentration of dye and hydrogen peroxide, the pH of the solution and time of UV irradiation. The corresponding decolorization efficiency was used as a target. The data sets (228) were divided into training (one half), validation (one fourth) and test (one fourth) subsets, each of which contained 114, 57 and 57 sets, respectively.
Fig. 9. Comparison between predicted and experimental decolorization (Aleboyeh et al., 2008)
www.intechopen.com

Artificial Neural Networks - Application
118
A three-layer backpropagation neural network was used to predict and simulate the process. Figure 9 shows the optimized network. It was a three-layer ANN with tangent sigmoid transfer function (tansig) at hidden layer with 14 neurons, linear transfer function (purelin) at output layer and scaled conjugate gradient algorithm training algorithm. The network was tested and the mean square error was 0.004. In a comparison between ANN predicted results and the experimental results, the correlation coefficient (R2) was 0.996 (Figure 10). The sensitivity analysis was conducted based on Garson equation (Equation 1) and it showed that all studied variables (initial concentration of the dye and H2O2, initial pH and reaction time) had considerable effects on decolorization. In addition, the initial concentration of H2O2 was the most influential parameter in the decolorization process with relative importance of 48.89%.
Fig. 10. Comparison between predicted and measured decolorization (Aleboyeh et al., 2008)
4.5 Decolorization process modeling by neural network
Guimarães et al. (2008) developed an artificial neural network model for the prediction and
simulation of photochemical decolorization of acid orange 52 dye solution by the UV/H2O2
process. The input variables were dye concentration, pH, hydrogen peroxide concentration,
temperature and time of operation. The corresponding absorbance was used as a target. A
three-layer backpropagation neural network was used to predict and simulate the process. It
was a three-layer ANN with tangent sigmoid transfer function (tansig) at hidden layer with
16 neurons, linear transfer function (purelin) at output layer and descending gradient
(learngdm) training algorithm. The neural network was trained with 218 samples and
utilized a configuration with a hidden layer and 16 neurons in the layer, presenting high
correlation coefficient of (R2) 0.991 (Figure 11). The sensitivity analysis using Garson
equation (Equation 1) showed that all studied variables (dye concentration, pH, hydrogen
peroxide concentration, temperature and time of operation) had considerable effects on the
decolorization.
www.intechopen.com

The Use of Artificial Neural Network (ANN) for Modelling, Simulation and Prediction of Advanced Oxidation Process Performance in Recalcitrant Wastewater Treatment
119
Fig. 11. Comparison between predicted and measured absorbance (Guimarães et al., 2008)
4.6 The use of Artificial Neural Network (ANN) for prediction of Methyl Tert-Butyl Ether (MTBE) degradation by UV/H2O2 process
Salari et al. (2005) proposed an artificial neural network model for the prediction and simulation MTBE concentration during irradiation time in optimized conditions of the UV/H2O2 process. The input variables were reaction time (t), initial concentration of MTBE, initial concentration of H2O2 and pH of the solution. The concentration of MTBE, as a function of reaction time ([MTBE]t), was used as a target. The data sets were divided into training (one half), validation (one fourth) and test (one fourth) subsets, each of which contained 32, 16 and 16 sets, respectively. Figure 12 shows the optimized network. It was a three-layer ANN with tangent sigmoid transfer function (tansig) at hidden layer with 14 neurons and linear transfer function (purelin) at output layer. The network was tested and
Fig. 12. Artificial neural network optimized structure (Salari et al., 2008)
www.intechopen.com

Artificial Neural Networks - Application
120
the mean square error was 0.0004. In a comparison between ANN predicted results and the experimental results, the correlation coefficient (R2) was 0.998 (Figure 13).
Fig. 13. Comparison between predicted and experimental results (Salari et al., 2008)
4.7 The use of Artificial Neural Network (ANN) for prediction of nitrogen oxides removal efficiency by TiO2 photocatalysis
Toma et al. (2004) predicted the photocatalytic removal efficiency of nitrogen oxides (NO and NOx) over a TiO2 powder (Degussa P25). The network input layer contained three neurons representing powder quantity, irradiation time and surface, respectively. The output layer comprised two neurons representing the photocatalytic efficiency in terms of NO and NOx. The data of 488 experimental sets were used to feed an ANN structure. Figure 14 shows the optimized ANN structure characterized by three hidden layers containing seven, four and three neurons, respectively. Correlations were learnt from the database with a percentage of 98.57%. The overall optimization error was on average less than 5%.
Fig. 14. Artificial neural network optimized structure (Toma et al., 2004)
www.intechopen.com

The Use of Artificial Neural Network (ANN) for Modelling, Simulation and Prediction of Advanced Oxidation Process Performance in Recalcitrant Wastewater Treatment
121
4.8 The use of Artificial Neural Network (ANN) modeling of humic substance removal from an aqueous solution by ozonation Oguz et al. (2008) modelled the removal of humic substances from aqueous solution by ozonation. The input variables to the neural network were treatment time (t), initial concentration of humic substance, powdered activated carbon dose (PAC), ozone-air flow rate, ozone generation potential, pH, temperature and HCO3− ion concentration. The output variable was humic substance removal. The best result was obtained from the Levenberg–Marquardt algorithm, hyperbolic tangent function in the hidden layer and the linear activation function in the output layer. As shown in Figure 15, the optimized network structure was 8 neurons at the input layer, 1 neuron at the hidden layer and 1 neuron at the output layer. In a comparison between ANN predicted values and the observed values, the correlation coefficient (R2) was 0.995 with standard deviation ratio 0.065, mean absolute error 4.057 and root mean square error 5.4967 (Figure 16).
Fig. 15. Artificial neural network optimized structure (Oguz et al., 2008)
Fig. 16. Comparison between predicted and observed values (Oguz et al., 2008)
5. Conclusions
Artificial neural network is a promising tool for simulation, modelling and prediction of advanced oxidation process (AOP) performance. The output of modelling can be used for
www.intechopen.com
Artificial Neural Networks - Application
122
sensitivity analysis and to study the dynamic behaviour of the AOP. More research should be done for application of other artificial intelligent technique such as Neuro-fuzzy for prediction as well as control the process.
6. References
Aleboyeh, A.; Kasiri, M.B.; Olya, M.E. & Aleboyeh, H. (2008). Prediction of azo dye decolorization by UV/H2O2 using artificial neural networks. Dyes and Pigments, 77, 288-294.
Arasasinghan, R.D.; Cornman, C.R. & Balch, A.L. (1989). Detection of alkylperoxo and ferryl, (FeIV=O)2+, intermediates during the reaction of tert-butyl hydroperoxide with iron porphyrins in toluene solution. Journal of the American Chemical Society, 111, 7800-7805.
Artificial neural network tutorial, 2008, http://www.learnartificialneuralnetworks.com/ access September 2009
Cardona, S.P.P. (2001). Coupling of photocatalytic and biological processes as a contribution to the detoxification of water: catalytic and technological aspects. PhD thesis, Thesis No. 2470, Institute of Environmental Engineering, Department of Rural Engineering, EPFL, Lausanne, Switzerland.
Curcó, D.; Gimènez, J.; Addardak, A.; Cervera-March, S. & Esplugas, S. (2002). Effects of radiation absorption and catalyst concentration on the photocatalytic degradation of pollutants. Catalysis Today, 76,177-188.
Daosud, W.; Thitiyasook, P.; Arpornwichanop, A.; Kittisupakorn, P. & Hussain, M. (2005). Neural network inverse model-based controller for the control of a steel pickling process. Computers & Chemical Engineering, 29, 2110–2119.
Dinga, H.; Suna, H. & Shan, Y. (2005). Preparation and characterization of mesoporous SBA-15 supported dye-sensitized TiO2 photocatalyst. Journal of Photochemistry and Photobiology A: Chemistry, 169, 101-107.
Elmolla, E.S. ; Chaudhuri, M. & Eltoukhy, MM. (2010). The use of artificial neural network (ANN) for modeling of COD removal from antibiotics aqueous solution by Fenton process. Journal of Hazardous Materials, 179, 127-134.
Evgenidou, E.; Fytianos, K. & Poulios, I. (2005). of dichlorvos in water using TiO2 and ZnO as catalysts. Applied Catalysis B: Environmental, 59, 81-89.
Fenton, H.J.H. (1894). Oxidation of tartaric acid in the presence of iron. Journal of the Chemical Society, 65, 899-910.
Gao, Y. & Liu, H. (2005). Preparation and catalytic property study of a novel kind of suspended photocatalyst of TiO2-activated carbon immobilized on silicone rubber film. Materials Chemistry and Physics, 92, 604-608.
Garson, G.D. (1991). Interpreting neural-network connection weights. AI Expert, 6, 47-51. Giroto, J.A.; Guardani, R.; Teixeira, A.C.S.C. & Nascimento, C.A.O. (2006). Study on the
photo-Fenton degradation of polyvinyl alcohol in aqueous solution. Chemical Engineering and Processing, 45, 523–532.
Glaze, W.H., Kang, J.W. & Chapin, D.H. (1987). The chemistry of water treatment processes involving ozone, hydrogen peroxide and ultraviolet radiation. Ozone: Science & Engineering, 9, 335-352.
Guimarães, O.L.C. ; Chagas, M.H.D.R. ; Filho, D.N.V. ; Siqueira, A.F. ; Filho, H.J I. ; Aquino, H.O.Q.D. & Silva, M.B. (2008). Discoloration process modeling by neural network. Chemical Engineering Journal, 140, 71–76.
www.intechopen.com

The Use of Artificial Neural Network (ANN) for Modelling, Simulation and Prediction of Advanced Oxidation Process Performance in Recalcitrant Wastewater Treatment
123
Haber, F. & Weiss, J. (1934). The catalytic decomposition of hydrogen peroxide by iron salts. Proceedings of the Royal Society of London. Series A, Mathematical and Physical Sciences, 147, 332-351.
Hoigné , J. (1998). Chemistry of aqueous ozone and transformation of pollutants by ozonation and advanced oxidation processes. In: Hrubec, J. ed. The Handbook of Environmental Chemistry. Vol. 5. Part C. Quality and Treatment of Drinking Water II. Berlin: Springer-Verlag.
Huston, P.L. & Pignatello, J. 1999. Degradation of selected pesticide active ingredients and commercial formulations in water by the photo-assisted Fenton reaction. Water Research, 33, 1238-1246.
Kansal, S.K.; Singh, M. & Sud, D. (2007). Studies on photodegradation of two commercial dyes in aqueous phase using different photocatalysts. Journal of Hazardous Materials, 141, 581-590.
Kavitha, V. & Palanivelu, K. (2005). Destruction of cresols by Fenton oxidation process. Water Research, 39, 3062–3072.
Kiwi, J.; Pulgarin C. & Peringer, P. (1994). Effect on Fenton and photo-Fenton reactions on the degradation and biodegradability of 2 and 4-nitrophenols in water treatment. Applied Catalysis B: Environmental, 3, 335-350.
Kwon, B.G.; Lee, D.S.; Kang, N. & Yoon, J. (1999). Characteristics of p-chlorophenol oxidation by Fenton’s reagent. Water Research, 33, 2110–2118.
Le Paulouë, J. & Langlais, B. (1999). State of the art of ozonation in France. Ozone: Science & Engineering, 21,153–162.
Maier, H.R. & Dandy, G.C. (1998). Understanding the behavior and optimizing the performance of back-propagation neural networks: an empirical study. Environmental Modelling & Software, 13, 179-191
Maira, A.J.; Yeung, K.L.; Soria, J.; Coronado ; Belver ; J.M.C. ; Lee, C.Y. & Augugliaro, V. (2001). Gas-phase photo-oxidation of toluene using nanometer-size TiO2 catalysts. Applied Catalysis B: Environmental, 29, 327-336.
Nesheiwat, F.K. & Swanson, A.G. (2000). Clean contaminated sites using Fenton’s reagent. Chemical Engineering Progress, 96, 61-66.
Oguz, E. ; Tortum, A. & Keskinler, B. (2008). Determination of the apparent rate constants of the degradation of humic substances by ozonation and modeling of the removal of humic substances from the aqueous solutions with neural network. Journal of Hazardous Materials, 157, 455–463.
Prakash, S.N. ; Manikandan, A. ; Govindarajan, L. & Vijayagopal, V. (2008). Prediction of biosorption efficiency for the removal of copper (II) using artificial neural networks. Journal of Hazardous Materials, 152, 1268–1275.
Qamar, M. ; Muneer, M. & Bahnemann, D. (2006). Heterogeneous photocatalysed degradation of two selected pesticide derivatives, triclopyr and daminozid in aqueous suspensions of titanium dioxide. Journal of Environmental Management, 80, 99-106.
Sadik, W.A. ; Nashed, A.W. & El-Demerdash, A.M. (2007). Photodecolourization of ponceau 4R by heterogeneous photocatalysis. Journal of Photochemistry and Photobiology A: Chemistry, 189, 135–140.
Salari, D. ; Daneshvar, N. ; Aghazadeh, F. & Khataee, A.R. (2005). Application of artificial neural networks for modeling of the treatment of wastewater contaminated with
www.intechopen.com

Artificial Neural Networks - Application
124
methyl tert-butyl ether (MTBE) by UV/H2O2 process. Journal of Hazardous Materials, B125, 205–210.
San, N. ; Kilic, M.; Tuiebakhova, Z. & Cinar, Z. (2007). Enhancement and modeling of the photocatalytic degradation of benzoic acid. Journal of Advanced Oxidation Technologies, 10, 43–50.
Strik, D.P.BT.B. ; Domnanovich, A.M ; Zani, L.; Braun, R. & Holubar, P. (2005). Prediction of trace compounds in biogas from anaerobic digestion using the MATLAB neural network toolbox. Environmental Modelling & Software, 20, 803-810.
Sychev, A.Y. & Isaak, V.G. (1995). Iron compounds and the mechanisms of the homogeneous catalysis of the activation of O2 and H2O2 and of the oxidation of organic substrates. Russian Chemical Reviews Articles, 64, 1105-1129.
Toma, F.L. ; Guessasma, S. ; Klein, D. ; Montavon, G. ; Bertrand, G. & Coddet C. 2004. Neural computation to predict TiO2 photocatalytic efficiency for nitrogen oxides removal. Journal of Photochemistry and Photobiology A: Chemistry, 165, 91–96.
Yu, R-F. ; Chen, H-W. ; Cheng, W-P. & Hsieh, P-H. (2009). Dosage control of the fenton process for color removal of textile wastewater applying ORP monitoring and artificial neural networks. Journal of Environmental Engineering, 135, 325-332.
Zhao, X. ; Yang, G. ; Wang, Y. & Gao, X. (2004). Photochemical degradation of dimethyl phthalate by Fenton reagent. Journal of Photochemistry and Photobiology A: Chemistry,161, 215–220.
www.intechopen.com
Artificial Neural Networks - ApplicationEdited by Dr. Chi Leung Patrick Hui
ISBN 978-953-307-188-6Hard cover, 586 pagesPublisher InTechPublished online 11, April, 2011Published in print edition April, 2011
InTech EuropeUniversity Campus STeP Ri Slavka Krautzeka 83/A 51000 Rijeka, Croatia Phone: +385 (51) 770 447 Fax: +385 (51) 686 166www.intechopen.com
InTech ChinaUnit 405, Office Block, Hotel Equatorial Shanghai No.65, Yan An Road (West), Shanghai, 200040, China
Phone: +86-21-62489820 Fax: +86-21-62489821
This book covers 27 articles in the applications of artificial neural networks (ANN) in various disciplines whichincludes business, chemical technology, computing, engineering, environmental science, science andnanotechnology. They modeled the ANN with verification in different areas. They demonstrated that the ANN isvery useful model and the ANN could be applied in problem solving and machine learning. This book issuitable for all professionals and scientists in understanding how ANN is applied in various areas.
How to referenceIn order to correctly reference this scholarly work, feel free to copy and paste the following:
Emad S. Elmolla and Malay Chaudhuri (2011). The Use of Artificial Neural Network (ANN) for Modelling,Simulation and Prediction of Advanced Oxidation Process Performance in Recalcitrant Wastewater Treatment,Artificial Neural Networks - Application, Dr. Chi Leung Patrick Hui (Ed.), ISBN: 978-953-307-188-6, InTech,Available from: http://www.intechopen.com/books/artificial-neural-networks-application/the-use-of-artificial-neural-network-ann-for-modelling-simulation-and-prediction-of-advanced-oxidati