The U.S. Mutual Fund Market: an updated study of the ... … · In reality, there are many factors...
57
THE UNIVERSITY OF GRONINGEN The U.S. Mutual Fund Market: an updated study of the Equity-Retail-Domestic Open-ended Fund 2005-2012 Author: Jinda Mei Student number: S2164957 University of Groningen Faculty of Economics and Business Master Finance Supervisor: Prof. Dr. R.A.H. Van der Meer June 2013
Transcript of The U.S. Mutual Fund Market: an updated study of the ... … · In reality, there are many factors...

THE UNIVERSITY OF GRONINGEN
The U.S. Mutual Fund Market: an updated study of the
Equity-Retail-Domestic Open-ended Fund 2005-2012
Author:
Jinda Mei
Student number:
S2164957
University of Groningen
Faculty of Economics and Business
Master Finance
Supervisor:
Prof. Dr. R.A.H. Van der Meer
June 2013
THE UNIVERSITY OF GRONINGEN
- 1 -
The U.S. Mutual Fund Market: an updated study of the
Equity-Retail-Domestic Open-ended Fund 2005-2012
ABSTRACT
This article examines the effects of mutual funds’ fees, size, age, and active management on fund
expense ratio and performance of nearly 1000 equity-retail-domestic open-ended funds in the US.
From the period 2005 through 2012 the empirical analysis finds that: first, the loaded funds are
more expensive than no-load funds, the 12b-1 funds are more expensive than non 12b-1 funds,
and the actively managed funds are more expensive than index funds. Secondly, the front-end
load, redemption fee, and 12b-1 fee are dead weight losses to investors. Moreover, bigger and
more mature funds on average are cheaper and better-performing than smaller and newly issued
funds. Lastly, the new finding in this study is that not only the index funds but also the stock
picking funds and moderately active funds all beat the benchmarks after expenses; while the
concentrated funds and factor betting funds underperform.
Key words: mutual funds, fees, active share, tracking error, information ratio
JEL Classification: G10, G11, G20, G23
Amount of words: 14529

THE UNIVERSITY OF GRONINGEN
- 2 -
PREFACE
First, the main aim of this research is to make a contribution to the academic
research in the equity retail mutual fund field regarding to the funds’ fees, size, age,
active management, expenses and performance. Moreover, I believe that this paper
will also be interested to the investors and mutual fund companies, as it provides
valuable information for making investment decisions and fund managing.
I would like to express my special thanks and gratitude to my supervisor, Prof. Dr.
Robert van der Meer for leading me through this study. His invaluable guidance,
patience, and encouragement will always be appreciated.
I would like to thank Standard & Poor’s and Frank Russell Co. for providing data
for this study.
I would also like to thank my dear friends Yachen Li and Andrii Antonov for their
continued support and encouragement.
Groningen
June 2013
THE UNIVERSITY OF GRONINGEN
- 3 -
MUTUAL FUNDS have been a popular investment choice for retail investors since
1970s. The household ownership of mutual fund has increased dramatically from 5.7% in
1980 to 89.23% of total net assets (13 trillion) in the U.S. in 2012 (ICI, 2012). There are
52.3 million households (44% of the total U.S. households) and 90.4 million U.S.
individuals who own mutual funds in 2011. People invest in mutual funds with several
reasons. First, the transaction fees are relatively low, because they can be bought easily
through an intermediary, or directly via telephone or internet. Moreover, investors can
hold a share of a diversified portfolio with a limit amount of money. Thirdly, the
customer service of mutual funds enables investors transfer money between funds within
the same family at a very low cost. In addition, they can buy and sell funds at net asset
value at any time. Finally, retail investors can get financial experts who can run the fund
professionally (Pozen, 1998).
Mutual funds are also named as open-ended funds which are pools of financial
instruments that may include stocks, bonds, commercial paper, cash and other
instruments (Alamuddin & Callaban, 2006; SEC1). There are four classes of mutual fund:
money market funds, bond funds, equity funds, and hybrid funds. Money market funds
are the funds which invest in the money market instruments, which are fixed income
securities with a very short time to maturity and high credit quality. Bond funds mainly
invest in the bonds which are fixed income securities. Equity funds, as the name suggests,
are the funds that mainly invest in the stocks. The hybrid funds invest in the bonds, equity
or other investments. From the investment geographic point of view, mutual funds can be
divided into domestic funds and international funds. Last but not least, mutual funds can
be retail funds or institutional funds. The retail funds are traded and available to the
general public. While, the institutional funds are available to a limited set of investors,
including larger financial service providers like banks, and insurance companies etc
(Alamuddin & Callaban, 2006).
1SEC is short for U.S. Securities and Exchange Commission that provides all kinds of information about
mutual funds, as well as the differences between mutual funds and other investment vehicles.
http://www.sec.gov/investor/pubs/inwsmf.htm
THE UNIVERSITY OF GRONINGEN
- 4 -
With the popularity of mutual funds, a lot of research has been done in this field.
Treynor (1966), Sharp (1966) and Jensen (1968, 1969) studied the performance of
fund, they find that after expenses, mutual fund perform worse than what investors can
earn through a naïve buy and hold strategy. Later on, with different time periods,
frequencies, and choice of benchmarks, researchers find mutual fund managers were
able to justify the expenses they charge (Friend, Blume, and Crockett, 1970;
Willianmson, 1972; McDonald, 1974; and Creshaw, 1977). Chen, Hong, Huang and
Kubik (2004) found strong evidence that fund size erodes performance based on the
US mutual fund data from 1962 to 1999. Ferris and Yan (2008) present that funds
managed by public fund families acquire more funds and charge higher fees than those
managed by private fund families during the period 1992-2004. Khorana, Servaes and
Tufano (2008) and Franger (2012) find that institutional funds have lower expense
ratio than retail funds. More recent studies have focused on the active and passive
management with respect to the market timing and stock selectivity of mutual funds.
Most research shows that only a limited number of fund managers have market timing
and/or stock selectivity expertise, since the passively managed funds perform better
than actively managed funds after expenses (Kon and Jen, 1979; Merton, 1981;
Woerheide, 1982; Veit and Chency, 1982; Ferri, Oberhelman, and Roenfeldt, 1984;
Chen and Stockum, 1985; Lee and Rahman, 1990 & 1991; Schlanger, Philips and
LaBarge, 2012). However, Cremers and Petajisto (2009) introduce a new measure for
portfolio active management named Active Share, which represents the share of
portfolio holdings that differ from the benchmark index holdings. They claim that
active share has prediction power, and the funds with the highest active share
significantly outperform their benchmarks, both before and after expenses. On the
contrary, Schlanger, Philips and LaBarge (2012) find that the most active funds
outperform their benchmarks, but they do not outperform low active-share funds.
However, most of the investors focus too much on the fund performance and do not
pay enough attention on the expenses. Capon, Fitzsimons, and Prince (1996) find that
most of the individuals do not know the investment objective of their mutual funds or
even if the fund is domestic or international, based on their survey of 3386 investors.

THE UNIVERSITY OF GRONINGEN
- 5 -
Additionally, most of those who have been surveyed consider fees to be of relatively little
importance in the mutual fund selection process. Alexander, Jones, and Nigro (1998)
indicate that most of those participants did not know the expenses of their largest funds,
even at the time when they made the initial investment in it. Wilcox (2003) performed an
experiment of fund choice on 50 investors, and find that most of them pay less attention
to fees than past performance, even though past performance provides little indication of
future performance. Barber, Odean and Zheng (2005) find that investors were attracted
by exceptional performance, marketing, or advertising when making funds purchasing
decisions; as did Wallison and Litan (2007). Most recent study shows that when fees
were clearly stated in a one-page tear sheet, only 20% of 720 investors chose to invest
only in the cheapest fund (Choi, Laibson, and Madrian, 2009).
In reality, there are many factors that influencing mutual fund expenses, either directly
or indirectly. The direct factors are the fees and expenses that associated with the
management of fund assets, the sales and distribution of fund shares (Malhotra &
Mcleod, 1997). They include the front-end loads, redemption fee and deferred loads,
operating expenses, account fees, and trading fees etc. The front-end load is the fee that
investors paid to brokers when they buy the funds which deducted directly from their
initial investments; it is the difference between the initial investment in the fund and the
real value of the fund in the first month statement. Moreover, it decreases with the
amount of money that invested (Barder, Odean and Zheng, 2005). The deferred load is
the money that investors pay to brokers when they sell shares, but it decreases to zero
with holding time. The longer period that investors hold the share, the lower deferred
load they pay. A fund named as loaded fund when it charges front-end load and/or
deferred loads; and named as no-load fund when it charges none of them. The redemption
fee is another type of fee that is paid by investors when they redeem their shares, it
proceeds like the deferred load, also deducted directly from the redemption (it is the
difference between the investor receives and the fund value reported). However, unlike
deferred load is paid to the broker, redemption fee is paid to the fund. The traditional
expense ratio defined by SEC consists of rule 12b-1 fees, management fees, and “other”
expenses (Houge & Wellman, 2007; Haslem, 2010). The rule 12b-1 fee is one of the most
THE UNIVERSITY OF GRONINGEN
- 6 -
controversial fees in the US mutual fund industry. Investors pay it to compensate the
financial advisers, marketing or distribution fee such as advertising expenses. The
management fee is paid to the investment advisers for managing the investment
portfolio of mutual fund. It also includes the incentive fees that are intended to
encourage portfolio managers to outperform the fund’s benchmark. The “other”
expenses include the transfer agent fees that paid to the entity which conducts back-
office functions; the securities custodian fees that used for keeping mutual fund
securities safeguarded and partitioned from other assets; the shareholder accounting
expenses, legal, auditor fees and independent direct fees (Haslem, 2010). The indirect
factors can be other characteristics of mutual fund. For instance, the size, age and how
active the fund managed etc.
To all of the investors, the fees must be checked and added into fund selection
toolkit, since a large part of return can be eaten by that without notice. Moreover, most
of mutual funds aggressively advertise historical performance, but rarely compete on
expenses, which lead the investors to focus on the fund performance (Houge &
Wellman, 2007). In addition, equity mutual funds have undergone significant changes
with respect to the types of fees they charge shareholders (Dellca and Olson, 1998).
Grinblatt and Titman (1994), Elton, Gruber, Das and Hlacka (1993) and Elton, Gruber,
and Blake (1996) considered the effect of loads on mutual fund performance. They
conclude that in general, there is no relationship between the loads and performance,
although Elton, Gruber, and Blake (1996) find that funds switch from no-load to
loaded are typically underperformers. Jensen (1968), Elton, et al, (1993), Malkiel
(1995), and Carhart (1997) present that mutual fund returns are negatively related to
the fund expense ratios. Dellva and Olson (1998) present that no-load funds with 12b-
1 fee earn higher risk adjusted returns. Barber, Odean, and Zheng (2005) conclude that
advertising helps funds growing, and the fund with high 12b-1 fee gathers more new
money.
As we can see, past studies are controversial. It can be explained by their different
time periods, frequencies, benchmarks or measurements. In addition, all of them were
doing research in broad fund categories. No one focus on the effects of all fees on

THE UNIVERSITY OF GRONINGEN
- 7 -
expenses and performance in a specific kind of fund. Moreover, few academic studies
have been done in recent years. Therefore, it is time to revisit the study in this filed,
investigating the effects of fees on fund expense ratio and performance in a specific fund
category over recent years including the world financial crisis period. Moreover, it is
interesting to combine the studies together with active management, to exam the
relationships between the mutual funds’ active management, expense ratio, and
performance.
This empirical research aims to investigate the effects of mutual funds’ front-end
loads, deferred loads, redemption fees, 12b-1 fees, management fees, size and age on
fund expense ratio; and their relations with fund performance. Next, I will examine the
relationships between the level of active management, expense ratio, and performance.
The study focuses on the U.S. Equity-Retail-Domestic Open-ended funds during the
period from 2005 to 2012. This paper also provides suggestions to the people who are
interested in the U.S. retail mutual funds.
The paper proceeds as follows. Section I discusses the previews literature and
hypothesis. Section II describes the methodology. Section III displays the data source
with the selection criteria. The empirical results are presented in Section IV. Section V
concludes.
I. Literature review
There are direct and indirect factors that influence the mutual fund expenses. Except
for all kinds of fees that mentioned before, Alamuddin & Callaban (2006) presented that
the factors influence retail fund expenses are the investment objectives, the category of
instruments that fund held, whether the fund is actively managed, and the sales
commission. Moreover, the influential factors like fund size and age have also been
mentioned by prior researchers. In this section, the previous literature on the factors that

THE UNIVERSITY OF GRONINGEN
- 8 -
influence fund expenses and their relations with fund performance will be presented,
followed by the corresponding hypothesis.
Several academic studies have documented the relationship between the fees and
fund expense ratio. The loaded funds charge front-end load and/or deferred loads,
while no-load funds charge none of them. Researchers find that front-end loads are not
significant in explaining expense ratio around the 1990s (Ferris and Chance, 1987;
Tracinka and Zweig, 1990; Mcleod and Malhotra, 1994). Front-end loads as one of the
marketing distribution costs that generally not improve the fund performance. Dellva
and Olson (1998) notice that funds charge front-end load earn lower risk adjusted
returns, and suggest investors to avoid it. They also find the deferred load has no
relation with fund performance. Moreover, the funds with redemption fees are
associated with superior performance, although the redemption fee is positively related
to the expense ratio. More recent studies find the percentage of U.S. equity mutual
fund assets that invested in the front-end load funds has dropped since 1962. It
indicates that investors are more likely to choose the no-load or low-load funds and
they are more sensitive to salient fees, like the front-end loads and commission, than
operating expenses (Barber, Odean and Zheng, 2005). Houge and Wellman (2007)
present that the loaded funds are more expensive and do not outperform than no-load
funds. It indicates that the sales loads result in a deadweight loss to investors. Del
Guercio and Reuter (2011) show that no-load funds mainly competing on portfolio
performance. Broker-sold funds (front-end load funds) are typically more expensive
than direct-sold funds because they bundle portfolio management with personalized
financial advice and these funds compete on both characteristics.
Hypothesis I (a): The expense ratios of loaded funds and no-load funds are the same.
Hypothesis I (b): There performance of loaded funds and no-load funds are the same.
The 12b-1 fee provides incentives to brokers and other sales representatives to sell
the fund, which are permitted under the Rule 12b-1 of Investment Company Act of

THE UNIVERSITY OF GRONINGEN
- 9 -
1940 in the US. In addition, it is limited to 1% of the mutual fund’s asset annually.
Theoretically, stronger investment in marketing and more incentives paid to brokers
would create more opportunities to increase the fund size, then resulting in economies of
scale that would lower overall expense ratio as well as per unit cost. However, it
increases the expense ratio, which in fact might lead the no-load or low-load funds to
become loaded funds while publicly advertising their no-load and low-load status.
Therefore, shareholders can benefit from this plan when the economies of scale outweigh
its cost. Alternatively, investors would benefit from it when the fees are used to gather
more information or attract exceptional managers that enable the fund to generate higher
risk adjusted returns (Dellva and Olson, 1998). While, the extant studies find that 12b-1
fees are “dead-weight” costs borne by investors. Researches based on different time
periods present that the 12b-1 funds (funds charge 12b-1 fee) ask higher expense ratio but
gain lower net investment returns than non 12b-1 funds (funds without 12b-1 fee) (see,
e.g. Ferris and Chance, 1987; Trzcinka and Zweig, 1990; Chance and Ferris, 1991;
Mcleod and Malhotra, 1994). Umamaheswar Rao (2001) concludes that 12b-1 plan
increases expense ratio without offering economic value to investors. Freeman (2007)
claim that the rules have generated huge wealth for fund sponsors and distributors at
investors’ expenses.
Hypothesis II (a): The expense ratios of 12b-1 funds and non 12b-1 funds are the same.
Hypothesis II (b): There is no relation between the 12b-1 fee and fund performance.
The agency conflict between the managers and shareholders is always a hot topic in
the mutual fund industry. Since the fund managers’ penchant for maximizing the level of
asset (size) under management and the associated management fees, while the
shareholders desire high, risk-adjusted returns at low cost (Ferris & Yan, 2008). Investors
are easily misled by the managers who are boasting about their “special” skills (e.g.
market timing skills, stock selection skills or just a nice promise of excellent returns etc.),
as a result of paying extremely high management fees which erode their own returns.

THE UNIVERSITY OF GRONINGEN
- 10 -
Reported by the Bloomberg Businessweek2, even the best managers, like Mario
Gabelli, John Neff and Michael Price, have a hard time beating the market. Fama and
French (2010) present that managers lack skills generally, although they do find some
talent managers in the upper tail of the distribution of managers. Management fees
vary with the investment managers and the nature of the investment products, and
grow with the complexity of management, research, and monitoring services.
Hypothesis III: There is no relation between management fee and fund expense ratio.
Prior studies presented controversial results on the effect of size (measured by
funds’ net assets) on mutual fund expense ratio and performance. Theoretically, the
expenses would decrease with the increasing size due to the economies of scale; then
the fund performance improves. Grinblatt and Sheridan Titman (1989) find that fund
returns decline with size. Other studies also find that fund size erodes fund
performance based on different time periods (see, e.g. Perold and Salomon, 1991;
Lowenstein, 1997; Cheng et al, 2004; Yan, 2008). On the contrary, Malhotra and
Mcleod (1997) and Dellva and Olson (1998) present that size is negatively related to
the fund expenses, which indicates that the operating efficiencies achieved by larger
funds and it passed onto investors in the form of lower per unit costs. Fan and
Addams (2012) propose that large funds, which can explore the economies of scale
and attract skilled managers, have significantly better market performance than small
funds.
Hypothesis IV (a): There is no relation between the fund size and fund expense ratio.
Hypothesis IV (b): There is no relation between the fund size and fund performance.
2 http://www.businessweek.com/stories/1992-01-26/poof-wall-streets-sorcerers-lose-their-magic

THE UNIVERSITY OF GRONINGEN
- 11 -
The age would influence the expenses negatively, since the new funds may incur start-
up cost at the beginning, while older fund can generate more experiences in the longer
operation period then achieves greater operating efficiency. This is known as learning
curve effect (Umamaheswar Rao, 2001). Previews studies provide evidence that fund age
is negatively related to the fund expenses (Ferris and Chance, 1987; Trzcinka and Zweig,
1990; Malhotra and Mcleod, 1997; Dellva and Olson, 1998; LaPlante, 2001).
Hypothesis V (a): There is no relation between the fund age and fund expense ratio.
Hypothesis V (b): There is no relation between the fund age and fund performance.
The active funds are more expensive than passive funds (index funds), because of the
higher investment advisory fees. The passively managed funds follow an index, buying
all or most all of stocks in the index and holding them. The actively managed funds then
are the funds that deviate from passively managed funds. Moreover, the degree of
deviation determines how active the funds are (Cremers & Petajisto, 2009). Prior
researches show that only a limited number of funds outperformed different benchmarks,
have market timing ability or selectivity expertise, although the percentage wealth
invested in mutual funds kept growing over the years. Moreover, there is strong evidence
of the negative relation between the expense ratio and performance of actively managed
funds. Malkiel (1995) find that 100 basis points of expense ratio decreased performance
by 192 basis points, and he concludes that most investors would be better off purchasing
low-expense funds. Carhart (1997) claim that fund performance decreased 153 basis
points corresponding to every 100 basis points of expense ratio. Net of all fees and
expenses, on average, the actively managed fund cannot beat a low-cost index fund
(Jensen, 1968; Gruber, 1996; Wermers, 2000). Umamaheswar Rao (2001) note that
active funds have higher expense ratio. Elton, Gruber, and Busse (2004) and Hortascu
and Syverson (2004) examine the S&P 500 index funds and find that more money has
flowed into the most expensive funds than the least expensive funds. However, more
recent studies present that the more active funds are, the more expensive they tend to be;

THE UNIVERSITY OF GRONINGEN
- 12 -
but the expenses may be covered by their better performance. Kacperczyk et al. (2005)
use various performance measures in their research and find that active managers who
concentrate on making investment in specific industries perform better after
controlling risk. Cremers and Petajisto (2009) argue that active managers are differing
in how active they are and what type of active management they practice. They report
that fund with the highest active share significantly outperform 19 benchmark indexes,
both before and after expenses. Moreover, they propose that active share has
prediction power in the fund performance. Schlanger, Philips and LaBarge (2012)
follow the same study and find the higher the active-share level, the higher the funds’
costs and the larger dispersion of the excess returns. Moreover, they claim that funds
with highest level of active share did not significantly outperform low active-share
funds and the expense ratio is still the most important tool for selecting the investment.
Hypothesis VI (a): There is no relation between active management and expense ratio.
Hypothesis VI (b): There is no relation between active management and performance.
The pioneering studies present controversial results on the relation between fund
expense ratio and performance. Most research reveals that on average, funds with
superior performance also have lower expense ratio. Funds equipped with more
informational competent are more efficient in their operations, thus providing higher
risk adjusted returns and charging lower expense simultaneously (Dellva and Olson,
1998). Carhart (1997) find that higher fees depress the investment performance.
However, more recent studies conclude that the active funds with high expense ratio
outperform their benchmarks after all fees (Cremers and Petajisto, 2009; Petajisto,
2013). Fan and Addams (2012) did not find positive relation between fund expense
ratio and performance. But they claim that a higher expense ratio does not mean poor
returns, and a lower expense ratio does not guarantee high returns.
Hypothesis VII: There is no relation between fund expense ratio and fund performance.
THE UNIVERSITY OF GRONINGEN
- 13 -
II. Methodology
A. Mutual fund fees and expense ratio
For studying the effects of front-end load, deferred load, redemption fee, 12b-1 fee,
management fee, size, and age on fund expense ratio. I start from analyzing the
development of the size, 12b-1 fee, management fee, and fund expense ratio during the
period from 2005 to 2012. Then, I compare the differences in the fund characteristics
between the loaded funds and no-load funds; between the 12b-1 funds and non 12b-1
funds. Finally, I analyze the effects of these factors on fund expense ratio over the years
based on the regression as follows,
where is the intercept; refers to the ith fund’s expenses as
a percentage of fund net assets at time t; is the natural log of ith fund’s net
assets which represents the fund size at time t; is the actual age of ith fund at time
t. The , , , , are refer to the
funds’ management fee, 12b-1 fee, front-end load, deferred load, redemption fee at time t
respectively; all of the fees are presented in percentage. The is the fixed effects to be
estimated which are absorbed by intercepts in the fixed effects panel regression.
However, it represents the between-entity error which has been assumed to be zero on
average in the random effects panel regression. is the error term.3
B. Mutual fund fees and fund performance
Benchmark adjusted returns have always been used to measure the mutual fund
performance, since the benchmark assumed as the market index. In this study, the fund
3 The explanation of , and in regression (6) is the same as in regression (1). Thus, I will not
explain again in following content.
THE UNIVERSITY OF GRONINGEN
- 14 -
performance is measured by the fund’s net return and two benchmark (risk) adjusted
returns. The net return of fund is the gross return after fees, expenses, and brokerage
commissions, but before any front-end or rear loads. I choose two indexes as the
benchmarks, which are S&P 500 index and Russell 2000 index. The benchmark
adjusted returns calculated using Jensen’s alpha as follows,
(2)
, (3)
, (4)
where is the net return of fund i at time t; is the three-month return
on US Treasury Bills at time t; is the return of the S&P500 index at time t;
is the return of the Russell 2000 index at time t; is either or
I implement the following regression for estimating the relations between the
funds’ characteristics and performance,
( ) ( )
Where is the intercept; refers to the performance 1-3 that mentioned
by equations (2) through (5); is the ith fund’s expenses as a percentage of
fund net assets at time t; ln is the size of ith fund at time t; is the actual age
of ith fund at time t; The , , , ,
THE UNIVERSITY OF GRONINGEN
- 15 -
are refer to the funds’ management fee, 12b-1 fee, front-end load, deferred
load, redemption fee at time t respectively; all of the fees are displayed in percentage4.
C. Active management, mutual fund expense and performance
Prior researches show that only a limited number of funds outperformed different
benchmarks. In other words, only a few funds have market timing ability or selectivity
expertise. Tracking error is the traditional active management measure which measures
the degree of deviation from a specified benchmark (Grinold and Kahn, 1999). It is
defined as the standard deviation ( ) of the difference between the fund return (
and the benchmark return ( ,
(7)
However, some researchers present that tracking error is not a good measure of active
management when it is used in isolation (Israelsen and Cogswell, 2007; Cremers and
Petajisto, 2009). Cremers and Petajisto (2009) claim that tracking error mostly measures
exposure to systematic risk, which can be used to measure managers’ market timing
ability. They propose a new active management measurement called active share, which
mostly measures the stock selectivity. It is defined as the sum of the deviation of
shareholdings from the benchmark index,
∑ | | (8)
where refers to the weight of security in the mutual fund; is the weight
of security in the index. I take the absolute value of the difference of weights and the
sum is taking over the universe of all assets. For the active share of mutual funds that
never short stocks and never buy on margin will always between 0% and 100 %.
4 The explanation of , and is presented under regression (1).

THE UNIVERSITY OF GRONINGEN
- 16 -
Based on the active share and tracking error, I follow Petajisto (2013) combining
them to measure the different levels of active management. Different from the
traditional classification of active management, which are market timing and stock
picking, there are five active management categories as presented in table I, which are
closet indexers, moderately active, factor bets (market timing), concentrated, and stock
pickers (stock picking). The closet indexing funds with active share smaller than 20%,
and consists of pure index funds. These funds behave the same as the passively
managed funds, while they still charging for management fee and claiming as the
actively managed funds. The other four types present the different degree of active
management, which actually are the extension of the two main types of active
management. The concentrated funds combine very active stock picking with
exposure to systematic risk. The moderately active funds are in the middle which has
no distinction between stock selection and market timing. According to these five
categories of actively managed funds, the characteristics of mutual funds will be
presented.
Table I
5 types of active management
Active share Tracking error quintile Group Label
quintile Low 2 3 4 High
High 5 5 5 5 4
5 Stock pickers
4 2 2 2 2 3
4 Concentrated
3 2 2 2 2 3
3 Factor bets
2 2 2 2 2 3
2 Moderately active
Low 1 1 1 1 3
1 Closet indexers
Sources: Petajisto (2013).
After that, I present the relations between the fund size, active management, and
fund expense ratio by tabulating the fund expense ratio based on five quintiles of fund

THE UNIVERSITY OF GRONINGEN
- 17 -
size and five categories of active management. In addition, the same method will be
implemented for examining the relations between the fund size, active management, and
fund performance.
Finally, I analyze the relation between active management and fund performance.
Except for the three performance measures of mutual funds that displayed in equation (2)
through (4), I add information ratio as an extra measurement. Since the information ratio
is a useful and accurate tool for assessing the skills of an active manager (Goodwin,
1998; Israelsen and Cogswell, 2007). It is defined as the difference between the fund
return and benchmark return divided by the fund’s tracking error, which are the funds’
net returns and risk adjusted returns
, (9)
where refers to the information ratio of fund i. is the net return
of fund i; is the return of benchmark (either S&P 500 index or Russell 2000
index); is the tracking error of fund i. Therefore, there are five performance measures
in this study, which are the funds’ net returns, two benchmark-adjusted returns based on
the returns of S&P 500 index and Russell 2000 index, and two information ratios based
on the returns of S&P 500 index and Russell 2000 index.
III. Data
A. Data on expenses
I first acquire the data of active open-ended equity funds that domicile in the U.S. and
focus the domestic markets from the Bloomberg Database5. There are 1534 funds in total
5 Bloomberg Database provides the most powerful and flexible platform for financial professionals who
need real-time data, news and analytics to make smarter, faster, more informed business decisions.
THE UNIVERSITY OF GRONINGEN
- 18 -
which consist of both retail and institutional funds. Bloomberg provides current
information for all mutual funds over the world. However, it does not provide
data for the fees. Therefore, the majority data of this study was obtained from the
for Research in Security Prices (CRSP) survivorship bias free database of mutual fund
that first complied in Carhart (1997). CRSP6 mutual fund database provides both
active and inactive mutual funds. It contains complete historical information from
1962 to 2012, for about 39,000 open-ended funds, which consists of more than 26,000
active and nearly 13,000 delisted funds. I finally collect the descriptive information
and expenses’ data both in quarterly and yearly for 997 retail mutual funds out of 1534
sample funds from the first quarter of 2005 to the last quarter of 2012. The descriptive
information includes the fund symbol, name, initial offer date which is used for
calculating the fund age, portfolio identifier, and retail fund identification. Other data
contains the latest month fund’s net asset, 12b-1 fee, management fee, and expense
ratio. The front-end load, deferred load and redemption fee are presented only in the
effective period as reported. Therefore, I manually filled the reported fees for the
funds in each quarter during the period. For the outliers in some variables, I treat them
as missing data. The equally-weighted average value of each variable that mentioned
above from 2005 to 2012 is presented in the appendix A.
B. Data on holdings
In order to compute the active share, I have to collect the composition of mutual
funds as well as the benchmark indexes. The data of stock holdings for 799 retail
mutual funds out of 997 is obtained from the CRSP mutual funds portfolio holdings
database at the end of each year from 2005 to 2012.
I choose two indexes as the benchmarks in this study, which are S&P 500 index
and Russell 2000 index. The S&P 500 focuses on the large-cap sector of the US
market. Since it includes a significant portion of the total value of the market, it has
6 http://www.crsp.com/products/mutual_funds.htm

THE UNIVERSITY OF GRONINGEN
- 19 -
always been assumed as the market index in academic research (see, e.g. Elton, Gruber,
and Busse, 2004; Hortascu and Syverson, 2004). Except for the S&P 500 index that
includes only big companies, I also use Russell 2000 index that includes small companies
as a complement benchmark. The Russell 2000 Index measures the performance of the
small-cap segment of the U.S. equity universe. It includes approximately 2000 of the
smallest securities based on a combination of their market cap and current index
membership. It is constructed to provide a comprehensive and unbiased small-cap
barometer and is completely reconstituted annually to ensure larger stocks do not distort
the performance and characteristics of the true small-cap opportunity set. It is the
benchmark used by small cap investors in the US. The yearly data of index constituents
from 2005 to 2012 is directly from the index providers, which are Standard & Poor’s and
Frank Russell Co. respectively.
Based on the shareholdings of mutual funds and two benchmarks, I calculate active
share for each fund at the end of each year from 2005 to 2012. There are two values of
active share for each fund because of two benchmarks. For better comparison, I
combined them as one by picking the larger value between them.
C. Data on returns
Monthly net returns for mutual funds are from the CRSP survivorship bias free
database of mutual funds. They are all net returns, which are the gross returns after fees,
expenses, and brokerage commissions, but before any front-end or rear loads. Mutual
funds daily returns are from Bloomberg database. Monthly and daily returns of indexes
are directly from the index providers, including dividends. All of the returns are from 1st
January 2005 to 31st December 2012. Based on the monthly returns, I calculate the
compounded quarterly and yearly returns for mutual funds and indexes.
I use one year period daily returns calculate the tracking error and information ratio for
each fund at the end of each year from 2005 to 2012. Therefore, all of the funds have two
values in tracking error and information ratio at each year because of the two

THE UNIVERSITY OF GRONINGEN
- 20 -
benchmarks. The equally-weighted average value of funds’ active share, tracking
error, and information ratio from 2005 to 2012 are presented in the appendix B.
As noticed, there are two different time frequencies in the database. The data for
mutual funds’ fees, net assets, expenses and performance have both quarterly and
yearly data; while, the funds’ active share, tracking error, and information ratio are
presented in yearly. Therefore, I use the quarterly data to analyze the effects of mutual
funds’ fees on fund expenses, and their relations with fund performance. The relations
between active management, fund expenses and performance are investigated based
on the yearly data.
IV. Empirical results
A. Mutual fund fees and expense ratio
Figure 1 portrays the developments of funds’ size, expense ratio, management fee
and 12b-1 fee of 997 US retail mutual funds during the period from 2005 to 2012. As
panel A displays, the average net assets of US retail mutual funds only grew slightly
during the study period. However, this is a rather turbulent period, with ups and
downs. The fund size experienced a gradual rise from $726 million in the first quarter
of 2005 and peaked at $1000 million in the second quarter of 2007. Reflecting the
macroeconomic environment, the fund size plummeted, dropping dramatically during
2007 and 2008 by more than $400 million on average. Bottoming out and hitting an
eight years low of less than $600 million in the end of 2008. After that, it started to
recover and rose to more than $800 million in 2012.

THE UNIVERSITY OF GRONINGEN
- 21 -
Figure 1: The trend of funds’ net assets and fees. This figure depicts the average funds’ net assets and both equal and assets-weighted average
expense ratio, 12b-1 fee and management fee of all U.S. retail equity mutual funds during the period from the first quarter of 2005 to the fourth quarter of
2012. The asset-weighted values are calculated based on the net assets of mutual funds.

THE UNIVERSITY OF GRONINGEN
- 22 -
Panel B through D depict the trends in expense ratio, 12b-1fee and management fee
from 2005 to 2012. As we can see, all asset-weighted average fees are much lower
than their equally-weighted average values. The equally-weighted average value is the
simple average for all of the funds. The asset-weighted average is computed by
assigning an asset weight based on the average net assets of a fund. Typically, as the
fund grows in size, greater operational efficiencies are realized then result in lower
total expense ratio. The difference of two average values most likely arises from
economies of scale. Since big funds are given greater weight than smaller funds in
computing the asset-weighted average values. As noticed, both equally-weighted and
asset-weighted average expense ratio and management fee display a declining trend
over the study period, as did the equally-weighted average 12b-1 fee. However, the
asset-weighted average 12b-1 fee tends to grow after 2011. Moreover, it is interesting
to find that both expense ratio and management fee has fallen at least 0.1% over the
period, while the asset-weighted average 12b-1 fee rises no matter during the world
financial crisis period or in the recovering time.
Table II presents the characteristics of fees between loaded funds and no-load
funds. As defined before, loaded funds charge front-end load and/or deferred load; no-
load funds charge none of the loads. The table shows that only about 12% of retail
funds are loaded funds, reflecting that loads are not the most popular fees charged by
the US retail mutual funds anymore. In addition, the average front-end load and
deferred load are 0.15 % and 0.057 % of fund net assets value respectively. As we can
see, the loaded funds charge higher management fee but lower 12b-1 fee and
redemption fee than no-load funds. However, what is the statistical difference between
the load funds and no-load funds?
Table III presents the statistical results of Wilcoxon rank sum test7 for checking the
differences between loaded funds and no-load funds. Before conducting the hypothesis
test, I test the distribution of the variables. The results reveal that none of them is
7 I conduct the two-sided Wilcoxon Rank-Sum Test in this study. The Wilcoxon Rank-Sum Test (Keller,
p756) is a nonparametric alternative to the two-sample t-test which is valid for data from any distribution. It
detects whether the distribution of the measurements in population A is the same as that in B with the null
hypothesis: H0: A=B.

THE UNIVERSITY OF GRONINGEN
- 23 -
normally distributed which are presented in the appendix C. Therefore, I go for the
Wilcoxon rank sum test. The results above display that the loaded funds on average ask
ask higher expense ratio and management fee but lower 12b-1 fee than no-load funds.
The findings are consistent with the prior studies and also indicate that loaded funds are
are more expensive than no-load funds. Comparing their average net assets, the loaded
funds are generally smaller than no-load funds. However, the negative z-statistic of
funds’ net asset shows that a random loaded fund would be bigger than a random no-load
fund. It indicates that broker advisory do attract more investment for the loaded funds.
Surprisingly, the loaded funds perform better than no-load funds implied by their net
returns, which contradicts to the results of prior research (see, Houge & Wellman, 2007).
However, we cannot prove the economies of scale, since the bigger size of loaded funds
does not result in lower expense ratio. Therefore, the higher return would come from
somewhere else which needs to do further research.
Table II
The characteristics of fund fees between loaded funds and no-load funds
The retail mutual funds are sorted by loaded funds and no-load funds. This table displays the fund
characteristics about the fees of loaded funds and no-load funds, as well as the number of loaded funds and
no-load funds. All of the fees are computed as the percentage of funds’ net assets.
Mean (%) Std.
Dev. Maximum (%) Minimum (%)
No. of
funds
Loaded funds
113
Management fee 0.706 0.253 2.559 0.002
12b-1 fee 0.100 0.261 1.006 0.000
Redemption fee 0.031 0.071 0.200 0.000
Front-end load 0.150 0.114 0.550 0.000
Deferred load 0.057 0.108 0.500 0.000
No-load funds
852
Management fee 0.614 0.500 21.935 0.000
12b-1 fee 0.391 0.413 1.111 0.000
Redemption fee 0.065 0.093 0.500 0.000
Front-end load 0.000 0.000 0.000 0.000
Deferred load 0.000 0.000 0.000 0.000

THE UNIVERSITY OF GRONINGEN
- 24 -
Table III
Results of Wilcoxon rank sum test by loaded and no-load funds
The 997 retail mutual funds are sorted by loaded funds and no-load funds. The two-sided Wilcoxon rank-
sum (Mann-Whitney) test checks whether the differences in the distribution of expense ratio (expense),
management fee (manag.fee), 12b-1 fee, fund size (fund NA), and fund return between the two categories
are statistically significant or not. This table displays the average mean and standard deviation of each
variable between loaded funds and no-load funds, as well as the z-statistics. The results reveal that the
loaded funds are statistically significantly different from no-load funds in all of the variables. The loaded
funds on average charge higher expense ratio and management fee than no-load funds, but lower 12b-1 fee.
In addition, they generate higher net returns. However, the negative z-statistic of Fund NA represents that
the loaded fund is statistically bigger than no-load fund, although on average the loaded funds is smaller.
[Examine HI]
Mean (%/$M) Standard Deviation Z-statistic
Expense (loaded) 1.522 0.528 -15.84***
Expense (no-load) 1.447 2.586
Manag. fee (loaded) 0.706 0.253 -21.92***
Manag. fee (no-load) 0.614 0.500
12b-1fee (loaded) 0.100 0.261 31.22***
12b-1fee (no-load) 0.391 0.413
Fund NA (loaded) 754 1271 -21.49***
Fund NA (no-load) 791 3722
Fund return (loaded) 1.644 10.608 -7.651***
Fund return (no-load) 1.225 8.437
Notes: ***, **, * denote statistical significance at the 0.01, 0.05 and 0.10 levels respectively.
After studied the differences between the loaded funds and no-load funds above, I
investigate the differences between the 12b-1 funds and non 12b-1 funds. Table IV
presents the statistical results of Wilcoxon rank sum test for checking the differences
in the fund characteristics of US retail mutual funds with and without 12b-1 fees from
2005 to 2012. As noted, more than 75% of US retail mutual funds charge 12b-1 fees
over this period. On average, the 12b-1 funds charge higher expense ratio and
management fee than non 12b-1 funds by 56 basis points and 3 basis points

THE UNIVERSITY OF GRONINGEN
- 25 -
respectively. Moreover, they generate higher net returns. However, the smaller size of
12b-1 funds indicates that the 12b-1 fee cannot grow funds, let alone the operating
efficiencies. Therefore, their higher net returns must be contributed by other factors that
need further research.
Table IV
Results of Wilcoxon rank sum test by 12b-1 and no 12b-1 funds
The 997 retail mutual funds are sorted by 12b-1 funds and non 12b-1 funds. The two-sided Wilcoxon rank-
sum (Mann-Whitney) test examines whether the differences in the distribution of funds’ expenses ratio
(expense), management fee (manag.fee), size (fund NA) and net return (fund NR) between the two
categories are statistically significant or not . The results reveal that, in general, the four characteristics of
12b-1 funds are significantly different from non 12b-1 funds as their average values presented. [Examine
HII]
Mean ($M/%)
Standard
Deviation
No. of
funds Z-statistic
Expense (12b-1) 1.578 2.244 780 -77.60***
Expense (non 12b-1) 1.018 3.001 217
Manag.fee (12b-1) 0.632 0.314 773 -18.64***
Manag.fee (non 12b-1) 0.598 0.844 208
Fund NA (12b-1) 426 1657 780 41.42***
Fund NA(non 12b-1) 2101 6757 217
Fund NR (12b-1) 1.280 8.841 780 -2.93***
Fund NR (non 12b-1) 1.248 8.224 217
Notes: ***, **, * denote statistical significance at the 0.01, 0.05 and 0.10 levels respectively.
Given the features of funds with and without loads (12b-1 fee), an interesting question
is raised about the impact of all specific fees, fund size, and age on the mutual fund
expense ratio over time. The fund size and age are indirect elements that might influence
the fund expenses. As a fund grows bigger, it may benefit from the economies of scale

THE UNIVERSITY OF GRONINGEN
- 26 -
which results in lower marginal expense. The operation efficiency may be achieved by
the older funds. To test their effects on fund expenses, I employ the regression that
presented in equation (1) based on quarterly data.
Table V displays the results for the regression that specified in equation (1) for each
year from 2005 to 2012. It reveals the effects of all fees, fund size, and age on mutual
fund expense ratio. I implement the random effects panel regression under the
guidance of Hausman test8. The results of Hausman test are presented in the appendix
D. The overall power of the model to explain the variation in fund expenses is fairly
stable during the sample period. F values are significant at 1 % each year.
Generally speaking, the US retail mutual fund industry can be categorized as
experiencing the economies of scale. Except for the coefficients for the fund size in
year 2009 and 2010 are positive; all other coefficients are negative and significant at
1% level. This negative results support the findings from Malhotra and Mcleod (1997)
and Dellva and Olson (1998), which indicate that larger funds benefit from operating
efficiencies with lower expenses than smaller funds. However, the new findings about
the positive relation between the fund size and expenses in 2009 and 2010 reveal that
US retail mutual funds did not benefit from their big size in these two years.
The significant negative coefficients for the age variable indicate that older funds
are cheaper than younger funds in most of the years except for 2007 and 2009. It
informs investors that they may pay higher expense for newly issued funds, either
because of the start-up costs, or less efficient in operation. This result is consistent
with the findings from Ferries and Chance (1987), Trzcinka and Zweig (1990) and
Dellva and Olson (1998). While, the positive relation between the fund age and fund
8 The Hausman test checks a more efficient model against a less efficient but consistent model to make sure
that the more efficient model also gives consistent results. It checks the differences of coefficients from
fixed effect model and random effect model; and chooses the better model according to the consistency and
efficiency.
THE UNIVERSITY OF GRONINGEN
- 27 -
expenses in 2007 and 2009 indicates that older funds are more expensive just before and
after the world financial crisis.
The coefficient for the management fee is significantly positive, which indicates that
management fee increase the fund expenses definitely. However, whether the higher
management fee brings economic value needs to be investigated further.
As explained, 12b-1 fees are mainly spent on the marketing activities; it aims for
attracting more capital that increases the fund size, then lead to economies of scale.
Therefore, investors would benefit from it when per unit cost decrease with an increase in
the degree of funds’ operating efficiency. However, I find controversial results on 12b-1
fee over the years. Five out of six significant coefficients for 12b-1 fee are positive in this
study; except in 2012 which is negative. The positive relation indicates that 12b-1 fees
increase the fund per unit cost and provide no economic benefit for investors. While, the
negative relation reveals that 12b-1 fee may reduce the fund expenses, but investors can
only benefit when the marginal return covers its additional expenses. Prior studies found
that 12b-1 fees are not covered by the fund return (see, e.g. Ferris and Chance, 1987;
Chance and Ferris, 1991; Mcleod and Malhotra, 1994).
Only one out of eight coefficients for the front-end loads is statistically significant and
positive. As mentioned before, there is only about 12 % of US retail mutual funds are
loaded funds, which charge front-end load and/or deferred load. The front-end load as
one of market distribution costs aims to increase the fund size by attracting more capital.
Whereas, the positive coefficient indicates that front-end loads increase the overall
expenses. The insignificant coefficients for deferred load and redemption fee provide no
information for their impact on fund expenses. Therefore, I find no relation between the
deferred load and fund expenses, as well as the redemption fee and fund expenses during
the study period.

THE UNIVERSITY OF GRONINGEN
- 28 -
Table V
Results of random effects panel regression for expense ratio and funds’ characteristics
Notes: The z-statistics are in parentheses. ***, **, * denote statistical significance at the 0.01, 0.05 and 0.10 levels respectively. [Examine HII (a)-HV (a)]
2005 2006 2007 2008 2009 2010 2011 2012
Intercept 1.323 1.161 0.986 1.670 -0.438 1.860 1.018 1.542 (z-value) (15.19)*** (12.48)*** (9.43)*** (18.63)*** (-3.58)*** (16.92)*** (6.68)*** (17.52)***
Fund size -0.005 -0.009 -0.004 -0.026 0.042 0.024 -0.012 -0.011
(-1.60) (-2.16)** (-0.49) (-7.05)*** (3.51)*** (3.64)*** (-0.98) (-3.45)***
Age -0.015 -0.013 0.007 -0.012 0.019 -0.045 -0.005 -0.014
(-5.69)*** (-5.42)*** (-2.02)** (-4.00)*** (3.47)*** (-14.27)*** (-0.88) (-7.89)***
Manage. fee 0.395 0.476 0.566 0.030 1.884 0.042 0.845 0.193
(21.70)*** (17.90)*** (19.25)*** (2.73)*** (106.51)*** (4.09)*** (13.40)*** (12.59)***
12B-1fee 0.327 0.391 0.495 0.020 0.646 0.647 -0.041 -0.028
(13.24)*** (13.19)*** (8.11)*** (0.57) (9.24)*** (20.71)*** (-0.66) (2.22)**
Front-end load -0.016 0.430 -0.826 -0.292 -0.229 0.125 -0.377 -0.021
(-0.02) (4.01)*** (0.24) (-0.60) (-0.48) (0.11) (-0.28) (0.99)
Def. load 0.153 0.142 0.302 0.502 1.153 1.305 1.027 1.216
(0.30) (0.30) (0.39) (0.54) (0.71) (0.59) (0.47) (0.56)
Red. Fee -0.216 0.721 0.641 0.065 0.601 -0.188 0.781 0.111
(-0.48) (0.97) (0.39) (0.29) (0.78) (-0.23) (0.95) (0.48)
F probability 0.000*** 0.000*** 0.000*** 0.000*** 0.000*** 0.000*** 0.000*** 0.000*** R
2 0.165 0.134 0.116 0.018 0.793 0.213 0.002 0.081

THE UNIVERSITY OF GRONINGEN
- 29 -
In general, the results from table V reveal that the 12b-1 fee and front-end load are
“hidden fees”. And the management fee increases mutual fund expense ratio. In addition,
the effects of deferred load and redemption fee on expense ratio are not significantly
significant during the period from 2005 to 2012.
B. Mutual fund fees and fund performance
How do the mutual funds’ fees, size and age relate to the fund performance? I conduct
the regression that specified in equation (6) for testing their relationships based on
quarterly data with all funds that are bigger than $20 million during the period from 2005
to 2012. As mentioned earlier, I use three returns to measure the fund performance which
are the funds’ net returns, risk adjusted return based on S&P 500 index, and risk adjusted
return based on Russell 2000 index. Moreover, I use dummy variables instead of their
true values for front-end load and deferred load in this regression. The D front-end load is
a dummy variable with a value of 1 if the fund charges front-end load and zero otherwise.
The D def. load is a dummy variable with a value of 1 if the fund charges deferred load
and zero otherwise. Before conducting the regression, I employ the Hausman Test for
choosing the appropriate test for the panel data analysis. The results which presented in
the appendix E reveal that the fixed-effects regression is preferable. Table VI displays the
results of the fixed-effects panel regression. As we can see, the F values for the regression
are statistically significant at 1% level. Three intercepts for the fund performance
measures are negative, but they are quite different from each other and two of them are
significant at 1% level. The results reflect the sensitivity of fund average performance to
different risk measures.
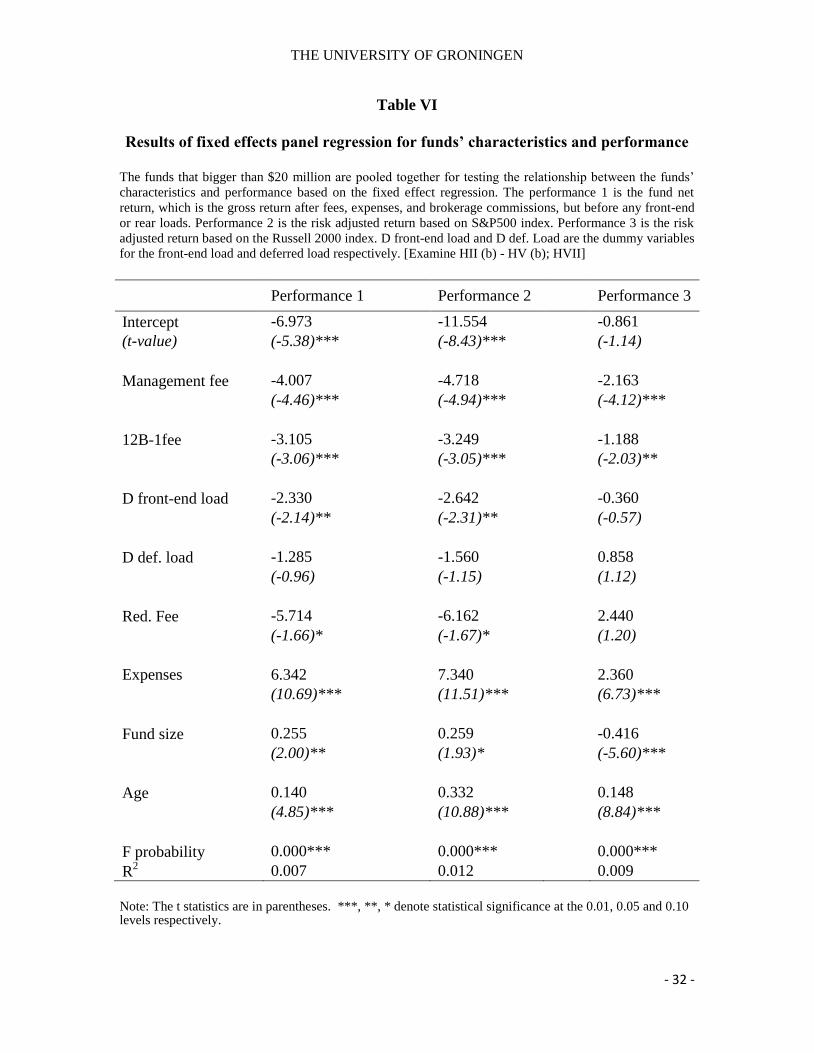
The coefficients for management fee are negative and significant at 1% level.
Combine this result with its effect on mutual fund expenses which is significantly
positive over most of the years from 2005 to 2012. It indicates that in general
management fee increases fund expenses without bringing economic benefit to investors.

THE UNIVERSITY OF GRONINGEN
- 30 -
Similar results are found on the 12b-1 fee, although its negative effect on fund
performance is weaker than management fee. The negative coefficients are significant
at 1% or 5% level. It reveals that marketing and distribution costs increase fund total
expenses, while they do not improve the fund performance. As noticed in table IV, the
12b-1 funds are much smaller than non 12b-1 funds, which indicates that either
advertising is useless or the 12b-1 fee actually did not used in the promotion and
advertising but somewhere else. The Investment Company Institute did a research in
2005 and find that less than 5% of the estimated $10.9 billion collected for 12b-1fee
were used for funds promotion and advertising (Haslem, 2010). The result from this
study implicates that 12b-1 fees are dead weight loss to retail mutual fund investors.
Moreover, it provides evidence that higher net returns of 12b-1 funds that I find in the
last subsection are not contributed by marketing and advertising, but from somewhere
else.
The Front-end load erodes the fund performance measures on average. As indicated
by the two significantly negative coefficients, one unit increase in the front-end load
lead to at least 2 basis points decline in the net returns.
Both deferred loads and redemption fees are sales charges, which would reduce
investors’ welfare at selling the fund shares. While, the deferred loads decrease with
the holding period, it then has no effect to the long-term investors. The coefficients of
deferred load are not significant for any of the performance measures. Two
coefficients for redemption fee variable are negative and significant at 10% level for
the first two performance measures. These results present that redemption fee is
negatively relate to the fund performance, and no relation between the deferred loads
and fund performance.
The fund expense ratio is positive and significant at 1% level for all performance
measures, which is different from most of the prior studies. Since most previous
research provides strong evidence of negative relation between expense ratio and
performance. However, more recent studies in mutual funds also find the positive
relation between expense ratio and performance (see, Cremers and Petajisto, 2009;
THE UNIVERSITY OF GRONINGEN
- 31 -
Petajisto, 2013). This result implicate that, in general, better performed funds are more
expensive than their counterparts. However, it does not mean that all good performed
funds are expensive funds. Thus, investors should not reject all of the expensive funds
absolutely, since the high additional expenses might be covered by their high returns.
Controversial results are found on fund size. First two coefficients are positive related
to the fund performance, which is measured by the fund net returns and the benchmark-
adjusted returns by S&P500 index. But, it is negatively relate to the benchmark-adjusted
return by Russell 2000 index. Given the result that fund size is negative related to the
fund expenses in the last subsection. Investor can benefit from larger size, since they are
able to achieve economies of scale and thus improve the fund performance. Similar result
can be found from Fan and Addams (2012), who claim that large funds can explore the
scale economies and attract skilled managers, then have significantly better market
performance than small funds. However, the negative relation from performance 3
reflects that risk adjusted return by Russell 2000 index capture other information than the
two other measures, concerning the fund performance.
Fund age is significantly positive related to fund performance at 1% level. This result
suggests that mature funds perform better than younger funds. In addition, it verifies the
exists of learning curve, which points that older funds can generate more experiences in
the longer operation period and then achieve greater operating efficiency (Umamaheswar
Rao, 2001).
The results of regression (6) indicate that 12b-1 fee, front-end load, and redemption
fee deteriorate the fund performance, which should be avoided by investors for a given
expenses. Moreover, deferred load does not significantly relate to the fund performance.
However, investors can benefit from bigger and older funds, because of the economies of
scale and operating efficiency. Last but not least, investors do not need to avoid all
expensive funds, since the result indicates that better performing funds also associate with
high expenses.
THE UNIVERSITY OF GRONINGEN
- 32 -
Table VI
Results of fixed effects panel regression for funds’ characteristics and performance
The funds that bigger than $20 million are pooled together for testing the relationship between the funds’
characteristics and performance based on the fixed effect regression. The performance 1 is the fund net
return, which is the gross return after fees, expenses, and brokerage commissions, but before any front-end
or rear loads. Performance 2 is the risk adjusted return based on S&P500 index. Performance 3 is the risk
adjusted return based on the Russell 2000 index. D front-end load and D def. Load are the dummy variables
for the front-end load and deferred load respectively. [Examine HII (b) - HV (b); HVII]
Performance 1 Performance 2
Performance 3
Intercept -6.973 -11.554
-0.861
(t-value) (-5.38)*** (-8.43)***
(-1.14)
Management fee -4.007 -4.718
-2.163
(-4.46)*** (-4.94)***
(-4.12)***
12B-1fee -3.105 -3.249
-1.188
(-3.06)*** (-3.05)***
(-2.03)**
D front-end load -2.330 -2.642
-0.360
(-2.14)** (-2.31)**
(-0.57)
D def. load -1.285 -1.560
0.858
(-0.96) (-1.15)
(1.12)
Red. Fee -5.714 -6.162
2.440
(-1.66)* (-1.67)*
(1.20)
Expenses 6.342 7.340
2.360
(10.69)*** (11.51)***
(6.73)***
Fund size 0.255 0.259
-0.416
(2.00)** (1.93)*
(-5.60)***
Age 0.140 0.332
0.148
(4.85)*** (10.88)***
(8.84)***
F probability 0.000*** 0.000***
0.000***
R2 0.007 0.012 0.009
Note: The t statistics are in parentheses. ***, **, * denote statistical significance at the 0.01, 0.05 and 0.10 levels respectively.

THE UNIVERSITY OF GRONINGEN
- 33 -
C. Active management, mutual fund expense and performance
Following the methodology given in section II, I conduct the cross-sectional analysis
based on the data from the latest year 2012 for studying the relations between mutual
fund active management, fees and performance in this subsection. The active
management is measured by active share and tracking error that defined before. I sorted
all funds in 2012 by the two dimensions of active management. Table VII presents the
number of mutual funds, the average net asset, management fee and 12b-1 fee according
to the scales of active share and tracking error in panel A, B, C and D respectively.
As we can see, most of the US retail mutual funds are located in the range with active
share between 40% and 60%, and smaller than other funds. Looking at the funds in the
first column that have tracking error smaller than 1.5%, I find the average net asset of
funds that hold active share below 10 % is 31836 million dollars, which is 40 times of its
counterparts with active share larger than 90%. Surprisingly, the most expensive
management fees are not charged by the funds with biggest active share, but the funds
hold active share between 70% and 80%. They also charge highest 12b-1 fee. With the
tracking error becomes bigger, fund number decreases and fees increase. These results
support the findings from Cremers and Petajisto (2009), which indicate the funds with
high active share tend to be smaller in size and more expensive than their counterparts
that hold low active share.
According to the different types of active management in the 5×5 grid of active share
and tracking error that presented in table I, I summarize some statistics of US retail
mutual fund characteristics and performance in table VIII. This table includes the mean
value and standard deviation of funds’ net assets, expense ratio, management fee, rule
12b-1fee, active share, tracking error, net return and information ratio for all of the US
equity-retail-domestic open-end funds during the period from 2005 to 2012. Each year, I
calculate the mean and standard deviation of each variable, and then compute average
across the years. Because the number of funds in each category varies over the years, I
present the percentage of funds instead of their actual number. Among all of the funds,
almost 17% are stock pickers that mainly focus on stock picking strategy, 3% are

THE UNIVERSITY OF GRONINGEN
- 34 -
concentrated funds which combine stock picking with the exposure to systematic risk;
around 10% are factor bets that mainly focus on the exposure to systematic risk; and
about 16% are closet index funds. The most popular funds are moderately active
funds, which occupied 54% of total funds.
Table VII
U.S. retail mutual funds in 2012
According to the distribution of the active share and tracking error, the four panels display the number of
mutual funds, fund net assets, management fee and 12b-1 fee respectively. The active share is defined as
the percentage of the fund’s stockholdings that differ from the benchmark index. It calculated based on the
CRSP mutual fund holdings data and index composition data from S&P500 index and Russell 2000 index.
The tracking error is defined as the standard deviation of the fund excess return over the index return. It is
computed based on daily returns of one year.
Tracking error (% per year)
Active
share (%) <1.5 1.5-2 2-2.5 total <1.5 1.5-2 2-2.5 total
Panel A: No. of funds
Panel C: Manage. Fee (%)
90-100 33 4
37
0.54 0.28 0.52
80-90 5
5
0.55 0.54
70-80 5 1
6
0.84 1.00 0.87
60-70 2
2
0.45 0.45
50-60 126 18
144
0.59 0.44 0.59
40-50 416 61 10 487
0.54 0.51 0.65 0.54
30-40 81 2
83
0.49 0.15 0.49
20-30 26 1
27
0.32 0.30
0-10 7 1
8
0.14 1.00 0.25
Total 701 88 10 799
0.54 0.49 0.65 0.54
Panel B: Mean net assets ($M)
Panel D: 12b-1 fee (%)
90-100 784 32
702
0.32 0.20 0. 31
80-90 1313
1313
0.12 0.12
70-80 3229 93
2706
0.84 1.00 0.86
60-70 3250
3250
0.45 0.45
50-60 368 198
345
0.42 0.28 0.40
40-50 571 196 189 511
0.45 0.47 0.42 0.45
30-40 1210 185
1185
0.41 0.15 0.40
20-30 4286 2613
4147
0.42 0.00 0.42
0-10 31836 24.9
27859
0.14 1.00 0.25
Total 1036 189 189 929 0.43 0.42 0.42 0.43

THE UNIVERSITY OF GRONINGEN
- 35 -
Table VIII
Sample statistics of U.S. retail mutual fund in five categories 2005 - 2012
This table shows some sample statistics for five fund categories that defined in table I. The NA is the fund net asset, AS is the active share that measures the
fraction of a fund that differs from benchmark index. TE is the tracking error; manage. Fee is the management fee, Ri is the fund net return, and IR is fund
information ratio. The mean value of each variable is equally weighted over the years from 2005 to 2012.
Panel A: Mean value
Group Label No.(%) of total
funds
NA
($M)
Expense
(%)
Manage. Fee
(%)
12B-1 fee
(%)
AS
(%)
TE
(%)
Ri
(%)
IR
(%)
5 Stock pickers 16.98
393 1.64 0.61 0.41 59 1.38 7.36 -0.03
4 Concentrated 3.01
403 1.84 0.49 0.44 63 2.26 -4.05 2.17
3 Factor bets 9.92
938 1.67 0.56 0.41 33 2.38 -22.97 1.35
2 Moderately active 54.13
586 1.70 0.58 0.45 45 1.37 9.68 1.40
1 Closet indexers 15.96
2188 1.36 0.54 0.41 13 1.09 10.8 1.40
Total 100
841 1.64 0.57 0.43 42 1.45 5.81 1.18
Panel B: Standard deviation
Group Label
NA
($M)
Expense
(%)
Manage. Fee
(%)
12B-1 fee
(%)
AS
(%)
TE
(%)
Ri
(%)
IR
(%)
5 Stock pickers
1362 3.30 1.20 0.42 17 0.32 12.72 2.74
4 Concentrated
848 3.81 0.39 0.40 19 0.47 37.77 3.67
3 Factor bets
4039 3.42 0.70 0.42 9 0.41 29.93 2.63
2 Moderately active
1830 3.16 0.80 0.42 4 0.55 17.90 3.33
1 Closet indexers
8382 0.77 0.68 0.40 12 0.41 10.96 3.72
Total
3927 3.00 0.85 0.42 18 0.60 21.19 3.30

THE UNIVERSITY OF GRONINGEN
- 36 -
The results present that average expense ratio of US retail mutual funds is 1.64%
per year, and comparable across all categories. The stock pickers are the smallest
funds which hold the second biggest active share and charge the highest management
fee. However, they are not the most expensive funds and generate positive net returns.
The concentrated funds are the most expensive funds among the five groups which
hold the biggest active share and the second biggest tracking error. But the high
expenses cannot be covered by their net returns which are negative. The factor bets are
the worst performers, which hold the biggest tracking error. The largest group which
occupies 54% of total funds is the moderately active funds. They are relatively more
expensive compared with other groups. However, their high expenses are covered by
their positive net returns. The best performers are the closet index funds, which are the
biggest and cheapest funds among the five categories. The results indicate that not all
actively managed funds are expensive and some expensive active funds can also
generate positive net returns.
Given the fund characteristics of US retail mutual funds among the five categories
of active management, I investigate the relations between fund size, active
management, and fund expense ratio; as well as their relations with fund performance.
Then, I study fund performance across the five categories of active management based
on five performance measures, which are the funds’ net returns, two benchmark-
adjusted returns (based on S&P500 index and Russell 2000 index), and two
information ratios (based on S&P500 index and Russell 2000 index).
Table IX shows how the size and level of active management of mutual fund affect
fund expense ratio. Looking at the total expense ratio across the five groups of active
management, closet index funds on average are the cheapest funds with smallest
standard deviation. However, among the smallest funds, closet index funds charge
highest expense ratio. On the contrary, stock pickers as the most active funds are the
cheapest funds. With the size grows bigger, most expense ratios decrease. Only the
largest stock pickers and moderately active funds are more expensive than their
smaller counterparts. Moreover, the largest stock pickers are the most expensive funds
in the total sample, followed by the biggest moderately active funds. It is inspiring to

THE UNIVERSITY OF GRONINGEN
- 37 -
find that the small stock pickers located from quintile 1 to 3 are cheaper than the closet
indexers, although active funds are more expensive than closet index funds generally. It
indicates that either the small closet index funds charge too high expenses or the smaller
most active funds are not expensive as assumed.
Table IX
Fund size, Active management and Expense ratio
The table displays the annual expense ratio of US retail mutual funds for fund size quintiles within five
categories of active management from 2005 to 2012. The five categories of funds are defined in table I. The
average expense ratio of mutual fund in the middle of the table is expressed in percent of fund’s net assets
per year, followed by the standard deviation of fund expense ratio in parenthesis. Funds with less than $20
M in net assets have been excluded. [Examine HIV (a)]
5 quintiles of fund size
Group Label 1 2 3 4 5 Total 5-1
5 Stock pickers 1.52 1.41 1.31 1.17 2.64 1.55 1.11
(0.58) (0.65) (0.53) (0.47) (10.27) (3.90)
4 Concentrated 1.72 1.74 1.14 1.42 1.16 1.43 -0.56
(0.65) (0.85) (0.39) (0.60) (0.66) (0.69)
3 Factor bets 1.74 1.53 1.48 1.25 1.45 1.48 -0.29
(0.51) (0.52) (0.48) (0.46) (7.13) (3.38)
2 Moderately active 1.70 1.60 1.49 1.36 1.78 1.58 0.08
(0.62) (0.60) (0.50) (0.45) (7.28) (3.22)
1 Closet indexers 1.78 1.54 1.39 1.15 0.62 1.25 -1.16
(0.53) (0.54) (0.57) (0.52) (0.47) (0.67)
Total 1.68 1.56 1.43 1.30 1.55 1.51 -0.13
(0.59) (0.61) (0.51) (0.48) (6.70) (3.04)
5-1 Difference -0.26 -0.13 -0.08 0.02 2.02 0.31

THE UNIVERSITY OF GRONINGEN
- 38 -
Table X
Fund size, Active management and Performance
The table displays the annual performance of US retail mutual funds for fund size quintiles within five
categories of active management from 2005 to 2012. The fund categories are defined in table I. Returns in
the middle of the table are net returns to the investor after fees and transaction costs. The numbers are
expressed in percent per year, followed by standard deviation of the net returns in parenthesis. Funds with
less than $20 M in net assets have been excluded. [Examine HIV (b)]
5 quintiles of fund size
Group Label 1 2 3 4 5 Total 5-1
5 Stock pickers 7.45 7.65 8.79 7.07 9.53 8.03 2.08
(13.52) (11.51) (12.24) (13.37) (13.73) (12.80)
4 Concentrated -2.78 -3.10 -9.75 1.38 -9.27 -5.20 -6.49
(35.03) (41.28) (34.61) (44.15) (37.63) (37.85)
3 Factor bets -27.29 -26.34 -18.72 -18.44 -20.16 -21.97 7.13
(26.68) (24.50) (36.16) (32.37) (30.35) (30.46)
2 Moderately active 8.06 10.53 10.48 10.59 10.58 10.07 2.52
(18.86) (17.87) (17.70) (19.96) (16.27) (18.23)
1 Closet indexers 13.33 12.38 10.01 10.63 10.26 11.31 -3.07
(13.92) (12.31) (10.66) (9.86) (9.81) (11.41)
Total 5.33 6.39 6.72 6.82 6.39 6.33 1.05
(21.48) (21.13) (21.44) (22.60) (20.55) (21.45)
5-1 Difference -5.88 -4.73 -1.22 -3.56 -0.73 -3.28
Table X shows how the fund size affects fund performance net of all fees within
each of the five active management categories. As we can see, the average net returns
of total retail mutual funds increase with size. Although the average net return of the
biggest funds is relatively lower than its neighbor, it is still 1% higher than the
smallest funds. Moreover, the bigger funds associate with lower volatility compared
with the smallest funds which indicate that bigger funds are less risky than smaller
funds. However, the result becomes controversial among the active management
categories across fund sizes. Two out of three categories show negative relation
between the size and performance. For example, the bigger closer indexers tend to
perform poorer than smaller ones as well as the concentrated funds. However, bigger
closet index funds are less risky measured by volatility; while the bigger concentrated

THE UNIVERSITY OF GRONINGEN
- 39 -
funds are much more risky than their smaller counterparts. These findings indicate that
the effect of fund size on performance is correlated with the type of active management,
although on average it is positive related to the fund performance.
Combining the results from table IX and X, the most expensive moderately active
funds and stock pickers on average generate positive return after all fees, as did the
cheapest index funds.
Table XI
Fund performance 2005-2012
The table displays the annual performance of U.S. retail mutual funds for five categories of active
management from 2005 to 2012. The fund categories are defined in table I. There are five kinds of returns
which are the net returns, benchmark adjusted returns (adjusted from S&P500 index and Russell2000
index), and the information ratio (adjusted from S&P500 index and Russell2000 index). The numbers are
expressed in percent per year, followed by standard deviation in parentheses. The Z-statistic is the result of
the Two-sample Wilcoxon rank-sum (Mann-Whitney) test that tests whether the difference between group
1 and group 5 is statically significant. Funds with less than $20 M in net assets have been excluded.
[Examine HVI (b)]
Net return Risk-adjusted return Information ratio
Group Label Funds S&P500 Russell 2000 S&P500 Russell 2000
5 Stock pickers 7.90 7.51 4.78 -0.14 0.48
(12.78) (13.02) (9.00) (2.15) (4.13)
4 Concentrated -5.20 -9.56 7.96 1.53 3.28
(37.85) (40.68) (18.64) (1.44) (6.50)
3 Factor bets -21.97 -27.66 1.96 0.88 2.03
(30.46) (32.98) (15.79) (1.20) (4.78)
2 Moderately active 9.94 8.12 7.14 0.77 2.18
(18.32) (19.21) (13.38) (2.06) (5.17)
1 Closet indexers 11.31 8.17 6.96 1.04 2.31
(11.41) (11.67) (10.00) (2.82) (4.86)
Total 6.26 3.99 6.26 0.70 1.96
(21.43) (22.92) (12.85) (2.17) (5.02)
5-1 Difference -3.41 -0.66 -2.18 -1.18 -1.83
Z-statistic 5.06*** -0.63 2.30** 8.99*** 8.11***
Note: ***, **, * denote statistical significance at the 0.01, 0.05 and 0.10 levels respectively.

THE UNIVERSITY OF GRONINGEN
- 40 -
Table XI shows the fund performance varies across the five categories of actively
managed funds during the period from 2005 to 2012. The fund performance is
measured by five returns as explained before. The returns are equally-weighted across
all groups. Looking at the funds’ net returns across the five categories of active funds,
the group 1, 2, and 5 all achieved positive returns, while the concentrated funds and
factor bets generated negative returns. Same results are presented in the second
column when fund performance is measured by the risk adjusted returns based on
S&P500. However, all of the funds beat Russell 2000 index by at least 1.96 % per year
on average. When it comes to the performance among groups, the closet indexers are
the best performers when it is measured by the net returns and Russell 2000 index
adjusted returns. However, the result from the second column indicates that the S&P
500 index adjusted returns of stock pickers is indifferent from that of index closets.
The information ratio identifies the performance of a fund manager relative to its
benchmark. Looking at the information ratios, concentrated funds hold highest value
among the groups, followed by the closet indexers. The result indicates that mangers
of these two categories of funds provide consistent returns during the sample period.
However, I believe that investors would choose the closet indexers with consistent
positive returns; rather than concentrated funds with negative returns.
To sum up, the empirical results are different from most prior studies. Since they
find that the active funds underperform their benchmarks and cannot beat index funds
(see, e.g. Gruber, 1996; Wermers, 2000). I find that the stock pickers, moderately
active managed funds, and the closet index funds generate positive net returns on
average. In addition, there is no significant evidence that index funds beat the most
active funds in their benchmark-adjusted returns by S&P500 index.

THE UNIVERSITY OF GRONINGEN
- 41 -
V. Conclusion
This article investigates the effects of fees, size, age, and active management on
mutual funds’ expense ratio and performance based on the data of 997 U.S. equity-retail-
domestic open-ended funds from 2005 to 2012. It is found that the average net assets of
U.S. retail mutual funds increased by more than 100 million dollars, although it fluctuates
strongly during the period from 2007 to 2009. Moreover, almost half of expense ratio is
eaten by the management fee. But both equally-weighted and asset-weighted average
expenses and management fees follow a decreasing trend over this period. However, the
asset-weighted average 12b-1 fees tend to increase after 2012.
There is only 12% of U.S. retail mutual funds charge front-end load and/or deferred
load. The empirical analysis finds that the loaded funds are more expensive and smaller
than no-load funds; front-end load destroys fund performance, and no relation between
the deferred load and fund performance. However, the deferred load as a sales charge
reduces investors’ welfare at selling, it is a dead weight loss for short time investors while
has no effect to the long term investors.
The redemption fee is another sales charge that is paid to the fund by investors. I find
no relation between the redemption fee and fund expenses, while it erodes the fund
performance. Therefore, investors should avoid it for a given expenses.
Three-fourths of U.S. retail mutual funds are 12b-1 funds, which are more expensive
and bigger than non 12b-1 funds. The 12b-1 fee including marketing and distribution
costs which increases expense ratio and undermines performance. It implicates that in
general, 12b-1 fee helps increasing the fund size, but the cost cannot be covered by their
returns.
The economies of scale in the retail mutual fund industry have been verified in this
study. The size on average is negatively related to the expense ratio and positively related
to the performance. It indicates that larger funds benefit from operating efficiencies.
However, this relation diverges with regard to the active management. It is found that
closet index funds, as well as the funds concentrate on both stock selection and

THE UNIVERSITY OF GRONINGEN
- 42 -
systematic risk, present negative relation between the size and performance. While, the
bigger stocker pickers, factor bets and moderately active funds generates better
returns.
I also find that older funds charge lower expenses and work more efficiently than
younger funds. This informs that the older funds would be a better choice for retail
investors, since they may pay higher expense either because of the start-up costs, or
lack of efficiency in operation.
The results point out that the actively managed funds are much more expensive and
smaller than index funds generally, although the smallest index funds are more
expensive than the smallest active funds. Among the five active management groups
which are categorized based on the combination of active share and tracking error, I
find that most of U.S. retail mutual funds are moderately active managed. In addition,
the concentrated funds and factor bets underperform after fees. Whereas, the stock
pickers, moderately active funds, and closet index funds outperform their benchmarks
after fees. Moreover, there is no significant difference between the most actively
managed funds and the index funds in their average S&P500 index adjusted returns.
In conclusion, to the investors, all else being equal, the front-end load, redemption
fee and 12b-1 fee deteriorate fund performance that should be avoided. Next, it is
better to choose older and bigger funds, since they work more efficiently and cheaper
than newly issued funds. However, with regard to the active management, smaller
index funds would be more attractive because of their high returns. In addition, closet
index funds are cheaper and better-performing than actively managed funds generally.
Nevertheless, not all actively managed funds are expensive and underperforming, as
the most active and moderately active funds also generate positive returns after fees.
To the mutual fund companies, it is important to realize that the stock pickers
which focus on stock picking outperform the benchmarks, as well as the moderately
active funds and closet index funds. Whereas, the factor bets and concentrated funds
underperform. The results indicate that stock selection as indicated by high active
THE UNIVERSITY OF GRONINGEN
- 43 -
share is rewarded in the stock market. By contrast, market timing as indicated by high
tracking error is not rewarded by the stock market. Therefore, it would be better to pay
more attention on stock selection in the long run, rather than focusing on the exposure to
systematic factor risk.
Limitations and further research
Although this research was carefully prepared, I am still aware of its limitations and
shortcomings. First of all, study on the interrelations between variables is not deep
enough. This study investigates the effects of nine mutual funds’ characteristics on fund
expenses and performance based on all U.S. Equity-Retail-Domestic Open-ended Funds
during the period from 2005 to 2012. It is a big project that worked on a huge database
within two months. I studied the effect of each variable on funds’ expenses and
performance without deep investigating the interrelations between the variables. For
example, the interrelations between the 12b-1 fee, fund size, expenses and performance.
Secondly, I only used the net returns and risk adjusted net returns for measuring the fund
performance, without comparison in the funds’ gross return. It would be better to have
both and compare the fund performance before and after expenses in this study. Lastly, I
pooled all mutual funds together for analyzing the relations between their active
management, expenses and performance without considering the change or adjustments
within each fund during the period.
This thesis provides an overview of the fees of U.S. retail mutual funds, active
management, fund expense and performance during the period from 2005 to 2012. There
are various other aspects of mutual funds that can be studied further. One possible
suggestion is study a specific characteristic of mutual fund deeply. For instance, the
interrelations between the active management, fund expenses and performance, then link
to the management compensation and investment decision making. Secondly, the same
study can also be done in the institutional funds, and compare the difference between the
retail and institutional funds. Finally, the same study can also be done in the developing

THE UNIVERSITY OF GRONINGEN
- 44 -
financial markets and compare the difference between the developing and developed
markets in the mutual fund field.

THE UNIVERSITY OF GRONINGEN
- 45 -
REFERENCES
Alamuddin S. M., and S. M. Callaban, 2006, The next ERISA Battleground: Mutual Fund
Fees and Expenses, Benefits Law Journal 19, 4.
Alexander G. J., J. D. Jones and P. J. Nigro, 1998, Mutual fund shareholders:
characteristics, investor knowledge, and sources of information, Financial Service
Review 7, 301-316.
Barber B. M., T. Odean and L. Zheng, 2005, Out of sight, out of mind: The effects of
expenses on mutual fund flows, The Journal of Business 78, 2095-2120.
Capon N., G. Fitzsimons, and R. Prince, 1996, An individual level analysis of the mutual
fund investment decision, Journal of Financial Services Research 10, 59-82.
Carhart M, 1997, On persistence in mutual fund performance, The Journal of Finance 52,
1, 57-82.
Chance D. M., and S. P. Ferris, 1991, Mutual fund distribution fees: An empirical
analysis of the impact deregulation, Journal of Financial Services Research 5, 25-42.
Chen C., and S. Stockum, 1985, Selectivity, market timing and random behaviour of
mutual funds: a generalized model, The Journal of Financial Research 8, 15-30.
Chen J., H. Hong, M. Huang, and J. D. Kubik, 2004, Does Fund Size Erode Mutual Fund
Performance? The role of liquidity and organization, American Economic Review 94,
5 (December): 1276-1302.
Choi J. J., D. Laibson, and B. C. Madria, 2009, Why does the law of one price fail? An
experiment on index mutual funds, The Review of Financial Studies 23, 1405-1432.
Cremers K. J. M., and A. Petajisto, 2009, How actice is your fund manager? A new
measure that predicts performance, The Review of Financial Studies 22, 3329-3365.

THE UNIVERSITY OF GRONINGEN
- 46 -
Creshaw T., 1977, The evaluation of investment performance, Journal of Business 41, 3-
39.
David N., 2012, Why do mutual fund expenses matter? Financial Service Review 21,
239-257.
Del Guercio D., and J. Reuter, 2011, Mutual Fund Performance and the Incentive to
Generate Alpha, National Bureau of Economic Research, Inc.
Dellva W. L., and G. T. Olson, 1998, The relationship between mutual fund fees and
expenses and their effects on performance, The Financial Review 33, 85-104.
Elton E. J., M. J. Gruber, and J. Busse, 2004, Are Investors Rational? Choice Among
Index Fund, Journal of Finance.
Elton E. J., M. J. Gruber, and C. Blake, 1996, The persistence of risk adjusted mutual
fund performance, Journal of Business 69, 133-57.
Elton E.J., M.J. Gruber, S. Das, and M. Hlavka, 1993, Efficiency with costly information:
a reinterpretation of evidence from managed portfolios. Review of Financial Studies
6, 1, 1-22.
Fama E.F., and K. R. French, 2010, Luck versus skill in the cross-section of mutual fund
returns, Journal of Finance 65(5).
Fan Y., and H. L. Addams, 2012, United States-based international mutual funds:
Performance and persistence, Financial Services Review 21, 51-61.
Ferris S. P., and X. Yan, 2008, Agency costs, governance, and organizational forms:
Evidence from the mutual fund industry. Journal of Banking &Finance 33, 619-626.
Ferris S., and D. Chance, 1987, The effect of 12b-1 plans on mutual fund expenses ratios:
a note. The Journal of Finance 42, 1077-1082.

THE UNIVERSITY OF GRONINGEN
- 47 -
Ferris S., H. Oberhelman, and R. Roenfeldt, 1984, Market timing and mutual fund
portfolio composition. The Journal of Financial Research 7, 143-150.
Franger S., 2012, The expense ratio game, On Wall Street, August 1st .
Freeman J. P., 2007, The mutual fund distribution expense mess, The Journal of
Corporatopm Law, Summer.
Friend I., M. Blume, and J. Crockett, 1970, Mutual funds and other institutional
investors. McGraw Hill, New York.
Goodwin, Thomas H., 1998, The Information Ratio, Financial Analysts Journal 54.
Grinblatt M., and S. Titman, 1989, Mutual fund performance: an analysis of quarterly
portfolio holdings, Journal of Business 62, 393-416.
Grinblatt M., and S. Titman, 1994, A study of monthly mutual fund returns and
performance evaluation techniques, Journal of Financial Quantitative Analysis 29.
Grinold R., and R. Kahn, 1999, Active Portfolio Management (2ndEdition), McGraw-Hill
Gruber E., 1996, The personal finance kit, (Dearborn Financial Publishing, Chicago),
ISBN: 0-7931-1713-5.
Haslem J. A., 2010, Mutual funds: portfolio structure, analysis, management, and
stewardship, (John Wiley & Sons, New Jersey), IBSN: 978-0-470-49909-2.
Hortascu A., and C. Syverson, 2004, Product differentiation, search costs, and
competition in the mutual fund industry, A case study of S&P 500 Index Fund,
Quarterly Journal of Economics 119, 403-456.
Houge T., and J. Wellman, 2007, The Use and Abuse of Mutual Fund Expenses, Journal
of Business Ethics 70, 23–32.

THE UNIVERSITY OF GRONINGEN
- 48 -
Investment Company Institute, 2012, Investment Company Fact Book: 52th
Edition,
Washington DC: Investment Company Institute, www.icifactbook.org.
Israelsen C. L., and G.F. Cogswell, 2007, The error of tracking error, Journal of Asset
Management 7(6), 419–424.
Jensen M., 1968, The performance of the mutual funds in the period 1945-1964, The
Journal of Finance 42, 389-416.
Jensen M., 1969, Risk, the pricing of capital assets and the evaluation of investment
portfolios, Journal of Business 42, 167-247.
Kacperczyk M., Clemens Sialm and Lu Zheng, 2005, On industry concentration of
actively managed equity mutual funds, Journal of Finance 60, 1983-2011.
Keller G., 2008, Managerial statistics, Eighth Edition (South-Western Cengage
Learning). ISBN-10: 1408009285
Khorana A., H. Servaes and P. Tufano, 2008, Mutual fund fees around the world, The
Review of Financial Studies 22.
Kon S., and F. Jen, 1979, The investment performance of mutual funds: an empirical
investigation of timing, selectivity, and market efficiency, Journal of Business 52,
263-289.
LaPlante M., 2001, Influences and trends in mutual fund expense ratios, The Journal of
Financial Research 1, 45-63.
Lee C., and S. Rahman, 1990, Market timing, selectivity, and mutual fund performance:
an empirical investigation, Journal of Business 63, 261-278.
Lee C., and S. Rahman, 1991, New evidence on timing and security selection skill of
mutual fund managers, the Journal of Portfolio Management 18, 80-83.
THE UNIVERSITY OF GRONINGEN
- 49 -
Lowenstein R., 1997, Frightened Funds: Is There a Master in the House? Wall Street
Joumal.
Malhotra D. K., and R. W. Mcleod, 1997, An empirical analysis of mutual fund expenses,
Journal of Financial Research 20, 175-90.
Malkiel B. G., 1995, Returns fron investing in Equity Mutual Funds 1971 to 1991,
Journal of Finance June, 549-572.
McDonald J., 1974, Objectives and performance of mutual funds, 1960-1969, Journal of
Financial and Quantities Analysis 9, 311-332.
Mcleod R., and D. Malhotra, 1994, A re-examination of the effect of 12b-1 plans on
mutual fund expense ratios, The Journal of Financial Research 17, 231-240.
Merton R. C., 1981, On the Role of Social Security as a Means for Efficient Risk-Bearing
in an Economy Where Human Capital Is Not Tradable, National Bureau of Economic
Research, Inc.
Perold A., and R. S. Salomon, 1991, The Right Amount of Assets under Management,
Financial Analysts Journal 47(3), 31-39.
Petajisto A., 2013, Active share and mutual fund performance, working paper.
Pozen R. C., 1998, The Mutual Fund Business. Cambridge, MA: MIT Press.
Schlanger T., A. B. Philips, and K. P. LaBarge, 2012, The research for outperformance:
Evaluating “active share”, Vanguard Research.
Sharp W. F., 1966, The Sharp Ratio, The Journal of Portfolio Management.
Treynor J., 1966, How to rate management of investment funds, Harvard Business
Review 44, 119-138.

THE UNIVERSITY OF GRONINGEN
- 50 -
Trzcinka C., and R. Zweig, 1990, An economic analysis of the cost and benefits of S.E.C.
Rule 12b-1, New York University Monograph Series.
Umamaheswar Rao S. P., 2001, Economic impact of distribution fees on mutual funds,
American Business Review.
Veit E., and J. Chency, 1982, Are mutual funds market timers? The Journal of Portfolio
Management 9, 35-42.
Wallison P. J., and R. E. Litan, 2007, Competitive equity: a better way to organize mutual
funds. Washington, DC: AEI press.
Wermers R., 2000, Mutual fund performance: an empirical decomposition into stock
picking talent, style, transaction costs and expenses, Journal of Finance 55, 4
(August): 1655-1695.
Wilcox R. T., 2003, Bargain hunting or star gazing? How consumers choose mutual
funds, Journal of Business 76, 645–665.
Willianmson P., 1972, Measurement and forecasting of mutual fund performance:
choosing an investment strategy, Financial Analysts Journal 28, 78-84.
Woerheide W., 1982, Investor response to suggested criteria for the selection of mutual
funds, Journal of Financial and Quantitative Analysis 17, 129-137.
Yan X., 2008, Liquidity, investment style, and the relation between fund size and fund
performance, Journal of Financial and Quantitative Analysis 43 (3): 741-768.

THE UNIVERSITY OF GRONINGEN
- 51 -
APPENDIX A: Description of quarterly data in years from 2005 to 2012
2005 2006 2007 2008 2009 2010 2011 2012
Fund size ($M) 754.4101 850.9223 954.3763 798.3851 631.2929 709.0298 783.8455 814.8696
(Standard dev.) (3446) (3602) (3945) (3281) (2761) (3298) (3707) (4042)
Fund age (year) 11.5565 12.5564 13.5565 14.5565 15.5565 16.5565 17.5565 18.5565
(10.3429) (10.3441) (10.3429) (10.3429) (10.3429) (10.3429) (10.3429) (10.3429)
Expense (%) 1.4855 1.4622 1.4483 1.4385 1.4739 1.4695 1.4393 1.4300
(2.2869) (2.2265) (2.2357) (2.2462) (2.3981) (2.5276) (2.6570) (2.8786)
Management fee (%) 0.6445 0.6364 0.6326 0.6271 0.6250 0.6257 0.6197 0.5815
(0.3622) (0.0000) (0.3717) (0.3816) (0.5090) (0.6579) (0.6971) (0.3256)
12b-1 fee (%) 0.3685 0.3679 0.3620 0.3603 0.3568 0.3517 0.3523 0.3473
(0.4077) (0.4066) (0.4035) (0.4004) (0.4018) (0.4064) (0.4205) (0.4250)
Front-end load (%) 0.0201 0.0193 0.0183 0.0171 0.0162 0.0155 0.0150 0.0148
(0.0723) (0.0681) (0.0635) (0.0590) (0.0571) (0.0561) (0.0551) (0.0549)
Redemption fee (%) 0.0643 0.0642 0.0637 0.0633 0.0620 0.0587 0.0575 0.0575
(0.0933) (0.0930) (0.0923) (0.0920) (0.0914) (0.0903) (0.0899) (0.0899)
Deferred load (%) 0.0089 0.0081 0.0072 0.0068 0.0059 0.0049 0.0048 0.0048
(0.0538) (0.0474) (0.0412) (0.0404) (0.0372) (0.0336) (0.0335) (0.0334)
R Fund (%) 1.7600 2.8165 1.7700 -7.9698 6.0988 3.3119 -0.2559 2.6511
(4.0001) (4.9054) (4.3120) (10.6077) (10.2971) (8.5021) (9.8428) (6.3824)
R (S&P 500) (%) 0.8095 3.2460 0.9760 -11.3633 5.8955 3.4498 0.2867 3.2910
(2.0976) (3.0681) (3.4286) (7.6222) (10.4348) (9.2570) (9.7121) (5.7550)
R (Russell 2000) (%) 2.2965 3.9237 -0.6965 -10.6930 5.6215 5.6395 -1.4018 3.4145
(1.8356) (7.0564) (3.6789) (12.3391) (14.1635) (9.7548) (11.1996) (5.5470)
No. of funds 997 997 997 997 997 997 997 997
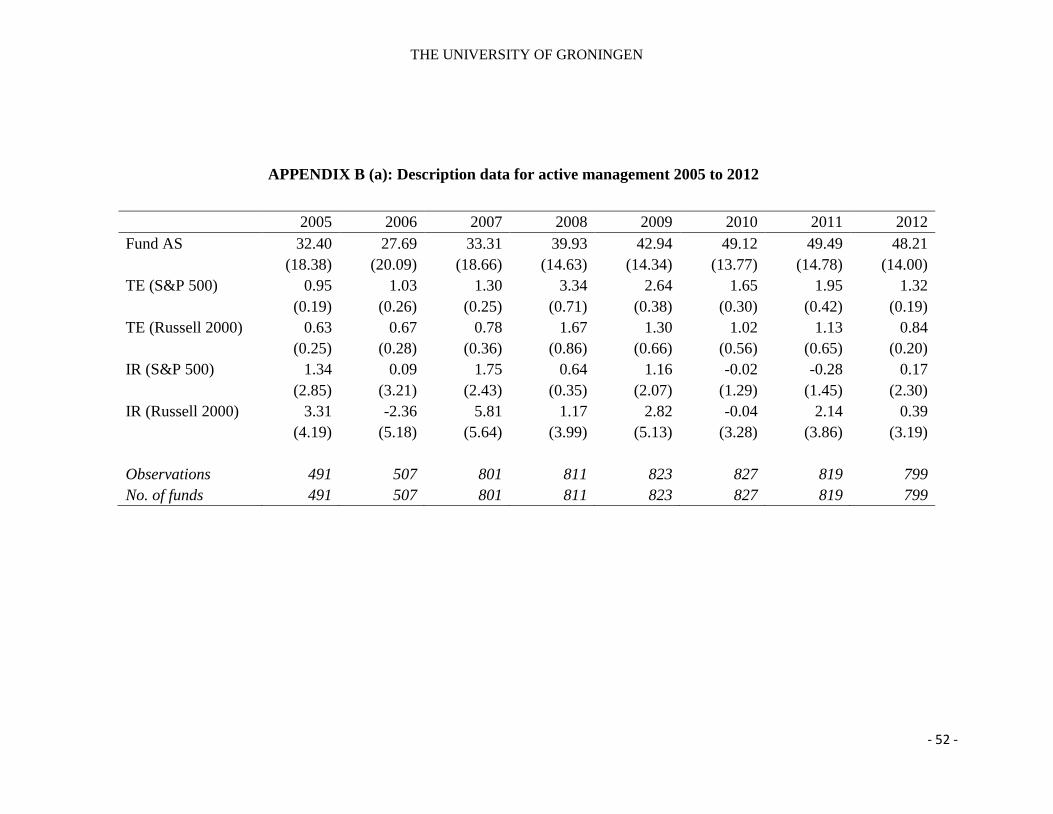
THE UNIVERSITY OF GRONINGEN
- 52 -
APPENDIX B (a): Description data for active management 2005 to 2012
2005 2006 2007 2008 2009 2010 2011 2012
Fund AS 32.40 27.69 33.31 39.93 42.94 49.12 49.49 48.21
(18.38) (20.09) (18.66) (14.63) (14.34) (13.77) (14.78) (14.00)
TE (S&P 500) 0.95 1.03 1.30 3.34 2.64 1.65 1.95 1.32
(0.19) (0.26) (0.25) (0.71) (0.38) (0.30) (0.42) (0.19)
TE (Russell 2000) 0.63 0.67 0.78 1.67 1.30 1.02 1.13 0.84
(0.25) (0.28) (0.36) (0.86) (0.66) (0.56) (0.65) (0.20)
IR (S&P 500) 1.34 0.09 1.75 0.64 1.16 -0.02 -0.28 0.17
(2.85) (3.21) (2.43) (0.35) (2.07) (1.29) (1.45) (2.30)
IR (Russell 2000) 3.31 -2.36 5.81 1.17 2.82 -0.04 2.14 0.39
(4.19) (5.18) (5.64) (3.99) (5.13) (3.28) (3.86) (3.19)
Observations 491 507 801 811 823 827 819 799
No. of funds 491 507 801 811 823 827 819 799
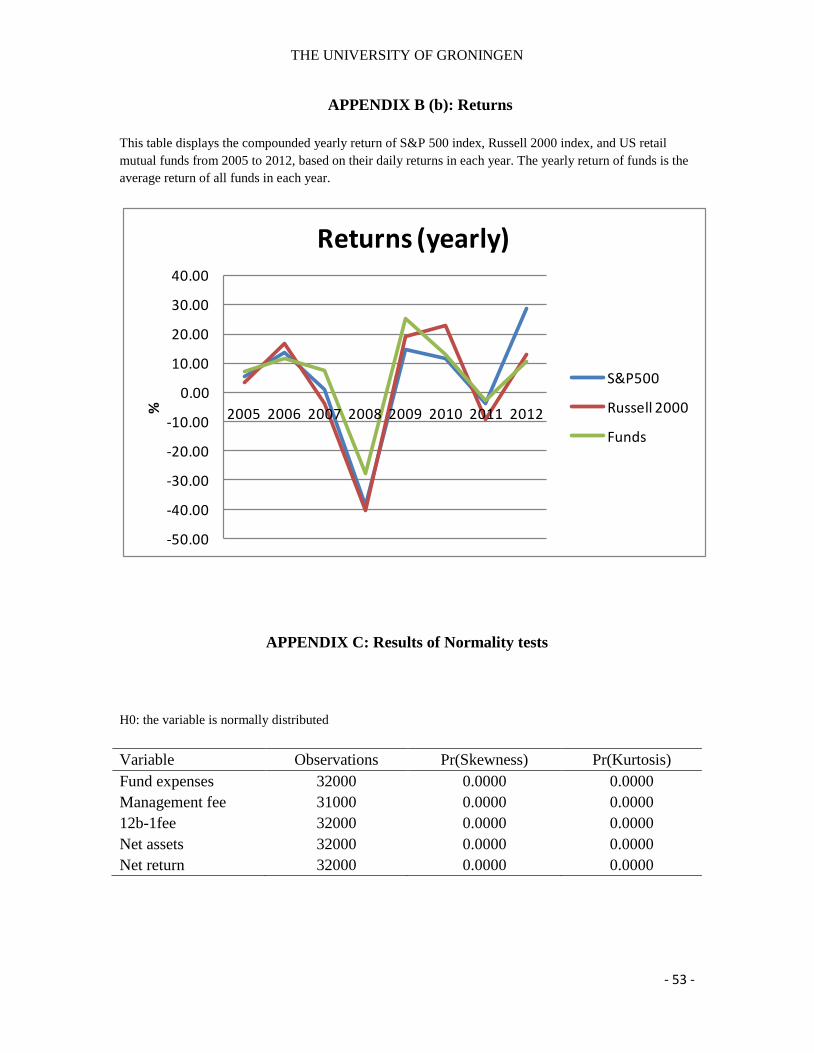
THE UNIVERSITY OF GRONINGEN
- 53 -
APPENDIX B (b): Returns
This table displays the compounded yearly return of S&P 500 index, Russell 2000 index, and US retail
mutual funds from 2005 to 2012, based on their daily returns in each year. The yearly return of funds is the
average return of all funds in each year.
APPENDIX C: Results of Normality tests
H0: the variable is normally distributed
Variable Observations Pr(Skewness) Pr(Kurtosis)
Fund expenses 32000 0.0000 0.0000
Management fee 31000 0.0000 0.0000
12b-1fee 32000 0.0000 0.0000
Net assets 32000 0.0000 0.0000
Net return 32000 0.0000 0.0000
-50.00
-40.00
-30.00
-20.00
-10.00
0.00
10.00
20.00
30.00
40.00
2005 2006 2007 2008 2009 2010 2011 2012%
Returns (yearly)
S&P500
Russell 2000
Funds

THE UNIVERSITY OF GRONINGEN
- 54 -
APPENDIX D: Results of Hausman tests for regression (1)
The result rejectes H0 hypothesis, suggests that random effects model is preferable.
---- Coefficients ----
Expense
ratio
(b)
fixed
(B)
random
(b-B)
Difference
sqrt(diag(V_b-V_B))
S.E.
lnta -0.0120 -0.0121 0.0000 0.0002
age -0.0030 -0.0030 0.0000 0.0001
managfee 1.3511 1.3514 -0.0003 0.0003
b12fee 0.4486 0.4529 -0.0042 0.0027
frontendload -0.0733 -0.0747 0.0014 0.0078
redepfee -0.2862 -0.2740 -0.0122 0.0090
deffload -0.0336 -0.0314 -0.0021 0.0030
b = consistent under Ho and Ha; obtained from xtreg
B = inconsistent under Ha, efficient under Ho; obtained from xtreg
Test: Ho: difference in coefficients not systematic
chi2(7) = (b-B)'[(V_b-V_B)^(-1)](b-B) = 6.43
Prob>chi2 = 0.4907
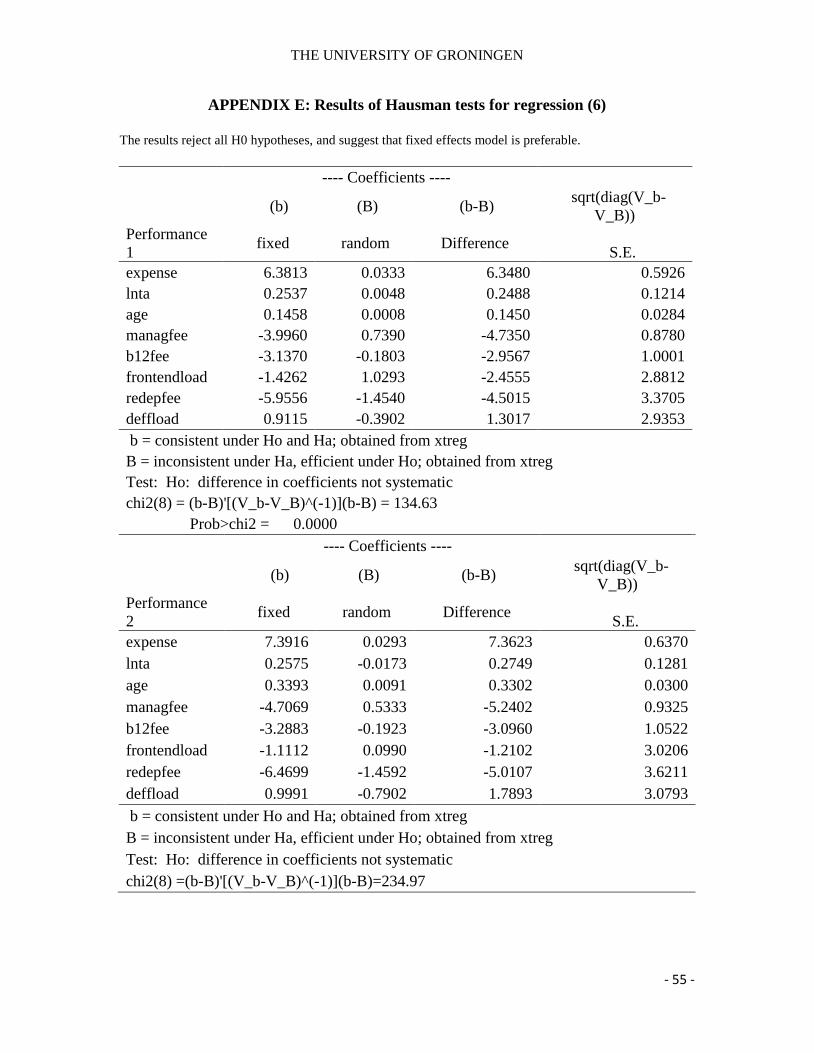
THE UNIVERSITY OF GRONINGEN
- 55 -
APPENDIX E: Results of Hausman tests for regression (6)
The results reject all H0 hypotheses, and suggest that fixed effects model is preferable.
---- Coefficients ----
Performance
1
(b)
fixed
(B)
random
(b-B)
Difference
sqrt(diag(V_b-
V_B))
S.E.
expense 6.3813 0.0333 6.3480 0.5926
lnta 0.2537 0.0048 0.2488 0.1214
age 0.1458 0.0008 0.1450 0.0284
managfee -3.9960 0.7390 -4.7350 0.8780
b12fee -3.1370 -0.1803 -2.9567 1.0001
frontendload -1.4262 1.0293 -2.4555 2.8812
redepfee -5.9556 -1.4540 -4.5015 3.3705
deffload 0.9115 -0.3902 1.3017 2.9353
b = consistent under Ho and Ha; obtained from xtreg
B = inconsistent under Ha, efficient under Ho; obtained from xtreg
Test: Ho: difference in coefficients not systematic
chi2(8) = (b-B)'[(V_b-V_B)^(-1)](b-B) = 134.63
Prob>chi2 = 0.0000
---- Coefficients ----
Performance
2
(b)
fixed
(B)
random
(b-B)
Difference
sqrt(diag(V_b-
V_B))
S.E.
expense 7.3916 0.0293 7.3623 0.6370
lnta 0.2575 -0.0173 0.2749 0.1281
age 0.3393 0.0091 0.3302 0.0300
managfee -4.7069 0.5333 -5.2402 0.9325
b12fee -3.2883 -0.1923 -3.0960 1.0522
frontendload -1.1112 0.0990 -1.2102 3.0206
redepfee -6.4699 -1.4592 -5.0107 3.6211
deffload 0.9991 -0.7902 1.7893 3.0793
b = consistent under Ho and Ha; obtained from xtreg
B = inconsistent under Ha, efficient under Ho; obtained from xtreg
Test: Ho: difference in coefficients not systematic
chi2(8) =(b-B)'[(V_b-V_B)^(-1)](b-B)=234.97
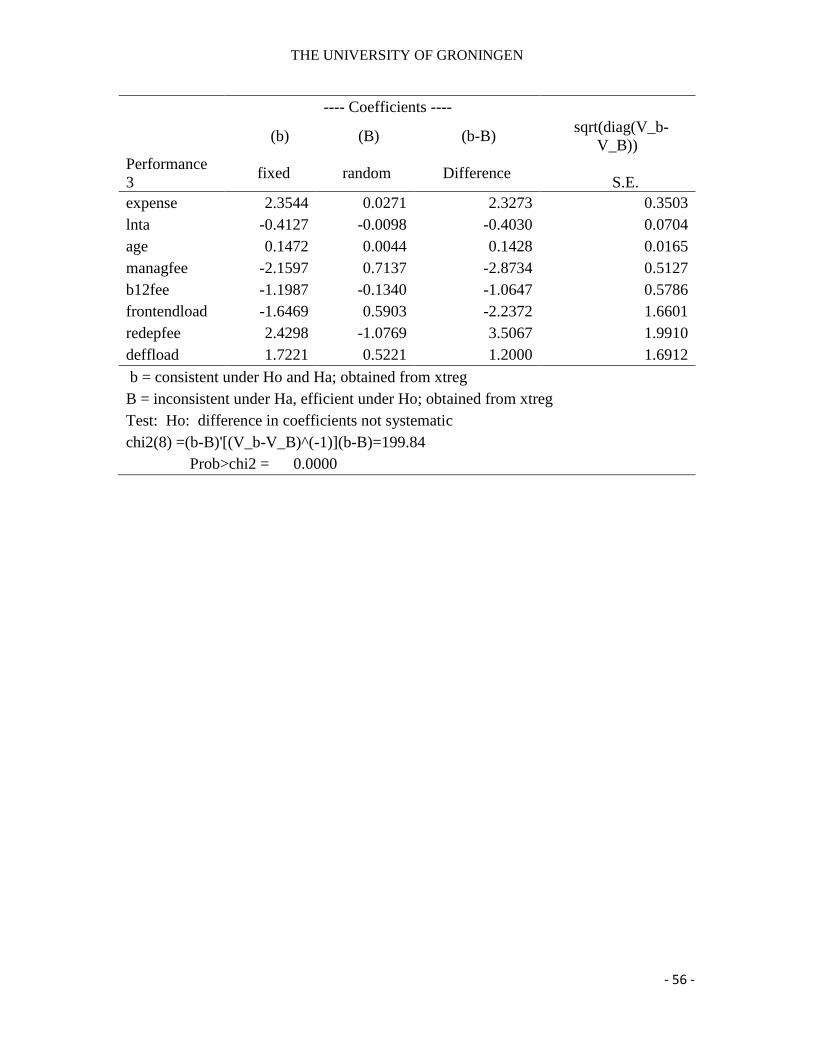
THE UNIVERSITY OF GRONINGEN
- 56 -
---- Coefficients ----
Performance
3
(b)
fixed
(B)
random
(b-B)
Difference
sqrt(diag(V_b-
V_B))
S.E.
expense 2.3544 0.0271 2.3273 0.3503
lnta -0.4127 -0.0098 -0.4030 0.0704
age 0.1472 0.0044 0.1428 0.0165
managfee -2.1597 0.7137 -2.8734 0.5127
b12fee -1.1987 -0.1340 -1.0647 0.5786
frontendload -1.6469 0.5903 -2.2372 1.6601
redepfee 2.4298 -1.0769 3.5067 1.9910
deffload 1.7221 0.5221 1.2000 1.6912
b = consistent under Ho and Ha; obtained from xtreg
B = inconsistent under Ha, efficient under Ho; obtained from xtreg
Test: Ho: difference in coefficients not systematic
chi2(8) =(b-B)'[(V_b-V_B)^(-1)](b-B)=199.84
Prob>chi2 = 0.0000