The University of Chicago Press+)$The American Society of …€¦ · · 2013-06-06Temperature...
15
! #$%&’()$* +)$ ,-./01%2034 25’ 6’&7’$%2.$’ 8’7’31’3/’ )+ #023’99: !.25)$;9<= >$0?%34% !&%$%9’*%$’ %31 @%3 A%B%4’ C’B0’(’1 ()$*;9<= A).$/’= 65’ !&’$0/%3 D%2.$%-092E @)-: FGHE D): I ;#’J$.%$? IKFI<E 77: FGLMFHF >.J-095’1 J?= The University of Chicago Press +)$ The American Society of Naturalists A2%J-’ NCO= http://www.jstor.org/stable/10.1086/663677 . !//’99’1= KPQKFQIKFI FF=KK Your use of the JSTOR archive indicates your acceptance of the Terms & Conditions of Use, available at . http://www.jstor.org/page/info/about/policies/terms.jsp JSTOR is a not-for-profit service that helps scholars, researchers, and students discover, use, and build upon a wide range of content in a trusted digital archive. We use information technology and tools to increase productivity and facilitate new forms of scholarship. For more information about JSTOR, please contact [email protected]. The University of Chicago Press and The American Society of Naturalists are collaborating with JSTOR to digitize, preserve and extend access to The American Naturalist. http://www.jstor.org
-
Upload
nguyenhuong -
Category
Documents
-
view
215 -
download
3
Transcript of The University of Chicago Press+)$The American Society of …€¦ · · 2013-06-06Temperature...

!"#$%&'()$*"+)$",-./01%2034"25'"6'&7'$%2.$'"8'7'31'3/'")+"#023'99:!.25)$;9<=">$0?%34%"!&%$%9'*%$'"%31"@%3"A%B%4'C'B0'('1"()$*;9<=A).$/'="65'"!&'$0/%3"D%2.$%-092E"@)-:"FGHE"D):"I";#'J$.%$?"IKFI<E"77:"FGLMFHF>.J-095'1"J?="The University of Chicago Press"+)$"The American Society of NaturalistsA2%J-'"NCO="http://www.jstor.org/stable/10.1086/663677 .!//'99'1="KPQKFQIKFI"FF=KK
Your use of the JSTOR archive indicates your acceptance of the Terms & Conditions of Use, available at .http://www.jstor.org/page/info/about/policies/terms.jsp
JSTOR is a not-for-profit service that helps scholars, researchers, and students discover, use, and build upon a wide range ofcontent in a trusted digital archive. We use information technology and tools to increase productivity and facilitate new formsof scholarship. For more information about JSTOR, please contact [email protected].
The University of Chicago Press and The American Society of Naturalists are collaborating with JSTOR todigitize, preserve and extend access to The American Naturalist.
http://www.jstor.org

vol. 179, no. 2 the american naturalist february 2012
A Framework for Elucidating the Temperature
Dependence of Fitness
Priyanga Amarasekare1,* and Van Savage2
1. Department of Ecology and Evolutionary Biology, University of California, Los Angeles, California 90095; 2. Department ofBiomathematics, University of California, Los Angeles, California 90095
Submitted April 12, 2011; Accepted October 23, 2011; Electronically published December 19, 2011
Online enhancements: appendixes. Dryad data: http://dx.doi.org/10.5061/dryad.g467j7g2.
abstract: Climate warming is predicted to cause large-scale ex-tinctions, particularly of ectothermic species. A striking differencebetween tropical and temperate ectotherms is that tropical speciesexperience a mean habitat temperature that is closer to the temper-ature at which fitness is maximized (Topt) and an upper temperaturelimit for survival (Tmax) that is closer to Topt than do temperate species.Thus, even a small increase in environmental temperature could puttropical ectotherms at high risk of extinction, whereas temperateectotherms have a wider temperature cushion. Although this patternis widely observed, the mechanisms that produce it are not wellunderstood. Here we develop a mathematical framework to partitionthe temperature response of fitness into its components (fecundity,mortality, and development) and test model predictions with datafor insects. We find that fitness declines at high temperatures becausethe temperature responses of fecundity and mortality act in oppositeways: fecundity decreases with temperature when temperatures ex-ceed the optimal range, whereas mortality continues to increase. Theproximity of Topt to Tmax depends on how the temperature responseof development mediates the interaction between fecundity and mor-tality. When development is highly temperature sensitive, mortalityexceeds reproduction only after fecundity has started to decline withtemperature, which causes fitness to decline rapidly to zero whentemperatures exceed Topt. The model correctly predicts empiricallyobserved fitness-temperature relationships in insects from differentlatitudes. It also suggests explanations for the widely reported phe-nological shifts in many ectotherms and the latitudinal differencesin fitness responses.
Keywords: development, fecundity, fitness, life-history traits, mor-tality, temperature variation.
Introduction
There is increasing evidence that climate warming cancause large-scale species extinctions (Walther et al. 2002;Root et al. 2003; Parmesan 2006; Sinervo et al. 2010).Ectotherms are particularly susceptible to extinction be-
* Corresponding author; e-mail: [email protected].
Am. Nat. 2012. Vol. 179, pp. 178–191. ! 2011 by The University of Chicago.0003-0147/2012/17902-52973$15.00. All rights reserved.DOI: 10.1086/663677
cause they are directly affected by perturbations to thetypical thermal environment. Since ectotherms are integralcomponents of virtually every community, playing suchkey roles as decomposers, pollinators, predators, and par-asites, their responses to climate warming are likely to havesignificant effects on community structure andfunctioning.
In ectotherms, fitness is strongly temperature depen-dent: increasing temperature causes a rise in fitness up toa maximum, followed by a rapid decline in fitness as tem-perature increases further. This dependence provides aquantifiable metric for assessing the effects of climatewarming on population viability. Data show that tropicalectotherms experience mean environmental temperaturesthat are much closer to their physiological optima thantemperate ectotherms, which puts them at greater risk ofextinction due to climate warming (Deutsch et al. 2008;Tewksbury et al. 2008; Huey et al. 2009). Understandingthe mechanisms that generate these differences is crucialin making informed predictions about how climate warm-ing affects species extinctions.
Previous studies have quantified the temperature re-sponse of fitness by fitting phenomenological functions(e.g., Gaussian-Gompertz: Frazier et al. 2006; Gaussian-quadratic: Deutsch et al. 2008) to data on the intrinsicgrowth rate measured at several temperatures. These anal-yses show that the temperature response of fitness is uni-modal and asymmetric (left skewed). Many performancetraits (e.g., assimilation, development, metabolic rate) alsoexhibit left-skewed temperature responses, and these aretypically explained in terms of the thermodynamics ofenzyme reaction rates (Van der Have and de Jong 1996;Van der Have 2002; Kingsolver 2009). These models arebased on the kinetics and denaturation of a single majorenzyme (Johnson and Lewin 1946; Sharpe and DeMichele1977; Schoolfield et al. 1981; Ratkowsky et al. 2005). Theypredict that the catalytic reaction, the rate of which in-creases exponentially with increasing temperature, com-

Temperature Dependence of Fitness 179
bined with enzyme denaturation at low and high tem-peratures, which is unimodal (and typically Gaussian;Ratkowsky et al. 2005), give rise to a left-skewed temper-ature response for reaction rates. However, it is unclearwhether this theory can explain the unimodal temperatureresponse of a composite trait such as fitness, which arisesfrom interactions between the temperature responses oflife-history traits that constitute fitness components (e.g.,fecundity, development, survivorship). There are currentlyno extensions of reaction rate theory that integrate thekinetics of several major enzymes that each drive separatefitness components. Moreover, empirically quantified tem-perature responses of fecundity and survivorship often de-viate from the left-skewed response predicted by reactionrate theory (e.g., Dreyer and Baumgartner 1996; Morganet al. 2001; Van der Have 2002; Angilletta 2009; Kingsolver2009; Dannon et al. 2010; Hou and Weng 2010; Jandricicet al. 2010), suggesting that factors other than enzymekinetics may be driving the temperature responses of fit-ness components themselves. For instance, reproductivetraits are likely to be affected by temperature effects onhormonal regulation (Nijhout 1994), and the survivorshipof free-living stages are likely to be affected by temperatureeffects on resource acquisition (Van der Have 2002). Thismismatch between theory and data highlights the need foran alternative theoretical framework for elucidating thetemperature dependence of fitness.
There is increasing recognition that the temperature de-pendence of fitness needs to be understood in terms ofthe temperature responses of fitness components. On thebasis of a data analysis spanning seven ectothermic phyla,Huey and Berrigan (2001) showed that the temperatureresponse of the intrinsic growth rate is more left skewedthan that of the basic reproductive rate, which they at-tributed to temperature effects on development. Kingsol-ver et al. (2011) point out that predictions of extinctionrisk due to climate warming need to come from a con-sideration of how fecundity and survivorship contributeto overall fitness in variable environments. There is cur-rently no theory that investigates how the temperatureresponses of fitness components interact to determine thetemperature response of fitness.
Here we take a first step toward investigating this im-portant question. We develop a mathematical frameworkbased on age-structured population dynamics to investi-gate how the temperature responses of fitness componentsdrive the temperature dependence of fitness. We find thatthe temperature responses of fitness components interactin complex and often nonintuitive ways. However, becausethe qualitative nature of these responses is conservedacross taxa, there are only a limited number of ways inwhich their interactions could influence the overall tem-perature dependence of fitness. This allows us to generate
testable predictions about the effect of climate warmingon fitness, and hence on extinction risk, that apply acrosstaxa, habitats, and latitude.
Background
Previous studies of temperature dependence (e.g., Savageet al. 2004; Frazier et al. 2006; Deutsch et al. 2008) haveused the intrinsic growth rate or the Malthusian parameter(rm) as the measure of fitness. This is the potential percapita growth rate of a population in the absence of den-sity-dependent factors such as resource limitation and nat-ural enemies (Krebs 1994), and it was previously used toelucidate latitudinal patterns in the temperature depen-dence of fitness (Deutsch et al. 2008). The ideas we develophere do not depend on the exact definition of fitness andcould in principle be extended to the realized per capitagrowth rate that includes the effects of resources and nat-ural enemies on birth, death, and development (Lotka1907; Lotka and Sharpe 1911; Charlesworth 1980; Roff1992). Using rm as the fitness measure provides a usefulbound, because populations cannot be viable unless r 1m
. Moreover, this choice makes it easier to relate the theory0to data because temperature dependence of life-historytraits is typically measured in the absence of resource lim-itation or natural enemy pressure (see app. A, availableonline).
Numerous studies have measured the temperature re-sponse of rm in ectotherms (e.g., references in Huey andBerrigan 2001; Savage et al. 2004; Frazier et al. 2006;Deutsch et al. 2008). They show that the temperature re-sponse of rm is left skewed, with a maximum at a tem-perature (Topt) that is closer to the upper temperature limit(Tmax) above which than to the lower temperaturer ! 0m
limit (Tmin) below which . Because extinction occursr ! 0m
when , any function rm(T ) that describes the tem-r ! 0m
perature dependence of fitness must have the property thatat the lower and upper temperature limits (Tminr p 0m
and Tmax, respectively) at which mortality balances repro-duction. Following Deutsch et al. (2008), we can quantifythe skewness of rm(T ) using the ratio r p (T !skew max
. This ratio is equal to 1 when rm is sym-T )/(T ! T )opt opt min
metric around Topt, less than 1 when Topt is closer to Tmax
(left skewed), and greater than 1 when Topt is closer to Tmin
(right skewed).In practice, the three parameters that describe rm(T )—
Tmin, Tmax, and Topt—can be estimated by measuring rm atdifferent temperatures and fitting a phenomenologicalfunction to the data (e.g., Huey and Berrigan 2001; Frazieret al. 2006). What we do not know is why a given specieshas particular values of these parameters and hence a par-ticular shape/form of rm(T ). To explain this, we must un-

180 The American Naturalist
derstand the mechanisms that drive the temperature re-sponse of fitness.
Mathematical Framework
Age-structured population dynamics provide a way to in-vestigate the temperature dependence of rm as a functionof the temperature responses of underlying life-historytraits. In a population that is growing at a rate rm, theexpected reproductive success of a newborn individual isgiven by the Euler-Lotka equation:
"
exp (!r x)l b dx p 1, (1)! m x x
a
where a is the age at first reproduction (the time it takesfor a zygote to develop into a reproductive adult), lx is theage-specific survivorship (the proportion of individualsthat survive from birth to age x), and bx is the age-specificfecundity (the number of offspring produced by an in-dividual of age x).
Equation (1) is the continuous form of the Euler-Lotkaequation (Lotka 1907; Lotka and Sharpe 1911), which ap-plies to multivoltine organisms that reproduce throughoutthe year. Tropical and Mediterranean species typically ex-hibit this type of life history, while temperate species arebivoltine or univoltine and reproduce only seasonally.However, data for all species come from experiments con-ducted under constant temperature and humidity andwithout any seasonal variation in temperature that limitsreproduction to a few months of the year. Thus, our frame-work applies to data used to quantify rm(T ) in speciesfrom all latitudes (e.g., references in Huey and Berrigan2001; Savage et al. 2004; Frazier et al. 2006; Deutsch et al.2008).
We do not consider the effect of body size on rm(T )because body size is fixed within a species and should havenegligible effects on temperature dependence within spe-cies. Across species, body size may influence the magnitudeof rm but not the unimodality or asymmetry of rm(T )because rm(T ) is determined by life-history traits that scalewith body size (Savage et al. 2004).
We consider the common situation where fecundity de-clines with age (Charlesworth 1980; Roff 1992; Stearns1992; Charnov 1993). Here, for andb p 0 x ! a b px x
for , where is the age at whichb f(x ! a ) x ! a aa peak peakpeak
fecundity is maximized and the function f describes therelationship between fecundity and age. This relationshipis typically unimodal and by definition has a peak at f (0)(Reznick 1985; Southwood 1988; Dreyer and Baumgartner1996; Medeiros et al. 2000, 2003; Morgan et al. 2001; Dan-non et al. 2010). Once the age at first reproduction is
reached, survivorship can be approximated by an expo-nential decay; that is, , where d isl p l exp [!d(x ! a)]x a
the instantaneous adult mortality rate (Charnov 1993; Sav-age et al. 2004). We assume that mortality does not increasewith age, which is reasonable for species in which fecunditydoes not appreciably reduce longevity.
We can then express equation (1) as
"
b l exp (da) f(x ! a )a a ! peakpeak
a (2)
# exp [!(d # r )x]dx p 1,m
which, with a change of variables of , be-y p x ! apeak
comes
b l exp [!d(a ! a)]a a peakpeak
"
# exp (!r a ) f(y) (3)m peak !a!apeak
# exp [!(d # r )y]dy p 1.m
Because f ( y) is unimodal, and every-f(0) p 1 f(y) ! 1where else. In ectotherms, fecundity typically reaches amaximum relatively soon after sexual maturity and de-clines thereafter (e.g., Reznick 1985; Southwood 1988). Forinstance, in many insects, the age at which fecundity ismaximized ( ) is less than 25% of the adult lifea ! apeak
span and can be as low as 5% (see app. B, table B1, avail-able online). Consequently, f is sharply peaked such thatadult mortality (d ) determines how quickly the integranddeclines and hence the age range contributing to the in-tegral. In this case, the integral in equation (3) is domi-nated by (i.e., ). We approximate this in-y p 0 x p apeak
tegral by evaluating f at its maximal point, , andy p 0performing the integration over the remaining exponentialterm (see app. C, available online). This gives us the fol-lowing solution:
b l exp (!r a) ! (d # r ) " 0. (4)a a m mpeak
The quantity la, the proportion of individuals that surviveto the age at first reproduction, can be expressed in termsof the average mortality during the juvenile stage, , asd
(Charnov 1993).a ¯l p exp (! d(x)dx) p exp (!da)!0a
Then,
¯b exp [!(d # r )a] ! (d # r ) " 0. (5)a m mpeak
To investigate the temperature dependence of rm, wemust consider the temperature dependence of fecundity( ), mortality ( and d ), and development (a). With¯b dapeak

Temperature Dependence of Fitness 181
explicit temperature dependence of these traits, equation(5) becomes
¯b (T) exp {![d(T) # r (T)]a(T)} ! [d(T) # r (T)] " 0,a m mpeak
(6)
which can be solved to give an analytical expression forthe temperature response of fitness in terms of the tem-perature dependence of fitness components:
1r (T) p !d(T) #m a(T) (7)
¯# W b (T)a(T) exp [(d(T) ! d(T))a(T)] ,{ }apeak
where W is the principal (positive) branch of the LambertW function or the product logarithm (Corless et al. 1996).
Equation (7) provides a general expression for rm(T )that can accommodate any empirically determined ormechanistically derived temperature response function forfecundity, development, and mortality. In what follows,we discuss some commonly observed response functionsand show that their incorporation into equation (7) yieldsan explicit analytical expression for rm(T ) that consistsentirely of measurable parameters.
Data from a large number of studies across all ecto-thermic taxa (e.g., references in Gillooly et al. 2001b) showthat per capita mortality rates of juveniles and adults in-crease monotonically with increasing temperature. Thisrelationship is well described by the Boltzmann-Arrheniusfunction (Gillooly et al. 2001b; Savage et al. 2004):
z(T) p z exp {A [(1/T ) ! (1/T)]}, (8)T z RR
where z is the juvenile ( ) or adult (d ) mortality rate atdtemperature T (in "K), is the mortality rate at a ref-zTR
erence temperature (typically between 20" and 30"C, with24"–35"C being the most common; Sharpe and DeMichele1977; Schoolfield et al. 1981), and Az is the Arrheniusconstant ( , where is the activation energyA p E /k Ez A A
[cal] and k is the Boltzmann’s constant [cal molecule!1
degree!1]), which quantifies how fast mortality increaseswith increasing temperature. Some studies have found thatmortality rates can increase at very low temperatures(Morgan et al. 2001), but because this typically occurs attemperatures too low for reproduction, such increases haveno effect on rm.
Developmental rates of most ectotherms also increasemonotonically with increasing temperature (Gillooly et al.2001b; Savage et al. 2004), although in some species thisoccurs at a decelerating rate (e.g., Dreyer and Baumgartner1996; Morgan et al. 2001) and in yet others, developmentalrate declines at high temperatures (Van der Have 2002;Angilletta 2009). This pattern has been attributed to the
reaction rate and high temperature inactivation of a singlemajor enzyme that drives the developmental process(Johnson and Lewin 1946; Sharpe and DeMichele 1977;Schoolfield et al. 1981; Van der Have and de Jong 1996;Van der Have 2002; Ratkowsky et al. 2005); that is, thereaction rate increases monotonically with temperaturewhile enzyme inactivation exhibits a unimodal (typicallyGaussian; Ratkowsky et al. 2005) response to temperature.The net result is a left-skewed temperature response givenby
1 [(TT )/a ] exp {E [(1/T ) ! (1/T)]}R T 1/a RRp , (9)a(T) 1 # exp {E [(1/T ) ! (1/T)]}H H/2
where is the developmental rate at temperature T1/a(T)in degrees Kelvin, is the developmental rate at the1/aTR
reference temperature TR, E1/a is the enthalpy of activationof the reaction (cal mol!1) catalyzed by the enzyme dividedby the universal gas constant (1.987 cal mol!1 degree!1),EH is the enthalpy change associated with the high-tem-perature inactivation of the enzyme (cal mol!1) dividedby the universal gas constant, and TH/2 is the temperatureat which the enzyme is 50% active. If the developmentalrate does not decrease within the temperature range thatallows for reproduction, the temperature response of de-velopment can be characterized by the Boltzmann-Arrhe-nius function (eq. [8], which is equivalent to the numer-ator of equation [9]) with the appropriate parameters( and Aa). On the basis of our survey of the literatureaTR
(P. Amarasekare, unpublished data), this is a reasonableapproach for a large number of species in which a declinein the developmental rate at high temperatures is not ob-served within the biologically relevant temperature range(Trudgill et al. 2005; Bowler and Terblanche 2008; Dixonet al. 2009). It also has the advantage that it allows us toobtain an explicit analytical expression for rm(T ), whereasthe use of equation (9) requires that rm(T ) be solved vianumerical root finding.
The temperature dependence of maximum fecundity( ) is rarely quantified empirically. We use the tem-b (T)apeak
perature dependence of average per capita fecundity( ) as a surrogate for . This is reasonable be-b(T) b (T)apeak
cause fecundity is typically a sharply peaked function ofage and is dominated by . Numerous studiesb(T) b (T)apeak
of invertebrates, fish, and lizards show that per capita fe-cundity (averaged over the reproductive life span) exhibitsa symmetric unimodal relationship with temperature (e.g.,Dreyer and Baumgartner 1996; Carriere and Boivin 1997;Morgan et al. 2001; Dannon et al. 2010; Hou and Weng2010; Jandricic et al. 2010; P. Amarasekare, unpublisheddata). This relationship is well-described by a Gaussianfunction:

182 The American Naturalist
2 2¯ ¯b(T) p b exp {![(T ! T ) /2s ]}, (10)¯T optR b
where is the average per capita fecundity at the ref-bTR
erence temperature, is the temperature at which av-T ¯optb
erage fecundity is maximal, and s gives the variability aboutthe optimum. If the relationship of any species de-b(T)viates from a Gaussian function (e.g., it is left skewed),one can use the appropriate function describing (e.g.,b(T)a Gaussian-quadratic) instead.
Incorporating a Gaussian function for fecundity andexponential (Boltzmann-Arrhenius) functions for devel-opment and mortality into equation (7) and defining
givesTD p [(1/T ) ! (1/T)]R
1r (T) p !d exp (A TD) #m T dR a exp (A TD)T aR
2 2¯# W b a exp {A TD ! [(T ! T ) /2s ] (11)( ¯T T a optR R b
¯# a exp (A TD)[d exp (A TD) ! d exp (A TD)]} .¯ )T a T d T dR R R
The first term of equation (11) is the negative of the tem-perature response function for adult mortality, which isnegative at all temperatures; the greater its magnitude, thegreater the negative effect it has on fitness. The secondterm, which is positive for all temperatures, combines ex-ponential, Gaussian, and Gompertz-like functions arisingfrom the temperature response of development (exponen-tial), fecundity (Gaussian), and the interaction betweendevelopment and mortality (Gompertz-like). For
, the negative effect of increasing adult mortalityr (T) 1 0m
with temperature must be counteracted by the positiveeffects of increasing fecundity and accelerated develop-ment as temperatures increase (fig. 1c–1e).
Results
Elucidating the temperature dependence of rm in terms ofunderlying life-history traits allows us to explain two keyempirical findings. The first is the unimodality of rm(T ),in particular, the decline of rm at high temperatures. Thesecond is the asymmetry (left skew) of rm(T ), with thelower critical threshold (Tmin) being farther away from theoptimum temperature (Topt) than the upper critical thresh-old (Tmax).
To understand why rm(T ) is unimodal, we characterizethe width and skew of rm(T ). We obtain Tmin and Tmax bysetting the right-hand side of equation (11) to 0 and solv-ing for T; we obtain Topt by setting and(!r (T))/!T p 0m
solving for T. These solutions must be obtained numer-ically. We can understand the properties of rm(T ) graph-ically by plotting the two terms of rm(T ) as a function oftemperature (fig. 1c–1e). The important point is that we
can use the temperature responses of fecundity, develop-ment, and mortality, which are routinely measured inmany ectothermic taxa, to predict the shape of rm(T ) ascharacterized by Tmin, Topt, and Tmax.
The empirically observed unimodality of rm(T ) is thedirect result of the qualitative differences between the tem-perature responses of fecundity, development, and mor-tality. Development and mortality rates increase with in-creasing temperature, while fecundity increases withtemperature up to a maximum and declines thereafter. Atlow temperatures, therefore, all three life-history traits in-crease with increasing temperature. Provided that the in-crease in fecundity with increasing temperature is greaterthan the increase in mortality, rm will increase as temper-ature increases. The greater the sensitivity of developmentto temperature, the greater the increase in fecundity rel-ative to the increase in mortality and, hence, the greaterthe increase in rm. As temperatures increase beyond theoptimal range for reproduction, fecundity starts to declinewhile mortality continues to increase, causing rm to declineat high temperatures. The wider the response of repro-duction to temperature, the greater the temperature rangeover which rm is positive (fig. 1).
We next explain the observed asymmetry of rm(T ): theincrease in fitness up to that optimum temperature ismuch slower than the decrease in fitness when environ-mental temperatures exceed the optimum (i.e., T !max
; Deutsch et al. 2008). Numerical eval-T ! T ! Topt opt min
uation of equation (11) for different values of Aa, Ad, ,Ad
and s shows that Aa and s are the key factors that determinethe asymmetry of rm(T ) (figs. 2, 3). The temperature sen-sitivities of juvenile and adult mortality ( , Ad) haveAd
roughly equivalent effects on Tmin, Topt, and Tmax and henceno strong qualitative effect on the unimodality or asym-metry of rm(T ). They have the quantitative effect of re-ducing the magnitude of rm at Topt, which is stronger for
than it is for Ad (app. D, figs. D1–D4, available online).Ad
The temperature sensitivity of development (Aa) is cru-cial in explaining the asymmetry of rm(T ). When Aa ishigh, the positive contribution to fitness (via fecundity anddevelopment) increases with temperature at an acceler-ating rate. Since the negative contribution to fitness (viamortality) also increases at an accelerating rate, mortalitycan overwhelm reproduction only after the optimal tem-perature range for reproduction is exceeded and fecundityhas begun to decline (fig. 2c). The net effect of decliningfecundity and increasing mortality is a rapid decline infitness when temperature exceeds the optimum (as op-posed to the slow increase to the optimum when fecundityand mortality are both increasing with temperature). Asa result, Tmax is closer to Topt than to Tmin (fig. 2d ). Incontrast, when Aa is low, the positive contribution to fit-ness increases with temperature at a decelerating rate (fig.

Figure 1: Temperature dependence of fecundity (a) and development (b; as specified by eq. [6]) and rm (c, d). In c, the black curve is thenegative contribution to fitness via adult mortality (negative of the first term of eq. [7]); the gray curve is the positive contribution tofitness via reproduction, development, and mortality (second term of eq. [7]). d, The function rm(T) resulting from c. The function rm(T) is 0 when the two curves in c cross, and these points correspond to Tmin and Tmax; rm(T) is maximal when the difference between thetwo curves is the largest, which occurs at Topt. A comparison of c and d with e and f illustrates the effects of s on rm(T): as s increases( in c and d and in e and f), over a wider temperature range. Increasing and Ad have no qualitative effect ons p 2.5 s p 4.8 r (T) 1 0 A¯m d
rm(T) (figs. D1–D4, available online). Equation (7) requires that temperature be in Kelvin, but graphs are plotted in Celsius for ease ofinterpretation. Parameter values are as follows: , , , , , , ,¯A p !8,000 A p 7,500 A p 10,000 T p 294 K b p 50 d p 0.03 d p 0.05¯a d d R T T TR R R
, .a p 60 T p 298 K¯T optR b

184 The American Naturalist
Figure 2: Effects of the temperature response of development on the asymmetry of rm(T). The temperature sensitivity of development (Aa)determines how close Tmax is to Topt. When Aa is low (a, b; ), the decline in rm at high temperatures is relatively slow becauseA p !2,000a
organisms develop more slowly and their reproductive life span becomes shorter. Then mortality can exceed reproduction even beforefecundity starts to decline with temperature, causing rm to decline over a wider temperature range. As a result, Tmax is farther away fromTopt. Conversely, when Aa is high (c, d; ), the decline in rm at high temperatures is relatively fast because organisms developA p !15,000a
faster and their reproductive life span is longer. Hence, mortality can overwhelm reproduction only after fecundity has started to declinewith temperature. Since fecundity is declining while mortality is increasing, rm declines to 0 within a narrow temperature range. As a result,Tmax becomes closer to Topt. Parameter values are as in figure 1 except , , and .s p 3 A p 9,000 A p 10,000d d
2a). Since mortality increases with temperature at an ac-celerating rate, fitness is maximized at a relatively lowtemperature, one at which fecundity is still increasing (fig.2a). Because fecundity continues to increase at tempera-tures past Topt, the decline in fitness with increasing tem-perature is relatively slow. As a result, Tmax is farther awayfrom Topt (fig. 2b).
Our formulation of rm(T ) (eq. [11]) considers that de-velopmental rate (1/a) increases monotonically with tem-perature. In some species, the developmental rate can de-
celerate and even decline at high temperatures (Trudgillet al. 2005; Bowler and Terblanche 2008; Dixon et al.2009). If the developmental rate starts to decline at tem-peratures that are too high for reproduction, it has noeffect on rm(T ); if it starts to decline within the tem-perature range that allows for reproduction, it will in-crease the left skewness of rm(T ). This is because a de-crease in the developmental rate reduces the reproductivelife span of individuals, which in turn allows mortalityto overwhelm reproduction at a lower temperature. As

Temperature Dependence of Fitness 185
Figure 3: Effects of the temperature response of reproduction on the asymmetry of rm(T). The width of the temperature response (s)determines how close Tmin is to Topt. When s is low (a, b; ), is only slightly greater than . As s increases (c, d;s p 2.0 T ! T T ! Topt min max opt
), Tmin decreases while Topt and Tmax increase. The decrease in Tmin is greater than the increase in Topt or Tmax, and hence the left tails p 4.0increases with s even faster than the right tail. These two effects result in a greater asymmetry of rm(T). Parameter values are as in figure1 except , , and .A p !15,000 A p 9,000 A p 10,000¯a d d
a result, Tmax will be closer to Topt than when the devel-opmental rate increases monotonically with tempera-ture.
While the decline in fitness at high temperatures occurswithin a narrow temperature range, the increase in fitnessup to the optimum temperature occurs over a much widertemperature range. This is because when environmentaltemperatures are low, the increase in fecundity with in-creasing temperature is not much greater than the increasein mortality. Hence, the increase in fitness with temper-ature ( ) is relatively slow. It is only when tem-!r (T)/!Tm
peratures approach the optimum range for reproductionthat the increase in fecundity substantially exceeds the in-crease in mortality, causing fitness to increase with tem-perature relatively quickly. As a result, Tmin is farther awayfrom Topt than Tmax. The width of the temperature responseof reproduction (s) has a strong effect on the proximityof Tmin to Topt (fig. 3a–3d ). When s is high, fitness increaseswith temperature at an accelerating rate; that is,
is very small at low temperatures and increases!r (T)/!Tm
rapidly as temperatures approach the optimum for repro-duction. This causes Tmin to be farther away from Topt, thus

186 The American Naturalist
making for a highly asymmetric temperature response (fig.3c, 3d ).
These findings suggest that species with low s and highAa values are likely to exhibit a narrower and more sym-metric temperature response of fitness than species withhigh s and low Aa values. Previous studies suggest that theasymmetry of the fitness response is a function of latitude(Deutsch et al. 2008; Tewksbury et al. 2008). If so, weexpect temperate ectotherms to exhibit greater asymmetryin rm(T ) than tropical ectotherms. We also expect theasymmetry of rm(T ) in subtropical and Mediterranean ec-totherms to be intermediate between those of tropical andtemperate ectotherms.
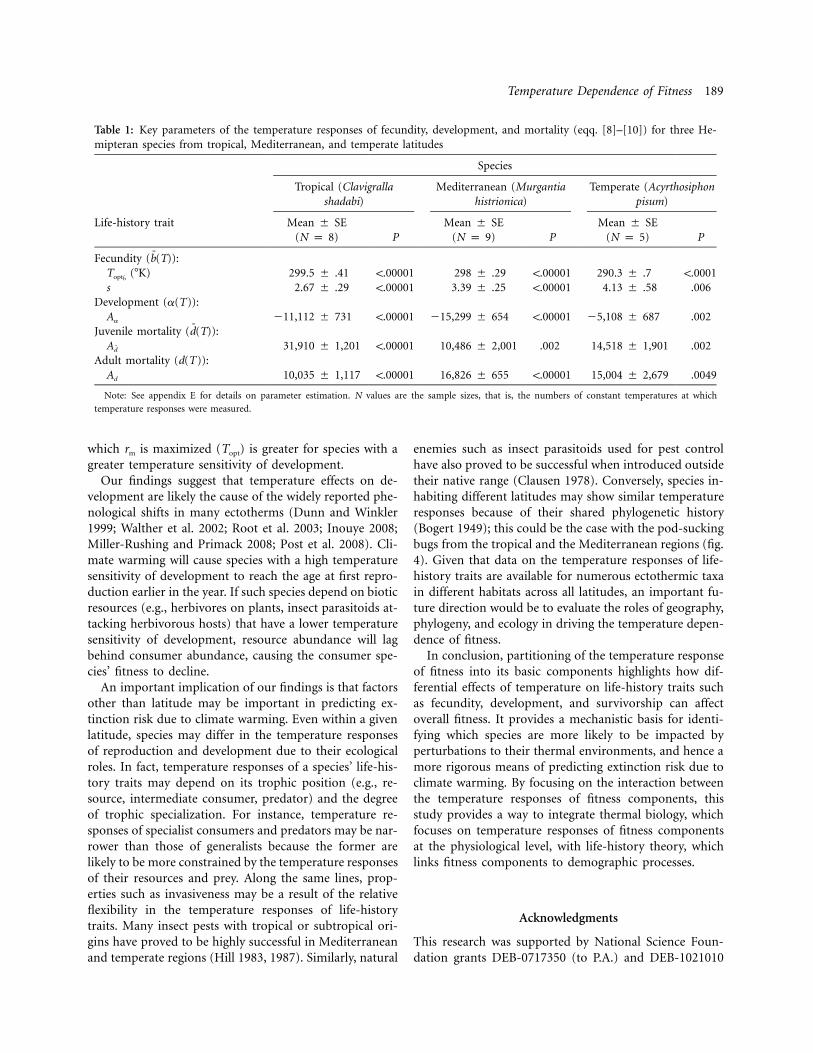
We tested these predictions with data from three Hemip-teran species from tropical, Mediterranean, and temperatelocalities. Our goal was to validate our model with datafrom representative species inhabiting different latitudesrather than perform an exhaustive analysis of a large num-ber of species; such an analysis is an important next step(see “Discussion”). The tropical species is a pod-suckingbug (Clavigralla shadabi; Hemiptera: Coreidae) from Be-nin (8"20#N; Dreyer and Baumgartner 1996), the Medi-terranean species is the harlequin bug (Murgantia histrion-ica; Hemiptera: Pentatomidae) from coastal southernCalifornia (33"37#8##N; Amarasekare 2000a, 2000b, 2003,2007), and the temperate species is the pea aphid (Acyr-thosiphon pisum; Hemiptera: Aphididae) from York, En-gland (53"57#30##N; Morgan et al. 2001). The tropical andtemperate species are the same ones used by Deutsch etal. (2008) in their study of extinction risk due to climatewarming. We used empirically measured temperature re-sponses of reproduction, development, and mortality foreach species (Dreyer and Baumgartner 1996; Morgan etal. 2001; P. Amarasekare, unpublished data) to parame-terize equation (11) and to predict the expected rm(T ) (seeapp. E, available online, for details). The predicted rm(T )for the tropical and temperate species provide a goodmatch with the empirically measured rm(T ) (fig. 4). Theasymmetry of the empirically measured rm(T ) is greaterin the temperate species compared with the tropical spe-cies, but the asymmetry of the Mediterranean species isnot greater than that of the tropical species (fig. 4). Whilethese results contradict expectations based purely on lat-itude, they are easily explained within our framework. Datashow the temperate species to have a wider temperatureresponse of reproduction and a lower temperature sen-sitivity of development than the tropical species. As wehave shown above, this combination of responses cancause rm(T ) to become highly asymmetric. The similaritybetween the tropical and the Mediterranean species arisesbecause the latter has as narrow a temperature responseof reproduction as the former and a much higher tem-perature sensitivity of development (table 1). Of note, the
tropical and the Mediterranean species, both pod-suckingbugs, are more closely related to each other than to thetemperate species, the pea aphid, suggesting a possiblephylogenetic influence on the temperature responses offitness components.
Discussion
Understanding how climate change influences species ex-tinction is an issue of great ecological and environmentalconcern. Because fitness is strongly temperature dependentin ectotherms, it provides a metric for assessing extinctionrisk. Here we have developed a mathematical frameworkthat partitions the temperature dependence of fitness intoits components of fecundity, development, and mortality.Because the qualitative properties of the temperature re-sponses of fitness components are robust to taxonomicand geographic variation (Gillooly et al. 2001a, 2001b;Savage et al. 2004), our partitioning applies to ectothermictaxa inhabiting all latitudes. Most importantly, it allowsus to both explain the observed fitness-temperature re-lationships and predict their consequences for speciesextinctions.
The key prediction of our framework is that speciesexhibiting a narrower temperature response of fitness, withTopt closer to Tmax, should have a narrower temperatureresponse of reproduction and a greater temperature sen-sitivity of development (i.e., lower s and higher Aa) com-pared with species that have a wider temperature responseof fitness, with Topt farther away from Tmax. In testing thisprediction with insects from different latitudes, we foundthat the tropical species, which exhibits a narrower tem-perature response of fitness, does indeed have lower s andhigher Aa values than the temperate species. However, theMediterranean species has similar s and higher Aa valuesthan the tropical species and a comparably narrow fitnessresponse. This finding highlights an important point: anyectothermic species, regardless of its geographic location,will be at greater risk of extinction because of climatewarming if it has a narrow temperature response of re-production and a high temperature sensitivity ofdevelopment.
Previous explanations of the temperature response offitness (e.g., Angilletta 2009; Kingsolver 2009) are basedon reaction rate theory, which considers temperature ef-fects on the kinetics and inactivation of a single majorenzyme (Johnson and Lewin 1946; Sharpe and DeMichele1977; Schoolfield et al. 1981; Van der Have and de Jong1996; Van der Have 2002; Ratkowsky et al. 2005). However,fitness is a composite trait consisting of individual com-ponents (e.g., fecundity, development, survivorship).While enzyme kinetics may play a role in the temperatureresponses of fitness components, these responses are also


188 The American Naturalist
Figure 4: Temperature responses of fitness for three Hemipteran species inhabiting tropical (a, b), Mediterranean (c, d), and temperate (e,f) latitudes. In b, d, and f, the solid curve is the predicted rm(T) from equation (7) parameterized with empirically quantified temperatureresponses of fecundity, development, and mortality (table 1; app. E, available online). The open circles are direct measurements of rm thatwe have normalized to 1 for ease of comparison. Direct measures of rm are not available for the Mediterranean species. For the tropicaland temperate species, rm predicted from the model provides a good fit to the empirical measurements of rm (Kolmogorov-Smirnov test;tropical species: , ; temperate species: , ; note that higher P values imply a better fit between observedD p 0.375 P p .6272 D p 0.2 P p 1and predicted rm(T)).
likely to be affected by other physiological processes thatare temperature dependent. For instance, cumulative sur-vivorship (lx), especially embryonic viability, exhibits atemperature response that is inverted U-shaped ratherthan left skewed (Van der Have 2002; Angilletta 2009;Kingsolver 2009), and per capita mortality rates exhibit amonotonic temperature response (Gillooly et al. 2001a;Savage et al. 2004). Reproductive traits (e.g., mating, egglaying) show a more symmetric temperature response thanthe left-skewed one predicted by reaction rate theory (e.g.,Dreyer and Baumgartner 1996; Carriere and Boivin 1997;Medeiros et al. 2000, 2003; Morgan et al. 2001; Dannonet al. 2010; P. Amarasekare, unpublished data; app. E).Because reproductive traits are also under strong hormonalregulation, their temperature responses are likely to bedriven by temperature effects on hormonal activity (Nij-hout 1994). Developmental rates exhibit temperature re-sponses that are most consistent with the left-skewed re-sponse predicted by the reaction rate theory (Sharpe andDeMichele 1977; Schoolfield et al. 1981; Van der Have andde Jong 1996; Van der Have 2002), but in many speciesthe developmental rate increases with temperature at adecelerating rate and does not appear to decline withinthe biologically relevant temperature range (Trudgill et al.2005; Bowler and Terblanche 2008; Dixon et al. 2009).Although there is no doubt that the thermodynamicsof enzyme reaction rates plays an important role in theorganism-level temperature responses of life-history andperformance traits, a mechanistic understanding of thetemperature dependence of fitness requires that we alsounderstand how temperature affects other physiologicalprocesses such as hormonal regulation. It may well be thatthe temperature responses of reproductive traits resultfrom the interplay between temperature effects on rateprocesses such as enzyme kinetics and on regulatory pro-cesses based on negative feedback pathways such as hor-monal action. Ultimately, it is through a mechanistic un-derstanding of how temperature affects key life-historytraits that we can hope to understand and predict howectotherms respond to perturbations such as climatewarming (Huey and Berrigan 2001; Kingsolver et al. 2011).
Our mathematical framework, and the studies that mo-tivated it (e.g., Deutsch et al. 2008), are based on thetemperature dependence of fitness quantified as the in-
trinsic growth rate. In real systems, fitness is likely to beinfluenced by density-dependent factors such as resourcelimitation and natural enemy pressure. It is therefore im-portant to verify that predictions of extinction risk thatare based on the temperature dependence of rm also holdin population dynamical models that incorporate resourcecompetition and interactions with natural enemies. If pre-dictions based on such models match those based on rm,we can have greater confidence in using the temperaturedependence of rm to predict extinction risk due to climatewarming. Studies are currently under way (P. Amarasekare,unpublished manuscript) to investigate this issue.
The crucial insight to emerge from our analysis is theeffect of development on the temperature dependence offitness. While the effects of reproduction and mortality arerelatively easy to predict (e.g., the decline in fitness at hightemperatures is the result of mortality exceeding repro-duction), the effects of development are indirect and couldnot have been elucidated without mathematical theory. Aswe have shown, temperature effects on development arethe key to explaining both the unimodality and the asym-metry of the temperature response of fitness. Huey andBerrigan (2001) found that the temperature response ofrm was more left skewed than that of the basic reproductiverate (R0), which they predicted should occur because rm
depends on the generation time, which itself decreases withincreasing temperature. This study, which was based onempirical measures of rm and R0 in several ecothermic taxa,highlighted how temperature effects on development couldlead to qualitatively different temperature responses for rm
and R0. However, it did not explain why the temperatureresponse of rm should be left skewed at all or why thereexist species-specific differences in the degree of skewnessof rm(T ) (e.g., tropical species exhibit rm(T ) values thatare significantly less left skewed than those of temperatespecies; Deutsch et al. 2008). Our mathematical analysesshow that the temperature sensitivity of development iskey to generating the left-skewed temperature response ofrm but that this effect can be counterintuitive. For instance,species with greater a temperature sensitivity of develop-ment (and hence a shorter generation time) exhibit a lessleft-skewed temperature response than species with a lowertemperature sensitivity of development (and hence alonger generation time), but the optimal temperature at
Temperature Dependence of Fitness 189
Table 1: Key parameters of the temperature responses of fecundity, development, and mortality (eqq. [8]–[10]) for three He-mipteran species from tropical, Mediterranean, and temperate latitudes
Species
Tropical (Clavigrallashadabi)
Mediterranean (Murgantiahistrionica)
Temperate (Acyrthosiphonpisum)
Life-history trait Mean # SE(N p 8) P
Mean # SE(N p 9) P
Mean # SE(N p 5) P
Fecundity ( ):b(T)("K)T ¯optb
299.5 # .41 !.00001 298 # .29 !.00001 290.3 # .7 !.0001s 2.67 # .29 !.00001 3.39 # .25 !.00001 4.13 # .58 .006
Development (a(T)):Aa !11,112 # 731 !.00001 !15,299 # 654 !.00001 !5,108 # 687 .002
Juvenile mortality ( ):d(T)Ad 31,910 # 1,201 !.00001 10,486 # 2,001 .002 14,518 # 1,901 .002
Adult mortality (d(T)):Ad 10,035 # 1,117 !.00001 16,826 # 655 !.00001 15,004 # 2,679 .0049
Note: See appendix E for details on parameter estimation. N values are the sample sizes, that is, the numbers of constant temperatures at whichtemperature responses were measured.
which rm is maximized (Topt) is greater for species with agreater temperature sensitivity of development.
Our findings suggest that temperature effects on de-velopment are likely the cause of the widely reported phe-nological shifts in many ectotherms (Dunn and Winkler1999; Walther et al. 2002; Root et al. 2003; Inouye 2008;Miller-Rushing and Primack 2008; Post et al. 2008). Cli-mate warming will cause species with a high temperaturesensitivity of development to reach the age at first repro-duction earlier in the year. If such species depend on bioticresources (e.g., herbivores on plants, insect parasitoids at-tacking herbivorous hosts) that have a lower temperaturesensitivity of development, resource abundance will lagbehind consumer abundance, causing the consumer spe-cies’ fitness to decline.
An important implication of our findings is that factorsother than latitude may be important in predicting ex-tinction risk due to climate warming. Even within a givenlatitude, species may differ in the temperature responsesof reproduction and development due to their ecologicalroles. In fact, temperature responses of a species’ life-his-tory traits may depend on its trophic position (e.g., re-source, intermediate consumer, predator) and the degreeof trophic specialization. For instance, temperature re-sponses of specialist consumers and predators may be nar-rower than those of generalists because the former arelikely to be more constrained by the temperature responsesof their resources and prey. Along the same lines, prop-erties such as invasiveness may be a result of the relativeflexibility in the temperature responses of life-historytraits. Many insect pests with tropical or subtropical ori-gins have proved to be highly successful in Mediterraneanand temperate regions (Hill 1983, 1987). Similarly, natural
enemies such as insect parasitoids used for pest controlhave also proved to be successful when introduced outsidetheir native range (Clausen 1978). Conversely, species in-habiting different latitudes may show similar temperatureresponses because of their shared phylogenetic history(Bogert 1949); this could be the case with the pod-suckingbugs from the tropical and the Mediterranean regions (fig.4). Given that data on the temperature responses of life-history traits are available for numerous ectothermic taxain different habitats across all latitudes, an important fu-ture direction would be to evaluate the roles of geography,phylogeny, and ecology in driving the temperature depen-dence of fitness.
In conclusion, partitioning of the temperature responseof fitness into its basic components highlights how dif-ferential effects of temperature on life-history traits suchas fecundity, development, and survivorship can affectoverall fitness. It provides a mechanistic basis for identi-fying which species are more likely to be impacted byperturbations to their thermal environments, and hence amore rigorous means of predicting extinction risk due toclimate warming. By focusing on the interaction betweenthe temperature responses of fitness components, thisstudy provides a way to integrate thermal biology, whichfocuses on temperature responses of fitness componentsat the physiological level, with life-history theory, whichlinks fitness components to demographic processes.
Acknowledgments
This research was supported by National Science Foun-dation grants DEB-0717350 (to P.A.) and DEB-1021010

190 The American Naturalist
to (V.M.S and P.A.). We thank P. Abrams, P. Chesson, T.Dell, S. Frank, C. Johnson, J. Kingsolver, K. Okamoto, S.Pawar, and an anonymous reviewer for comments thatsubstantially improved the manuscript.
Literature Cited
Amarasekare, P. 2000a. Coexistence of competing parasitoids on apatchily distributed host: local vs. spatial mechanisms. Ecology 81:1286–1296.
———. 2000b. Spatial dynamics in a host-multiparasitoid com-munity. Journal of Animal Ecology 69:201–213.
———. 2003. Diversity-stability relationships in multi-trophic sys-tems: an empirical exploration. Journal of Animal Ecology 72:713–724.
———. 2007. Trade-offs, temporal variation and species coexistencein communities with intraguild predation. Ecology 88:2720–2728.
Angilletta, M. 2009. Thermal adaption: a theoretical and empiricalsynthesis. Oxford University Press, Oxford.
Bogert, C. M. 1949. Thermoregulation in reptiles, a factor in evo-lution. Evolution 3:195–211.
Bowler, K., and J. Terblanche. 2008. Insect thermal tolerance: whatis the role of ontogeny, ageing and senescence? Biological Review8:339–355.
Carriere, Y., and G. Boivin. 1997. Evolution of thermal sensitivity ofparasitization capacity in egg parasitoids. Evolution 51:2028–2032.
Charlesworth, B. 1980. Evolution in age-structured populations.Cambridge University Press, Cambridge.
Charnov, E. L. 1993. Life history invariants: some exploration ofsymmetry. Oxford University Press, Oxford.
Clausen, C. P. 1978. Introduced parasites and predators of arthropodpests and weeds: a world review. Agricultural Handbook 480. Ag-ricultural Research Service, USDA, Washington DC.
Corless, R., G. Gonnet, D. Hare, D. Jeffrey, and D. Knuth. 1996. Onthe Lambert w function. Advances in Computational Mathematics5:329–359.
Dannon, E. A., M. Tamo, A. van Huis, and M. Dicke. 2010. Func-tional response and life history parameters of Apanteles taragamae,a larval parasitoid of Maruca vitrata. BioControl 55:363–378.
Deutsch, C. J., J. Tewksbury, R. B. Huey, K. Sheldon, C. Ghalambor,D. Haak, and P. R. Martin. 2008. Impacts of climate warming onterrestrial ectotherms across latitude. Proceedings of the NationalAcademy of Sciences of the USA 105:6668–6672.
Dixon, A., A. Hone, K. Keil, M. Kotela, A. Sizling, and V. Jarosik.2009. Relationship between the minimum and maximum tem-perature thresholds for development in insects. Functional Ecology23:256–264.
Dreyer, H., and J. Baumgartner. 1996. Temperature influence oncohort parameters and demographic characteristics of the twocowpea coreids Clavigralla tomentosicollis and C. shadabi. Ento-mologia Experimentalis et Applicata 78:201–213.
Dunn, P. O., and D. W. Winkler. 1999. Climate change has affectedthe breeding date of tree swallows throughout North America.Proceedings of the Royal Society B: Biological Sciences 266:2487–2490.
Frazier, M., R. Huey, and D. Berrigan. 2006. Thermodynamic con-straints on the evolution of insect growth rates: “warmer is better.”American Naturalist 168:512–520.
Gillooly, J. F., J. H. Brown, G. B. West, V. M. Savage, and E. L.
Charnov. 2001a. Effects of size and temperature on metabolic rate.Science 293:2248–2251.
Gillooly, J. F., E. L. Charnov, G. B. West, V. M. Savage, and J. H.Brown. 2001b. Effects of size and temperature on developmentaltime. Science 293:2248–2251.
Hill, D. S. 1983. Agricultural insect pests of the tropics and theircontrol. Cambridge University Press, Cambridge.
———. 1987. Agricultural insect pests of temperate regions and theircontrol. Cambridge University Press, Cambridge.
Hou, Y., and Z. Weng. 2010. Temperature-dependent developmentand life table parameters of Octodonta nipae (Coleoptera: Chry-somelidae). Environmental Entomology 39:1676–1684.
Huey, R., and D. Berrigan. 2001. Temperature, demography, andectotherm fitness. American Naturalist 158:204–210.
Huey, R. B., C. Deutsch, J. J. Tewksbury, L. J. Vitt, P. Hertz, H. J.Alvarez Perez, and T. J. Garland. 2009. Why tropical forest lizardsare vulnerable to climate warming. Proceedings of the Royal So-ciety B: Biological Sciences 276:1939–1948.
Inouye, D. 2008. Effects of climate change on phenology, frost dam-age, and floral abundance of wildflowers. Ecology 89:353–362.
Jandricic, S. E., S. P. Wraight, K. C. Bennett, and J. P. Sanderson.2010. Developmental times and life table statistics of Aulacorthumsolani (Hemiptera: Aphididae) at six constant temperatures, withrecommendations on the application of temperature-dependentdevelopment models. Environmental Entomology 39:1631–1642.
Johnson, F., and I. Lewin. 1946. The growth rate of E. coli in relationto temperature, quinine and coenzyme. Journal of Cellular andComparative Physiology 28:47–75.
Kingsolver, J. 2009. The well-temperatured biologist. American Nat-uralist 174:755–768.
Kingsolver, J., A. Woods, L. B. Buckley, L. Potter, H. MacLean, andJ. Higgins. 2011. Complex life cycles and the responses of insectsto climate change. Integrative and Comparative Biology 51:662–665.
Krebs, C. J. 1994. Ecology: the experimental analysis of distributionand abundance. Harper Collins, New York.
Lotka, A. J. 1907. Relation between birth rates and death rates. Sci-ence 26:21–22.
Lotka, A. J., and F. R. Sharpe. 1911. A problem in age distribution.Philosophical Magazine 21:339–345.
Medeiros, S., F. S. Ramalho, W. P. Lemos, and J. C. Zanuncio. 2000.Age-dependent fecundity and life-fertility tables for Podisus ni-grispinus (Dallas) (Het., Pentatomidae). Journal of Applied En-tomology 124:319–324.
Medeiros, R. S., F. S. Ramalho, J. C. Zanuncio, and J. E. Serrao. 2003.Effect of temperature on life table parameters of Podisus nigrispinus(Het., Pentatomidae) fed with Alabama argillacea (lep., noctuidae)larvae. Journal of Applied Entomology 127:209–213.
Miller-Rushing, A., and R. Primack. 2008. Global warming and flow-ering times in Thoreau’s Concord: a community perspective. Ecol-ogy 89:332–341.
Morgan, D., K. F. A. Walters, and J. N. Aegerter. 2001. Effect oftemperature and cultivar on the pea aphid, Acyrthosiphon pisum(Hemiptera: Aphididae) life history. Bulletin of Entomological Re-search 91:47–52.
Nijhout, H. 1994. Insect hormones. Princeton University Press,Princeton, NJ.
Parmesan, C. 2006. Ecological and evolutionary responses to recentclimate change. Annual Review of Ecology, Evolution, and Sys-tematics 37:637–669.

Temperature Dependence of Fitness 191
Post, E., C. Pedersen, C. Wilmers, and M. C. Forchhammer. 2008.Warming, plant phenology and the spatial dimension of trophicmismatch for large herbivores. Proceedings of the Royal SocietyB: Biological Sciences 275:2005–2013.
Ratkowsky, D., J. Olley, and T. Ross. 2005. Unifying temperatureeffects on the growth rate of bacteria and the stability of globularproteins. Journal of Theoretical Biology 233:351–362.
Reznick, D. 1985. Costs of reproduction: an evaluation of the em-pirical evidence. Oikos 44:257–267.
Roff, D. 1992. The evolution of life histories: theory and analysis.Chapman & Hall, New York.
Root, T. L., J. T. Price, K. R. Hall, S. H. Schneider, C. Rosenzweig,and J. A. Pounds. 2003. Fingerprints of global warming on wildanimals and plants. Nature 421:57–60.
Savage, V. M., J. F. Gillooly, J. H. Brown, G. B. West, and E. L.Charnov. 2004. Effects of body size and temperature on populationgrowth. American Naturalist 163:429–441.
Schoolfield, R., J. Sharpe, and C. Magnuson. 1981. Non-linear re-gression of biological temperature-dependent rate models basedon absolute reaction-rate theory. Journal of Theoretical Biology88:719–731.
Sharpe, P., and D. DeMichele. 1977. Reaction kinetics of poikilothermdevelopment. Journal of Theoretical Biology 64:649–670.
Sinervo, B., M. Fausto, and D. Miles. 2010. Erosion of lizard diversityby climate change and altered thermal niches. Science 328:894–899.
Southwood, T. R. E. 1988. Tactics, strategies and templets. Oikos 52:3–18.
Stearns, S. 1992. The evolution of life histories. Oxford UniversityPress, Oxford.
Tewksbury, J. J., R. B. Huey, and C. Deutsch. 2008. Climate warmingputs the heat on tropical ectotherms. Science 320:1296–1297.
Trudgill, D., A. Honek, and N. van Straalen. 2005. Thermal time:concepts and utility. Annals of Applied Biology 146:1–14.
Van der Have, T. 2002. A proximate model for thermal tolerance inectotherms. Oikos 98:141–155.
Van der Have, T. M., and G. de Jong. 1996. Adult size in ectotherms:temperature effects on growth and differentiation. Journal of The-oretical Biology 183:329–340.
Walther, G. R., E. Post, P. Convery, A. Menzel, C. Parmesan, T. J. C.Beebee, J.-M. Fromentin, O. Hoegh-Guldberg, and F. Bairlein.2002. Ecological responses to recent climate change. Nature 416:389–395.
Associate Editor: Michael G. NeubertEditor: Ruth G. Shaw
Ophion macrurum Linn. Ichneumon parasite on the larva of Telea polyphemus. “When an Ichneumon detects the presence of a worm,she flies around it for a few seconds, and then rests upon the leaf near her victim; moving her antennae very rapidly above the body ofthe worm but not touching it and bending her abdomen under the breast, she seizes her ovipositor with the front legs, and waits for afavorable moment, when she quickly deposits a little oval white egg upon the skin of the larva.” From “The American Silk Worm” by L.Trouvelot (American Naturalist, 1867, 1:85–94).