The United Republic of Tanzania · Tanzania in Figures 2012 is the revised version from the...
81
The United Republic of Tanzania TANZANIA IN FIGURES 2012 National Bureau of Statistics Ministry of Finance June, 2013 Price: TShs. 5,000/=
Transcript of The United Republic of Tanzania · Tanzania in Figures 2012 is the revised version from the...

The United Republic of Tanzania
TANZANIA IN FIGURES 2012
National Bureau of Statistics
Ministry of Finance
June, 2013
Price: TShs. 5,000/=

H.E. HON. DR. JAKAYA MRISHO KIKWETE
President of the United Republic of Tanzania
“Slowly but surely poverty is being reduced and prosperity is on
increase. For nearly a decade, Africa has recorded sustained
average economic growth rate above six percent”.

Pag
e i
THE UNITED REPUBLIC OF TANZANIA, REGIONAL BOUNDARIES
Source: National Bureau of Statistics

Pag
e ii
PREFACE
Tanzania in Figures 2012 is the revised version from the previous booklets,
which provides important demographic and social-economic data as well
as numbers of statistical indicators on the United Republic of Tanzania.
This document contains data and information from various statistical
publications compiled by the National Bureau of Statistics (NBS), Sector
Ministries, Government Departments and Agencies (MDAs).
The booklet serves as a brief and comprehensive reference for such
statistical data.
Therefore views and feedback are welcome from data users in all sectors at
national level so as to enrich the next edition of Tanzania in Figures..
In recognizing the inputs used in the compilation of this booklet, the
National Bureau of Statistics would like to thank all organizations in the
Government, parastatal and private sector.
The National Bureau of Statistics thanks for your continued support and
cooperation for the compilation of the future editions of this and other
statistical publications.
This document can also be obtained from the NBS website;
www.nbs.go.tz. For more detailed information on the published data,
please visit the NBS library.
Abbreviations and symbols
“-” Data not available
“%” = a notation for percent
Rounding
Figures are rounded off independent of one another and therefore, details
may not add to total.

Pag
e ii
i
WH AT IS NEW
The 2012 Population and Housing Census
The 2012 Population and Housing Census (PHC) for the United Republic
of Tanzania was carried out on the 26th August, 2012. This was the fifth
Census after the Union of Tanganyika and Zanzibar in 1964.
The 2012 Population and Housing Census results show that, Tanzania has a
population of 44,928,923 of which 43,625,354 is on Tanzania Mainland
and 1,303,569 is in Tanzania Zanzibar.
The 2011-2012 Tanzania HIV/AIDS and Malaria Indicator Survey
(THMIS)
The 2011-12 Tanzania HIV/AIDS and Malaria Indicator Survey (THMIS)
was designed to provide up-to-date information on the prevalence of HIV
infection among Tanzanian adults and the prevalence of malaria and
anaemia among children under the age five. The 2011-12 THMIS is the
tenth national survey carried out as part of the Demographic and Health
Surveys project in Tanzania. It is the third comprehensive survey on
HIV/AIDS carried out in Tanzania.
A nationally representative sample of 10,967 women aged 15-49 and 8,352
men aged 15-49 were interviewed. The response rate for women was 96
percent and that for men was 89 percent.
Employment and Earnings Survey 2010-2011: Analytical Report
The Employment and Earnings Survey (EES) report is the only source of
regional information showing the distribution of income, new workers
recruited, current job vacancies and number of employees in the formal
sector of employment. Therefore, the need for this report arises from the
appreciation of information gap that persisted on employment and
Pag
e iv
earnings. However, due to lack of financial resources, this series was
discontinued for sixteen years before being resumed in 2001. This report is
the fourth since 2001 when the EES were re-started.
The findings show that a total of 1,362,559 persons were employed in the
formal sector in 2011 as compared to 1,276,982 persons in 2010. This was
an increase of 6.7 percent. The proportion of total employment was higher
in the private sector (63.1 percent in 2011 and 63.7 percent in 2010) than in
the public sector (36.9 percent in 2011 and 36.3 percent in 2010) for the
two years.
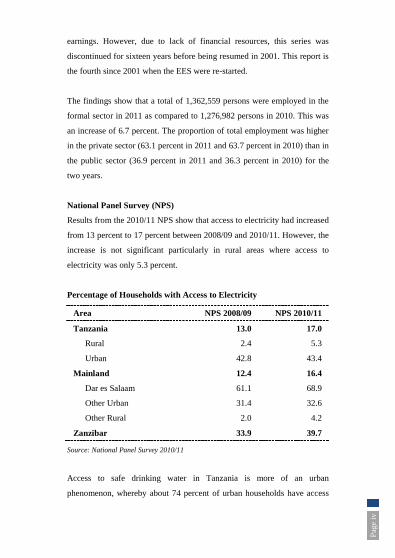
National Panel Survey (NPS)
Results from the 2010/11 NPS show that access to electricity had increased
from 13 percent to 17 percent between 2008/09 and 2010/11. However, the
increase is not significant particularly in rural areas where access to
electricity was only 5.3 percent.
Percentage of Households with Access to Electricity
Area NPS 2008/09 NPS 2010/11
Tanzania 13.0 17.0
Rural 2.4 5.3
Urban 42.8 43.4
Mainland 12.4 16.4
Dar es Salaam 61.1 68.9
Other Urban 31.4 32.6
Other Rural 2.0 4.2
Zanzibar 33.9 39.7
Source: National Panel Survey 2010/11
Access to safe drinking water in Tanzania is more of an urban
phenomenon, whereby about 74 percent of urban households have access

Pag
e v
to safe drinking water as compared to about 40 percent of their rural
counterparts.
Percentage of Households with Access to Safe Drinking Water
Area
Rainy Season Dry Season
NPS
2008/09
NPS
2010/11
NPS
2008/09
NPS
2010/11
Tanzania 43 43 44 50
Rural 33 32 33 40
Urban 73 66 73 74
Mainland 42 42 43 49
Dar es Salaam 78 75 81 78
Other Urban 67 62 67 71
Other Rural 32 30 32 38
Zanzibar 81 86 80 84
Source: National Panel Survey 2010/11

Pag
e vi
CONTENTS
Preface ................................................................................. ii What is new ........................................................................ iii Contents .............................................................................. vi Background Information ....................................................... 1 Politics .................................................................................. 2 Geography ............................................................................ 7 Millennium Development Goals ......................................... 16 Employment ........................................................................ 18 Household Budget Surveys ................................................. 21 Population ........................................................................... 23 HIV Prevalence ................................................................... 31 Prevalence of Malaria in Children ...................................... 34 National Accounts............................................................... 36 Foreign Trade ..................................................................... 44 Manufacturing..................................................................... 45 Agriculture .......................................................................... 46 Electricity ........................................................................... 53 Transport ............................................................................. 54 Information and Communication Technology (ICT) ........... 56 Public Finance .................................................................... 57 Health Facilities .................................................................. 58 Education ............................................................................ 59 Crimes and Road accidents as at December, 2011 and 2012
............................................................................................ 62 Tanzania Diplomatic Missions Abroad ............................... 63

Pag
e 1
BACKG ROU ND INFO RM A TI ON
Tanganyika became a Sovereign State on 9th
December, 1961 and a
Republic in 1962. Zanzibar became independent in December, 1963 and
the People’s Republic of Zanzibar was established after the Revolution of
12th
January, 1964. The two Sovereign States formed the United Republic
of Tanzania on 26th April, 1964.
The fourth multi-party elections held in October, 2010 brought in His
Excellency Dr. Jakaya Mrisho Kikwete from Chama Cha Mapinduzi
(CCM) as the fourth President of the United Republic of Tanzania for the
second term.
Dodoma is the capital city and Dar es Salaam is the major commercial
city. The official currency is Tanzanian Shilling and the national language
is Kiswahili whilst English is also used in communication.
Pag
e 2
POLITICS
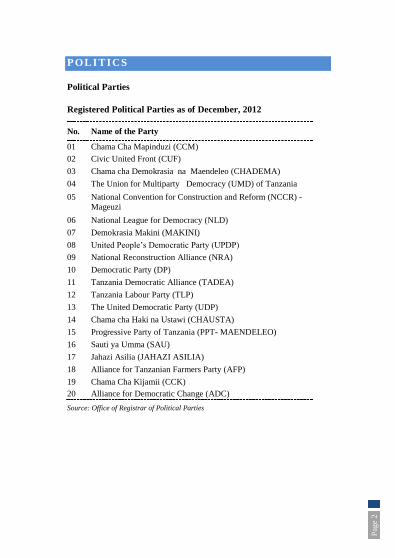
Political Parties
Registered Political Parties as of December, 2012
No. Name of the Party
01 Chama Cha Mapinduzi (CCM)
02 Civic United Front (CUF)
03 Chama cha Demokrasia na Maendeleo (CHADEMA)
04 The Union for Multiparty Democracy (UMD) of Tanzania
05
National Convention for Construction and Reform (NCCR) -
Mageuzi
06 National League for Democracy (NLD)
07 Demokrasia Makini (MAKINI)
08 United People’s Democratic Party (UPDP)
09 National Reconstruction Alliance (NRA)
10 Democratic Party (DP)
11 Tanzania Democratic Alliance (TADEA)
12 Tanzania Labour Party (TLP)
13 The United Democratic Party (UDP)
14 Chama cha Haki na Ustawi (CHAUSTA)
15 Progressive Party of Tanzania (PPT- MAENDELEO)
16 Sauti ya Umma (SAU)
17 Jahazi Asilia (JAHAZI ASILIA)
18 Alliance for Tanzanian Farmers Party (AFP)
19 Chama Cha Kijamii (CCK)
20 Alliance for Democratic Change (ADC)
Source: Office of Registrar of Political Parties

Pag
e 3
The 2010 General Election Results
Presidential: United Republic of Tanzania
No. Name of the Candidate Name of the Party Number
of Votes
Percentage of
valid Votes
1 Jakaya Mrisho Kikwete CCM 5,276,827 62.8
2 Wilbrod Peter Slaa CHADEMA 2,271,491 27.0
3 Ibrahimu Haruna Lipumba CUF 695,667 8.3
4 Peter Mziray Kuga PPT– Maendeleo 96,932 1.2
5 Mutamwegwa Mgaywa TLP 17,482 0.2
6 Dovutwa Y. N Dovutwa UPDP 13,176 0.2
7 Hashim Spunda Rungwe NCCR-Mageuzi 26,388 0.3
Total 8,397,963 100.0
Source: National Electoral Commission (NEC)
Presidential: Tanzania Zanzibar
No. Name of the candidate Name of the
Party
Number
of Votes
Percentage of
valid Votes
1 Ali Mohamed Shein CCM 179,809 50.2
2 Seif Sharif Hamad CUF 176,338 49.2
3 Kassim Bakari Ali JAHAZI ASILIA 803 0.2
4 Haji Khamis Haji NRA 525 0.1
5 Said Soud Said AFP 480 0.1
6 Ambar Haji Khamis NCCR - Mageuzi 363 0.1
Total 358,318 100.0
Source: Zanzibar Electoral Commission (ZEC)

Pag
e 4
Parliamentary Members: United Republic of Tanzania
Nominated by: Number of
Seats Nominated
Female
Seats
Male
Seats
President 10 7 3 4
House of Representatives 5 5 2 3
Total 15 12 5 7
Source: Parliament of Tanzania Office.
Distribution of Members of Parliament by Parties/Ex-Officio,
2011
No. Parties Total
1 CCM 258
2 CHADEMA 48
3 CUF 36
4 NCCR – MAGEUZI 4
5 TLP 1
6 UDP 1
7 Attorney General 1
Total 349
Source: Parliament of Tanzania Office.
Members of the House of Representatives, 2011
Type of Member CCM CUF
Total Male Female Male Female
Elected 25 3 22 0 50
Reserved for Women - 11 - 9 20
Nominated by President 5 2 1 1 9
Attorney General 1 0 0 0 1
Total 31 16 23 10 80
Source: House of Representative office

Pag
e 5
Tanzania Zanzibar Councilors as at December 2011
Party Number of
Elected
Number of
Nominated
Appointed by
Ministers
Total
Male Female Male Female Male Female
CCM 13 5 0 5 2 1 26
CUF 2 0 0 1 0 0 3
Total 15 5 0 6 2 1 29
Source: Zanzibar Municipal Council
Number of Councilors’ Seats each Party Won on 2010 Elections
in Tanzania Mainland
No. Name of the Party No. of Seats
01 CCM 2,803
02 CHADEMA 326
03 CHAUSTA 0
04 CUF 126
05 DP 1
06 FORD 0
07 JAHAZI ASILIA 0
08 MAKINI 0
09 NCCR – MAGEUZI 28
10 NLD 0
11 NRA 0
12 PPT – MAENDELEO 3
13 SAU 0
14 TADEA 0
15 TLP 20
16 UDP 28
17 UMD 0
18 UPDP 0
Total 3,335
Source: National Electoral Commission (NEC)
Pag
e 6
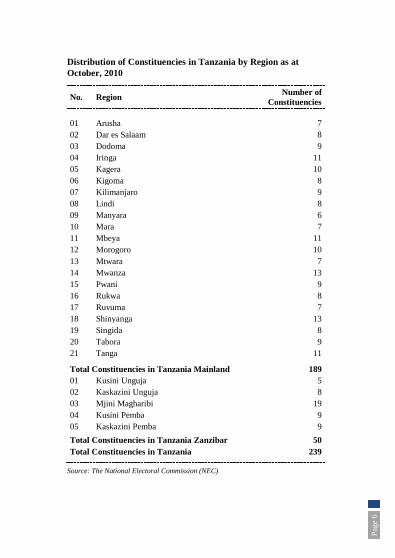
Distribution of Constituencies in Tanzania by Region as at
October, 2010
No. Region Number of
Constituencies
01 Arusha 7
02 Dar es Salaam 8
03 Dodoma 9
04 Iringa 11
05 Kagera 10
06 Kigoma 8
07 Kilimanjaro 9
08 Lindi 8
09 Manyara 6
10 Mara 7
11 Mbeya 11
12 Morogoro 10
13 Mtwara 7
14 Mwanza 13
15 Pwani 9
16 Rukwa 8
17 Ruvuma 7
18 Shinyanga 13
19 Singida 8
20 Tabora 9
21 Tanga 11
Total Constituencies in Tanzania Mainland 189
01 Kusini Unguja 5
02 Kaskazini Unguja 8
03 Mjini Magharibi 19
04 Kusini Pemba 9
05 Kaskazini Pemba 9
Total Constituencies in Tanzania Zanzibar 50
Total Constituencies in Tanzania 239
Source: The National Electoral Commission (NEC)

Pag
e 7
GEOGRAP HY
Geographical Location, Boundaries and Area
Location
Tanzania is located in Eastern Africa between Longitude 290
and 410
East
and Latitude 10
and 120 South.
Most Northerly point: Mutukula 10 01'S & 31
0 25' E
Most Southerly point: Mtalika 110
32'S & 370 05' E
Most Westerly point: Kigoma 40
52'S & 290 38' E
Most Easterly point: Msimbati 100
21'S & 400 26' E
Tanzania Mainland has frontiers to the following countries:
North: Kenya and Uganda;
West: Rwanda, Burundi and Democratic Republic of Congo;
South West: Zambia and Malawi;
South: Mozambique;
East: Indian Ocean.
Tanzania Zanzibar
The Islands of Zanzibar are situated some 30 kilometers from Tanzania
Mainland in the Indian Ocean.
Total Area
Land: (“000” sq. km)
Tanzania Mainland ............................................. 883.6
Tanzania Zanzibar ............................................. 2.5
Major Islands: Tanzania Mainland (sq. km)
Ukerewe ........................................................... 647
Mafia ................................................................ 518
Major Islands: Tanzania Zanzibar (sq. km)
Unguja .............................................................. 1,666
Pemba............................................................... 988

Pag
e 8
Water Bodies and Planted Areas
(“000” sq. km)
Water Bodies:
Tanzania Mainland 61.5
Major Lakes:
Victoria 34.9
Tanganyika 13.4
Nyasa 5.6
Rukwa 2.8
Eyasi 1.0
Other water bodies on land mass (small lakes,
dams, rivers, etc.) 3.8
Total 123.0
Total Planted Area, 2007/08
Tanzania Mainland Million Hectares
Short Rainy Season (Vuli) 1.8
Long Rainy Season (Masika) 7.0
Tanzania Zanzibar Thousand Hectares
Short Rainy Season (Vuli) 14.8
Long Rainy Season (Masika) 37.7
Pag
e 9
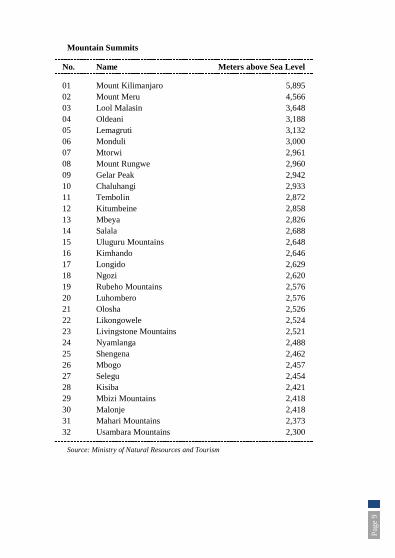
Mountain Summits
No. Name Meters above Sea Level
01 Mount Kilimanjaro 5,895
02 Mount Meru 4,566
03 Lool Malasin 3,648
04 Oldeani 3,188
05 Lemagruti 3,132
06 Monduli 3,000
07 Mtorwi 2,961
08 Mount Rungwe 2,960
09 Gelar Peak 2,942
10 Chaluhangi 2,933
11 Tembolin 2,872
12 Kitumbeine 2,858
13 Mbeya 2,826
14 Salala 2,688
15 Uluguru Mountains 2,648
16 Kimhando 2,646
17 Longido 2,629
18 Ngozi 2,620
19 Rubeho Mountains 2,576
20 Luhombero 2,576
21 Olosha 2,526
22 Likongowele 2,524
23 Livingstone Mountains 2,521
24 Nyamlanga 2,488
25 Shengena 2,462
26 Mbogo 2,457
27 Selegu 2,454
28 Kisiba 2,421
29 Mbizi Mountains 2,418
30 Malonje 2,418
31 Mahari Mountains 2,373
32 Usambara Mountains 2,300
Source: Ministry of Natural Resources and Tourism
Pag
e 10
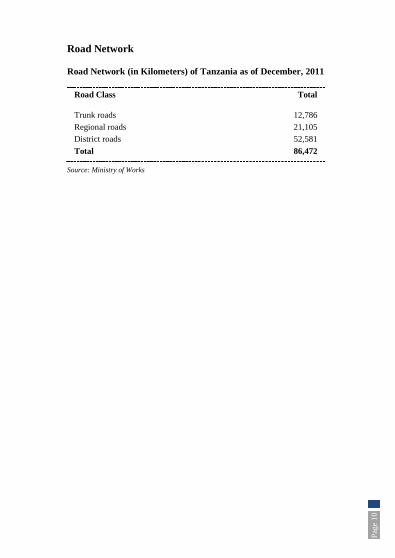
Road Network
Road Network (in Kilometers) of Tanzania as of December, 2011
Road Class Total
Trunk roads 12,786
Regional roads 21,105
District roads 52,581
Total 86,472
Source: Ministry of Works

Pag
e 11
NO
TE
:
RO
UT
EV
IA
RO
UT
EV
IA
RO
UT
EV
IA
Dar -
Kig
om
aIt
igi - T
ab
ora
Buko
ba -
Mb
eya
Nzeg
a -
Tab
ora
Kig
om
a -
Njo
mb
eM
pand
a -
Sum
baw
ang
a -
Mb
eya
Dar -
Muso
ma
Sin
gid
a -
Shin
yang
a -
Mw
anza
Buko
ba -
Njo
mb
eS
ing
ida -
Do
do
ma -
Irin
ga
Kig
om
a -
Tab
ora
Mala
garasi
Arusha -
Irin
ga
Bab
ati - D
od
om
aD
od
om
a -
Mb
eya
Mtera -
Irin
ga
Lin
di - M
beya
Masasi - S
ong
ea -
Njo
mb
e
Arusha -
Kig
om
aS
ing
ida -
Nzeg
a -
Tab
ora
Do
do
ma -
Kig
om
aIt
igi - T
ab
ora
Mb
eya -
Mtw
ara
Njo
mb
e -
So
ng
ea -
Masasi
Arusha -
Mb
eya
Bab
ati - D
od
om
a -
Irin
ga
Geit
a -
Mp
and
aN
yakanazi - K
asulu
Mb
eya -
Sin
gid
a
Rung
wa -
Itig
i
Arusha -
Muso
ma
Sereng
eti
Geit
a -
Njo
mb
eS
ing
ida -
Do
do
ma -
Irin
ga
Muso
ma -
S'w
ang
a
Tab
ora -
Ip
ole
- M
pand
a
Arusha -
Mw
anza
Bab
ati - S
ing
ida -
Shin
yang
aIr
ing
a -
Kig
om
aD
od
om
a -
Itig
i - T
ab
ora
Muso
ma -
Tang
a
Sereng
eti - A
rusha
Bab
ati - Irin
ga
Do
do
ma
Irin
ga -
Tab
ora
Do
do
ma -
Itig
iM
wanza -
Tang
a
Shin
yang
a -
Sin
gid
a -
Arusha
Bab
ati - M
oro
go
ro
Do
do
ma
Kig
om
a -
Mb
eya
Mp
and
a -
Sum
baw
ang
aS
ing
ida -
S'w
ang
a
Rung
wa -
Mb
eya
Bab
ati - M
uso
ma
Makuyuni - S
ereng
eti
Kig
om
a -
Muso
ma
Nyakanazi - G
eit
a -
Mw
anza
Sin
gid
a -
Tab
ora
Nzeg
a
Pag
e 12
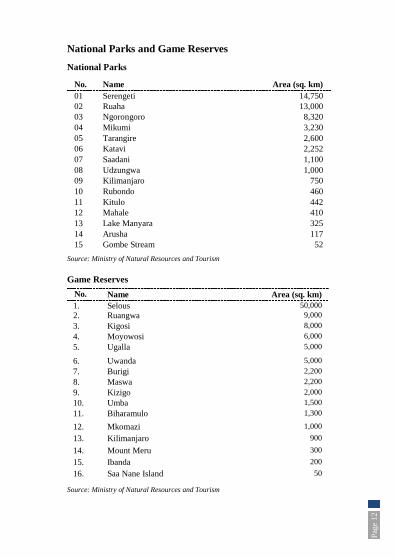
National Parks and Game Reserves National Parks
No. Name Area (sq. km)
01 Serengeti 14,750
02 Ruaha 13,000
03 Ngorongoro 8,320
04 Mikumi 3,230
05 Tarangire 2,600
06 Katavi 2,252
07 Saadani 1,100
08 Udzungwa 1,000
09 Kilimanjaro 750
10 Rubondo 460
11 Kitulo 442
12 Mahale 410
13 Lake Manyara 325
14 Arusha 117
15 Gombe Stream 52
Source: Ministry of Natural Resources and Tourism
Game Reserves
No. Name Area (sq. km)
1. Selous 50,000
2. Ruangwa 9,000
3. Kigosi 8,000
4. Moyowosi 6,000
5. Ugalla 5,000
6. Uwanda 5,000
7. Burigi 2,200
8. Maswa 2,200
9. Kizigo 2,000
10. Umba 1,500
11. Biharamulo 1,300
12. Mkomazi 1,000
13. Kilimanjaro 900
14. Mount Meru 300
15. Ibanda
200
16. Saa Nane Island 50
Source: Ministry of Natural Resources and Tourism
Pag
e 13
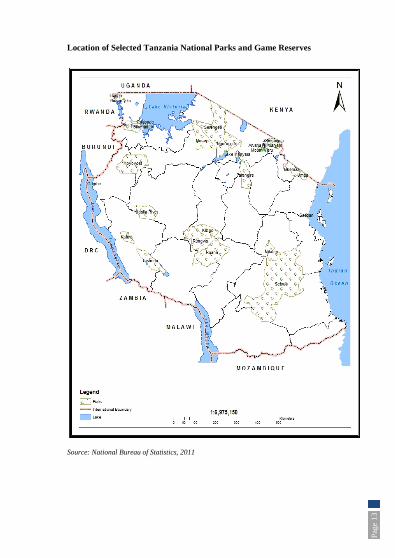
Location of Selected Tanzania National Parks and Game Reserves
Source: National Bureau of Statistics, 2011
Pag
e 14
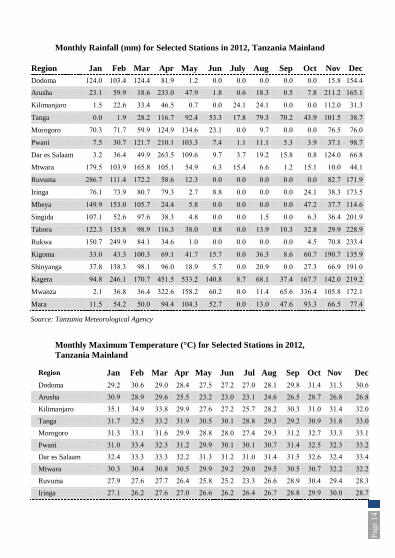
Monthly Rainfall (mm) for Selected Stations in 2012, Tanzania Mainland
Region Jan Feb Mar Apr May Jun July Aug Sep Oct Nov Dec
Dodoma 124.0 103.4 124.4 81.9 1.2 0.0 0.0 0.0 0.0 0.0 15.8 154.4
Arusha 23.1 59.9 18.6 233.0 47.9 1.8 0.6 18.3 0.5 7.8 211.2 165.1
Kilimanjaro 1.5 22.6 33.4 46.5 0.7 0.0 24.1 24.1 0.0 0.0 112.0 31.3
Tanga 0.0 1.9 28.2 116.7 92.4 53.3 17.8 79.3 70.2 43.9 101.5 38.7
Morogoro 70.3 71.7 59.9 124.9 134.6 23.1 0.0 9.7 0.0 0.0 76.5 76.0
Pwani 7.5 30.7 121.7 210.1 103.3 7.4 1.1 11.1 5.3 3.9 37.1 98.7
Dar es Salaam 3.2 36.4 49.9 263.5 109.6 9.7 3.7 19.2 15.8 0.8 124.0 66.8
Mtwara 179.5 103.9 165.8 105.1 54.9 6.3 15.4 6.6 1.2 15.1 10.0 44.1
Ruvuma 286.7 111.4 172.2 58.6 12.3 0.0 0.0 0.0 0.0 0.0 82.7 171.9
Iringa 76.1 73.9 80.7 79.3 2.7 8.8 0.0 0.0 0.0 24.1 38.3 173.5
Mbeya 149.9 153.0 105.7 24.4 5.8 0.0 0.0 0.0 0.0 47.2 37.7 114.6
Singida 107.1 52.6 97.6 38.3 4.8 0.0 0.0 1.5 0.0 6.3 36.4 201.9
Tabora 122.3 135.8 98.9 116.3 38.0 0.8 0.0 13.9 10.3 32.8 29.9 228.9
Rukwa 150.7 249.9 84.1 34.6 1.0 0.0 0.0 0.0 0.0 4.5 70.8 233.4
Kigoma 33.0 43.3 100.3 69.1 41.7 15.7 0.0 36.3 8.6 60.7 190.7 135.9
Shinyanga 37.8 138.3 98.1 96.0 18.9 5.7 0.0 20.9 0.0 27.3 66.9 191.0
Kagera 94.8 246.1 170.7 451.5 533.2 140.8 8.7 68.1 37.4 167.7 142.0 219.2
Mwanza 2.1 36.8 36.4 322.6 158.2 60.2 0.0 11.4 65.6 336.4 105.8 172.1
Mara 11.5 54.2 50.0 94.4 104.3 52.7 0.0 13.0 47.6 93.3 66.5 77.4
Source: Tanzania Meteorological Agency
Monthly Maximum Temperature (°C) for Selected Stations in 2012,
Tanzania Mainland
Region Jan Feb Mar Apr May Jun Jul Aug Sep Oct Nov Dec
Dodoma 29.2 30.6 29.0 28.4 27.5 27.2 27.0 28.1 29.8 31.4 31.3 30.6
Arusha 30.9 28.9 29.6 25.5 23.2 23.0 23.1 24.6 26.5 28.7 26.8 26.8
Kilimanjaro 35.1 34.9 33.8 29.9 27.6 27.2 25.7 28.2 30.3 31.0 31.4 32.0
Tanga 31.7 32.5 33.2 31.9 30.5 30.1 28.8 29.3 29.2 30.9 31.8 33.0
Morogoro 31.3 33.1 31.6 29.9 28.8 28.0 27.4 29.3 31.2 32.7 33.3 33.1
Pwani 31.0 33.4 32.3 31.2 29.9 30.1 30.1 30.7 31.4 32.5 32.3 33.2
Dar es Salaam 32.4 33.3 33.3 32.2 31.3 31.2 31.0 31.4 31.5 32.6 32.4 33.4
Mtwara 30.3 30.4 30.8 30.5 29.9 29.2 29.0 29.5 30.5 30.7 32.2 32.2
Ruvuma 27.9 27.6 27.7 26.4 25.8 25.2 23.3 26.6 28.9 30.4 29.4 28.3
Iringa 27.1 26.2 27.6 27.0 26.6 26.2 26.4 26.7 28.8 29.9 30.0 28.7

Pag
e 15
Region Jan Feb Mar Apr May Jun Jul Aug Sep Oct Nov Dec
Mbeya 24.4 25.4 24.7 23.6 23.6 23.2 23.2 25.3 27.0 28.2 26.7 26.1
Singida 27.4 28.4 27.4 26.2 26.1 26.0 26.1 27.0 28.4 30.0 29.2 27.6
Tabora 29.0 29.7 29.2 29.0 29.6 29.3 29.0 31.0 32.5 33.2 31.6 29.4
Rukwa 22.9 24.4 24.9 24.8 25.3 23.4 23.4 26.1 27.4 27.8 24.8 23.6
Kigoma 29.2 28.9 30.3 29.6 28.6 30.0 28.5 30.4 30.6 30.6 27.6 27.4
Shinyanga 30.7 31.4 30.0 29.0 29.9 29.9 29.7 31.1 32.6 33.2 32.1 29.3
Kagera 27.4 27.6 27.2 24.9 25.8 25.7 25.4 26.2 25.3 26.5 25.6 26.4
Mwanza 28.6 29.4 28.3 27.8 28.6 28.2 28.3 28.6 28.5 28.3 27.5 26.9
Mara 29.0 30.0 28.5 28.3 28.0 27.9 27.8 28.8 28.3 29.7 28.7 27.8
Source: Tanzania Meteorological Agency
Monthly Minimum Temperature (°C) for Selected Stations in 2012, Tanzania
Mainland
Region Jan Feb Mar Apr May Jun Jul Aug Sep Oct Nov Dec
Dodoma 19.2 19.3 18.8 18.2 16.5 14.1 14.5 15.6 16.3 17.9 19.7 19.7
Arusha 14.4 14.0 16.1 17.0 16.0 14.9 13.4 13.0 13.7 15.4 15.5 16.3
Kilimanjaro 18.4 19.1 19.9 20.0 18.3 17.5 14.4 15.5 15.9 16.9 19.3 19.5
Tanga 24.2 24.3 24.4 23.8 23.2 22.0 20.1 21.3 21.7 22.7 23.9 24.6
Morogoro 21.5 21.5 21.3 17.4 19.3 17.0 15.8 19.9 17.6 19.1 20.6 21.5
Pwani 22.9 22.7 22.5 22.2 21.9 20.3 18.5 18.6 19.3 20.4 21.9 22.7
Dar es Salaam 25.4 24.7 27.0 22.8 21.2 19.1 18.0 18.1 18.5 21.4 23.1 22.9
Mtwara 23.2 23.1 23.7 22.3 20.8 19.1 18.5 18.3 18.5 19.4 22.2 22.8
Ruvuma 18.4 18.3 17.5 15.4 13.3 18.2 11.1 12.4 14.6 16.3 18.2 17.5
Iringa 16.6 16.7 16.2 16.3 15.8 13.9 13.1 13.7 14.1 15.5 16.2 16.4
Mbeya 14.7 13.5 15.1 12.5 12.3 7.1 5.7 8.8 12.3 15.4 17.5 17.6
Singida 16.9 16.9 16.9 16.6 15.7 14.5 13.6 14.2 15.1 17.1 17.9 17.5
Tabora 18.2 18.4 17.8 18.0 16.9 15.5 13.9 16.5 18.8 20.0 19.5 18.9
Rukwa 14.1 13.2 13.3 13.5 12.3 8.6 7.6 8.9 11.9 12.1 14.1 14.4
Kigoma 20.1 19.5 20.0 19.8 19.0 17.8 16.8 18.0 19.6 20.6 20.1 19.8
Shinyanga 19.1 19.5 19.3 19.1 18.7 17.7 14.9 17.9 19.9 21.3 20.3 19.7
Kagera 17.5 17.6 18.1 17.9 18.1 16.3 15.5 17.9 16.7 18.4 15.1 16.4
Mwanza 18.1 17.8 19.1 18.9 19.0 16.2 16.2 16.8 18.3 18.3 18.4 18.8
Mara 17.5 18.3 14.8 18.3 18.0 17.4 16.4 17.6 18.0 19.8 18.4 18.3
Source: Tanzania Meteorological Agency

Pag
e 16
MILLENNI UM DE VELOPM E NT GOALS
Millennium Development Goals Indicators
Goal Indicator Value
1. Eradicate extreme poverty and hunger
Prevalence of underweight children under age 5 Male: 1.3 Total: 15.8 Female: 14.3
2. Achieve universal
primary education
Net attendance ratio in primary education1 Male: 74.7 Total: 77.4
Female: 80.1
Literacy rate of 15 – 24 year olds1a
Male: 83.0
Female: 76.9
3. Promote gender
equality and
empower women
Ratio of girls to boys in primary education2 1.1
Ratio of girls to boys in secondary education2 0.9
Ratio of girls to boys in tertiary education2 1.5
Ratio of literate women to literate men, 15 – 24 years old
0.93
4. Reduce child
mortality
Under-5 mortality rate (per 1,000 live births)3 81 per 1,000
Infant mortality rate (per 1,000 live births)3 51 per 1,000
Proportional of 1-year-old children immunized against measles
Male: 86.4 Total: 84.5 Female: 82.7
5. Improve maternal
health
Maternal mortality ratio (per 100,000 live
births)4
454 per 100,000
Percentage of births attended by skilled health
personnel5
42.6
Adolescent birth rate
5a Female: 67.1
Antenatal care coverage: At least one visit with a
skilled provider
Female: 96.5
6. Combat HIV/AIDS,
malaria and other diseases
HIV prevalence among the population age 15-24 Male: 1.2 Total: 2.0
Female: 2.7
Percentage of current users of contraception who
are using condoms (currently married women age 15-49)
7.1
Condom use at last high-risk sex6 Male: 56.8 Total: 55.7
a
Female: 54.6
Percentage of population age 15-24 with
comprehensive correct knowledge of HIV/AIDS7
Male: 46.7 Total: 43.4a
Female: 40.1
Contraceptive prevalence rate (any modern
method, currently married women age 15-49)
26.9
Ratio of school attendance of orphans to school attendance of non-orphans age 10-14 years
Male: 0.96 Total: 0.95 Female: 0.95
Percentage of children under age 5 sleeping
under insecticide-treated bednets
Male: 71.9 Total: 72.0
Female: 72.1
Percentage of children under age 5 with fever
who are treated with appropriate
antimalarial drugs8a
Male: 56.2 Total: 53.7
Female: 51.1

Pag
e 17
Goal Indicator Value
Proportion of population in malaria-risk areas
using effective malaria prevention and treatment
measures8
71.8
Prevention:9 16.0
Treatment:10
58.2
Prompt treatment:10
51.0
7. Ensure environmental
sustainability
Proportion of population using solid fuels11
Urban: 89.1 Total: 97.2
Rural: 99.6
Percentage of population using an improved
water source12
Urban: 88.5 Total: 55.3
Rural: 46.2
Percentage of population using an improved sanitation facility
13
Urban: 34.2 Total: 13.9 Rural: 8.3
a The total is calculated as the simple arithmetic mean of the percentages in the columns for males and females.
1The ratio is based on reported attendance, not enrollment, in primary education among primary school age children
(age 7-13). The rate also includes children of primary school age enrolled in secondary education. This is a proxy for
MDG indicator 2.1, Net enrollment ratio.
1aRefer to respondents who attended secondary school or higher and who can read a whole sentence.
2Based on reported net attendance, not gross enrollment, among students age 7-13 for primary, age 14-19 for
secondary, and age 2024 for tertiary education 3For five-year period before the survey.
4For 10-year period before the survey.
5Among births in the five years preceding the survey.
5aEquivalent to the age-specific fertility rate for women age 15-19 for the three-year period preceding the survey,
expressed in terms of births per 1,000 women age 15-19 6 Higher-risk sex refers to sexual intercourse with a non-marital, non-cohabiting partner. Expressed as a percentage of
men and women age 15-24 who had higher-risk sex in the past 12 months.
7 Comprehensive knowledge means knowing that consistent use of a condom during sexual intercourse and having just
one uninfected faithful partner can reduce the chance of getting the AIDS virus, knowing that a healthy-looking person
can have the AIDS virus, and rejecting the two most common local misconceptions about transmission or prevention of
HIV/AIDS.
8a Measured as the percentage of children age 0-59 months who were ill with a fever in the two weeks preceding the
interview and received any antimalarial drug
8The proportion of the population that own an insecticide-treated net (ITN)
9Prevention of malaria is measured as the percentage of children age 0-59 months that slept under an insecticide-treated
bed-net the night before the interview. 10
Treatment of malaria is measured as the percentage of children age 0-59 months that was ill with a fever in the two
weeks preceding the interview and that receive an antimalarial drug. The treatment is considered prompt if the child received the antimalarial drug on the same day as the onset of fever or the following day. 11
Charcoal, firewood, straw, dung or crop waste. 12
Percentage of de jure population whose main source of drinking water is a household connection (piped), public tap or
standpipe, tubewell or borehole, protected dug well, protected spring, rainwater collection, or bottled water
13Percentage of de jure population whose household has a flush toilet, ventilated improved pit latrine, pit latrine with a
slab, or composting toilet and does not share this facility with other households
Source: 2010 DHS and 2011/12 THMIS
Pag
e 18
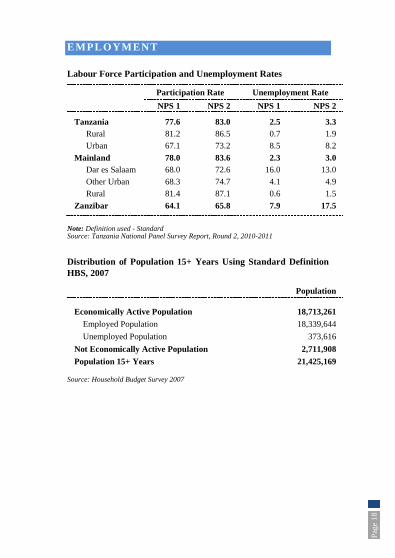
EMPLOYMENT
Labour Force Participation and Unemployment Rates
Participation Rate Unemployment Rate
NPS 1 NPS 2 NPS 1 NPS 2
Tanzania 77.6 83.0 2.5 3.3
Rural 81.2 86.5 0.7 1.9
Urban 67.1 73.2 8.5 8.2
Mainland 78.0 83.6 2.3 3.0
Dar es Salaam 68.0 72.6 16.0 13.0
Other Urban 68.3 74.7 4.1 4.9
Rural 81.4 87.1 0.6 1.5
Zanzibar 64.1 65.8 7.9 17.5
Note: Definition used - Standard Source: Tanzania National Panel Survey Report, Round 2, 2010-2011
Distribution of Population 15+ Years Using Standard Definition
HBS, 2007
Population
Economically Active Population 18,713,261
Employed Population 18,339,644
Unemployed Population 373,616
Not Economically Active Population 2,711,908
Population 15+ Years 21,425,169
Source: Household Budget Survey 2007

Pag
e 19
Employment Created by TASAF Projects: Tanzania 2011/12
S/No. Sector Male Female Total
1 HIV/AIDS Education 12 52 64
2 Services for Disadvantaged 55 89 144
3 Health 70 59 129
4 Agriculture 315 434 749
5 Hotels and Restaurants 7 26 33
6 Iron Smith 37 38 75
7 Livestock 3,092 3,357 6,449
8 Construction of Roads 7,412 6,111 13,523
9 Construction of Water Infrastructure 4,354 3,765 8,119
10 Construction of Markets and
Warehouses 755 677 1,432
11 Transportation 1 9 10
12 Carpentry 93 73 166
13 Tailoring 236 228 464
14 Grain Milling 243 287 530
15 Forest Development 1,486 1,112 2,598
16 Manufacture of Bricks 5 5 10
17 Manufacture of Shoes 12 9 21
Total 18,185 16,331 34,516
Source: Ministry for Labour and Employment
Employment Created by Ministry of Works and TANROAD:
Tanzania 2011/2012
S/No. Sector Total
1 Construction (Building) 17,685
2 Construction (Roads) 42,107
Total 59,792
Source: Ministry for Labour and Employment

Pag
e 20
Employment Created through Investment Programmes by
Tanzania Investment Centre (TIC): Tanzania 2011/2012
S/No. Sector Total
1 Construction 20,271
2 Production 19,982
3 Transport and Transportation 15,786
4 Agriculture 10,968
5 Tourism 9,505
6 Administration 2,239
7 Social Services 962
8 Finance 843
9 Communication 549
10 Energy 526
11 Broadcasting 390
12 Fuel and Mineral 382
13 Natural Resources 313
14 Information and Communication Technology (ICT) 68
15 Real Estate Activities with Own or Leased Property 50
Total 82,834
Source: Ministry for Labour and Employment
Employment Created through Export Processing Zone Authority
(EPZA): Tanzania 2011/2012
S/No. Sector Male Female Total
1 Mineral 897 237 1,134
2 Engineering 1,561 505 2,066
3 Typing 261 60 321
4 Grain Milling 2,063 1,191 3,254
5 Manufacture of Clothing 3,955 4,370 8,325
Total 8,737 6,363 15,100
Source: Ministry for Labour and Employment

Pag
e 21
HOUSEHOL D BU DGET SU R VEY S
Key Indicators from the Household Budget Surveys
Indicators 1991/9
2
2000/0
1 2007
Housing, Water and Sanitation, Communication (%)
Households with modern roofs 36.0 43.0 55.0
Households with modern walls 16.0 25.0 35.0
Households with electricity 9.0 12.0 13.0
Households with protected water sources 46.0 55.0 52.0
Household within 1 Km of drinking water 50.0 55.0 57.0
Households using toilets 93.0 93.0 93.0
Household owning radios 37.0 52.0 66.0
Households owning telephones 1.0 1.0 25.0
Education and Health (%)
Adults men with any education 83.0 83.0 83.0
Adults women with any education 68.0 67.0 71.0
Literate adults - 71.0 73.0
Primary school net attendance ratio - 59.0 84.0
Children aged 7-13 years studying 57.0 61.0 86.0
Secondary net enrolment ratio (forms I-IV) - 5.0 15.0
Households within 6 km of primary health
facility 75.0 75.0 76.0
Source: Household Budget Surveys 1991/92, 2000/01 and 2007

Pag
e 22
Poverty Status
Percentage of Population below Poverty Line Category and
Female Headed Households by Year and Area, Tanzania
Mainland
Year Region
% of
Population
below Food
Poverty line
% of Population
below Basic
needs Poverty
line
% of
Female
Headed
Households
1991/92
Dar es Salaam 13.6 28.1 14.1
Other Urban 15.0 28.7 23.9
Rural 23.1 40.8 16.7
Total 21.6 38.6 17.6
2000/01
Dar es Salaam 7.5 17.6 20.9
Other Urban 13.2 25.8 27.9
Rural 20.4 38.7 22.1
Total 18.7 35.7 22.9
2007
Dar es Salaam 7.4 16.4 24.4
Other Urban 12.9 24.1 30.1
Rural 18.4 37.6 23.0
Total 16.6 33.6 24.5
Source: Household Budget Surveys 1991/92, 2000/01 and 2007
Distribution of Poverty by Number of Employees, Tanzania
Mainland
1991/92 2000/01 2007
Number of
Employees
Headcount
ratio
% of the
poor
Headcount
ratio
% of the
poor
Headcount
ratio
% of the
poor
None 42.5 82.4 40.3 80.5 41.0 75.1
1 23.5 10.2 23.8 12.9 20.9 14.2
2 33.1 5.2 26.2 4.8 21.9 6.9
3 39.0 1.6 24.9 1.0 19.7 1.8
4 or more 31.2 0.6 23.4 0.7 31.3 2.0
Total 38.6 100.0 35.7 100.0 33.6 100.0
Source: Household Budget Surveys 1991/92, 2000/01 and 2007
Pag
e 23
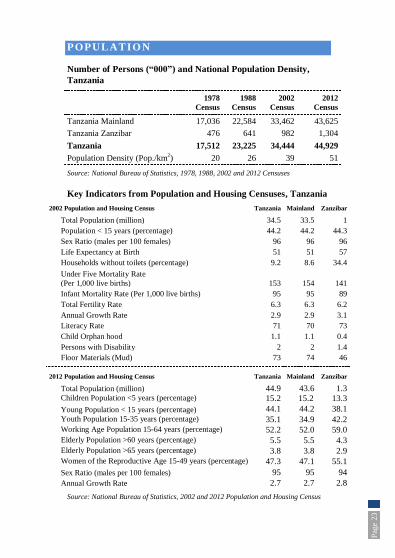
POPULATIO N
Number of Persons (“000”) and National Population Density,
Tanzania
1978
Census
1988
Census
2002
Census
2012
Census
Tanzania Mainland 17,036 22,584 33,462 43,625
Tanzania Zanzibar 476 641 982 1,304
Tanzania 17,512 23,225 34,444 44,929
Population Density (Pop./km2) 20 26 39 51
Source: National Bureau of Statistics, 1978, 1988, 2002 and 2012 Censuses
Key Indicators from Population and Housing Censuses, Tanzania
2002 Population and Housing Census Tanzania Mainland Zanzibar
Total Population (million) 34.5 33.5 1
Population < 15 years (percentage) 44.2 44.2 44.3
Sex Ratio (males per 100 females) 96 96 96
Life Expectancy at Birth 51 51 57
Households without toilets (percentage) 9.2 8.6 34.4
Under Five Mortality Rate
(Per 1,000 live births) 153 154 141
Infant Mortality Rate (Per 1,000 live births) 95 95 89
Total Fertility Rate 6.3 6.3 6.2
Annual Growth Rate 2.9 2.9 3.1
Literacy Rate 71 70 73
Child Orphan hood 1.1 1.1 0.4
Persons with Disability 2 2 1.4
Floor Materials (Mud) 73 74 46
2012 Population and Housing Census Tanzania Mainland Zanzibar
Total Population (million) 44.9 43.6 1.3 Children Population <5 years (percentage) 15.2 15.2 13.3
Young Population < 15 years (percentage) 44.1 44.2 38.1
Youth Population 15-35 years (percentage) 35.1 34.9 42.2 Working Age Population 15-64 years (percentage) 52.2 52.0 59.0
Elderly Population >60 years (percentage) 5.5 5.5 4.3
Elderly Population >65 years (percentage) 3.8 3.8 2.9
Women of the Reproductive Age 15-49 years (percentage) 47.3 47.1 55.1
Sex Ratio (males per 100 females) 95 95 94
Annual Growth Rate 2.7 2.7 2.8
Source: National Bureau of Statistics, 2002 and 2012 Population and Housing Census
Pag
e 24
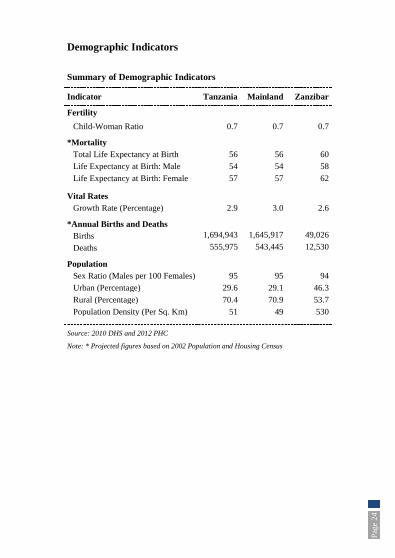
Demographic Indicators
Summary of Demographic Indicators
Indicator Tanzania Mainland Zanzibar
Fertility
Child-Woman Ratio 0.7 0.7 0.7
*Mortality Total Life Expectancy at Birth 56 56 60
Life Expectancy at Birth: Male 54 54 58
Life Expectancy at Birth: Female 57 57 62
Vital Rates Growth Rate (Percentage) 2.9 3.0 2.6
*Annual Births and Deaths Births 1,694,943 1,645,917 49,026
Deaths 555,975 543,445 12,530
Population Sex Ratio (Males per 100 Females) 95 95 94
Urban (Percentage) 29.6 29.1 46.3
Rural (Percentage) 70.4 70.9 53.7
Population Density (Per Sq. Km) 51 49 530
Source: 2010 DHS and 2012 PHC
Note: * Projected figures based on 2002 Population and Housing Census

Pag
e 25
Population Pyramids
Percentage Distribution of Population by Age Group and Sex:
Tanzania, 2002 Census
Percentage Distribution of Population by Age Group and Sex:
Tanzania, 2012 Census
Pag
e 26
Population Distribution, Population Density and Average Annual
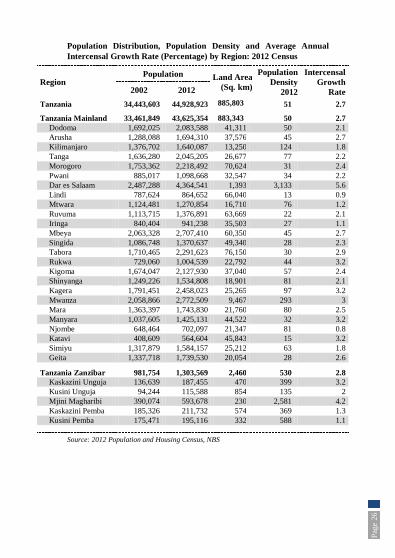
Intercensal Growth Rate (Percentage) by Region: 2012 Census
Region Population Land Area
(Sq. km)
Population
Density
2012
Intercensal
Growth
Rate 2002 2012
Tanzania 34,443,603 44,928,923 885,803
51 2.7
Tanzania Mainland 33,461,849 43,625,354 883,343
50 2.7
Dodoma 1,692,025 2,083,588 41,311 50 2.1
Arusha 1,288,088 1,694,310 37,576 45 2.7
Kilimanjaro 1,376,702 1,640,087 13,250 124 1.8
Tanga 1,636,280 2,045,205 26,677 77 2.2
Morogoro 1,753,362 2,218,492 70,624 31 2.4
Pwani 885,017 1,098,668 32,547 34 2.2
Dar es Salaam 2,487,288 4,364,541 1,393 3,133 5.6
Lindi 787,624 864,652 66,040 13 0.9
Mtwara 1,124,481 1,270,854 16,710 76 1.2
Ruvuma 1,113,715 1,376,891 63,669 22 2.1
Iringa 840,404 941,238 35,503 27 1.1
Mbeya 2,063,328 2,707,410 60,350 45 2.7
Singida 1,086,748 1,370,637 49,340 28 2.3
Tabora 1,710,465 2,291,623 76,150 30 2.9
Rukwa 729,060 1,004,539 22,792 44 3.2
Kigoma 1,674,047 2,127,930 37,040 57 2.4
Shinyanga 1,249,226 1,534,808 18,901 81 2.1
Kagera 1,791,451 2,458,023 25,265 97 3.2
Mwanza 2,058,866 2,772,509 9,467 293 3
Mara 1,363,397 1,743,830 21,760 80 2.5
Manyara 1,037,605 1,425,131 44,522 32 3.2
Njombe 648,464 702,097 21,347 81 0.8
Katavi 408,609 564,604 45,843 15 3.2
Simiyu 1,317,879 1,584,157 25,212 63 1.8
Geita 1,337,718 1,739,530 20,054 28 2.6
Tanzania Zanzibar 981,754 1,303,569 2,460 530 2.8
Kaskazini Unguja 136,639 187,455 470 399 3.2
Kusini Unguja 94,244 115,588 854 135 2
Mjini Magharibi 390,074 593,678 230 2,581 4.2
Kaskazini Pemba 185,326 211,732 574 369 1.3
Kusini Pemba 175,471 195,116 332 588 1.1
Source: 2012 Population and Housing Census, NBS

Pag
e 27
Tanzania Population Trend in Million: 1967 - 2012 Censuses
12.3
17.5
23.1
34.4
44.9
1967 1978 1988 2002 2012
Source: Population and Housing Censuses 1967, 1978, 1988, 2002 and 2012
Pag
e 28
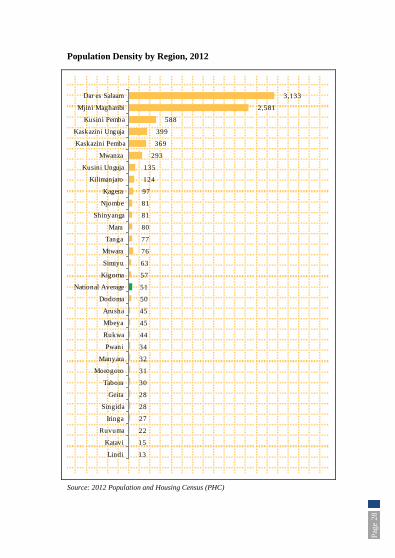
Population Density by Region, 2012
13
15
22
27
28
28
30
31
32
34
44
45
45
50
51
57
63
76
77
80
81
81
97
124
135
293
369
399
588
2,581
3,133
Lindi
Katavi
Ruvuma
Iringa
Singida
Geita
Tabora
Morogoro
Manyara
Pwani
Rukwa
Mbeya
Arusha
Dodoma
National Average
Kigoma
Simiyu
Mtwara
Tanga
Mara
Shinyanga
Njombe
Kagera
Kilimanjaro
Kusini Unguja
Mwanza
Kaskazini Pemba
Kaskazini Unguja
Kusini Pemba
Mjini Magharibi
Dar es Salaam
Source: 2012 Population and Housing Census (PHC)

Pag
e 29
Tanzania Demographic and Health Survey (TDHS), 2010
Report
Total Fertility Rate (TFR) and Crude Birth Rate (CBR) by
Residence
Residence TFR CBR
Tanzania
Total 5.4 38.1
Tanzania Mainland 5.4 38.1
Zanzibar 5.1 35.9
Tanzania Mainland
Urban 3.7 35.0
Rural 6.1 39.0
Source: 2010 TDHS
Trends in Total Fertility Rate (TFR): Tanzania
Year TFR (Births per woman)
1991/92 DHS 6.3
1996 DHS 5.8
1999 DHS 5.6
2002 Census 6.3
2004/05 DHS 5.7
2010 DHS 5.4 Source: 1991/92, 1996, 1999, 2004/05 and 2010 TDHS and 2002 PHC
Trend on Contraceptive Use, 1991 – 2010
Contraceptive Methods 1991/92 1996 1999 2004/05 2010
Modern Method 7 13 17 20 27
Any Method 10 18 25 26 34 Source: 1991/92, 1996, 1999, 2004/05 and 2010 TDHS

Pag
e 30
Infant and Under-Five Mortality Rates, Tanzania, 1996 - 2010
Survey Year Infant Mortality (per
1,000 live births) - 1q0
Under-Five Mortality (per
1,000 live births) - 5q0
1996 88 137
2004/05 68 112
2010 51 81 Source: 1996, 2004/05 and 2010 TDHS Maternal Mortality (Maternal Deaths per 100,000 Live Births)
Year Maternal deaths per 100,000 live births
1996 529
2004/05 578
2010 454 Source: 1996, 2004/05 and 2010 TDHS

Pag
e 31
HIV PRE VALEN CE
HIV Prevalence by Age and Socio-economic Characteristics: 2011/12
THMIS
Background
Characteristics
Women Men Total
% HIV
Positive
Number
Tested
% HIV
Positive
Number
Tested
% HIV
Positive
Number
Tested
Age
15-19 1.3 2,153 0.8 1,944 1.0 4,097
20-24 4.4 1,699 1.7 1,449 3.2 3,148
25-29 7.0 1,691 2.5 1,053 5.3 2,744
30-34 9.2 1,320 6.5 1,013 8.0 2,333
35-39 8.0 1,269 7.1 1,007 7.6 2,276
40-44 9.3 901 7.1 892 8.2 1,793
45-49 10.2 722 6.5 631 8.5 1,353
Total 15 – 49 6.2 9,755 3.8 7,989 5.1 17,744
Residence
Urban 8.9 2,627 5.2 2,094 7.2 4,720
Rural 5.1 7,129 3.4 5,895 4.3 13,025
Mainland/Zanzibar
Mainland 6.3 9,409 3.9 7,730 5.3 17,139
Urban 9.3 2,519 5.4 2,021 7.5 4,539
Rural 5.3 6,891 3.5 5,709 4.5 12,600
Zanzibar 1.1 347 0.9 259 1.0 606
Unguja 1.2 265 1.1 194 1.2 458
Pemba 0.5 82 0.2 65 0.3 148
Education
No Education 5.4 1,715 3.5 715 4.8 2,430
Primary Incomplete 6.6 1,241 3.4 1,276 5.0 2,517
Primary Complete 6.7 5,110 4.9 4,093 5.9 9,202
Secondary + 4.9 1,690 2.0 1,905 3.4 3,595 Source: 2011/12 Tanzania HIV/AIDS and Malaria Indicator Survey (THMIS)

Pag
e 32
Regional HIV Prevalence by Sex and Socio-economic Characteristics:
2011/12 THMIS
Background
Characteristics
Women Men Total
% HIV
Positive
Number
Tested
% HIV
Positive
Number
Tested
% HIV
Positive
Number
Tested
Tanzania 6.2 9,755 3.8 7,988 5.1 17,746
Region
Dodoma 2.1 373 3.7 332 2.9 705
Arusha 3.9 290 2.3 245 3.2 535
Kilimanjaro 4.9 343 2.2 244 3.8 587
Tanga 3.5 508 0.7 325 2.4 833
Morogoro 5.3 352 2.1 322 3.8 674
Pwani 9.2 187 2.1 159 5.9 346
Dar es Salaam 8.2 962 5.3 802 6.9 1,764
Lindi 4.3 167 1.1 123 2.9 290
Mtwara 6.0 333 1.5 237 4.1 570
Ruvuma 9.1 619 4.1 441 7.0 1,061
Iringa 10.9 183 6.9 145 9.1 328
Mbeya 11.0 619 6.7 538 9.0 1,157
Singida 4.5 370 1.8 320 3.3 690
Tabora 5.8 383 4.5 390 5.1 774
Rukwa 6.8 164 5.5 131 6.2 295
Kigoma 4.5 405 2.0 305 3.4 710
Shinyanga 8.1 368 6.6 313 7.4 681
Kagera 5.5 399 4.1 355 4.8 754
Mwanza 4.7 509 3.7 411 4.2 920
Mara 5.2 385 3.5 321 4.5 706
Manyara 2.7 232 0.3 227 1.5 459
Njombe 15.4 240 14.2 200 14.8 440
Katavi 5.3 190 6.7 150 5.9 340
Simiyu 4.3 558 2.7 457 3.6 1,015
Geita 5.7 270 3.5 236 4.7 506
Kaskazini Unguja 0.2 37 0.0 24 0.1 62
Kusini Unguja 0.7 23 0.3 19 0.5 42
Mjini Magharibi 1.5 204 1.4 150 1.4 354
Kaskazini Pemba 0.2 42 0.3 32 0.3 74
Kusini Pemba 0.8 40 0.0 34 0.4 74 Source: 2011/12 THMIS

Pag
e 33
HIV Prevalence by Region: THMIS 2011/12
Source: 2011/12 THMIS

Pag
e 34
P RE VAL E N CE O F M AL ARI A I N CH I L D RE N
Percentage of Children aged 6-59 Months Classified in two Tests as
Having Malaria
Background
Characteristics
Malaria prevalence
according to RDT1
Malaria prevalence
according to microscopy
RDT Positive
(%)
Number of
children
tested
Microscopy
positive
(%)
Number of
children
tested
Age (in Months)
6-8 3.5 405 2.1 400
9-11 5.1 401 1.9 400
12-17 6.4 917 2.2 906
18-23 8.9 831 4 821
24-35 9.7 1,641 4.4 1,632
36-47 10.7 1,687 4.9 1,668
48-59 11.7 1,516 5.2 1,494
Sex
Male 9.2 3,724 4.1 3,694
Female 9.3 3,676 4.1 3,628
Source: 2011/12 THMIS
1 RDT - Rapid Diagnostic Test
Pag
e 35
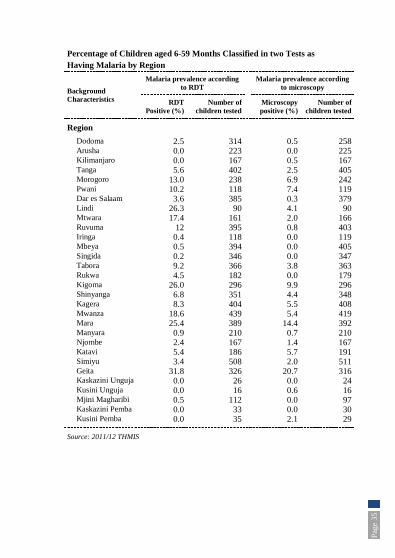
Percentage of Children aged 6-59 Months Classified in two Tests as
Having Malaria by Region
Background
Characteristics
Malaria prevalence according
to RDT
Malaria prevalence according
to microscopy
RDT
Positive (%)
Number of
children tested
Microscopy
positive (%)
Number of
children tested
Region
Dodoma 2.5 314 0.5 258 Arusha 0.0 223 0.0 225 Kilimanjaro 0.0 167 0.5 167 Tanga 5.6 402 2.5 405 Morogoro 13.0 238 6.9 242 Pwani 10.2 118 7.4 119 Dar es Salaam 3.6 385 0.3 379 Lindi 26.3 90 4.1 90 Mtwara 17.4 161 2.0 166 Ruvuma 12 395 0.8 403 Iringa 0.4 118 0.0 119 Mbeya 0.5 394 0.0 405 Singida 0.2 346 0.0 347 Tabora 9.2 366 3.8 363 Rukwa 4.5 182 0.0 179 Kigoma 26.0 296 9.9 296 Shinyanga 6.8 351 4.4 348 Kagera 8.3 404 5.5 408 Mwanza 18.6 439 5.4 419 Mara 25.4 389 14.4 392 Manyara 0.9 210 0.7 210 Njombe 2.4 167 1.4 167 Katavi 5.4 186 5.7 191 Simiyu 3.4 508 2.0 511 Geita 31.8 326 20.7 316 Kaskazini Unguja 0.0 26 0.0 24 Kusini Unguja 0.0 16 0.6 16 Mjini Magharibi 0.5 112 0.0 97 Kaskazini Pemba 0.0 33 0.0 30 Kusini Pemba 0.0 35 2.1 29
Source: 2011/12 THMIS

Pag
e 36
NATIO NAL A CC OU NTS
Mean Exchange Rate (TShs. to 1US$)
Source: Bank of Tanzania
Consumption Expenditure and Balance of Payments
Final Consumption Expenditure at Current Prices (Million TShs.)
2001 2008 2009 2010 2011 2012
Households 6,822 16,460 18,477 20,209 24,816 29,399
Government 1,079 4,322 4,927 5,208 6,146 7,118
Source: National Bureau of Statistics Balance of Payments Position (TShs. Billion)
2008 2009 2010 2011 2012
Exports (FoB) 3,195 3,672 5,604 7,331 8,653
Imports (CIF) 8,839 8,447 11,087 17,217 18,276
Visible Balance of Trade -5,644 -4,775 -5,483 -9,886 -9,623 Source: Bank of Tanzania

Pag
e 37
Economic Indicators for Tanzania Mainland Gross Domestic Product at Market Price (TShs. Billion)
2001 2008 2009 2010 2011 2012
At Current Prices 9,100 24,782 28,213 32,293 37,533 44,718
At 2001 Prices 9,100 14,828 15,721 16,829 17,914 19,156
GDP Growth Rate
Percentage 6.0 7.4 6.0 7.0 6.4 6.9 Source: National Bureau of Statistics
Pag
e 38
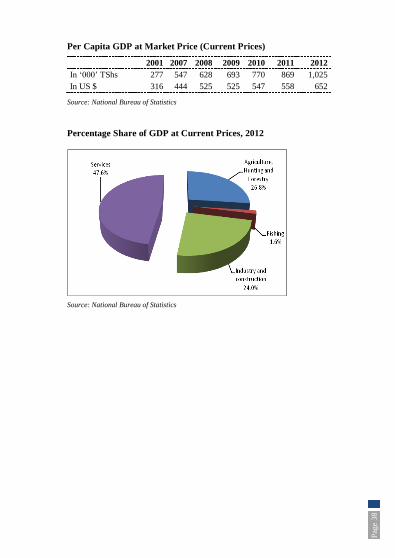
Per Capita GDP at Market Price (Current Prices)
2001 2007 2008 2009 2010 2011 2012
In ‘000’ TShs 277 547 628 693 770 869 1,025
In US $ 316 444 525 525 547 558 652
Source: National Bureau of Statistics
Percentage Share of GDP at Current Prices, 2012
Source: National Bureau of Statistics

Pag
e 39
Monthly Inflation Rates for Tanzania Mainland, 2012
Category Jan Feb Mar Apr May Jun July Aug Sep Oct Nov Dec
Total Inflation 19.7 19.4 19.0 18.7 18.2 17.4 15.7 14.9 13.5 12.9 12.1 12.1
Food Inflation
Rate 26.2 25.5 24.9 24.7 24.5 22.9 20.3 18.5 15.8 15.0 13.7 13.3
Energy Inflation
Rate 30.1 33.5 29.4 24.9 21.2 20.5 16.3 16.9 19.4 18.4 18.6 17.8
Non Food
Inflation Rate 11.8 11.8 11.5 11.2 10.5 10.5 10.0 10.3 10.5 10.1 10.1 10.3
Non Food and
non-Energy
Inflation Rate
9.0 8.6 8.8 9.0 8.7 8.8 8.8 9.2 8.9 8.6 8.5 8.9
Source: National Bureau of Statistics
National Consumer Price Index (NCPI) September, 2010 =100
Year 2002 2003 2004 2005 2006 2007 2008 2009 2010 2011 2012
Index 57.58 60.64 63.51 66.71 71.54 76.57 84.44 94.69 99.87 112.55 130.56
Inflation
Rates 5.3 5.3 4.7 5.0 7.3 7.0 10.3 12.1 5.5 12.7 16.0
Source: National Bureau of Statistics

Pag
e 40
Government Minimum Wage in TShs: Tanzania Mainland
Source: President’s Office Public Service Management

Pag
e 41
Non-Government Minimum Wage in TShs: Tanzania Mainland
Sector Minimum
Wage Sub-Sector
Health Services
Health Services 80,000
Agriculture
Agriculture 70,000
Commerce, Industrial and Trading only one wage
Commerce, Industrial and Trading only one wage 80,000
Transport and Communications
Aviation Services 350,000
Clearing and Forwarding 230,000
Telecommunication 300,000
Inland Transport 150,000
Mining
Mining Licences/Prospecting Licences 350,000
Primary Mining Licences/Prospecting Licences 150,000
Dealers Licences/Lapidary 250,000
Brokers Licences 150,000
Marine and Fishing
Marine and Fishing 165,000
Domestic Services including Hotels
Domestic Servants Employed by Diplomats and
Potential Businessmen 90,000
Entitled Officers for Domestic Services Provision 80,000
Other Domestic Servants 65, 000
Potential and Tourist Hotels 150,000
Medium Hotels 100,000
Restaurants, Guest Houses and Bars 80,000
Private Security Services
International or Potential Security Companies 105,000
Others 80,000
Pag
e 42
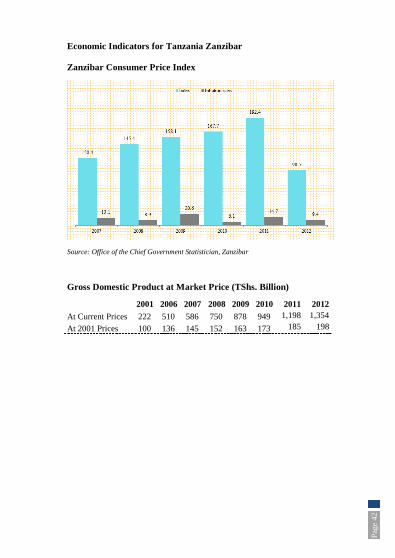
Economic Indicators for Tanzania Zanzibar
Zanzibar Consumer Price Index
Source: Office of the Chief Government Statistician, Zanzibar Gross Domestic Product at Market Price (TShs. Billion)
2001 2006 2007 2008 2009 2010 2011 2012
At Current Prices 222 510 586 750 878 949 1,198 1,354
At 2001 Prices 100 136 145 152 163 173 185 198
Pag
e 43
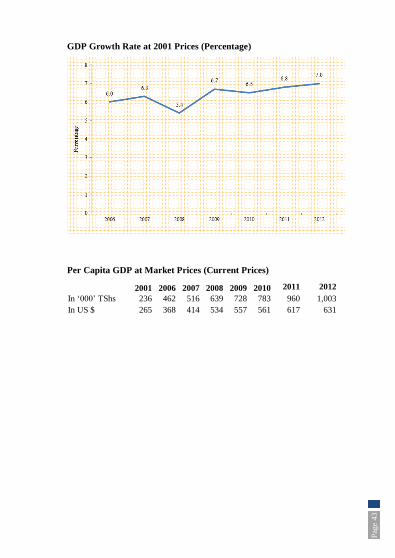
GDP Growth Rate at 2001 Prices (Percentage)
Per Capita GDP at Market Prices (Current Prices)
2001 2006 2007 2008 2009 2010 2011 2012
In ‘000’ TShs 236 462 516 639 728 783 960 1,003
In US $ 265 368 414 534 557 561 617 631

Pag
e 44
FOREIGN T RA DE
Major Exports: (TShs. Billion)
Commodity 2006 2007 2008 2009 2010 2011 2012
Coffee 92.8 143.3 124.1 150.0 162.3 225.7 292.8
Cotton 56.8 49.8 95.6 146.8 133.1 103.9 -
Sisal 9.3 7.4 18.5 - 11.1 - -
Cashew nuts 62.7 33.8 82.0 94.4 173.2 189.6 222.0
Cloves 10.0 10.6 16.0 18.5 11.3 48.4 58.3
Diamonds 28.0 23.4 23.8 24.2 14.2 17.0 41.0
Gold 968.0 672.1 807.9 1,058.2 1,336.7 3,463.8 3,410.7
Tobacco 129.1 116.9 210.2 327.5 178.7 437.9 348.1
Tea 41.7 48.3 50.3 88.1 68.1 73.5 87.4
Total 1,398.4 1,105.6 1,428.4 1,907.7 2,088.7 4,559.8 4,460.3
Major Imports by Commodity: (TShs. Billion)
Commodity 2006 2007 2008 2009 2010 2011 2012
Food and Beverages 108.3 388.8 702.0 724.1 1,068.6 1,059.0 1,749.1
Oil 1,280.7 1,802.5 2,764.0 1,849.6 2,852.6 4,878.1 5,390.1
Building & Construction
Material 247.7 513.7 948.6 804.9 959.5 1,325.0 1,398.0
Machinery 1,155.9 1,083.0 1,106.7 1,179.3 1,241.4 2,068.4 1,827.1
Transport Equipment 595.6 589.1 1,127.2 1,085.0 1,440.1 1,795.1 2,162.1
Others 2,153.8 3,895.5 2,920.6 2,803.9 4,752.6 6,292.0 8,675.0
Total 5,542.0 8,272.6 9,569.1 8,446.8 12,314.8 17,417.6 21,201.4
Source: National Bureau of Statistics

Pag
e 45
MAN UFA CTU RING
Selected Manufactured Goods Produced in Tanzania Mainland
2006 2007 2008 2009 2010 2011 2012
Konyagi (Mill. litres) 5 6 4 10 11 15 16
Beer (Mill. litres) 299 310 291 285 243 323 338
Kibuku (Mill. litres) 12 10 10 16 21 23 22
Cigarette (Mill. pieces) 5,095 5,821 6,101 5,831 6,181 6,630 7,723
Textiles (Mill.sq.m) 147 139 141 92 103 102 81
Paints(‘000 litres) 18,402 17,451 24,857 25,762 28,201 31,710 35,025
Cement (‘000 metric tons) 1,422 1,630 1,756 1,941 2,313 2,409 2,558
Rolled steel (‘000 metric tons) 44 36 40 35 33 40 47
Iron sheets(‘000 metric tons) 30 36 32 51 71 77 81
Aluminium (tons) 105 110 105 58 59 33 23
Selected Manufactured Goods Produced in Tanzania Zanzibar
2001 2007 2008 2009 2010 2011 2012
*Beverages (million litres) 5.7 9.9 12.8 13.8 15.4 17.2 14.4
Animal Feeds (tons ‘000’) - 1.1 0.2 0.0 0.0 0.0 0.0
Wheat flour (tons) 8.8 1.0 0.0 0.0 0.0 0.0 17.6
Soap & Detergents (tons) 195.0 0.0 0.0 0.0 0.0 0.0 0.0
Coconut oil (tons) 233.0 77.0 - - - - -
Bread (Nos.‘000) 53.1 98.0 109.0 106.0 108.3 111.5 114.9
Copra Cakes (tons) 61.0 49.0 - - - -
Noodles (tons) - 58.8 71.1 75.6 80.4 189.0 199.0
Door UPVC (Nos.) - 53.0 33.0 43.0 125.0 140.0 95.0
Window UPVC(Nos.) - 161.0 35.0 98.0 43.0 95.0 201.0
Garments Dish Dash (Pcs) - 5,338.0 3,778.0 4,392.0 4,648.0 4,672.0 2,877.0
Jewellery Gold/Silver (Gms) - 7,563.0 7,526.0 9,710.0 9,508.0 8,602.0 8,172.0
Source: National Bureau of Statistics
* Includes mineral water and juice

Pag
e 46
AGRI CULTU RE
Household Indicators 2007/08
Tanzania Mainland Zanzibar
POPULATION
Rural Population involved in Agriculture 31,013,026 30,264,358 748,668
Male 15,487,216 15,114,238 372,978
Female 15,525,809 15,150,119 375,690
LAND OWNERSHIP/TENURE
Percentage of Land owned under Customary Law 69.3 69.5 39.4
Percentage of Land owned by buying 15.7 15.8 7.3
Percentage of Land owned under official land titles 5.6 5.5 14
LITERACY AND EDUCATION (5 YEARS AND ABOVE)
Literacy
The Average Literacy Rate for overall household
members 73 73 69
The Average Literacy Rate for Heads of
Agricultural Households 73 74 63
Rate of Completion of a Certain Level of education 41 41 34
Rate of population attending school 35 35 37
Rate of Population Never attended School 24 24 29
Education
Percentage of heads of Agricultural Households
with formal education 72 72 58
Percentage of heads of Agricultural Households
without formal education 28 28 42
Percentage of heads of Agricultural Households
with Adult Education 1 1 4
Percentage of heads of Agricultural Households
with maximum Primary Level Education
attainment
67 68 30
Rate of Involvement on Agricultural activities on
full time basis 48 49 22
LIVING CONDITION
Percentage of households with roof of main
building made of traditional roofing material
(grass/leaves/mud)
49 49 35
Percentage of households using traditional Pit
latrines 85 86 39

Pag
e 47
Household Indicators 2007/08
Tanzania Mainland Zanzibar
Percentage of households not owning Assets
Radio 33 33 31
Bicycle 49 50 48
Iron 76 76 84
Wheelbarrow 93 93 97
Mobile phone 68 68 50
TV/ Video 97 97 90
Vehicle 95 95 97
Landline phone 99 99 99
Percentage of households and Sources of Energy for Lighting
Wick Lamp 67 67 72
Hurricane Lamp 24 24 11
Pressure Lamp 4 4 3
Firewood 2 2 1
Mains Electricity 2 2 12
Candles 0 0 0
Solar 1 1 0
Gas(Biogas) 0 0 0
Percentage of households and Sources of Energy for Cooking
Firewood 95 95 95
Charcoal 4 4 4
Crop Residues 1 1 1
Paraffin / Kerosene 0 0 0
Mains Electricity 0 0 1
Bottled Gas 0 0 0
Solar 0 0 0
Livestock Dung 0 0 0
Gas (Biogas) 0 0 0
Percentage of households and Access to Drinking Water (Less than one Km)
Wet Season 66 76 99
Dry Season 57 56 98
Percentage of households and number of Meals per day
One 2 2 3
Two 52 52 57
Three 45 45 40
Four - - -
Percentage of households and Status of Food Satisfaction
Always 6 6 5

Pag
e 48
Household Indicators 2007/08
Tanzania Mainland Zanzibar
Sometimes 10 10 9
Often 10 10 9
Never 41 40 41
Seldom 34 34 36
Crop Indicators
2007/08
Tanzania Mainland Zanzibar
AGRICULTURAL HOUSEHOLDS
Number of Rural Agricultural households 5,838,523 5,706,329 132,193
Number of Households Growing Crops only 3,508,581 3,422,072 86,509
Number of Households Growing Crops and livestock 2,268,255 2,224,410 43,844
Number of Households with Livestock only 57,770 55,929 1,840
Number of Households doing Pastoralism 3,917 3,917 0
LAND ACCESS & OWNERSHIP
Land allocated to smallholders (ha) 14,810,368 14,684,721 125,647
Average allocated land per agricultural household 2.5 2.5 0.9
Average Utilized Area per agricultural household 2.0 1.98 0.91
Land Insufficiency Rate (%) 63 63 56
Land Utilization Rate (%) 78 78 96
Average planted area of annual Crops per crop
growing household 1.5 1.6 0.4
Pag
e 49
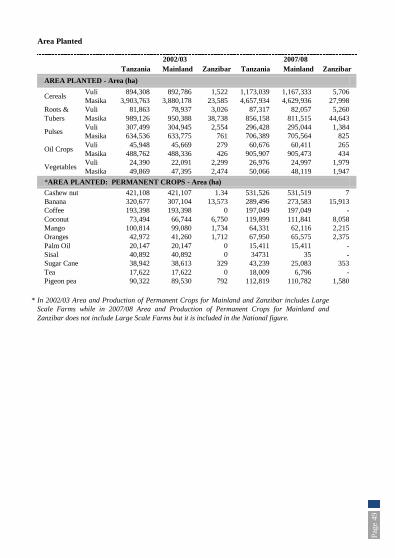
Area Planted
2002/03 2007/08
Tanzania Mainland Zanzibar Tanzania Mainland Zanzibar
AREA PLANTED - Area (ha)
Cereals Vuli 894,308 892,786 1,522 1,173,039 1,167,333 5,706
Masika 3,903,763 3,880,178 23,585 4,657,934 4,629,936 27,998
Roots &
Tubers
Vuli 81,863 78,937 3,026 87,317 82,057 5,260
Masika 989,126 950,388 38,738 856,158 811,515 44,643
Pulses Vuli 307,499 304,945 2,554 296,428 295,044 1,384
Masika 634,536 633,775 761 706,389 705,564 825
Oil Crops Vuli 45,948 45,669 279 60,676 60,411 265
Masika 488,762 488,336 426 905,907 905,473 434
Vegetables Vuli 24,390 22,091 2,299 26,976 24,997 1,979
Masika 49,869 47,395 2,474 50,066 48,119 1,947
*AREA PLANTED: PERMANENT CROPS - Area (ha)
Cashew nut 421,108 421,107 1.34 531,526 531,519 7
Banana 320,677 307,104 13,573 289,496 273,583 15,913
Coffee 193,398 193,398 0 197,049 197,049 -
Coconut 73,494 66,744 6,750 119,899 111,841 8,058
Mango 100,814 99,080 1,734 64,331 62,116 2,215
Oranges 42,972 41,260 1,712 67,950 65,575 2,375
Palm Oil 20,147 20,147 0 15,411 15,411 -
Sisal 40,892 40,892 0 34731 35 -
Sugar Cane 38,942 38,613 329 43,239 25,083 353
Tea 17,622 17,622 0 18,009 6,796 -
Pigeon pea 90,322 89,530 792 112,819 110,782 1,580
* In 2002/03 Area and Production of Permanent Crops for Mainland and Zanzibar includes Large
Scale Farms while in 2007/08 Area and Production of Permanent Crops for Mainland and
Zanzibar does not include Large Scale Farms but it is included in the National figure.

Pag
e 50
2002/03 2007/08
Tanzania Mainland Zanzibar Tanzania Mainland Zanzibar
PRODUCTION IN TONNES
Cereals Vuli 755,060 753,517 1,544 1,458,979 1,451,911 7,068
Masika 2802,832 2,790,438 12,394 6,173,797 6,140,629 33,168
Roots &
Tubers
Vuli 141,207 137,078 4,129 160,215 150,441 9,774
Masika 2,342,987 2,268,055 74,932 1,670,380 1,537,462 132,918
Pulses Vuli 138,702 138,192 510 214,181 213,249 932
Masika 266,550 266,361 189 512,358 512,022 337
Oil Crops Vuli 24,876 24,692 185 36,024 35,845 180
Masika 215,420 215,217 203 608,814 608,308 506
Vegetable Vuli 74,371 71,509 2,864 152,126 148,396 3,730
Masika 153,806 150,233 3,572 285,033 281,003 4,030
PRODUCTION OF PERMANENT CROPS IN TONNES
Cashew nut 183,419 134,998 134,997 1
Banana 2,205,673 1,889,570 1,795,230 94,339
Coffee 61,602 186,250 186,250 -
Mango 336,028 190,402 180,291 10,111
Pigeon pea 26,615 44,942 44,358 584
Coconut 102,458 120,619 106,105 14,514
Oranges 186,695 197,522 186,583 10,938
Sugar Cane 404,694 190,147 186,500 3,647
Palm Oil 51,109 12,217 12,217 -
IRRIGATION PRACTICE
Percentage Irrigated Area
Vuli 3.3 3.2 12.3 4.8 4.7 9.9
Masika 2.6 2.6 1.2 2.8 2.8 3.5
Percentage of households using Irrigation Facilities
Dams 5 0.9 0.7 13
Canals 28 10.5 10.2 27
Well 15 1.5 1.4 12
Rivers 49 52.7 52.9 36
Lake 2 5.5 5.6 0
Pipe water 1 27.6 27.8 11
Borehole 1 1.3 1.3 0
Pag
e 51
Input Usage
2002/03 2007/08
Tanzania Mainland Zanzibar Tanzania Mainland Zanzibar
INPUT USAGE: ANNUAL CROPS
Percentage Area Planted on
Improved Seeds - 16 - 16.9 17 7.4
Percentage Area planted with
fertiliser application 28.09 24.23 0.15 - - -
Percentage Area planted with
Farm Yard Manure application 18.4 15.95 0.04 - - -
Percentage Area planted with
Compost application 2.97 2.48 0.07 - - -
Percentage Area planted with
Inorganic fertiliser application 6.73 5.79 0.04 6.7 6.7 6.9
CROP EXTENSION
Percent of Households Receiving
Crop Extension Services - 34 - 67 67 34
FARM IMPLEMENTS
Percent of Households Using hand
hoe as the main Farm Implement - 98 - 97.6 97.8 89.5
Percent of Households Using
OXEN PLOUGH as the main
Farm Implement
- 24 - 14.1 14.4 0.3
Percent of Households Using
Tractor as the main Farm
Implement
- 3 - 0.8 0.8 1.4
Quantity of the Major Crops Marketed: (000’ Metric Tons)
Crop 2006 2007 2008 2009 2010 2011 2012
Sisal fibre 31 33 34 26 42 25 37
Coffee 46 55 44 69 35 57 33
Tobacco 51 51 55 163 94 121 74
Cashew nuts 88 91 98 49 119 66 122
Pyrethrum 2 2 1 2 2 2 6
Green tea leaves 123 159 148 142 151 143 141
Seed cotton 131 131 201 369 268 166 226
Pag
e 52
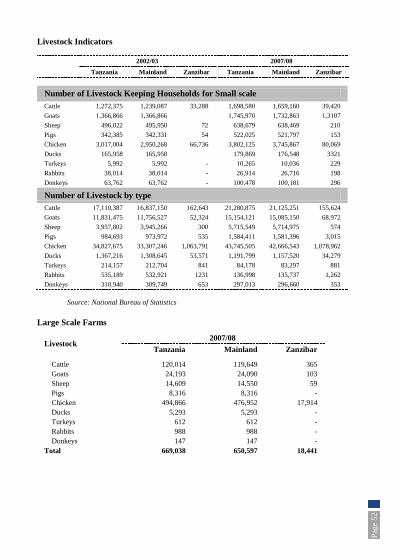
Livestock Indicators
2002/03 2007/08
Tanzania Mainland Zanzibar Tanzania Mainland Zanzibar
Number of Livestock Keeping Households for Small scale
Cattle 1,272,375 1,239,087 33,288 1,698,580 1,659,160 39,420
Goats 1,366,866 1,366,866 1,745,970 1,732,863 1,3107
Sheep 496,022 495,950 72 638,679 638,469 210
Pigs 342,385 342,331 54 522,025 521,797 153
Chicken 3,017,004 2,950,268 66,736 3,802,125 3,745,867 80,069
Ducks 165,958 165,958 179,869 176,548 3321
Turkeys 5,992 5,992 - 10,265 10,036 229
Rabbits 38,014 38,014 - 26,914 26,716 198
Donkeys 63,762 63,762 - 100,478 100,181 296
Number of Livestock by type
Cattle 17,110,387 16,837,150 162,643 21,280,875 21,125,251 155,624
Goats 11,831,475 11,756,527 52,324 15,154,121 15,085,150 68,972
Sheep 3,957,802 3,945,266 300 5,715,549 5,714,975 574
Pigs 984,693 973,972 535 1,584,411 1,581,396 3,015
Chicken 34,827,675 33,307,246 1,063,791 43,745,505 42,666,543 1,078,962
Ducks 1,367,216 1,308,645 53,571 1,191,799 1,157,520 34,279
Turkeys 214,157 212,704 841 84,178 83,297 881
Rabbits 535,189 532,921 1231 136,998 135,737 1,262
Donkeys 310,940 309,749 653 297,013 296,660 353
Source: National Bureau of Statistics
Large Scale Farms
Livestock 2007/08
Tanzania Mainland Zanzibar
Cattle 120,014 119,649 365
Goats 24,193 24,090 103
Sheep 14,609 14,550 59
Pigs 8,316 8,316 -
Chicken 494,866 476,952 17,914
Ducks 5,293 5,293 -
Turkeys 612 612 -
Rabbits 988 988 -
Donkeys 147 147 -
Total 669,038 650,597 18,441

Pag
e 53
ELECTRICIT Y
2008 2009 2010 2011 2012
Tanzania Mainland
Installed Capacity (MW) 680 828 789 860 885
Generation (GWH) 4,425 4,802 5,138 5,153 5,860
Tanzania Zanzibar
Distributed (Kwh “000”) 131 185 197 248 223
Source: Tanzania Electricity Supply Company (TANESCO)
Pag
e 54
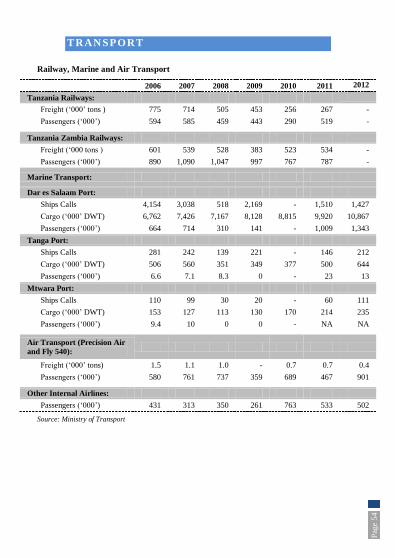
TRAN SPORT
Railway, Marine and Air Transport
2006 2007 2008 2009 2010 2011 2012
Tanzania Railways:
Freight (‘000’ tons ) 775 714 505 453 256 267 -
Passengers (‘000’) 594 585 459 443 290 519 -
Tanzania Zambia Railways:
Freight (‘000 tons ) 601 539 528 383 523 534 -
Passengers (‘000’) 890 1,090 1,047 997 767 787 -
Marine Transport:
Dar es Salaam Port:
Ships Calls 4,154 3,038 518 2,169 - 1,510 1,427
Cargo (‘000’ DWT) 6,762 7,426 7,167 8,128 8,815 9,920 10,867
Passengers (‘000’) 664 714 310 141 - 1,009 1,343
Tanga Port:
Ships Calls 281 242 139 221 - 146 212
Cargo (‘000’ DWT) 506 560 351 349 377 500 644
Passengers (‘000’) 6.6 7.1 8.3 0 - 23 13
Mtwara Port:
Ships Calls 110 99 30 20 - 60 111
Cargo (‘000’ DWT) 153 127 113 130 170 214 235
Passengers (‘000’) 9.4 10 0 0 - NA NA
Air Transport (Precision Air
and Fly 540):
Freight (‘000’ tons) 1.5 1.1 1.0 - 0.7 0.7 0.4
Passengers (‘000’) 580 761 737 359 689 467 901
Other Internal Airlines:
Passengers (‘000’) 431 313 350 261 763 533 502
Source: Ministry of Transport
Pag
e 55
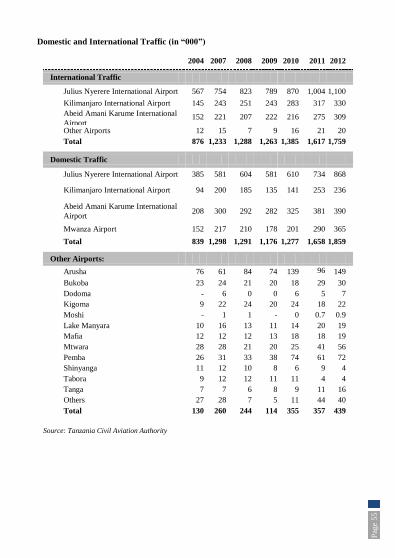
Domestic and International Traffic (in “000”)
2004 2007 2008 2009 2010 2011 2012
International Traffic
Julius Nyerere International Airport 567 754 823 789 870 1,004 1,100
Kilimanjaro International Airport 145 243 251 243 283 317 330
Abeid Amani Karume International
Airport 152 221 207 222 216 275 309
Other Airports 12 15 7 9 16 21 20
Total 876 1,233 1,288 1,263 1,385 1,617 1,759
Domestic Traffic
Julius Nyerere International Airport 385 581 604 581 610 734 868
Kilimanjaro International Airport 94 200 185 135 141 253 236
Abeid Amani Karume International
Airport 208 300 292 282 325 381 390
Mwanza Airport 152 217 210 178 201 290 365
Total 839 1,298 1,291 1,176 1,277 1,658 1,859
Other Airports:
Arusha 76 61 84 74 139 96
149
Bukoba 23 24 21 20 18 29 30
Dodoma - 6 0 0 6 5 7
Kigoma 9 22 24 20 24 18 22
Moshi - 1 1 - 0 0.7 0.9
Lake Manyara 10 16 13 11 14 20 19
Mafia 12 12 12 13 18 18 19
Mtwara 28 28 21 20 25 41 56
Pemba 26 31 33 38 74 61 72
Shinyanga 11 12 10 8 6 9 4
Tabora 9 12 12 11 11 4 4
Tanga 7 7 6 8 9 11 16
Others 27 28 7 5 11 44 40
Total 130 260 244 114 355 357 439
Source: Tanzania Civil Aviation Authority

Pag
e 56
INFOR MATI ON AN D C OMM U NIC ATIO N
TECHNOLOG Y (I CT)
2007 2008 2009 2010 2011 2012
Telephone and Internet Operators:
Fixed Line Operators 2 2 2 2 2 2
Mobile Operators 6 6 7 10 7 7
Data Operators and Internet
Service Providers 34 60 62 80 84 84
Number of Television Stations:
National Television Stations 6 6 6 5 6 5
Regional Television Stations 2 2 1 1 3 1
District Television Stations 18 20 21 20 19 20
Total 24 28 27 26 28 26
Number of Radio Stations:
National Radio Stations 5 5 5 6 5 5
Regional Radio Stations 8 11 17 18 8 21
District Radio Stations 31 35 35 43 30 57
Community Radio Stations 2 2 2 3 2 3
Total 46 53 59 70 45 86
Telephone Subscribers:
Year Fixed lines Mobile Total
1999 150,220 50,100 200,320
2000 173,591 110,518 284,109
2001 177,802 275,560 453,362
2002 161,590 606,859 768,449
2003 147,006 1,298,000 1,445,006
2004 148,360 1,942,000 2,090,360
2005 154,420 2,963,737 3,118,157
2006 151,644 5,614,922 5,766,566
2007 163,269 8,322,857 8,486,126
2008 123,809 13,006,793 13,130,602
2009 181,671 17,985,919 18,167,590
2010 174,511 20,983,853 21,158,364
2011 161,063 25,666,455 25,827,518
2012 168,965 25,759,134 25,928,099
Source: Tanzania Communication Regulatory Authority

Pag
e 57
PUBLIC FI NA NCE
Revenue and Expenditure for the Year ending 30th
June: (TShs. Billion)
2005 2006 2007 2008 2009 2010 2011 2012
Recurrent Revenue 1,774 2,125 2,739 3,635 4,293 4,662 5,578 7,026
Recurrent Expenditure 2,017 2,662 3,137 3,398 4,681 5,562 6,690 6,990
Development Revenue 1,474 1,848 1,736 1,574 2,519 3,512 3,861 3,739
Internal Expenditure 240 296 503 567 906 1,005 985 1,872
External Expenditure 991 1,015 834 1,244 1,224 1,607 1,764 1,902
Development Expenditure 1,231 1,311 1,337 1,811 2,130 2,611 2,749 3,775
Total Revenue 3,248 3,973 4,475 5,209 6,812 8,174 9,439 10,765
Total Expenditure 3,248 3,973 4,475 5,209 6,812 8,174 9,439 10,765
Income from Taxes for the Year ending 30th
June: (TShs. Billion)
2005 2006 2007 2008 2009 2010 2011 2012
Income Tax 465 581 791 1,029 1,258 1,389 1,720 2,311
Customs & Excise Duty 351 452 766 966 1,131 1,215 1,512 1,539
Sales tax/VAT 732 846 861 1,111 1,334 1,488 1,633 2,073
Other Taxes 132 137 219 383 463 500 602 732
Refunds -64 -70 -107 -129 -141 -164 -173 -174
Non-Tax Revenue 158 178 210 275 249 217 285 545
Total Taxes 1,774 2,124 2,740 3,635 4,294 4,645 5,579 7,026
Source: Ministry of Finance

Pag
e 58
HEALTH FAC ILITIES
Number of Health Facilities
2005 2006 2007 2008 2009 2010 2011 2012
Hospitals 219 219 230 232 240 240 236 241
Health Centres 481 481 565 594 578 687 684 742
Dispensaries 4,552 4,679 4,930 4,984 5,394 5,394 5,132 5,680
Total 5,252 5,369 5,725 5,810 6,112 6,321 6,052 6,663 Source: Ministry of Health and Social Welfare
Number of Health Facilities 2012

Pag
e 59
EDUC ATION
2006 2007 2008 2009 2010 2011 2012
Number of Schools:
Primary Schools 14,700 15,446 15,673 15,727 15,816 16,001 16,331
Public 14,440 15,122 15,257 15,301 15,265 15,412 15,525
Private 260 324 416 426 551 589 806
Secondary Schools 2,289 3,485 3,798 4,102 4,266 4,367 4,528
Public 1,690 2,806 3,039 3,283 3,397 3,425 3,508
Private 599 679 759 819 869 942 1,020
Higher Learning Institutions:
Public Full Universities 5 8 8 8 8 8 11
Public University Colleges 4 4 3 4 4 4 3
Private Universities 17 10 11 11 11 11 16
Private University Colleges 19 11 10 10 10 10 19
Teacher Training Colleges:
Public 32 32 32 34 34 34 34
Private 22 23 34 43 58 75 71
Enrolment:
Primary Schools
Standard I
Public (‘000’) 1,303 1,365 1,361 1,337 1,333 1,362 1,364
Private 13,399 13,708 19,161 21,448 23,805 26,684 40,578
Standard VII
Public (‘000’) 690 809 1,055 1,047 932 1,011 887
Private 7,223 7,742 10,600 12,808 16,013 17,072 22,489
Secondary Schools
Form I 243,359 448,448 438,801 524,784 438,827 467,155 522,379
Public 196,391 401 395,830 480,529 382,207 403,873 457,321
Private 46,968 47,437 42,971 44,255 56,620 63,282 65,058
Form IV 72,380 106,542 131,194 201,416 326,815 333,638 404,585
Public 42,584 70,796 95,214 167,355 279,995 279,117 343,376
Private 29,796 35,746 35,980 34,061 46,820 54,521 61,209
Form V 27,780 33,088 37,816 43,052 38,334 41,348 40,890
Public 18,211 21,789 25,240 31,201 26,065 30,265 31,206
Private 9,569 11,299 12,576 11,851 12,269 11,083 9,684
Form VI 17,647 20,335 20,337 21,791 33,680 37,090 40,572
Public 9,691 11,668 11,743 12,695 20,674 25,164 28,859
Private 7,956 8,667 8,594 9,096 13,006 11,926 11,713
Source: Ministry of Education and Vocational Training

Pag
e 60
Students Enrolled in Universities and Colleges 2006/07 – 2011/12
Category 2006/07 2007/08
Female Male Total Female Male Total
Public Universities 13,281 25,937 39,218 19,505 45,159 64,664
Percentage 33.9 66.1 100 30 70 100
Private Universities 4,036 6,713 10,749 6,712 11,153 17,865
Percentage 37.5 62.5 100 37.6 62.4 100
Grand Total 17,317 32,650 49,967 26,217 56,312 82,529
Percentage 34.7 65.3 100 31.8 68.2 100
Category 2008/09 2009/10
Female Male Total Female Male Total
Public
Universities 23,613 51,418 75,031 30,632 58,817 89,449
Percentage 32 69 100 34 66 100
Private
Universities 10,400 15,791 26,191 13,690 20,295 33,985
Percentage 39.7 60.3 100 40.3 59.7 100
Grand Total 34,013 67,209 101,222 44,322 79,112 123,434
Percentage 33.6 66.4 100 35.9 64.1 100
Category 2010/11 2011/12
Female Male Total Female Male Total
Public
Universities 30,003 62,974 92,977 38,228 7,4345 11,2573
Percentage 32 68 100 33.9 66.0 100
Private
Universities 17,186 25,204 42,390 21,663 32,038 53,701
Percentage 40.5 59.5 100 40.3 59.7 100
Grand Total 47,189 88,178 135,367 38,228 7,4345 11,2573
Percentage 34.9 65.1 100 33.9 66.0 100
Source: Tanzania Commission for Universities (TCU)

Pag
e 61
Number of Teaching Staff 2006 2007 2008 2009 2010 2011 2012
Primary Schools
Total 151,882 154,868 154,895 157,185 165,856 175,449 180,987
Public 148,607 151,231 149,433 151,476 159,081 167,111 171,986
Private 3,275 3,637 5,462 5,709 6,775 8,338 9,001
Secondary Schools
Total 23,905 23,252 32,835 33,954 40,517 52,146 65,086
Public 13,448 15,911 24,971 26,432 30,252 39,934 51,469
Private 10,457 7,341 7,864 7,522 10,265 12,212 13,617
Female Enrolment as Percentage of Total Enrolment
Primary Education
STD I 49.4 49.3 49.2 49.6 49.7 49.6 49.7
STD VII 49.0 48.7 49.2 49.8 51.0 51.9 52.1
STD I-VII 49.1 49.3 49.3 49.7 50.1 50.3 50.5
Secondary Education
Form I 48.0 47.5 42.6 44.6 45.3 47.2 49.4
Public 47.4 47.1 41.6 43.9 44.2 46.2 48.8
Private 50.4 50.7 51.4 52.6 52.7 53.6 54.1
Form IV 42.5 46.0 43.8 45.9 45.8 42.9 44.5
Public 39.6 44.1 42.3 44.7 45.0 41.3 43.3
Private 46.6 49.8 47.8 51.2 50.2 51.7 51.4
Form V 41.4 40.2 42.0 41.5 39.9 34.5 31.6
Public 40.8 39.6 42.7 40.4 39.5 30.6 27.7
Private 42.4 41.3 40.6 44.5 40.7 44.9 44.2
Form VI 38.0 41.0 35.3 39.2 39.5 35.6 32.1
Public 34.9 41.2 31.7 35.3 39.2 33.1 27.5
Private 41.7 40.6 40.3 44.7 40.0 40.7 43.4
Source: Ministry of Education and Vocational Training

Pag
e 62
CRI ME S A ND RO AD A C CIDE NTS A S AT
DECEMBER, 2 0 1 1 AND 2 0 1 2
Crime Type 2011 2012
Against Human
Killings 4,023 3,928
Children theft 5,948 6,132
Raping 780 828
Sodomising 104 113
Children desertion 172 186
Child abuse 19 12
Human trafficking 3 7
Against Properties
Guns theft 65 73
Robbery on the main roads 17 6
Robbery 6,577 1,215
Robbery through fire arms 1,271 6,378
Cases of breaking houses 23,873 24,555
Property theft 6,305 537
Motorcycle theft 2,611 3,512
Vehicles theft 392 392
Fake money 992 723
Livestock theft 5,244 5,572
Bank robbery 175 200
Theft in the public sectors 126 127
Theft in the trade unions 12 10
Theft in the local government 34 31
Theft in the Central Government 15 20
Theft in political parties 0 0
House burning/arson cases 2,375 2,471
Fire accidents 610 642
Counterfeits 169 309
Source: Crime Statistics Department, Tanzania Police Force
Pag
e 63
TAN ZA NIA DIPLOM AT IC MI SSI ONS
ABROA D
1. BELGIUM
Embassy of the United Republic of Tanzania,
72, Avenue Franklin Roosevelt,
Zip Code: 1050 BRUSSELS
Tel: General: +32-2-640 6500
Fax: +32- 2- 646 8026/ +32-2 647 64 44
Email: [email protected]
Website: www.tanzaniaembassy-brussels.gov
2. BRAZIL
Embassy of the United Republic of Tanzania,
Brasilia, Brazil,
SHIS, Q109, Conjunto 16 CASA 20
LAGO-SUL CEP 71625-160
Brasilia-DF
Tel: +55-61-3364-2629/3364-0419
Fax: +55-61-3248-3361
E-mail: [email protected]
3. BURUNDI
Embassy of the United Republic of Tanzania,
United Nations Road,
855 BUJUMBURA, BURUNDI
Tel: General: +257- 248632/6
Fax: 257 - 248637
HOC: 257 – 248633
Email: [email protected]
4. CANADA
The High Commission of the United Republic of Tanzania,
50 Range Road, Ottawa,
Ontario Kin, 8J4. Canada
Tel: General: +1-613-232-1500/09
Direct Line +1-613-2326792
Fax: +1-613-232-5184
E-mail: [email protected]
Website: www.tanzaniahighcommission.ca

Pag
e 64
5. PEOPLES REPUBLIC OF CHINA
Embassy of the United Republic of Tanzania,
Beijing,
No. 8, Liang Ma He Nan Lu,
Beijing 100600 P.R China
Tel: General: +86-10-65321408/ +86-10 65321491
Direct: +86-10 65325572
Fax: +86-10 65321695
E-mail: [email protected]
6. DEMOCRATIC REPUBLIC OF CONGO (DRC)
Embassy of the United Republic of Tanzania,
142, Boulevard 30 Juin,
B.P. 1612 Kinshasa 1, Gombe
Tel: General: +243-81-7008701
Direct: +243-81 2686109
Fax: +243-81 2616109
Email: [email protected]
7. EGYPT
Embassy of the United Republic of Tanzania,
Cairo, Egypt,
10, Anas Ibn Malik Street
Mohandessin-Arab Republic of Egypt
Postal Code 12411 Cairo
Tel: +202 - 3374155
Fax: +202 – 3374286
E-mail: [email protected]
Website: www.tanrep-egypt.com
8. ETHIOPIA
Embassy of the United Republic of Tanzania,
Addis Ababa,
Bole Kifle Ketema Kebele 03/05
House NO. 2213
P.O. Box 1053 Addis Ababa.
Tel: General: +251-1-6634353
Direct: +251-1-6627840
Fax: +251-1-6627882
E-mail: [email protected]

Pag
e 65
9. FRANCE
Embassy of the United Republic of Tanzania,
Paris, France
13, Avenue Raymond Poincare
75116, Paris
Tel: General: +331-53 70 6366
Fax: +331- 47- 550546
E-mail: [email protected] or [email protected]
Website: www.amb-tanzanie.fr
10. GERMANY
Embassy of the United Republic of Tanzania
Eschenallee 11
14050 Berlin
Tel: +49-30-303080-0
Fax: +49-30-303080- 20
E-mail: [email protected]
Website: www.tanzania-gov.de
11. INDIA
The High Commission of the United Republic of Tanzania
New Delhi,
EP 15C Chanakyapuri, New Delhi-110021,
Direct: +91-11 -24122864/5
Fax: +91-11 -24122862/6,
E-mail: [email protected]
Web: tanzanrepdelhi.com
12. ITALY
Embassy of the United Republic of Tanzania,
Rome, Italy, Villa Tanzania,
Viale Cortina D'ampezzo 185,
00135 Rome.
Tel: General: +39- 06 - 33485801
Fax: +39-06-33485821, +39-06-33485828
E-mail: [email protected]

Pag
e 66
13. JAPAN
Embassy of the United Republic of Tanzania,
21-9 Kamiyoga 4, Chome, Setagaya-ku,
Tokyo 1580098 ,
Tel: General: +81-03-3425 4531/3,
Fax: +81-03 3425 7844
E-mail: [email protected]
Website: www.tanzaniaembassy.or.jp
14. KENYA
High Commission of the United Republic of Tanzania,
Taifa Road,
Reinsurance Plaza, 9th Floor,
P.O. Box 47790-00100, G.P.O, Nairobi
Tel: General: +254-20-311948/ +255-20-311950, 312027,
Fax: +254-20-218269
Email: [email protected]
15. KENYA
Consulate of the United Republic of Tanzania,
Nkrumah Road
P.O. Box 1422 Mombasa
Tel: +254-41-2228595
Fax: +254-41-2222837
E-mail: [email protected]
16. MALAWI
High Commission of the United Republic of Tanzania,
Capital City, Plaza House,
P.O. Box 922, Lilongwe.
Tel: +265 -01 -775-035/038
Fax: +265- 01-776-024
Email: [email protected]
17. MOZAMBIQUE
High Commission of the United Republic of Tanzania,
Av. Dos Martires Da Machava No. 852 Ujamaa House
P.O. Box 4515 Maputo.
Tel: +258-21 490110-3-21
Fax: +258-21 491228
E-mail: [email protected]
Website: www.tanzanrepmoz.net

Pag
e 67
18. NIGERIA
The High Commission of the United Republic Of Tanzania,
16, Yedseram Street, Maitama,
P.M.B. 5125, Wuse
Abuja, Nigeria
Direct Tel: 234-9-4132313
Fax No: 234-9-4132314
E-Mail: [email protected]
19. MALAYSIA
Embassy of the United Republic of Tanzania,
Kuala Lumpur,
44 Jalan U-Thant 55000 Kuala Lumpur.
Tel: +603-42517603/4,
Fax +603-42515641
Email: [email protected]
20. OMAN
Embassy of the United Republic of Tanzania,
Building No. 1798 Way No. 2135
Madinat Al Sultan Qaboos Street
P.O. Box 1170
Zip Code: 133,
Tel: +968-24601174, 24603373
Fax: +968-24604425
E-mail: [email protected]
Website: www.tanrepmuscat.com
21. RUSSIA
Embassy of the United Republic of Tanzania,
Pyatnitskaya Ulista 33, Moscow.
Zip Code: 119017
Tel: +7-495- 953 -8221, 953-0940, 953-4975
Fax: +7-495 -953-0785
E-mail: [email protected]
Website: www.tanzania.ru

Pag
e 68
22. RWANDA
The Embassy of the United Republic of Tanzania,
Boulevard De L’unuganda, Telecom House.
Block C 2nd Floor, Kigali
Tel: +250-505400
Direct: +250- 505401/3
Fax: +250- 505402
E-mail: [email protected]
23. REPUBLIC OF SAUDI ARABIA
Embassy of the United Republic of Tanzania,
Riyadhi, Saudi Arabia, Al Woroud Area,
Ebn Hebt Allah St
P.O. Box 94320 Riyadhi 11693,
Tel: D/L +966-1 -4542 833, 20 51 541, 20 50 310
Fax: +966-1-45 49 660
E-mail: [email protected]
24. REPUBLIC OF SOUTH AFRICA
High Commission of the United Republic of Tanzania,
Pretoria, 822 George Avenue,
Box 56572 Arcadia Pretoria.
Tel: +027-12 3424371 Direct: 342 4393, 342 5921
Fax: +027-12 4304383
E-mail: [email protected]
Website: www.tanzania.org.za
25. SWEDEN
Embassy of the United Republic of Tanzania,
Wallingatan 11,
Box 7255, SE-11160, Stockholm,
Tel: +46 -8 -50320600/1,
Fax: +46 -8 -50320602
E-mail: [email protected]
26. SWITZERLAND
Embassy of the United Republic of Tanzania
47 Avenue Blanc, CH 1201 Geneva.
Tel: +41-22 7318920/9
Res: +41-22 7323752
Fax: +41-22 7328255
E-mail: [email protected]
Pag
e 69
27. UGANDA
The High Commission of the United Republic of Tanzania,
6 Kagera Road
P.O. Box 5750 Kampala.
Tel: +256 – 41- 256272 Direct: +256-41 - 257357
Fax: +256 – 41 – 343973/ 342849
E-mail: [email protected]
28. UNITED ARAB EMIRATES
Embassy of the United Republic of Tanzania,
Abu Dhabi, UAE
No. 56 Al-Nasser Street,
Khalidiya,
P.O. Box 43714,
Abu Dhabi, UAE
Tel: 971 2 660226
Fax No. 971 2 6661613
E-Mail: [email protected]
29. UNITED KINGDOM
The High Commission of the United Republic of Tanzania,
3 Stratford Palace
London W1C, 1AS,
Tel: +44-207 569 470-78
Fax: +44-207 491 3710, +44-207 495 8817
E-mail: [email protected]
Website: www.tanzania-online.gov.uk
30. UNITED NATIONS
The Tanzania Mission to the United Nations,
201 East 42 Street Suite 1700
New York, N.Y.10017, U.S.A.
Tel: General: +1-212 -6992367
Pvt. Line: +1-212 -972 9123
Fax: +1-212- 6825232
E-mail: [email protected]
Website: www.tanzania-un.org

Pag
e 70
31. UNITED STATES OF AMERICA
Embassy of the United Republic of Tanzania,
1232 22nd
Street, N.W, R.ST N.W
Washington D.C. 20037
Tel: +1-202 8841080 /202-939-6125
Fax: +1-202 -7977408
E-mail: [email protected]
32. ZAMBIA
The High Commission of the United Republic of Tanzania,
Ujamaa House, 5200 U.N. Avenue,
P.O. Box 31219
10101 Lusaka
Tel: +260-1-253323/4
Fax: +260-1-254861
E-mail: [email protected]
33. ZIMBABWE
The High Commission of the United Republic of Tanzania,
Ujamaa House, 23 Baines Ave.
P.O. Box 4841Harare
Tel: +263-4-792714
General Line +263-792714/26
Fax: +263-4 -792747
E-mail: [email protected]
Source: Ministry of Foreign Affairs and International Co-operation
Pag
e 71
ORDERING, INFORMATION & LIBRARY
For more information, please contact:
The Director General,
National Bureau of Statistics,
P.O. Box 796,
Dar es Salaam.
Telephone: +255 22 2122722-3 Fax: +255 22 2130852
E-mail: [email protected]
Website: www.nbs.go.tz
The Chief Government Statistician,
Office of Chief Government Statistician,
P.O. Box 874,
Zanzibar.
Telephone: +25524 2231869
E-mail: [email protected]
Website: www.ocgs.go.tz
Or
Visit the Tanzania Government National Website at www.tanzania.go.tz


Vision
To be a preferable source of official statistics in Tanzania
Mission
To facilitate informed decision-making process, through provision of relevant, timely
and reliable user-driven statistical information, coordinating statistical activities and
promoting the adherence to statistical methodologies and standards