The UK and Global Wine Markets by 2025, and Implications ... · Revised July 2017 Wine Economics...
41
www.adelaide.edu.au/wine-econ The UK and Global Wine Markets by 2025, and Implications of Brexit Kym Anderson and Glyn Wittwer Revised July 2017 Wine Economics Research Centre Working Papers Working Paper No. 0217
Transcript of The UK and Global Wine Markets by 2025, and Implications ... · Revised July 2017 Wine Economics...

www.adelaide.edu.au/wine-econ
The UK and Global Wine Markets by 2025, and Implications of Brexit
Kym Anderson and Glyn Wittwer
Revised July 2017
Wine Economics Research Centre
Working Papers Working Paper No. 0217

WINE ECONOMICS RESEARCH CENTRE The Wine Economics Research Centre was established in 2010 by the School of Economics and the Wine 2030 Research Network of the University of Adelaide, having been previously a program in the University's Centre for International Economic Studies. The Centre’s purpose is to promote and foster its growing research strength in the area of wine economics research, and to complement the University's long-established strength in viticulture and oenology. The key objectives for the Wine Economics Research Centre are to:
• publish wine economics research outputs and disseminate them to academia, industryand government
• contribute to economics journals, wine industry journals and related publications• promote collaboration and sharing of information, statistics and analyses between
industry, government agencies and research institutions• sponsor wine economics seminars, workshops and conferences and contribute to other
grape and wine events
Contact details: Wine Economics Research Centre School of Economics University of Adelaide SA 5005 AUSTRALIA Email: [email protected]
Centre publications can be downloaded at: www.adelaide.edu.au/wine-econ/
Information about this paper – was it prepared for a conference/presentation/publication. Any notes/caveats/clarifying points the author(s) may wish to make. Ensure this notes section fits to bottom of page
The University of Adelaide 2

1
UK and global wine markets by 2025,
and implications of Brexit
Kym Anderson
University of Adelaide and Australian National University
and
Glyn Wittwer
Victoria University, Melbourne
July 2017
The authors are grateful for helpful comments from L. Alan Winters, Jancis Robinson, Tamara
Roberts and other participants in a seminar at Chatham House in London on 19 May 2018, and to
both the UK Trade Policy Observatory of the University of Sussex and the Royal Institute for
International Affairs for hosting the seminar. Forthcoming in the Journal of Wine Economics Vol.
12, 2017.

2
Abstract
The UK has accounted for a major share of the world’s wine imports for centuries, and wine
accounts for more than one-third of UK alcohol consumption. It is therefore not surprising that both
suppliers of those imports and UK wine consumers, producers, traders, distributors, and retailers are
focusing on what the UK’s planned withdrawal from the European Union (Brexit) might mean for
them. In this paper a model of the world’s wine markets is used to project those markets to 2025
without, and then with, Brexit. The Brexit scenarios involve adjustment not just to UK and EU27
bilateral tariffs but also to assumed changes to the UK’s income growth and currency. The relative
importance of each of those three components of the initial shock are reported, as are impacts on
bilateral wine trade values and volumes for still and sparkling wines. The results suggest the impact
outside the UK will be minor compared with other developments in the world’s wine markets.
Inside the UK, however, the effect of Brexit on incomes and the pound are likely to have non-trivial
initial impacts on the domestic wine market, and to be far larger than the direct impact of changes in
bilateral tariffs.
Keywords: Brexit; global wine market modeling; preferential trading agreements.
JEL Codes: F15, F14, F13
Author contact:
Kym Anderson
Wine Economics Research Centre
School of Economics
University of Adelaide
Adelaide, SA 5005 Australia

UK and global wine markets by 2025, and
implications of Brexit
I. Introduction
The UK’s planned withdrawal from the European Union (Brexit) will affect markets for
many products, including wine. True, very little wine is produced in the UK (although the
volume is now five times what it was in the 1980s), and wine has accounted on average for
just 0.5% of UK merchandise imports since World War I. Over the past six decades, though,
wine’s share of UK alcohol consumption has steadily risen from 5% to more than one-third,
so wine traders, distributors and retailers as well as consumers are concerned about Brexit’s
potential impact on them. To wine producers and consumers outside the UK, Brexit is
attracting considerable attention too, because the UK has always accounted for a major share
of the world’s wine imports.
To examine how wine markets might be affected by an exit of the UK from the EU, it
is necessary to look beyond just the immediate trade-reducing and trade-diverting effects of
altering bilateral import tariffs that are the focus of the standard comparative static economic
theory of (withdrawal from a) customs unions. Since the process of exiting, establishing new
trading arrangements and adjusting to the altered incentives is expected to spread over many
years, and initially to slow the growth of UK incomes and devalue the pound, one needs to
begin with a projection of how wine markets would have looked without Brexit in several
years and then show how that projected baseline might change under various Brexit scenarios
and a replacement trade agreement between the UK and EU27. We do that using a model of
the world’s wine markets projected to 2025.
The paper begins by briefly reviewing the UK’s historic and present roles in global
wine markets. It then summarizes what trade theory would lead us to expect for a country
leaving a customs union.1 A model of the world’s wine markets is then outlined, along with a
1 As of mid-2017 it was not yet certain that the UK would leave the Single Market or alternatively form a UK-
EU27 customs union, but both would require the UK to retain the EU’s tariff policy and the former would
require the UK also to continue to allow freedom of movement of labour and to remain under the European
Court of Justice, none of which Brexiteers want. We therefore ignore these two possibilities and, following
Rollo et al. (2016) and Smith (2017), assume that the UK will commit to the current EU tariff schedule at the

2
description of the way in which the model projects forward and of how that projection can be
altered to simulate the effects of Brexit and subsequent bilateral trade agreements on the UK
and others. The model’s results of prospective changes to grape and wine markets by 2025
for a baseline case are then summarized, followed by results for a range of alternative
adjustments following Brexit. The final section draws out implications of the findings for
wine markets and their participants in the UK and abroad, both within and outside the EU.
II. Historical Backdrop: Wine in the UK, and the UK in global wine markets
Wine has rarely accounted for more than 2% of UK merchandise imports, and since World
War I it has averaged just 0.5%. Also, prior to 1950 wine accounted for less than 4% of the
volume of alcohol consumed in the UK except briefly in the 1920s, and not much more as a
share of alcohol expenditure. Over the past six decades, though, wine’s share of UK alcohol
consumption has steadily risen, and it now exceeds one-third in both volume and value terms
(Figure 1).
The UK is a very important player in wine trade circles, as it has always accounted for
a major – and often the largest – share of the world’s wine imports. Prior to 1960 the UK’s
share of the value of world imports of wine roughly matched its share for all merchandise:
above 20% in the 19th century, and steadily declining to around 10% by 1960. Since then the
two shares have diverged though, with the all-goods share falling to around 4% while the
wine share climbed back above 20% by the beginning of the present century. And while the
UK’s share of the volume of global wine imports has always been below its value share,
those two shares have converged since 1960 and are now both around 14% (Figure 2).
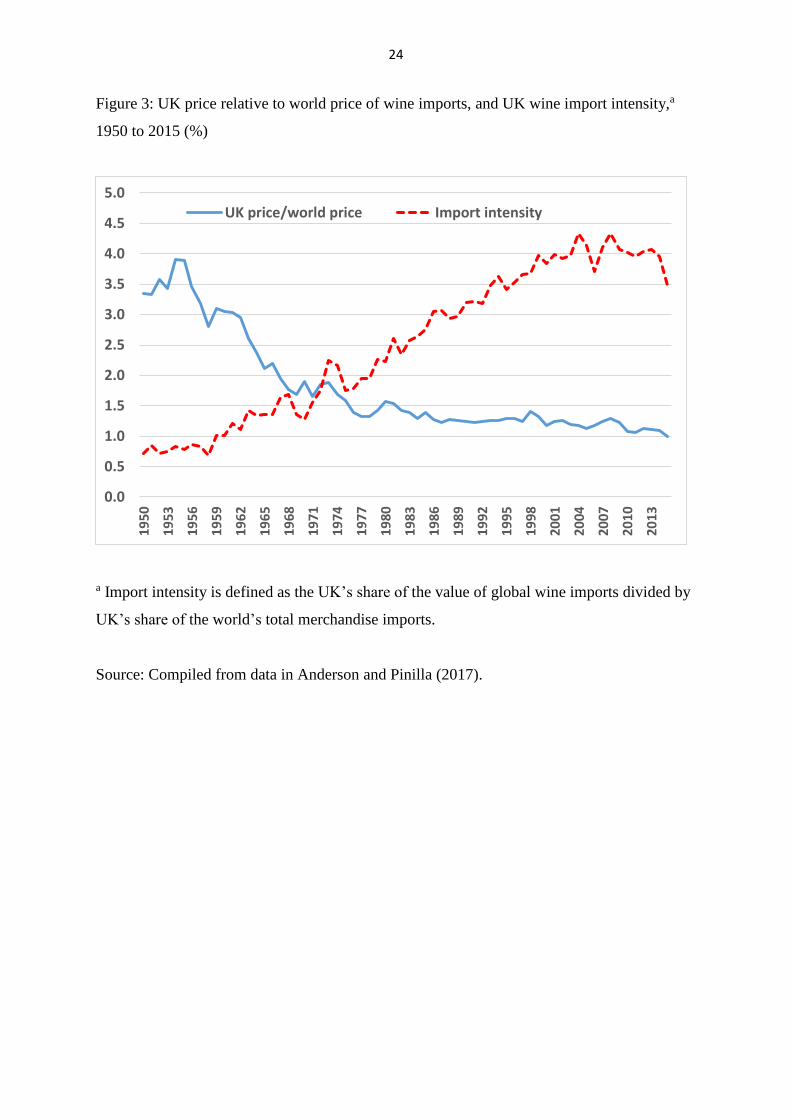
These two trends are summarized in Figure 3: the ratio of the UK’s shares of world
imports of wine to that of all goods rose from 1 to 4 between 1960 and 2000; and the ratio of
the UK’s average import price to the world average has come down from between 3 and 4
pre-1960 (when the UK was mostly importing relatively expensive wines from Bordeaux and
Champagne) to about 1.2 by 1980 and is now close to 1.
WTO in the first instance and then seek a free trade agreement (FTA) with the EU27. Presumably other trading
partners would want to wait and see what that FTA looked like before signing on to a bilateral FTA of their own
with the UK. Deep FTAs normally take several years to negotiate and get ratified by the relevant parliaments,
even when a sufficient number of experienced negotiators are on each side of the table. At present the UK has
very few such negotiators, having delegated that task to the EC in Brussels during the past 45 years of its EU
membership.

3
Associated with the change in the average quality of UK wine imports are dramatic
changes in the importance of different wine-exporting countries in the UK’s imports, and in
the shares of the UK in the wine exports of those countries.
Those recent shares are very different from what they were in 1995, when the New
World was just beginning to expand its wine exports. But such changes are not
unprecedented. Indeed they changed considerably not only because of the changing global
shares of the various wine-exporting countries but also because of changes in the UK’s
preferential trading arrangements such as the Methuen Treaty with Portugal in 1703, the
Cobden-Chevalier Treaty with France in 1860, and the Ottawa Agreement of 1932 with
Commonwealth countries (Tables 1 and 2).
In the middle rows of Table 1 the 2010-14 shares of exporters in the international
market are shown below their shares in the UK markets. For some countries those two sets of
shares are similar (France, Italy, Germany, Chile) while for others they are very different.
The latter is most noticeable for the former colonies of Australia, New Zealand and South
Africa, whose shares in the UK are more than twice their shares in the rest of the world. Both
shares for the EU27 exceed two-thirds. Many commentators expect the EU27 shares to drop
and shares of, e.g., Australia and New Zealand to rise as a consequence of Brexit.
The UK’s recent importance to producers in wine-exporting countries is clear from
Figure 4. For seven key suppliers, the UK accounted in 2010-14 for more than one-sixth of
their wine export earnings, and for three of them (Australia, the US and New Zealand) the
UK was a market for more than one-third of their volume of wine exports.
Recent import duties and other taxes affecting the consumer prices of alcohol in the
UK are summarized in Table 3, expressed per litre of beverage. Both import and excise duties
on wine vary according to their alcohol content. About one-third of UK wine imports arrive
in bulk and perhaps half have less than 13% alcohol, and one-tenth of imports are sparkling,
so the volume-weighted average import duty is 13 pence per litre. This contrasts with the
volume-weighted average excise tax on wine which is 297 pence per litre. To that increase in
the wholesale price is added perhaps a 25% retail margin for off-trade sales and well over a
100% margin for many restaurant sales before the 20% VAT is added. So the average import
price in 2013-15 of 222 pence per litre is escalated to 800 pence for off-trade sales and more
than 1300 pence for on-trade sales (which are about one-fifth of the total sales volume in the
UK). The share of that latter retail price that is due to tariffs on wine imports is thus just 1%.
The change in the UK’s import trade regime from imposing such tariffs on wines currently
imported free of duty from the EU, Chile and South Africa is therefore likely to be very

4
minor. However, as will become clear below, the effect of Brexit on wine sales involves far
more than just the trade-reducing and trade-diverting effects of altering bilateral import
tariffs.
III. The Economics of Leaving a Customs Union
The standard theory of customs unions (Viner 1950) focuses on the fact that when countries
join a union and impose a common external tariff on imports from non-union countries, there
can be net trade creation (depending on the height of the common external tariff relative to
the previous national tariffs), but there will also be trade diversion (because of the preference
to producers within the union). When a country leaves a union, the reverse happens, because
the leaving country’s tariffs will now apply to its imports from union countries as well as
from the rest of the world. Hence imports from the union will fall, because their preferential
access to the leaving country will no longer apply. That is also the case for countries that
enjoyed a free trade agreement (FTA) with the union. Of significance to wine are the EU’s
FTAs with Chile and South Africa.
How large that trade-diverting impact of leaving the union will be on wine depends on
the external tariff imposed on wine imports not only by the union but also by the leaving
country. Some have suggested the UK should become the Hong Kong of Europe and go
immediately to free trade on all products. Others have suggested that this would impose huge
structural changes on the UK economy which society would not tolerate, at least not without
major compensation packages. But both groups agree that a new trade policy which sets
most-favored-nation tariff rates is needed before the UK can begin to negotiate new
preferential trading arrangements with the EU27, its FTA partners such as Chile and South
Africa, or other countries. Rollo et al. (2016) suggest the most practical trade policy for the
UK to adopt at the outset is the EU’s tariff schedules previously agreed to at the World Trade
Organization (WTO). In all but one of the Brexit scenarios examined below, we assume this
will be the new UK trade policy commitment to WTO members, and that subsequent
negotiations for preferential arrangements will take years and any consequent agreements
with the EU and others will be gradually implemented after that.
The impact of leaving a customs union on wine markets comes not only from tariff
changes, however. Also relevant are any effects leaving has on real UK incomes and the
value of the pound. If the UK were to move immediately to free trade on all products (the

5
Hong Kong option), its per capita income could eventually rise, but only after considerable
adjustment. Should instead the UK commit to the current EU tariff schedule at the WTO in
the first instance, as we assume below, then its per capita income growth rate and the pound’s
exchange rates almost certainly will be lower for some time – at least until new trade
agreement negotiations with the EU27 and others are sufficiently advanced as to restore
investor and consumer confidence in the UK economy. How large those impacts will be is
uncertain of course (see Baldwin 2016, and especially Campos 2016), so we consider a range
of possibilities below.
Those assumed adverse macroeconomic effects will add to the initial impact of altered
wine tariffs on aggregate wine consumption in the UK and hence on its bilateral trades in
wine. They will make the loss of sales to the UK by EU (and Chilean and South African)
suppliers greater than would otherwise be the case. And they reduce the likelihood that other
countries’ sales of wine in the UK will be higher than in the baseline. Indeed the macro
effects could outweigh the trade-diverting effects, so that even countries that are currently
discriminated against by the EU28’s wine trade policy may be worse off because of Brexit.
IV. Global Wine Markets Model and Database
Our model of the world’s wine markets, first published by Wittwer, Berger and Anderson
(2003) and revised by Anderson and Wittwer (2013), is summarized in the Appendix. It
disaggregates wine markets into four types, namely non-premium, commercial-premium and
super-premium still wines, and sparkling wine.2 There are two types of grapes, premium and
non-premium. Non-premium wine uses non-premium grapes exclusively, super-premium
wines use premium grapes exclusively, and commercial-premium and sparkling wines use
both types of grapes to varying extents across countries. The world is divided into 44
individual nations and 7 composite geographic regions that capture all other countries.
The model’s database is calibrated to 2014, based on the comprehensive wine market
volume and value data and trade and excise tax data provided in Anderson and Pinilla (2017)
and Anderson, Nelgen and Pinilla (2017). It is projected forward assuming aggregate national
consumption, population, and real exchange rates change between 2014 and 2025 to the
2 Commercial-premium still wines are defined by Anderson, Nelgen and Pinilla (2017) to be those between
US$2.50 and $7.50 per litre pre-tax at a country’s border or wholesale.

6
extent shown in Appendix Table 1.3 The Brexit alternatives to that baseline also are projected
to 2025.
Concerning preferences, there is assumed to continue to be a considerable swing
towards all wine types in China and a swing away from non-premium wines in all other
countries through to 2025.
In our baseline scenario both grape and wine industry total factor productivity are
assumed to grow at 1% per year everywhere, while grape and wine industry capital is
assumed to grow net of depreciation at 1.5% per year in China but zero elsewhere (consistent
with the almost-zero growth in global wine production and consumption over the past two
decades).
Two alternative scenarios are considered (‘large’ and ‘small’) for the initial impact of
Brexit, to provide a range of results. We assume that, because of the UK’s decision to exit the
EU, the rate of UK real GDP growth is only one-third or two-thirds as fast over the projection
period (0.9% or 1.8% per year instead of 2.6%), and the UK pound will be 20% or 10% lower
in real terms than in our model’s core baseline projection.4 In both alternative scenarios it is
assumed the UK applies the EU’s external tariffs on wine from 30 March 2019, at the end of
the 2-year period following the UK’s formal triggering of Article 50 (see Table 3).
We then consider a subsequent impact of Brexit, presumed to result from the
negotiating, signing, implementing and responding to, by 2025, of a free trade agreement
(FTA) with the EU27. (Chile and South Africa both currently have preferential access to EU
wine markets, but we continue to assume in this scenario that the UK does not implement
new bilateral FTAs with them or others in our time frame).5 This subsequent scenario
assumes the pound returns to what it would have been in 2025 in the absence of Brexit, and
3 The real exchange rate changes over the projection period are the changes expected in the nominal value of
country i’s currency relative to the US dollar times the expected ratio of the GDP deflator for the US versus that
for country i. 4 The nominal US$ price of the pound in the fortnight following the Brexit vote on 23 June 2016 dropped 13%
to US$1.30, and a year later the pound sat at the same rate, having dropped to an average of $1.24 (an 18%
devaluation) during Oct 2016 and April 2017. Our choice of a low of 10% and a high of 20% aims to capture
future possible rates while uncertainties remain. The average real wage in the UK fell in the first half of 2017,
and projected real GDP growth during 2018-20 has been revised down to 1.7% in the UK’s latest Budget (HM
Treasury 2017). 5 South Africa currently has duty-free access to the EU28 for just 50 ML of wine per year, beyond which the
MFN tariff rate applies. South Africa currently exports around 320 ML to the EU, one-third of which initially
goes to the UK. How that quota of 50 ML is divided between the UK and EU27 is subject to future negotiation
(Rollo et al. 2016; Swinbank 2017). In what follows we assume none of it is accepted by the UK so that all
South African wine imports pay the UK’s MFN tariff under Brexit, but altering that assumption would make
very little difference to our results for any country’s trade except South Africa’s.

7
that real incomes return two-thirds of the way back to what they would have been without
Brexit as compared with our ‘small’ initial Brexit scenario.
This global model has supply and demand equations and hence quantities and prices
and price elasticities for each of the grape and wine products and for a single composite of all
other products in each country. There are also income elasticities of demand for each final
product. Grapes are assumed to be not traded internationally, but other products are both
exported and imported. Each market is assumed to have been in equilibrium before any
shock, and to find a new market-clearing outcome following any exogenously introduced
shock.
V. Projecting Global Wine Markets to 2025
Global wine production and exports are projected in the baseline from 2014 to 2025
consistent with past trends: the model’s global volume of production (and consumption) rises
little over that 11-year period (9%), made up of a 6% decline in non-premium wine and a
one-sixth rise in commercial and super-premium wine. In real (2014 US$) value though,
global wine output and consumption increase by about 50% in total and 60% in the two
premium categories. The international trade projections are similar although a little larger,
with the share of global wine production exported (= share of global consumption imported)
rising two percentage points between 2014 and 2025.
The baseline projection does not alter greatly the 2014 shares of various countries in
global wine production, apart from China because we assume vineyard expansion there is
faster than elsewhere.6 In value terms that means China moves from 5th to 4th by 2025 behind
France, the US and Italy. Spain remains barely ahead of Australia and they with Germany
take the next three places (Figure 5(a)). In total wine production volume terms, China moves
from 6th to 5th place, and Argentina drops from 5th to 8th (and from 8th to 9th in value terms).
When sub-divided into fine wine (super-premium still plus sparking), commercial
premium wine and non-premium wine, France and the US retain the highest two places on
the global ladder for fine wine production, and Spain and Italy retain the top two places for
non-premium wine. As for commercial premium wine production (defined to be those
6 In fact China’s wine production fell steadily between 2012 and 2016, by a total of one-sixth, so China’s wine
imports may grow faster in practice than in this baseline projection.

8
between US$2.50 and $7.50 per litre pre-tax at a country’s wholesale level or national
border), Italy retains the top ranking over our projections period but, at least in terms of
value, China challenges France for the 2nd place.
The country rankings by projected value of total wine consumption change somewhat
more than those for production by 2025, with China taking second place after the US ahead
of France and Germany, and then the UK slightly overtaking Italy to slip into fifth place
(Figure 5(b)). The US, France and Germany retain the top three rankings for consuming fine
wine, but Canada slightly overtakes Italy for 4th place, in terms of value at least. In the case of
commercial wine consumption, China strengthens its number one position ahead of the US
and the UK does likewise vis-à-vis Germany for 3rd place.
As for the projected changes in consumption volumes, China is projected to dominate
the increase in aggregate, although the US is projected to lead the increase in consumption of
fine wine. In Western Europe and the Southern Hemisphere’s New World countries, fine
wines are projected to substitute for commercial wines (defined as the sum of commercial
premium and non-premium wines) with almost no change in total wine consumption. Sub-
Saharan Africa is the next region that is projected to take off, with its growth accounting for
more than one-third of the rest of the world’s increase in volumes consumed.
Those differences in production versus consumption rankings are reflected in
international trade. Figure 6 shows that France, Italy and Spain remain the three dominant
exporters of wine in aggregate value, but that the rankings of the next few change to Australia
being slightly ahead of Chile, and then the US, Germany and New Zealand being almost
equal 6th place in value terms. France and then Italy are even more dominant in fine wine
exports, and remain so by 2025, while Italy outranks France in the commercial premium
export category, and Spain outranks Italy, Australia and then Chile in the non-premium
export class.
Among the importers the US and UK are projected to continue to hold the first two
places in 2025 in value terms, but China moves into third place slightly ahead of Germany,
followed well behind by Canada, Hong Kong, Belgium-Luxembourg, Netherlands and Japan
(Figure 6(b)). Other Africa (excluding South Africa) is projected to experience the largest
increase in imports of all the other regions, followed by Other Asia which becomes as big as
Germany in value terms (Figure 7(a)). In terms of total volume of wine imports, Germany
and the UK held the top two shares in 2014 but by 2025 the UK is projected to be well ahead
of Germany (Figure 7(b)) – but this projection ignores the effect of Brexit, to which we now
turn.

9
VI. How Might Wine Markets be Affected by an Exit of the UK from the EU?
As mentioned earlier, for our two alternative scenarios to capture the initial effects of Brexit
(‘large’ and ‘small’) we assume that, following the UK’s exit from the EU, the rate of UK
economic growth would be only one-third or two-thirds as fast for the period to 2025, the UK
pound would be 20% or 10% lower in real terms than in our model’s baseline projection, and
the UK would apply the EU’s external tariff on wine to imports from EU member countries
(as part of establishing MFN rates via the WTO in order to then start new bilateral FTA
negotiations). In these initial scenarios it is assumed the UK does not implement any new free
trade agreements, particularly with the EU27, Chile and South Africa. Following the
discussion of those initial results, we present results of a subsequent scenario which is the
implementation of an FTA between the UK and EU27. We assume these are two discrete
steps with no agreed arrangements to smooth the transition between them.
A. Initial impact of Brexit
Since the pound dropped by one-sixth against the US dollar in the four months following the
Brexit vote in June 2016 and the UK’s average real wage fell 1% between November 2016
and April 2017 (latest available data, from ONS 2017), we assumed our ‘large’ scenario was
considered more likely soon after the Brexit vote. But we compare those results with ones
from our ‘small’ initial impact scenario, since it has become more likely following the June
2017 general election as ‘softer’ options are now being considered by the new Government.
Generally the results are about half as big in the ‘small’ scenario, with the exception of the
bilateral trade effects. To show the sensitivity of results to our assumptions, we point out the
differences when the ‘small’ results are not close to half the results shown for the ‘large’
scenario.
Before turning to those results, we first present a ‘free trade’ scenario, which assumes
the UK chooses the radical option of becoming the Hong Kong of Europe. Unlikely though
this scenario is, the results provide assurance that our global wine model generates the
standard types of effects of exiting a customs union. In this ‘free trade’ scenario, the UK is
assumed to move to zero tariffs on all wine imports. Thus the current preferences on EU,
Chilean and South African wine imports disappear as all other wine exporters enjoy the same

10
free access to UK wine markets. We assume in this scenario that Brexit has no impact on the
UK’s real income or consumption growth rates by 2025, and that by then the pound has
returned to its 2014 value relative to other currencies (similar to the real exchange rate
assumed in our baseline scenario to 2025, see Appendix Table A1).7 Under these
assumptions, EU/Chile/South African wine exports to the UK in 2025 are 0.03% less than in
the no-Brexit baseline, UK imports from other wine exporters are 0.25% larger, but the UK’s
total imports of wine are hardly any different (since local wine prices have fallen by only
0.5% and incomes are unchanged). In this scenario UK consumers expand their volume of
consumption by just 0.5%, while the EU27 exports more and other countries export less to
the rest of the world such that world wine exports are almost unchanged. In short, all these
effects are in the direction that comparative static customs union theory would predict, but
they are small because we assumed the UK’s real income and currency would be the same as
in our baseline for 2025 described in the previous section.
In the ‘large’ alternative initial scenario involving Brexit, as compared with the
baseline scenario to 2025, the consumer price of wine in 2025 would be 22% higher in the
UK in local currency terms (20% because of real depreciation of the pound, 4% because of
the new tariffs on EU, Chilean and South African wines, and -2% because of slower UK
income growth). The volume of UK wine consumption would be 28% lower: 16% because of
slower UK economic growth, 7% because of real depreciation of the pound, and 5% because
of the new tariffs. Super-premium still wine sales would be the most affected, dropping by
two-fifths, while sparkling and commercial wines would drop a bit less than one-quarter.
Since the average price rises by more than the fall in the volume sold, the aggregate value of
UK sales even in local currency terms would fall under this ‘large’ Brexit scenario. Under the
‘small’ Brexit scenario, the consumer price of wine in 2025 would be 11% higher in the UK
and its volume of wine consumption would be 17% lower.
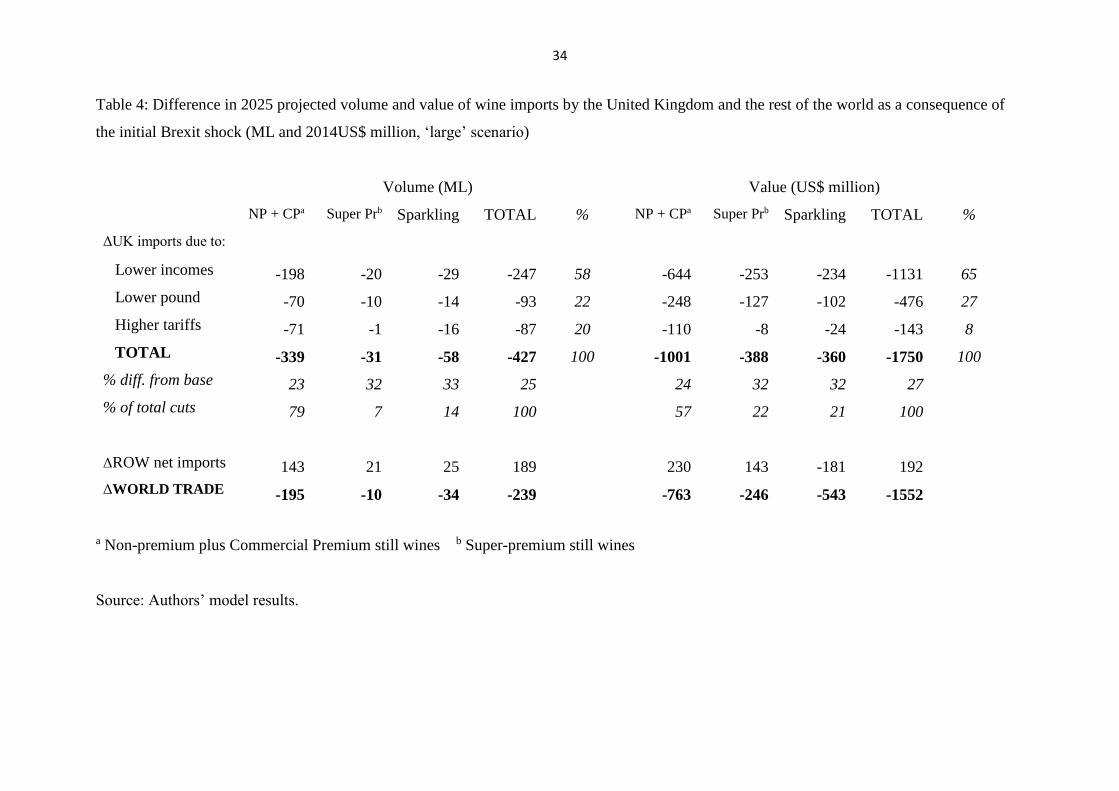
The volume of projected UK imports in 2025 is 427 million litres (ML) or nearly one-
quarter lower in the ‘large’ scenario than in the baseline scenario, comprising 58 ML less
sparkling, 31 ML less super-premium still wine, and 339 ML less commercial wine. World
imports would be lower by just 239 ML because imports by other countries would be 189 ML
higher in response to the international prices of wines being lower in this scenario. In value
7 If this was seen as a credible long-run trade policy, it would encourage more investment that would eventually
raise UK incomes, but not without major structural changes that would initially disrupt the economy. Implicitly
we are assuming in our free trade scenario that these two opposite impacts on real UK incomes and the pound
offset each other by 2025.

11
terms UK imports are $1.75 billion (or 27%) lower in 2025 because of ‘large’ Brexit: $1.13
billion because of lower incomes, $0.38 billion because of the fall in the pound, and $0.14
billion because of the rise in wine import tariffs (Table 4). These aggregate trade impacts are
a little more than half as large under the ‘small’ Brexit scenario.
Despite the levels of imports falling because of raised import tariffs, domestic
consumption of all three quality categories of UK-produced wine is lower with than without
Brexit, because of the shrunken demand for all wines resulting from the lowered UK incomes
and their raised local price because of the devaluation of the pound. The pound’s devaluation
does make it easier for the UK to sell wines abroad though: their exports are 7 ML or nearly
5% higher in 2025 in the ‘large’ Brexit scenario, and UK production is 3% higher. Those UK
exports (or re-exports of imported bulk wine after it is bottled in the UK) that go to EU27
countries are reduced though because of the tariff now imposed at the new EU border.
Without Brexit, the UK’s shares of global wine imports would have been slightly
higher in volume terms in 2025 than in 2010-15, but 2 percentage points lower in value terms
thanks to East Asia’s expanding demand for imports of premium wines. With ‘large’ Brexit,
however, that value share would be a further 2 percentage points lower, and the volume share
would be almost 5 points lower (Figure 8). The net effect of these impacts on global trade are
shown in Figure 9: most of the initial trade effect of Brexit is a large decline in net imports of
wine by the UK with very little offsetting positive effect on trade in the rest of the world. The
‘small’ Brexit numbers are a bit more than half these for ‘large’ Brexit.
The aggregate effect of ‘large’ Brexit on the market shares of various wine-exporting
countries in the UK is almost indiscernible even with one decimal point. The projected 2025
shares are quite different from the actual 2014 shares for several countries. They are much
smaller in 2025 for South Africa, Australia and New Zealand (and the US in volume terms),
and are much larger in volume for Spain and in value for Italy. This is because wine-
exporting countries benefit differentially from the varying rates of growth in net import
demand for wine in non-UK countries over this projection period. The most important
projected changes are the increase in the real value of annual wine imports between 2014 and
2025 by China (200% or $3 billion), Other Asia (110% or $2.2 billion) and Africa (270% or
$1.6 billion). More than half of Australia’s increase in annual exports from 2014 to 2025 go
to Asia, and more than half of South Africa’s increase in exports go to other Africa.
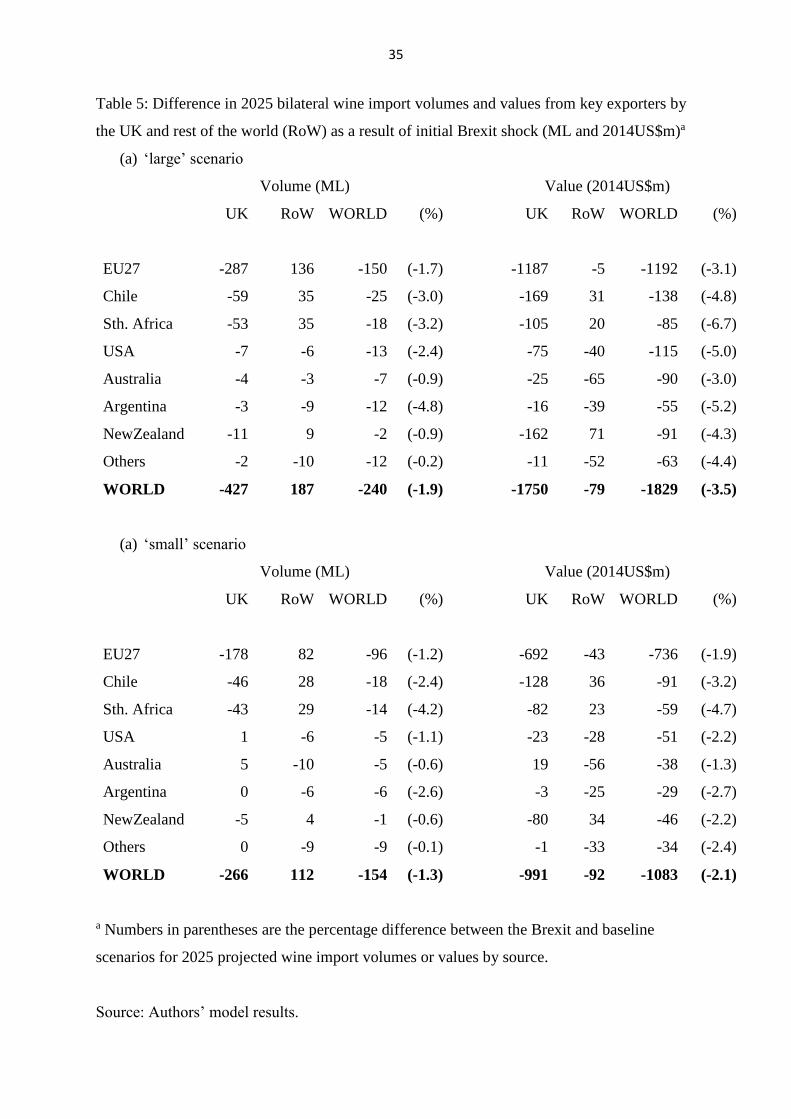
Table 5 reveals that European, Chilean and South African wine exports are lowered
by ‘large’ Brexit, by 150 ML or US$1.2 billion in the case of the EU, with some of their
exports diverted from the UK to EU27 and other markets in competition with New World

12
exporters. While the US, Australia and Argentina sell only a little less into the UK, they sell
less also to other countries. For Chile and South Africa, who lose their preferential access to
UK (but not to EU27) markets in this Brexit scenario, some of their exports are re-directed
from the UK to EU27 countries but again they export less overall. Global wine trade in 2025
would be less under this ‘large’ Brexit scenario by 240 ML (1.9%) or $1.8 billion (3.5%).
The percentage by which wine exporters’ trade shrinks is greater for values than for volumes
because of changes in relative prices of different-quality wines. Those differences are shown
in the numbers in parentheses in Table 5.
Three other points are worth making about Table 5. One is that Australia sells slightly
more to the UK in the ‘small’ Brexit scenario, rather than slightly less as in the ‘large’ Brexit
case. Evidently the negative income and price (devaluation) effects do not more than offset
the positive trade-diverting effect on Australian exports to the UK of removing preferences in
the ‘small’ scenario. Second, New Zealand sells slightly more to non-UK countries under
Brexit, despite greater competition from EU27, Chile and South Africa. This anomaly is due
to changes in the relative prices of different qualities of wine in global wine markets, bearing
in mind that New Zealand has the world’s highest average price for still wine exports. And
third, the value (but not the volume) of exports of ‘Other’ countries to markets other than the
UK is higher under Brexit. This too is due to changes in the relative prices of different
qualities of wine in global wine markets.
B. Subsequent impact of Brexit from a UK-EU27 FTA
The next most-likely step in the Brexit process is for the UK to negotiate a new trade
arrangement with the EU27. We therefore assume that a UK-EU27 FTA with free bilateral
wine trade is implemented and adjusted to by 2025, and that progress toward that end occurs
soon enough that the adverse macroeconomic shocks from the initial impact of uncertainty
over the Brexit process are confined to those assumed in our ‘small’ scenario outlined above.
In this subsequent scenario we assume the pound returns to what it would have been in 2025
in the absence of Brexit (i.e., reversing the 10% devaluation assumed in our ‘small’ initial
Brexit scenario), and that real incomes in the UK are 8% higher in 2025 than in our ‘small’
scenario, that is, they return two-thirds of the way back to what they would have been without
Brexit-related uncertainty.).
This subsequent development in the Brexit process would reverse most of the initial
effects of Brexit by 2025, but not fully because of our assumption that the lost growth in the

13
initial years of uncertainty following the Brexit vote are only partly recovered by 2025
following the implementation of a UK-EU27 FTA. Moreover, the longer it takes before this
FTA is finalized and implemented, the longer will the estimated initial adverse effects persist
and so the larger will be the cumulative cost of Brexit to UK wine consumers and to grape
and wine producers in wine-exporting countries.
Table 6 summarizes the subsequent trade effects for 2025. It suggests that all but one-
tenth of the loss in value of world trade in wine from the initial ‘small’ impact would be
restored, most of it because of a smaller reduction in the UK’s wine imports following the
FTA. Most of that improved outcome is because of recovered imports from EU27,
commensurate with the latter’s high share of UK imports. Even though Chile and South
Africa are assumed in this scenario to have not yet signed an FTA with the UK, they export
slightly more to the UK (and even more to all other countries) than in the initial ‘small’
scenario.
Within the UK, this FTA would bring down the local currency consumer price of
wine by 9%, largely offsetting the 11% rise in the initial ‘small’ Brexit scenario; and it would
raise the volume consumed in the UK by 18%, fully offsetting the 17% fall in the initial
‘small’ Brexit scenario.
In short, this subsequent step in the Brexit process can be expected to restore much of
the initial adverse effects in the UK of the Brexit vote by 2025. For the wine exporters in the
EU27, Chile and South Africa, they too lose less in this as compared with the initial ‘small’
scenario, while other key exporters sell nearly as much in 2025 in this scenario as they were
projected to in the baseline. That is, they are beneficiaries of the reduced discrimination in
global wine markets in this case where Chile and South Africa no longer enjoy preferential
access to the UK market (and even though EU27 producers would again be allowed to do so).
Keep in mind, though, that while the estimated losses in the initial scenarios are reported just
for 2025, they are expected to be felt throughout the preceding years of uncertainty. Hence
the longer it is before the uncertainty abates and the UK’s current preferential trading
arrangements are replaced by new ones such as a UK-EU27 FTA, the higher will be the
cumulative cost of the Brexit vote to the wine trade.
VII. Caveats and Conclusions

14
The above Brexit simulations are just a few of many scenarios that could be modelled.
Obvious additional ones could also assume FTAs are reached between the UK and other
trading partners including Chile and South Africa, and also countries such as Australia and
New Zealand. Some of those other countries are already exploring the European
Commission’s invitation (see EC 2015) to negotiate an FTA with what will be the EU27. The
sequence in which FTAs are signed and the speed with which they are implemented will
matter (as was also the case with the sequential signing over the past decade of bilateral FTAs
with Northeast Asian countries by Chile, Australia and New Zealand, see Anderson and
Wittwer 2015). Even if the UK were able to sign additional bilateral FTAs and begin
implementing them before 2025, it would make very little difference to the above results
(since wine tariffs are a very minor contributor to them) unless those FTAs were to accelerate
UK economic growth and the rise in the value of the pound before 2025.
We have assumed above that no changes are made to alcohol excise duties in the UK
following Brexit, when in fact they are scheduled to be progressively raised with inflation
and may be raised even more for wine relative to spirits to offset the opposite effects of
Brexit on those two domestic industries. Nor have we made any allowance for UK consumer
wine price rises that may be needed to cover the higher cost of clearing customs on imports
from EU27 countries (which may be more or less offset by increased smuggling and duty-
free purchasing). Importers of fine wine, including individuals who buy Bordeaux wines en
primeur, may well reduce their demand because of concerns that delays on docks will affect
the quality of their wine or because of greater currency uncertainty.
To summarize, Brexit will be costly initially to UK consumers of wine (and of many
other tradable products), because the domestic retail price in local currency tax-inclusive
terms would be 22% higher than otherwise in 2025 and the volume of wine consumed
domestically will be 28% lower (in the ‘large’ Brexit scenario, or 11% higher prices and 17%
lower quantities in the ‘small’ case) by 2025, unless a UK-EU27 FTA comes into force
before then. Even if such an FTA does get signed, ratified by all 28+ parliaments and
implemented by 2025, the slower income growth in the interim will mean a smaller UK wine
market in 2025. The volume reduction will be a blow to many participants in UK wine
bottling, transporting, storing, wholesaling and retailing businesses, in addition to restaurants
and pubs. Very little of that initial impact is because of higher import tariffs; most important
is the assumed fall in UK real incomes.
For the small but growing number of local UK vignerons (who supply less than 0.5%
of all domestic wine sales and less than 4% of sparkling wine sales), they are initially

15
projected to sell less wine domestically because of reduced demand, and to export only a little
extra abroad while the pound is devalued. Overall their production is only 3% higher in 2025
even in the ‘large’ Brexit scenario (not taking into account the fact that their casual labor is
likely to be more expensive under Brexit because of tighter restrictions on immigration), and
that will diminish if/when a UK-EU27 FTA is in place.
Even with a UK-EU27 FTA in place, EU27 wine exporters will export US$56 million
less wine in 2025 thanks to Brexit, Chile and South Africa will export $88 million less wine,
while wine exports from the rest of the world will be little different in aggregate although
slightly larger from Australia.
Clearly there will be great uncertainly for some time yet over the possible policy
outcomes to flow from Brexit, and of their consequent sequential impacts on UK household
disposable incomes, foreign exchange rates, and bilateral wine tariffs. Meanwhile, the above
projections under explicit assumptions provide some idea of how wine markets might be
affected by the most-likely first two stages of the Brexit process (agreeing on a new tariff
schedule at the WTO, and agreeing to and implementing a UK-EU27 FTA). In particular,
they make clear that there could be non-trivial initial impacts on the domestic wine market,
effects that are likely to be larger than just the direct impact of changes in bilateral tariffs. If
the UK were to be successful in getting agreement to transition arrangements that delayed the
changes in tariffs until new FTAs were agreed and ratified, the initial effects would be less
dramatic than in our first scenarios, but it remains to be seen whether any such agreements
can be reached. In any event, the net effect of Brexit on the welfare of the world’s consumers
and producers of wine as a whole will be negative not just initially but permanently unless
new trade policy commitments by the UK with major wine-exporting countries are
sufficiently more liberal than current arrangements.
Appendix: Key equations in the Global Wine Markets Model
A model of the world’s wine markets was first published by Wittwer, Berger and Anderson
(2003) and much improved by Anderson and Wittwer (2013). Several significant
enhancements have been to that original model. Wine types have been disaggregated into
more types, namely non-premium (including generic bulk), commercial-premium and super-

16
premium still wines, and sparkling wine.8 As in the original model, there are two types of
grapes, premium and non-premium. Non-premium wine uses non-premium grapes
exclusively, super-premium wines use mainly premium grapes, and commercial-premium
and sparkling wines use both types of grapes. In the regional dimension, the number of
countries and country groups has expanded from ten in the original model to 51 now: 44
individual nations and 7 composite regions. The model’s database is calibrated to 2014 for
this paper, based on data in Anderson, Nelgen and Pinilla (2017), trade data for which are
downloaded from https://comtrade.un.org/. The model’s supply and demand equations are
based on the original ORANI model’s theory (see Dixon et al. 1982), and the model is
implemented using GEMPACK software (Harrison et al. 2014).
An enhancement of importance to the present study is the inclusion of exchange rate
variables in the model. This allows a distinction between price impacts as observed in local
currency units and those observed in 2014 US dollars.
In the model, the grape and wine sectors minimize costs of intermediate inputs subject
to weak CES substitutability between inputs. By assumption, no intermediate inputs are
imported from other countries.9 Hence:
( 1 , / 1 ])[c c
id id id idX f X CES P P (1)
1 . 1 .c c
id id id idc
P X X P (2)
where c
idX is the quantity demanded of commodity c by grape or wine industry i in region d,
c
idP is the corresponding price, and 1idX and 1idP are the respective intermediate composite
quantities and prices.
There are two primary factors employed in the sector: labour (the quantity of which is
endogenous with perfectly elastic supply) and capital. Capital is usually treated as exogenous
in quantity, with rates of return bearing all the adjustment in the various scenarios. This
reflects the fact that both grapes (a perennial crop), and wine plant capacity, adjust slowly to
market signals:
( , [ / ])id id id idL f F CES W PF (3)
( , / ])(id id id idK f F CES R PF (4)
8 Commercial-premium still wines are defined by Anderson and Nelgen (2011) to be those priced between
US$2.50 and $7.50 per litre pre-tax at a country’s border or wholesale. 9 An exception concerns bulk wine imports used mainly in the bottling of commercial premium wine in the UK,
USA, Canada, Japan and Germany.

17
. . .id id id id id idPF F L W K R (5)
Grape and wine producers are assumed to minimize costs subject to CES substitution
between capital and labour. Equations (3) to (5) show primary factor demands for the labour
composite Lid and capital Kid subject to a composite factor demand Fid by industry i in region
d. The factor prices are Wid for labour, Rid for capital rentals and PFid for composite factor
prices.
The composite factor demand Fid is proportional to total output Qid subject to a
primary-factor-using technology Aid. Hence
.id id idF Q A (6)
The perfectly competitive zero pure profit condition is that total revenue, valued at the
output price 0s
iP multiplied by Qid, equals the total production cost:
. . 1 . .0s c c o o
i id id id id id id idc o
P Q P X W L R K (7)
Household demands follow a linear expenditure system in each region. We reduce the
optimizing problem for household consumption of each commodity, subject to a budget
constraint, to equations describing subsistence and discretionary demands. Aggregate
subsistence expenditure WSUBd depends only on consumer prices P3cd for each commodity,
and the number of households N, as per capita subsistence quantities XSUBcd subject to given
preferences are constant.
3 . .d cd cd dc
WSUB P XSUB N (8)
Discretionary expenditures for each commodity (the left-hand side of equation (9))
are equal to the marginal budget share ( cd) of aggregate discretionary expenditure. This
aggregate is the bracketed term on the right-hand side of equation (9), where W3TOTd is
aggregate nominal expenditure:
3 ( 3 . ) ( 3 )cd cd cd d cd d dP X XSUB N W TOT WSUB (9)
Since real aggregate consumption is usually exogenous in our partial equilibrium
simulations, the linear expenditure system determines the consumption shares of individual
final commodities (i.e., the five wine types plus a composite of all other consumption items),
driven by changes in relative prices as faced by domestic consumers. The income elasticity of
demand for each commodity is equal to the marginal budget share divided by the expenditure
share. This varies from 0.5 for non-premium wine to 1.7 for super-premium still wine. The
income elasticity of demand for other consumption is very close to 1.0, because wine

18
accounts for an average of only 0.3 percent of aggregate expenditure globally and no more
than 1.1 percent in any country (Anderson and Nelgen 2011, Table 166).
A feature of our revised model of world wine markets is the inclusion of nominal
exchange rates. These appear directly in the equation linking retail prices ( s
cdP3 ) to producer
prices by country of origin ( 0s
cP ) where c denotes the wine type:
s 0s tar tax mdcd c cd cd cd
s
P3 P T T P
(10)
The exchange rates in the consuming and producing regions are d
and s
respectively,
expressed as local currency units per $US. tar
cdT is the power of the tariff in the consuming
region and tax
cdT the power of the domestic consumption (or excise) tax prior to any generic
value-added or goods-and-services tax. m
cdP is the price of margin m, assumed to be locally
supplied, non-tradable and therefore unaffected by the exchange rate.
A given level of consumption for wine type c (X3cd) is satisfied using the Armington
(1969) assumption, in which wine from different countries of origin are imperfectly
substitutable. First, domestic wine is imperfectly substitutable with a composite of imports:
3 ( 3 , ( 3 / 3 ))ss ss
cd cd cd cdX f X CES P P ss = domestic, imports (11)
and then imports by origin ( 3s
cdX ) are determined in a second CES equation:
" " " "3 ( 3 , ( 3 / 3 ))s ss imports s ss imports
cd cd cd cdX f X CES P P (12)
The model enables us to show how changes in international competitiveness affect the
world’s wine markets. A crucial part of this exercise is explaining how prices determined
outside the grape and wine markets influence these markets. Since the model is partial
equilibrium, in order to depict the impacts of changes in international competitiveness,
outside price changes need to be imposed as shocks on the model. The price of intermediate
inputs other than grapes and wine shown in equations (1) and (2) is set equal to the price of
GDP ( g
dP ) multiplied by a shifter c
dF .
c c g
id d dP F P (13)
If no specific price observations are available, the shifter c
dF remains exogenous and
unshocked, with the change in price being determined by a shock to the price of GDP. If
observations are available for specific input price movements, the shifter c
dF becomes
endogenous, with c
idP now exogenous and shocked.

19
w g
id d dW F P (14)
Wage rates are treated similarly. In equation (14), if the wage shifter w
dF is
exogenous, changes in wage rates idW are determined by changes in the price of GDP. If
wage rate data are available, w
dF becomes endogenous and wage rates are shocked directly.
m m g
cd d dP F P (15)
The prices of trade and transport margins are also determined by the price of GDP if
the shifter m
dF in equation (15) is exogenous.
Changes in international competitiveness depend on changes in relative price levels
and changes in nominal exchange rates. In equation (16), R
s denotes real exchange rate
movements relative to the US dollar:
" "/ [ * ]R g g
s s USA sP P (16)
In (16), the nominal exchange rate for the United States is always unchanged, because
nominal and real exchange rates are expressed relative to the US currency.
Changes in international market conditions may have impacts in one direction on
producer prices as expressed in US dollars 0s
iP and potentially in the opposite direction in
local currency units. Hence, we calculate real producer prices ,
0s
i locP in local currency terms
(i.e., the price most relevant to domestic producers):
, * /0s 0s g
i loc i s sP P P (17)
To obtain real price changes in local currency terms, we convert US dollar prices ( s
cdP3 for
source-specific and cdP3 for the source-composite price) to real local currency prices
( ,
s
cd locP3 and ,cd locP3 ) using the CPI ( c
dP ) as the deflator:
, * /s s c
cd loc cd d dP3 P3 P (18)
and
, * / c
cd loc cd d dP3 P3 P (19)

20
References
Anderson, K. and Nelgen, S. (2011). Global Wine Markets, 1961 to 2009: A Statistical
Compendium. Adelaide: University of Adelaide Press. Also freely available as an e-
book at www.adelaide.edu.au/press/titles/global-wine
Anderson, K., Nelgen, S. and Pinilla, V. (2017). Global Wine Markets, 1860 to 2015: A
Statistical Compendium. Adelaide: University of Adelaide Press (forthcoming). Also
to be freely available as an e-book at www.adelaide.edu.au/press/
Anderson, K. and Pinilla, V. (with the assistance of A. J. Holmes) (2017). Annual Database
of Global Wine Markets, 1835 to 2015. Wine Economics Research Centre, University
of Adelaide, to be posted in October at www.adelaide.edu.au/wine-econ/databases/
Anderson, K. and Strutt, A. (2016). Impacts of Asia’s rise on African and Latin American
trade: Projections to 2030. The World Economy 39(2): 172-94, February.
Anderson, K. and Wittwer, G. (2013). Modeling global wine markets to 2018: Exchange
rates, taste changes, and China’s import growth. Journal of Wine Economics 8(2):
131-58.
Anderson, K. and Wittwer, G. (2015). Asia’s evolving role in global wine markets. China
Economic Review 35: 1-14, September.
Armington, P. A. (1969). A theory of demand for products distinguished by place of
production. IMF Staff Papers 16: 159-78.
Baldwin, R. E. (ed.) (2016). Brexit Beckons: Thinking Ahead by Leading Economists.
VoxEU.org eBook, London: Centre for Economic Policy Research.
Campos, N. F. (2016). Lousy experts: Looking back at the ex ante estimates of the costs of
Brexit’, Ch. 3 in R. E. Baldwin (ed.) Brexit Beckons: Thinking Ahead by Leading
Economists. VoxEU.org eBook, London: CEPR.
Dixon P., Parmenter, B., Sutton, J. and Vincent, D. (1982). ORANI: A Multisectoral Model of
the Australian Economy. Contributions to Economic Analysis 142, Amsterdam:
North-Holland.
EC (2015). Trade for All: Towards a More Responsible Trade and Investment Policy.
Brussels: European Commission.
Harrison J., Horridge, M., Jerie, M. and Pearson, K. (2014). GEMPACK Manual. Melbourne:
GEMPACK Software, ISBN 978-1-921654-34-3.
HM Treasury (2017). Spring Budget 2017. London: HM Treasury, March.

21
Holmes, A. J. and Anderson, K. (2017). Annual Database of National Beverage
Consumption Volumes and Expenditures, 1950 to 2015. Wine Economics Research
Centre, University of Adelaide, to be posted at www.adelaide.edu.au/wine-
econ/databases/
Ludington, C. C. (2013). The Politics of Wine in Britain: A New Cultural History.
Basingstoke and New York: Palgrave Macmillan.
ONS (2017). Analysis of real earnings. London: UK Office of National Statistics, June.
https://www.ons.gov.uk/employmentandlabourmarket/peopleinwork/earningsandwork
inghours/articles/supplementaryanalysisofaverageweeklyearnings/latest
Rollo, J., Borchert, I., Dawar, K., Holmes, P. and Winters, L. A. (2016). The World Trade
Organisation: A safety net for a post-Brexit UK trade policy? Briefing Paper 1,
UKTPO, University of Sussex, July.
http://blogs.sussex.ac.uk/uktpo/files/2017/01/Briefing-paper-1-final-1.pdf
Smith, A. (2017). Brexit: Hard truths and hard choices. UKTPO blog, 19 June, at
https://blogs.sussex.ac.uk/uktpo/2017/06/19/brexit-hard-truths-and-hard-choices/
Swinbank, A. (2017). World trade rules and the policy options for British agriculture post-
Brexit. Briefing Paper 7, UKTPO, University of Sussex, January.
http://blogs.sussex.ac.uk/uktpo/files/2017/01/Briefing-paper-7.pdf
Viner, J. (1950). The Customs Union Issue. New York: Carnegie Endowment for
International Peace.
Wine Australia (2015). Export Market Guide: European Union. Adelaide: Wine Australia,
May.
Wittwer, G., Berger, N. and Anderson, K. (2003). A model of the world’s wine markets.
Economic Modelling 20(3): 487-506, May.

22
Figure 1: Wine’s shares of UK merchandise import value and of volume and value of UK
alcohol consumption,a 1800 to 2015 (%)
a Reliable wine consumption volume data are not available for the 1930s and 1940s, nor are
value of alcohol consumption data pre-1955.
Source: Compiled from data in Anderson and Pinilla (2017) and Holmes and Anderson
(2017).
0
5
10
15
20
25
30
35
40
0.0
0.5
1.0
1.5
2.0
2.5
3.0
3.5
4.0
4.5
5.0
18
00
18
08
18
16
18
24
18
32
18
40
18
48
18
56
18
64
18
72
18
80
18
88
18
96
19
04
19
12
19
20
19
28
19
36
19
44
19
52
19
60
19
68
19
76
19
84
19
92
20
00
200
8
wine % of merch import value (LH)
wine % alcohol consm volume (RH)
wine % alcohol consm value (RH)

23
Figure 2: UK shares of value of world merchandise imports and of value and volume of
world wine imports, 1850 to 2015 (%, 3-year averages to year shown)
Source: Compiled from data in Anderson and Pinilla (2017).
0
5
10
15
20
25
30
18
50
18
56
18
62
18
68
18
74
188
01
88
61
89
21
89
81
90
4
19
10
191
6
19
22
19
28
19
34
19
40
19
46
19
52
19
58
19
64
19
70
19
76
19
82
19
88
19
94
20
00
20
06
20
12
% merch import value
% wine import value
% wine import volume
24
Figure 3: UK price relative to world price of wine imports, and UK wine import intensity,a
1950 to 2015 (%)
a Import intensity is defined as the UK’s share of the value of global wine imports divided by
UK’s share of the world’s total merchandise imports.
Source: Compiled from data in Anderson and Pinilla (2017).
0.0
0.5
1.0
1.5
2.0
2.5
3.0
3.5
4.0
4.5
5.0
19
50
19
53
19
56
19
59
19
62
19
65
19
68
19
71
19
74
19
77
19
80
19
83
19
86
19
89
19
92
19
95
19
98
20
01
20
04
20
07
20
10
20
13
UK price/world price Import intensity

25
Figure 4: Shares of UK in wine exports of key wine-exporting countries, 2010-14 (%)
Source: Compiled from data in Anderson and Pinilla (2017).
0
5
10
15
20
25
30
35
40
45
Volume Value

26
Figure 5: Value of wine production and consumption in key countries, 2014 and projected
baseline for 2025 (2014 US$ million at winery/wholesale pre-tax prices)
(a) Production
(b) Consumption
Source: Authors’ model results.
0
5000
10000
15000
20000
25000
30000
2014 2025
0
5000
10000
15000
20000
25000
USA
FRA
GER
CH
INA
ITA
UK
Oth
er W
E
Oth
er E
E
CA
N
Afr
ica
+ME
AR
G
AU
S
RU
S
JAP
Oth
er L
AC
BEL
BR
A
NLD
SWIS
S
SPN
Oth
er A
sia
HK
CH
ILE
NZL
PO
R
2014 2025

27
Figure 6: Value of wine exports and imports, key wine trading countries, 2014 and projected
baseline for 2025 (2014 US$ million)
(a) Exports
(b) Imports
Source: Authors’ model results.
0
2000
4000
6000
8000
10000
12000
14000
16000
FRA ITA SPN CHILE AUS USA GER NZL POR ARG SAF UK RoW
2014 2025
0
2000
4000
6000
8000
10000
12000
14000
16000
2014 2025

28
Figure 7: National shares of global wine import value and volume, 2014 and projected
baseline for 2025 (%)
(a) Value shares (%)
(b) Volume shares (%)
Source: Authors’ model results.
0
2
4
6
8
10
12
14
16
2014 2025
0
2
4
6
8
10
12
14
16
2014 2025

29
Figure 8: UK shares of world wine imports, 2010-15 and projected to 2025 without and with
the ‘large’ initial Brexit shock (%)
Source: Anderson and Pinilla (2017) and authors’ model results.
0
2
4
6
8
10
12
14
16
2010-15 2025 no Brexit 2025 with Brexit
Volume Value

30
Figure 9: Difference in 2025 wine import volumes and values as a result of the ‘large’ initial
Brexit shock (ML and US$ million in 2014 US dollars)
Source: Authors’ model results.
-1800
-1600
-1400
-1200
-1000
-800
-600
-400
-200
0
200
United Kingdom Rest of World WORLD
Volume Value

31
Table 1: Shares of UK wine imports from today’s key wine-exporting countries, 1675 to 2014 and projected 2025 without and with Brexit (%)
Volume: France Spain Portugal Italy Germany
South
Africa Australia
United
States Chile
New
Zealand Argentina Other
countries Total
1675-1696 25 42 23 1 9 0 0 0 0 0 0 0 100
1697-1862 5 26 49 1 3 2 0 0 0 0 0 14 100
1863-1919 26 26 22 0 0 0 2 0 0 0 0 25 100
1920-1940 12 18 32 0 0 5 14 0 0 0 0 20 100
1995:
volume 32 10 3 18 14 3 7 3 2 1 0 7 100
value 43 9 4 13 10 2 8 3 2 1 0 5 100
2010-14:
volume 15 9 1 17 4 8 21 10 8 4 1 2 100
value 35 8 2 15 4 4 11 5 6 6 1 2 100
Exporters’ share of world wine exports, 2010-14:
volume 15 20 3 22 4 4 7 4 7 2 3 9 100
value 30 9 3 19 4 2 6 4 5 3 3 12 100
2025 projected, no Brexit 100
volume 18.8 18.8 2.6 20.7 4.5 4.5 6.5 4.3 6.4 1.7 2.0 9.2 100
value 32.3 10.0 3.0 21.8 4.4 2.3 5.8 4.4 5.4 4.1 2.0 4.5 100
2025 projected, with Brexit
volume 19.0 18.8 2.7 20.8 4.3 4.4 6.6 4.2 6.3 1.7 1.9 9.3 100
value 31.1 9.6 2.9 21.0 4.1 2.4 5.9 4.4 5.5 4.1 2.0 7.0 100
Source: Compiled from data in Anderson and Pinilla (2017) to 1940, United Nations COMTRADE, https://comtrade.un.org/data/ for 1995-2014,
and authors’ model results for 2025.

32
Table 2: Taxes on British wine imports, by source, 1660 to 1862 (UK Pounds per KL)
France Germany Spain Portugal South Africa
1660-65 7 9 8 8
1666-84 7 9 8 8
1685-91 14 20 19 18
1692-95 22 20 19 18
1696 47 20 19 18
1697-1702 51 25 23 22
1703 52 27 24 23
1704-44 55 31 26 25
1745-62 63 35 30 29
1763-77 71 39 34 33
1778 79 43 38 37
1779 84 41 40 39
1780-81 92 49 44 43
1782-85 96 51 47 46 44
1786 65 51 37 37 37
1787-94 47 51 32 32 37
1795 78 64 51 51 57
1796-97 108 92 71 71 77
1798 111 96 73 73 79
1799-1801 107 92 71 71 77
1802 112 97 74 74 80
1803 131 109 87 87 87
1804 142 117 95 95 95
1805-24 144 119 96 96 96
1825-30 78 50 50 50 25
1831-59 58 58 58 58 29
1860 32 32 32 32 32
1861 16 21 21 21 21
1862 11 26 26 26 26
Source: Summarized from Ludington (2013, Table A1).

33
Table 3: Import duties, excise duties and value-added tax affecting consumer prices of wine
and other alcohol in the UK, 1 April 2017
Value-added tax 20%
MFN import duties on wine: £ per litre
-bottled still wine, <13% alc. 0.114
-bottled still wine, 13-15% alc. 0.134
-bottled still wine, 15-18% alc. 0.162
-bulk still wine, <13% alc. 0.086
-bulk still wine, 13-15% alc. 0.105
-bulk still wine, 15-18% alc. 0.134
-sparkling wine 0.278
Weighted averagea 0.130
Excise duties on alcohol: £ per litre
-still wine, <15% alc. 2.887
-still wine, 15-22% alc. 3.848
-sparkling wine, 5.5-8.5% alc. 2.795
-sparkling wine, 8.5-15% alc. 3.697
-spirits (assumed 40% alc.) 11.551
-beer (assumed 5% alc.) 0.954
Value-added tax on alcohol 20%
a Assumes one-third of UK wine imports arrive in bulk and half have less than 13% alcohol,
and one-tenth of imports are sparkling.
Source: HM Revenue, https://www.gov.uk/government/publications/alcohol-duty-rate-
changes for excise duties and VAT, accessed 9 April 2017, and Wine Australia (2015) for
import duties, converted at the 2016 average exchange rate of £0.740634 per Euro.
34
Table 4: Difference in 2025 projected volume and value of wine imports by the United Kingdom and the rest of the world as a consequence of
the initial Brexit shock (ML and 2014US$ million, ‘large’ scenario)
Volume (ML) Value (US$ million)
NP + CPa Super Prb Sparkling TOTAL % NP + CPa Super Prb Sparkling TOTAL %
ΔUK imports due to:
Lower incomes -198 -20 -29 -247 58 -644 -253 -234 -1131 65
Lower pound -70 -10 -14 -93 22 -248 -127 -102 -476 27
Higher tariffs -71 -1 -16 -87 20 -110 -8 -24 -143 8
TOTAL -339 -31 -58 -427 100 -1001 -388 -360 -1750 100
% diff. from base 23 32 33 25 24 32 32 27
% of total cuts 79 7 14 100 57 22 21 100
ΔROW net imports 143 21 25 189 230 143 -181 192
ΔWORLD TRADE -195 -10 -34 -239 -763 -246 -543 -1552
a Non-premium plus Commercial Premium still wines b Super-premium still wines
Source: Authors’ model results.
35
Table 5: Difference in 2025 bilateral wine import volumes and values from key exporters by
the UK and rest of the world (RoW) as a result of initial Brexit shock (ML and 2014US$m)a
(a) ‘large’ scenario
Volume (ML) Value (2014US$m)
UK RoW WORLD (%)
UK RoW WORLD (%)
EU27 -287 136 -150 (-1.7)
-1187 -5 -1192 (-3.1)
Chile -59 35 -25 (-3.0)
-169 31 -138 (-4.8)
Sth. Africa -53 35 -18 (-3.2)
-105 20 -85 (-6.7)
USA -7 -6 -13 (-2.4)
-75 -40 -115 (-5.0)
Australia -4 -3 -7 (-0.9)
-25 -65 -90 (-3.0)
Argentina -3 -9 -12 (-4.8)
-16 -39 -55 (-5.2)
NewZealand -11 9 -2 (-0.9)
-162 71 -91 (-4.3)
Others -2 -10 -12 (-0.2)
-11 -52 -63 (-4.4)
WORLD -427 187 -240 (-1.9)
-1750 -79 -1829 (-3.5)
(a) ‘small’ scenario
Volume (ML) Value (2014US$m)
UK RoW WORLD (%)
UK RoW WORLD (%)
EU27 -178 82 -96 (-1.2)
-692 -43 -736 (-1.9)
Chile -46 28 -18 (-2.4)
-128 36 -91 (-3.2)
Sth. Africa -43 29 -14 (-4.2)
-82 23 -59 (-4.7)
USA 1 -6 -5 (-1.1)
-23 -28 -51 (-2.2)
Australia 5 -10 -5 (-0.6)
19 -56 -38 (-1.3)
Argentina 0 -6 -6 (-2.6)
-3 -25 -29 (-2.7)
NewZealand -5 4 -1 (-0.6)
-80 34 -46 (-2.2)
Others 0 -9 -9 (-0.1)
-1 -33 -34 (-2.4)
WORLD -266 112 -154 (-1.3)
-991 -92 -1083 (-2.1)
a Numbers in parentheses are the percentage difference between the Brexit and baseline
scenarios for 2025 projected wine import volumes or values by source.
Source: Authors’ model results.

36
Table 6: Difference in 2025 bilateral wine import volumes and values from key exporters by
the UK and rest of the world (RoW) as a result of implementing a UK-EU27 FTA following
initial ‘small’ Brexit shock (ML and 2014US$ million difference relative to initial ‘small’
Brexit scenario)a
Volume (ML) Value (2014US$m)
UK RoW WORLD (‘small’)a
UK RoW WORLD (‘small’)a
EU27 212 -112 100 (-96)
750 0 750 (-806)
Chile 1 3 4 (-18)
3 40 43 (-92)
Sth. Africa 3 2 5 (-14)
3 18 21 (-60)
USA 3 3 6 (-5)
26 21 47 (-50)
Australia 1 1 2 (-5)
8 38 46 (-33)
Argentina 1 4 5 (-6)
4 20 24 (-28)
NewZealand 4 -3 1 (-1)
61 -25 36 (-46)
Others 1 6 7 (-9)
5 -46 -41 (92)
WORLD 226 -96 130 (-154)
860 66 926 (-1022)
a Numbers in parentheses are the world trade differences between the ‘small’ initial Brexit
scenario and the baseline scenario, copied from columns 3 and 7 of Table 5(b).
Source: Authors’ model results.

37
Appendix Table A1: Cumulative consumption and population growth rates and changes in
the real exchange rate (RER) relative to the US dollar, 2014 to 2025 without Brexit (%)
Aggregate
consumption Pop’n
RER
Aggreg.
consm
Pop’n RER
France 18 4 -11 Australia 35 11 -17
Italy 11 2 -9 New Zealand 32 9 -26
Portugal 14 0 -9 Canada 27 8 -18
Spain 26 8 -9 United States 31 8 0
Austria 19 4 -7 Argentina 7 10 109
Belgium 20 7 -9 Brazil 16 8 -29
Denmark 22 2 -9 Chile 55 8 -2
Finland 21 3 -7 Mexico 42 12 -8
Germany 14 -2 -11 Uruguay 45 3 1
Greece 22 -1 -14 Other L. Am 60 10 -5
Ireland 42 12 -9 South Africa 36 12 -1
Netherlands 21 4 -9 Turkey 50 8 20
Sweden 24 9 -13 North Africa 53 11 0
Switzerland 18 8 -6 Other Africa 109 18 84
United Kingdom 32 6 1 Middle East 52 18 -12
Other W. Europe 21 10 -1 China 79 3 5
Bulgaria 41 -7 7 Hong Kong 42 3 2
Croatia 20 -2 -1 India 134 13 17
Georgia 35 0 23 Japan 11 -3 -24
Hungary 25 -3 -11 Korea 38 1 -9
Moldova 49 -11 13 Malaysia 62 15 -16
Romania 45 -4 22 Philippines 75 18 7
Russia 18 -2 -8 Singapore 44 21 -22
Ukraine 22 -5 14 Taiwan 29 1 -13
Other E. Europe 40 -5 48 Thailand 47 3 -9
Other Asia 99 10 10
Source: Authors’ compilation from projections by various international agencies and from
global economy-wide modeling by Anderson and Strutt (2016).