The Tax Foundation, in collaboration with KPMG. Scott Hodge, President, Tax Foundation Hartley...
32
Location Matters: A Comparative Analysis of State Tax Costs on Business The Tax Foundation, in collaboration with KPMG
-
Upload
breana-goley -
Category
Documents
-
view
216 -
download
1
Transcript of The Tax Foundation, in collaboration with KPMG. Scott Hodge, President, Tax Foundation Hartley...

Location Matters: A Comparative Analysis of State Tax Costs on
BusinessThe Tax Foundation, in collaboration with KPMG

Presenters:
Scott Hodge, President, Tax FoundationHartley Powell, Principal, KPMGUlrich Schmidt, Sr. Manager, Global Location and Expansion Services, KPMGGlenn Mair, Director, MMK Consulting
Questions? Contact Richard Morrison, Media Manager, Tax Foundation:

Study Findings in Brief:
Paying state corporate taxes is like buying a car – everyone pays a different price
CarMax states tend to have the lowest tax costs for business

Location Matters…
…Represents the most extensive comparison of real-world corporate tax
costs across the 50 states ever undertaken.

Tax FoundationState and Local Tax Burden Report
Highest Burdens1. New Jersey – 12.2%2. New York – 12.1%
3. Connecticut – 12.0%4. Wisconsin – 11.0%
5. Rhode Island – 10.7%
Lowest Burdens46. Wyoming – 7.8%
47. Tennessee – 7.6%48. South Dakota – 7.6%
49. Nevada – 7.5%50. Alaska – 6.3%
Measures how much a state taxes, i.e. the total tax burden
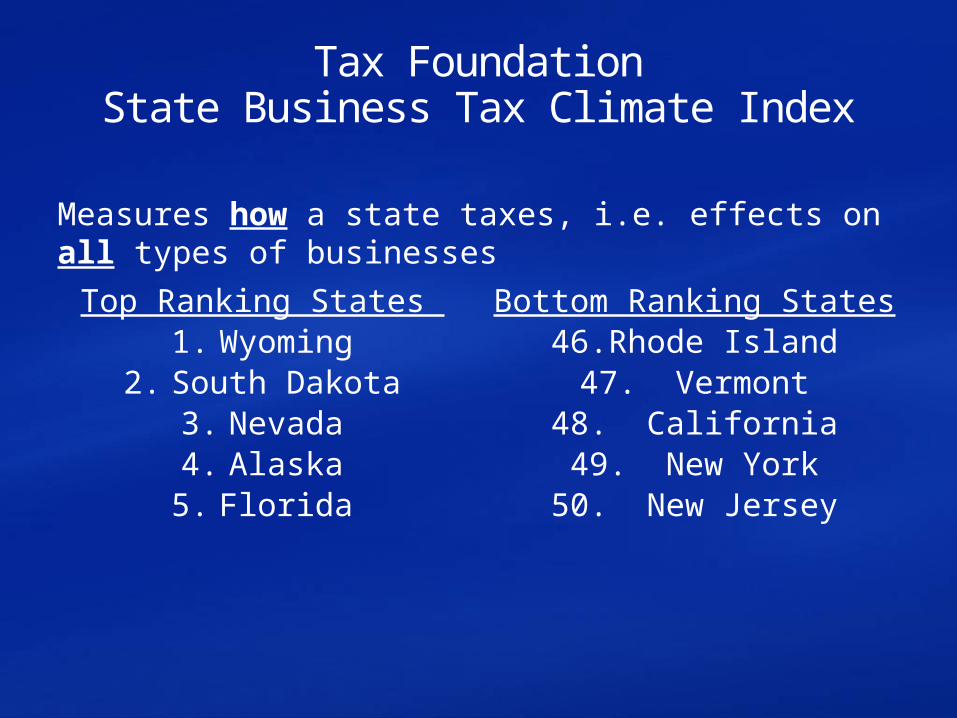
Tax FoundationState Business Tax Climate Index
Top Ranking States 1. Wyoming
2. South Dakota3. Nevada4. Alaska5. Florida
Bottom Ranking States46. Rhode Island
47. Vermont48. California49. New York
50. New Jersey
Measures how a state taxes, i.e. effects on all types of businesses

Location Matters Answers the Bottom-Line Question:
“How Much Will My Company Pay in Taxes?”

Seven Model Firms – Seven Industries:Corporate HeadquartersR&D FacilityIndependent Retail StoreCall CenterDistribution CenterCapital-Intensive Manufacturing (Steel Factory)Labor-Intensive Manufacturing (Truck Factory)
Two Variations of Each Firm: Mature firms – older than 10 years New firms – 3 years old, eligible for incentives

Mobile Corporations Selling Nationally:Mobile and competed for by statesAll C-corporations, not pass-throughs such as LLCs and S-corporationsFirms have property & payroll in home state, while sales are in all other states in proportion to that state’s GDP (except retail)

Two Cities Within Every State
All 50 states & Washington, DC99 Locations:
• Tier 1 Cities – the major city in each state (For Corporate HQ, R&D Facility, Retail Store*)
• Tier 2 Cities – a mid-size city (For Call Center, Distribution Center, Manufacturing*)
* Providence Rhode Island serves for both locations

Calculate the Taxes that matter to business:
Corporate net income taxesGross receipts and franchise taxesProperty taxesUnemployment insurance (UI) taxesSales taxes on business equipment

And, The Most Common Tax Incentives:New jobs creditInvestment creditR&D tax creditPayroll withholding tax rebatesProperty tax abatements

Two Measurement Tools:
Total Effective Tax Rates (TETR) – all state/local taxes divided by pre-tax business profits
Index Scores – ranks state tax burdens against the national average
e.g.: National Average = 100 Score of 120 = 20% above avg.
Score of 80 = 20% below avg.

3 Ways to Compare Corporate Tax Bills:
Differences across 50 states – a “composite” ranking for all 7 firm types
Differences across industries within each state
Differences between new firms (eligible for incentives) and mature firms (no incentives) within each state

Caveats and Limitations
Tax law through April 1, 2011Seven model firms may not represent all businessesRankings and burdens don’t necessarily reflect the quality of a state’s tax system – we make no value judgment here States can achieve similar results in different waysAssumptions matter

Mature Firm Composite ResultsLowest Tax Cost States
1. Wyoming2. South Dakota3. Georgia4. Nevada5. Ohio6. Utah7. North Carolina8. Maryland9. Nebraska10. Louisiana
Why Do They Rank Well?
No corporate income tax – WY, SD, NV, (OH)Low CIT rate – UT, GASingle sales factorNo throwback ruleTop ten index score in multiple firm types – but much variation
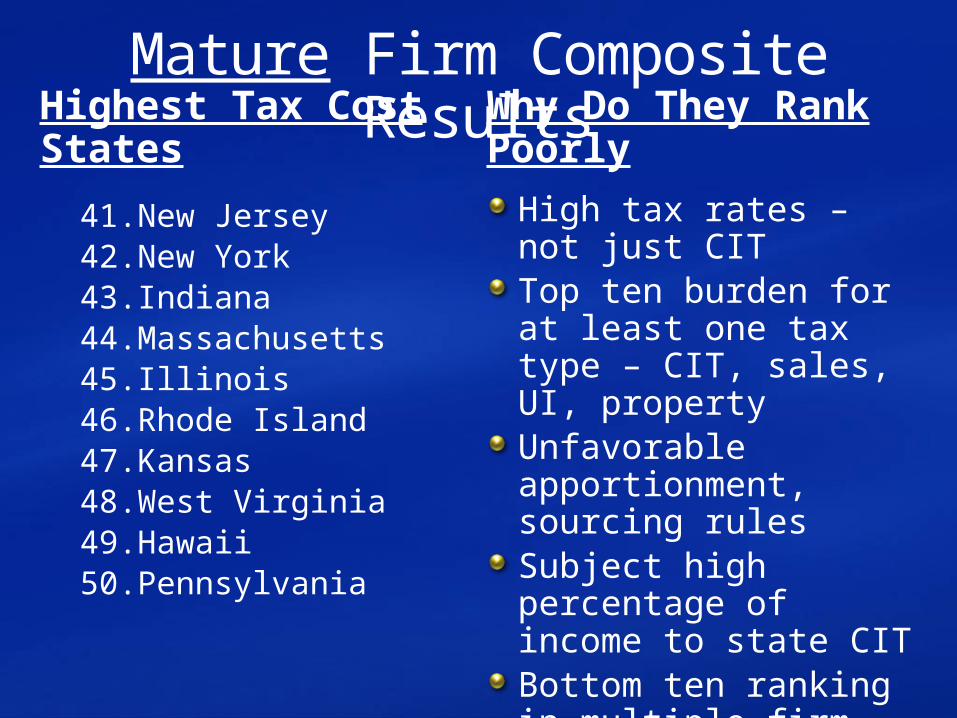
Mature Firm Composite ResultsHighest Tax Cost States
41. New Jersey42. New York43. Indiana44. Massachusetts45. Illinois46. Rhode Island47. Kansas48. West Virginia49. Hawaii50. Pennsylvania
Why Do They Rank PoorlyHigh tax rates – not just CITTop ten burden for at least one tax type – CIT, sales, UI, propertyUnfavorable apportionment, sourcing rulesSubject high percentage of income to state CITBottom ten ranking in multiple firm types

New Firm Composite ResultsLowest Tax Cost States
1. Nebraska2. Louisiana3. Ohio4. Wisconsin5. Oklahoma6. Georgia7. Kentucky8. Arkansas9. Wyoming10. Utah
Why Do They Rank Well?Six states also top-ranked for mature firms (NE, LA, GA, OH, WY, UT)Aggressive with tax incentives (NE, LA, WI, not WY)Incentives moved AR, KY, OK to jump from middle to top

New Firm Composite ResultsHighest Tax Cost States
41. Iowa42. Texas43. Massachusetts44. Rhode Island45. California46. Maryland47. Colorado48. Kansas49. Pennsylvania50. Hawaii
Why Do They Rank PoorlyFive states also worst for mature firms (HI, KS, MA, PA, RI)Maryland – top ten for mature firms, bottom ten for newHigh property taxesHigh sales taxes on equipment & inventoryFew/lack of incentives (TX, CA)
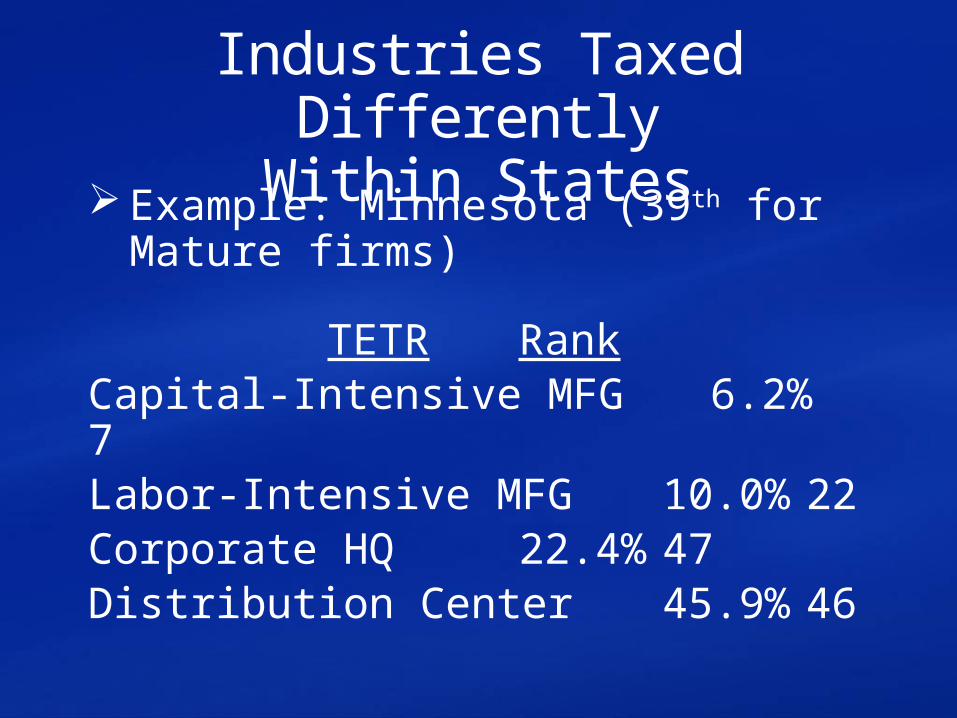
Industries Taxed DifferentlyWithin States
Example: Minnesota (39th for Mature firms)
TETR RankCapital-Intensive MFG 6.2% 7Labor-Intensive MFG 10.0% 22Corporate HQ 22.4% 47Distribution Center 45.9% 46

Wide Variations of Effective Tax Rates Between Mature and New Firms
Nebraska – Call CenterMature: 20.1% New: 1.1%
Louisiana – Capital-Intensive MFGMature: 10.9% New: 1.0%
Arkansas – R&D FacilityMature: 13.6% New: 6.7%

Corporate Headquarters
Mature: Wyoming 1st Pennsylvania 50th
New: Nebraska 1st Pennsylvania 50th

R&D Facility
Mature: Louisiana 1st Pennsylvania 50th
New: Louisiana 1st Pennsylvania 50th

Retail Store
Mature: Wyoming 1st Pennsylvania 50th
New: South Dakota 1st Iowa 50th

Call Center
Mature: South Dakota 1st New Jersey 50th
New: Nebraska 1st West Virginia 50th

Distribution Center
Mature: Wyoming 1st Iowa 50th
New: Ohio 1st Kansas 50th

Capital-Intensive Manufacturing
Mature: Wyoming 1st Hawaii 50th
New: Louisiana 1st Maryland 50th

Labor-Intensive Manufacturing
Mature: Wyoming 1st Hawaii 50th
New: Louisiana 1st Hawaii 50th

Take Aways
There are considerable variations in average corporate tax burdens across the 50 states
There are considerable variations in the tax burdens faced by different firm types within each state
There are often large differences in tax burdens between mature and new firms within each state
CarMax usually has the lowest price

Presenters:
Scott Hodge, President, Tax FoundationHartley Powell, Principal, KPMGUlrich Schmidt, Sr. Manager, Global Location and Expansion Services, KPMGGlenn Mair, Director, MMK Consulting
Questions? Contact Richard Morrison, Media Manager, Tax Foundation:
202-464-5102, [email protected]


State Comparisons are a Bit Like…