THE TAMPA BAY OPERATIONAL FORECAST SYSTEM (TBOFS): MODEL ... · the tampa bay operational forecast...
119
NOAA Technical Report NOS CS 30 THE TAMPA BAY OPERATIONAL FORECAST SYSTEM (TBOFS): MODEL DEVELOPMENT AND SKILL ASSESSMENT Silver Spring, Maryland March 2011 noaa National Oceanic and Atmospheric Administration U.S. DEPARTMENT OF COMMERCE National Ocean Service Coast Survey Development Laboratory
Transcript of THE TAMPA BAY OPERATIONAL FORECAST SYSTEM (TBOFS): MODEL ... · the tampa bay operational forecast...
NOAA Technical Report NOS CS 30 THE TAMPA BAY OPERATIONAL FORECAST SYSTEM (TBOFS): MODEL DEVELOPMENT AND SKILL ASSESSMENT Silver Spring, Maryland March 2011
noaa National Oceanic and Atmospheric Administration U.S. DEPARTMENT OF COMMERCE National Ocean Service Coast Survey Development Laboratory
Office of Coast Survey National Ocean Service
National Oceanic and Atmospheric Administration U.S. Department of Commerce
The Office of Coast Survey (OCS) is the Nation’s only official chartmaker. As the oldest United States scientific organization, dating from 1807, this office has a long history. Today it promotes safe navigation by managing the National Oceanic and Atmospheric Administration’s (NOAA) nautical chart and oceanographic data collection and information programs. There are four components of OCS:
The Coast Survey Development Laboratory develops new and efficient techniques to accomplish Coast Survey missions and to produce new and improved products and services for the maritime community and other coastal users. The Marine Chart Division acquires marine navigational data to construct and maintain nautical charts, Coast Pilots, and related marine products for the United States. The Hydrographic Surveys Division directs programs for ship and shore-based hydrographic survey units and conducts general hydrographic survey operations. The Navigational Services Division is the focal point for Coast Survey customer service activities, concentrating predominately on charting issues, fast-response hydrographic surveys, and Coast Pilot updates.
NOAA Technical Report NOS CS 30
THE TAMPA BAY OPERATIONAL FORECAST SYSTEM (TBOFS): MODEL DEVELOPMENT AND SKILL ASSESSMENT
Eugene Wei and Aijun Zhang
Office of Coast Survey, Coast Survey Development Laboratory, Silver Spring, MD
March 2011
noaa National Oceanic and Atmospheric Administration
U. S. DEPARTMENT National Oceanic and National Ocean Service OF COMMERCE Atmospheric Administration David Kennedy Gary Locke, Dr. Jane Lubchenco Assistant Secretary Under Secretary Administrator Office of Coast Survey Coast Survey Development Laboratory Captain John Lowell, NOAA Mary Erickson
ii
NOTICE
Mention of a commercial company or product does not constitute an endorsement by NOAA. Use for publicity or advertising purposes of information from this publication concerning proprietary products or the tests of such products is not authorized.
iii
TABLE OF CONTENTS
LIST OF FIGURES………………………………………………………………………..……..vi
LIST OFTABLES…………………………………………………………………..…….………ix
EXECUTIVE SUMMARY …………………………………………………………...….............x
1. INTRODUCTION……………………………………………………………………..…..…...1
2. MODEL SYSTEM OVERVIEW……………………………………………………….....…...3 2.1. ROMS Hydrodynamic Model………………………………………………………...…..3
2.2. Model Grid………………………………………………………………….…….….….3 3. MODEL CALIBRATION AND VALIDATION…………………………………….……….7 3.1. Astronomical Tide Simulation………………………………………………...….……..7
3.2. Model Hindcast Simulation…………………………………………………..…..….…14 3.2.1. Water Level and Current Velocity………………………………………………...16 3.2.2. Temperature and Salinity………………………………………………………….19
3.3. Semi-Operational Nowcast/Forecast Simulation……………………………………....25 4. SKILL ASSEESSMENT STATISTICS AND DATA….……………………...…….……....33 4.1. Skill Assessment Statistics.……………………………………………………..…...…33 4.2. Tide Simulation Skills…………………………………………………………..….......33 4.3. Hindcast Skills ..………………………………………………………………..……...36 4.4. Tidal Constituent Comparison……………………..…………………………………..42 4.5. Semi-operational Nowcast/Forecast Skill Assessment………………………....……...42 SUMMARY…………………………………………………………………………….…..…....47
ACKNOWLEDGMENTS……………………………………………………………….........…47
REFERENCES…………………………………………………………………………….….…48
APPENDIX A. ROMS CPPDEFS .…………………………………………………….…..…...51 A.1. Tide Simulation ………………………………………………………………….……51 A.2. Hindcast Simulation………………………………………………………………..….52
APPENDIX B. SKILL ASSESSMENT SCORE TABLES FOR TIDES………………….…....55 APPENDIX C. SKILL ASSESSMENT SCORE TABLES FOR TIDAL CURRENT
SPEED……………………………………………………………………....…..59 APPENDIX D. SKILL ASSESSMENT SCORE TABLES FOR HINDCAST WATER
LEVELS…………………………………………………..…………………….69 APPENDIX E. SKILL ASSESSMENT SCORE TABLES FOR HINDCAST CURRENT
SPEED………………………………………………………………………….73
iv
APPENDIX F. SKILL ASSESSMENT SCORE TABLES FOR HINDCAST TEMPERATURE………………………………………………..……………...83
APPENDIX G. SKILL ASSESSMENT SCORE TABLES FOR HINDCAST SALINITY…………………..…………………………………………………..91 APPENDIX H. COMPARISON OF TIDAL CONSTITUENT AMPLITUDES AND EPOCHS FOR
CURRENTS ……………………………………………………………………93 APPENDIX I. SKILL ASSESSMENT SCORE TABLES FOR SEME-OPERATIONAL
WATER LEVELS …………………………..………..…………………….…..95 APPENDIX J. SKILL ASSESSMENT SCORE TABLES FOR SEME-OPERATIONAL
CURRENT SPEEDS AND DIRECTIONS…………………………….…..…..99 APPENDIX K. SKILL ASSESSMENT SCORE TABLES FOR SEME-OPERATIONAL
SURFACE TEMPERATURE……………………………………..……...…..103 APPENDIX L. SKILL ASSESSMENT SCORE TABLES FOR SEME-OPERATIONAL
SURFACE SALINITY……………………..……………………….………..105
v
LIST OF FIGURES Figure 1. Tampa Bay base map………………………………………………………………..4 Figure 2. Tampa Bay ROMS model grid…...............................................................................5 Figure 3.1. TOP water level gage station location map…………………………………………8 Figure 3.2. TOP current meter station location map…………………………………………….9 Figure 3.3. Tide elevation time series from tide simulation (black) compared with
harmonic predicted tides (red) for upper bay (left panel) and coastal and lower bay (right panel) stations……………..………………………..……….……10
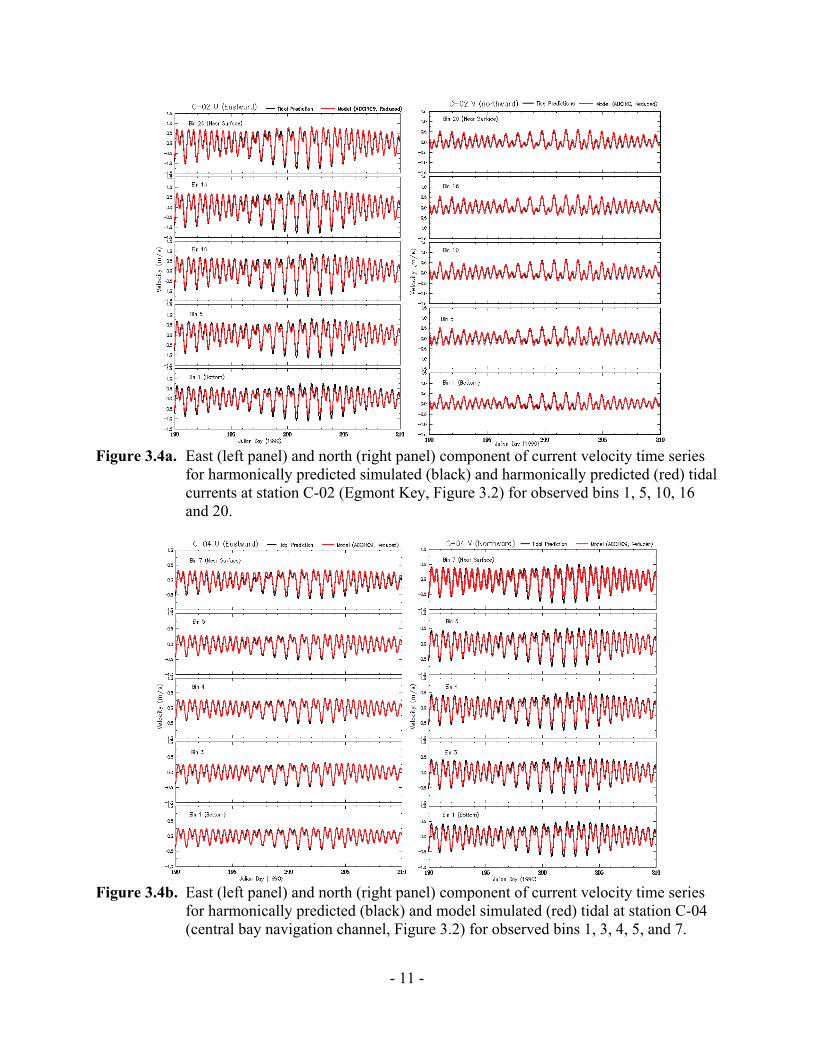
Figure 3.4a. East (left panel) and north (right panel) component of current velocity time series for harmonically predicted simulated (black) and harmonically
predicted (red) tidal currents at station C-02 (Egmont Key, Figure 3.2) for observed bins 1, 5, 10, 16 and 2 .…………………………………………………..11 Figure 3.4b. East (left panel) and north (right panel) component of current velocity time series for harmonically predicted (black) and model simulated (red)
tidal at station C-04 (central bay navigation channel, Figure 3.2) for observed bins 1, 3, 4, 5, and 7 ………………………………..…………..……..…11
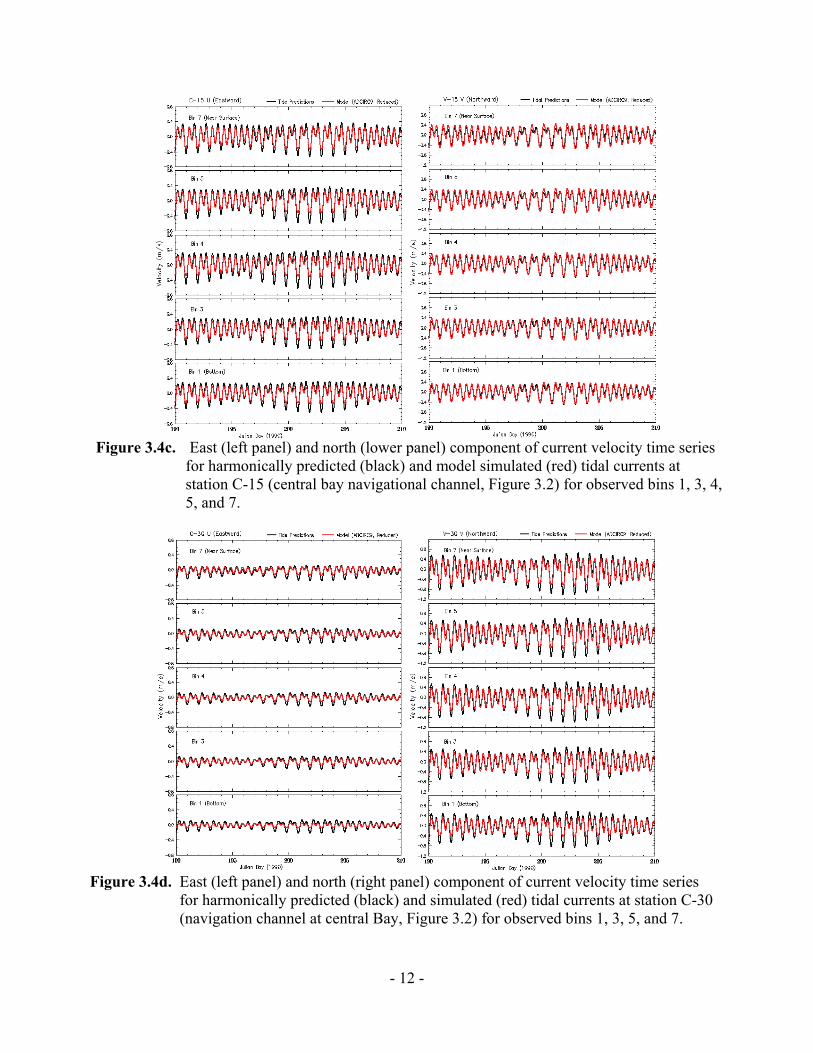
Figure 3.4c. East (left panel) and north (lower panel) component of current velocity
time series for harmonically predicted (black) and model simulated (red) tidal currents at station C-15 (central bay navigational channel, Figure 3.2) for observed bins 1, 3, 4, 5, and 7……..………………………...…….………..….12
Figure 3.4d. East (left panel) and north (right panel) component of current velocity time series for harmonically predicted (black) and model simulated (red) tidal currents at station C-30 (navigation channel at central Bay, Figure 3.2) for observed bins 1, 3, 5, and 7.……………………….………………..….…....…12 Figure 3.5. Averaged tidal currents over 30 days simulation (August, 1990). Left:
near surface. Right: Bottom……………………….………………………………13 Figure 3.6. Major river inflows for synoptic hindcast simulation……………………..…….…15 Figure 3.7. Water elevation at TOP stations; hindcasts (red) compares with
observations (black) ……………………………..…………………………......….16
vi
Figure 3.8a. East (left) and north (right) component of hindcast current velocity time series at station C-02 (bay entrance)………………………….………………17
Figure 3.8b. East (left) and north (right) component of hindcast current velocity
time series at station C-04 (mid-bay)…………….….………………………….….17 Figure 3.8c. East (left) and north (right) component of hindcast current velocity time series at station C-15 (upper mid-bay)…………..………………………...….18 Figure 3.8d. East (left) and north (right) component of hindcast current velocity time series at station C-30 (upper bay) ………………............................................18 Figure 3.9. TOP temperature and conductivity sensor locations………………………..……..19 Figure 3.10a. Model simulated (red) near surface temperature time series with
observations (black) for stations near bay entrance area (See Figure 3.9 for station locations).……………………………………..……………………….…20
Figure 3.10b. Model simulated (red) near surface temperature time series with
observations (black) near the center of the bay and Manatee Channel (See Figure 3.9 for station locations).………………………………………..…..21
Figure 3.10c. Model simulated (red) near surface temperature time series with
observations (black) at Y-Cut channel and Hillsborough Bay (See Figure 3.9 for station locations)………………………...…….…………….22
Figure 3.10d. Model simulated (red) near surface temperature time series with
observations (black) at Old Tampa Bay (See Figure 3.9 for station locations) .…………………………………………………...………23
Figure 3.11. Model simulated (red) near surface salinity time series with observations (black) for stations from the entrance (02, S1, and 21) to mid-bay (52 and 53) and upper bay (30, 46, and 34) (see Figure 3.9
for station location)………….………………………………………………..….24 Figure 3.12. Schematic TBOFS run script and data flow chart…………………………....….26 Figure 3.13. Real-time observation locations for TBOFS semi-operational nowcasts
and forecasts verification for surface temperature and salinity…………….....…27 Figure 3.14. Water level comparison of observations (black) with semi-operational nowcasts (red) and forecasts (blue) at 4 NOS real-time locations: Mckay Bay Entrance, Old Port Tampa, St. Petersburg, and Port Manatee…...…28
vii
Figure 3.15. Currents comparison of observations (black) with semi-operational nowcasts (red) and forecasts (blue) at 2 NOS real-time locations: Sunshine Skyway Bridge and Old Port Tampa…………………………………26 Figure 3.16. Observed (black) temperature time series with semi-operational nowcasts (red) and forecasts (blue) at real-time locations: Buoy 42013 (NDBC), St. Petersburg (NOS), and Campbell Park and Frog Creek (Terra Ceia Aquatic Preserve, via NBDC) for the period from April 15 to July 14, 2010…………………….………….……………...….30 Figure 3.17. Observed (black) temperature time series with semi-operational
nowcasts (red) and forecasts (blue) at real-time location Buoy 42013 (NDBC) for the period from April 15 to July 14, 2010………….……....31
Figure 4.1. Central Frequency (CF) and Root Mean Squared Error (RMSE)
of tide from tide simulation……………………………………………..………34 Figure 4.2. Central Frequency (CF) and Root Mean Squared Error (RMSE)
of tidal current speed (at NOS tide prediction depth: 5 m below the surface or mid-depth) from tide simulation.....................................................35
Figure 4.3. Central Frequency (CF) and Root Mean Squared Error (RMSE)
of water level from hindcast simulation................................................................39
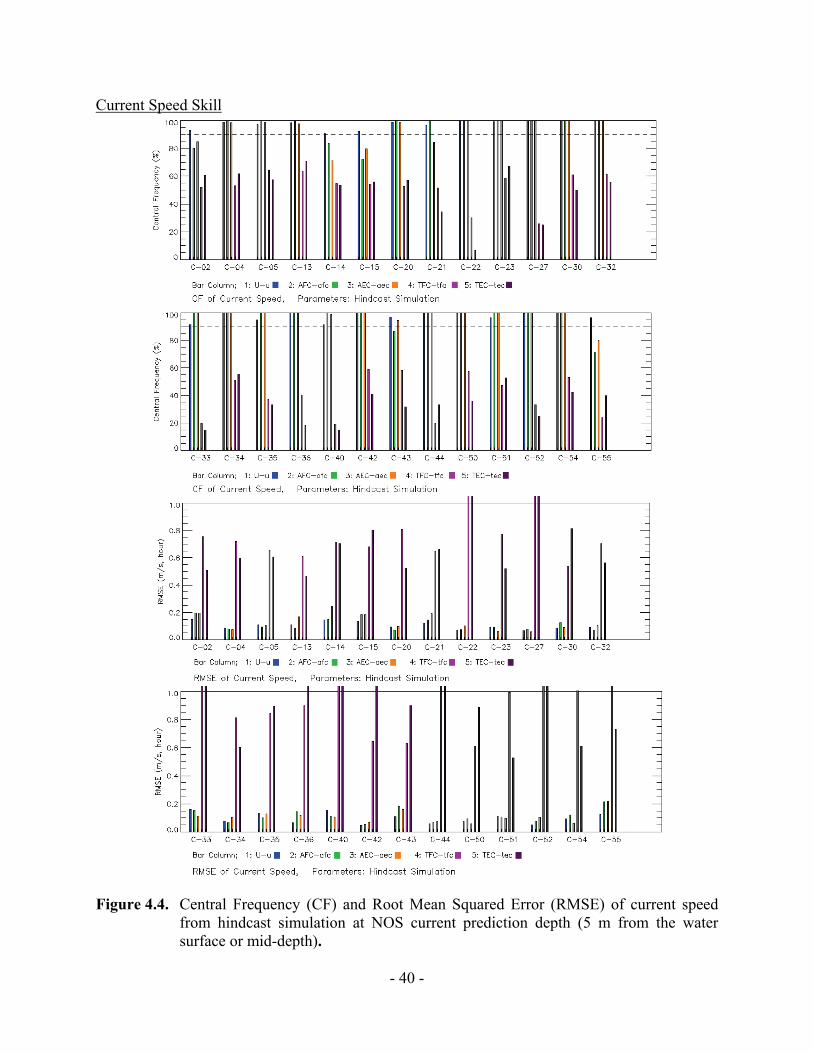
Figure 4.4. Central Frequency (CF) and Root Mean Squared Error (RMSE) of current speed from hindcast simulation at NOS current prediction depth (5 m from the water surface or mid-depth).................................................40
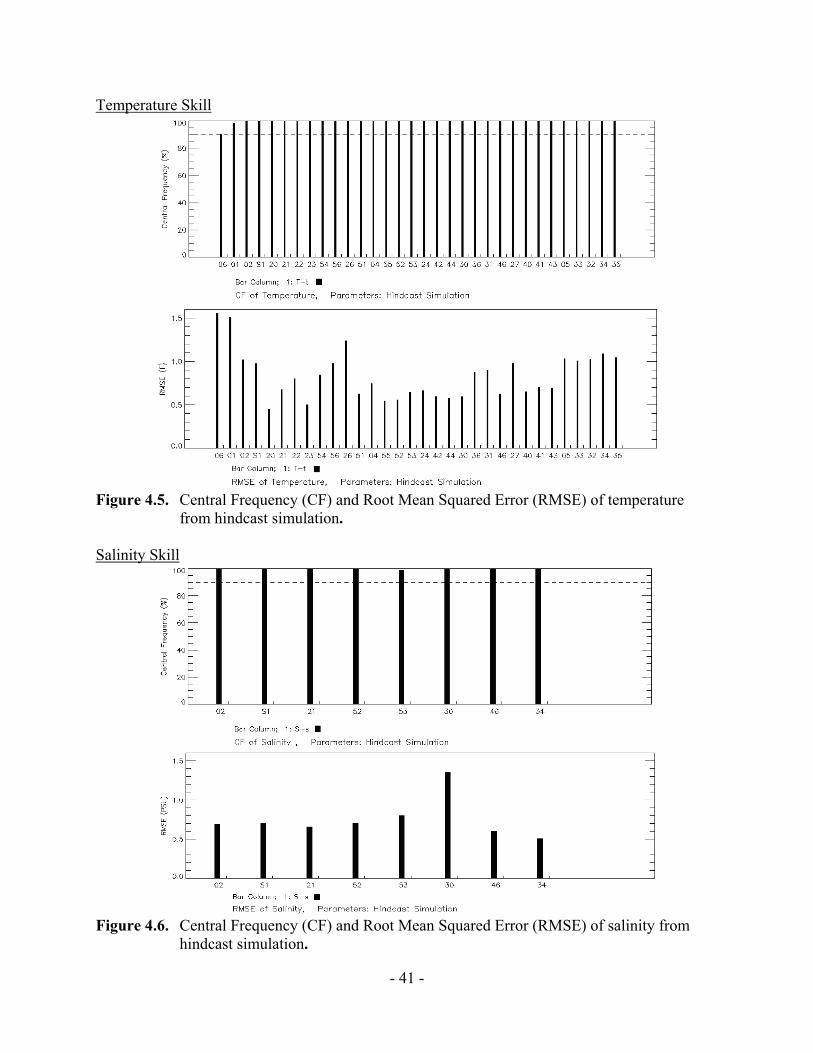
Figure 4.5. Central Frequency (CF) and Root Mean Squared Error (RMSE)
of temperature from hindcast simulation...............................................................41 Figure 4.6. Central Frequency (CF) and Root Mean Squared Error (RMSE)
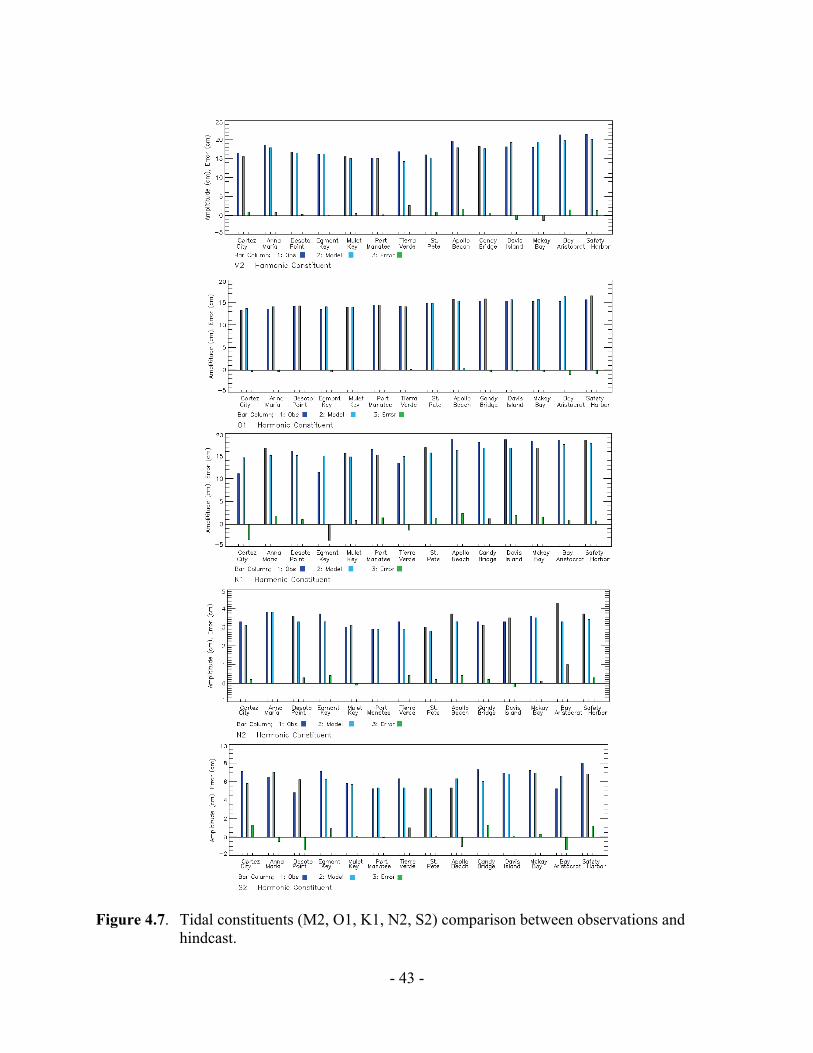
of salinity from hindcast simulation......................................................................42 Figure 4.7. Tidal constituents (M2, O1, K1, N2, S2) comparison between
observations and hindcast…..................................................................................43
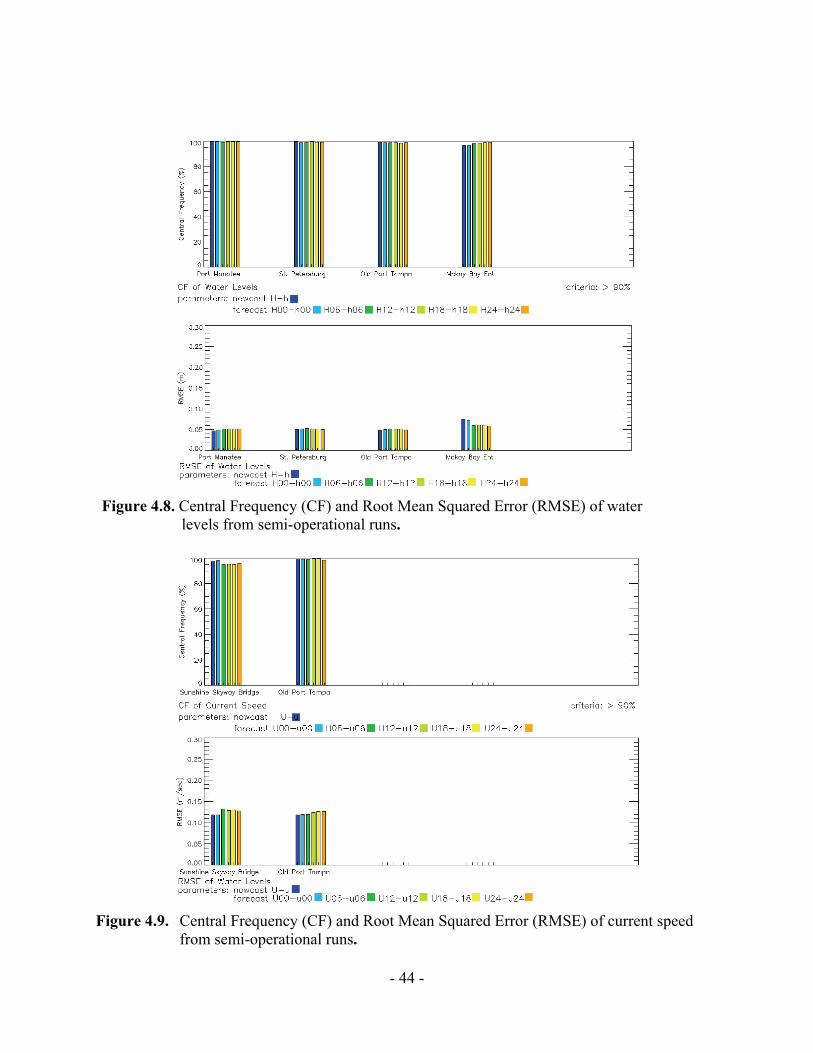
Figure 4.8. Central Frequency (CF) and Root Mean Squared Error (RMSE) of water levels from semi-operational runs…………………………………...…44
Figure 4.9. Central Frequency (CF) and Root Mean Squared Error (RMSE)
of current speed from semi-operational runs……………………………….……44
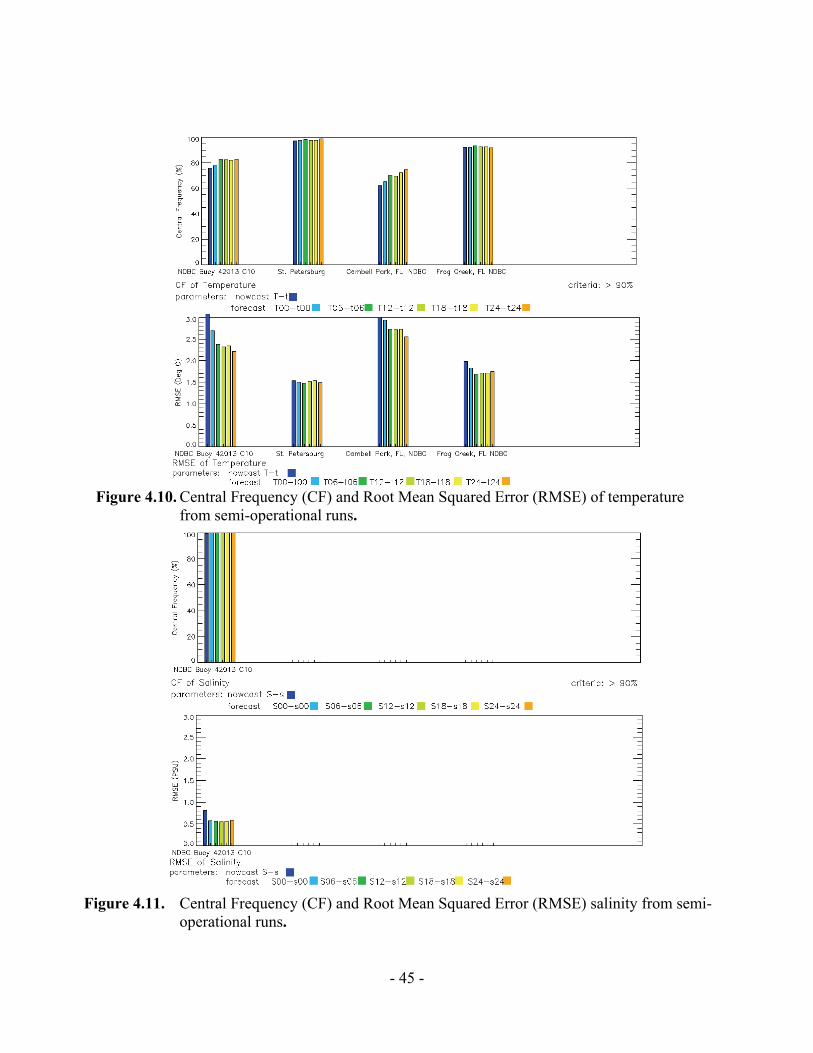
Figure 4.10. Central Frequency (CF) and Root Mean Squared Error (RMSE) of temperature from semi-operational runs………………………………………45
viii
Figure 4.11. Central Frequency (CF) and Root Mean Squared Error (RMSE) of salinity from semi-operational runs………………………………………….45
ix
LIST OF TABLES Table 1. Hindcast water level skill assessment statistics: RMSE (m), CF (%),
NOF (%), POF(%), and index of agreement (SKILL). NOS error criteria X=15 cm………...........................................................................................................36
Table 2. Hindcast current speed skill assessment statistics: RMSE (m s-1), CF (%),
NOF (%), and POF (%), and index of agreement (SKILL). NOS error criteria X=26 m s-1…………………………………………………………………………...37
Table 3. Hindcast temperature skill assessment statistics: RMSE (0C for temperature),
CF (%), NOF (%), and POF (%) , and index agreement (SKILL). NOS error Criteria X=3 0C……………………………................................................................38
Table 4. Hindcast salinity skill assessment statistics: RMSE (PSU), CF (%),
NOF (%), and POF (%) , and index agreement (SKILL). NOS error criteria X=3.5 PSU……………………………………………………………...…...39
x
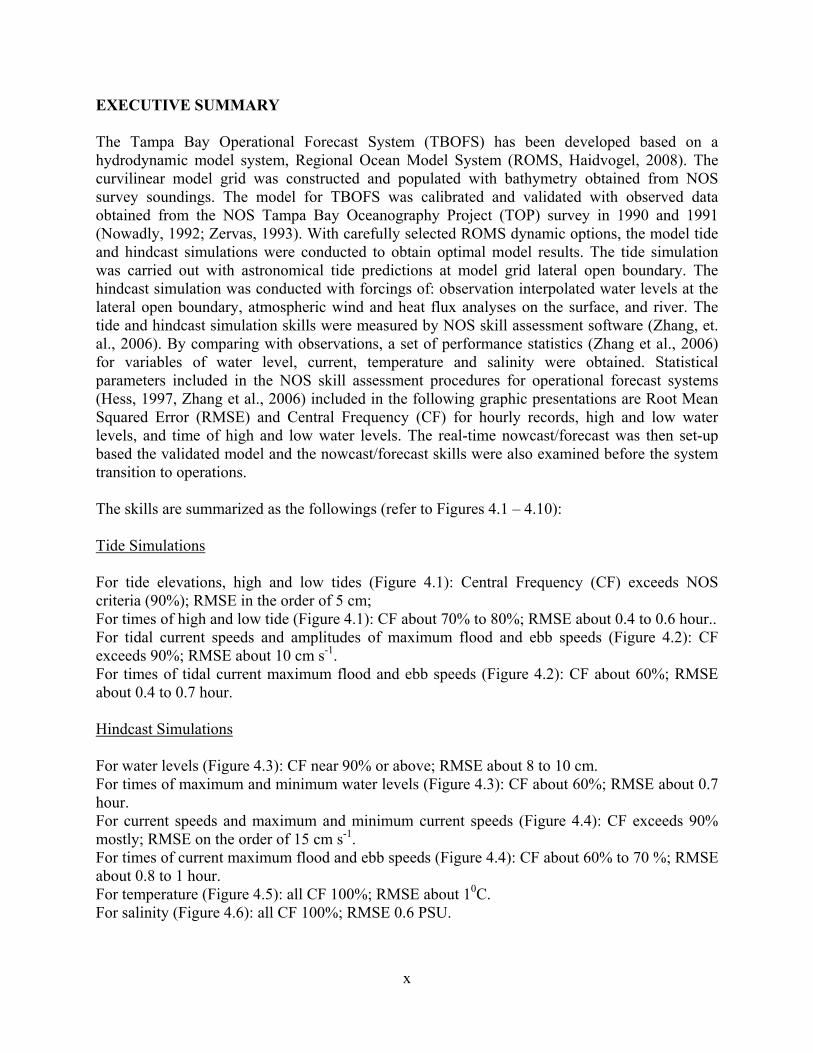
EXECUTIVE SUMMARY The Tampa Bay Operational Forecast System (TBOFS) has been developed based on a hydrodynamic model system, Regional Ocean Model System (ROMS, Haidvogel, 2008). The curvilinear model grid was constructed and populated with bathymetry obtained from NOS survey soundings. The model for TBOFS was calibrated and validated with observed data obtained from the NOS Tampa Bay Oceanography Project (TOP) survey in 1990 and 1991 (Nowadly, 1992; Zervas, 1993). With carefully selected ROMS dynamic options, the model tide and hindcast simulations were conducted to obtain optimal model results. The tide simulation was carried out with astronomical tide predictions at model grid lateral open boundary. The hindcast simulation was conducted with forcings of: observation interpolated water levels at the lateral open boundary, atmospheric wind and heat flux analyses on the surface, and river. The tide and hindcast simulation skills were measured by NOS skill assessment software (Zhang, et. al., 2006). By comparing with observations, a set of performance statistics (Zhang et al., 2006) for variables of water level, current, temperature and salinity were obtained. Statistical parameters included in the NOS skill assessment procedures for operational forecast systems (Hess, 1997, Zhang et al., 2006) included in the following graphic presentations are Root Mean Squared Error (RMSE) and Central Frequency (CF) for hourly records, high and low water levels, and time of high and low water levels. The real-time nowcast/forecast was then set-up based the validated model and the nowcast/forecast skills were also examined before the system transition to operations. The skills are summarized as the followings (refer to Figures 4.1 – 4.10): Tide Simulations For tide elevations, high and low tides (Figure 4.1): Central Frequency (CF) exceeds NOS criteria (90%); RMSE in the order of 5 cm; For times of high and low tide (Figure 4.1): CF about 70% to 80%; RMSE about 0.4 to 0.6 hour.. For tidal current speeds and amplitudes of maximum flood and ebb speeds (Figure 4.2): CF exceeds 90%; RMSE about 10 cm s-1. For times of tidal current maximum flood and ebb speeds (Figure 4.2): CF about 60%; RMSE about 0.4 to 0.7 hour. Hindcast Simulations For water levels (Figure 4.3): CF near 90% or above; RMSE about 8 to 10 cm. For times of maximum and minimum water levels (Figure 4.3): CF about 60%; RMSE about 0.7 hour. For current speeds and maximum and minimum current speeds (Figure 4.4): CF exceeds 90% mostly; RMSE on the order of 15 cm s-1. For times of current maximum flood and ebb speeds (Figure 4.4): CF about 60% to 70 %; RMSE about 0.8 to 1 hour. For temperature (Figure 4.5): all CF 100%; RMSE about 10C. For salinity (Figure 4.6): all CF 100%; RMSE 0.6 PSU.

xi
Semi-operational Nowcasts/Forecasts For water levels and current speed nowcasts and all forecast hours (Figures 4.8 and 4.9): CF near 100%; RMSE 5 cm and 13 cm s-1. For surface temperature (Figure 4.10): CF 80 –92%; RMSE 1.5 – 2.5 0C. For surface salinity (Figure 4.11): CF 100%; RMSE 0.5 PSU.

xii
- 1 -
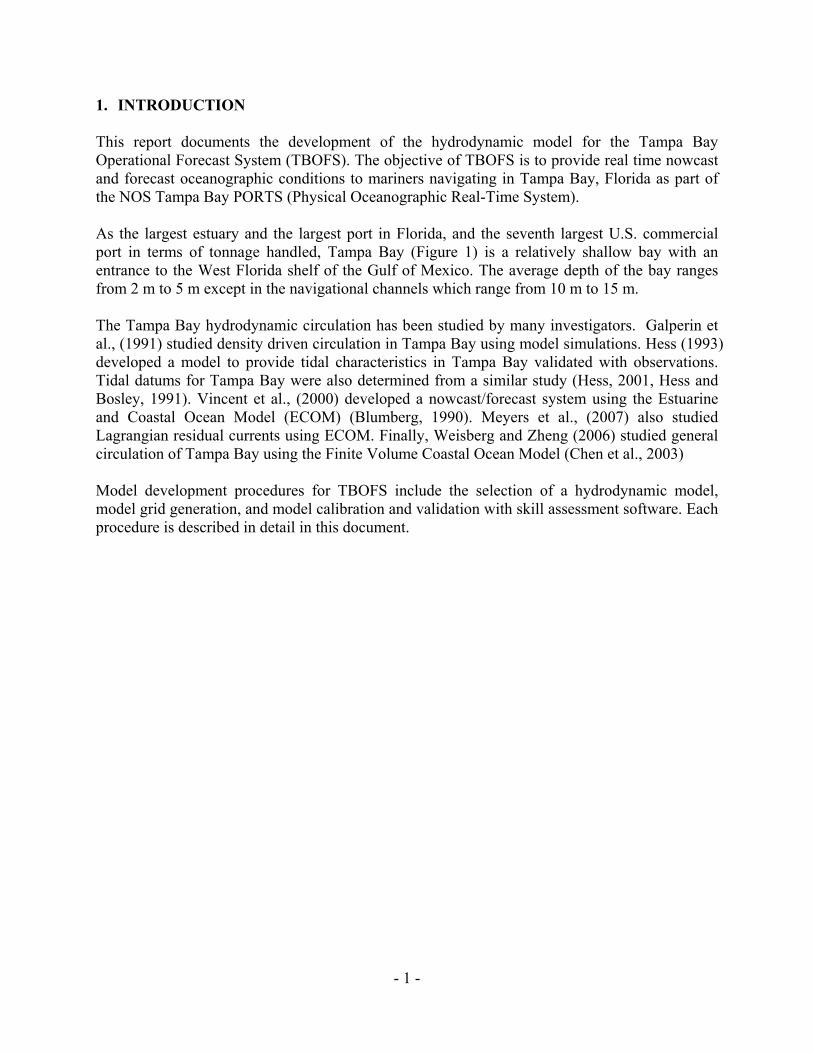
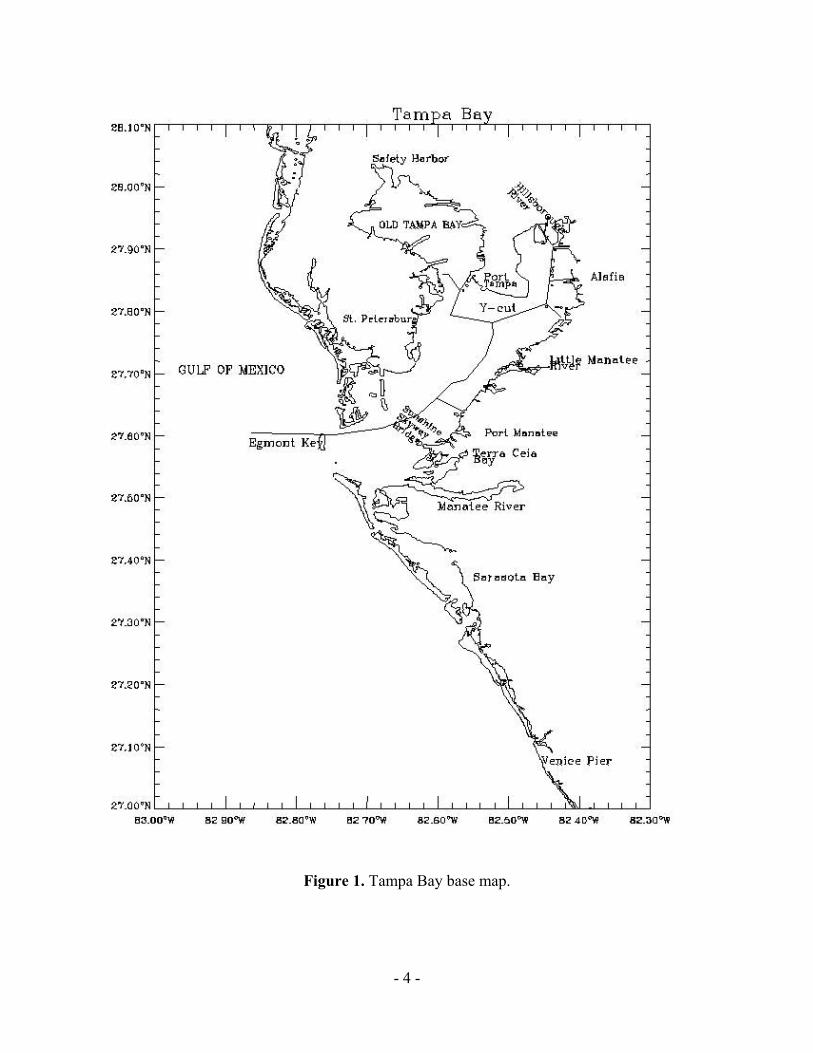
1. INTRODUCTION This report documents the development of the hydrodynamic model for the Tampa Bay Operational Forecast System (TBOFS). The objective of TBOFS is to provide real time nowcast and forecast oceanographic conditions to mariners navigating in Tampa Bay, Florida as part of the NOS Tampa Bay PORTS (Physical Oceanographic Real-Time System). As the largest estuary and the largest port in Florida, and the seventh largest U.S. commercial port in terms of tonnage handled, Tampa Bay (Figure 1) is a relatively shallow bay with an entrance to the West Florida shelf of the Gulf of Mexico. The average depth of the bay ranges from 2 m to 5 m except in the navigational channels which range from 10 m to 15 m. The Tampa Bay hydrodynamic circulation has been studied by many investigators. Galperin et al., (1991) studied density driven circulation in Tampa Bay using model simulations. Hess (1993) developed a model to provide tidal characteristics in Tampa Bay validated with observations. Tidal datums for Tampa Bay were also determined from a similar study (Hess, 2001, Hess and Bosley, 1991). Vincent et al., (2000) developed a nowcast/forecast system using the Estuarine and Coastal Ocean Model (ECOM) (Blumberg, 1990). Meyers et al., (2007) also studied Lagrangian residual currents using ECOM. Finally, Weisberg and Zheng (2006) studied general circulation of Tampa Bay using the Finite Volume Coastal Ocean Model (Chen et al., 2003) Model development procedures for TBOFS include the selection of a hydrodynamic model, model grid generation, and model calibration and validation with skill assessment software. Each procedure is described in detail in this document.

- 2 -
- 3 -
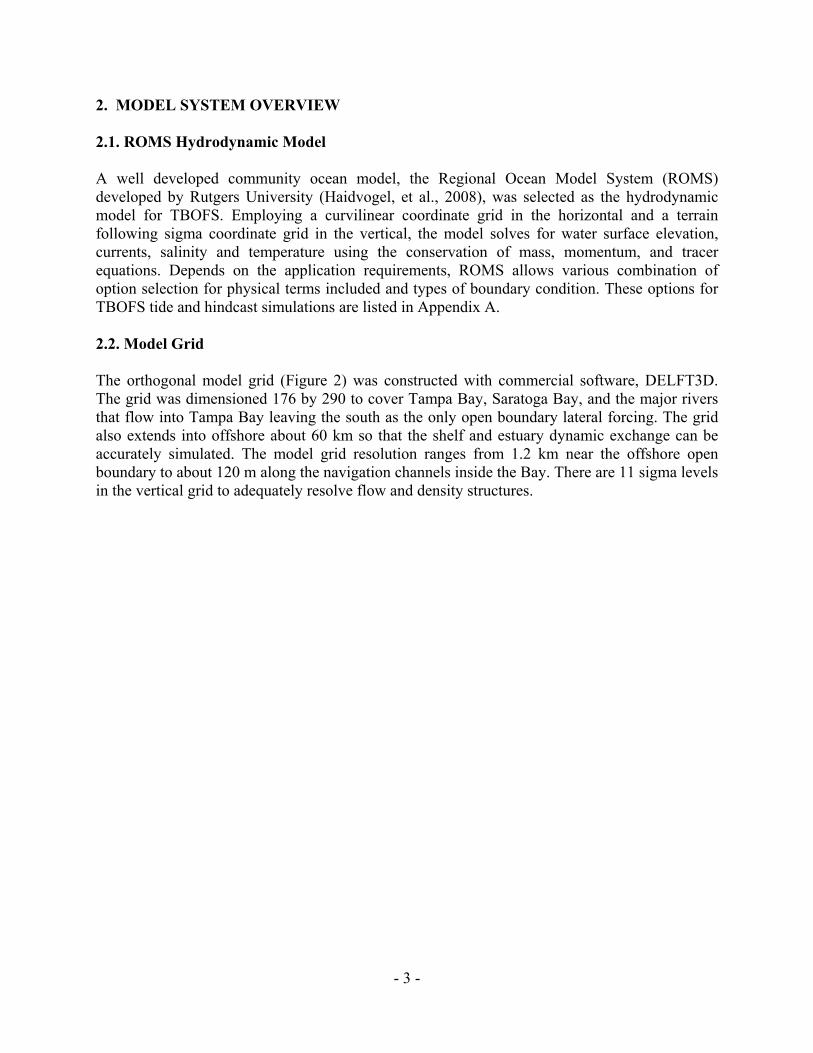
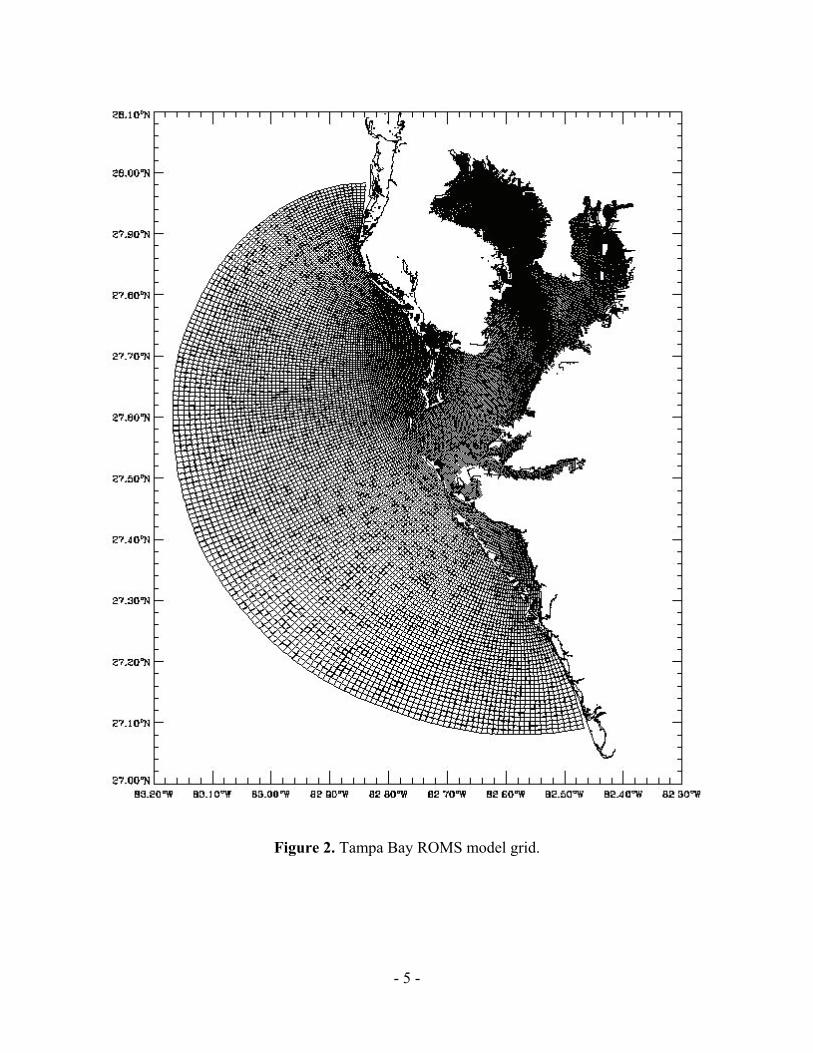
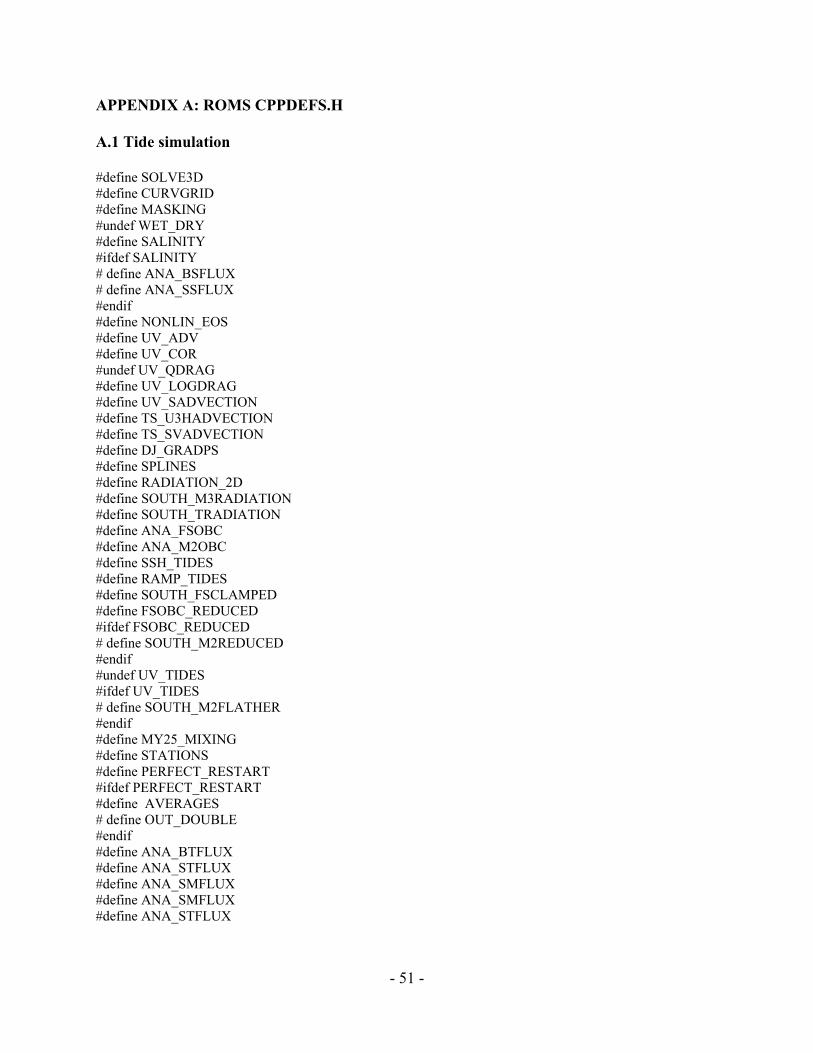
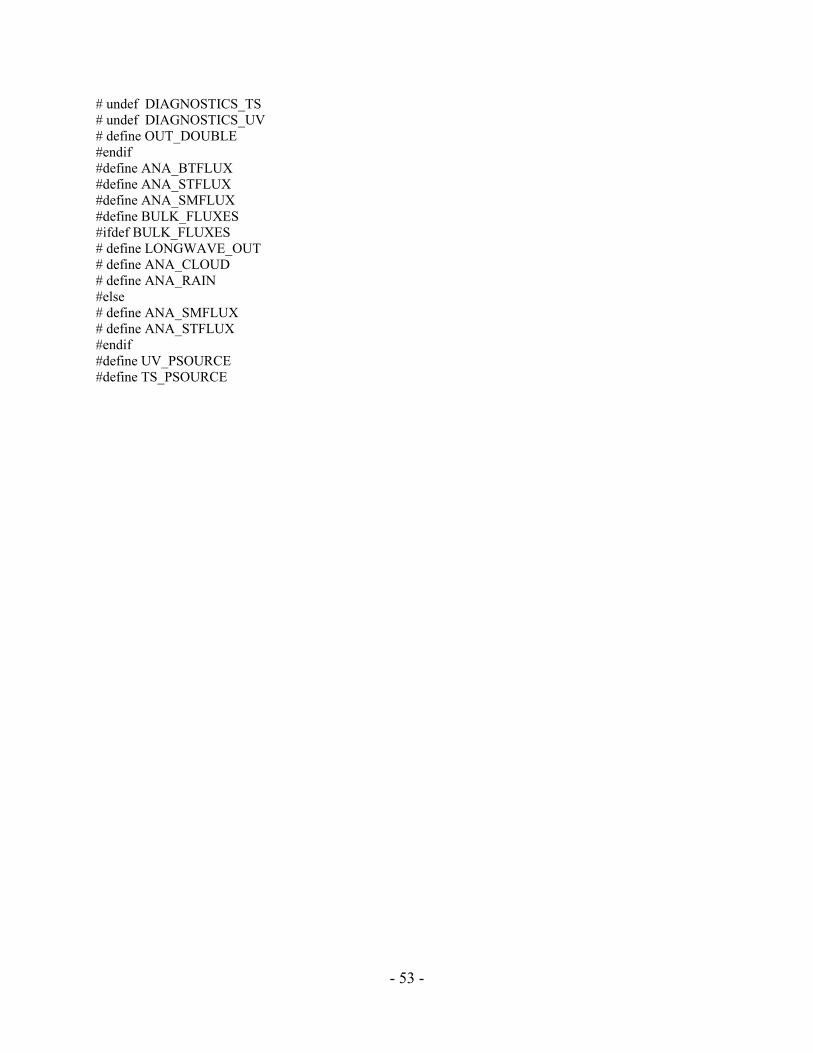
2. MODEL SYSTEM OVERVIEW 2.1. ROMS Hydrodynamic Model A well developed community ocean model, the Regional Ocean Model System (ROMS) developed by Rutgers University (Haidvogel, et al., 2008), was selected as the hydrodynamic model for TBOFS. Employing a curvilinear coordinate grid in the horizontal and a terrain following sigma coordinate grid in the vertical, the model solves for water surface elevation, currents, salinity and temperature using the conservation of mass, momentum, and tracer equations. Depends on the application requirements, ROMS allows various combination of option selection for physical terms included and types of boundary condition. These options for TBOFS tide and hindcast simulations are listed in Appendix A. 2.2. Model Grid The orthogonal model grid (Figure 2) was constructed with commercial software, DELFT3D. The grid was dimensioned 176 by 290 to cover Tampa Bay, Saratoga Bay, and the major rivers that flow into Tampa Bay leaving the south as the only open boundary lateral forcing. The grid also extends into offshore about 60 km so that the shelf and estuary dynamic exchange can be accurately simulated. The model grid resolution ranges from 1.2 km near the offshore open boundary to about 120 m along the navigation channels inside the Bay. There are 11 sigma levels in the vertical grid to adequately resolve flow and density structures.
- 4 -
Figure 1. Tampa Bay base map.
- 5 -
Figure 2. Tampa Bay ROMS model grid.

- 6 -
- 7 -
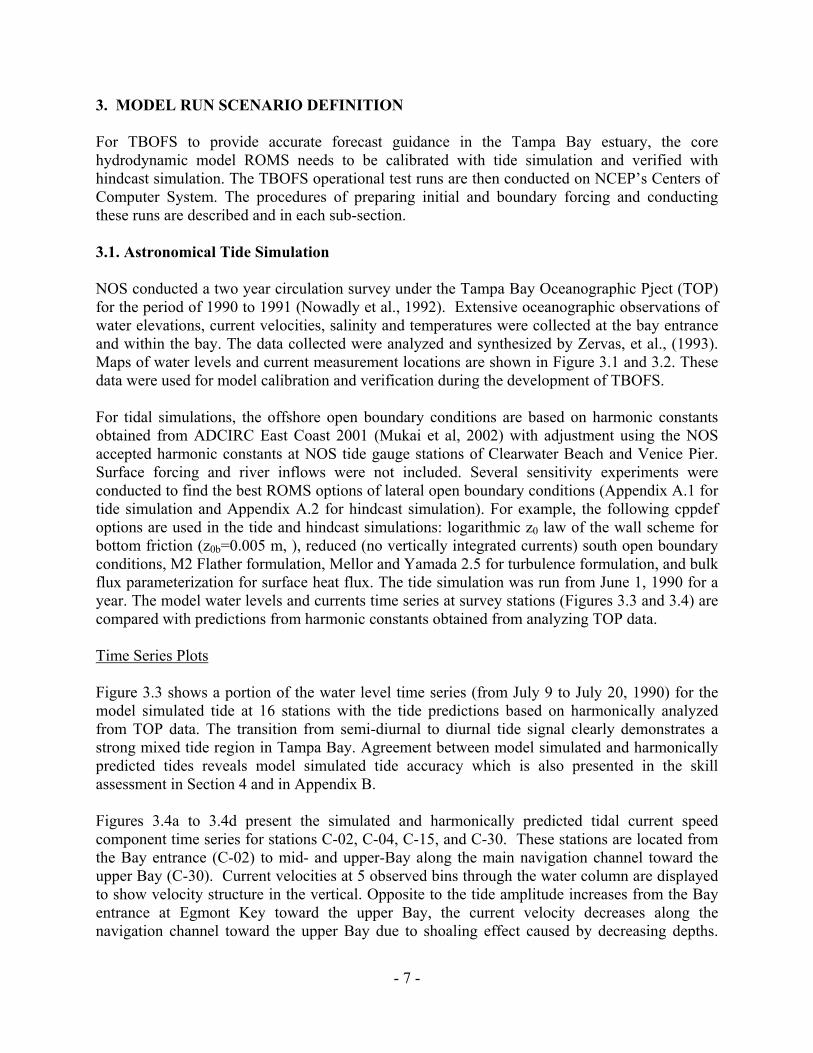
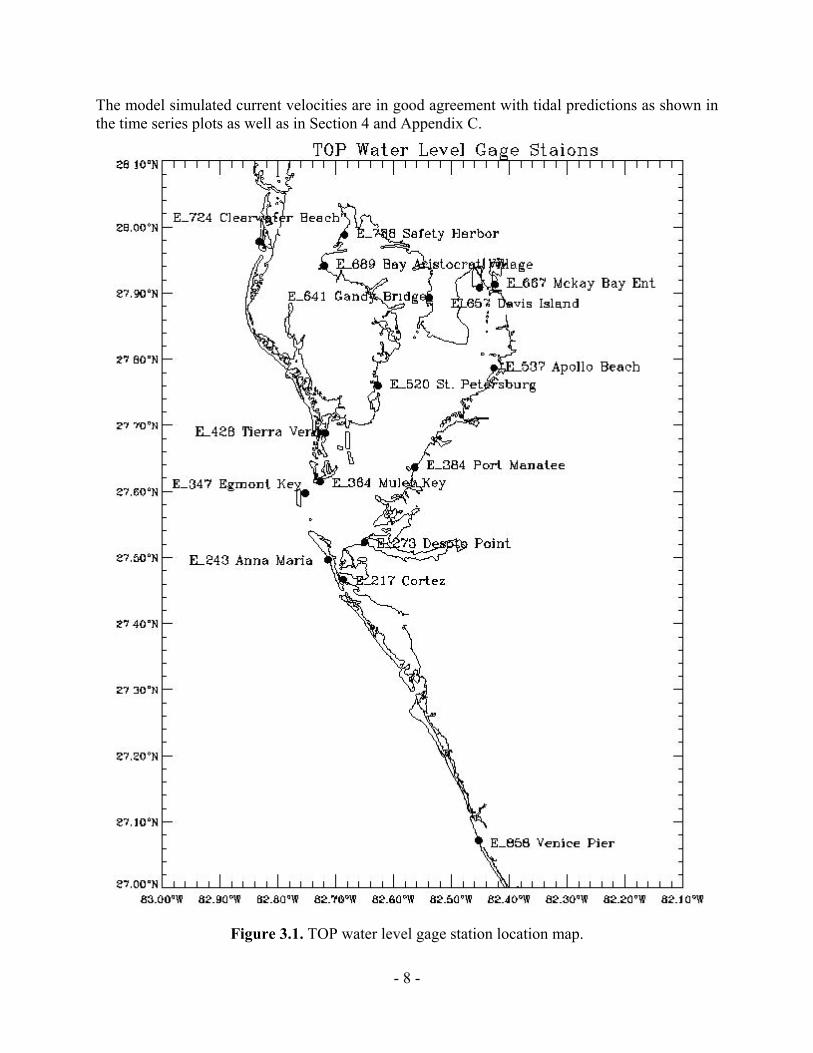
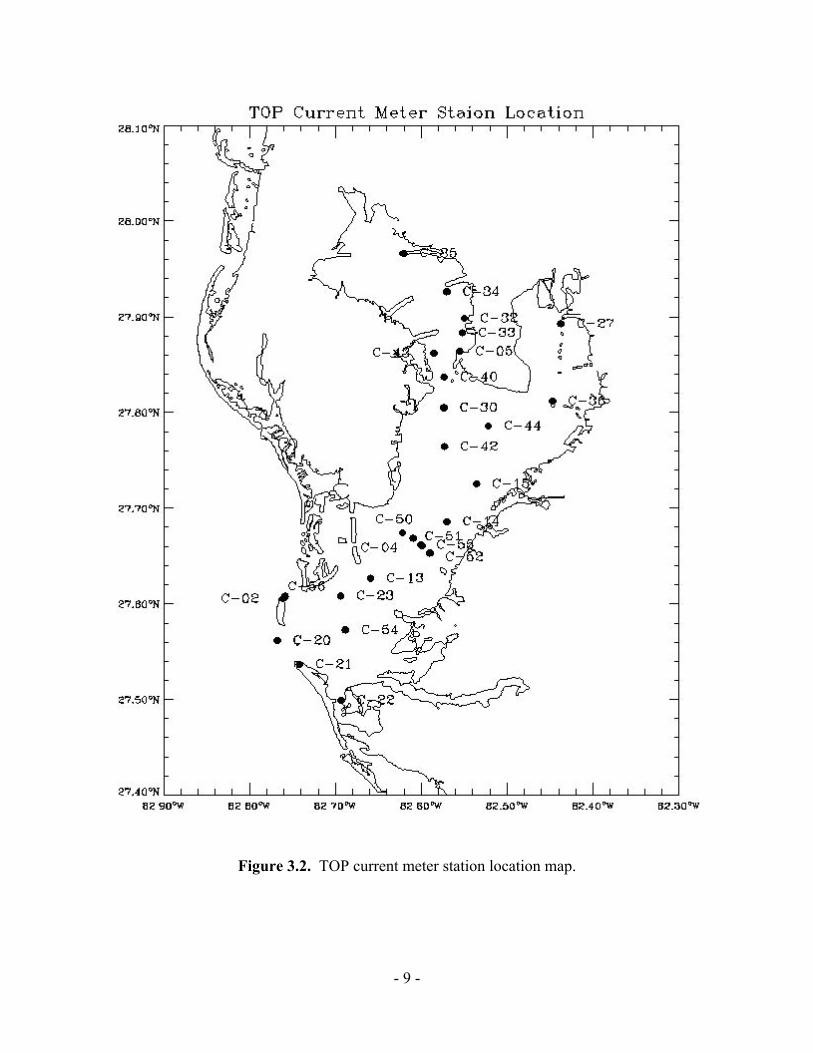
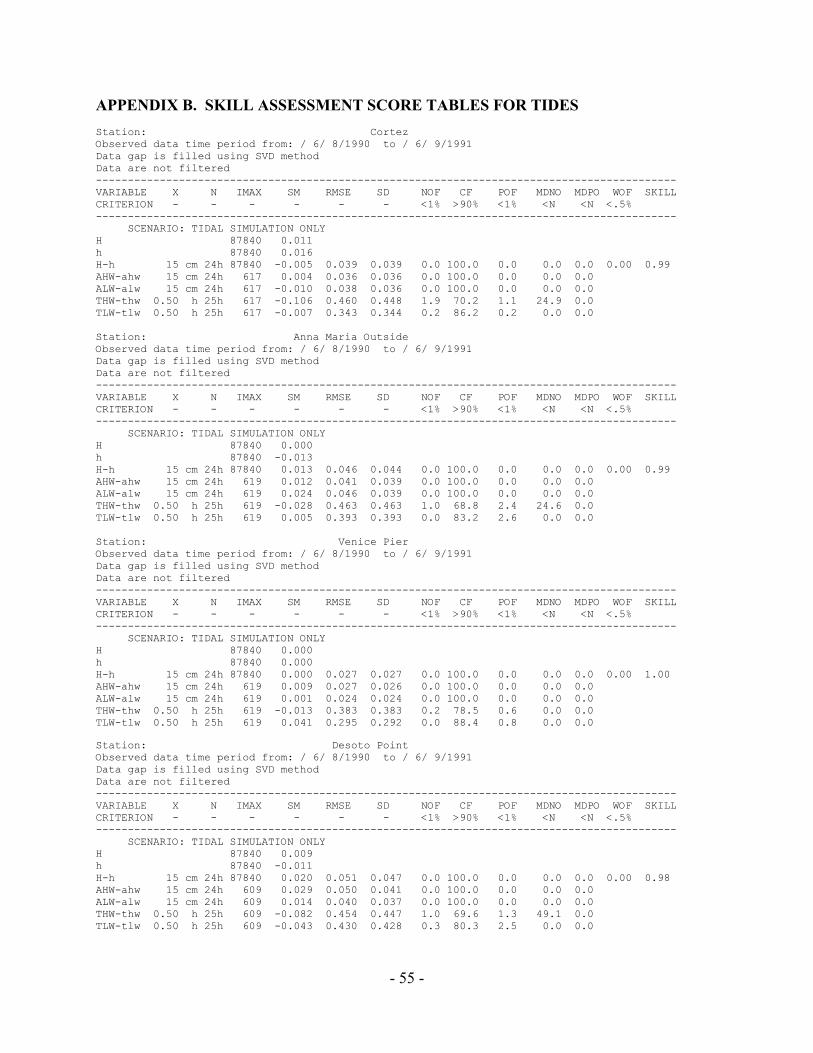
3. MODEL RUN SCENARIO DEFINITION For TBOFS to provide accurate forecast guidance in the Tampa Bay estuary, the core hydrodynamic model ROMS needs to be calibrated with tide simulation and verified with hindcast simulation. The TBOFS operational test runs are then conducted on NCEP’s Centers of Computer System. The procedures of preparing initial and boundary forcing and conducting these runs are described and in each sub-section. 3.1. Astronomical Tide Simulation NOS conducted a two year circulation survey under the Tampa Bay Oceanographic Pject (TOP) for the period of 1990 to 1991 (Nowadly et al., 1992). Extensive oceanographic observations of water elevations, current velocities, salinity and temperatures were collected at the bay entrance and within the bay. The data collected were analyzed and synthesized by Zervas, et al., (1993). Maps of water levels and current measurement locations are shown in Figure 3.1 and 3.2. These data were used for model calibration and verification during the development of TBOFS. For tidal simulations, the offshore open boundary conditions are based on harmonic constants obtained from ADCIRC East Coast 2001 (Mukai et al, 2002) with adjustment using the NOS accepted harmonic constants at NOS tide gauge stations of Clearwater Beach and Venice Pier. Surface forcing and river inflows were not included. Several sensitivity experiments were conducted to find the best ROMS options of lateral open boundary conditions (Appendix A.1 for tide simulation and Appendix A.2 for hindcast simulation). For example, the following cppdef options are used in the tide and hindcast simulations: logarithmic z0 law of the wall scheme for bottom friction (z0b=0.005 m, ), reduced (no vertically integrated currents) south open boundary conditions, M2 Flather formulation, Mellor and Yamada 2.5 for turbulence formulation, and bulk flux parameterization for surface heat flux. The tide simulation was run from June 1, 1990 for a year. The model water levels and currents time series at survey stations (Figures 3.3 and 3.4) are compared with predictions from harmonic constants obtained from analyzing TOP data. Time Series Plots Figure 3.3 shows a portion of the water level time series (from July 9 to July 20, 1990) for the model simulated tide at 16 stations with the tide predictions based on harmonically analyzed from TOP data. The transition from semi-diurnal to diurnal tide signal clearly demonstrates a strong mixed tide region in Tampa Bay. Agreement between model simulated and harmonically predicted tides reveals model simulated tide accuracy which is also presented in the skill assessment in Section 4 and in Appendix B. Figures 3.4a to 3.4d present the simulated and harmonically predicted tidal current speed component time series for stations C-02, C-04, C-15, and C-30. These stations are located from the Bay entrance (C-02) to mid- and upper-Bay along the main navigation channel toward the upper Bay (C-30). Current velocities at 5 observed bins through the water column are displayed to show velocity structure in the vertical. Opposite to the tide amplitude increases from the Bay entrance at Egmont Key toward the upper Bay, the current velocity decreases along the navigation channel toward the upper Bay due to shoaling effect caused by decreasing depths.
- 8 -
The model simulated current velocities are in good agreement with tidal predictions as shown in the time series plots as well as in Section 4 and Appendix C.
Figure 3.1. TOP water level gage station location map.
- 9 -
Figure 3.2. TOP current meter station location map.
- 10 -
Figure 3.3. Tide elevation time series from tide simulation (black) compared with harmonic
predicted tides (red) for upper bay (left panel) and coastal and lower bay (right panel) stations.
- 11 -
Figure 3.4a. East (left panel) and north (right panel) component of current velocity time series
for harmonically predicted simulated (black) and harmonically predicted (red) tidal currents at station C-02 (Egmont Key, Figure 3.2) for observed bins 1, 5, 10, 16 and 20.
Figure 3.4b. East (left panel) and north (right panel) component of current velocity time series
for harmonically predicted (black) and model simulated (red) tidal at station C-04 (central bay navigation channel, Figure 3.2) for observed bins 1, 3, 4, 5, and 7.
- 12 -
Figure 3.4c. East (left panel) and north (lower panel) component of current velocity time series
for harmonically predicted (black) and model simulated (red) tidal currents at station C-15 (central bay navigational channel, Figure 3.2) for observed bins 1, 3, 4, 5, and 7.
Figure 3.4d. East (left panel) and north (right panel) component of current velocity time series
for harmonically predicted (black) and simulated (red) tidal currents at station C-30 (navigation channel at central Bay, Figure 3.2) for observed bins 1, 3, 5, and 7.
- 13 -
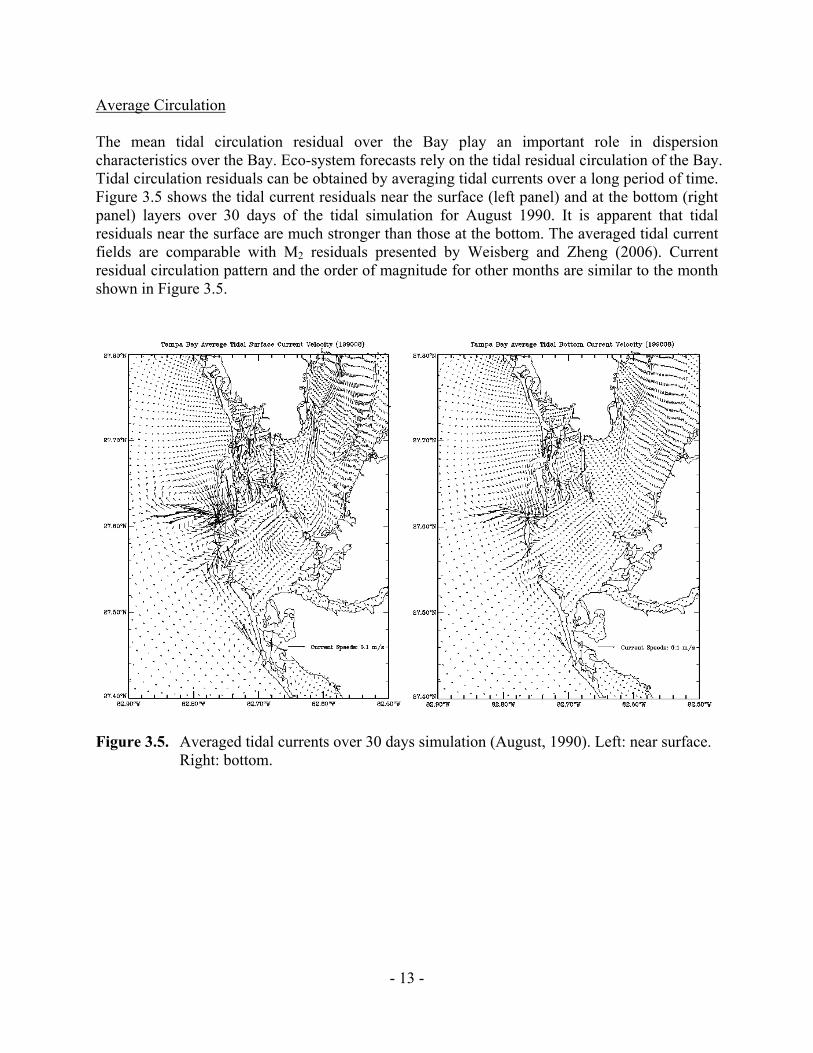
Average Circulation The mean tidal circulation residual over the Bay play an important role in dispersion characteristics over the Bay. Eco-system forecasts rely on the tidal residual circulation of the Bay. Tidal circulation residuals can be obtained by averaging tidal currents over a long period of time. Figure 3.5 shows the tidal current residuals near the surface (left panel) and at the bottom (right panel) layers over 30 days of the tidal simulation for August 1990. It is apparent that tidal residuals near the surface are much stronger than those at the bottom. The averaged tidal current fields are comparable with M2 residuals presented by Weisberg and Zheng (2006). Current residual circulation pattern and the order of magnitude for other months are similar to the month shown in Figure 3.5.
Figure 3.5. Averaged tidal currents over 30 days simulation (August, 1990). Left: near surface.
Right: bottom.
- 14 -
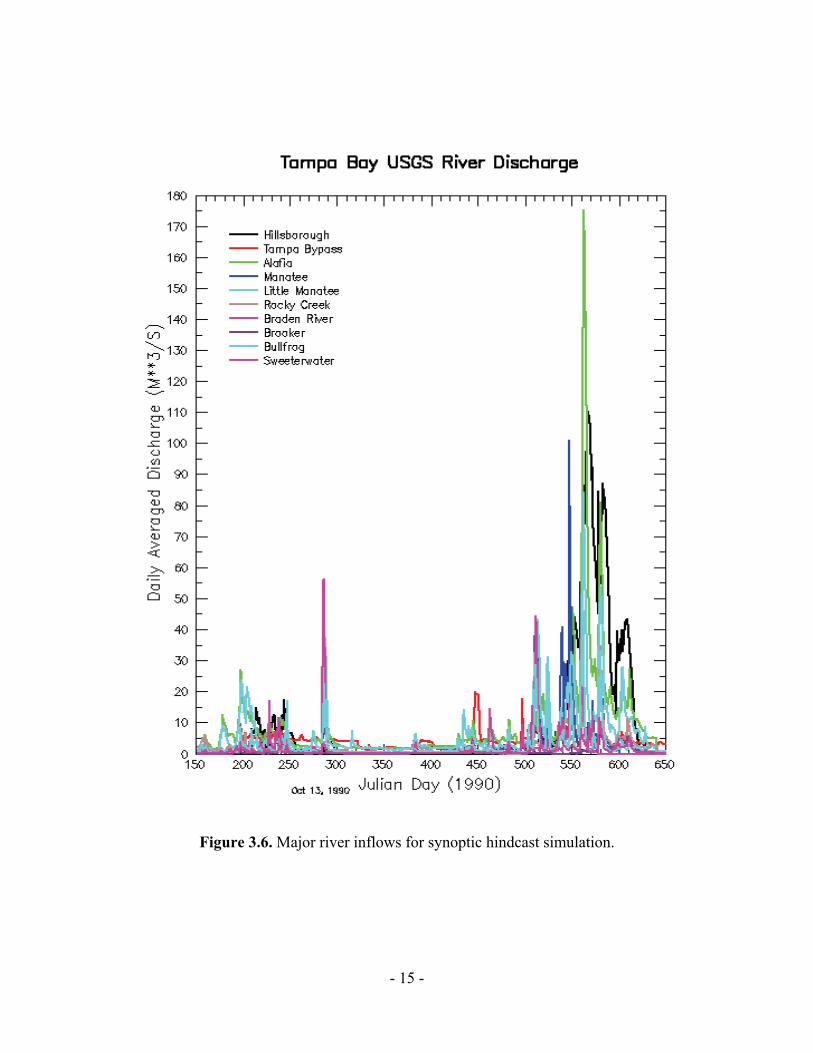
3.2. Model Hindcast Simulation The open boundary conditions for hindcast simulation were specified using the TOP survey data for water levels, temperature, and salinity at a single measurement location about 60 km offshore of Tampa Bay. Other locations of temperature and conductivity measurement are shown in Figure 3.9. The model was initialized with temperature and salinity fields generated from monthly measurements from the Environmental Protection Commission of Hillsborough County (EPCHC). Model parameters such as the bottom friction formulation and its coefficients obtained from the tidal simulation were kept invariant in this validation simulation. Three hourly atmospheric surface forcing variables, which include wind, sea level atmospheric air pressure, relative humidity, downward and upward short wave radiation, and downward long wave radiation, were obtained from the North America Regional Reanalysis (NARR) provided by the Physical Sciences Division of NOAA’s Ocean and Atmospheric Research office (http://www.cdc.noaa.gov). Initial model calibration indicated that excessive heat flux from NARR caused simulated surface temperatures to be about 2oC warmer than observations. Net input heat flux for the synoptic hindcast simulation was therefore reduced by 10%. Averaged daily river fresh water inflows at 7 river basins from 12 rivers were specified using USGS measurements (Figure 3.6). Salinity was set to be zero, and river temperatures were specified from observed time series.
The model was run for 15 months from May 31, 1990 to August 31, 1991. Simulated water levels, currents, temperature and salinity at TOP gage locations are compared with observations for model performance skill assessment.
- 15 -
Figure 3.6. Major river inflows for synoptic hindcast simulation.
- 16 -
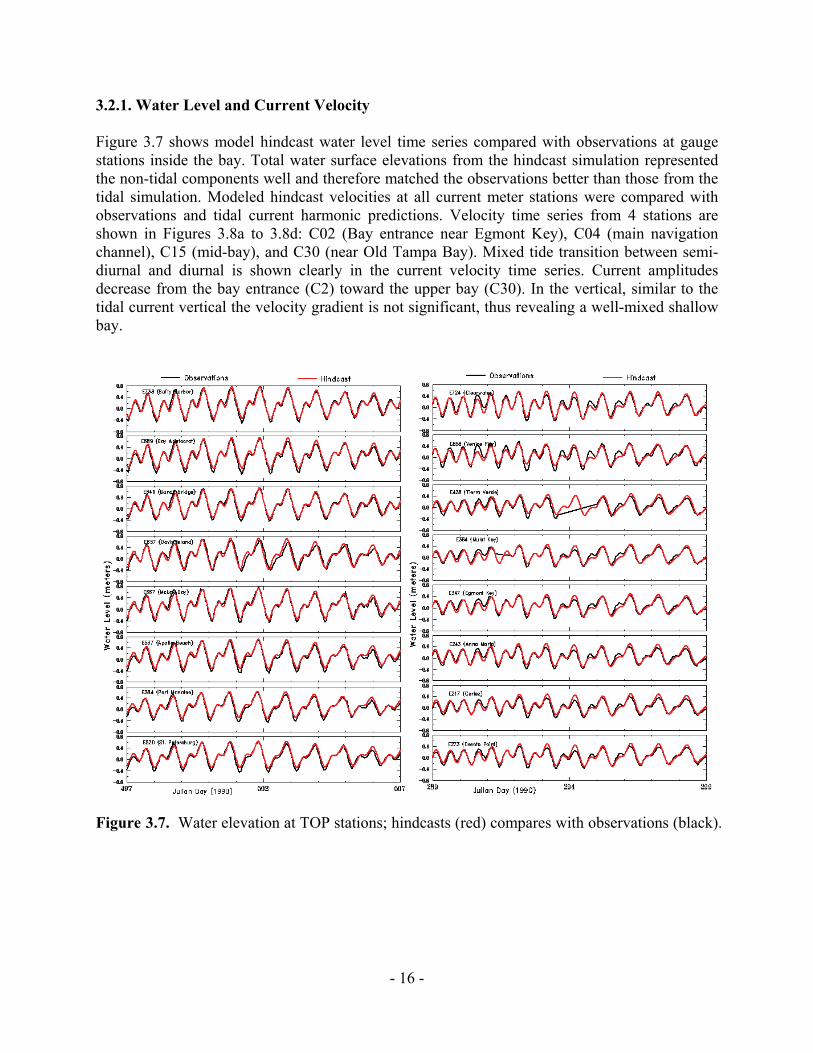
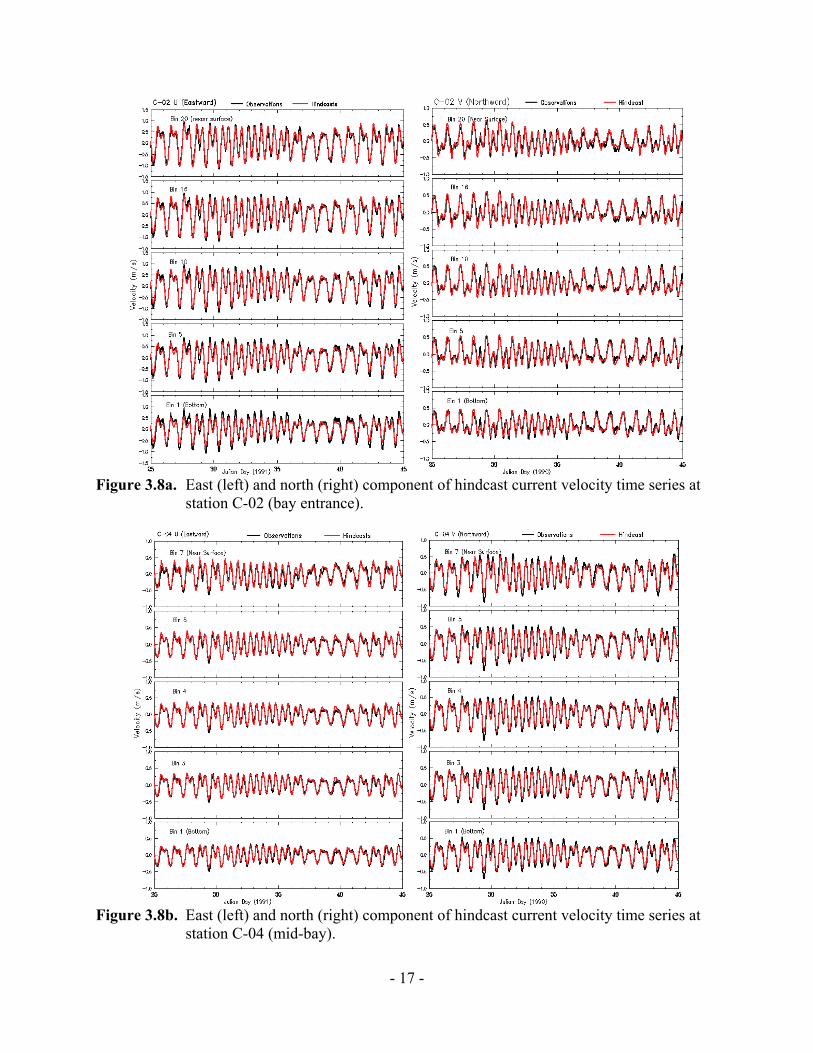
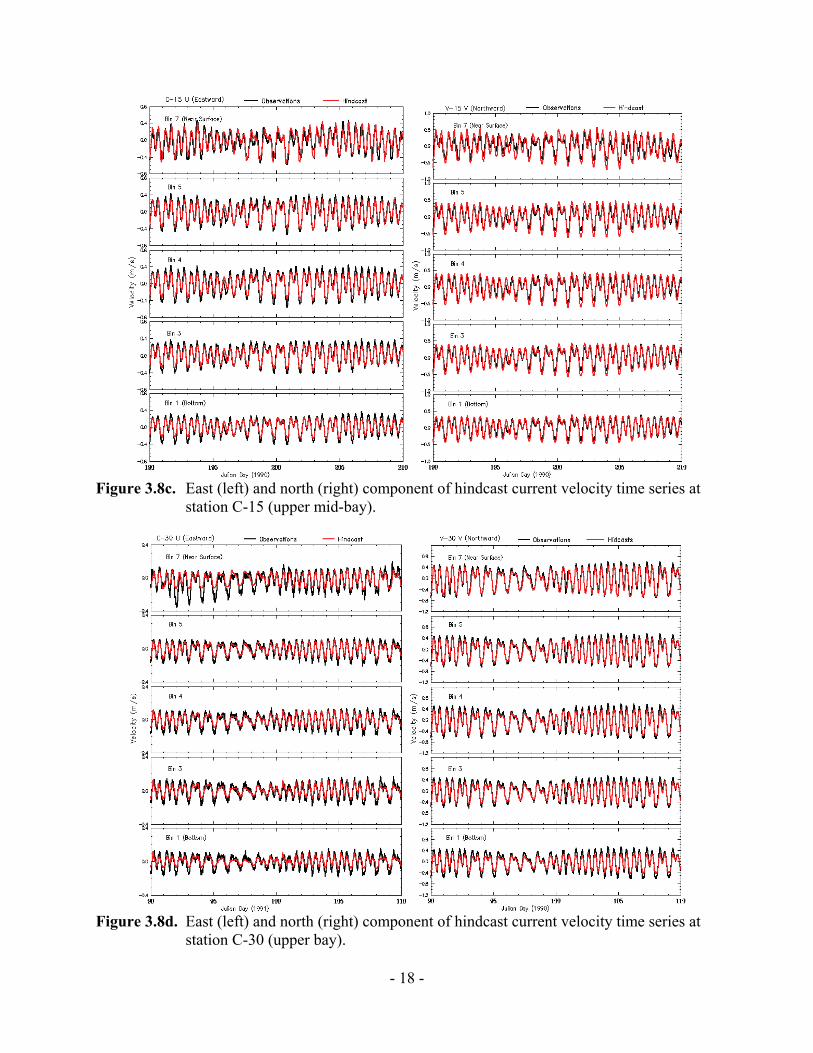
3.2.1. Water Level and Current Velocity Figure 3.7 shows model hindcast water level time series compared with observations at gauge stations inside the bay. Total water surface elevations from the hindcast simulation represented the non-tidal components well and therefore matched the observations better than those from the tidal simulation. Modeled hindcast velocities at all current meter stations were compared with observations and tidal current harmonic predictions. Velocity time series from 4 stations are shown in Figures 3.8a to 3.8d: C02 (Bay entrance near Egmont Key), C04 (main navigation channel), C15 (mid-bay), and C30 (near Old Tampa Bay). Mixed tide transition between semi-diurnal and diurnal is shown clearly in the current velocity time series. Current amplitudes decrease from the bay entrance (C2) toward the upper bay (C30). In the vertical, similar to the tidal current vertical the velocity gradient is not significant, thus revealing a well-mixed shallow bay.
Figure 3.7. Water elevation at TOP stations; hindcasts (red) compares with observations (black).
- 17 -
Figure 3.8a. East (left) and north (right) component of hindcast current velocity time series at
station C-02 (bay entrance).
Figure 3.8b. East (left) and north (right) component of hindcast current velocity time series at
station C-04 (mid-bay).
- 18 -
Figure 3.8c. East (left) and north (right) component of hindcast current velocity time series at
station C-15 (upper mid-bay).
Figure 3.8d. East (left) and north (right) component of hindcast current velocity time series at
station C-30 (upper bay).
- 19 -
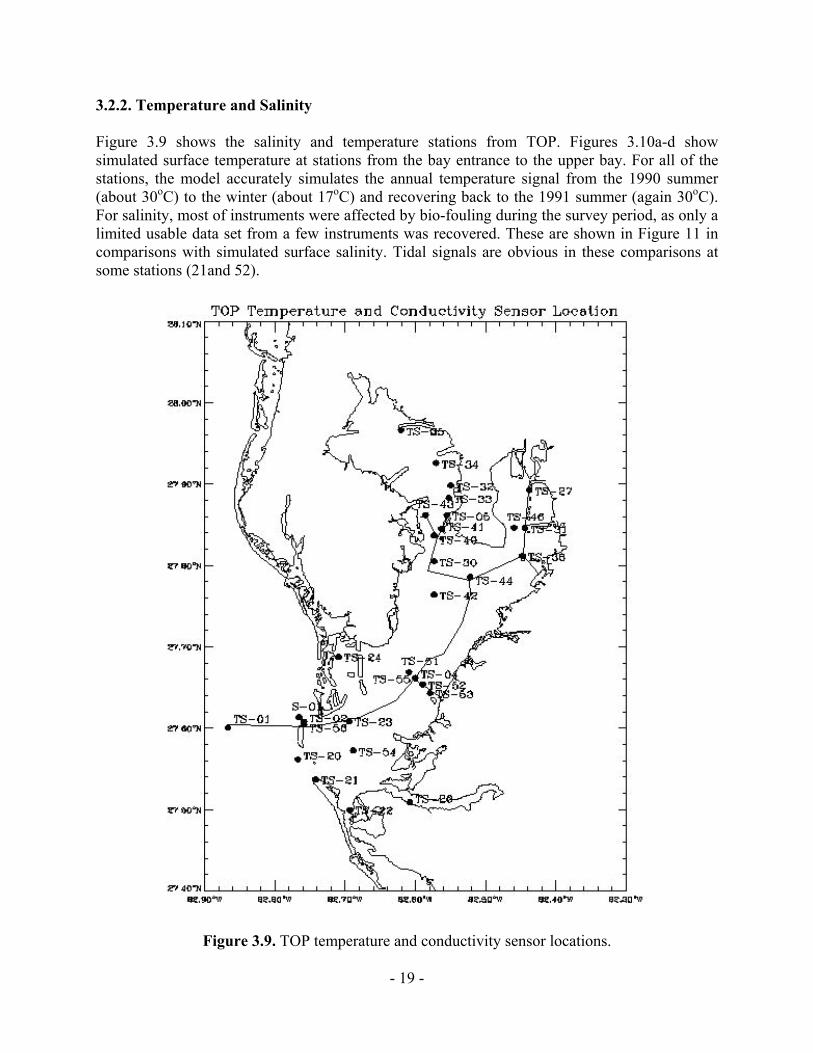
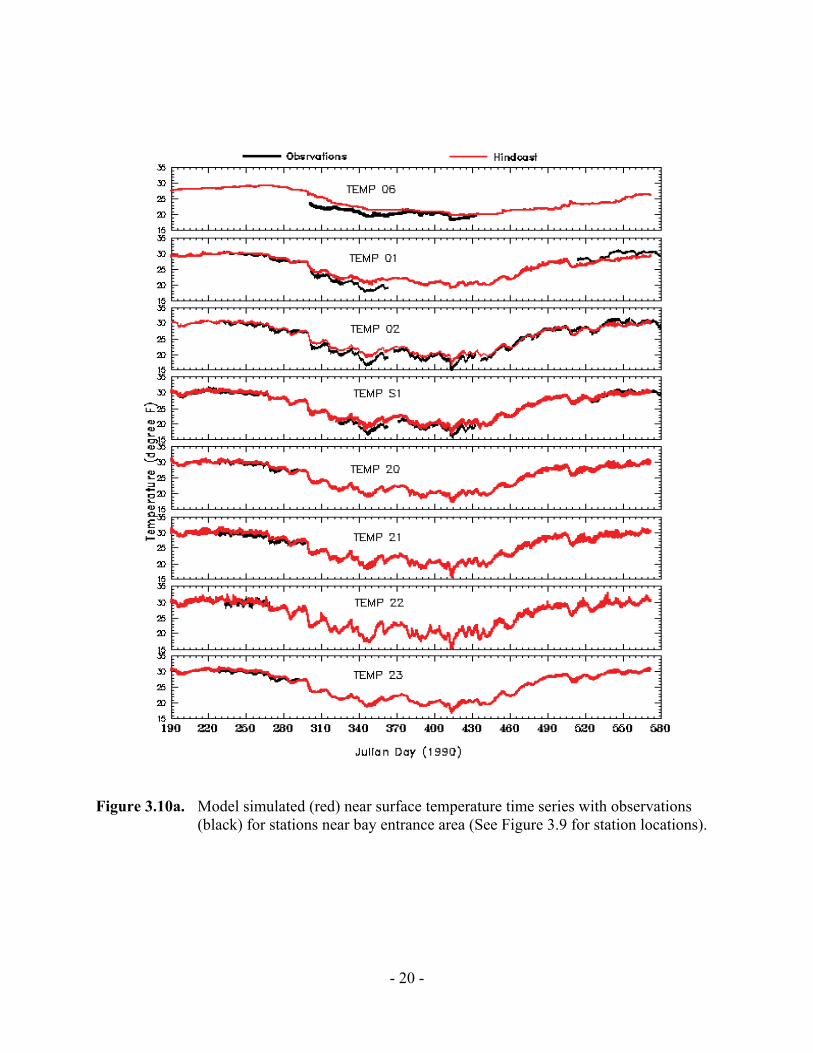
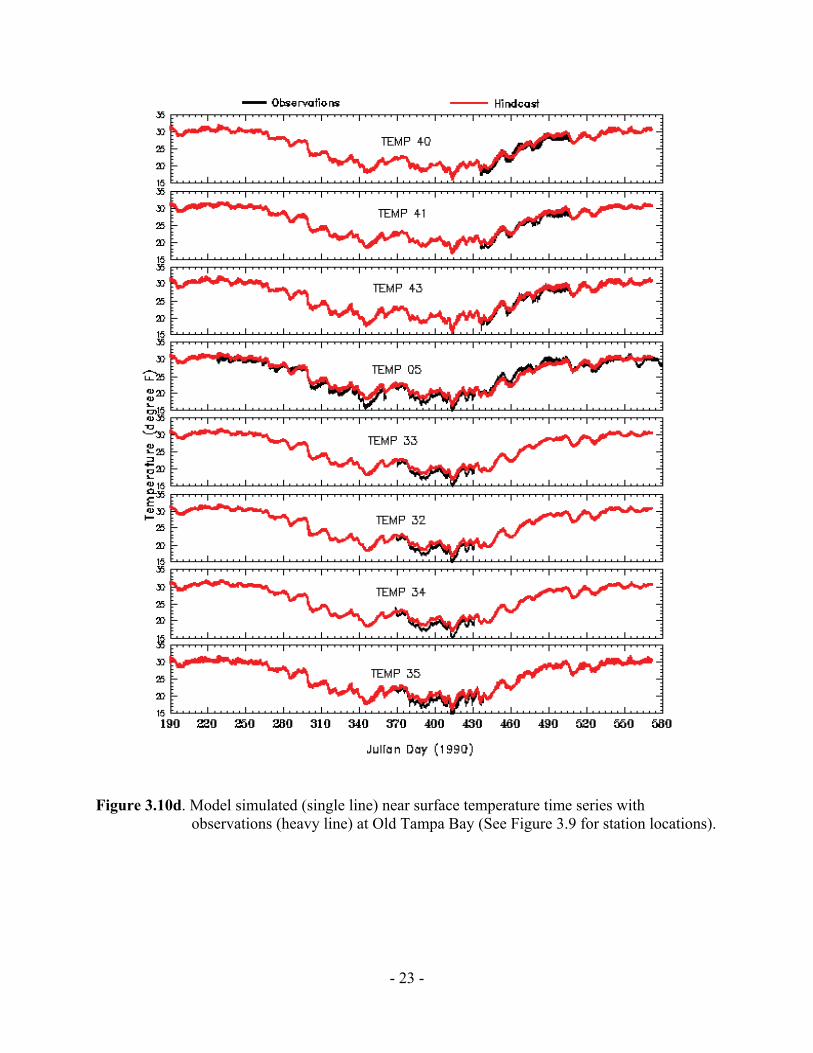
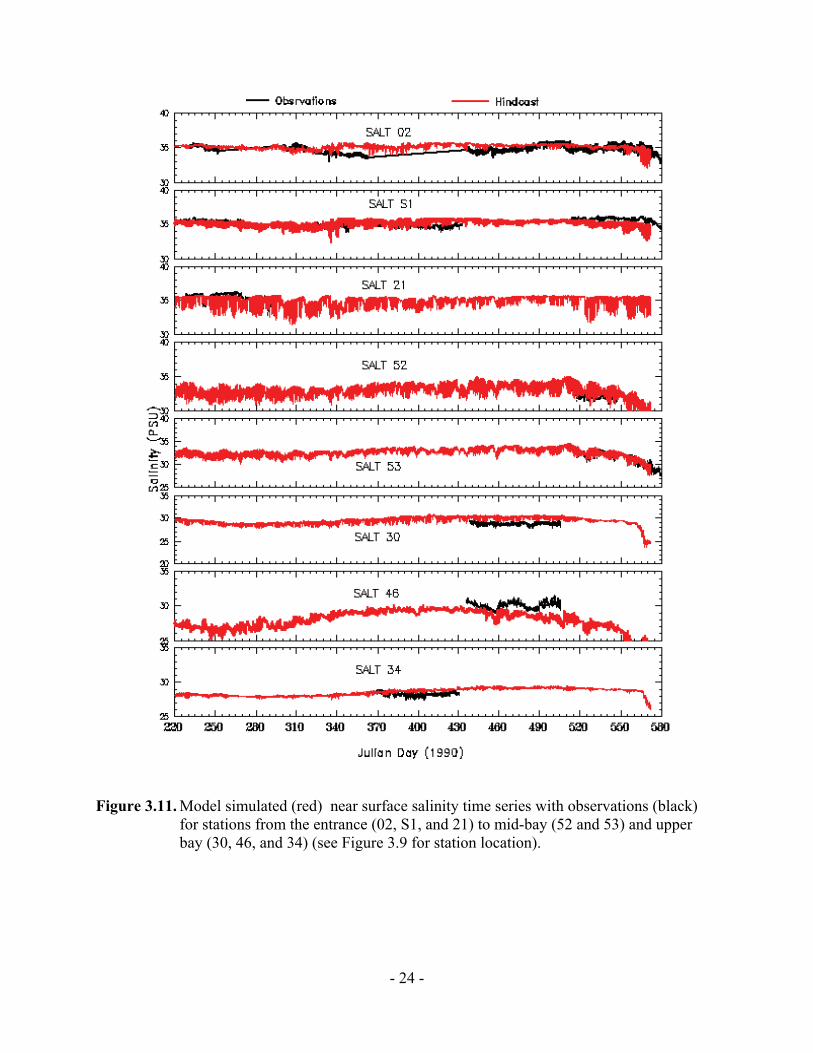
3.2.2. Temperature and Salinity Figure 3.9 shows the salinity and temperature stations from TOP. Figures 3.10a-d show simulated surface temperature at stations from the bay entrance to the upper bay. For all of the stations, the model accurately simulates the annual temperature signal from the 1990 summer (about 30oC) to the winter (about 17oC) and recovering back to the 1991 summer (again 30oC). For salinity, most of instruments were affected by bio-fouling during the survey period, as only a limited usable data set from a few instruments was recovered. These are shown in Figure 11 in comparisons with simulated surface salinity. Tidal signals are obvious in these comparisons at some stations (21and 52).
Figure 3.9. TOP temperature and conductivity sensor locations.
- 20 -
Figure 3.10a. Model simulated (red) near surface temperature time series with observations
(black) for stations near bay entrance area (See Figure 3.9 for station locations).
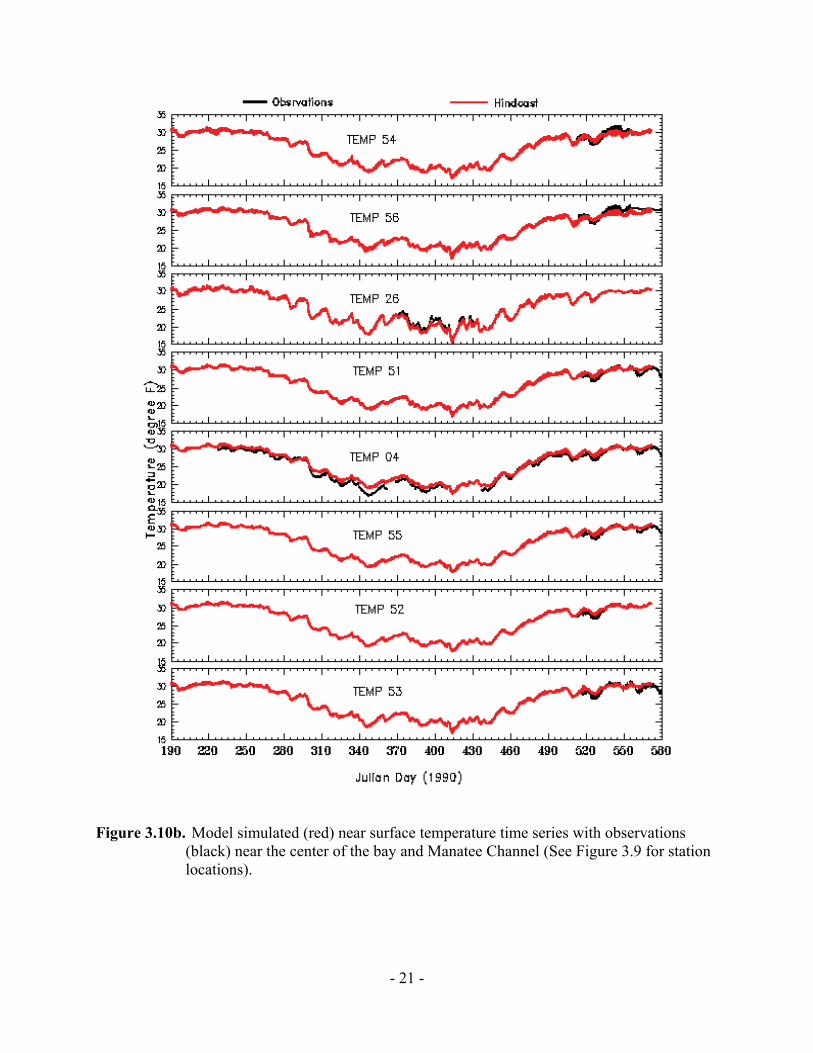
- 21 -
Figure 3.10b. Model simulated (red) near surface temperature time series with observations
(black) near the center of the bay and Manatee Channel (See Figure 3.9 for station locations).
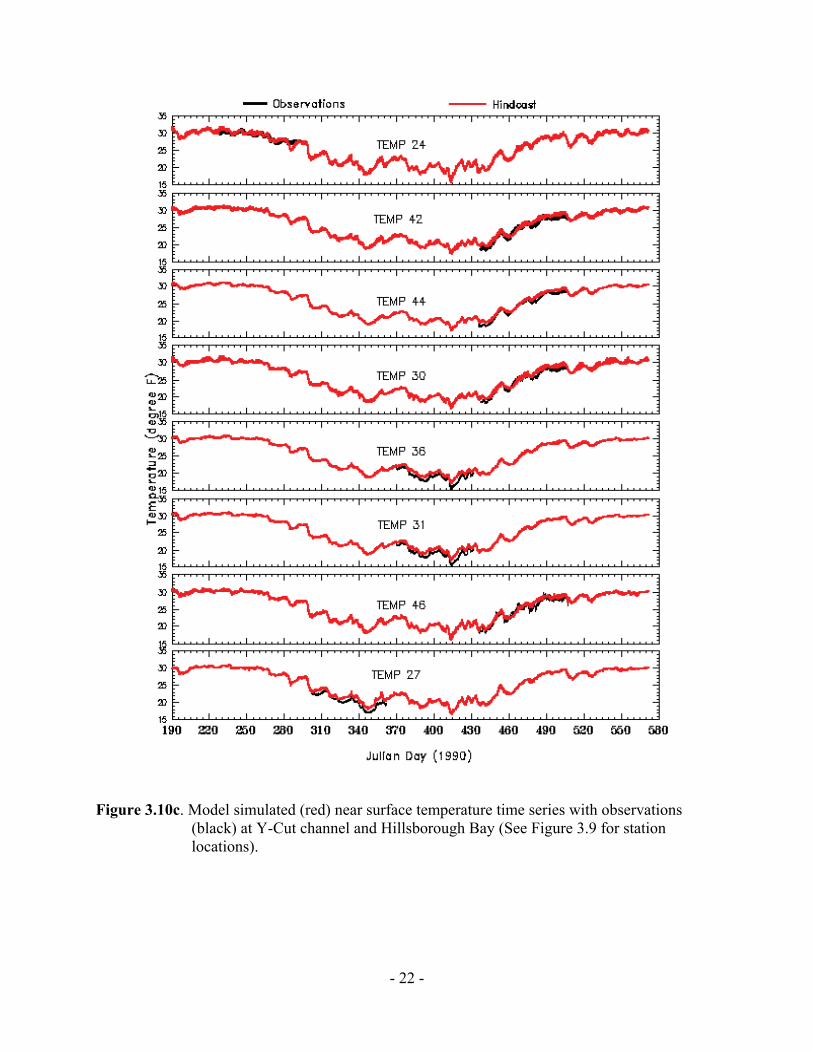
- 22 -
Figure 3.10c. Model simulated (red) near surface temperature time series with observations
(black) at Y-Cut channel and Hillsborough Bay (See Figure 3.9 for station locations).
- 23 -
Figure 3.10d. Model simulated (single line) near surface temperature time series with
observations (heavy line) at Old Tampa Bay (See Figure 3.9 for station locations).
- 24 -
Figure 3.11. Model simulated (red) near surface salinity time series with observations (black)
for stations from the entrance (02, S1, and 21) to mid-bay (52 and 53) and upper bay (30, 46, and 34) (see Figure 3.9 for station location).
- 25 -
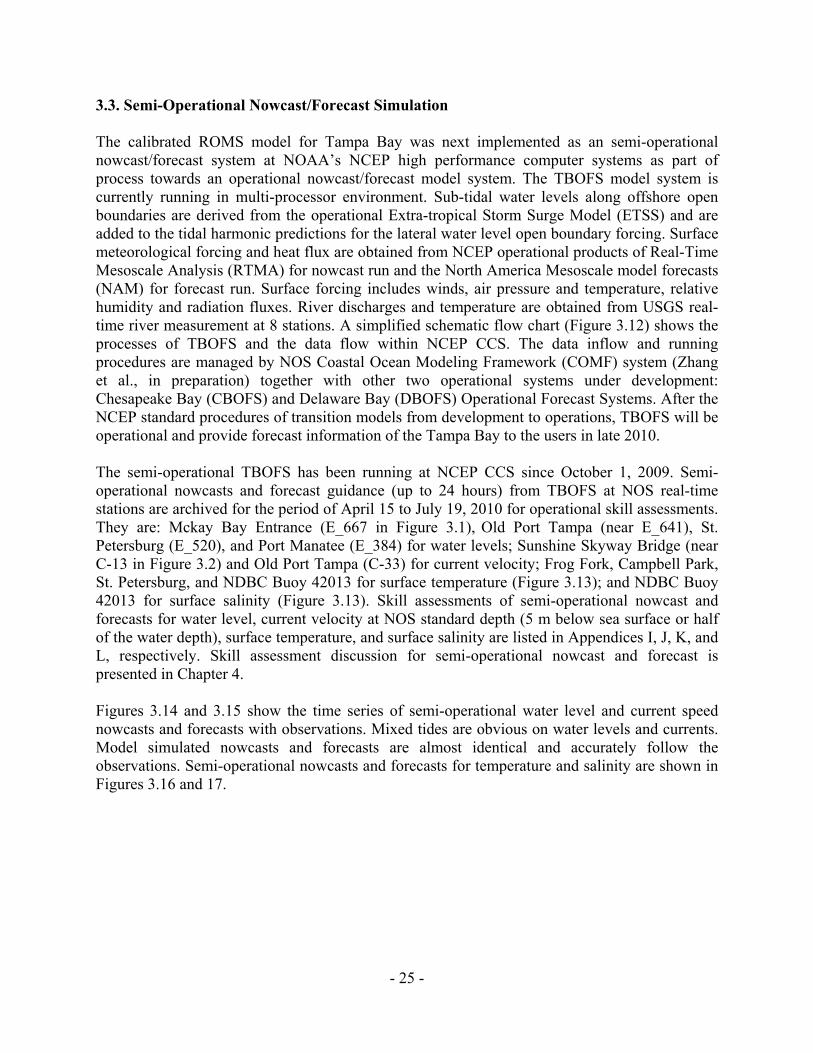
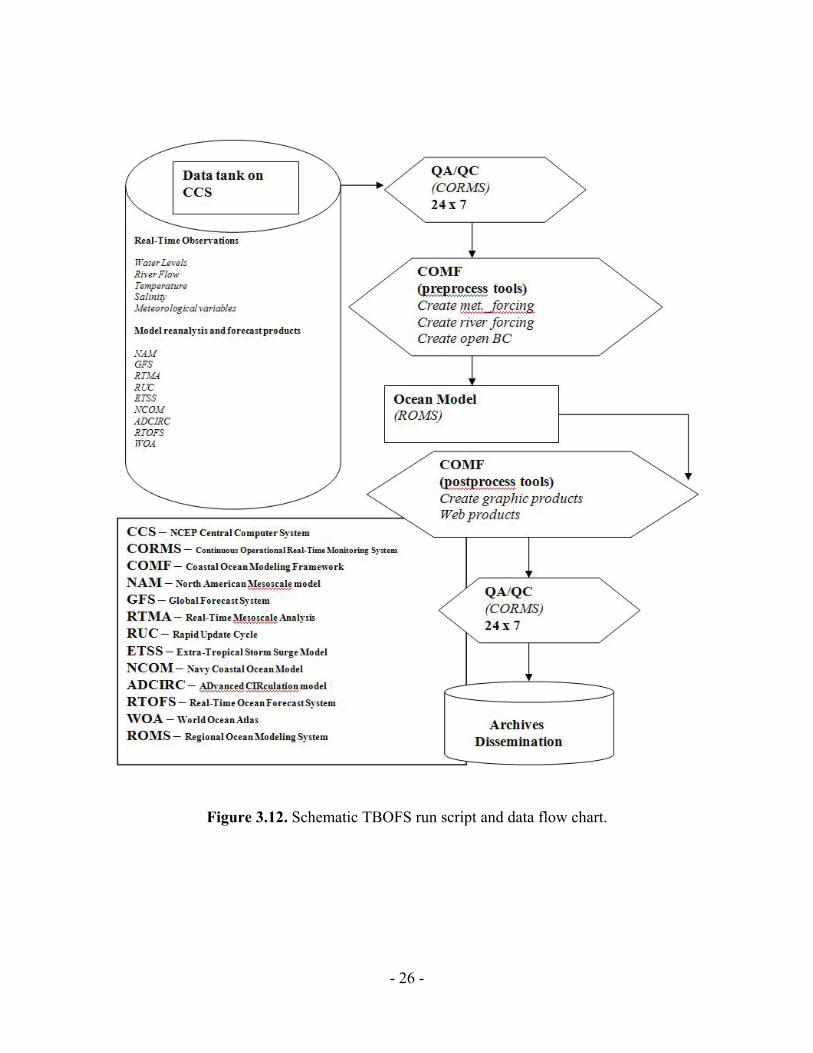
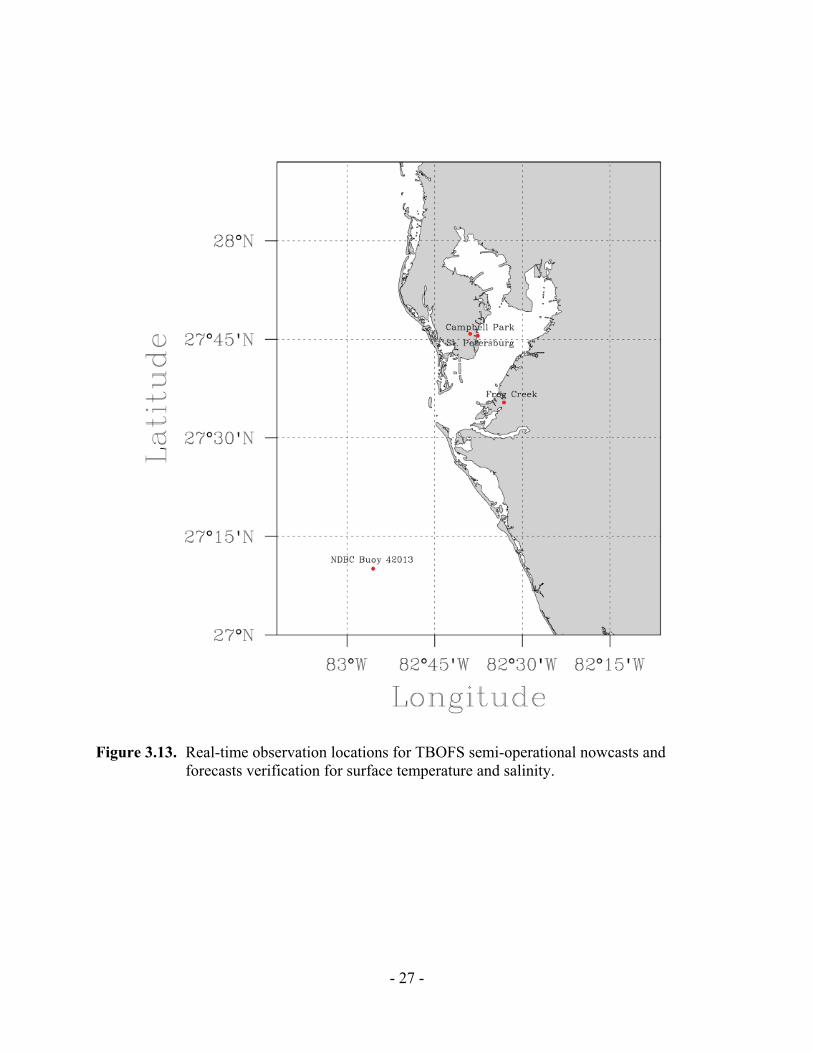
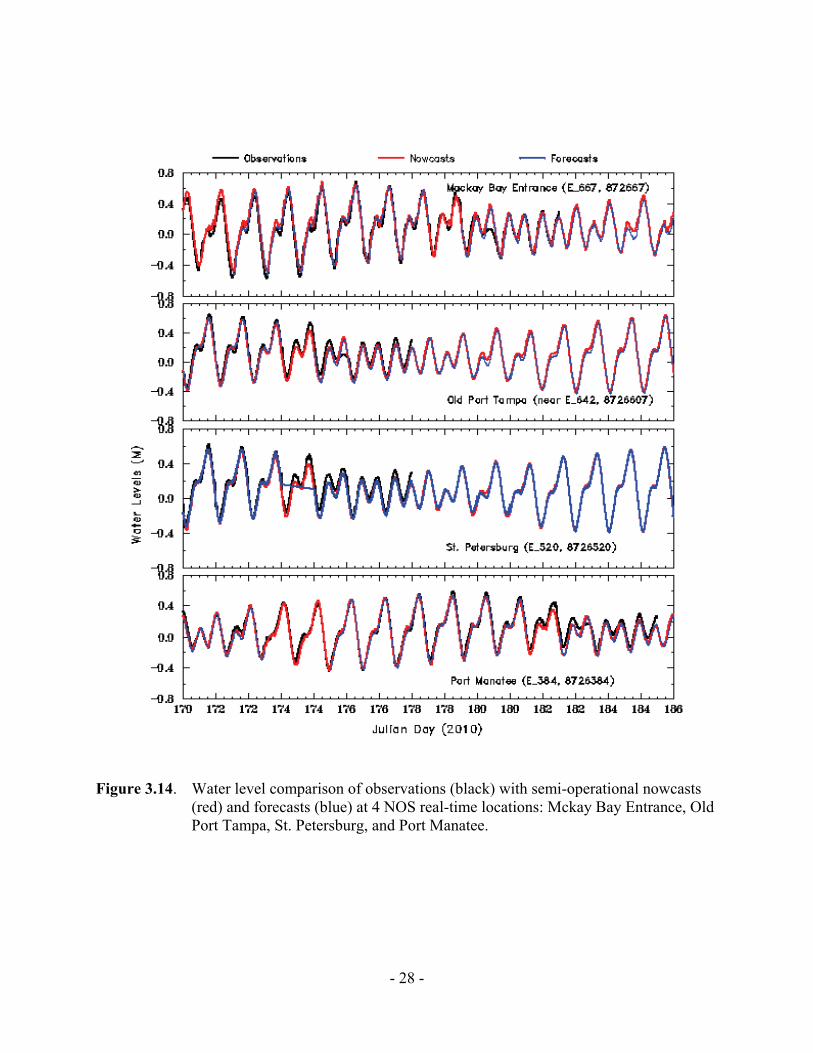
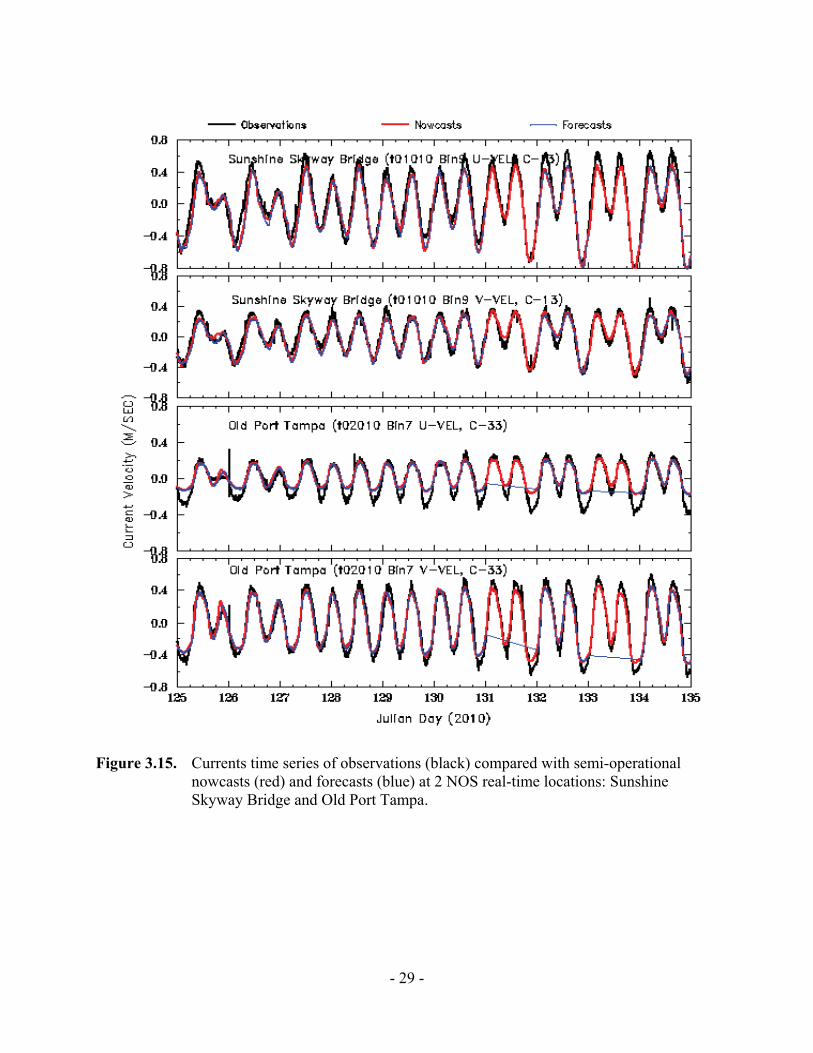
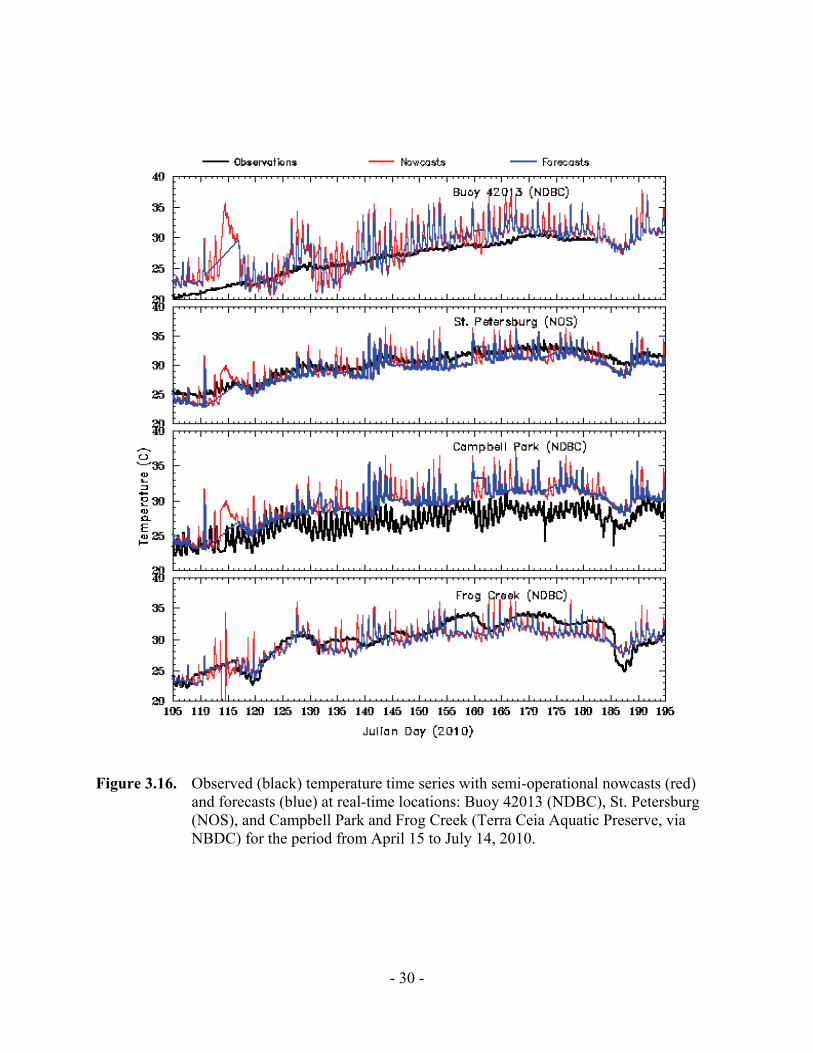
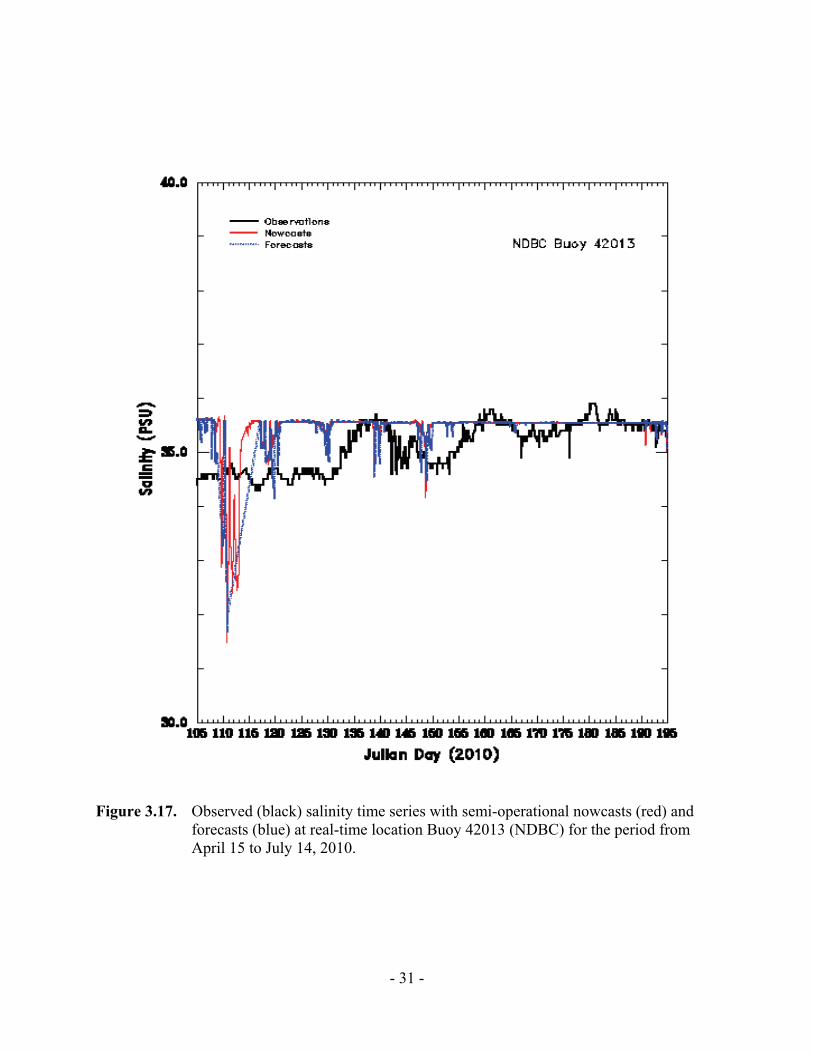
3.3. Semi-Operational Nowcast/Forecast Simulation The calibrated ROMS model for Tampa Bay was next implemented as an semi-operational nowcast/forecast system at NOAA’s NCEP high performance computer systems as part of process towards an operational nowcast/forecast model system. The TBOFS model system is currently running in multi-processor environment. Sub-tidal water levels along offshore open boundaries are derived from the operational Extra-tropical Storm Surge Model (ETSS) and are added to the tidal harmonic predictions for the lateral water level open boundary forcing. Surface meteorological forcing and heat flux are obtained from NCEP operational products of Real-Time Mesoscale Analysis (RTMA) for nowcast run and the North America Mesoscale model forecasts (NAM) for forecast run. Surface forcing includes winds, air pressure and temperature, relative humidity and radiation fluxes. River discharges and temperature are obtained from USGS real-time river measurement at 8 stations. A simplified schematic flow chart (Figure 3.12) shows the processes of TBOFS and the data flow within NCEP CCS. The data inflow and running procedures are managed by NOS Coastal Ocean Modeling Framework (COMF) system (Zhang et al., in preparation) together with other two operational systems under development: Chesapeake Bay (CBOFS) and Delaware Bay (DBOFS) Operational Forecast Systems. After the NCEP standard procedures of transition models from development to operations, TBOFS will be operational and provide forecast information of the Tampa Bay to the users in late 2010. The semi-operational TBOFS has been running at NCEP CCS since October 1, 2009. Semi-operational nowcasts and forecast guidance (up to 24 hours) from TBOFS at NOS real-time stations are archived for the period of April 15 to July 19, 2010 for operational skill assessments. They are: Mckay Bay Entrance (E_667 in Figure 3.1), Old Port Tampa (near E_641), St. Petersburg (E_520), and Port Manatee (E_384) for water levels; Sunshine Skyway Bridge (near C-13 in Figure 3.2) and Old Port Tampa (C-33) for current velocity; Frog Fork, Campbell Park, St. Petersburg, and NDBC Buoy 42013 for surface temperature (Figure 3.13); and NDBC Buoy 42013 for surface salinity (Figure 3.13). Skill assessments of semi-operational nowcast and forecasts for water level, current velocity at NOS standard depth (5 m below sea surface or half of the water depth), surface temperature, and surface salinity are listed in Appendices I, J, K, and L, respectively. Skill assessment discussion for semi-operational nowcast and forecast is presented in Chapter 4. Figures 3.14 and 3.15 show the time series of semi-operational water level and current speed nowcasts and forecasts with observations. Mixed tides are obvious on water levels and currents. Model simulated nowcasts and forecasts are almost identical and accurately follow the observations. Semi-operational nowcasts and forecasts for temperature and salinity are shown in Figures 3.16 and 17.
- 26 -
Figure 3.12. Schematic TBOFS run script and data flow chart.
- 27 -
Figure 3.13. Real-time observation locations for TBOFS semi-operational nowcasts and
forecasts verification for surface temperature and salinity.
- 28 -
Figure 3.14. Water level comparison of observations (black) with semi-operational nowcasts
(red) and forecasts (blue) at 4 NOS real-time locations: Mckay Bay Entrance, Old Port Tampa, St. Petersburg, and Port Manatee.
- 29 -
Figure 3.15. Currents time series of observations (black) compared with semi-operational
nowcasts (red) and forecasts (blue) at 2 NOS real-time locations: Sunshine Skyway Bridge and Old Port Tampa.
- 30 -
Figure 3.16. Observed (black) temperature time series with semi-operational nowcasts (red)
and forecasts (blue) at real-time locations: Buoy 42013 (NDBC), St. Petersburg (NOS), and Campbell Park and Frog Creek (Terra Ceia Aquatic Preserve, via NBDC) for the period from April 15 to July 14, 2010.
- 31 -
Figure 3.17. Observed (black) salinity time series with semi-operational nowcasts (red) and
forecasts (blue) at real-time location Buoy 42013 (NDBC) for the period from April 15 to July 14, 2010.

- 32 -
- 33 -
4. SKILL ASSEESSMENT STATISTICS AND DATA 4.1. Skill Assessment Statistics Model skill assessment was carried out using the NOS skill assessment software (Zhang et al., 2006). Tidal and hindcast model simulations were compared with observations to obtain a set of performance statistics for water levels, currents, temperatures and salinity. Some of the statistic parameters in the NOS skill assessment procedures for operational forecast systems (Hess, 2003; Zhang et. al., 2006) include the Root Mean Squared Error (RMSE), Central Frequency (CF), and Positive Outlier Frequency (POF) and Negative Outlier Frequency (NOF) for hourly records. The NOS statistic standard criteria is such that greater than 90% for CF, and less than 1% for NOF and POF. More detail definition of the above parameters can be found in NOAA’s technical report (Hess et al., 2003). In addition, a slightly different measure of model skill defined by Willmott (1981) and used by Warner et al, (2005) in a ROMS hydrodynamic simulation of the Hudson River was also computed for model comparison. Following Willmott, it takes the form,
2
mod
2
mod1obsobsobsel
obsel
XXXX
XXSkill
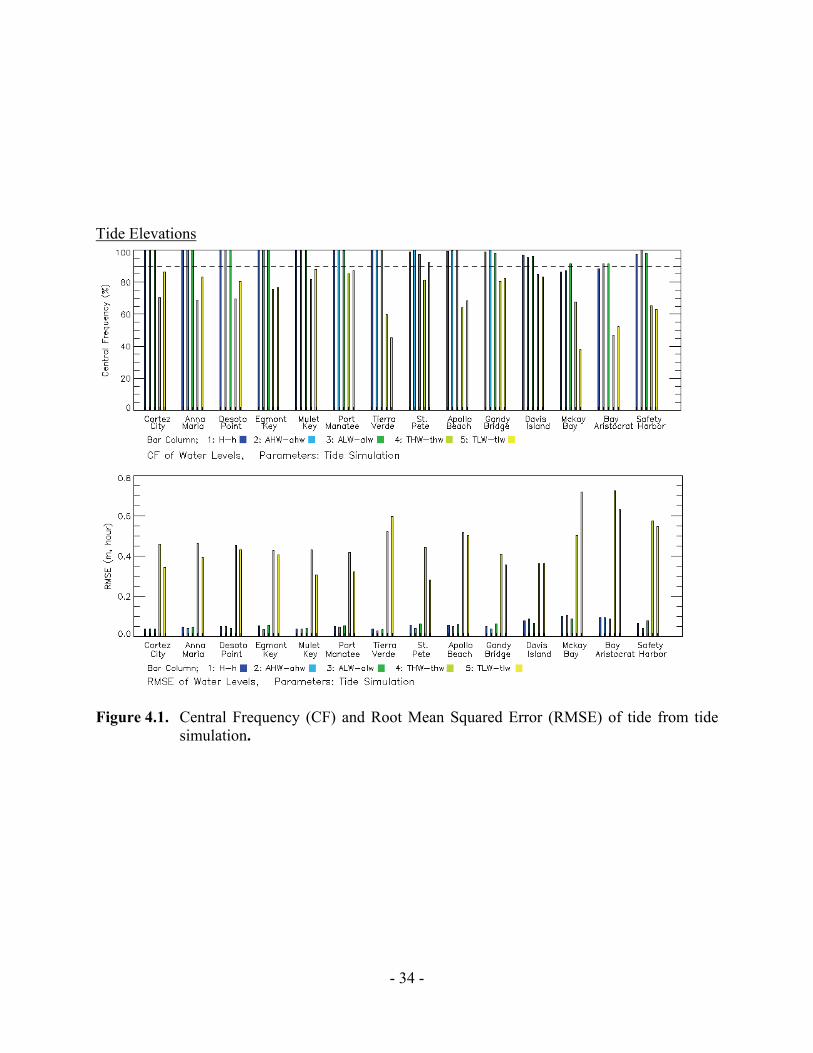
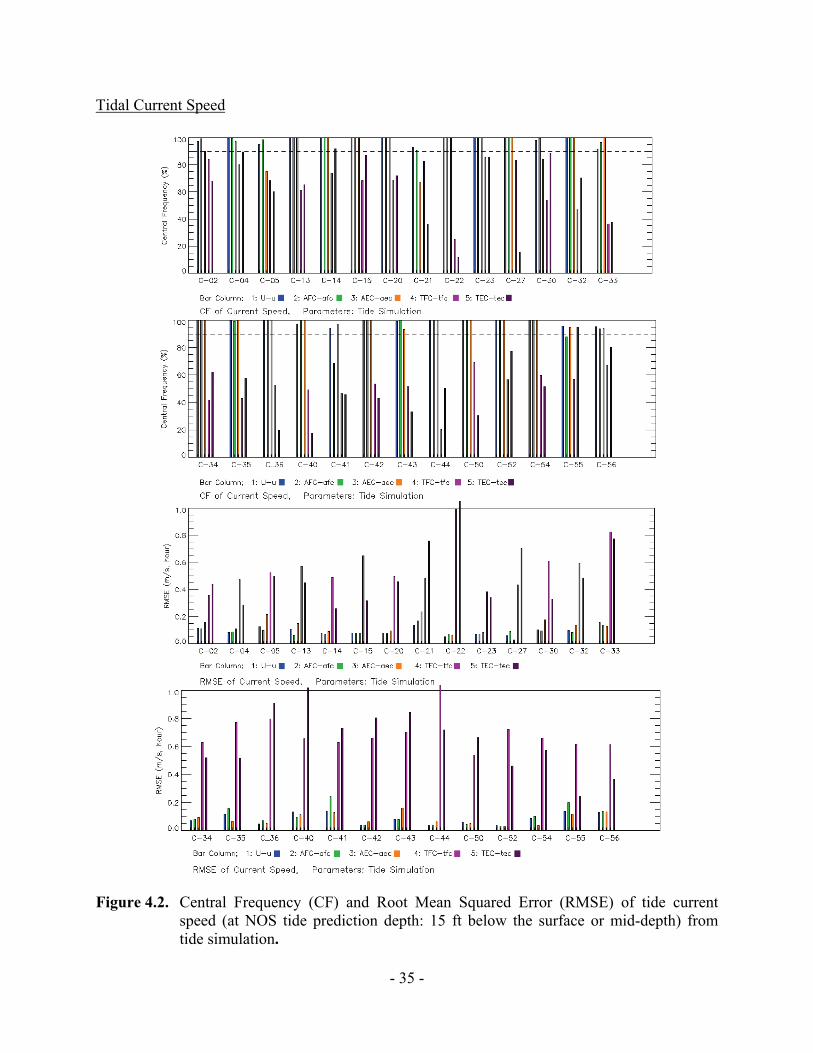
This parameter, called “index of agreement” by Willmott, is a relative average error and bounded measure. Perfect agreement between model results and observations will yield a skill of one and complete disagreement yields a skill of zero. Statistics resulted from skill assessment software application to tide, hindcast, semi-operational nowcast/forecast simulations are listed in detail as Appendices B to L. The CF and RMSE, two most critical statistic parameters are plotted as the bar charts and presented in this Section. 4.2. Tide Simulation Skills Figures 4.1 and 4.2 show the CF and RMSE of tides and tidal currents at 14 water level stations and 27 tidal current stations from tide simulations described in Section 3. NOS standard for CF (90%) is shown as the dashed line in the plot. Tidal water level comparisons are given in Appendix B and tidal current speed comparisons are given in Appendix C.
- 34 -
Tide Elevations
Figure 4.1. Central Frequency (CF) and Root Mean Squared Error (RMSE) of tide from tide
simulation.
- 35 -
Tidal Current Speed
Figure 4.2. Central Frequency (CF) and Root Mean Squared Error (RMSE) of tide current
speed (at NOS tide prediction depth: 15 ft below the surface or mid-depth) from tide simulation.
- 36 -
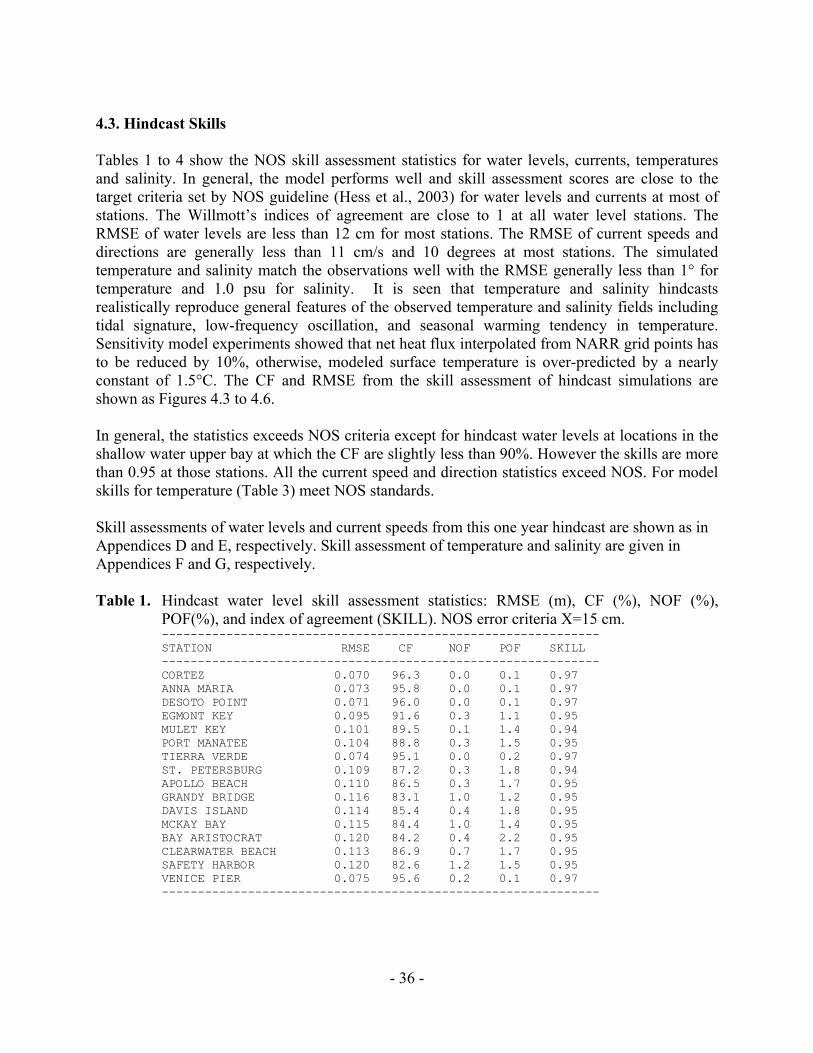
4.3. Hindcast Skills Tables 1 to 4 show the NOS skill assessment statistics for water levels, currents, temperatures and salinity. In general, the model performs well and skill assessment scores are close to the target criteria set by NOS guideline (Hess et al., 2003) for water levels and currents at most of stations. The Willmott’s indices of agreement are close to 1 at all water level stations. The RMSE of water levels are less than 12 cm for most stations. The RMSE of current speeds and directions are generally less than 11 cm/s and 10 degrees at most stations. The simulated temperature and salinity match the observations well with the RMSE generally less than 1° for temperature and 1.0 psu for salinity. It is seen that temperature and salinity hindcasts realistically reproduce general features of the observed temperature and salinity fields including tidal signature, low-frequency oscillation, and seasonal warming tendency in temperature. Sensitivity model experiments showed that net heat flux interpolated from NARR grid points has to be reduced by 10%, otherwise, modeled surface temperature is over-predicted by a nearly constant of 1.5°C. The CF and RMSE from the skill assessment of hindcast simulations are shown as Figures 4.3 to 4.6. In general, the statistics exceeds NOS criteria except for hindcast water levels at locations in the shallow water upper bay at which the CF are slightly less than 90%. However the skills are more than 0.95 at those stations. All the current speed and direction statistics exceed NOS. For model skills for temperature (Table 3) meet NOS standards. Skill assessments of water levels and current speeds from this one year hindcast are shown as in Appendices D and E, respectively. Skill assessment of temperature and salinity are given in Appendices F and G, respectively. Table 1. Hindcast water level skill assessment statistics: RMSE (m), CF (%), NOF (%),
POF(%), and index of agreement (SKILL). NOS error criteria X=15 cm. ------------------------------------------------------------- STATION RMSE CF NOF POF SKILL ------------------------------------------------------------- CORTEZ 0.070 96.3 0.0 0.1 0.97 ANNA MARIA 0.073 95.8 0.0 0.1 0.97 DESOTO POINT 0.071 96.0 0.0 0.1 0.97 EGMONT KEY 0.095 91.6 0.3 1.1 0.95 MULET KEY 0.101 89.5 0.1 1.4 0.94 PORT MANATEE 0.104 88.8 0.3 1.5 0.95 TIERRA VERDE 0.074 95.1 0.0 0.2 0.97 ST. PETERSBURG 0.109 87.2 0.3 1.8 0.94 APOLLO BEACH 0.110 86.5 0.3 1.7 0.95 GRANDY BRIDGE 0.116 83.1 1.0 1.2 0.95 DAVIS ISLAND 0.114 85.4 0.4 1.8 0.95 MCKAY BAY 0.115 84.4 1.0 1.4 0.95 BAY ARISTOCRAT 0.120 84.2 0.4 2.2 0.95 CLEARWATER BEACH 0.113 86.9 0.7 1.7 0.95 SAFETY HARBOR 0.120 82.6 1.2 1.5 0.95 VENICE PIER 0.075 95.6 0.2 0.1 0.97 -------------------------------------------------------------
- 37 -
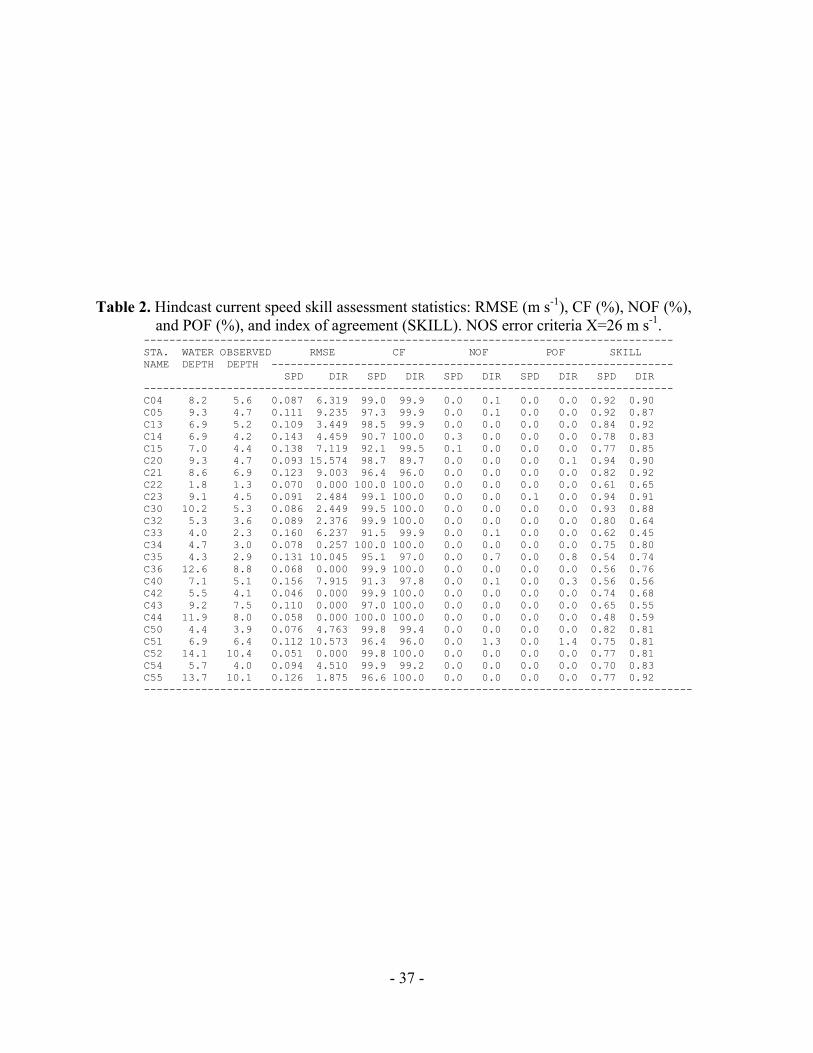
Table 2. Hindcast current speed skill assessment statistics: RMSE (m s-1), CF (%), NOF (%),
and POF (%), and index of agreement (SKILL). NOS error criteria X=26 m s-1. ----------------------------------------------------------------------------------- STA. WATER OBSERVED RMSE CF NOF POF SKILL NAME DEPTH DEPTH --------------------------------------------------------------- SPD DIR SPD DIR SPD DIR SPD DIR SPD DIR ----------------------------------------------------------------------------------- C04 8.2 5.6 0.087 6.319 99.0 99.9 0.0 0.1 0.0 0.0 0.92 0.90 C05 9.3 4.7 0.111 9.235 97.3 99.9 0.0 0.1 0.0 0.0 0.92 0.87 C13 6.9 5.2 0.109 3.449 98.5 99.9 0.0 0.0 0.0 0.0 0.84 0.92 C14 6.9 4.2 0.143 4.459 90.7 100.0 0.3 0.0 0.0 0.0 0.78 0.83 C15 7.0 4.4 0.138 7.119 92.1 99.5 0.1 0.0 0.0 0.0 0.77 0.85 C20 9.3 4.7 0.093 15.574 98.7 89.7 0.0 0.0 0.0 0.1 0.94 0.90 C21 8.6 6.9 0.123 9.003 96.4 96.0 0.0 0.0 0.0 0.0 0.82 0.92 C22 1.8 1.3 0.070 0.000 100.0 100.0 0.0 0.0 0.0 0.0 0.61 0.65 C23 9.1 4.5 0.091 2.484 99.1 100.0 0.0 0.0 0.1 0.0 0.94 0.91 C30 10.2 5.3 0.086 2.449 99.5 100.0 0.0 0.0 0.0 0.0 0.93 0.88 C32 5.3 3.6 0.089 2.376 99.9 100.0 0.0 0.0 0.0 0.0 0.80 0.64 C33 4.0 2.3 0.160 6.237 91.5 99.9 0.0 0.1 0.0 0.0 0.62 0.45 C34 4.7 3.0 0.078 0.257 100.0 100.0 0.0 0.0 0.0 0.0 0.75 0.80 C35 4.3 2.9 0.131 10.045 95.1 97.0 0.0 0.7 0.0 0.8 0.54 0.74 C36 12.6 8.8 0.068 0.000 99.9 100.0 0.0 0.0 0.0 0.0 0.56 0.76 C40 7.1 5.1 0.156 7.915 91.3 97.8 0.0 0.1 0.0 0.3 0.56 0.56 C42 5.5 4.1 0.046 0.000 99.9 100.0 0.0 0.0 0.0 0.0 0.74 0.68 C43 9.2 7.5 0.110 0.000 97.0 100.0 0.0 0.0 0.0 0.0 0.65 0.55 C44 11.9 8.0 0.058 0.000 100.0 100.0 0.0 0.0 0.0 0.0 0.48 0.59 C50 4.4 3.9 0.076 4.763 99.8 99.4 0.0 0.0 0.0 0.0 0.82 0.81 C51 6.9 6.4 0.112 10.573 96.4 96.0 0.0 1.3 0.0 1.4 0.75 0.81 C52 14.1 10.4 0.051 0.000 99.8 100.0 0.0 0.0 0.0 0.0 0.77 0.81 C54 5.7 4.0 0.094 4.510 99.9 99.2 0.0 0.0 0.0 0.0 0.70 0.83 C55 13.7 10.1 0.126 1.875 96.6 100.0 0.0 0.0 0.0 0.0 0.77 0.92 --------------------------------------------------------------------------------------
- 38 -
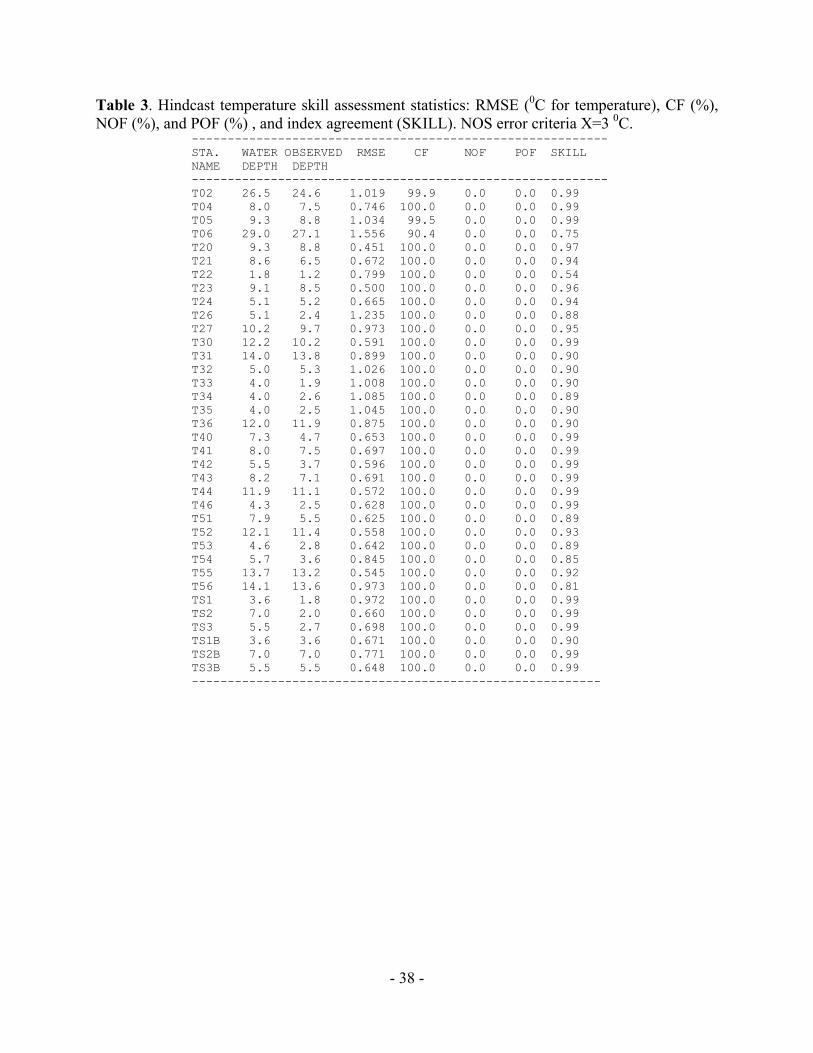
Table 3. Hindcast temperature skill assessment statistics: RMSE (0C for temperature), CF (%), NOF (%), and POF (%) , and index agreement (SKILL). NOS error criteria X=3 0C.
---------------------------------------------------------- STA. WATER OBSERVED RMSE CF NOF POF SKILL NAME DEPTH DEPTH ---------------------------------------------------------- T02 26.5 24.6 1.019 99.9 0.0 0.0 0.99 T04 8.0 7.5 0.746 100.0 0.0 0.0 0.99 T05 9.3 8.8 1.034 99.5 0.0 0.0 0.99 T06 29.0 27.1 1.556 90.4 0.0 0.0 0.75 T20 9.3 8.8 0.451 100.0 0.0 0.0 0.97 T21 8.6 6.5 0.672 100.0 0.0 0.0 0.94 T22 1.8 1.2 0.799 100.0 0.0 0.0 0.54 T23 9.1 8.5 0.500 100.0 0.0 0.0 0.96 T24 5.1 5.2 0.665 100.0 0.0 0.0 0.94 T26 5.1 2.4 1.235 100.0 0.0 0.0 0.88 T27 10.2 9.7 0.973 100.0 0.0 0.0 0.95 T30 12.2 10.2 0.591 100.0 0.0 0.0 0.99 T31 14.0 13.8 0.899 100.0 0.0 0.0 0.90 T32 5.0 5.3 1.026 100.0 0.0 0.0 0.90 T33 4.0 1.9 1.008 100.0 0.0 0.0 0.90 T34 4.0 2.6 1.085 100.0 0.0 0.0 0.89 T35 4.0 2.5 1.045 100.0 0.0 0.0 0.90 T36 12.0 11.9 0.875 100.0 0.0 0.0 0.90 T40 7.3 4.7 0.653 100.0 0.0 0.0 0.99 T41 8.0 7.5 0.697 100.0 0.0 0.0 0.99 T42 5.5 3.7 0.596 100.0 0.0 0.0 0.99 T43 8.2 7.1 0.691 100.0 0.0 0.0 0.99 T44 11.9 11.1 0.572 100.0 0.0 0.0 0.99 T46 4.3 2.5 0.628 100.0 0.0 0.0 0.99 T51 7.9 5.5 0.625 100.0 0.0 0.0 0.89 T52 12.1 11.4 0.558 100.0 0.0 0.0 0.93 T53 4.6 2.8 0.642 100.0 0.0 0.0 0.89 T54 5.7 3.6 0.845 100.0 0.0 0.0 0.85 T55 13.7 13.2 0.545 100.0 0.0 0.0 0.92 T56 14.1 13.6 0.973 100.0 0.0 0.0 0.81 TS1 3.6 1.8 0.972 100.0 0.0 0.0 0.99 TS2 7.0 2.0 0.660 100.0 0.0 0.0 0.99 TS3 5.5 2.7 0.698 100.0 0.0 0.0 0.99 TS1B 3.6 3.6 0.671 100.0 0.0 0.0 0.90 TS2B 7.0 7.0 0.771 100.0 0.0 0.0 0.99 TS3B 5.5 5.5 0.648 100.0 0.0 0.0 0.99 ---------------------------------------------------------
- 39 -
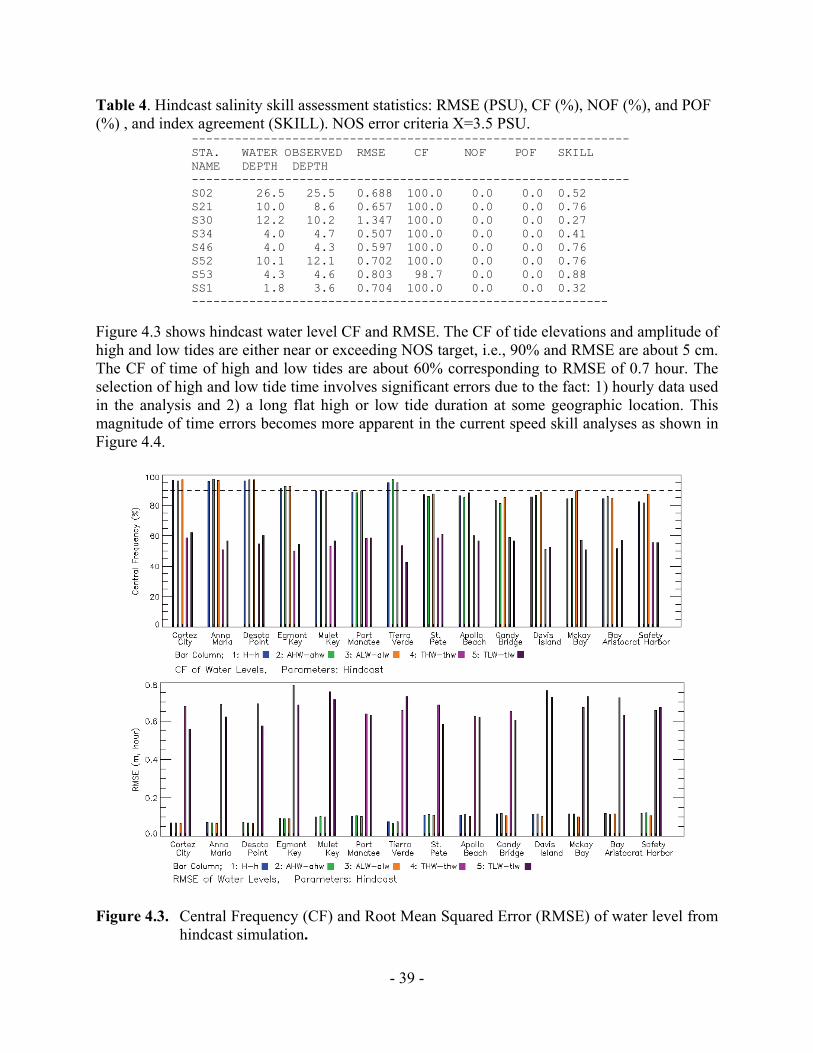
Table 4. Hindcast salinity skill assessment statistics: RMSE (PSU), CF (%), NOF (%), and POF (%) , and index agreement (SKILL). NOS error criteria X=3.5 PSU.
------------------------------------------------------------- STA. WATER OBSERVED RMSE CF NOF POF SKILL NAME DEPTH DEPTH ------------------------------------------------------------- S02 26.5 25.5 0.688 100.0 0.0 0.0 0.52 S21 10.0 8.6 0.657 100.0 0.0 0.0 0.76 S30 12.2 10.2 1.347 100.0 0.0 0.0 0.27 S34 4.0 4.7 0.507 100.0 0.0 0.0 0.41 S46 4.0 4.3 0.597 100.0 0.0 0.0 0.76 S52 10.1 12.1 0.702 100.0 0.0 0.0 0.76 S53 4.3 4.6 0.803 98.7 0.0 0.0 0.88 SS1 1.8 3.6 0.704 100.0 0.0 0.0 0.32 ----------------------------------------------------------
Figure 4.3 shows hindcast water level CF and RMSE. The CF of tide elevations and amplitude of high and low tides are either near or exceeding NOS target, i.e., 90% and RMSE are about 5 cm. The CF of time of high and low tides are about 60% corresponding to RMSE of 0.7 hour. The selection of high and low tide time involves significant errors due to the fact: 1) hourly data used in the analysis and 2) a long flat high or low tide duration at some geographic location. This magnitude of time errors becomes more apparent in the current speed skill analyses as shown in Figure 4.4.
Figure 4.3. Central Frequency (CF) and Root Mean Squared Error (RMSE) of water level from hindcast simulation.
- 40 -
Current Speed Skill
Figure 4.4. Central Frequency (CF) and Root Mean Squared Error (RMSE) of current speed
from hindcast simulation at NOS current prediction depth (5 m from the water surface or mid-depth).
- 41 -
Temperature Skill
Figure 4.5. Central Frequency (CF) and Root Mean Squared Error (RMSE) of temperature
from hindcast simulation. Salinity Skill
Figure 4.6. Central Frequency (CF) and Root Mean Squared Error (RMSE) of salinity from
hindcast simulation.
- 42 -
4.4. Tidal Constituent Comparison Simulated water levels from the one-year hindcast are harmonically analyzed by a least squared method for tidal constituents and compared with the observations. The tide amplitude comparison of the most significant constituents (M2, O1, K1, S2, N2, and M4) is given in Figure 4.7 in bar chart format for water levels. Except K1 at Cortez and Egmont Key, the differences between observed and simulated tidal constituent amplitude are in the order of 1 to 2 cm. Current comparisons are given in Appendix H. 4.5. Semi-operational Nowcast/Forecast Skill Assessment Water level nowcast and forecast from semi-operational runs at 4 NOS operational stations are archived and compared with observations from NOS’s COOPS NWLON data base and listed in Appendix I. The system nowcast and forecast performance satisfy NOS skill criteria for most of parameters except the time of high and low water where the RMSE is in the order of 30 minutes. The Central Frequency (CF) of forecast does not degrade within 24 hours and the RMSE remains around 5 cm. Current speed and direction at the NOS real-time water depth (about 5 m from the surface) from nowcast and forecast runs are compared with observations and the skill statistics are listed in Appendix J. The skills show near 100% of CF in current direction nowcast and forecast. The nowcast and forecast CF of current speed are over 90% except the maximum ebbing current at Old Port Tampa (76%). However, the time of maximum currents and slacks are in the order of 60% with RMSE over 30 minutes in general. Surface temperature from semi-operational nowcast/forecast runs at Buoy 42013, St. Petersburg, Campbell Park, Frog Creek are compared with observations obtained from NDBC, COOPS, and Terra Ceia Aquatic Preserve to generate skill assessment tables listed in Appendix K. The surface temperature nowcast/forecast skills indicate the model system accurately predicted surface temperature at these two stations. The RMSE in the order of 1.50 C with forecast skill slightly better than the nowcast probably due to the effect from the heat flux surface forcing (from atmospheric forecasts) to the model. Surface salinity observations are available from NDBC Buoy 42013 located on West Florida Shelf near the model grid offshore open boundary (Figure 3.2). Skills for surface salinity nowcast/forecast at this location is listed as Appendix L. RMSE of 0.5 PSU for nowcasts and 0.8 PSU for forecasts at this station show the model system forced with the salinity open boundary condition by NCOM model nowcasts and forecasts are well represented.
- 43 -
Figure 4.7. Tidal constituents (M2, O1, K1, N2, S2) comparison between observations and
hindcast.
- 44 -
Figure 4.8. Central Frequency (CF) and Root Mean Squared Error (RMSE) of water
levels from semi-operational runs.
Figure 4.9. Central Frequency (CF) and Root Mean Squared Error (RMSE) of current speed
from semi-operational runs.
- 45 -
Figure 4.10. Central Frequency (CF) and Root Mean Squared Error (RMSE) of temperature
from semi-operational runs.
Figure 4.11. Central Frequency (CF) and Root Mean Squared Error (RMSE) salinity from semi-
operational runs.

- 46 -
- 47 -
5. SUMMARY The ROMS model has been tested and evaluated for hydrodynamic simulations of Tampa Bay as part of the development of an operational nowcast/forecast system. The observations from an extensive 1990-1991 NOS circulation survey were analyzed and used for model calibration and validation. Model initial conditions for temperature and salinity are generated from monthly measurements from the Environmental Protection Commission of Hillsborough County (EPCHC). The averaged surface circulation from the tidal simulation compared well with previous studies by Weisberg et al., (1991, 2006) and shows that the model is capable of representing well the tidal circulation patterns from the Bay entrance to the upper bay. The performance of the ROMS hindcast simulations was evaluated by comparison with observed water levels, currents, temperatures, and salinity. The model results show that the currents are simulated very well throughout Tampa Bay in both speed and direction. The values of RMSE are generally less than 10 cm/s for maximum current speeds that range from 30 cm/s to 70 cm/s. Skill assessment statistics for water levels, currents, temperatures, and salinity evaluated at stations exceed the NOS criteria with the exception of the water level Central Frequency at some stations inside the upper shallow portion of the bay. The temperature hindcast time series shows that the model is capable of reproducing the annual cycle of surface water temperature. The calibrated ROMS-based model for Tampa Bay is being implemented on NOAA high performance computers (NCEP CCS) as a nowcast/forecast model to provide real-time and forecast information of water levels, currents, temperatures and salinity for mariners navigating in Tampa Bay. Skill assessment from semi-operational nowcast/forecast runs at NCEP CCS meets NOS operational model system standard. The TBOFS will be implemented as an NOAA operational system in 2011. ACKNOWLEDGEMENTS We would like to thank our colleagues Frank Aikman, Richard Schmalz, Lyon Lanerolle at NOS’s Coast Survey Development Laboratory and Mark Vincent of Office of Oceanic Atmospheric Research (formerly at the Center for Operational Oceanographic Products and Services) for their discussions, suggestions and comments during TBOFS development.
- 48 -
REFERENCES Burwell, D., M. Vincent, M. Luther, and B. Galperin, 2000. Modeling Residence Times:
Eulerian vs Lagrangian, in Estuarine and Coastal Modeling, edited by M.L. Spaulding and H.L. Butler, pp 995 – 1009, ASCE, Reston, Va.
Blumberg, A., 1990. A Primer for ECOM-3D. Hydroqual, Inc. Mahwah, New Jersey. 58 pages. Galperin, B., A. F. Blumberg, and R. H. Weisberg, 1991,The importance of density driven
circulation in well mixed estuaries: The Tampa Bay experience, in Estuarine and Coastal Modeling, edited by M. L. Spaulding and A. Blumberg, pp. 332 –343, Am. Soc. of Civ. Eng., Tampa, Fla
Haidvogel, D.B., H. Arango, W.P. Budgell, B.D. Cornuelle, E. Curchitser, E. Di Lorenzo, K.
Fennel, W.R. Geyer, A.J. Hermann, L. Lanerolle, J. Levin, J.C. McWilliams, A.J. Miller, A.M. Moore, T.M. Powell, A.F. Shchepetkin, C.R. Sherwood, R.P. Signell, J.C. Warner, J. Wilkin. 2008. Ocean forecasting in terrain-following coordinates: Formulation and skill assessment of the Regional Ocean Modeling System, Journal of Computational Physics, Vol. 27 No. 7, 3595-3624.
Hess, K. W., and K. Bosley, 1991. Methodology for Validation of a Tampa Bay Circulation
Model, in Estuarine and Coastal Modeling, edited by M.L. Spaulding , ASCE. p. 83-94. Hess, K. W., 1993. Modeling astronomical tides and currents in Tampa Bay. Proceedings,
International Conference on HydroScience and Engineering, Washington, DC, June 8-11, 1993, pp. 1499 - 1506.
Hess, K. W., 2001. Generation of Tidal Datum Fields for Tampa Bay and the New York Bight.
U.S. Department of Commerce, National Oceanic and Atmospheric Administration, Silver Spring, Maryland, NOAA Technical Report NOS CS 11, 43 p.
Meyers, S.D., E. M. Luther, M. Wilson, H. Havens, A. Linville, and K. Sopkin, 2007. A
Numerical Simulation of Residual Circulation in Tampa Bay. Part I: Low-frequency Temporal Variations. Estuaries and Coasts, Vol. 30, No. 4, p. 679-697. August 2007.
Mukai A.Y., J.J. Westerink, R.A. Luettich Jr., and D. Mark, 2002. “Eastcoast 2001: a tidal
constituent database for the western North Atlantic, Gulf of Mexico and Caribbean Sea”, US Army Engineer Research and Development Center, Coastal and Hydraulics Laboratory, Technical Report, ERDC/CHL TR-02-24, September 2002, 201p.
Nowadly, F. ed., 1992. Tampa Bay Oceanography Project: 1990-1991. NOS Oceanographic
Circulation Survey Report No. 11, 25 pp + appendices. Vincent, M., D. Burwell, and M. Luther, 2000, The Tampa Bay Nowcast-Forecast System, in
Estuarine and Coastal Modeling, edited by M. L. Spaulding and H. L. Butler, pp. 765 –780, Am. Soc. of Civ. Eng., Reston, Va.
- 49 -
Warner, J., W. R. Geyer, and J. Lerczak, 2005. Numerical modeling of an estuary: A
comprehensive skill assessment. Journal of Geophysical Research, 110, C05001. Weisberg, R. H., and R. G. Williams (1991), Initial findings of the circulation of Tampa Bay, in
Proceedings of Tampa Bay Area Scientific Information Symposium, vol. 2, edited by S. Treat and P. Clark, pp. 49 –66, Tampa, Fla.
Weisberg, R. H., and L.Y. Zheng, 2006. Circulation of Tampa Bay driven by buoyancy, tides,
and winds, as simulated using a finite volume coastal ocean model, J. Geophys. Res., 111, C01005, doi:10.1029/2005JC003067.
Willmott, C. J. 1981, On the validation of models, Physical Geography, 2. 184-194. Wilson, M, S.D. Meyers, and M.E. Luther, 2006. Changes in the circulation of Tampa Bay due
to Hurricane Frances as recorded by ADCP measurements and reproduced with a numerical ocean model. Estuaries and Coasts, Vol. 29, No. 6A, p. 914-918. December 2006.
Zervas, C. E. (Ed.) (1993), Tampa Bay Oceanography Project: Physical oceanographic synthesis,
NOAA Tech. Rep., NOS OES 002, 184 pp. Zheng, L. Y., and R. H. Weisberg, 2004. Tide, buoyancy, and wind-driven circulation of the
Charlotte Harbor estuary: A model study, J. Geophys. Res., 109, C06011, doi:10.1029/2003JC001996
Zhang, A., K. W. Hess, E. Wei, and E. Myers, 2006. Implementation of Model Skill Assessment
Software for Water Level and Current. NOAA Technical Report NOS CS 24, 61pp. Zhang, A., Z. Yang, M. Greg, D. Cao, F. Aikman, J. Kelley, E. Wei, R. Schmalz, L. Lanerolle,
and M. Vincent. 2010. High Performance Computer Coastal Ocean Modeling Framework for the NOS Costal Operational Forecast System. NOAA Technical Report, CO-OPS TRXX (in preparation).

- 50 -
- 51 -
APPENDIX A: ROMS CPPDEFS.H A.1 Tide simulation #define SOLVE3D #define CURVGRID #define MASKING #undef WET_DRY #define SALINITY #ifdef SALINITY # define ANA_BSFLUX # define ANA_SSFLUX #endif #define NONLIN_EOS #define UV_ADV #define UV_COR #undef UV_QDRAG #define UV_LOGDRAG #define UV_SADVECTION #define TS_U3HADVECTION #define TS_SVADVECTION #define DJ_GRADPS #define SPLINES #define RADIATION_2D #define SOUTH_M3RADIATION #define SOUTH_TRADIATION #define ANA_FSOBC #define ANA_M2OBC #define SSH_TIDES #define RAMP_TIDES #define SOUTH_FSCLAMPED #define FSOBC_REDUCED #ifdef FSOBC_REDUCED # define SOUTH_M2REDUCED #endif #undef UV_TIDES #ifdef UV_TIDES # define SOUTH_M2FLATHER #endif #define MY25_MIXING #define STATIONS #define PERFECT_RESTART #ifdef PERFECT_RESTART #define AVERAGES # define OUT_DOUBLE #endif #define ANA_BTFLUX #define ANA_STFLUX #define ANA_SMFLUX #define ANA_SMFLUX #define ANA_STFLUX

- 52 -
A.2. Hindcast #define SOLVE3D #define CURVGRID #define MASKING #undef WET_DRY #define ATM_PRESS #define SALINITY #ifdef SALINITY # define ANA_BSFLUX # define ANA_SSFLUX #endif #define NONLIN_EOS #define UV_ADV #define UV_COR #undef UV_QDRAG #define UV_LOGDRAG #define UV_SADVECTION #define TS_U3HADVECTION #define TS_SVADVECTION #define DJ_GRADPS #define SPLINES #define RADIATION_2D #define SOUTH_M3RADIATION #define SOUTH_TRADIATION #define SOUTH_TNUDGING #undef ANA_FSOBC #define ANA_M2OBC #define SSH_TIDES #define RAMP_TIDES #ifdef SSH_TIDES # define SOUTH_FSCHAPMAN #endif #define ADD_FSOBC #define FSOBC_REDUCED #ifdef FSOBC_REDUCED # define SOUTH_M2REDUCED #endif #undef UV_TIDES #ifdef UV_TIDES # define SOUTH_M2FLATHER #endif #define MY25_MIXING #undef GLS_MIXING #if defined MY25_MIXING || defined GLS_MIXING # define N2S2_HORAVG # define KANTHA_CLAYSON #endif #define STATIONS #define PERFECT_RESTART #ifdef PERFECT_RESTART # define AVERAGES # undef DIAGNOSTICS_BIO
- 53 -
# undef DIAGNOSTICS_TS # undef DIAGNOSTICS_UV # define OUT_DOUBLE #endif #define ANA_BTFLUX #define ANA_STFLUX #define ANA_SMFLUX #define BULK_FLUXES #ifdef BULK_FLUXES # define LONGWAVE_OUT # define ANA_CLOUD # define ANA_RAIN #else # define ANA_SMFLUX # define ANA_STFLUX #endif #define UV_PSOURCE #define TS_PSOURCE

- 54 -
- 55 -
APPENDIX B. SKILL ASSESSMENT SCORE TABLES FOR TIDES Station: Cortez Observed data time period from: / 6/ 8/1990 to / 6/ 9/1991 Data gap is filled using SVD method Data are not filtered ------------------------------------------------------------------------------------------- VARIABLE X N IMAX SM RMSE SD NOF CF POF MDNO MDPO WOF SKILL CRITERION - - - - - - <1% >90% <1% <N <N <.5% ------------------------------------------------------------------------------------------- SCENARIO: TIDAL SIMULATION ONLY H 87840 0.011 h 87840 0.016 H-h 15 cm 24h 87840 -0.005 0.039 0.039 0.0 100.0 0.0 0.0 0.0 0.00 0.99 AHW-ahw 15 cm 24h 617 0.004 0.036 0.036 0.0 100.0 0.0 0.0 0.0 ALW-alw 15 cm 24h 617 -0.010 0.038 0.036 0.0 100.0 0.0 0.0 0.0 THW-thw 0.50 h 25h 617 -0.106 0.460 0.448 1.9 70.2 1.1 24.9 0.0 TLW-tlw 0.50 h 25h 617 -0.007 0.343 0.344 0.2 86.2 0.2 0.0 0.0 Station: Anna Maria Outside Observed data time period from: / 6/ 8/1990 to / 6/ 9/1991 Data gap is filled using SVD method Data are not filtered ------------------------------------------------------------------------------------------- VARIABLE X N IMAX SM RMSE SD NOF CF POF MDNO MDPO WOF SKILL CRITERION - - - - - - <1% >90% <1% <N <N <.5% ------------------------------------------------------------------------------------------- SCENARIO: TIDAL SIMULATION ONLY H 87840 0.000 h 87840 -0.013 H-h 15 cm 24h 87840 0.013 0.046 0.044 0.0 100.0 0.0 0.0 0.0 0.00 0.99 AHW-ahw 15 cm 24h 619 0.012 0.041 0.039 0.0 100.0 0.0 0.0 0.0 ALW-alw 15 cm 24h 619 0.024 0.046 0.039 0.0 100.0 0.0 0.0 0.0 THW-thw 0.50 h 25h 619 -0.028 0.463 0.463 1.0 68.8 2.4 24.6 0.0 TLW-tlw 0.50 h 25h 619 0.005 0.393 0.393 0.0 83.2 2.6 0.0 0.0 Station: Venice Pier Observed data time period from: / 6/ 8/1990 to / 6/ 9/1991 Data gap is filled using SVD method Data are not filtered ------------------------------------------------------------------------------------------- VARIABLE X N IMAX SM RMSE SD NOF CF POF MDNO MDPO WOF SKILL CRITERION - - - - - - <1% >90% <1% <N <N <.5% ------------------------------------------------------------------------------------------- SCENARIO: TIDAL SIMULATION ONLY H 87840 0.000 h 87840 0.000 H-h 15 cm 24h 87840 0.000 0.027 0.027 0.0 100.0 0.0 0.0 0.0 0.00 1.00 AHW-ahw 15 cm 24h 619 0.009 0.027 0.026 0.0 100.0 0.0 0.0 0.0 ALW-alw 15 cm 24h 619 0.001 0.024 0.024 0.0 100.0 0.0 0.0 0.0 THW-thw 0.50 h 25h 619 -0.013 0.383 0.383 0.2 78.5 0.6 0.0 0.0 TLW-tlw 0.50 h 25h 619 0.041 0.295 0.292 0.0 88.4 0.8 0.0 0.0 Station: Desoto Point Observed data time period from: / 6/ 8/1990 to / 6/ 9/1991 Data gap is filled using SVD method Data are not filtered ------------------------------------------------------------------------------------------- VARIABLE X N IMAX SM RMSE SD NOF CF POF MDNO MDPO WOF SKILL CRITERION - - - - - - <1% >90% <1% <N <N <.5% ------------------------------------------------------------------------------------------- SCENARIO: TIDAL SIMULATION ONLY H 87840 0.009 h 87840 -0.011 H-h 15 cm 24h 87840 0.020 0.051 0.047 0.0 100.0 0.0 0.0 0.0 0.00 0.98 AHW-ahw 15 cm 24h 609 0.029 0.050 0.041 0.0 100.0 0.0 0.0 0.0 ALW-alw 15 cm 24h 609 0.014 0.040 0.037 0.0 100.0 0.0 0.0 0.0 THW-thw 0.50 h 25h 609 -0.082 0.454 0.447 1.0 69.6 1.3 49.1 0.0 TLW-tlw 0.50 h 25h 609 -0.043 0.430 0.428 0.3 80.3 2.5 0.0 0.0
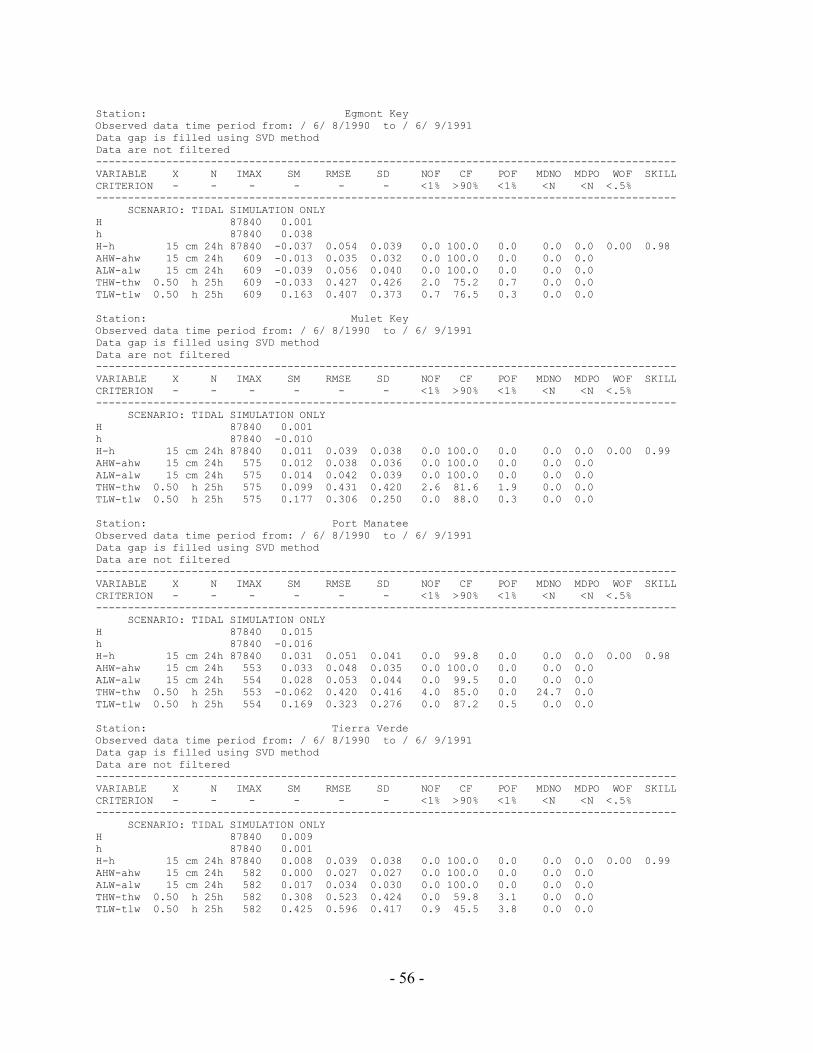
- 56 -
Station: Egmont Key Observed data time period from: / 6/ 8/1990 to / 6/ 9/1991 Data gap is filled using SVD method Data are not filtered ------------------------------------------------------------------------------------------- VARIABLE X N IMAX SM RMSE SD NOF CF POF MDNO MDPO WOF SKILL CRITERION - - - - - - <1% >90% <1% <N <N <.5% ------------------------------------------------------------------------------------------- SCENARIO: TIDAL SIMULATION ONLY H 87840 0.001 h 87840 0.038 H-h 15 cm 24h 87840 -0.037 0.054 0.039 0.0 100.0 0.0 0.0 0.0 0.00 0.98 AHW-ahw 15 cm 24h 609 -0.013 0.035 0.032 0.0 100.0 0.0 0.0 0.0 ALW-alw 15 cm 24h 609 -0.039 0.056 0.040 0.0 100.0 0.0 0.0 0.0 THW-thw 0.50 h 25h 609 -0.033 0.427 0.426 2.0 75.2 0.7 0.0 0.0 TLW-tlw 0.50 h 25h 609 0.163 0.407 0.373 0.7 76.5 0.3 0.0 0.0 Station: Mulet Key Observed data time period from: / 6/ 8/1990 to / 6/ 9/1991 Data gap is filled using SVD method Data are not filtered -------------------------------------------------------------------------------------------VARIABLE X N IMAX SM RMSE SD NOF CF POF MDNO MDPO WOF SKILL CRITERION - - - - - - <1% >90% <1% <N <N <.5% ------------------------------------------------------------------------------------------- SCENARIO: TIDAL SIMULATION ONLY H 87840 0.001 h 87840 -0.010 H-h 15 cm 24h 87840 0.011 0.039 0.038 0.0 100.0 0.0 0.0 0.0 0.00 0.99 AHW-ahw 15 cm 24h 575 0.012 0.038 0.036 0.0 100.0 0.0 0.0 0.0 ALW-alw 15 cm 24h 575 0.014 0.042 0.039 0.0 100.0 0.0 0.0 0.0 THW-thw 0.50 h 25h 575 0.099 0.431 0.420 2.6 81.6 1.9 0.0 0.0 TLW-tlw 0.50 h 25h 575 0.177 0.306 0.250 0.0 88.0 0.3 0.0 0.0 Station: Port Manatee Observed data time period from: / 6/ 8/1990 to / 6/ 9/1991 Data gap is filled using SVD method Data are not filtered ------------------------------------------------------------------------------------------- VARIABLE X N IMAX SM RMSE SD NOF CF POF MDNO MDPO WOF SKILL CRITERION - - - - - - <1% >90% <1% <N <N <.5% ------------------------------------------------------------------------------------------- SCENARIO: TIDAL SIMULATION ONLY H 87840 0.015 h 87840 -0.016 H-h 15 cm 24h 87840 0.031 0.051 0.041 0.0 99.8 0.0 0.0 0.0 0.00 0.98 AHW-ahw 15 cm 24h 553 0.033 0.048 0.035 0.0 100.0 0.0 0.0 0.0 ALW-alw 15 cm 24h 554 0.028 0.053 0.044 0.0 99.5 0.0 0.0 0.0 THW-thw 0.50 h 25h 553 -0.062 0.420 0.416 4.0 85.0 0.0 24.7 0.0 TLW-tlw 0.50 h 25h 554 0.169 0.323 0.276 0.0 87.2 0.5 0.0 0.0 Station: Tierra Verde Observed data time period from: / 6/ 8/1990 to / 6/ 9/1991 Data gap is filled using SVD method Data are not filtered ------------------------------------------------------------------------------------------- VARIABLE X N IMAX SM RMSE SD NOF CF POF MDNO MDPO WOF SKILL CRITERION - - - - - - <1% >90% <1% <N <N <.5% ------------------------------------------------------------------------------------------- SCENARIO: TIDAL SIMULATION ONLY H 87840 0.009 h 87840 0.001 H-h 15 cm 24h 87840 0.008 0.039 0.038 0.0 100.0 0.0 0.0 0.0 0.00 0.99 AHW-ahw 15 cm 24h 582 0.000 0.027 0.027 0.0 100.0 0.0 0.0 0.0 ALW-alw 15 cm 24h 582 0.017 0.034 0.030 0.0 100.0 0.0 0.0 0.0 THW-thw 0.50 h 25h 582 0.308 0.523 0.424 0.0 59.8 3.1 0.0 0.0 TLW-tlw 0.50 h 25h 582 0.425 0.596 0.417 0.9 45.5 3.8 0.0 0.0
- 57 -
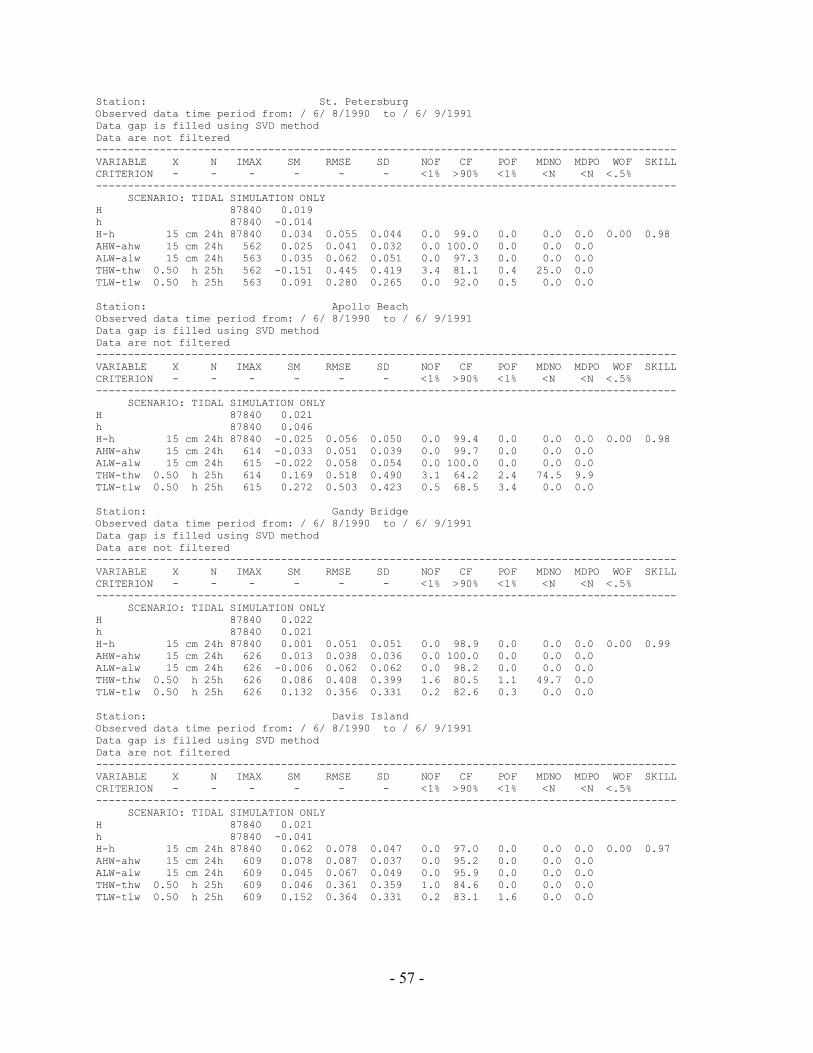
Station: St. Petersburg Observed data time period from: / 6/ 8/1990 to / 6/ 9/1991 Data gap is filled using SVD method Data are not filtered ------------------------------------------------------------------------------------------- VARIABLE X N IMAX SM RMSE SD NOF CF POF MDNO MDPO WOF SKILL CRITERION - - - - - - <1% >90% <1% <N <N <.5% ------------------------------------------------------------------------------------------- SCENARIO: TIDAL SIMULATION ONLY H 87840 0.019 h 87840 -0.014 H-h 15 cm 24h 87840 0.034 0.055 0.044 0.0 99.0 0.0 0.0 0.0 0.00 0.98 AHW-ahw 15 cm 24h 562 0.025 0.041 0.032 0.0 100.0 0.0 0.0 0.0 ALW-alw 15 cm 24h 563 0.035 0.062 0.051 0.0 97.3 0.0 0.0 0.0 THW-thw 0.50 h 25h 562 -0.151 0.445 0.419 3.4 81.1 0.4 25.0 0.0 TLW-tlw 0.50 h 25h 563 0.091 0.280 0.265 0.0 92.0 0.5 0.0 0.0 Station: Apollo Beach Observed data time period from: / 6/ 8/1990 to / 6/ 9/1991 Data gap is filled using SVD method Data are not filtered ------------------------------------------------------------------------------------------- VARIABLE X N IMAX SM RMSE SD NOF CF POF MDNO MDPO WOF SKILL CRITERION - - - - - - <1% >90% <1% <N <N <.5% ------------------------------------------------------------------------------------------- SCENARIO: TIDAL SIMULATION ONLY H 87840 0.021 h 87840 0.046 H-h 15 cm 24h 87840 -0.025 0.056 0.050 0.0 99.4 0.0 0.0 0.0 0.00 0.98 AHW-ahw 15 cm 24h 614 -0.033 0.051 0.039 0.0 99.7 0.0 0.0 0.0 ALW-alw 15 cm 24h 615 -0.022 0.058 0.054 0.0 100.0 0.0 0.0 0.0 THW-thw 0.50 h 25h 614 0.169 0.518 0.490 3.1 64.2 2.4 74.5 9.9 TLW-tlw 0.50 h 25h 615 0.272 0.503 0.423 0.5 68.5 3.4 0.0 0.0 Station: Gandy Bridge Observed data time period from: / 6/ 8/1990 to / 6/ 9/1991 Data gap is filled using SVD method Data are not filtered ------------------------------------------------------------------------------------------- VARIABLE X N IMAX SM RMSE SD NOF CF POF MDNO MDPO WOF SKILL CRITERION - - - - - - <1% >90% <1% <N <N <.5% ------------------------------------------------------------------------------------------- SCENARIO: TIDAL SIMULATION ONLY H 87840 0.022 h 87840 0.021 H-h 15 cm 24h 87840 0.001 0.051 0.051 0.0 98.9 0.0 0.0 0.0 0.00 0.99 AHW-ahw 15 cm 24h 626 0.013 0.038 0.036 0.0 100.0 0.0 0.0 0.0 ALW-alw 15 cm 24h 626 -0.006 0.062 0.062 0.0 98.2 0.0 0.0 0.0 THW-thw 0.50 h 25h 626 0.086 0.408 0.399 1.6 80.5 1.1 49.7 0.0 TLW-tlw 0.50 h 25h 626 0.132 0.356 0.331 0.2 82.6 0.3 0.0 0.0 Station: Davis Island Observed data time period from: / 6/ 8/1990 to / 6/ 9/1991 Data gap is filled using SVD method Data are not filtered ------------------------------------------------------------------------------------------- VARIABLE X N IMAX SM RMSE SD NOF CF POF MDNO MDPO WOF SKILL CRITERION - - - - - - <1% >90% <1% <N <N <.5% ------------------------------------------------------------------------------------------- SCENARIO: TIDAL SIMULATION ONLY H 87840 0.021 h 87840 -0.041 H-h 15 cm 24h 87840 0.062 0.078 0.047 0.0 97.0 0.0 0.0 0.0 0.00 0.97 AHW-ahw 15 cm 24h 609 0.078 0.087 0.037 0.0 95.2 0.0 0.0 0.0 ALW-alw 15 cm 24h 609 0.045 0.067 0.049 0.0 95.9 0.0 0.0 0.0 THW-thw 0.50 h 25h 609 0.046 0.361 0.359 1.0 84.6 0.0 0.0 0.0 TLW-tlw 0.50 h 25h 609 0.152 0.364 0.331 0.2 83.1 1.6 0.0 0.0
- 58 -
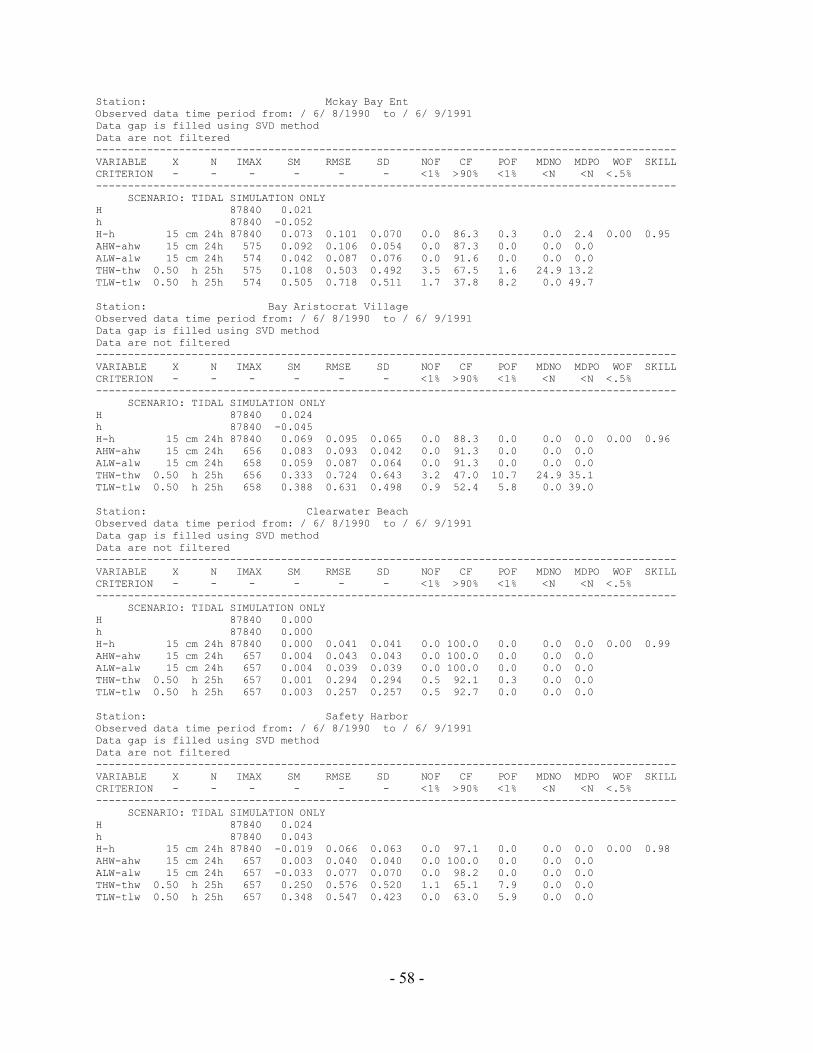
Station: Mckay Bay Ent Observed data time period from: / 6/ 8/1990 to / 6/ 9/1991 Data gap is filled using SVD method Data are not filtered ------------------------------------------------------------------------------------------- VARIABLE X N IMAX SM RMSE SD NOF CF POF MDNO MDPO WOF SKILL CRITERION - - - - - - <1% >90% <1% <N <N <.5% ------------------------------------------------------------------------------------------- SCENARIO: TIDAL SIMULATION ONLY H 87840 0.021 h 87840 -0.052 H-h 15 cm 24h 87840 0.073 0.101 0.070 0.0 86.3 0.3 0.0 2.4 0.00 0.95 AHW-ahw 15 cm 24h 575 0.092 0.106 0.054 0.0 87.3 0.0 0.0 0.0 ALW-alw 15 cm 24h 574 0.042 0.087 0.076 0.0 91.6 0.0 0.0 0.0 THW-thw 0.50 h 25h 575 0.108 0.503 0.492 3.5 67.5 1.6 24.9 13.2 TLW-tlw 0.50 h 25h 574 0.505 0.718 0.511 1.7 37.8 8.2 0.0 49.7 Station: Bay Aristocrat Village Observed data time period from: / 6/ 8/1990 to / 6/ 9/1991 Data gap is filled using SVD method Data are not filtered ------------------------------------------------------------------------------------------- VARIABLE X N IMAX SM RMSE SD NOF CF POF MDNO MDPO WOF SKILL CRITERION - - - - - - <1% >90% <1% <N <N <.5% ------------------------------------------------------------------------------------------- SCENARIO: TIDAL SIMULATION ONLY H 87840 0.024 h 87840 -0.045 H-h 15 cm 24h 87840 0.069 0.095 0.065 0.0 88.3 0.0 0.0 0.0 0.00 0.96 AHW-ahw 15 cm 24h 656 0.083 0.093 0.042 0.0 91.3 0.0 0.0 0.0 ALW-alw 15 cm 24h 658 0.059 0.087 0.064 0.0 91.3 0.0 0.0 0.0 THW-thw 0.50 h 25h 656 0.333 0.724 0.643 3.2 47.0 10.7 24.9 35.1 TLW-tlw 0.50 h 25h 658 0.388 0.631 0.498 0.9 52.4 5.8 0.0 39.0 Station: Clearwater Beach Observed data time period from: / 6/ 8/1990 to / 6/ 9/1991 Data gap is filled using SVD method Data are not filtered ------------------------------------------------------------------------------------------- VARIABLE X N IMAX SM RMSE SD NOF CF POF MDNO MDPO WOF SKILL CRITERION - - - - - - <1% >90% <1% <N <N <.5% ------------------------------------------------------------------------------------------- SCENARIO: TIDAL SIMULATION ONLY H 87840 0.000 h 87840 0.000 H-h 15 cm 24h 87840 0.000 0.041 0.041 0.0 100.0 0.0 0.0 0.0 0.00 0.99 AHW-ahw 15 cm 24h 657 0.004 0.043 0.043 0.0 100.0 0.0 0.0 0.0 ALW-alw 15 cm 24h 657 0.004 0.039 0.039 0.0 100.0 0.0 0.0 0.0 THW-thw 0.50 h 25h 657 0.001 0.294 0.294 0.5 92.1 0.3 0.0 0.0 TLW-tlw 0.50 h 25h 657 0.003 0.257 0.257 0.5 92.7 0.0 0.0 0.0 Station: Safety Harbor Observed data time period from: / 6/ 8/1990 to / 6/ 9/1991 Data gap is filled using SVD method Data are not filtered ------------------------------------------------------------------------------------------- VARIABLE X N IMAX SM RMSE SD NOF CF POF MDNO MDPO WOF SKILL CRITERION - - - - - - <1% >90% <1% <N <N <.5% ------------------------------------------------------------------------------------------- SCENARIO: TIDAL SIMULATION ONLY H 87840 0.024 h 87840 0.043 H-h 15 cm 24h 87840 -0.019 0.066 0.063 0.0 97.1 0.0 0.0 0.0 0.00 0.98 AHW-ahw 15 cm 24h 657 0.003 0.040 0.040 0.0 100.0 0.0 0.0 0.0 ALW-alw 15 cm 24h 657 -0.033 0.077 0.070 0.0 98.2 0.0 0.0 0.0 THW-thw 0.50 h 25h 657 0.250 0.576 0.520 1.1 65.1 7.9 0.0 0.0 TLW-tlw 0.50 h 25h 657 0.348 0.547 0.423 0.0 63.0 5.9 0.0 0.0
- 59 -
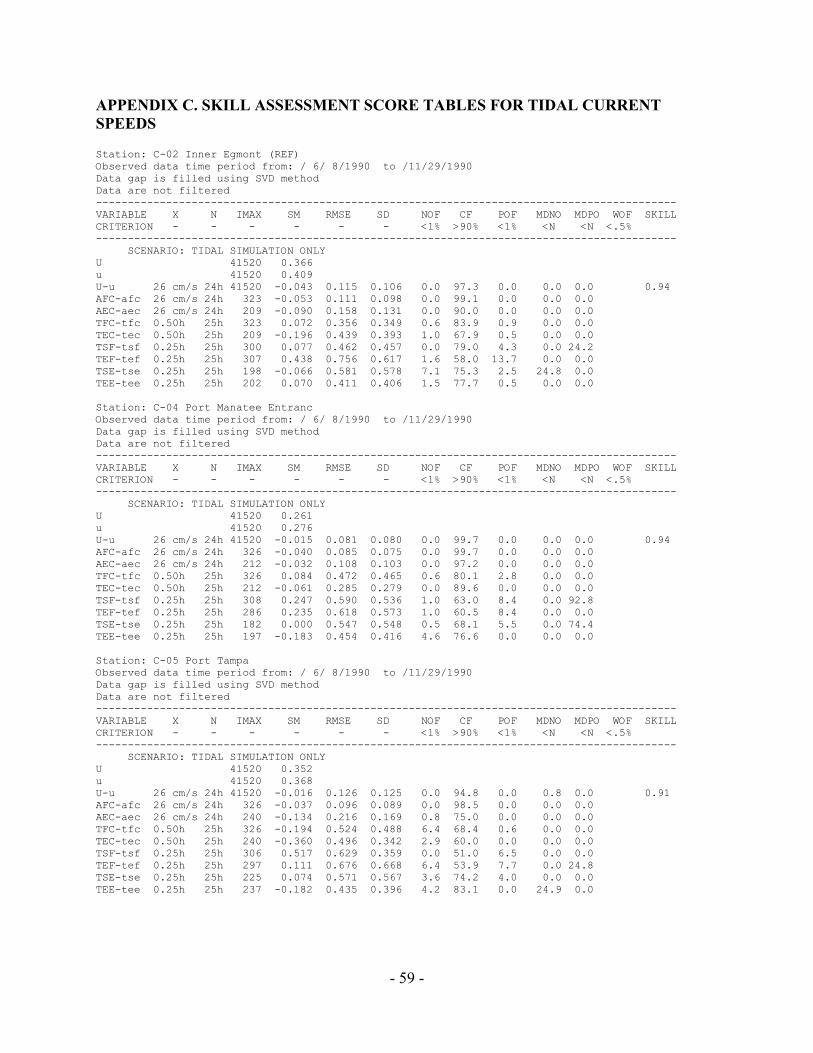
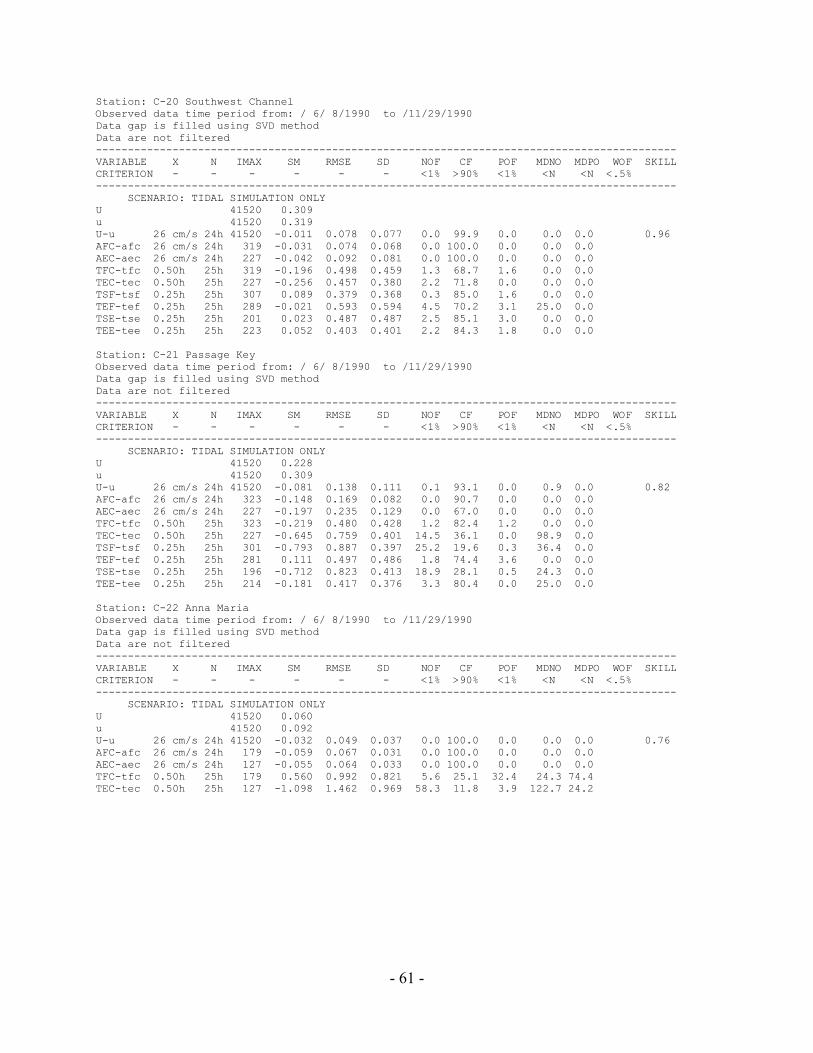
APPENDIX C. SKILL ASSESSMENT SCORE TABLES FOR TIDAL CURRENT SPEEDS Station: C-02 Inner Egmont (REF) Observed data time period from: / 6/ 8/1990 to /11/29/1990 Data gap is filled using SVD method Data are not filtered -------------------------------------------------------------------------------------------VARIABLE X N IMAX SM RMSE SD NOF CF POF MDNO MDPO WOF SKILL CRITERION - - - - - - <1% >90% <1% <N <N <.5% ------------------------------------------------------------------------------------------- SCENARIO: TIDAL SIMULATION ONLY U 41520 0.366 u 41520 0.409 U-u 26 cm/s 24h 41520 -0.043 0.115 0.106 0.0 97.3 0.0 0.0 0.0 0.94 AFC-afc 26 cm/s 24h 323 -0.053 0.111 0.098 0.0 99.1 0.0 0.0 0.0 AEC-aec 26 cm/s 24h 209 -0.090 0.158 0.131 0.0 90.0 0.0 0.0 0.0 TFC-tfc 0.50h 25h 323 0.072 0.356 0.349 0.6 83.9 0.9 0.0 0.0 TEC-tec 0.50h 25h 209 -0.196 0.439 0.393 1.0 67.9 0.5 0.0 0.0 TSF-tsf 0.25h 25h 300 0.077 0.462 0.457 0.0 79.0 4.3 0.0 24.2 TEF-tef 0.25h 25h 307 0.438 0.756 0.617 1.6 58.0 13.7 0.0 0.0 TSE-tse 0.25h 25h 198 -0.066 0.581 0.578 7.1 75.3 2.5 24.8 0.0 TEE-tee 0.25h 25h 202 0.070 0.411 0.406 1.5 77.7 0.5 0.0 0.0 Station: C-04 Port Manatee Entranc Observed data time period from: / 6/ 8/1990 to /11/29/1990 Data gap is filled using SVD method Data are not filtered ------------------------------------------------------------------------------------------- VARIABLE X N IMAX SM RMSE SD NOF CF POF MDNO MDPO WOF SKILL CRITERION - - - - - - <1% >90% <1% <N <N <.5% ------------------------------------------------------------------------------------------- SCENARIO: TIDAL SIMULATION ONLY U 41520 0.261 u 41520 0.276 U-u 26 cm/s 24h 41520 -0.015 0.081 0.080 0.0 99.7 0.0 0.0 0.0 0.94 AFC-afc 26 cm/s 24h 326 -0.040 0.085 0.075 0.0 99.7 0.0 0.0 0.0 AEC-aec 26 cm/s 24h 212 -0.032 0.108 0.103 0.0 97.2 0.0 0.0 0.0 TFC-tfc 0.50h 25h 326 0.084 0.472 0.465 0.6 80.1 2.8 0.0 0.0 TEC-tec 0.50h 25h 212 -0.061 0.285 0.279 0.0 89.6 0.0 0.0 0.0 TSF-tsf 0.25h 25h 308 0.247 0.590 0.536 1.0 63.0 8.4 0.0 92.8 TEF-tef 0.25h 25h 286 0.235 0.618 0.573 1.0 60.5 8.4 0.0 0.0 TSE-tse 0.25h 25h 182 0.000 0.547 0.548 0.5 68.1 5.5 0.0 74.4 TEE-tee 0.25h 25h 197 -0.183 0.454 0.416 4.6 76.6 0.0 0.0 0.0 Station: C-05 Port Tampa Observed data time period from: / 6/ 8/1990 to /11/29/1990 Data gap is filled using SVD method Data are not filtered ------------------------------------------------------------------------------------------- VARIABLE X N IMAX SM RMSE SD NOF CF POF MDNO MDPO WOF SKILL CRITERION - - - - - - <1% >90% <1% <N <N <.5% ------------------------------------------------------------------------------------------- SCENARIO: TIDAL SIMULATION ONLY U 41520 0.352 u 41520 0.368 U-u 26 cm/s 24h 41520 -0.016 0.126 0.125 0.0 94.8 0.0 0.8 0.0 0.91 AFC-afc 26 cm/s 24h 326 -0.037 0.096 0.089 0.0 98.5 0.0 0.0 0.0 AEC-aec 26 cm/s 24h 240 -0.134 0.216 0.169 0.8 75.0 0.0 0.0 0.0 TFC-tfc 0.50h 25h 326 -0.194 0.524 0.488 6.4 68.4 0.6 0.0 0.0 TEC-tec 0.50h 25h 240 -0.360 0.496 0.342 2.9 60.0 0.0 0.0 0.0 TSF-tsf 0.25h 25h 306 0.517 0.629 0.359 0.0 51.0 6.5 0.0 0.0 TEF-tef 0.25h 25h 297 0.111 0.676 0.668 6.4 53.9 7.7 0.0 24.8 TSE-tse 0.25h 25h 225 0.074 0.571 0.567 3.6 74.2 4.0 0.0 0.0 TEE-tee 0.25h 25h 237 -0.182 0.435 0.396 4.2 83.1 0.0 24.9 0.0
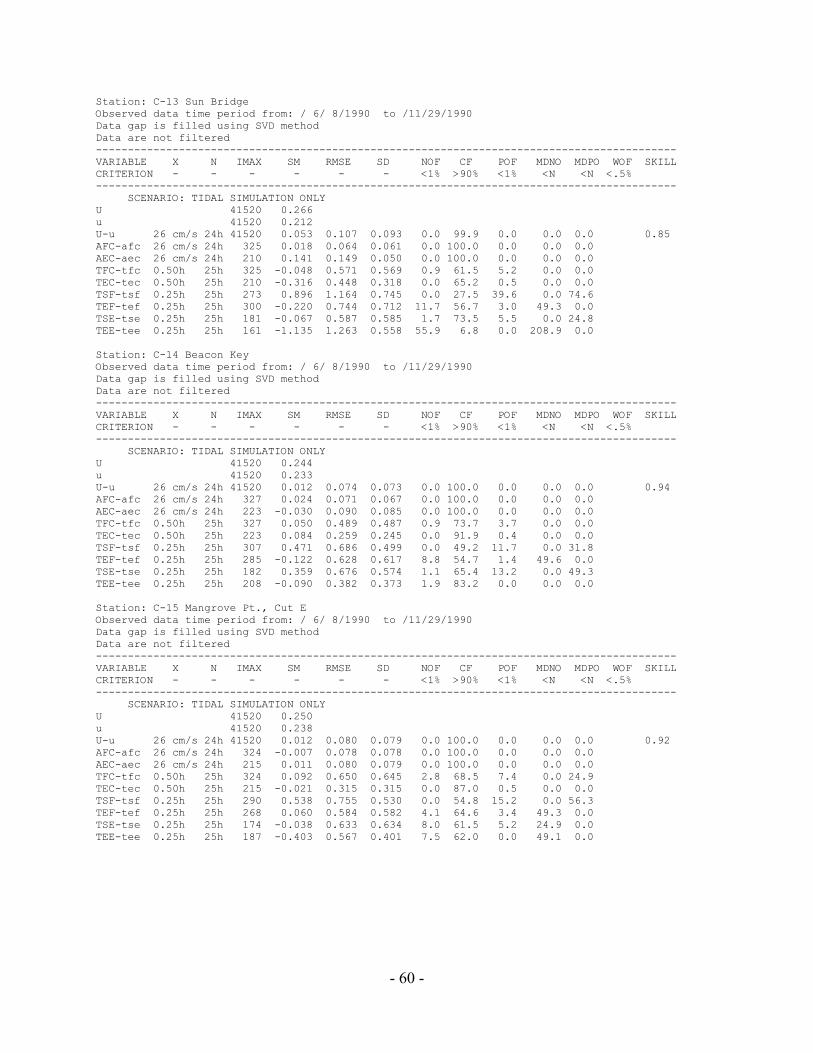
- 60 -
Station: C-13 Sun Bridge Observed data time period from: / 6/ 8/1990 to /11/29/1990 Data gap is filled using SVD method Data are not filtered ------------------------------------------------------------------------------------------- VARIABLE X N IMAX SM RMSE SD NOF CF POF MDNO MDPO WOF SKILL CRITERION - - - - - - <1% >90% <1% <N <N <.5% ------------------------------------------------------------------------------------------- SCENARIO: TIDAL SIMULATION ONLY U 41520 0.266 u 41520 0.212 U-u 26 cm/s 24h 41520 0.053 0.107 0.093 0.0 99.9 0.0 0.0 0.0 0.85 AFC-afc 26 cm/s 24h 325 0.018 0.064 0.061 0.0 100.0 0.0 0.0 0.0 AEC-aec 26 cm/s 24h 210 0.141 0.149 0.050 0.0 100.0 0.0 0.0 0.0 TFC-tfc 0.50h 25h 325 -0.048 0.571 0.569 0.9 61.5 5.2 0.0 0.0 TEC-tec 0.50h 25h 210 -0.316 0.448 0.318 0.0 65.2 0.5 0.0 0.0 TSF-tsf 0.25h 25h 273 0.896 1.164 0.745 0.0 27.5 39.6 0.0 74.6 TEF-tef 0.25h 25h 300 -0.220 0.744 0.712 11.7 56.7 3.0 49.3 0.0 TSE-tse 0.25h 25h 181 -0.067 0.587 0.585 1.7 73.5 5.5 0.0 24.8 TEE-tee 0.25h 25h 161 -1.135 1.263 0.558 55.9 6.8 0.0 208.9 0.0 Station: C-14 Beacon Key Observed data time period from: / 6/ 8/1990 to /11/29/1990 Data gap is filled using SVD method Data are not filtered ------------------------------------------------------------------------------------------- VARIABLE X N IMAX SM RMSE SD NOF CF POF MDNO MDPO WOF SKILL CRITERION - - - - - - <1% >90% <1% <N <N <.5% ------------------------------------------------------------------------------------------- SCENARIO: TIDAL SIMULATION ONLY U 41520 0.244 u 41520 0.233 U-u 26 cm/s 24h 41520 0.012 0.074 0.073 0.0 100.0 0.0 0.0 0.0 0.94 AFC-afc 26 cm/s 24h 327 0.024 0.071 0.067 0.0 100.0 0.0 0.0 0.0 AEC-aec 26 cm/s 24h 223 -0.030 0.090 0.085 0.0 100.0 0.0 0.0 0.0 TFC-tfc 0.50h 25h 327 0.050 0.489 0.487 0.9 73.7 3.7 0.0 0.0 TEC-tec 0.50h 25h 223 0.084 0.259 0.245 0.0 91.9 0.4 0.0 0.0 TSF-tsf 0.25h 25h 307 0.471 0.686 0.499 0.0 49.2 11.7 0.0 31.8 TEF-tef 0.25h 25h 285 -0.122 0.628 0.617 8.8 54.7 1.4 49.6 0.0 TSE-tse 0.25h 25h 182 0.359 0.676 0.574 1.1 65.4 13.2 0.0 49.3 TEE-tee 0.25h 25h 208 -0.090 0.382 0.373 1.9 83.2 0.0 0.0 0.0 Station: C-15 Mangrove Pt., Cut E Observed data time period from: / 6/ 8/1990 to /11/29/1990 Data gap is filled using SVD method Data are not filtered ------------------------------------------------------------------------------------------- VARIABLE X N IMAX SM RMSE SD NOF CF POF MDNO MDPO WOF SKILL CRITERION - - - - - - <1% >90% <1% <N <N <.5% ------------------------------------------------------------------------------------------- SCENARIO: TIDAL SIMULATION ONLY U 41520 0.250 u 41520 0.238 U-u 26 cm/s 24h 41520 0.012 0.080 0.079 0.0 100.0 0.0 0.0 0.0 0.92 AFC-afc 26 cm/s 24h 324 -0.007 0.078 0.078 0.0 100.0 0.0 0.0 0.0 AEC-aec 26 cm/s 24h 215 0.011 0.080 0.079 0.0 100.0 0.0 0.0 0.0 TFC-tfc 0.50h 25h 324 0.092 0.650 0.645 2.8 68.5 7.4 0.0 24.9 TEC-tec 0.50h 25h 215 -0.021 0.315 0.315 0.0 87.0 0.5 0.0 0.0 TSF-tsf 0.25h 25h 290 0.538 0.755 0.530 0.0 54.8 15.2 0.0 56.3 TEF-tef 0.25h 25h 268 0.060 0.584 0.582 4.1 64.6 3.4 49.3 0.0 TSE-tse 0.25h 25h 174 -0.038 0.633 0.634 8.0 61.5 5.2 24.9 0.0 TEE-tee 0.25h 25h 187 -0.403 0.567 0.401 7.5 62.0 0.0 49.1 0.0
- 61 -
Station: C-20 Southwest Channel Observed data time period from: / 6/ 8/1990 to /11/29/1990 Data gap is filled using SVD method Data are not filtered ------------------------------------------------------------------------------------------- VARIABLE X N IMAX SM RMSE SD NOF CF POF MDNO MDPO WOF SKILL CRITERION - - - - - - <1% >90% <1% <N <N <.5% ------------------------------------------------------------------------------------------- SCENARIO: TIDAL SIMULATION ONLY U 41520 0.309 u 41520 0.319 U-u 26 cm/s 24h 41520 -0.011 0.078 0.077 0.0 99.9 0.0 0.0 0.0 0.96 AFC-afc 26 cm/s 24h 319 -0.031 0.074 0.068 0.0 100.0 0.0 0.0 0.0 AEC-aec 26 cm/s 24h 227 -0.042 0.092 0.081 0.0 100.0 0.0 0.0 0.0 TFC-tfc 0.50h 25h 319 -0.196 0.498 0.459 1.3 68.7 1.6 0.0 0.0 TEC-tec 0.50h 25h 227 -0.256 0.457 0.380 2.2 71.8 0.0 0.0 0.0 TSF-tsf 0.25h 25h 307 0.089 0.379 0.368 0.3 85.0 1.6 0.0 0.0 TEF-tef 0.25h 25h 289 -0.021 0.593 0.594 4.5 70.2 3.1 25.0 0.0 TSE-tse 0.25h 25h 201 0.023 0.487 0.487 2.5 85.1 3.0 0.0 0.0 TEE-tee 0.25h 25h 223 0.052 0.403 0.401 2.2 84.3 1.8 0.0 0.0 Station: C-21 Passage Key Observed data time period from: / 6/ 8/1990 to /11/29/1990 Data gap is filled using SVD method Data are not filtered ------------------------------------------------------------------------------------------- VARIABLE X N IMAX SM RMSE SD NOF CF POF MDNO MDPO WOF SKILL CRITERION - - - - - - <1% >90% <1% <N <N <.5% ------------------------------------------------------------------------------------------- SCENARIO: TIDAL SIMULATION ONLY U 41520 0.228 u 41520 0.309 U-u 26 cm/s 24h 41520 -0.081 0.138 0.111 0.1 93.1 0.0 0.9 0.0 0.82 AFC-afc 26 cm/s 24h 323 -0.148 0.169 0.082 0.0 90.7 0.0 0.0 0.0 AEC-aec 26 cm/s 24h 227 -0.197 0.235 0.129 0.0 67.0 0.0 0.0 0.0 TFC-tfc 0.50h 25h 323 -0.219 0.480 0.428 1.2 82.4 1.2 0.0 0.0 TEC-tec 0.50h 25h 227 -0.645 0.759 0.401 14.5 36.1 0.0 98.9 0.0 TSF-tsf 0.25h 25h 301 -0.793 0.887 0.397 25.2 19.6 0.3 36.4 0.0 TEF-tef 0.25h 25h 281 0.111 0.497 0.486 1.8 74.4 3.6 0.0 0.0 TSE-tse 0.25h 25h 196 -0.712 0.823 0.413 18.9 28.1 0.5 24.3 0.0 TEE-tee 0.25h 25h 214 -0.181 0.417 0.376 3.3 80.4 0.0 25.0 0.0 Station: C-22 Anna Maria Observed data time period from: / 6/ 8/1990 to /11/29/1990 Data gap is filled using SVD method Data are not filtered -------------------------------------------------------------------------------------------VARIABLE X N IMAX SM RMSE SD NOF CF POF MDNO MDPO WOF SKILL CRITERION - - - - - - <1% >90% <1% <N <N <.5% ------------------------------------------------------------------------------------------- SCENARIO: TIDAL SIMULATION ONLY U 41520 0.060 u 41520 0.092 U-u 26 cm/s 24h 41520 -0.032 0.049 0.037 0.0 100.0 0.0 0.0 0.0 0.76 AFC-afc 26 cm/s 24h 179 -0.059 0.067 0.031 0.0 100.0 0.0 0.0 0.0 AEC-aec 26 cm/s 24h 127 -0.055 0.064 0.033 0.0 100.0 0.0 0.0 0.0 TFC-tfc 0.50h 25h 179 0.560 0.992 0.821 5.6 25.1 32.4 24.3 74.4 TEC-tec 0.50h 25h 127 -1.098 1.462 0.969 58.3 11.8 3.9 122.7 24.2
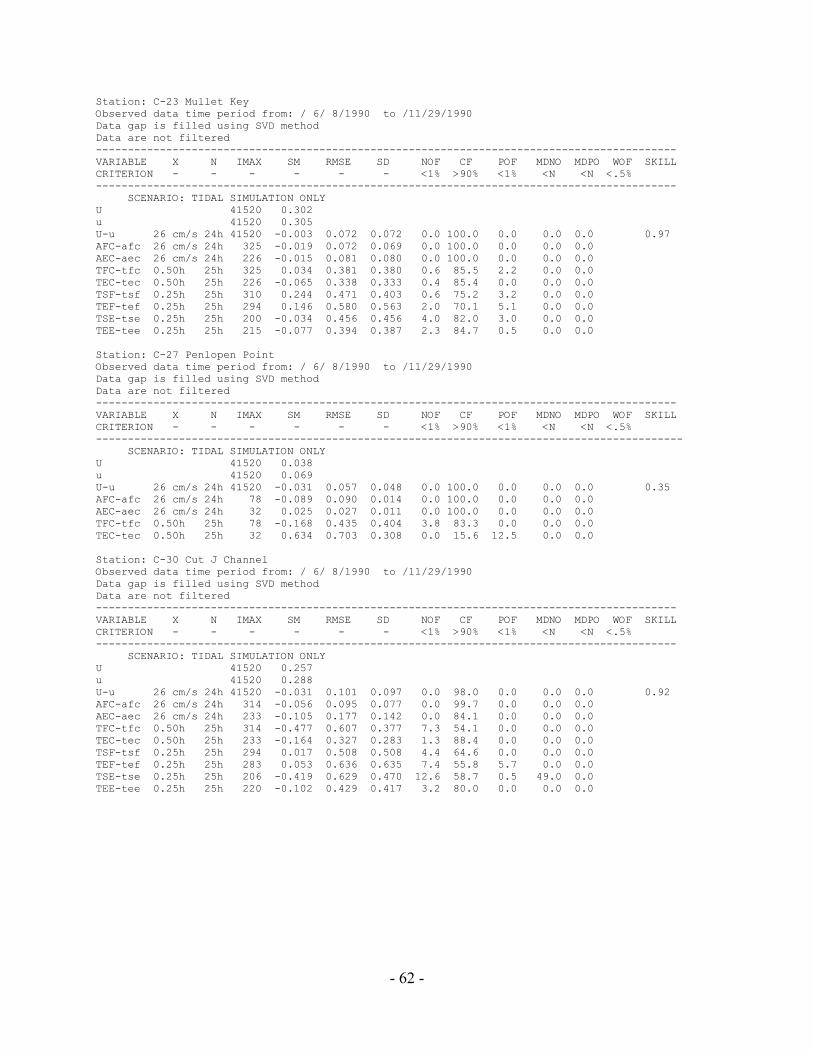
- 62 -
Station: C-23 Mullet Key Observed data time period from: / 6/ 8/1990 to /11/29/1990 Data gap is filled using SVD method Data are not filtered ------------------------------------------------------------------------------------------- VARIABLE X N IMAX SM RMSE SD NOF CF POF MDNO MDPO WOF SKILL CRITERION - - - - - - <1% >90% <1% <N <N <.5% ------------------------------------------------------------------------------------------- SCENARIO: TIDAL SIMULATION ONLY U 41520 0.302 u 41520 0.305 U-u 26 cm/s 24h 41520 -0.003 0.072 0.072 0.0 100.0 0.0 0.0 0.0 0.97 AFC-afc 26 cm/s 24h 325 -0.019 0.072 0.069 0.0 100.0 0.0 0.0 0.0 AEC-aec 26 cm/s 24h 226 -0.015 0.081 0.080 0.0 100.0 0.0 0.0 0.0 TFC-tfc 0.50h 25h 325 0.034 0.381 0.380 0.6 85.5 2.2 0.0 0.0 TEC-tec 0.50h 25h 226 -0.065 0.338 0.333 0.4 85.4 0.0 0.0 0.0 TSF-tsf 0.25h 25h 310 0.244 0.471 0.403 0.6 75.2 3.2 0.0 0.0 TEF-tef 0.25h 25h 294 0.146 0.580 0.563 2.0 70.1 5.1 0.0 0.0 TSE-tse 0.25h 25h 200 -0.034 0.456 0.456 4.0 82.0 3.0 0.0 0.0 TEE-tee 0.25h 25h 215 -0.077 0.394 0.387 2.3 84.7 0.5 0.0 0.0 Station: C-27 Penlopen Point Observed data time period from: / 6/ 8/1990 to /11/29/1990 Data gap is filled using SVD method Data are not filtered ------------------------------------------------------------------------------------------- VARIABLE X N IMAX SM RMSE SD NOF CF POF MDNO MDPO WOF SKILL CRITERION - - - - - - <1% >90% <1% <N <N <.5% -------------------------------------------------------------------------------------------- SCENARIO: TIDAL SIMULATION ONLY U 41520 0.038 u 41520 0.069 U-u 26 cm/s 24h 41520 -0.031 0.057 0.048 0.0 100.0 0.0 0.0 0.0 0.35 AFC-afc 26 cm/s 24h 78 -0.089 0.090 0.014 0.0 100.0 0.0 0.0 0.0 AEC-aec 26 cm/s 24h 32 0.025 0.027 0.011 0.0 100.0 0.0 0.0 0.0 TFC-tfc 0.50h 25h 78 -0.168 0.435 0.404 3.8 83.3 0.0 0.0 0.0 TEC-tec 0.50h 25h 32 0.634 0.703 0.308 0.0 15.6 12.5 0.0 0.0 Station: C-30 Cut J Channel Observed data time period from: / 6/ 8/1990 to /11/29/1990 Data gap is filled using SVD method Data are not filtered ------------------------------------------------------------------------------------------- VARIABLE X N IMAX SM RMSE SD NOF CF POF MDNO MDPO WOF SKILL CRITERION - - - - - - <1% >90% <1% <N <N <.5% ------------------------------------------------------------------------------------------- SCENARIO: TIDAL SIMULATION ONLY U 41520 0.257 u 41520 0.288 U-u 26 cm/s 24h 41520 -0.031 0.101 0.097 0.0 98.0 0.0 0.0 0.0 0.92 AFC-afc 26 cm/s 24h 314 -0.056 0.095 0.077 0.0 99.7 0.0 0.0 0.0 AEC-aec 26 cm/s 24h 233 -0.105 0.177 0.142 0.0 84.1 0.0 0.0 0.0 TFC-tfc 0.50h 25h 314 -0.477 0.607 0.377 7.3 54.1 0.0 0.0 0.0 TEC-tec 0.50h 25h 233 -0.164 0.327 0.283 1.3 88.4 0.0 0.0 0.0 TSF-tsf 0.25h 25h 294 0.017 0.508 0.508 4.4 64.6 0.0 0.0 0.0 TEF-tef 0.25h 25h 283 0.053 0.636 0.635 7.4 55.8 5.7 0.0 0.0 TSE-tse 0.25h 25h 206 -0.419 0.629 0.470 12.6 58.7 0.5 49.0 0.0 TEE-tee 0.25h 25h 220 -0.102 0.429 0.417 3.2 80.0 0.0 0.0 0.0
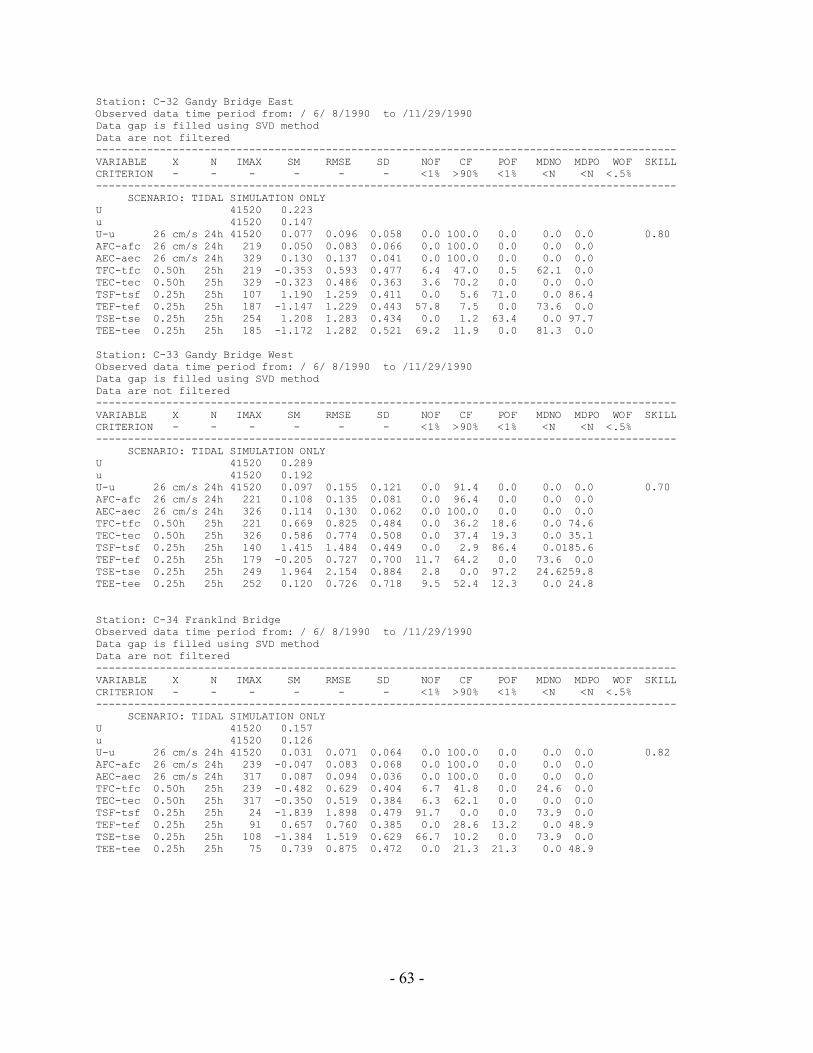
- 63 -
Station: C-32 Gandy Bridge East Observed data time period from: / 6/ 8/1990 to /11/29/1990 Data gap is filled using SVD method Data are not filtered ------------------------------------------------------------------------------------------- VARIABLE X N IMAX SM RMSE SD NOF CF POF MDNO MDPO WOF SKILL CRITERION - - - - - - <1% >90% <1% <N <N <.5% ------------------------------------------------------------------------------------------- SCENARIO: TIDAL SIMULATION ONLY U 41520 0.223 u 41520 0.147 U-u 26 cm/s 24h 41520 0.077 0.096 0.058 0.0 100.0 0.0 0.0 0.0 0.80 AFC-afc 26 cm/s 24h 219 0.050 0.083 0.066 0.0 100.0 0.0 0.0 0.0 AEC-aec 26 cm/s 24h 329 0.130 0.137 0.041 0.0 100.0 0.0 0.0 0.0 TFC-tfc 0.50h 25h 219 -0.353 0.593 0.477 6.4 47.0 0.5 62.1 0.0 TEC-tec 0.50h 25h 329 -0.323 0.486 0.363 3.6 70.2 0.0 0.0 0.0 TSF-tsf 0.25h 25h 107 1.190 1.259 0.411 0.0 5.6 71.0 0.0 86.4 TEF-tef 0.25h 25h 187 -1.147 1.229 0.443 57.8 7.5 0.0 73.6 0.0 TSE-tse 0.25h 25h 254 1.208 1.283 0.434 0.0 1.2 63.4 0.0 97.7 TEE-tee 0.25h 25h 185 -1.172 1.282 0.521 69.2 11.9 0.0 81.3 0.0 Station: C-33 Gandy Bridge West Observed data time period from: / 6/ 8/1990 to /11/29/1990 Data gap is filled using SVD method Data are not filtered ------------------------------------------------------------------------------------------- VARIABLE X N IMAX SM RMSE SD NOF CF POF MDNO MDPO WOF SKILL CRITERION - - - - - - <1% >90% <1% <N <N <.5% ------------------------------------------------------------------------------------------- SCENARIO: TIDAL SIMULATION ONLY U 41520 0.289 u 41520 0.192 U-u 26 cm/s 24h 41520 0.097 0.155 0.121 0.0 91.4 0.0 0.0 0.0 0.70 AFC-afc 26 cm/s 24h 221 0.108 0.135 0.081 0.0 96.4 0.0 0.0 0.0 AEC-aec 26 cm/s 24h 326 0.114 0.130 0.062 0.0 100.0 0.0 0.0 0.0 TFC-tfc 0.50h 25h 221 0.669 0.825 0.484 0.0 36.2 18.6 0.0 74.6 TEC-tec 0.50h 25h 326 0.586 0.774 0.508 0.0 37.4 19.3 0.0 35.1 TSF-tsf 0.25h 25h 140 1.415 1.484 0.449 0.0 2.9 86.4 0.0185.6 TEF-tef 0.25h 25h 179 -0.205 0.727 0.700 11.7 64.2 0.0 73.6 0.0 TSE-tse 0.25h 25h 249 1.964 2.154 0.884 2.8 0.0 97.2 24.6259.8 TEE-tee 0.25h 25h 252 0.120 0.726 0.718 9.5 52.4 12.3 0.0 24.8 Station: C-34 Franklnd Bridge Observed data time period from: / 6/ 8/1990 to /11/29/1990 Data gap is filled using SVD method Data are not filtered ------------------------------------------------------------------------------------------- VARIABLE X N IMAX SM RMSE SD NOF CF POF MDNO MDPO WOF SKILL CRITERION - - - - - - <1% >90% <1% <N <N <.5% ------------------------------------------------------------------------------------------- SCENARIO: TIDAL SIMULATION ONLY U 41520 0.157 u 41520 0.126 U-u 26 cm/s 24h 41520 0.031 0.071 0.064 0.0 100.0 0.0 0.0 0.0 0.82 AFC-afc 26 cm/s 24h 239 -0.047 0.083 0.068 0.0 100.0 0.0 0.0 0.0 AEC-aec 26 cm/s 24h 317 0.087 0.094 0.036 0.0 100.0 0.0 0.0 0.0 TFC-tfc 0.50h 25h 239 -0.482 0.629 0.404 6.7 41.8 0.0 24.6 0.0 TEC-tec 0.50h 25h 317 -0.350 0.519 0.384 6.3 62.1 0.0 0.0 0.0 TSF-tsf 0.25h 25h 24 -1.839 1.898 0.479 91.7 0.0 0.0 73.9 0.0 TEF-tef 0.25h 25h 91 0.657 0.760 0.385 0.0 28.6 13.2 0.0 48.9 TSE-tse 0.25h 25h 108 -1.384 1.519 0.629 66.7 10.2 0.0 73.9 0.0 TEE-tee 0.25h 25h 75 0.739 0.875 0.472 0.0 21.3 21.3 0.0 48.9
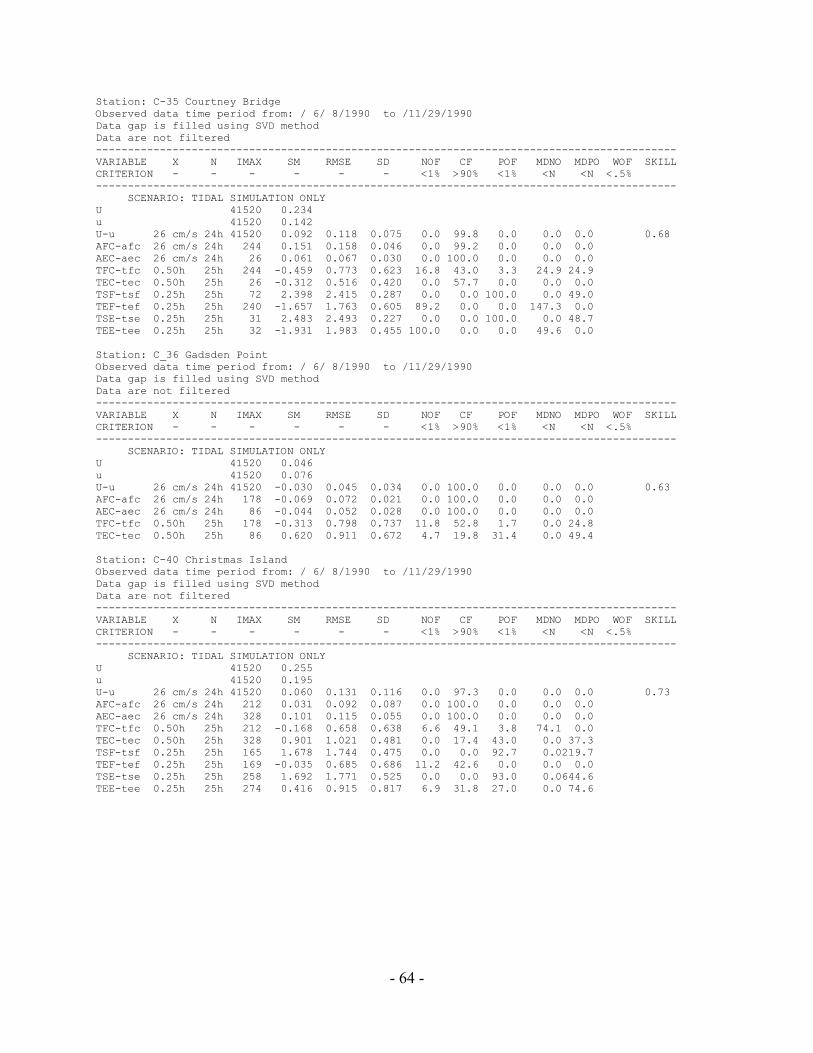
- 64 -
Station: C-35 Courtney Bridge Observed data time period from: / 6/ 8/1990 to /11/29/1990 Data gap is filled using SVD method Data are not filtered ------------------------------------------------------------------------------------------- VARIABLE X N IMAX SM RMSE SD NOF CF POF MDNO MDPO WOF SKILL CRITERION - - - - - - <1% >90% <1% <N <N <.5% ------------------------------------------------------------------------------------------- SCENARIO: TIDAL SIMULATION ONLY U 41520 0.234 u 41520 0.142 U-u 26 cm/s 24h 41520 0.092 0.118 0.075 0.0 99.8 0.0 0.0 0.0 0.68 AFC-afc 26 cm/s 24h 244 0.151 0.158 0.046 0.0 99.2 0.0 0.0 0.0 AEC-aec 26 cm/s 24h 26 0.061 0.067 0.030 0.0 100.0 0.0 0.0 0.0 TFC-tfc 0.50h 25h 244 -0.459 0.773 0.623 16.8 43.0 3.3 24.9 24.9 TEC-tec 0.50h 25h 26 -0.312 0.516 0.420 0.0 57.7 0.0 0.0 0.0 TSF-tsf 0.25h 25h 72 2.398 2.415 0.287 0.0 0.0 100.0 0.0 49.0 TEF-tef 0.25h 25h 240 -1.657 1.763 0.605 89.2 0.0 0.0 147.3 0.0 TSE-tse 0.25h 25h 31 2.483 2.493 0.227 0.0 0.0 100.0 0.0 48.7 TEE-tee 0.25h 25h 32 -1.931 1.983 0.455 100.0 0.0 0.0 49.6 0.0 Station: C_36 Gadsden Point Observed data time period from: / 6/ 8/1990 to /11/29/1990 Data gap is filled using SVD method Data are not filtered ------------------------------------------------------------------------------------------- VARIABLE X N IMAX SM RMSE SD NOF CF POF MDNO MDPO WOF SKILL CRITERION - - - - - - <1% >90% <1% <N <N <.5% ------------------------------------------------------------------------------------------- SCENARIO: TIDAL SIMULATION ONLY U 41520 0.046 u 41520 0.076 U-u 26 cm/s 24h 41520 -0.030 0.045 0.034 0.0 100.0 0.0 0.0 0.0 0.63 AFC-afc 26 cm/s 24h 178 -0.069 0.072 0.021 0.0 100.0 0.0 0.0 0.0 AEC-aec 26 cm/s 24h 86 -0.044 0.052 0.028 0.0 100.0 0.0 0.0 0.0 TFC-tfc 0.50h 25h 178 -0.313 0.798 0.737 11.8 52.8 1.7 0.0 24.8 TEC-tec 0.50h 25h 86 0.620 0.911 0.672 4.7 19.8 31.4 0.0 49.4 Station: C-40 Christmas Island Observed data time period from: / 6/ 8/1990 to /11/29/1990 Data gap is filled using SVD method Data are not filtered -------------------------------------------------------------------------------------------VARIABLE X N IMAX SM RMSE SD NOF CF POF MDNO MDPO WOF SKILL CRITERION - - - - - - <1% >90% <1% <N <N <.5% ------------------------------------------------------------------------------------------- SCENARIO: TIDAL SIMULATION ONLY U 41520 0.255 u 41520 0.195 U-u 26 cm/s 24h 41520 0.060 0.131 0.116 0.0 97.3 0.0 0.0 0.0 0.73 AFC-afc 26 cm/s 24h 212 0.031 0.092 0.087 0.0 100.0 0.0 0.0 0.0 AEC-aec 26 cm/s 24h 328 0.101 0.115 0.055 0.0 100.0 0.0 0.0 0.0 TFC-tfc 0.50h 25h 212 -0.168 0.658 0.638 6.6 49.1 3.8 74.1 0.0 TEC-tec 0.50h 25h 328 0.901 1.021 0.481 0.0 17.4 43.0 0.0 37.3 TSF-tsf 0.25h 25h 165 1.678 1.744 0.475 0.0 0.0 92.7 0.0219.7 TEF-tef 0.25h 25h 169 -0.035 0.685 0.686 11.2 42.6 0.0 0.0 0.0 TSE-tse 0.25h 25h 258 1.692 1.771 0.525 0.0 0.0 93.0 0.0644.6 TEE-tee 0.25h 25h 274 0.416 0.915 0.817 6.9 31.8 27.0 0.0 74.6
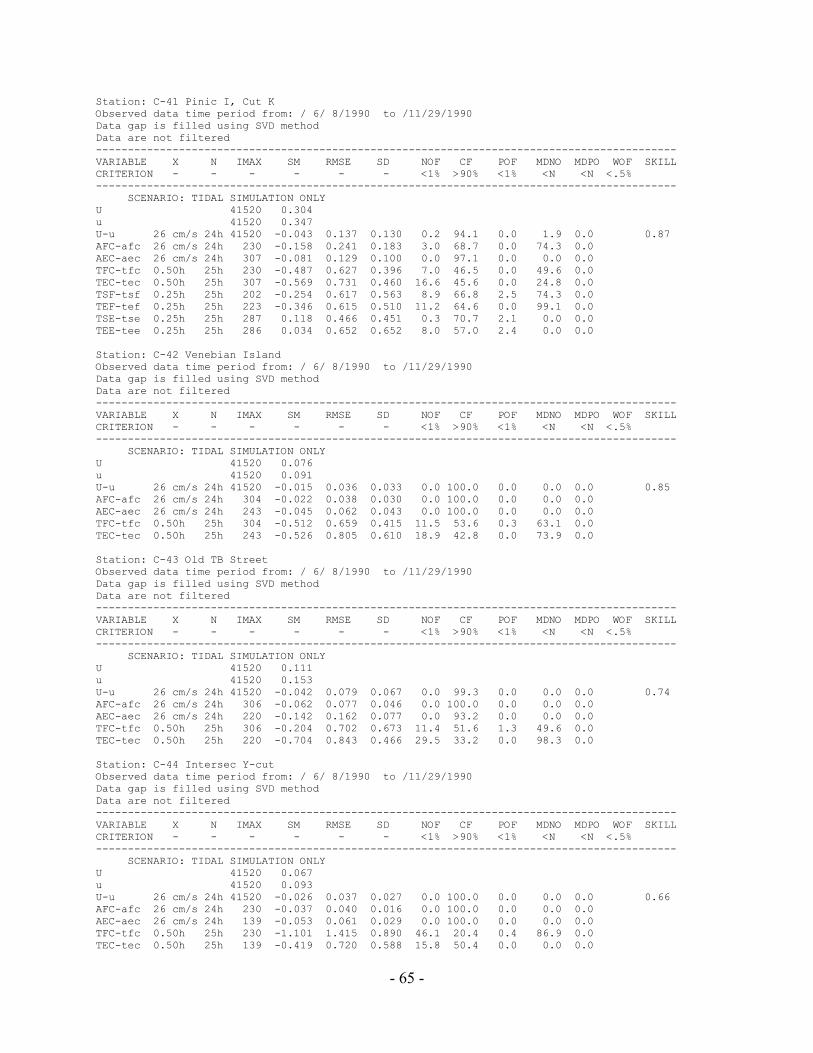
- 65 -
Station: C-41 Pinic I, Cut K Observed data time period from: / 6/ 8/1990 to /11/29/1990 Data gap is filled using SVD method Data are not filtered -------------------------------------------------------------------------------------------VARIABLE X N IMAX SM RMSE SD NOF CF POF MDNO MDPO WOF SKILL CRITERION - - - - - - <1% >90% <1% <N <N <.5% ------------------------------------------------------------------------------------------- SCENARIO: TIDAL SIMULATION ONLY U 41520 0.304 u 41520 0.347 U-u 26 cm/s 24h 41520 -0.043 0.137 0.130 0.2 94.1 0.0 1.9 0.0 0.87 AFC-afc 26 cm/s 24h 230 -0.158 0.241 0.183 3.0 68.7 0.0 74.3 0.0 AEC-aec 26 cm/s 24h 307 -0.081 0.129 0.100 0.0 97.1 0.0 0.0 0.0 TFC-tfc 0.50h 25h 230 -0.487 0.627 0.396 7.0 46.5 0.0 49.6 0.0 TEC-tec 0.50h 25h 307 -0.569 0.731 0.460 16.6 45.6 0.0 24.8 0.0 TSF-tsf 0.25h 25h 202 -0.254 0.617 0.563 8.9 66.8 2.5 74.3 0.0 TEF-tef 0.25h 25h 223 -0.346 0.615 0.510 11.2 64.6 0.0 99.1 0.0 TSE-tse 0.25h 25h 287 0.118 0.466 0.451 0.3 70.7 2.1 0.0 0.0 TEE-tee 0.25h 25h 286 0.034 0.652 0.652 8.0 57.0 2.4 0.0 0.0 Station: C-42 Venebian Island Observed data time period from: / 6/ 8/1990 to /11/29/1990 Data gap is filled using SVD method Data are not filtered ------------------------------------------------------------------------------------------- VARIABLE X N IMAX SM RMSE SD NOF CF POF MDNO MDPO WOF SKILL CRITERION - - - - - - <1% >90% <1% <N <N <.5% ------------------------------------------------------------------------------------------- SCENARIO: TIDAL SIMULATION ONLY U 41520 0.076 u 41520 0.091 U-u 26 cm/s 24h 41520 -0.015 0.036 0.033 0.0 100.0 0.0 0.0 0.0 0.85 AFC-afc 26 cm/s 24h 304 -0.022 0.038 0.030 0.0 100.0 0.0 0.0 0.0 AEC-aec 26 cm/s 24h 243 -0.045 0.062 0.043 0.0 100.0 0.0 0.0 0.0 TFC-tfc 0.50h 25h 304 -0.512 0.659 0.415 11.5 53.6 0.3 63.1 0.0 TEC-tec 0.50h 25h 243 -0.526 0.805 0.610 18.9 42.8 0.0 73.9 0.0 Station: C-43 Old TB Street Observed data time period from: / 6/ 8/1990 to /11/29/1990 Data gap is filled using SVD method Data are not filtered ------------------------------------------------------------------------------------------- VARIABLE X N IMAX SM RMSE SD NOF CF POF MDNO MDPO WOF SKILL CRITERION - - - - - - <1% >90% <1% <N <N <.5% ------------------------------------------------------------------------------------------- SCENARIO: TIDAL SIMULATION ONLY U 41520 0.111 u 41520 0.153 U-u 26 cm/s 24h 41520 -0.042 0.079 0.067 0.0 99.3 0.0 0.0 0.0 0.74 AFC-afc 26 cm/s 24h 306 -0.062 0.077 0.046 0.0 100.0 0.0 0.0 0.0 AEC-aec 26 cm/s 24h 220 -0.142 0.162 0.077 0.0 93.2 0.0 0.0 0.0 TFC-tfc 0.50h 25h 306 -0.204 0.702 0.673 11.4 51.6 1.3 49.6 0.0 TEC-tec 0.50h 25h 220 -0.704 0.843 0.466 29.5 33.2 0.0 98.3 0.0 Station: C-44 Intersec Y-cut Observed data time period from: / 6/ 8/1990 to /11/29/1990 Data gap is filled using SVD method Data are not filtered ------------------------------------------------------------------------------------------- VARIABLE X N IMAX SM RMSE SD NOF CF POF MDNO MDPO WOF SKILL CRITERION - - - - - - <1% >90% <1% <N <N <.5% ------------------------------------------------------------------------------------------- SCENARIO: TIDAL SIMULATION ONLY U 41520 0.067 u 41520 0.093 U-u 26 cm/s 24h 41520 -0.026 0.037 0.027 0.0 100.0 0.0 0.0 0.0 0.66 AFC-afc 26 cm/s 24h 230 -0.037 0.040 0.016 0.0 100.0 0.0 0.0 0.0 AEC-aec 26 cm/s 24h 139 -0.053 0.061 0.029 0.0 100.0 0.0 0.0 0.0 TFC-tfc 0.50h 25h 230 -1.101 1.415 0.890 46.1 20.4 0.4 86.9 0.0 TEC-tec 0.50h 25h 139 -0.419 0.720 0.588 15.8 50.4 0.0 0.0 0.0
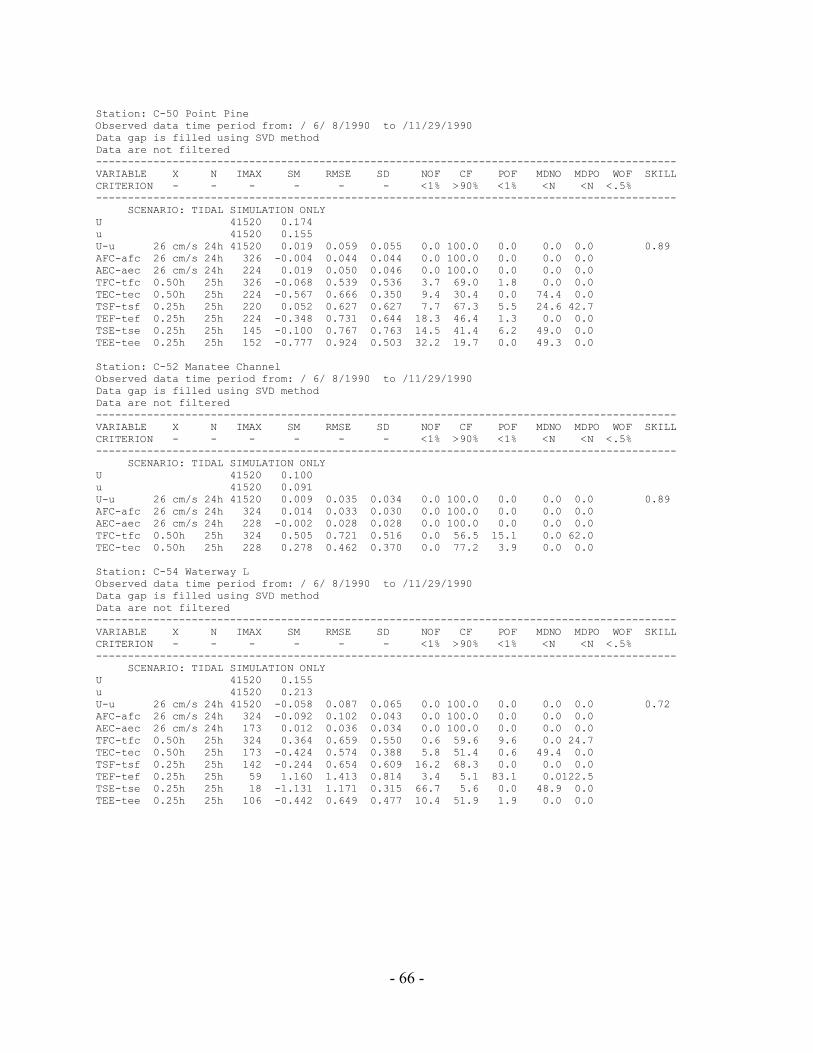
- 66 -
Station: C-50 Point Pine Observed data time period from: / 6/ 8/1990 to /11/29/1990 Data gap is filled using SVD method Data are not filtered ------------------------------------------------------------------------------------------- VARIABLE X N IMAX SM RMSE SD NOF CF POF MDNO MDPO WOF SKILL CRITERION - - - - - - <1% >90% <1% <N <N <.5% ------------------------------------------------------------------------------------------- SCENARIO: TIDAL SIMULATION ONLY U 41520 0.174 u 41520 0.155 U-u 26 cm/s 24h 41520 0.019 0.059 0.055 0.0 100.0 0.0 0.0 0.0 0.89 AFC-afc 26 cm/s 24h 326 -0.004 0.044 0.044 0.0 100.0 0.0 0.0 0.0 AEC-aec 26 cm/s 24h 224 0.019 0.050 0.046 0.0 100.0 0.0 0.0 0.0 TFC-tfc 0.50h 25h 326 -0.068 0.539 0.536 3.7 69.0 1.8 0.0 0.0 TEC-tec 0.50h 25h 224 -0.567 0.666 0.350 9.4 30.4 0.0 74.4 0.0 TSF-tsf 0.25h 25h 220 0.052 0.627 0.627 7.7 67.3 5.5 24.6 42.7 TEF-tef 0.25h 25h 224 -0.348 0.731 0.644 18.3 46.4 1.3 0.0 0.0 TSE-tse 0.25h 25h 145 -0.100 0.767 0.763 14.5 41.4 6.2 49.0 0.0 TEE-tee 0.25h 25h 152 -0.777 0.924 0.503 32.2 19.7 0.0 49.3 0.0 Station: C-52 Manatee Channel Observed data time period from: / 6/ 8/1990 to /11/29/1990 Data gap is filled using SVD method Data are not filtered ------------------------------------------------------------------------------------------- VARIABLE X N IMAX SM RMSE SD NOF CF POF MDNO MDPO WOF SKILL CRITERION - - - - - - <1% >90% <1% <N <N <.5% ------------------------------------------------------------------------------------------- SCENARIO: TIDAL SIMULATION ONLY U 41520 0.100 u 41520 0.091 U-u 26 cm/s 24h 41520 0.009 0.035 0.034 0.0 100.0 0.0 0.0 0.0 0.89 AFC-afc 26 cm/s 24h 324 0.014 0.033 0.030 0.0 100.0 0.0 0.0 0.0 AEC-aec 26 cm/s 24h 228 -0.002 0.028 0.028 0.0 100.0 0.0 0.0 0.0 TFC-tfc 0.50h 25h 324 0.505 0.721 0.516 0.0 56.5 15.1 0.0 62.0 TEC-tec 0.50h 25h 228 0.278 0.462 0.370 0.0 77.2 3.9 0.0 0.0 Station: C-54 Waterway L Observed data time period from: / 6/ 8/1990 to /11/29/1990 Data gap is filled using SVD method Data are not filtered ------------------------------------------------------------------------------------------- VARIABLE X N IMAX SM RMSE SD NOF CF POF MDNO MDPO WOF SKILL CRITERION - - - - - - <1% >90% <1% <N <N <.5% ------------------------------------------------------------------------------------------- SCENARIO: TIDAL SIMULATION ONLY U 41520 0.155 u 41520 0.213 U-u 26 cm/s 24h 41520 -0.058 0.087 0.065 0.0 100.0 0.0 0.0 0.0 0.72 AFC-afc 26 cm/s 24h 324 -0.092 0.102 0.043 0.0 100.0 0.0 0.0 0.0 AEC-aec 26 cm/s 24h 173 0.012 0.036 0.034 0.0 100.0 0.0 0.0 0.0 TFC-tfc 0.50h 25h 324 0.364 0.659 0.550 0.6 59.6 9.6 0.0 24.7 TEC-tec 0.50h 25h 173 -0.424 0.574 0.388 5.8 51.4 0.6 49.4 0.0 TSF-tsf 0.25h 25h 142 -0.244 0.654 0.609 16.2 68.3 0.0 0.0 0.0 TEF-tef 0.25h 25h 59 1.160 1.413 0.814 3.4 5.1 83.1 0.0122.5 TSE-tse 0.25h 25h 18 -1.131 1.171 0.315 66.7 5.6 0.0 48.9 0.0 TEE-tee 0.25h 25h 106 -0.442 0.649 0.477 10.4 51.9 1.9 0.0 0.0
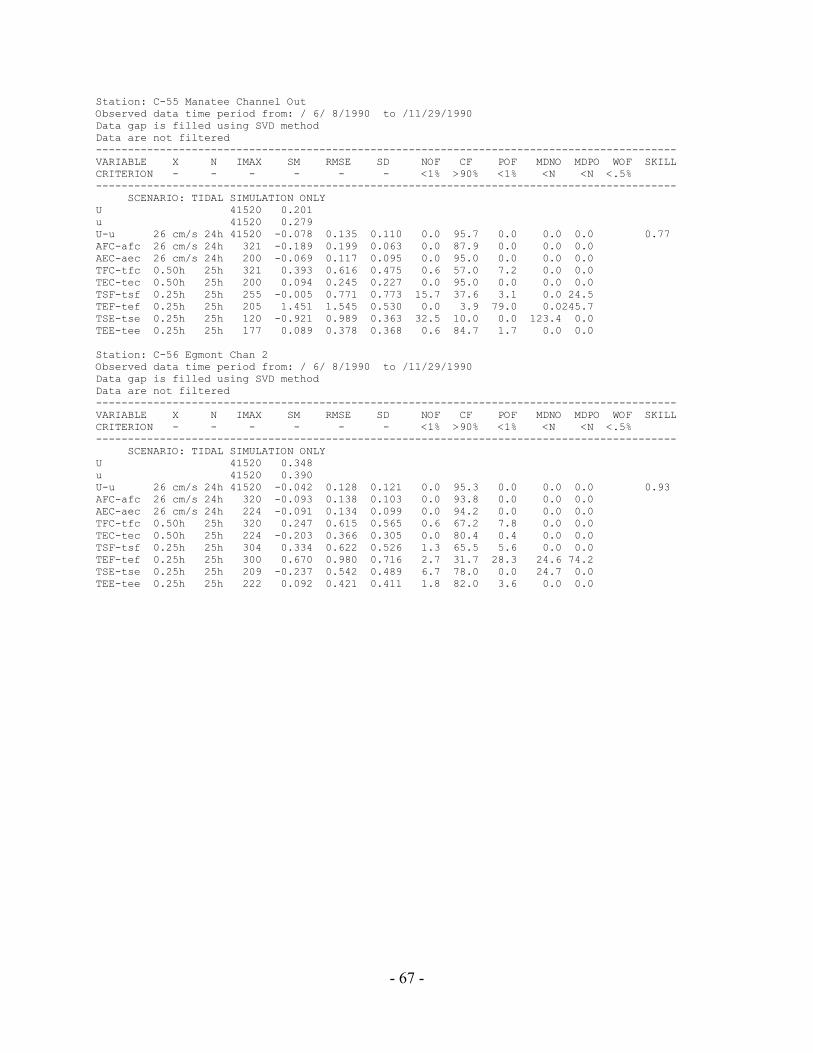
- 67 -
Station: C-55 Manatee Channel Out Observed data time period from: / 6/ 8/1990 to /11/29/1990 Data gap is filled using SVD method Data are not filtered ------------------------------------------------------------------------------------------- VARIABLE X N IMAX SM RMSE SD NOF CF POF MDNO MDPO WOF SKILL CRITERION - - - - - - <1% >90% <1% <N <N <.5% ------------------------------------------------------------------------------------------- SCENARIO: TIDAL SIMULATION ONLY U 41520 0.201 u 41520 0.279 U-u 26 cm/s 24h 41520 -0.078 0.135 0.110 0.0 95.7 0.0 0.0 0.0 0.77 AFC-afc 26 cm/s 24h 321 -0.189 0.199 0.063 0.0 87.9 0.0 0.0 0.0 AEC-aec 26 cm/s 24h 200 -0.069 0.117 0.095 0.0 95.0 0.0 0.0 0.0 TFC-tfc 0.50h 25h 321 0.393 0.616 0.475 0.6 57.0 7.2 0.0 0.0 TEC-tec 0.50h 25h 200 0.094 0.245 0.227 0.0 95.0 0.0 0.0 0.0 TSF-tsf 0.25h 25h 255 -0.005 0.771 0.773 15.7 37.6 3.1 0.0 24.5 TEF-tef 0.25h 25h 205 1.451 1.545 0.530 0.0 3.9 79.0 0.0245.7 TSE-tse 0.25h 25h 120 -0.921 0.989 0.363 32.5 10.0 0.0 123.4 0.0 TEE-tee 0.25h 25h 177 0.089 0.378 0.368 0.6 84.7 1.7 0.0 0.0 Station: C-56 Egmont Chan 2 Observed data time period from: / 6/ 8/1990 to /11/29/1990 Data gap is filled using SVD method Data are not filtered ------------------------------------------------------------------------------------------- VARIABLE X N IMAX SM RMSE SD NOF CF POF MDNO MDPO WOF SKILL CRITERION - - - - - - <1% >90% <1% <N <N <.5% ------------------------------------------------------------------------------------------- SCENARIO: TIDAL SIMULATION ONLY U 41520 0.348 u 41520 0.390 U-u 26 cm/s 24h 41520 -0.042 0.128 0.121 0.0 95.3 0.0 0.0 0.0 0.93 AFC-afc 26 cm/s 24h 320 -0.093 0.138 0.103 0.0 93.8 0.0 0.0 0.0 AEC-aec 26 cm/s 24h 224 -0.091 0.134 0.099 0.0 94.2 0.0 0.0 0.0 TFC-tfc 0.50h 25h 320 0.247 0.615 0.565 0.6 67.2 7.8 0.0 0.0 TEC-tec 0.50h 25h 224 -0.203 0.366 0.305 0.0 80.4 0.4 0.0 0.0 TSF-tsf 0.25h 25h 304 0.334 0.622 0.526 1.3 65.5 5.6 0.0 0.0 TEF-tef 0.25h 25h 300 0.670 0.980 0.716 2.7 31.7 28.3 24.6 74.2 TSE-tse 0.25h 25h 209 -0.237 0.542 0.489 6.7 78.0 0.0 24.7 0.0 TEE-tee 0.25h 25h 222 0.092 0.421 0.411 1.8 82.0 3.6 0.0 0.0

- 68 -
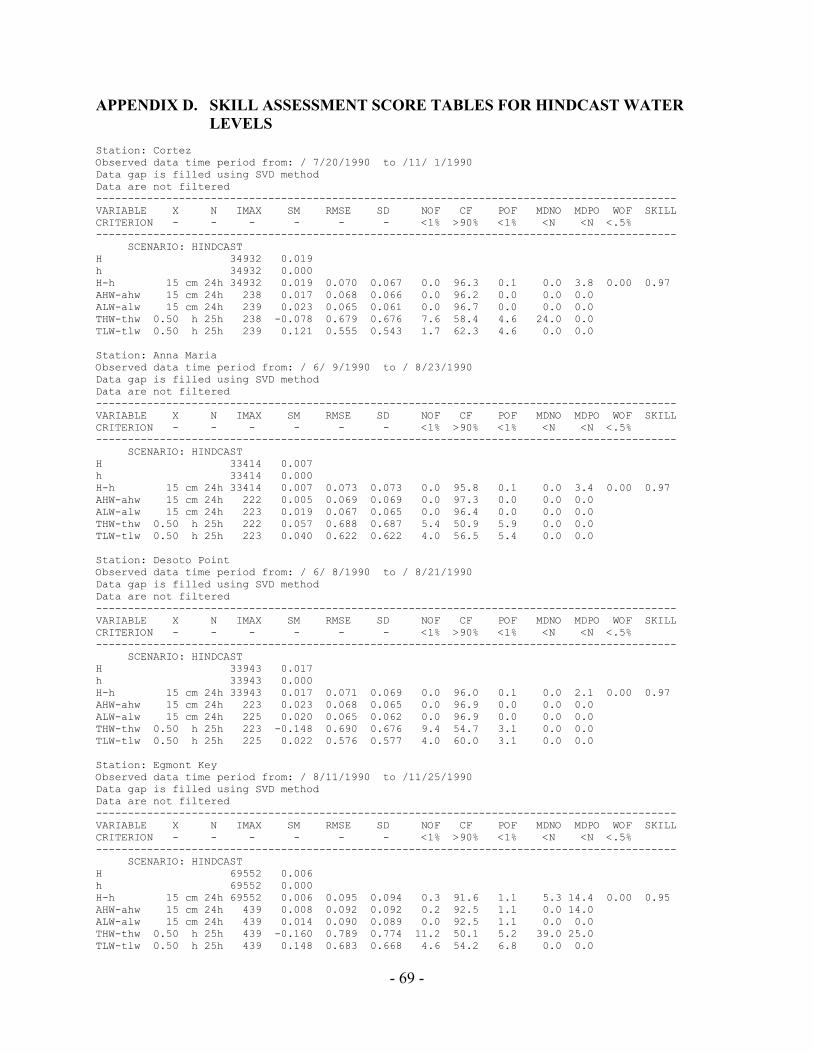
- 69 -
APPENDIX D. SKILL ASSESSMENT SCORE TABLES FOR HINDCAST WATER LEVELS
Station: Cortez Observed data time period from: / 7/20/1990 to /11/ 1/1990 Data gap is filled using SVD method Data are not filtered ------------------------------------------------------------------------------------------- VARIABLE X N IMAX SM RMSE SD NOF CF POF MDNO MDPO WOF SKILL CRITERION - - - - - - <1% >90% <1% <N <N <.5% ------------------------------------------------------------------------------------------- SCENARIO: HINDCAST H 34932 0.019 h 34932 0.000 H-h 15 cm 24h 34932 0.019 0.070 0.067 0.0 96.3 0.1 0.0 3.8 0.00 0.97 AHW-ahw 15 cm 24h 238 0.017 0.068 0.066 0.0 96.2 0.0 0.0 0.0 ALW-alw 15 cm 24h 239 0.023 0.065 0.061 0.0 96.7 0.0 0.0 0.0 THW-thw 0.50 h 25h 238 -0.078 0.679 0.676 7.6 58.4 4.6 24.0 0.0 TLW-tlw 0.50 h 25h 239 0.121 0.555 0.543 1.7 62.3 4.6 0.0 0.0 Station: Anna Maria Observed data time period from: / 6/ 9/1990 to / 8/23/1990 Data gap is filled using SVD method Data are not filtered ------------------------------------------------------------------------------------------- VARIABLE X N IMAX SM RMSE SD NOF CF POF MDNO MDPO WOF SKILL CRITERION - - - - - - <1% >90% <1% <N <N <.5% ------------------------------------------------------------------------------------------- SCENARIO: HINDCAST H 33414 0.007 h 33414 0.000 H-h 15 cm 24h 33414 0.007 0.073 0.073 0.0 95.8 0.1 0.0 3.4 0.00 0.97 AHW-ahw 15 cm 24h 222 0.005 0.069 0.069 0.0 97.3 0.0 0.0 0.0 ALW-alw 15 cm 24h 223 0.019 0.067 0.065 0.0 96.4 0.0 0.0 0.0 THW-thw 0.50 h 25h 222 0.057 0.688 0.687 5.4 50.9 5.9 0.0 0.0 TLW-tlw 0.50 h 25h 223 0.040 0.622 0.622 4.0 56.5 5.4 0.0 0.0 Station: Desoto Point Observed data time period from: / 6/ 8/1990 to / 8/21/1990 Data gap is filled using SVD method Data are not filtered ------------------------------------------------------------------------------------------- VARIABLE X N IMAX SM RMSE SD NOF CF POF MDNO MDPO WOF SKILL CRITERION - - - - - - <1% >90% <1% <N <N <.5% ------------------------------------------------------------------------------------------- SCENARIO: HINDCAST H 33943 0.017 h 33943 0.000 H-h 15 cm 24h 33943 0.017 0.071 0.069 0.0 96.0 0.1 0.0 2.1 0.00 0.97 AHW-ahw 15 cm 24h 223 0.023 0.068 0.065 0.0 96.9 0.0 0.0 0.0 ALW-alw 15 cm 24h 225 0.020 0.065 0.062 0.0 96.9 0.0 0.0 0.0 THW-thw 0.50 h 25h 223 -0.148 0.690 0.676 9.4 54.7 3.1 0.0 0.0 TLW-tlw 0.50 h 25h 225 0.022 0.576 0.577 4.0 60.0 3.1 0.0 0.0 Station: Egmont Key Observed data time period from: / 8/11/1990 to /11/25/1990 Data gap is filled using SVD method Data are not filtered ------------------------------------------------------------------------------------------- VARIABLE X N IMAX SM RMSE SD NOF CF POF MDNO MDPO WOF SKILL CRITERION - - - - - - <1% >90% <1% <N <N <.5% ------------------------------------------------------------------------------------------- SCENARIO: HINDCAST H 69552 0.006 h 69552 0.000 H-h 15 cm 24h 69552 0.006 0.095 0.094 0.3 91.6 1.1 5.3 14.4 0.00 0.95 AHW-ahw 15 cm 24h 439 0.008 0.092 0.092 0.2 92.5 1.1 0.0 14.0 ALW-alw 15 cm 24h 439 0.014 0.090 0.089 0.0 92.5 1.1 0.0 0.0 THW-thw 0.50 h 25h 439 -0.160 0.789 0.774 11.2 50.1 5.2 39.0 25.0 TLW-tlw 0.50 h 25h 439 0.148 0.683 0.668 4.6 54.2 6.8 0.0 0.0
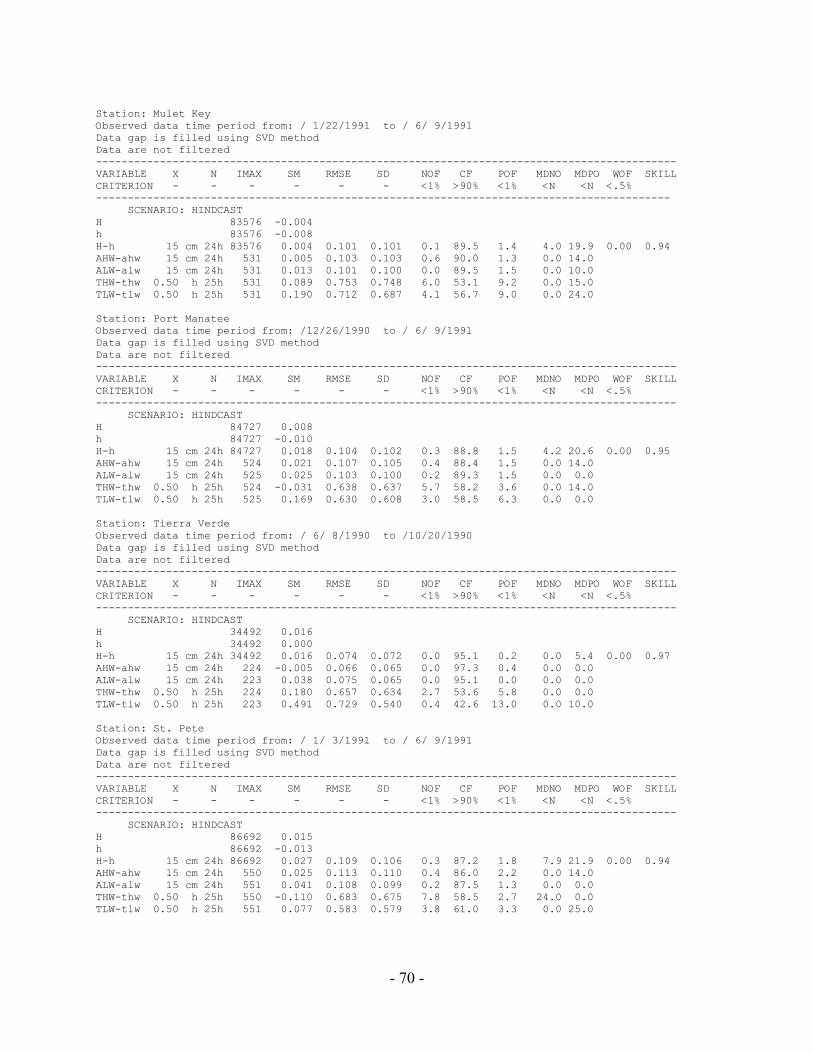
- 70 -
Station: Mulet Key Observed data time period from: / 1/22/1991 to / 6/ 9/1991 Data gap is filled using SVD method Data are not filtered ------------------------------------------------------------------------------------------- VARIABLE X N IMAX SM RMSE SD NOF CF POF MDNO MDPO WOF SKILL CRITERION - - - - - - <1% >90% <1% <N <N <.5% ------------------------------------------------------------------------------------------ SCENARIO: HINDCAST H 83576 -0.004 h 83576 -0.008 H-h 15 cm 24h 83576 0.004 0.101 0.101 0.1 89.5 1.4 4.0 19.9 0.00 0.94 AHW-ahw 15 cm 24h 531 0.005 0.103 0.103 0.6 90.0 1.3 0.0 14.0 ALW-alw 15 cm 24h 531 0.013 0.101 0.100 0.0 89.5 1.5 0.0 10.0 THW-thw 0.50 h 25h 531 0.089 0.753 0.748 6.0 53.1 9.2 0.0 15.0 TLW-tlw 0.50 h 25h 531 0.190 0.712 0.687 4.1 56.7 9.0 0.0 24.0 Station: Port Manatee Observed data time period from: /12/26/1990 to / 6/ 9/1991 Data gap is filled using SVD method Data are not filtered ------------------------------------------------------------------------------------------- VARIABLE X N IMAX SM RMSE SD NOF CF POF MDNO MDPO WOF SKILL CRITERION - - - - - - <1% >90% <1% <N <N <.5% ------------------------------------------------------------------------------------------- SCENARIO: HINDCAST H 84727 0.008 h 84727 -0.010 H-h 15 cm 24h 84727 0.018 0.104 0.102 0.3 88.8 1.5 4.2 20.6 0.00 0.95 AHW-ahw 15 cm 24h 524 0.021 0.107 0.105 0.4 88.4 1.5 0.0 14.0 ALW-alw 15 cm 24h 525 0.025 0.103 0.100 0.2 89.3 1.5 0.0 0.0 THW-thw 0.50 h 25h 524 -0.031 0.638 0.637 5.7 58.2 3.6 0.0 14.0 TLW-tlw 0.50 h 25h 525 0.169 0.630 0.608 3.0 58.5 6.3 0.0 0.0 Station: Tierra Verde Observed data time period from: / 6/ 8/1990 to /10/20/1990 Data gap is filled using SVD method Data are not filtered ------------------------------------------------------------------------------------------- VARIABLE X N IMAX SM RMSE SD NOF CF POF MDNO MDPO WOF SKILL CRITERION - - - - - - <1% >90% <1% <N <N <.5% ------------------------------------------------------------------------------------------- SCENARIO: HINDCAST H 34492 0.016 h 34492 0.000 H-h 15 cm 24h 34492 0.016 0.074 0.072 0.0 95.1 0.2 0.0 5.4 0.00 0.97 AHW-ahw 15 cm 24h 224 -0.005 0.066 0.065 0.0 97.3 0.4 0.0 0.0 ALW-alw 15 cm 24h 223 0.038 0.075 0.065 0.0 95.1 0.0 0.0 0.0 THW-thw 0.50 h 25h 224 0.180 0.657 0.634 2.7 53.6 5.8 0.0 0.0 TLW-tlw 0.50 h 25h 223 0.491 0.729 0.540 0.4 42.6 13.0 0.0 10.0 Station: St. Pete Observed data time period from: / 1/ 3/1991 to / 6/ 9/1991 Data gap is filled using SVD method Data are not filtered ------------------------------------------------------------------------------------------- VARIABLE X N IMAX SM RMSE SD NOF CF POF MDNO MDPO WOF SKILL CRITERION - - - - - - <1% >90% <1% <N <N <.5% ------------------------------------------------------------------------------------------- SCENARIO: HINDCAST H 86692 0.015 h 86692 -0.013 H-h 15 cm 24h 86692 0.027 0.109 0.106 0.3 87.2 1.8 7.9 21.9 0.00 0.94 AHW-ahw 15 cm 24h 550 0.025 0.113 0.110 0.4 86.0 2.2 0.0 14.0 ALW-alw 15 cm 24h 551 0.041 0.108 0.099 0.2 87.5 1.3 0.0 0.0 THW-thw 0.50 h 25h 550 -0.110 0.683 0.675 7.8 58.5 2.7 24.0 0.0 TLW-tlw 0.50 h 25h 551 0.077 0.583 0.579 3.8 61.0 3.3 0.0 25.0
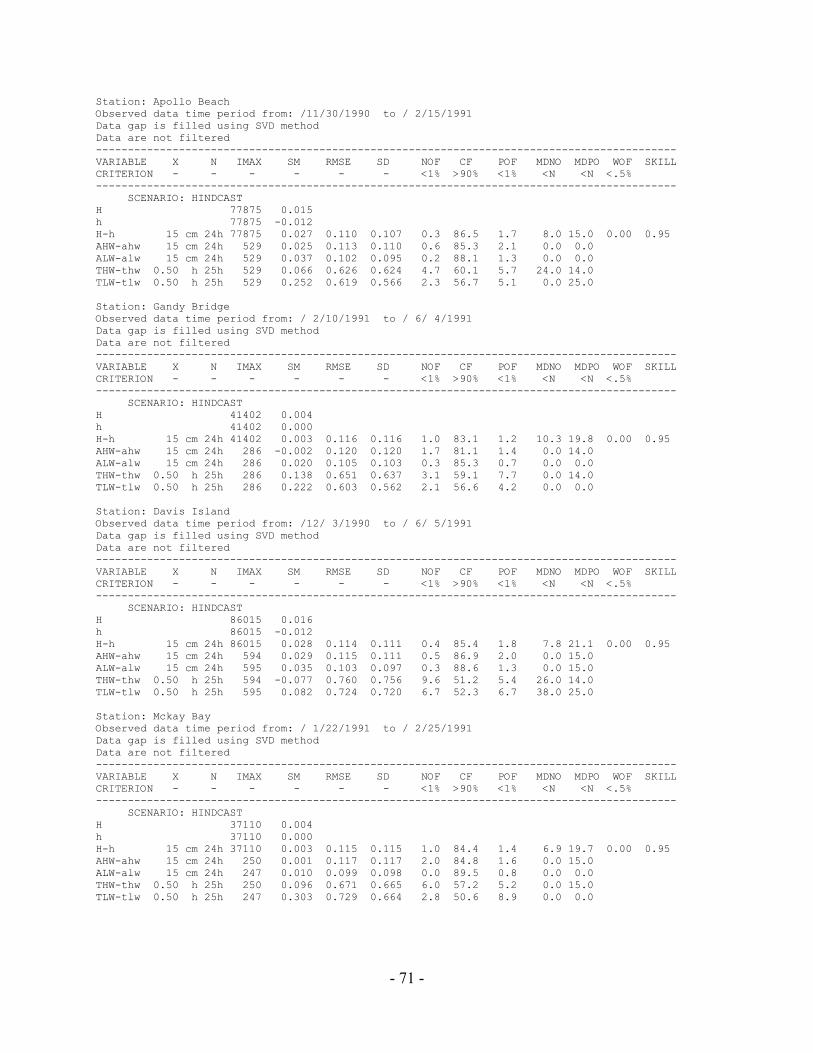
- 71 -
Station: Apollo Beach Observed data time period from: /11/30/1990 to / 2/15/1991 Data gap is filled using SVD method Data are not filtered ------------------------------------------------------------------------------------------- VARIABLE X N IMAX SM RMSE SD NOF CF POF MDNO MDPO WOF SKILL CRITERION - - - - - - <1% >90% <1% <N <N <.5% ------------------------------------------------------------------------------------------- SCENARIO: HINDCAST H 77875 0.015 h 77875 -0.012 H-h 15 cm 24h 77875 0.027 0.110 0.107 0.3 86.5 1.7 8.0 15.0 0.00 0.95 AHW-ahw 15 cm 24h 529 0.025 0.113 0.110 0.6 85.3 2.1 0.0 0.0 ALW-alw 15 cm 24h 529 0.037 0.102 0.095 0.2 88.1 1.3 0.0 0.0 THW-thw 0.50 h 25h 529 0.066 0.626 0.624 4.7 60.1 5.7 24.0 14.0 TLW-tlw 0.50 h 25h 529 0.252 0.619 0.566 2.3 56.7 5.1 0.0 25.0 Station: Gandy Bridge Observed data time period from: / 2/10/1991 to / 6/ 4/1991 Data gap is filled using SVD method Data are not filtered ------------------------------------------------------------------------------------------- VARIABLE X N IMAX SM RMSE SD NOF CF POF MDNO MDPO WOF SKILL CRITERION - - - - - - <1% >90% <1% <N <N <.5% ------------------------------------------------------------------------------------------- SCENARIO: HINDCAST H 41402 0.004 h 41402 0.000 H-h 15 cm 24h 41402 0.003 0.116 0.116 1.0 83.1 1.2 10.3 19.8 0.00 0.95 AHW-ahw 15 cm 24h 286 -0.002 0.120 0.120 1.7 81.1 1.4 0.0 14.0 ALW-alw 15 cm 24h 286 0.020 0.105 0.103 0.3 85.3 0.7 0.0 0.0 THW-thw 0.50 h 25h 286 0.138 0.651 0.637 3.1 59.1 7.7 0.0 14.0 TLW-tlw 0.50 h 25h 286 0.222 0.603 0.562 2.1 56.6 4.2 0.0 0.0 Station: Davis Island Observed data time period from: /12/ 3/1990 to / 6/ 5/1991 Data gap is filled using SVD method Data are not filtered ------------------------------------------------------------------------------------------- VARIABLE X N IMAX SM RMSE SD NOF CF POF MDNO MDPO WOF SKILL CRITERION - - - - - - <1% >90% <1% <N <N <.5% ------------------------------------------------------------------------------------------- SCENARIO: HINDCAST H 86015 0.016 h 86015 -0.012 H-h 15 cm 24h 86015 0.028 0.114 0.111 0.4 85.4 1.8 7.8 21.1 0.00 0.95 AHW-ahw 15 cm 24h 594 0.029 0.115 0.111 0.5 86.9 2.0 0.0 15.0 ALW-alw 15 cm 24h 595 0.035 0.103 0.097 0.3 88.6 1.3 0.0 15.0 THW-thw 0.50 h 25h 594 -0.077 0.760 0.756 9.6 51.2 5.4 26.0 14.0 TLW-tlw 0.50 h 25h 595 0.082 0.724 0.720 6.7 52.3 6.7 38.0 25.0 Station: Mckay Bay Observed data time period from: / 1/22/1991 to / 2/25/1991 Data gap is filled using SVD method Data are not filtered ------------------------------------------------------------------------------------------- VARIABLE X N IMAX SM RMSE SD NOF CF POF MDNO MDPO WOF SKILL CRITERION - - - - - - <1% >90% <1% <N <N <.5% ------------------------------------------------------------------------------------------- SCENARIO: HINDCAST H 37110 0.004 h 37110 0.000 H-h 15 cm 24h 37110 0.003 0.115 0.115 1.0 84.4 1.4 6.9 19.7 0.00 0.95 AHW-ahw 15 cm 24h 250 0.001 0.117 0.117 2.0 84.8 1.6 0.0 15.0 ALW-alw 15 cm 24h 247 0.010 0.099 0.098 0.0 89.5 0.8 0.0 0.0 THW-thw 0.50 h 25h 250 0.096 0.671 0.665 6.0 57.2 5.2 0.0 15.0 TLW-tlw 0.50 h 25h 247 0.303 0.729 0.664 2.8 50.6 8.9 0.0 0.0
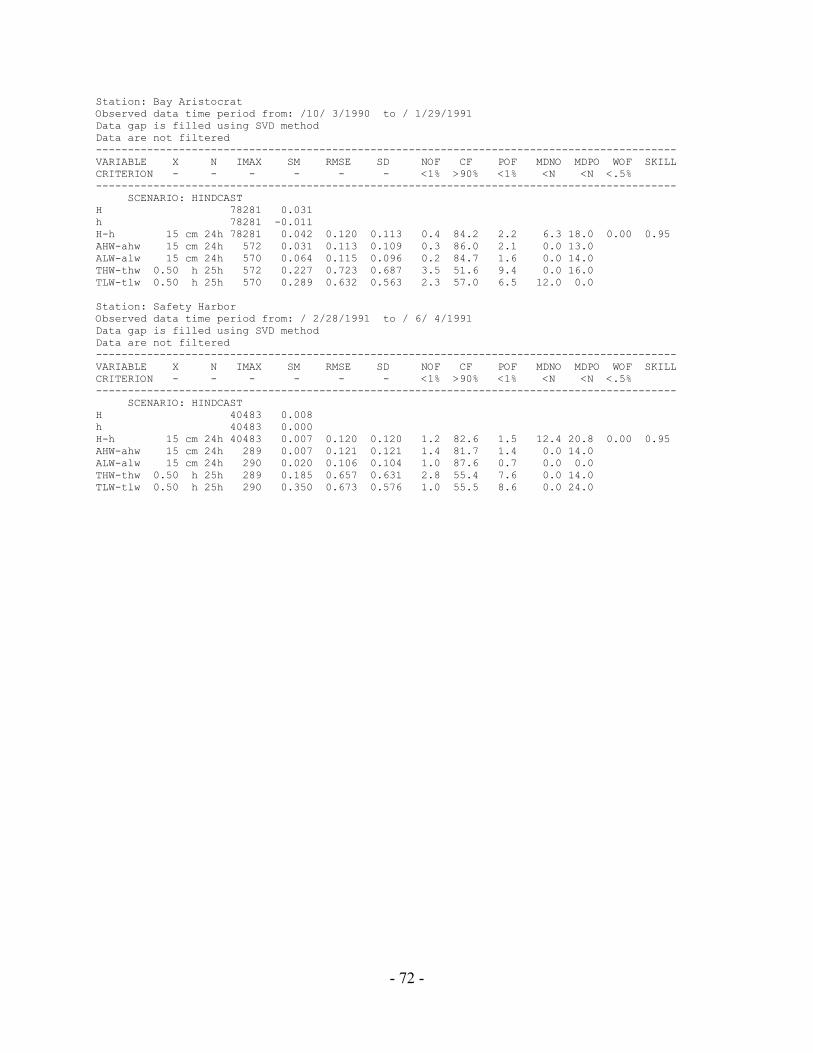
- 72 -
Station: Bay Aristocrat Observed data time period from: /10/ 3/1990 to / 1/29/1991 Data gap is filled using SVD method Data are not filtered ------------------------------------------------------------------------------------------- VARIABLE X N IMAX SM RMSE SD NOF CF POF MDNO MDPO WOF SKILL CRITERION - - - - - - <1% >90% <1% <N <N <.5% ------------------------------------------------------------------------------------------- SCENARIO: HINDCAST H 78281 0.031 h 78281 -0.011 H-h 15 cm 24h 78281 0.042 0.120 0.113 0.4 84.2 2.2 6.3 18.0 0.00 0.95 AHW-ahw 15 cm 24h 572 0.031 0.113 0.109 0.3 86.0 2.1 0.0 13.0 ALW-alw 15 cm 24h 570 0.064 0.115 0.096 0.2 84.7 1.6 0.0 14.0 THW-thw 0.50 h 25h 572 0.227 0.723 0.687 3.5 51.6 9.4 0.0 16.0 TLW-tlw 0.50 h 25h 570 0.289 0.632 0.563 2.3 57.0 6.5 12.0 0.0 Station: Safety Harbor Observed data time period from: / 2/28/1991 to / 6/ 4/1991 Data gap is filled using SVD method Data are not filtered ------------------------------------------------------------------------------------------- VARIABLE X N IMAX SM RMSE SD NOF CF POF MDNO MDPO WOF SKILL CRITERION - - - - - - <1% >90% <1% <N <N <.5% ------------------------------------------------------------------------------------------- SCENARIO: HINDCAST H 40483 0.008 h 40483 0.000 H-h 15 cm 24h 40483 0.007 0.120 0.120 1.2 82.6 1.5 12.4 20.8 0.00 0.95 AHW-ahw 15 cm 24h 289 0.007 0.121 0.121 1.4 81.7 1.4 0.0 14.0 ALW-alw 15 cm 24h 290 0.020 0.106 0.104 1.0 87.6 0.7 0.0 0.0 THW-thw 0.50 h 25h 289 0.185 0.657 0.631 2.8 55.4 7.6 0.0 14.0 TLW-tlw 0.50 h 25h 290 0.350 0.673 0.576 1.0 55.5 8.6 0.0 24.0
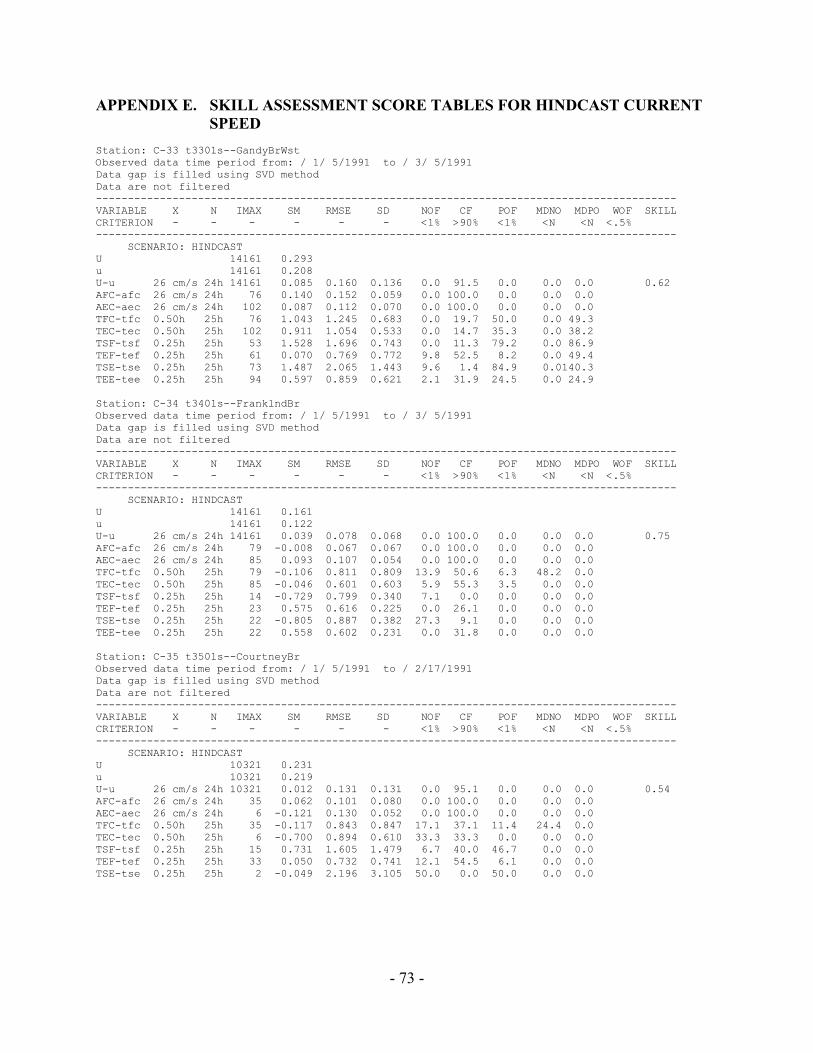
- 73 -
APPENDIX E. SKILL ASSESSMENT SCORE TABLES FOR HINDCAST CURRENT SPEED
Station: C-33 t3301s--GandyBrWst Observed data time period from: / 1/ 5/1991 to / 3/ 5/1991 Data gap is filled using SVD method Data are not filtered ------------------------------------------------------------------------------------------- VARIABLE X N IMAX SM RMSE SD NOF CF POF MDNO MDPO WOF SKILL CRITERION - - - - - - <1% >90% <1% <N <N <.5% ------------------------------------------------------------------------------------------- SCENARIO: HINDCAST U 14161 0.293 u 14161 0.208 U-u 26 cm/s 24h 14161 0.085 0.160 0.136 0.0 91.5 0.0 0.0 0.0 0.62 AFC-afc 26 cm/s 24h 76 0.140 0.152 0.059 0.0 100.0 0.0 0.0 0.0 AEC-aec 26 cm/s 24h 102 0.087 0.112 0.070 0.0 100.0 0.0 0.0 0.0 TFC-tfc 0.50h 25h 76 1.043 1.245 0.683 0.0 19.7 50.0 0.0 49.3 TEC-tec 0.50h 25h 102 0.911 1.054 0.533 0.0 14.7 35.3 0.0 38.2 TSF-tsf 0.25h 25h 53 1.528 1.696 0.743 0.0 11.3 79.2 0.0 86.9 TEF-tef 0.25h 25h 61 0.070 0.769 0.772 9.8 52.5 8.2 0.0 49.4 TSE-tse 0.25h 25h 73 1.487 2.065 1.443 9.6 1.4 84.9 0.0140.3 TEE-tee 0.25h 25h 94 0.597 0.859 0.621 2.1 31.9 24.5 0.0 24.9 Station: C-34 t3401s--FranklndBr Observed data time period from: / 1/ 5/1991 to / 3/ 5/1991 Data gap is filled using SVD method Data are not filtered -------------------------------------------------------------------------------------------VARIABLE X N IMAX SM RMSE SD NOF CF POF MDNO MDPO WOF SKILL CRITERION - - - - - - <1% >90% <1% <N <N <.5% ------------------------------------------------------------------------------------------- SCENARIO: HINDCAST U 14161 0.161 u 14161 0.122 U-u 26 cm/s 24h 14161 0.039 0.078 0.068 0.0 100.0 0.0 0.0 0.0 0.75 AFC-afc 26 cm/s 24h 79 -0.008 0.067 0.067 0.0 100.0 0.0 0.0 0.0 AEC-aec 26 cm/s 24h 85 0.093 0.107 0.054 0.0 100.0 0.0 0.0 0.0 TFC-tfc 0.50h 25h 79 -0.106 0.811 0.809 13.9 50.6 6.3 48.2 0.0 TEC-tec 0.50h 25h 85 -0.046 0.601 0.603 5.9 55.3 3.5 0.0 0.0 TSF-tsf 0.25h 25h 14 -0.729 0.799 0.340 7.1 0.0 0.0 0.0 0.0 TEF-tef 0.25h 25h 23 0.575 0.616 0.225 0.0 26.1 0.0 0.0 0.0 TSE-tse 0.25h 25h 22 -0.805 0.887 0.382 27.3 9.1 0.0 0.0 0.0 TEE-tee 0.25h 25h 22 0.558 0.602 0.231 0.0 31.8 0.0 0.0 0.0 Station: C-35 t3501s--CourtneyBr Observed data time period from: / 1/ 5/1991 to / 2/17/1991 Data gap is filled using SVD method Data are not filtered ------------------------------------------------------------------------------------------- VARIABLE X N IMAX SM RMSE SD NOF CF POF MDNO MDPO WOF SKILL CRITERION - - - - - - <1% >90% <1% <N <N <.5% ------------------------------------------------------------------------------------------- SCENARIO: HINDCAST U 10321 0.231 u 10321 0.219 U-u 26 cm/s 24h 10321 0.012 0.131 0.131 0.0 95.1 0.0 0.0 0.0 0.54 AFC-afc 26 cm/s 24h 35 0.062 0.101 0.080 0.0 100.0 0.0 0.0 0.0 AEC-aec 26 cm/s 24h 6 -0.121 0.130 0.052 0.0 100.0 0.0 0.0 0.0 TFC-tfc 0.50h 25h 35 -0.117 0.843 0.847 17.1 37.1 11.4 24.4 0.0 TEC-tec 0.50h 25h 6 -0.700 0.894 0.610 33.3 33.3 0.0 0.0 0.0 TSF-tsf 0.25h 25h 15 0.731 1.605 1.479 6.7 40.0 46.7 0.0 0.0 TEF-tef 0.25h 25h 33 0.050 0.732 0.741 12.1 54.5 6.1 0.0 0.0 TSE-tse 0.25h 25h 2 -0.049 2.196 3.105 50.0 0.0 50.0 0.0 0.0
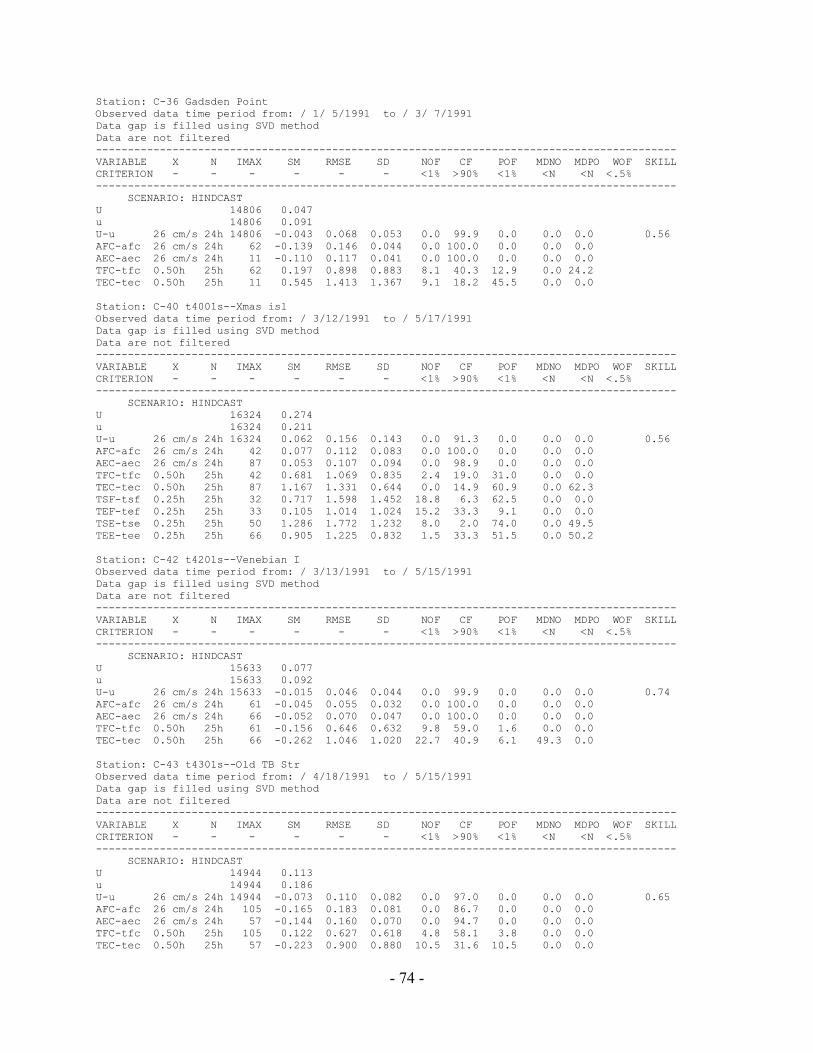
- 74 -
Station: C-36 Gadsden Point Observed data time period from: / 1/ 5/1991 to / 3/ 7/1991 Data gap is filled using SVD method Data are not filtered ------------------------------------------------------------------------------------------- VARIABLE X N IMAX SM RMSE SD NOF CF POF MDNO MDPO WOF SKILL CRITERION - - - - - - <1% >90% <1% <N <N <.5% ------------------------------------------------------------------------------------------- SCENARIO: HINDCAST U 14806 0.047 u 14806 0.091 U-u 26 cm/s 24h 14806 -0.043 0.068 0.053 0.0 99.9 0.0 0.0 0.0 0.56 AFC-afc 26 cm/s 24h 62 -0.139 0.146 0.044 0.0 100.0 0.0 0.0 0.0 AEC-aec 26 cm/s 24h 11 -0.110 0.117 0.041 0.0 100.0 0.0 0.0 0.0 TFC-tfc 0.50h 25h 62 0.197 0.898 0.883 8.1 40.3 12.9 0.0 24.2 TEC-tec 0.50h 25h 11 0.545 1.413 1.367 9.1 18.2 45.5 0.0 0.0 Station: C-40 t4001s--Xmas isl Observed data time period from: / 3/12/1991 to / 5/17/1991 Data gap is filled using SVD method Data are not filtered ------------------------------------------------------------------------------------------- VARIABLE X N IMAX SM RMSE SD NOF CF POF MDNO MDPO WOF SKILL CRITERION - - - - - - <1% >90% <1% <N <N <.5% ------------------------------------------------------------------------------------------- SCENARIO: HINDCAST U 16324 0.274 u 16324 0.211 U-u 26 cm/s 24h 16324 0.062 0.156 0.143 0.0 91.3 0.0 0.0 0.0 0.56 AFC-afc 26 cm/s 24h 42 0.077 0.112 0.083 0.0 100.0 0.0 0.0 0.0 AEC-aec 26 cm/s 24h 87 0.053 0.107 0.094 0.0 98.9 0.0 0.0 0.0 TFC-tfc 0.50h 25h 42 0.681 1.069 0.835 2.4 19.0 31.0 0.0 0.0 TEC-tec 0.50h 25h 87 1.167 1.331 0.644 0.0 14.9 60.9 0.0 62.3 TSF-tsf 0.25h 25h 32 0.717 1.598 1.452 18.8 6.3 62.5 0.0 0.0 TEF-tef 0.25h 25h 33 0.105 1.014 1.024 15.2 33.3 9.1 0.0 0.0 TSE-tse 0.25h 25h 50 1.286 1.772 1.232 8.0 2.0 74.0 0.0 49.5 TEE-tee 0.25h 25h 66 0.905 1.225 0.832 1.5 33.3 51.5 0.0 50.2 Station: C-42 t4201s--Venebian I Observed data time period from: / 3/13/1991 to / 5/15/1991 Data gap is filled using SVD method Data are not filtered ------------------------------------------------------------------------------------------- VARIABLE X N IMAX SM RMSE SD NOF CF POF MDNO MDPO WOF SKILL CRITERION - - - - - - <1% >90% <1% <N <N <.5% ------------------------------------------------------------------------------------------- SCENARIO: HINDCAST U 15633 0.077 u 15633 0.092 U-u 26 cm/s 24h 15633 -0.015 0.046 0.044 0.0 99.9 0.0 0.0 0.0 0.74 AFC-afc 26 cm/s 24h 61 -0.045 0.055 0.032 0.0 100.0 0.0 0.0 0.0 AEC-aec 26 cm/s 24h 66 -0.052 0.070 0.047 0.0 100.0 0.0 0.0 0.0 TFC-tfc 0.50h 25h 61 -0.156 0.646 0.632 9.8 59.0 1.6 0.0 0.0 TEC-tec 0.50h 25h 66 -0.262 1.046 1.020 22.7 40.9 6.1 49.3 0.0 Station: C-43 t4301s--Old TB Str Observed data time period from: / 4/18/1991 to / 5/15/1991 Data gap is filled using SVD method Data are not filtered ------------------------------------------------------------------------------------------- VARIABLE X N IMAX SM RMSE SD NOF CF POF MDNO MDPO WOF SKILL CRITERION - - - - - - <1% >90% <1% <N <N <.5% ------------------------------------------------------------------------------------------- SCENARIO: HINDCAST U 14944 0.113 u 14944 0.186 U-u 26 cm/s 24h 14944 -0.073 0.110 0.082 0.0 97.0 0.0 0.0 0.0 0.65 AFC-afc 26 cm/s 24h 105 -0.165 0.183 0.081 0.0 86.7 0.0 0.0 0.0 AEC-aec 26 cm/s 24h 57 -0.144 0.160 0.070 0.0 94.7 0.0 0.0 0.0 TFC-tfc 0.50h 25h 105 0.122 0.627 0.618 4.8 58.1 3.8 0.0 0.0 TEC-tec 0.50h 25h 57 -0.223 0.900 0.880 10.5 31.6 10.5 0.0 0.0
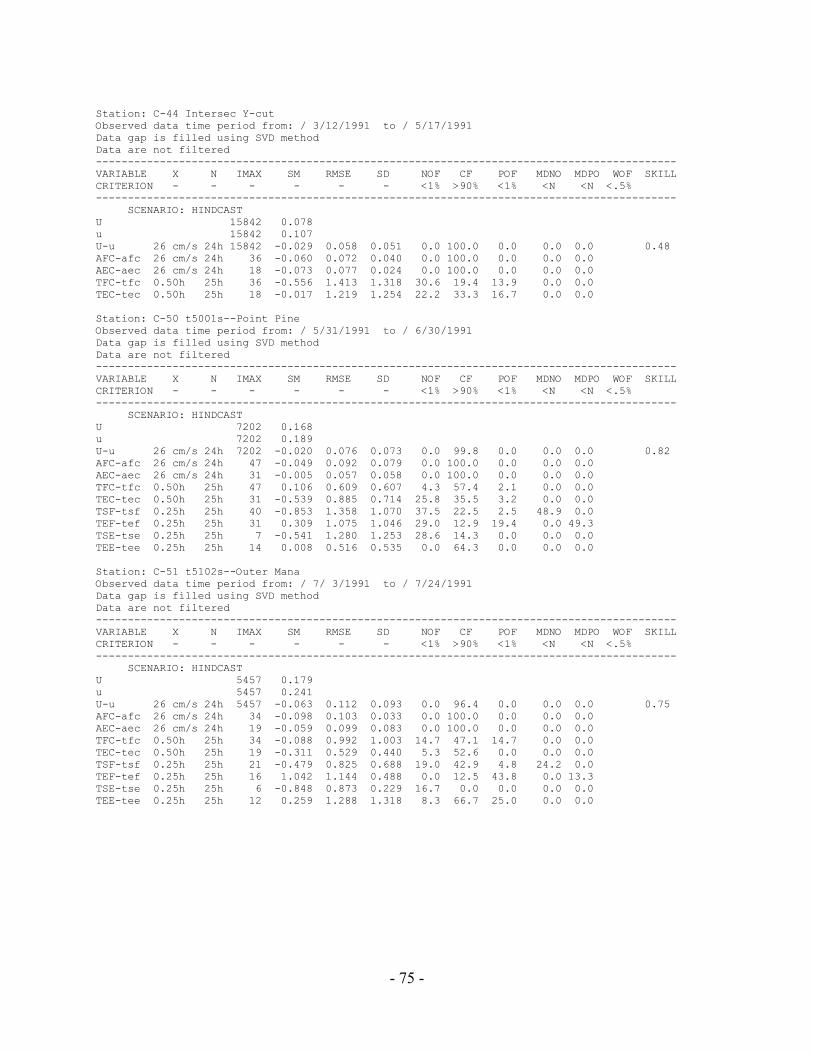
- 75 -
Station: C-44 Intersec Y-cut Observed data time period from: / 3/12/1991 to / 5/17/1991 Data gap is filled using SVD method Data are not filtered ------------------------------------------------------------------------------------------- VARIABLE X N IMAX SM RMSE SD NOF CF POF MDNO MDPO WOF SKILL CRITERION - - - - - - <1% >90% <1% <N <N <.5% ------------------------------------------------------------------------------------------- SCENARIO: HINDCAST U 15842 0.078 u 15842 0.107 U-u 26 cm/s 24h 15842 -0.029 0.058 0.051 0.0 100.0 0.0 0.0 0.0 0.48 AFC-afc 26 cm/s 24h 36 -0.060 0.072 0.040 0.0 100.0 0.0 0.0 0.0 AEC-aec 26 cm/s 24h 18 -0.073 0.077 0.024 0.0 100.0 0.0 0.0 0.0 TFC-tfc 0.50h 25h 36 -0.556 1.413 1.318 30.6 19.4 13.9 0.0 0.0 TEC-tec 0.50h 25h 18 -0.017 1.219 1.254 22.2 33.3 16.7 0.0 0.0 Station: C-50 t5001s--Point Pine Observed data time period from: / 5/31/1991 to / 6/30/1991 Data gap is filled using SVD method Data are not filtered ------------------------------------------------------------------------------------------- VARIABLE X N IMAX SM RMSE SD NOF CF POF MDNO MDPO WOF SKILL CRITERION - - - - - - <1% >90% <1% <N <N <.5% ------------------------------------------------------------------------------------------- SCENARIO: HINDCAST U 7202 0.168 u 7202 0.189 U-u 26 cm/s 24h 7202 -0.020 0.076 0.073 0.0 99.8 0.0 0.0 0.0 0.82 AFC-afc 26 cm/s 24h 47 -0.049 0.092 0.079 0.0 100.0 0.0 0.0 0.0 AEC-aec 26 cm/s 24h 31 -0.005 0.057 0.058 0.0 100.0 0.0 0.0 0.0 TFC-tfc 0.50h 25h 47 0.106 0.609 0.607 4.3 57.4 2.1 0.0 0.0 TEC-tec 0.50h 25h 31 -0.539 0.885 0.714 25.8 35.5 3.2 0.0 0.0 TSF-tsf 0.25h 25h 40 -0.853 1.358 1.070 37.5 22.5 2.5 48.9 0.0 TEF-tef 0.25h 25h 31 0.309 1.075 1.046 29.0 12.9 19.4 0.0 49.3 TSE-tse 0.25h 25h 7 -0.541 1.280 1.253 28.6 14.3 0.0 0.0 0.0 TEE-tee 0.25h 25h 14 0.008 0.516 0.535 0.0 64.3 0.0 0.0 0.0 Station: C-51 t5102s--Outer Mana Observed data time period from: / 7/ 3/1991 to / 7/24/1991 Data gap is filled using SVD method Data are not filtered ------------------------------------------------------------------------------------------- VARIABLE X N IMAX SM RMSE SD NOF CF POF MDNO MDPO WOF SKILL CRITERION - - - - - - <1% >90% <1% <N <N <.5% ------------------------------------------------------------------------------------------- SCENARIO: HINDCAST U 5457 0.179 u 5457 0.241 U-u 26 cm/s 24h 5457 -0.063 0.112 0.093 0.0 96.4 0.0 0.0 0.0 0.75 AFC-afc 26 cm/s 24h 34 -0.098 0.103 0.033 0.0 100.0 0.0 0.0 0.0 AEC-aec 26 cm/s 24h 19 -0.059 0.099 0.083 0.0 100.0 0.0 0.0 0.0 TFC-tfc 0.50h 25h 34 -0.088 0.992 1.003 14.7 47.1 14.7 0.0 0.0 TEC-tec 0.50h 25h 19 -0.311 0.529 0.440 5.3 52.6 0.0 0.0 0.0 TSF-tsf 0.25h 25h 21 -0.479 0.825 0.688 19.0 42.9 4.8 24.2 0.0 TEF-tef 0.25h 25h 16 1.042 1.144 0.488 0.0 12.5 43.8 0.0 13.3 TSE-tse 0.25h 25h 6 -0.848 0.873 0.229 16.7 0.0 0.0 0.0 0.0 TEE-tee 0.25h 25h 12 0.259 1.288 1.318 8.3 66.7 25.0 0.0 0.0
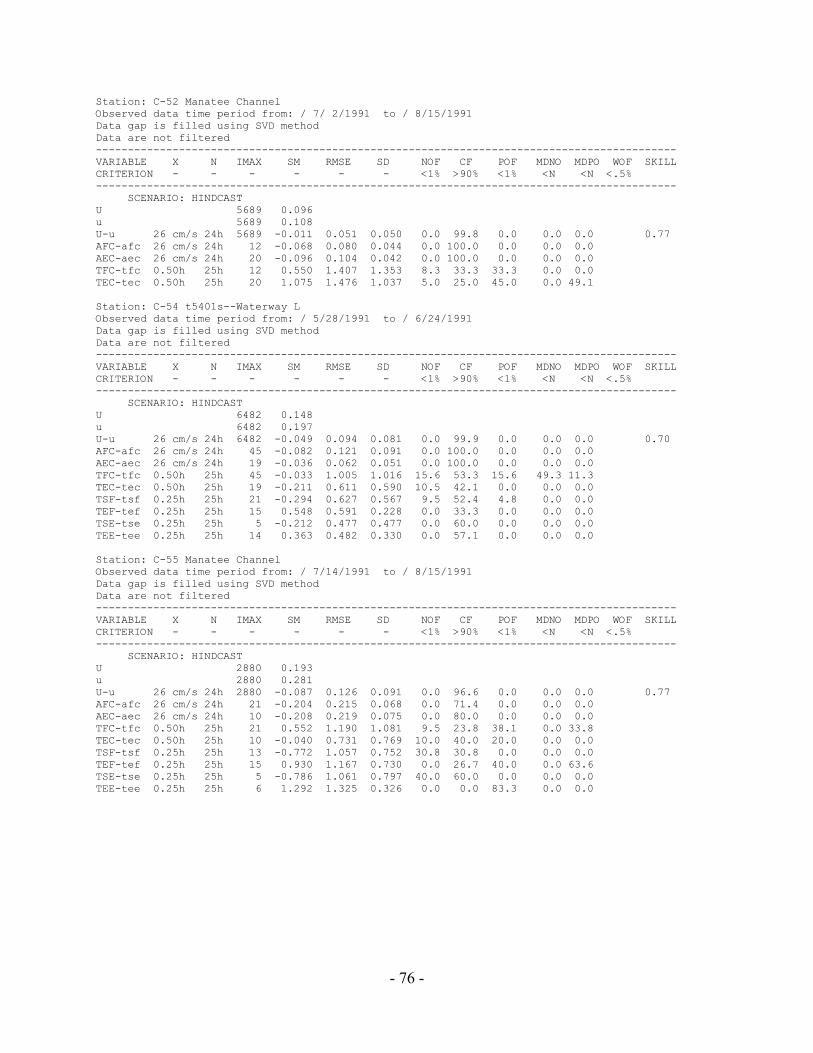
- 76 -
Station: C-52 Manatee Channel Observed data time period from: / 7/ 2/1991 to / 8/15/1991 Data gap is filled using SVD method Data are not filtered ------------------------------------------------------------------------------------------- VARIABLE X N IMAX SM RMSE SD NOF CF POF MDNO MDPO WOF SKILL CRITERION - - - - - - <1% >90% <1% <N <N <.5% ------------------------------------------------------------------------------------------- SCENARIO: HINDCAST U 5689 0.096 u 5689 0.108 U-u 26 cm/s 24h 5689 -0.011 0.051 0.050 0.0 99.8 0.0 0.0 0.0 0.77 AFC-afc 26 cm/s 24h 12 -0.068 0.080 0.044 0.0 100.0 0.0 0.0 0.0 AEC-aec 26 cm/s 24h 20 -0.096 0.104 0.042 0.0 100.0 0.0 0.0 0.0 TFC-tfc 0.50h 25h 12 0.550 1.407 1.353 8.3 33.3 33.3 0.0 0.0 TEC-tec 0.50h 25h 20 1.075 1.476 1.037 5.0 25.0 45.0 0.0 49.1 Station: C-54 t5401s--Waterway L Observed data time period from: / 5/28/1991 to / 6/24/1991 Data gap is filled using SVD method Data are not filtered ------------------------------------------------------------------------------------------- VARIABLE X N IMAX SM RMSE SD NOF CF POF MDNO MDPO WOF SKILL CRITERION - - - - - - <1% >90% <1% <N <N <.5% ------------------------------------------------------------------------------------------- SCENARIO: HINDCAST U 6482 0.148 u 6482 0.197 U-u 26 cm/s 24h 6482 -0.049 0.094 0.081 0.0 99.9 0.0 0.0 0.0 0.70 AFC-afc 26 cm/s 24h 45 -0.082 0.121 0.091 0.0 100.0 0.0 0.0 0.0 AEC-aec 26 cm/s 24h 19 -0.036 0.062 0.051 0.0 100.0 0.0 0.0 0.0 TFC-tfc 0.50h 25h 45 -0.033 1.005 1.016 15.6 53.3 15.6 49.3 11.3 TEC-tec 0.50h 25h 19 -0.211 0.611 0.590 10.5 42.1 0.0 0.0 0.0 TSF-tsf 0.25h 25h 21 -0.294 0.627 0.567 9.5 52.4 4.8 0.0 0.0 TEF-tef 0.25h 25h 15 0.548 0.591 0.228 0.0 33.3 0.0 0.0 0.0 TSE-tse 0.25h 25h 5 -0.212 0.477 0.477 0.0 60.0 0.0 0.0 0.0 TEE-tee 0.25h 25h 14 0.363 0.482 0.330 0.0 57.1 0.0 0.0 0.0 Station: C-55 Manatee Channel Observed data time period from: / 7/14/1991 to / 8/15/1991 Data gap is filled using SVD method Data are not filtered ------------------------------------------------------------------------------------------- VARIABLE X N IMAX SM RMSE SD NOF CF POF MDNO MDPO WOF SKILL CRITERION - - - - - - <1% >90% <1% <N <N <.5% ------------------------------------------------------------------------------------------- SCENARIO: HINDCAST U 2880 0.193 u 2880 0.281 U-u 26 cm/s 24h 2880 -0.087 0.126 0.091 0.0 96.6 0.0 0.0 0.0 0.77 AFC-afc 26 cm/s 24h 21 -0.204 0.215 0.068 0.0 71.4 0.0 0.0 0.0 AEC-aec 26 cm/s 24h 10 -0.208 0.219 0.075 0.0 80.0 0.0 0.0 0.0 TFC-tfc 0.50h 25h 21 0.552 1.190 1.081 9.5 23.8 38.1 0.0 33.8 TEC-tec 0.50h 25h 10 -0.040 0.731 0.769 10.0 40.0 20.0 0.0 0.0 TSF-tsf 0.25h 25h 13 -0.772 1.057 0.752 30.8 30.8 0.0 0.0 0.0 TEF-tef 0.25h 25h 15 0.930 1.167 0.730 0.0 26.7 40.0 0.0 63.6 TSE-tse 0.25h 25h 5 -0.786 1.061 0.797 40.0 60.0 0.0 0.0 0.0 TEE-tee 0.25h 25h 6 1.292 1.325 0.326 0.0 0.0 83.3 0.0 0.0
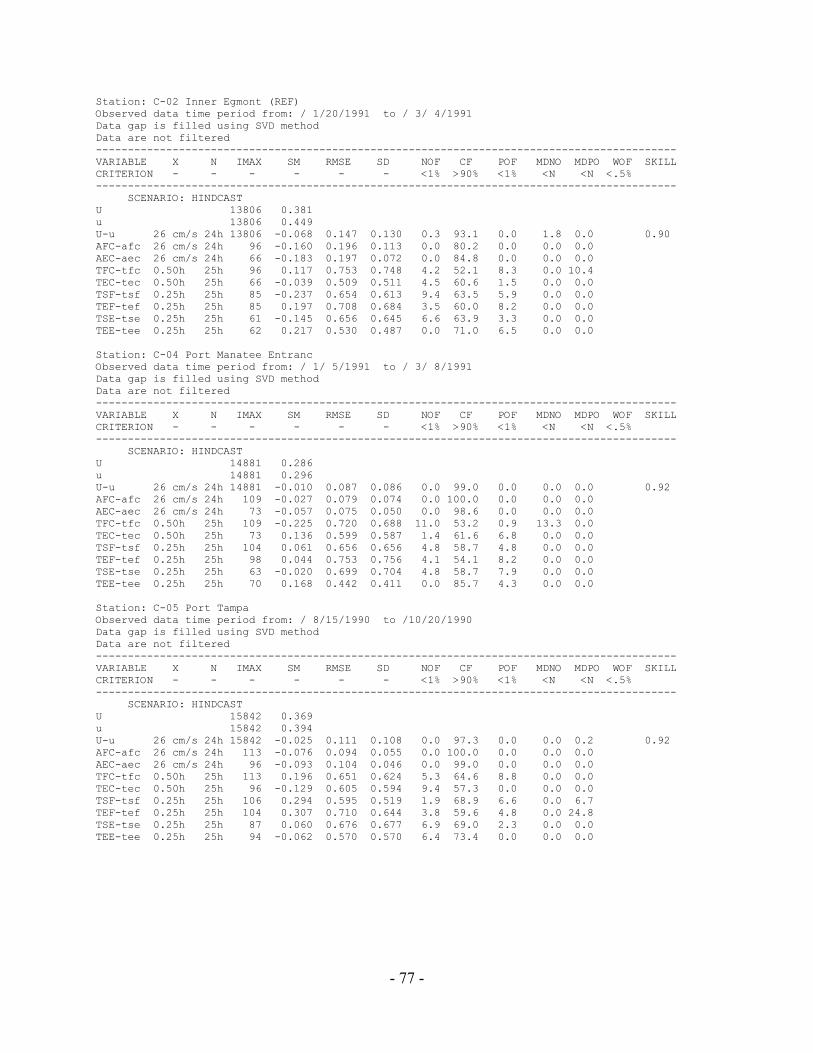
- 77 -
Station: C-02 Inner Egmont (REF) Observed data time period from: / 1/20/1991 to / 3/ 4/1991 Data gap is filled using SVD method Data are not filtered ------------------------------------------------------------------------------------------- VARIABLE X N IMAX SM RMSE SD NOF CF POF MDNO MDPO WOF SKILL CRITERION - - - - - - <1% >90% <1% <N <N <.5% ------------------------------------------------------------------------------------------- SCENARIO: HINDCAST U 13806 0.381 u 13806 0.449 U-u 26 cm/s 24h 13806 -0.068 0.147 0.130 0.3 93.1 0.0 1.8 0.0 0.90 AFC-afc 26 cm/s 24h 96 -0.160 0.196 0.113 0.0 80.2 0.0 0.0 0.0 AEC-aec 26 cm/s 24h 66 -0.183 0.197 0.072 0.0 84.8 0.0 0.0 0.0 TFC-tfc 0.50h 25h 96 0.117 0.753 0.748 4.2 52.1 8.3 0.0 10.4 TEC-tec 0.50h 25h 66 -0.039 0.509 0.511 4.5 60.6 1.5 0.0 0.0 TSF-tsf 0.25h 25h 85 -0.237 0.654 0.613 9.4 63.5 5.9 0.0 0.0 TEF-tef 0.25h 25h 85 0.197 0.708 0.684 3.5 60.0 8.2 0.0 0.0 TSE-tse 0.25h 25h 61 -0.145 0.656 0.645 6.6 63.9 3.3 0.0 0.0 TEE-tee 0.25h 25h 62 0.217 0.530 0.487 0.0 71.0 6.5 0.0 0.0 Station: C-04 Port Manatee Entranc Observed data time period from: / 1/ 5/1991 to / 3/ 8/1991 Data gap is filled using SVD method Data are not filtered ------------------------------------------------------------------------------------------- VARIABLE X N IMAX SM RMSE SD NOF CF POF MDNO MDPO WOF SKILL CRITERION - - - - - - <1% >90% <1% <N <N <.5% ------------------------------------------------------------------------------------------- SCENARIO: HINDCAST U 14881 0.286 u 14881 0.296 U-u 26 cm/s 24h 14881 -0.010 0.087 0.086 0.0 99.0 0.0 0.0 0.0 0.92 AFC-afc 26 cm/s 24h 109 -0.027 0.079 0.074 0.0 100.0 0.0 0.0 0.0 AEC-aec 26 cm/s 24h 73 -0.057 0.075 0.050 0.0 98.6 0.0 0.0 0.0 TFC-tfc 0.50h 25h 109 -0.225 0.720 0.688 11.0 53.2 0.9 13.3 0.0 TEC-tec 0.50h 25h 73 0.136 0.599 0.587 1.4 61.6 6.8 0.0 0.0 TSF-tsf 0.25h 25h 104 0.061 0.656 0.656 4.8 58.7 4.8 0.0 0.0 TEF-tef 0.25h 25h 98 0.044 0.753 0.756 4.1 54.1 8.2 0.0 0.0 TSE-tse 0.25h 25h 63 -0.020 0.699 0.704 4.8 58.7 7.9 0.0 0.0 TEE-tee 0.25h 25h 70 0.168 0.442 0.411 0.0 85.7 4.3 0.0 0.0 Station: C-05 Port Tampa Observed data time period from: / 8/15/1990 to /10/20/1990 Data gap is filled using SVD method Data are not filtered ------------------------------------------------------------------------------------------- VARIABLE X N IMAX SM RMSE SD NOF CF POF MDNO MDPO WOF SKILL CRITERION - - - - - - <1% >90% <1% <N <N <.5% ------------------------------------------------------------------------------------------- SCENARIO: HINDCAST U 15842 0.369 u 15842 0.394 U-u 26 cm/s 24h 15842 -0.025 0.111 0.108 0.0 97.3 0.0 0.0 0.2 0.92 AFC-afc 26 cm/s 24h 113 -0.076 0.094 0.055 0.0 100.0 0.0 0.0 0.0 AEC-aec 26 cm/s 24h 96 -0.093 0.104 0.046 0.0 99.0 0.0 0.0 0.0 TFC-tfc 0.50h 25h 113 0.196 0.651 0.624 5.3 64.6 8.8 0.0 0.0 TEC-tec 0.50h 25h 96 -0.129 0.605 0.594 9.4 57.3 0.0 0.0 0.0 TSF-tsf 0.25h 25h 106 0.294 0.595 0.519 1.9 68.9 6.6 0.0 6.7 TEF-tef 0.25h 25h 104 0.307 0.710 0.644 3.8 59.6 4.8 0.0 24.8 TSE-tse 0.25h 25h 87 0.060 0.676 0.677 6.9 69.0 2.3 0.0 0.0 TEE-tee 0.25h 25h 94 -0.062 0.570 0.570 6.4 73.4 0.0 0.0 0.0
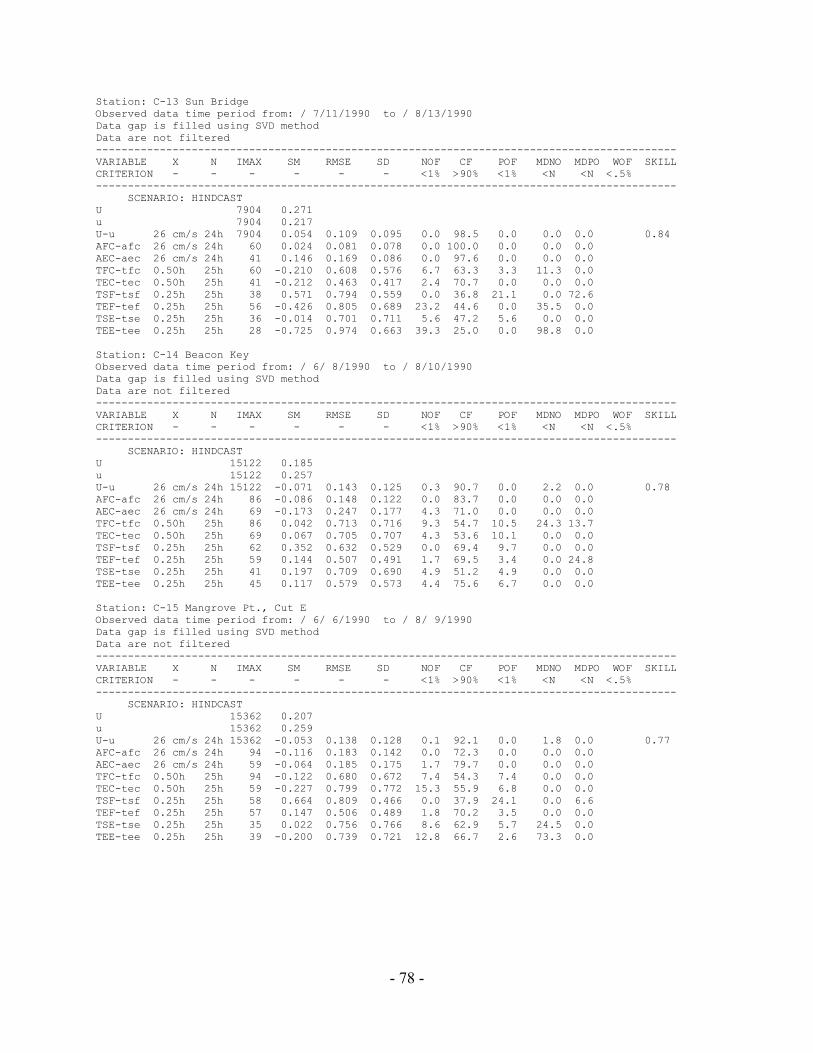
- 78 -
Station: C-13 Sun Bridge Observed data time period from: / 7/11/1990 to / 8/13/1990 Data gap is filled using SVD method Data are not filtered ------------------------------------------------------------------------------------------- VARIABLE X N IMAX SM RMSE SD NOF CF POF MDNO MDPO WOF SKILL CRITERION - - - - - - <1% >90% <1% <N <N <.5% ------------------------------------------------------------------------------------------- SCENARIO: HINDCAST U 7904 0.271 u 7904 0.217 U-u 26 cm/s 24h 7904 0.054 0.109 0.095 0.0 98.5 0.0 0.0 0.0 0.84 AFC-afc 26 cm/s 24h 60 0.024 0.081 0.078 0.0 100.0 0.0 0.0 0.0 AEC-aec 26 cm/s 24h 41 0.146 0.169 0.086 0.0 97.6 0.0 0.0 0.0 TFC-tfc 0.50h 25h 60 -0.210 0.608 0.576 6.7 63.3 3.3 11.3 0.0 TEC-tec 0.50h 25h 41 -0.212 0.463 0.417 2.4 70.7 0.0 0.0 0.0 TSF-tsf 0.25h 25h 38 0.571 0.794 0.559 0.0 36.8 21.1 0.0 72.6 TEF-tef 0.25h 25h 56 -0.426 0.805 0.689 23.2 44.6 0.0 35.5 0.0 TSE-tse 0.25h 25h 36 -0.014 0.701 0.711 5.6 47.2 5.6 0.0 0.0 TEE-tee 0.25h 25h 28 -0.725 0.974 0.663 39.3 25.0 0.0 98.8 0.0 Station: C-14 Beacon Key Observed data time period from: / 6/ 8/1990 to / 8/10/1990 Data gap is filled using SVD method Data are not filtered ------------------------------------------------------------------------------------------- VARIABLE X N IMAX SM RMSE SD NOF CF POF MDNO MDPO WOF SKILL CRITERION - - - - - - <1% >90% <1% <N <N <.5% ------------------------------------------------------------------------------------------- SCENARIO: HINDCAST U 15122 0.185 u 15122 0.257 U-u 26 cm/s 24h 15122 -0.071 0.143 0.125 0.3 90.7 0.0 2.2 0.0 0.78 AFC-afc 26 cm/s 24h 86 -0.086 0.148 0.122 0.0 83.7 0.0 0.0 0.0 AEC-aec 26 cm/s 24h 69 -0.173 0.247 0.177 4.3 71.0 0.0 0.0 0.0 TFC-tfc 0.50h 25h 86 0.042 0.713 0.716 9.3 54.7 10.5 24.3 13.7 TEC-tec 0.50h 25h 69 0.067 0.705 0.707 4.3 53.6 10.1 0.0 0.0 TSF-tsf 0.25h 25h 62 0.352 0.632 0.529 0.0 69.4 9.7 0.0 0.0 TEF-tef 0.25h 25h 59 0.144 0.507 0.491 1.7 69.5 3.4 0.0 24.8 TSE-tse 0.25h 25h 41 0.197 0.709 0.690 4.9 51.2 4.9 0.0 0.0 TEE-tee 0.25h 25h 45 0.117 0.579 0.573 4.4 75.6 6.7 0.0 0.0 Station: C-15 Mangrove Pt., Cut E Observed data time period from: / 6/ 6/1990 to / 8/ 9/1990 Data gap is filled using SVD method Data are not filtered ------------------------------------------------------------------------------------------- VARIABLE X N IMAX SM RMSE SD NOF CF POF MDNO MDPO WOF SKILL CRITERION - - - - - - <1% >90% <1% <N <N <.5% ------------------------------------------------------------------------------------------- SCENARIO: HINDCAST U 15362 0.207 u 15362 0.259 U-u 26 cm/s 24h 15362 -0.053 0.138 0.128 0.1 92.1 0.0 1.8 0.0 0.77 AFC-afc 26 cm/s 24h 94 -0.116 0.183 0.142 0.0 72.3 0.0 0.0 0.0 AEC-aec 26 cm/s 24h 59 -0.064 0.185 0.175 1.7 79.7 0.0 0.0 0.0 TFC-tfc 0.50h 25h 94 -0.122 0.680 0.672 7.4 54.3 7.4 0.0 0.0 TEC-tec 0.50h 25h 59 -0.227 0.799 0.772 15.3 55.9 6.8 0.0 0.0 TSF-tsf 0.25h 25h 58 0.664 0.809 0.466 0.0 37.9 24.1 0.0 6.6 TEF-tef 0.25h 25h 57 0.147 0.506 0.489 1.8 70.2 3.5 0.0 0.0 TSE-tse 0.25h 25h 35 0.022 0.756 0.766 8.6 62.9 5.7 24.5 0.0 TEE-tee 0.25h 25h 39 -0.200 0.739 0.721 12.8 66.7 2.6 73.3 0.0
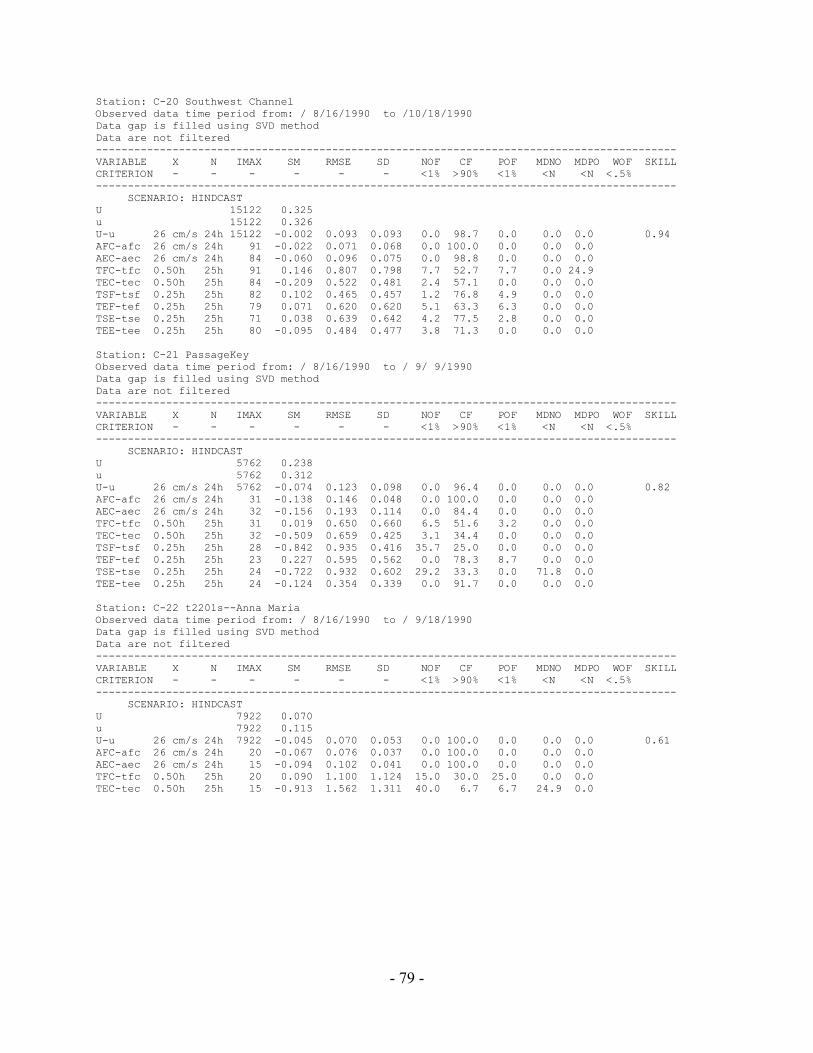
- 79 -
Station: C-20 Southwest Channel Observed data time period from: / 8/16/1990 to /10/18/1990 Data gap is filled using SVD method Data are not filtered ------------------------------------------------------------------------------------------- VARIABLE X N IMAX SM RMSE SD NOF CF POF MDNO MDPO WOF SKILL CRITERION - - - - - - <1% >90% <1% <N <N <.5% ------------------------------------------------------------------------------------------- SCENARIO: HINDCAST U 15122 0.325 u 15122 0.326 U-u 26 cm/s 24h 15122 -0.002 0.093 0.093 0.0 98.7 0.0 0.0 0.0 0.94 AFC-afc 26 cm/s 24h 91 -0.022 0.071 0.068 0.0 100.0 0.0 0.0 0.0 AEC-aec 26 cm/s 24h 84 -0.060 0.096 0.075 0.0 98.8 0.0 0.0 0.0 TFC-tfc 0.50h 25h 91 0.146 0.807 0.798 7.7 52.7 7.7 0.0 24.9 TEC-tec 0.50h 25h 84 -0.209 0.522 0.481 2.4 57.1 0.0 0.0 0.0 TSF-tsf 0.25h 25h 82 0.102 0.465 0.457 1.2 76.8 4.9 0.0 0.0 TEF-tef 0.25h 25h 79 0.071 0.620 0.620 5.1 63.3 6.3 0.0 0.0 TSE-tse 0.25h 25h 71 0.038 0.639 0.642 4.2 77.5 2.8 0.0 0.0 TEE-tee 0.25h 25h 80 -0.095 0.484 0.477 3.8 71.3 0.0 0.0 0.0 Station: C-21 PassageKey Observed data time period from: / 8/16/1990 to / 9/ 9/1990 Data gap is filled using SVD method Data are not filtered ------------------------------------------------------------------------------------------- VARIABLE X N IMAX SM RMSE SD NOF CF POF MDNO MDPO WOF SKILL CRITERION - - - - - - <1% >90% <1% <N <N <.5% ------------------------------------------------------------------------------------------- SCENARIO: HINDCAST U 5762 0.238 u 5762 0.312 U-u 26 cm/s 24h 5762 -0.074 0.123 0.098 0.0 96.4 0.0 0.0 0.0 0.82 AFC-afc 26 cm/s 24h 31 -0.138 0.146 0.048 0.0 100.0 0.0 0.0 0.0 AEC-aec 26 cm/s 24h 32 -0.156 0.193 0.114 0.0 84.4 0.0 0.0 0.0 TFC-tfc 0.50h 25h 31 0.019 0.650 0.660 6.5 51.6 3.2 0.0 0.0 TEC-tec 0.50h 25h 32 -0.509 0.659 0.425 3.1 34.4 0.0 0.0 0.0 TSF-tsf 0.25h 25h 28 -0.842 0.935 0.416 35.7 25.0 0.0 0.0 0.0 TEF-tef 0.25h 25h 23 0.227 0.595 0.562 0.0 78.3 8.7 0.0 0.0 TSE-tse 0.25h 25h 24 -0.722 0.932 0.602 29.2 33.3 0.0 71.8 0.0 TEE-tee 0.25h 25h 24 -0.124 0.354 0.339 0.0 91.7 0.0 0.0 0.0 Station: C-22 t2201s--Anna Maria Observed data time period from: / 8/16/1990 to / 9/18/1990 Data gap is filled using SVD method Data are not filtered ------------------------------------------------------------------------------------------- VARIABLE X N IMAX SM RMSE SD NOF CF POF MDNO MDPO WOF SKILL CRITERION - - - - - - <1% >90% <1% <N <N <.5% ------------------------------------------------------------------------------------------- SCENARIO: HINDCAST U 7922 0.070 u 7922 0.115 U-u 26 cm/s 24h 7922 -0.045 0.070 0.053 0.0 100.0 0.0 0.0 0.0 0.61 AFC-afc 26 cm/s 24h 20 -0.067 0.076 0.037 0.0 100.0 0.0 0.0 0.0 AEC-aec 26 cm/s 24h 15 -0.094 0.102 0.041 0.0 100.0 0.0 0.0 0.0 TFC-tfc 0.50h 25h 20 0.090 1.100 1.124 15.0 30.0 25.0 0.0 0.0 TEC-tec 0.50h 25h 15 -0.913 1.562 1.311 40.0 6.7 6.7 24.9 0.0
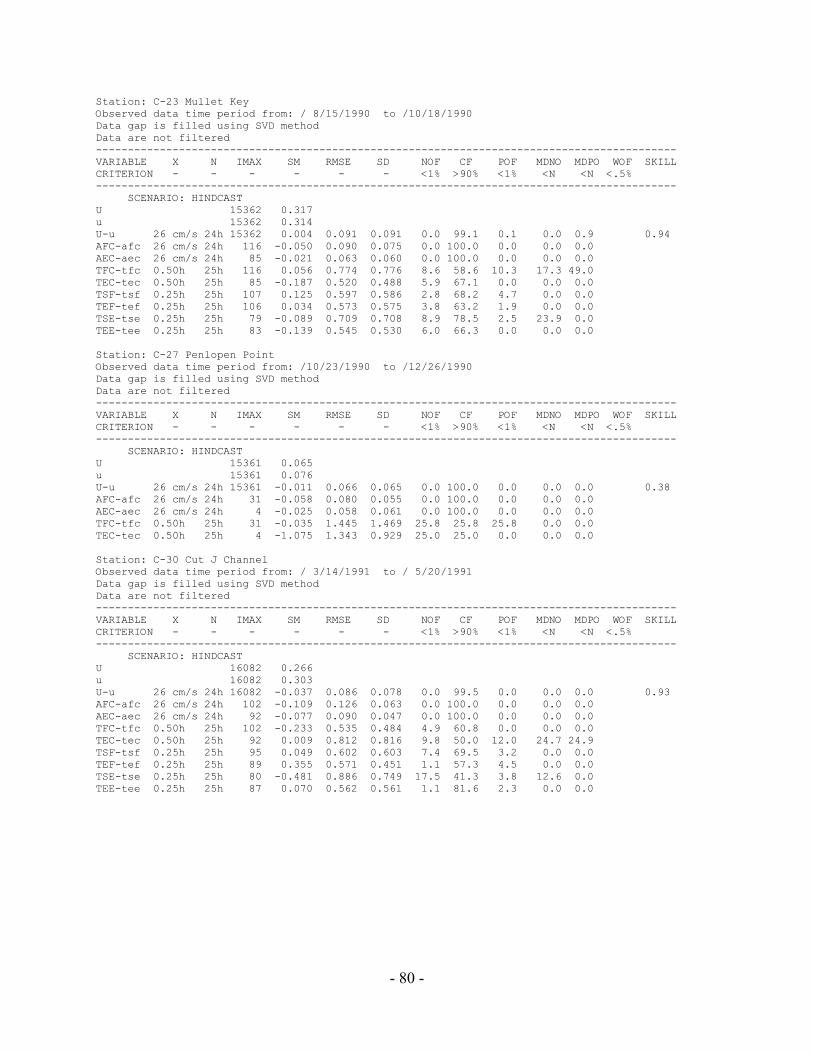
- 80 -
Station: C-23 Mullet Key Observed data time period from: / 8/15/1990 to /10/18/1990 Data gap is filled using SVD method Data are not filtered ------------------------------------------------------------------------------------------- VARIABLE X N IMAX SM RMSE SD NOF CF POF MDNO MDPO WOF SKILL CRITERION - - - - - - <1% >90% <1% <N <N <.5% ------------------------------------------------------------------------------------------- SCENARIO: HINDCAST U 15362 0.317 u 15362 0.314 U-u 26 cm/s 24h 15362 0.004 0.091 0.091 0.0 99.1 0.1 0.0 0.9 0.94 AFC-afc 26 cm/s 24h 116 -0.050 0.090 0.075 0.0 100.0 0.0 0.0 0.0 AEC-aec 26 cm/s 24h 85 -0.021 0.063 0.060 0.0 100.0 0.0 0.0 0.0 TFC-tfc 0.50h 25h 116 0.056 0.774 0.776 8.6 58.6 10.3 17.3 49.0 TEC-tec 0.50h 25h 85 -0.187 0.520 0.488 5.9 67.1 0.0 0.0 0.0 TSF-tsf 0.25h 25h 107 0.125 0.597 0.586 2.8 68.2 4.7 0.0 0.0 TEF-tef 0.25h 25h 106 0.034 0.573 0.575 3.8 63.2 1.9 0.0 0.0 TSE-tse 0.25h 25h 79 -0.089 0.709 0.708 8.9 78.5 2.5 23.9 0.0 TEE-tee 0.25h 25h 83 -0.139 0.545 0.530 6.0 66.3 0.0 0.0 0.0 Station: C-27 Penlopen Point Observed data time period from: /10/23/1990 to /12/26/1990 Data gap is filled using SVD method Data are not filtered ------------------------------------------------------------------------------------------- VARIABLE X N IMAX SM RMSE SD NOF CF POF MDNO MDPO WOF SKILL CRITERION - - - - - - <1% >90% <1% <N <N <.5% ------------------------------------------------------------------------------------------- SCENARIO: HINDCAST U 15361 0.065 u 15361 0.076 U-u 26 cm/s 24h 15361 -0.011 0.066 0.065 0.0 100.0 0.0 0.0 0.0 0.38 AFC-afc 26 cm/s 24h 31 -0.058 0.080 0.055 0.0 100.0 0.0 0.0 0.0 AEC-aec 26 cm/s 24h 4 -0.025 0.058 0.061 0.0 100.0 0.0 0.0 0.0 TFC-tfc 0.50h 25h 31 -0.035 1.445 1.469 25.8 25.8 25.8 0.0 0.0 TEC-tec 0.50h 25h 4 -1.075 1.343 0.929 25.0 25.0 0.0 0.0 0.0 Station: C-30 Cut J Channel Observed data time period from: / 3/14/1991 to / 5/20/1991 Data gap is filled using SVD method Data are not filtered ------------------------------------------------------------------------------------------- VARIABLE X N IMAX SM RMSE SD NOF CF POF MDNO MDPO WOF SKILL CRITERION - - - - - - <1% >90% <1% <N <N <.5% ------------------------------------------------------------------------------------------- SCENARIO: HINDCAST U 16082 0.266 u 16082 0.303 U-u 26 cm/s 24h 16082 -0.037 0.086 0.078 0.0 99.5 0.0 0.0 0.0 0.93 AFC-afc 26 cm/s 24h 102 -0.109 0.126 0.063 0.0 100.0 0.0 0.0 0.0 AEC-aec 26 cm/s 24h 92 -0.077 0.090 0.047 0.0 100.0 0.0 0.0 0.0 TFC-tfc 0.50h 25h 102 -0.233 0.535 0.484 4.9 60.8 0.0 0.0 0.0 TEC-tec 0.50h 25h 92 0.009 0.812 0.816 9.8 50.0 12.0 24.7 24.9 TSF-tsf 0.25h 25h 95 0.049 0.602 0.603 7.4 69.5 3.2 0.0 0.0 TEF-tef 0.25h 25h 89 0.355 0.571 0.451 1.1 57.3 4.5 0.0 0.0 TSE-tse 0.25h 25h 80 -0.481 0.886 0.749 17.5 41.3 3.8 12.6 0.0 TEE-tee 0.25h 25h 87 0.070 0.562 0.561 1.1 81.6 2.3 0.0 0.0
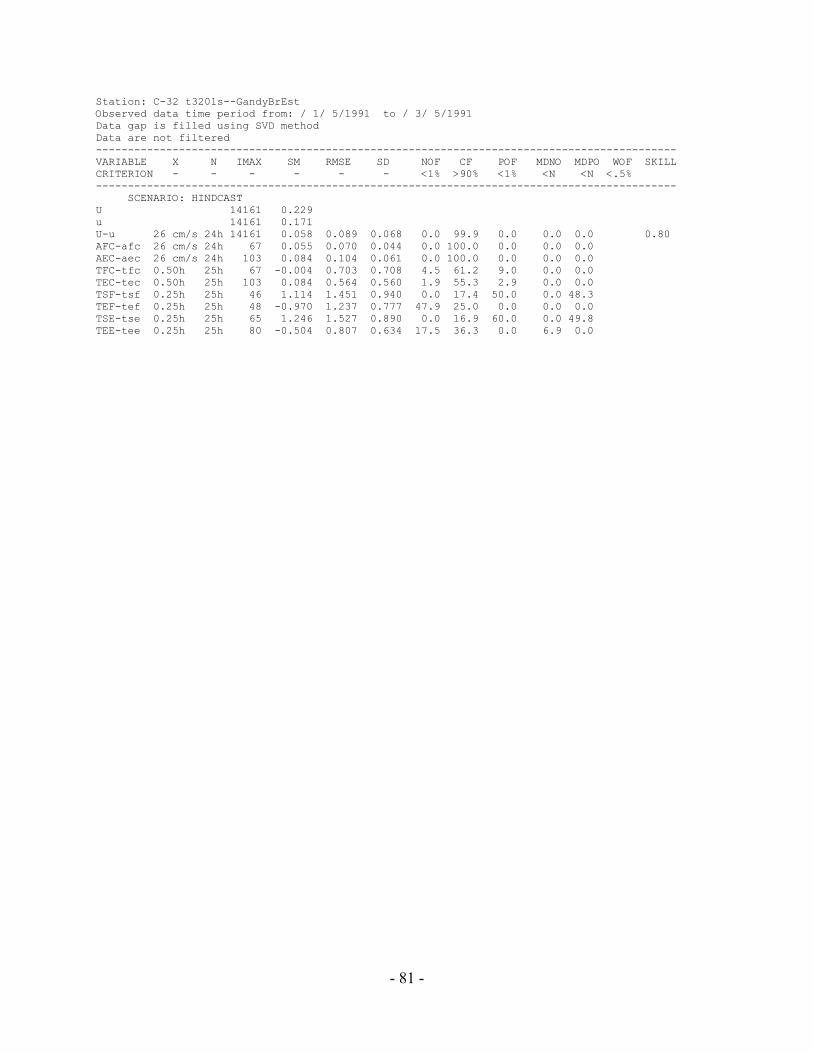
- 81 -
Station: C-32 t3201s--GandyBrEst Observed data time period from: / 1/ 5/1991 to / 3/ 5/1991 Data gap is filled using SVD method Data are not filtered ------------------------------------------------------------------------------------------- VARIABLE X N IMAX SM RMSE SD NOF CF POF MDNO MDPO WOF SKILL CRITERION - - - - - - <1% >90% <1% <N <N <.5% ------------------------------------------------------------------------------------------- SCENARIO: HINDCAST U 14161 0.229 u 14161 0.171 U-u 26 cm/s 24h 14161 0.058 0.089 0.068 0.0 99.9 0.0 0.0 0.0 0.80 AFC-afc 26 cm/s 24h 67 0.055 0.070 0.044 0.0 100.0 0.0 0.0 0.0 AEC-aec 26 cm/s 24h 103 0.084 0.104 0.061 0.0 100.0 0.0 0.0 0.0 TFC-tfc 0.50h 25h 67 -0.004 0.703 0.708 4.5 61.2 9.0 0.0 0.0 TEC-tec 0.50h 25h 103 0.084 0.564 0.560 1.9 55.3 2.9 0.0 0.0 TSF-tsf 0.25h 25h 46 1.114 1.451 0.940 0.0 17.4 50.0 0.0 48.3 TEF-tef 0.25h 25h 48 -0.970 1.237 0.777 47.9 25.0 0.0 0.0 0.0 TSE-tse 0.25h 25h 65 1.246 1.527 0.890 0.0 16.9 60.0 0.0 49.8 TEE-tee 0.25h 25h 80 -0.504 0.807 0.634 17.5 36.3 0.0 6.9 0.0

- 82 -
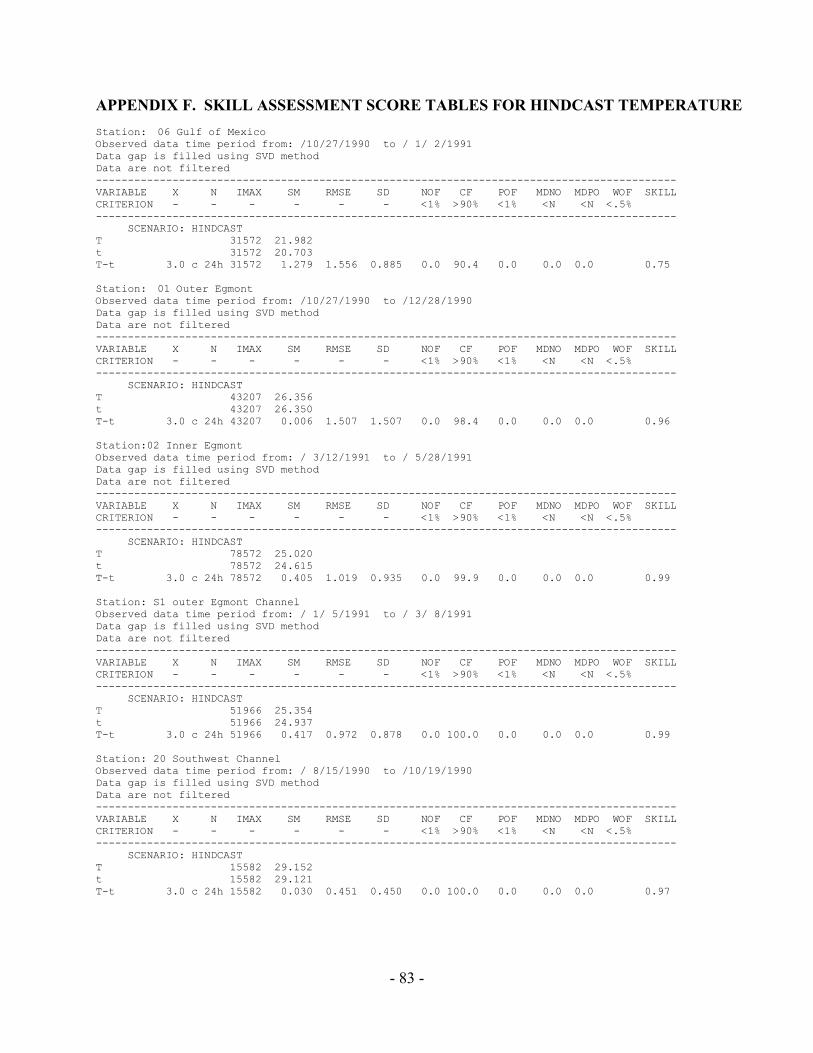
- 83 -
APPENDIX F. SKILL ASSESSMENT SCORE TABLES FOR HINDCAST TEMPERATURE Station: 06 Gulf of Mexico Observed data time period from: /10/27/1990 to / 1/ 2/1991 Data gap is filled using SVD method Data are not filtered ------------------------------------------------------------------------------------------- VARIABLE X N IMAX SM RMSE SD NOF CF POF MDNO MDPO WOF SKILL CRITERION - - - - - - <1% >90% <1% <N <N <.5% ------------------------------------------------------------------------------------------- SCENARIO: HINDCAST T 31572 21.982 t 31572 20.703 T-t 3.0 c 24h 31572 1.279 1.556 0.885 0.0 90.4 0.0 0.0 0.0 0.75 Station: 01 Outer Egmont Observed data time period from: /10/27/1990 to /12/28/1990 Data gap is filled using SVD method Data are not filtered ------------------------------------------------------------------------------------------- VARIABLE X N IMAX SM RMSE SD NOF CF POF MDNO MDPO WOF SKILL CRITERION - - - - - - <1% >90% <1% <N <N <.5% ------------------------------------------------------------------------------------------- SCENARIO: HINDCAST T 43207 26.356 t 43207 26.350 T-t 3.0 c 24h 43207 0.006 1.507 1.507 0.0 98.4 0.0 0.0 0.0 0.96 Station:02 Inner Egmont Observed data time period from: / 3/12/1991 to / 5/28/1991 Data gap is filled using SVD method Data are not filtered ------------------------------------------------------------------------------------------- VARIABLE X N IMAX SM RMSE SD NOF CF POF MDNO MDPO WOF SKILL CRITERION - - - - - - <1% >90% <1% <N <N <.5% ------------------------------------------------------------------------------------------- SCENARIO: HINDCAST T 78572 25.020 t 78572 24.615 T-t 3.0 c 24h 78572 0.405 1.019 0.935 0.0 99.9 0.0 0.0 0.0 0.99 Station: S1 outer Egmont Channel Observed data time period from: / 1/ 5/1991 to / 3/ 8/1991 Data gap is filled using SVD method Data are not filtered ------------------------------------------------------------------------------------------- VARIABLE X N IMAX SM RMSE SD NOF CF POF MDNO MDPO WOF SKILL CRITERION - - - - - - <1% >90% <1% <N <N <.5% ------------------------------------------------------------------------------------------- SCENARIO: HINDCAST T 51966 25.354 t 51966 24.937 T-t 3.0 c 24h 51966 0.417 0.972 0.878 0.0 100.0 0.0 0.0 0.0 0.99 Station: 20 Southwest Channel Observed data time period from: / 8/15/1990 to /10/19/1990 Data gap is filled using SVD method Data are not filtered ------------------------------------------------------------------------------------------- VARIABLE X N IMAX SM RMSE SD NOF CF POF MDNO MDPO WOF SKILL CRITERION - - - - - - <1% >90% <1% <N <N <.5% ------------------------------------------------------------------------------------------- SCENARIO: HINDCAST T 15582 29.152 t 15582 29.121 T-t 3.0 c 24h 15582 0.030 0.451 0.450 0.0 100.0 0.0 0.0 0.0 0.97
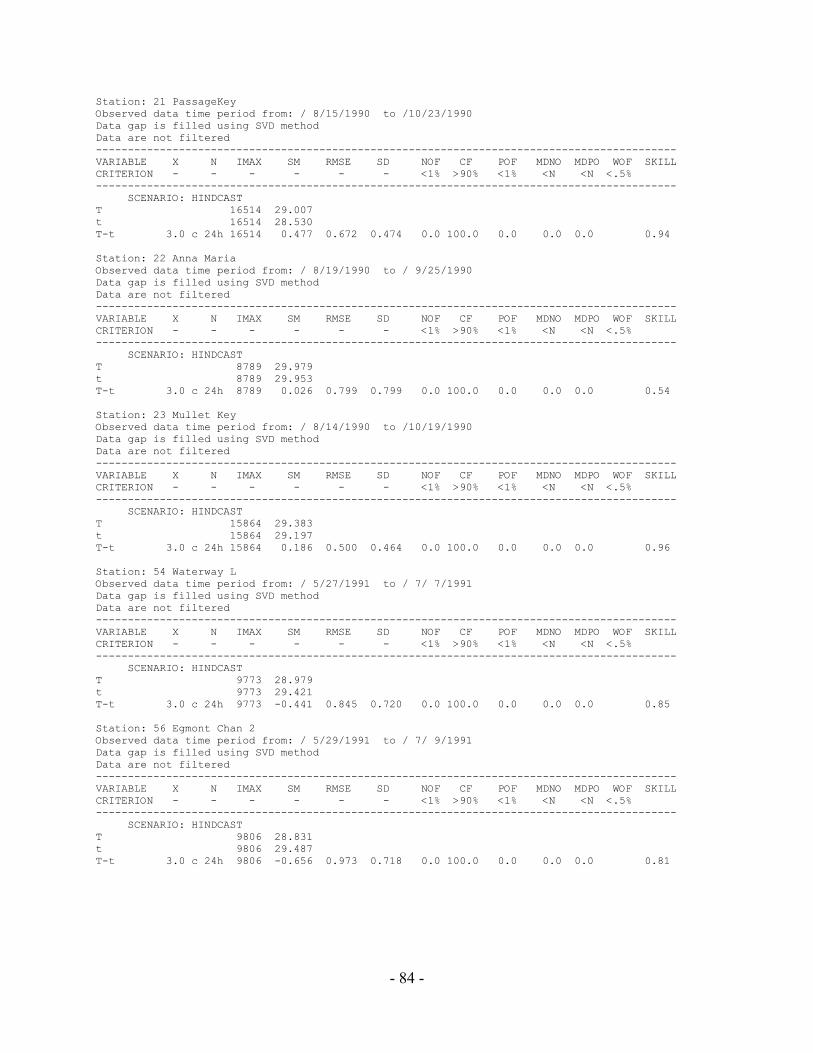
- 84 -
Station: 21 PassageKey Observed data time period from: / 8/15/1990 to /10/23/1990 Data gap is filled using SVD method Data are not filtered ------------------------------------------------------------------------------------------- VARIABLE X N IMAX SM RMSE SD NOF CF POF MDNO MDPO WOF SKILL CRITERION - - - - - - <1% >90% <1% <N <N <.5% ------------------------------------------------------------------------------------------- SCENARIO: HINDCAST T 16514 29.007 t 16514 28.530 T-t 3.0 c 24h 16514 0.477 0.672 0.474 0.0 100.0 0.0 0.0 0.0 0.94 Station: 22 Anna Maria Observed data time period from: / 8/19/1990 to / 9/25/1990 Data gap is filled using SVD method Data are not filtered ------------------------------------------------------------------------------------------- VARIABLE X N IMAX SM RMSE SD NOF CF POF MDNO MDPO WOF SKILL CRITERION - - - - - - <1% >90% <1% <N <N <.5% ------------------------------------------------------------------------------------------- SCENARIO: HINDCAST T 8789 29.979 t 8789 29.953 T-t 3.0 c 24h 8789 0.026 0.799 0.799 0.0 100.0 0.0 0.0 0.0 0.54 Station: 23 Mullet Key Observed data time period from: / 8/14/1990 to /10/19/1990 Data gap is filled using SVD method Data are not filtered ------------------------------------------------------------------------------------------- VARIABLE X N IMAX SM RMSE SD NOF CF POF MDNO MDPO WOF SKILL CRITERION - - - - - - <1% >90% <1% <N <N <.5% ------------------------------------------------------------------------------------------- SCENARIO: HINDCAST T 15864 29.383 t 15864 29.197 T-t 3.0 c 24h 15864 0.186 0.500 0.464 0.0 100.0 0.0 0.0 0.0 0.96 Station: 54 Waterway L Observed data time period from: / 5/27/1991 to / 7/ 7/1991 Data gap is filled using SVD method Data are not filtered ------------------------------------------------------------------------------------------- VARIABLE X N IMAX SM RMSE SD NOF CF POF MDNO MDPO WOF SKILL CRITERION - - - - - - <1% >90% <1% <N <N <.5% ------------------------------------------------------------------------------------------- SCENARIO: HINDCAST T 9773 28.979 t 9773 29.421 T-t 3.0 c 24h 9773 -0.441 0.845 0.720 0.0 100.0 0.0 0.0 0.0 0.85 Station: 56 Egmont Chan 2 Observed data time period from: / 5/29/1991 to / 7/ 9/1991 Data gap is filled using SVD method Data are not filtered ------------------------------------------------------------------------------------------- VARIABLE X N IMAX SM RMSE SD NOF CF POF MDNO MDPO WOF SKILL CRITERION - - - - - - <1% >90% <1% <N <N <.5% ------------------------------------------------------------------------------------------- SCENARIO: HINDCAST T 9806 28.831 t 9806 29.487 T-t 3.0 c 24h 9806 -0.656 0.973 0.718 0.0 100.0 0.0 0.0 0.0 0.81
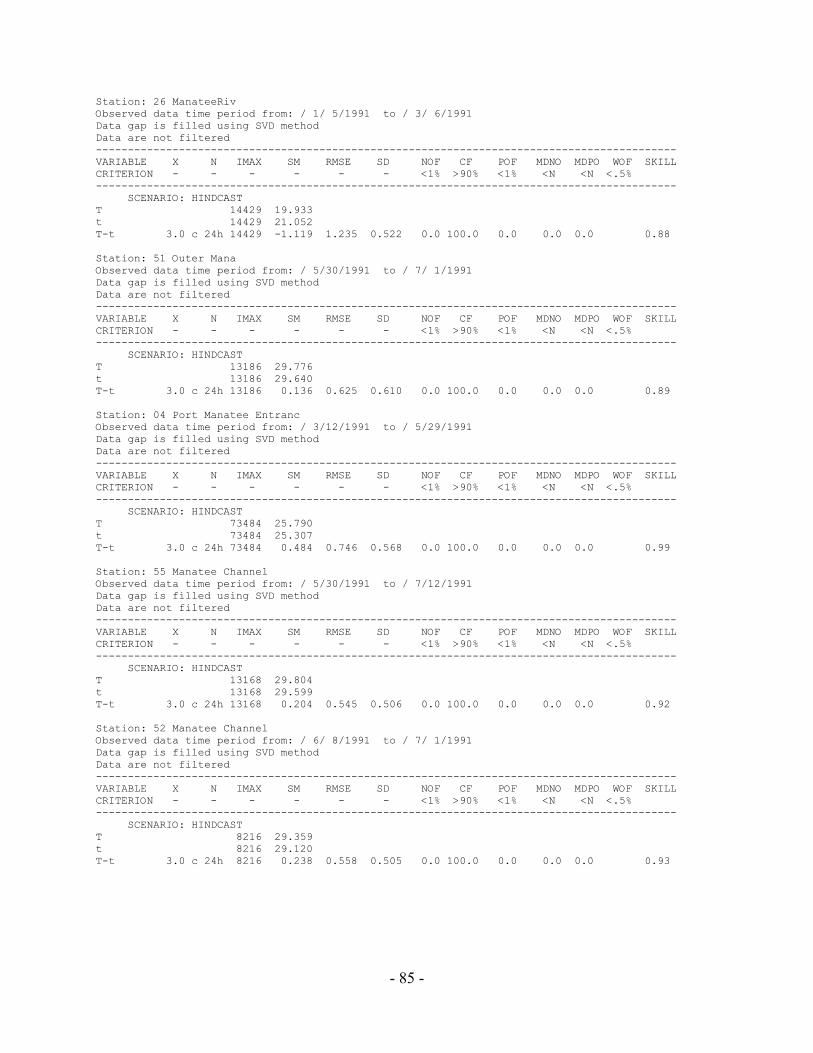
- 85 -
Station: 26 ManateeRiv Observed data time period from: / 1/ 5/1991 to / 3/ 6/1991 Data gap is filled using SVD method Data are not filtered ------------------------------------------------------------------------------------------- VARIABLE X N IMAX SM RMSE SD NOF CF POF MDNO MDPO WOF SKILL CRITERION - - - - - - <1% >90% <1% <N <N <.5% ------------------------------------------------------------------------------------------- SCENARIO: HINDCAST T 14429 19.933 t 14429 21.052 T-t 3.0 c 24h 14429 -1.119 1.235 0.522 0.0 100.0 0.0 0.0 0.0 0.88 Station: 51 Outer Mana Observed data time period from: / 5/30/1991 to / 7/ 1/1991 Data gap is filled using SVD method Data are not filtered ------------------------------------------------------------------------------------------- VARIABLE X N IMAX SM RMSE SD NOF CF POF MDNO MDPO WOF SKILL CRITERION - - - - - - <1% >90% <1% <N <N <.5% ------------------------------------------------------------------------------------------- SCENARIO: HINDCAST T 13186 29.776 t 13186 29.640 T-t 3.0 c 24h 13186 0.136 0.625 0.610 0.0 100.0 0.0 0.0 0.0 0.89 Station: 04 Port Manatee Entranc Observed data time period from: / 3/12/1991 to / 5/29/1991 Data gap is filled using SVD method Data are not filtered ------------------------------------------------------------------------------------------- VARIABLE X N IMAX SM RMSE SD NOF CF POF MDNO MDPO WOF SKILL CRITERION - - - - - - <1% >90% <1% <N <N <.5% ------------------------------------------------------------------------------------------- SCENARIO: HINDCAST T 73484 25.790 t 73484 25.307 T-t 3.0 c 24h 73484 0.484 0.746 0.568 0.0 100.0 0.0 0.0 0.0 0.99 Station: 55 Manatee Channel Observed data time period from: / 5/30/1991 to / 7/12/1991 Data gap is filled using SVD method Data are not filtered ------------------------------------------------------------------------------------------- VARIABLE X N IMAX SM RMSE SD NOF CF POF MDNO MDPO WOF SKILL CRITERION - - - - - - <1% >90% <1% <N <N <.5% ------------------------------------------------------------------------------------------- SCENARIO: HINDCAST T 13168 29.804 t 13168 29.599 T-t 3.0 c 24h 13168 0.204 0.545 0.506 0.0 100.0 0.0 0.0 0.0 0.92 Station: 52 Manatee Channel Observed data time period from: / 6/ 8/1991 to / 7/ 1/1991 Data gap is filled using SVD method Data are not filtered ------------------------------------------------------------------------------------------- VARIABLE X N IMAX SM RMSE SD NOF CF POF MDNO MDPO WOF SKILL CRITERION - - - - - - <1% >90% <1% <N <N <.5% ------------------------------------------------------------------------------------------- SCENARIO: HINDCAST T 8216 29.359 t 8216 29.120 T-t 3.0 c 24h 8216 0.238 0.558 0.505 0.0 100.0 0.0 0.0 0.0 0.93
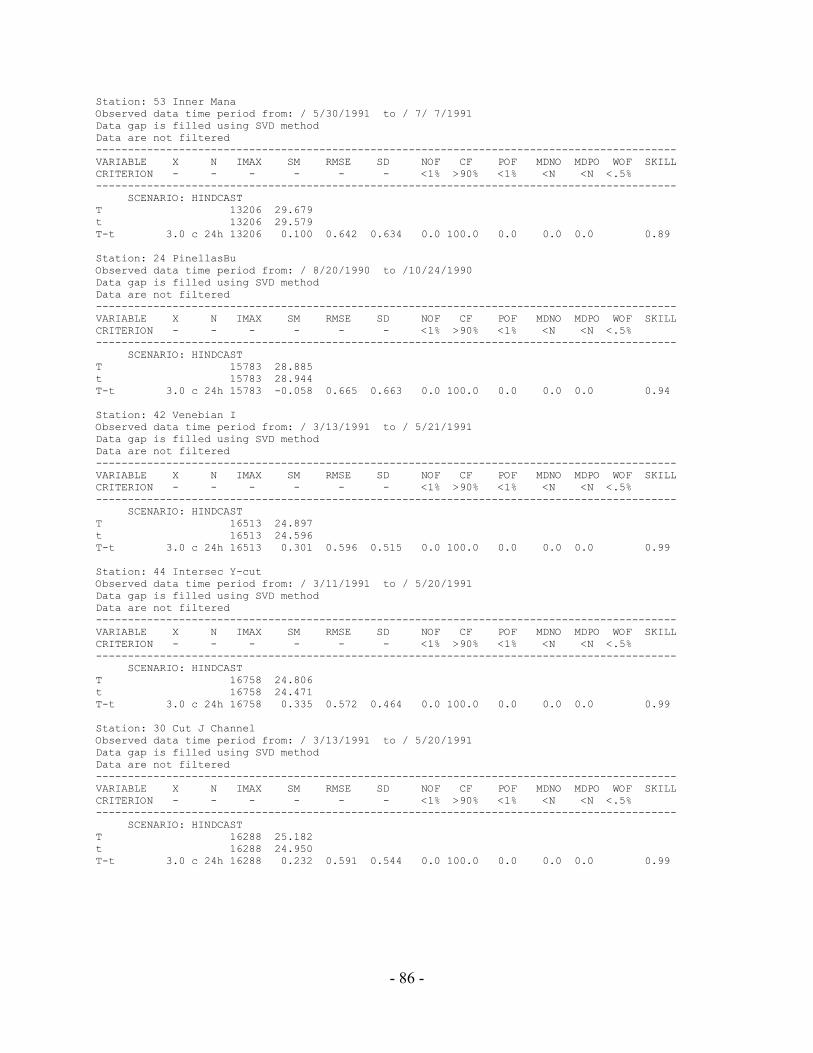
- 86 -
Station: 53 Inner Mana Observed data time period from: / 5/30/1991 to / 7/ 7/1991 Data gap is filled using SVD method Data are not filtered ------------------------------------------------------------------------------------------- VARIABLE X N IMAX SM RMSE SD NOF CF POF MDNO MDPO WOF SKILL CRITERION - - - - - - <1% >90% <1% <N <N <.5% ------------------------------------------------------------------------------------------- SCENARIO: HINDCAST T 13206 29.679 t 13206 29.579 T-t 3.0 c 24h 13206 0.100 0.642 0.634 0.0 100.0 0.0 0.0 0.0 0.89 Station: 24 PinellasBu Observed data time period from: / 8/20/1990 to /10/24/1990 Data gap is filled using SVD method Data are not filtered ------------------------------------------------------------------------------------------- VARIABLE X N IMAX SM RMSE SD NOF CF POF MDNO MDPO WOF SKILL CRITERION - - - - - - <1% >90% <1% <N <N <.5% ------------------------------------------------------------------------------------------- SCENARIO: HINDCAST T 15783 28.885 t 15783 28.944 T-t 3.0 c 24h 15783 -0.058 0.665 0.663 0.0 100.0 0.0 0.0 0.0 0.94 Station: 42 Venebian I Observed data time period from: / 3/13/1991 to / 5/21/1991 Data gap is filled using SVD method Data are not filtered ------------------------------------------------------------------------------------------- VARIABLE X N IMAX SM RMSE SD NOF CF POF MDNO MDPO WOF SKILL CRITERION - - - - - - <1% >90% <1% <N <N <.5% ------------------------------------------------------------------------------------------- SCENARIO: HINDCAST T 16513 24.897 t 16513 24.596 T-t 3.0 c 24h 16513 0.301 0.596 0.515 0.0 100.0 0.0 0.0 0.0 0.99 Station: 44 Intersec Y-cut Observed data time period from: / 3/11/1991 to / 5/20/1991 Data gap is filled using SVD method Data are not filtered ------------------------------------------------------------------------------------------- VARIABLE X N IMAX SM RMSE SD NOF CF POF MDNO MDPO WOF SKILL CRITERION - - - - - - <1% >90% <1% <N <N <.5% ------------------------------------------------------------------------------------------- SCENARIO: HINDCAST T 16758 24.806 t 16758 24.471 T-t 3.0 c 24h 16758 0.335 0.572 0.464 0.0 100.0 0.0 0.0 0.0 0.99 Station: 30 Cut J Channel Observed data time period from: / 3/13/1991 to / 5/20/1991 Data gap is filled using SVD method Data are not filtered ------------------------------------------------------------------------------------------- VARIABLE X N IMAX SM RMSE SD NOF CF POF MDNO MDPO WOF SKILL CRITERION - - - - - - <1% >90% <1% <N <N <.5% ------------------------------------------------------------------------------------------- SCENARIO: HINDCAST T 16288 25.182 t 16288 24.950 T-t 3.0 c 24h 16288 0.232 0.591 0.544 0.0 100.0 0.0 0.0 0.0 0.99

- 87 -
Station: 36 Gadsden Point Observed data time period from: / 1/ 4/1991 to / 3/ 7/1991 Data gap is filled using SVD method Data are not filtered ------------------------------------------------------------------------------------------- VARIABLE X N IMAX SM RMSE SD NOF CF POF MDNO MDPO WOF SKILL CRITERION - - - - - - <1% >90% <1% <N <N <.5% ------------------------------------------------------------------------------------------- SCENARIO: HINDCAST T 14814 20.133 t 14814 19.335 T-t 3.0 c 24h 14814 0.799 0.875 0.356 0.0 100.0 0.0 0.0 0.0 0.90 Station: 31 Cut C Channel Observed data time period from: / 1/ 5/1991 to / 3/ 7/1991 Data gap is filled using SVD method Data are not filtered ------------------------------------------------------------------------------------------- VARIABLE X N IMAX SM RMSE SD NOF CF POF MDNO MDPO WOF SKILL CRITERION - - - - - - <1% >90% <1% <N <N <.5% ------------------------------------------------------------------------------------------- SCENARIO: HINDCAST T 14776 20.123 t 14776 19.310 T-t 3.0 c 24h 14776 0.812 0.899 0.385 0.0 100.0 0.0 0.0 0.0 0.90 Station: 46 AlphiaRv Observed data time period from: / 3/11/1991 to / 5/22/1991 Data gap is filled using SVD method Data are not filtered ------------------------------------------------------------------------------------------- VARIABLE X N IMAX SM RMSE SD NOF CF POF MDNO MDPO WOF SKILL CRITERION - - - - - - <1% >90% <1% <N <N <.5% ------------------------------------------------------------------------------------------- SCENARIO: HINDCAST T 17214 24.967 t 17214 24.847 T-t 3.0 c 24h 17214 0.119 0.628 0.617 0.0 100.0 0.0 0.0 0.0 0.99 Station: 27 PinellasPt Observed data time period from: /10/22/1990 to /12/27/1990 Data gap is filled using SVD method Data are not filtered ------------------------------------------------------------------------------------------- VARIABLE X N IMAX SM RMSE SD NOF CF POF MDNO MDPO WOF SKILL CRITERION - - - - - - <1% >90% <1% <N <N <.5% ------------------------------------------------------------------------------------------- SCENARIO: HINDCAST T 15750 21.927 t 15750 21.091 T-t 3.0 c 24h 15750 0.836 0.973 0.498 0.0 100.0 0.0 0.0 0.0 0.95 Station: 40 Xmas Is Observed data time period from: / 3/11/1991 to / 5/21/1991 Data gap is filled using SVD method Data are not filtered ------------------------------------------------------------------------------------------- VARIABLE X N IMAX SM RMSE SD NOF CF POF MDNO MDPO WOF SKILL CRITERION - - - - - - <1% >90% <1% <N <N <.5% ------------------------------------------------------------------------------------------- SCENARIO: HINDCAST T 16950 25.232 t 16950 24.928 T-t 3.0 c 24h 16950 0.304 0.653 0.577 0.0 100.0 0.0 0.0 0.0 0.99
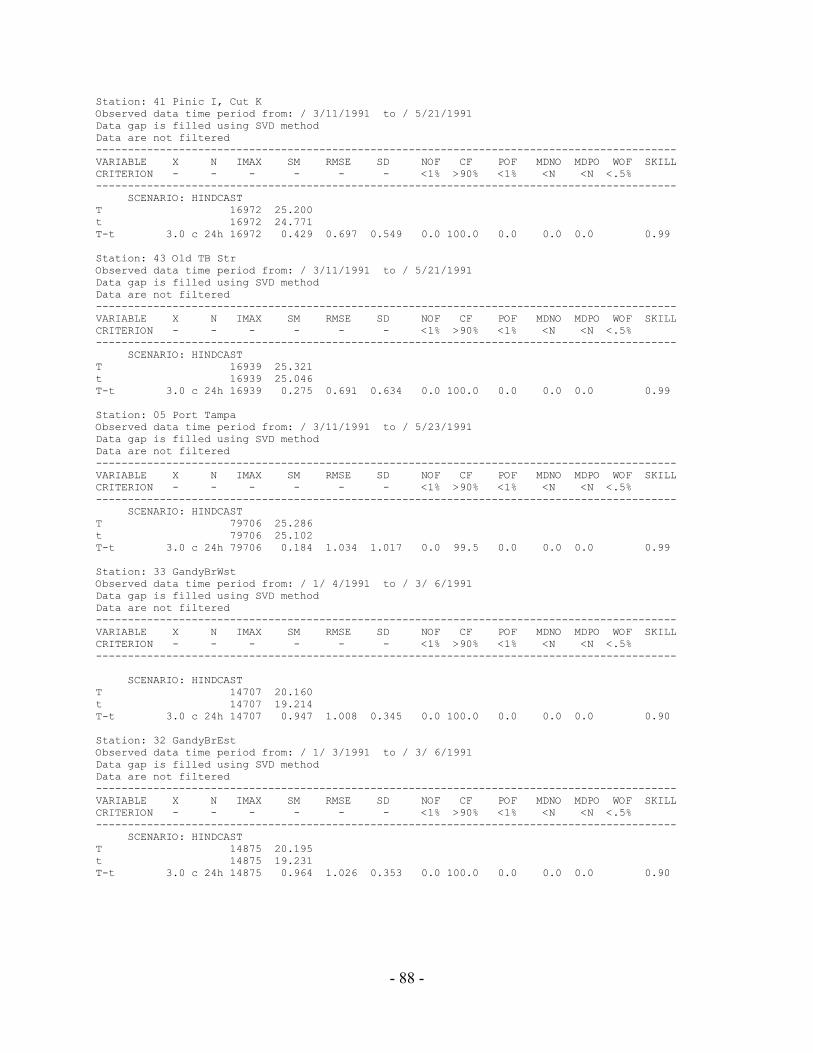
- 88 -
Station: 41 Pinic I, Cut K Observed data time period from: / 3/11/1991 to / 5/21/1991 Data gap is filled using SVD method Data are not filtered ------------------------------------------------------------------------------------------- VARIABLE X N IMAX SM RMSE SD NOF CF POF MDNO MDPO WOF SKILL CRITERION - - - - - - <1% >90% <1% <N <N <.5% ------------------------------------------------------------------------------------------- SCENARIO: HINDCAST T 16972 25.200 t 16972 24.771 T-t 3.0 c 24h 16972 0.429 0.697 0.549 0.0 100.0 0.0 0.0 0.0 0.99 Station: 43 Old TB Str Observed data time period from: / 3/11/1991 to / 5/21/1991 Data gap is filled using SVD method Data are not filtered ------------------------------------------------------------------------------------------- VARIABLE X N IMAX SM RMSE SD NOF CF POF MDNO MDPO WOF SKILL CRITERION - - - - - - <1% >90% <1% <N <N <.5% ------------------------------------------------------------------------------------------- SCENARIO: HINDCAST T 16939 25.321 t 16939 25.046 T-t 3.0 c 24h 16939 0.275 0.691 0.634 0.0 100.0 0.0 0.0 0.0 0.99 Station: 05 Port Tampa Observed data time period from: / 3/11/1991 to / 5/23/1991 Data gap is filled using SVD method Data are not filtered ------------------------------------------------------------------------------------------- VARIABLE X N IMAX SM RMSE SD NOF CF POF MDNO MDPO WOF SKILL CRITERION - - - - - - <1% >90% <1% <N <N <.5% ------------------------------------------------------------------------------------------- SCENARIO: HINDCAST T 79706 25.286 t 79706 25.102 T-t 3.0 c 24h 79706 0.184 1.034 1.017 0.0 99.5 0.0 0.0 0.0 0.99 Station: 33 GandyBrWst Observed data time period from: / 1/ 4/1991 to / 3/ 6/1991 Data gap is filled using SVD method Data are not filtered ------------------------------------------------------------------------------------------- VARIABLE X N IMAX SM RMSE SD NOF CF POF MDNO MDPO WOF SKILL CRITERION - - - - - - <1% >90% <1% <N <N <.5% ------------------------------------------------------------------------------------------- SCENARIO: HINDCAST T 14707 20.160 t 14707 19.214 T-t 3.0 c 24h 14707 0.947 1.008 0.345 0.0 100.0 0.0 0.0 0.0 0.90 Station: 32 GandyBrEst Observed data time period from: / 1/ 3/1991 to / 3/ 6/1991 Data gap is filled using SVD method Data are not filtered ------------------------------------------------------------------------------------------- VARIABLE X N IMAX SM RMSE SD NOF CF POF MDNO MDPO WOF SKILL CRITERION - - - - - - <1% >90% <1% <N <N <.5% ------------------------------------------------------------------------------------------- SCENARIO: HINDCAST T 14875 20.195 t 14875 19.231 T-t 3.0 c 24h 14875 0.964 1.026 0.353 0.0 100.0 0.0 0.0 0.0 0.90
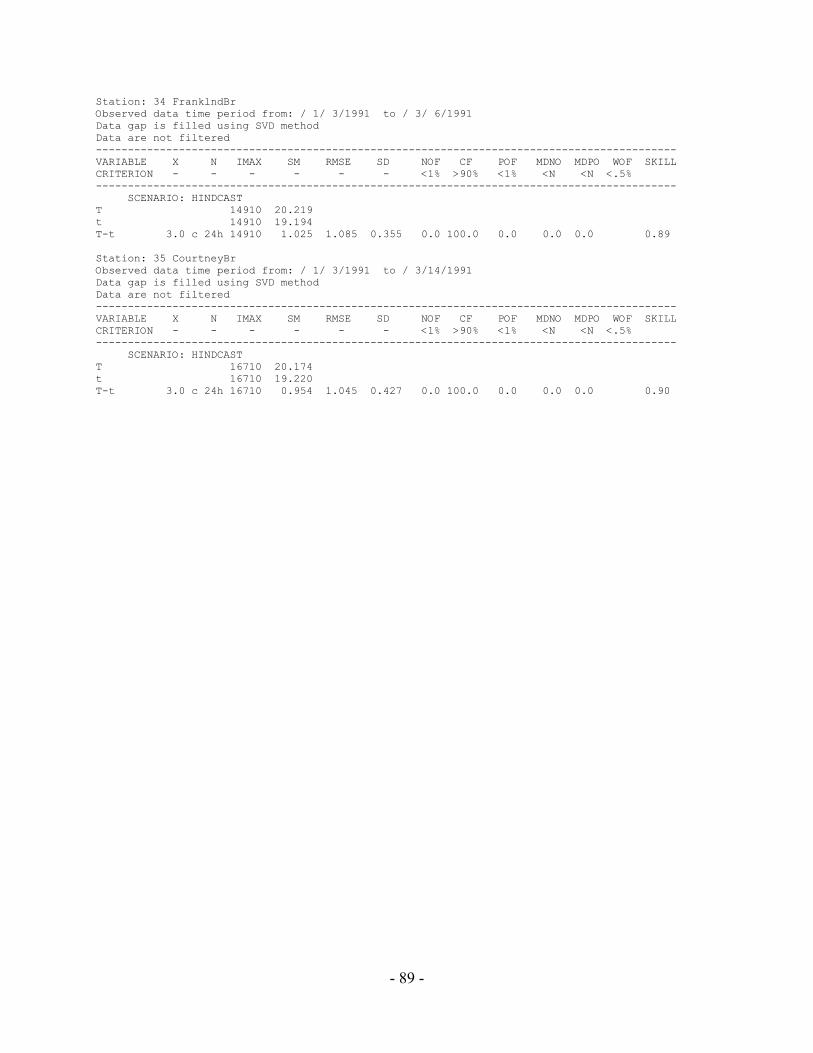
- 89 -
Station: 34 FranklndBr Observed data time period from: / 1/ 3/1991 to / 3/ 6/1991 Data gap is filled using SVD method Data are not filtered ------------------------------------------------------------------------------------------- VARIABLE X N IMAX SM RMSE SD NOF CF POF MDNO MDPO WOF SKILL CRITERION - - - - - - <1% >90% <1% <N <N <.5% ------------------------------------------------------------------------------------------- SCENARIO: HINDCAST T 14910 20.219 t 14910 19.194 T-t 3.0 c 24h 14910 1.025 1.085 0.355 0.0 100.0 0.0 0.0 0.0 0.89 Station: 35 CourtneyBr Observed data time period from: / 1/ 3/1991 to / 3/14/1991 Data gap is filled using SVD method Data are not filtered ------------------------------------------------------------------------------------------- VARIABLE X N IMAX SM RMSE SD NOF CF POF MDNO MDPO WOF SKILL CRITERION - - - - - - <1% >90% <1% <N <N <.5% ------------------------------------------------------------------------------------------- SCENARIO: HINDCAST T 16710 20.174 t 16710 19.220 T-t 3.0 c 24h 16710 0.954 1.045 0.427 0.0 100.0 0.0 0.0 0.0 0.90

- 90 -
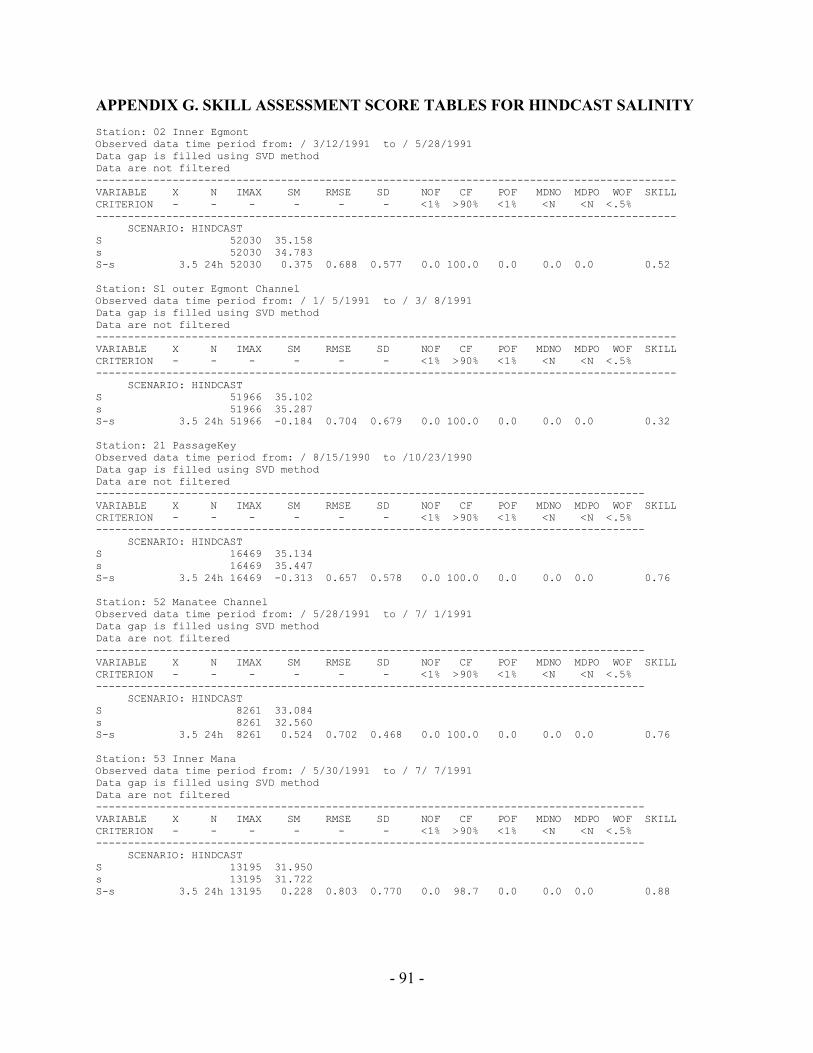
- 91 -
APPENDIX G. SKILL ASSESSMENT SCORE TABLES FOR HINDCAST SALINITY Station: 02 Inner Egmont Observed data time period from: / 3/12/1991 to / 5/28/1991 Data gap is filled using SVD method Data are not filtered ------------------------------------------------------------------------------------------- VARIABLE X N IMAX SM RMSE SD NOF CF POF MDNO MDPO WOF SKILL CRITERION - - - - - - <1% >90% <1% <N <N <.5% ------------------------------------------------------------------------------------------- SCENARIO: HINDCAST S 52030 35.158 s 52030 34.783 S-s 3.5 24h 52030 0.375 0.688 0.577 0.0 100.0 0.0 0.0 0.0 0.52 Station: S1 outer Egmont Channel Observed data time period from: / 1/ 5/1991 to / 3/ 8/1991 Data gap is filled using SVD method Data are not filtered ------------------------------------------------------------------------------------------- VARIABLE X N IMAX SM RMSE SD NOF CF POF MDNO MDPO WOF SKILL CRITERION - - - - - - <1% >90% <1% <N <N <.5% ------------------------------------------------------------------------------------------- SCENARIO: HINDCAST S 51966 35.102 s 51966 35.287 S-s 3.5 24h 51966 -0.184 0.704 0.679 0.0 100.0 0.0 0.0 0.0 0.32 Station: 21 PassageKey Observed data time period from: / 8/15/1990 to /10/23/1990 Data gap is filled using SVD method Data are not filtered -------------------------------------------------------------------------------------- VARIABLE X N IMAX SM RMSE SD NOF CF POF MDNO MDPO WOF SKILL CRITERION - - - - - - <1% >90% <1% <N <N <.5% -------------------------------------------------------------------------------------- SCENARIO: HINDCAST S 16469 35.134 s 16469 35.447 S-s 3.5 24h 16469 -0.313 0.657 0.578 0.0 100.0 0.0 0.0 0.0 0.76 Station: 52 Manatee Channel Observed data time period from: / 5/28/1991 to / 7/ 1/1991 Data gap is filled using SVD method Data are not filtered -------------------------------------------------------------------------------------- VARIABLE X N IMAX SM RMSE SD NOF CF POF MDNO MDPO WOF SKILL CRITERION - - - - - - <1% >90% <1% <N <N <.5% -------------------------------------------------------------------------------------- SCENARIO: HINDCAST S 8261 33.084 s 8261 32.560 S-s 3.5 24h 8261 0.524 0.702 0.468 0.0 100.0 0.0 0.0 0.0 0.76 Station: 53 Inner Mana Observed data time period from: / 5/30/1991 to / 7/ 7/1991 Data gap is filled using SVD method Data are not filtered -------------------------------------------------------------------------------------- VARIABLE X N IMAX SM RMSE SD NOF CF POF MDNO MDPO WOF SKILL CRITERION - - - - - - <1% >90% <1% <N <N <.5% -------------------------------------------------------------------------------------- SCENARIO: HINDCAST S 13195 31.950 s 13195 31.722 S-s 3.5 24h 13195 0.228 0.803 0.770 0.0 98.7 0.0 0.0 0.0 0.88
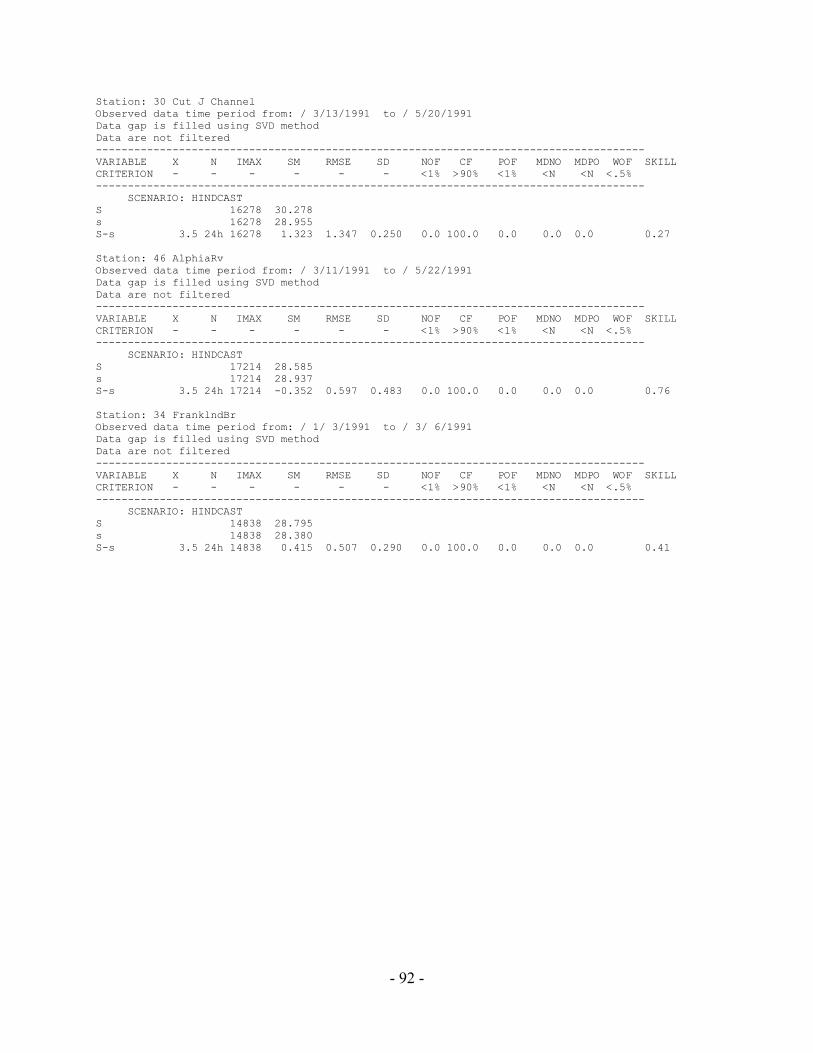
- 92 -
Station: 30 Cut J Channel Observed data time period from: / 3/13/1991 to / 5/20/1991 Data gap is filled using SVD method Data are not filtered -------------------------------------------------------------------------------------- VARIABLE X N IMAX SM RMSE SD NOF CF POF MDNO MDPO WOF SKILL CRITERION - - - - - - <1% >90% <1% <N <N <.5% -------------------------------------------------------------------------------------- SCENARIO: HINDCAST S 16278 30.278 s 16278 28.955 S-s 3.5 24h 16278 1.323 1.347 0.250 0.0 100.0 0.0 0.0 0.0 0.27 Station: 46 AlphiaRv Observed data time period from: / 3/11/1991 to / 5/22/1991 Data gap is filled using SVD method Data are not filtered -------------------------------------------------------------------------------------- VARIABLE X N IMAX SM RMSE SD NOF CF POF MDNO MDPO WOF SKILL CRITERION - - - - - - <1% >90% <1% <N <N <.5% -------------------------------------------------------------------------------------- SCENARIO: HINDCAST S 17214 28.585 s 17214 28.937 S-s 3.5 24h 17214 -0.352 0.597 0.483 0.0 100.0 0.0 0.0 0.0 0.76 Station: 34 FranklndBr Observed data time period from: / 1/ 3/1991 to / 3/ 6/1991 Data gap is filled using SVD method Data are not filtered -------------------------------------------------------------------------------------- VARIABLE X N IMAX SM RMSE SD NOF CF POF MDNO MDPO WOF SKILL CRITERION - - - - - - <1% >90% <1% <N <N <.5% -------------------------------------------------------------------------------------- SCENARIO: HINDCAST S 14838 28.795 s 14838 28.380 S-s 3.5 24h 14838 0.415 0.507 0.290 0.0 100.0 0.0 0.0 0.0 0.41
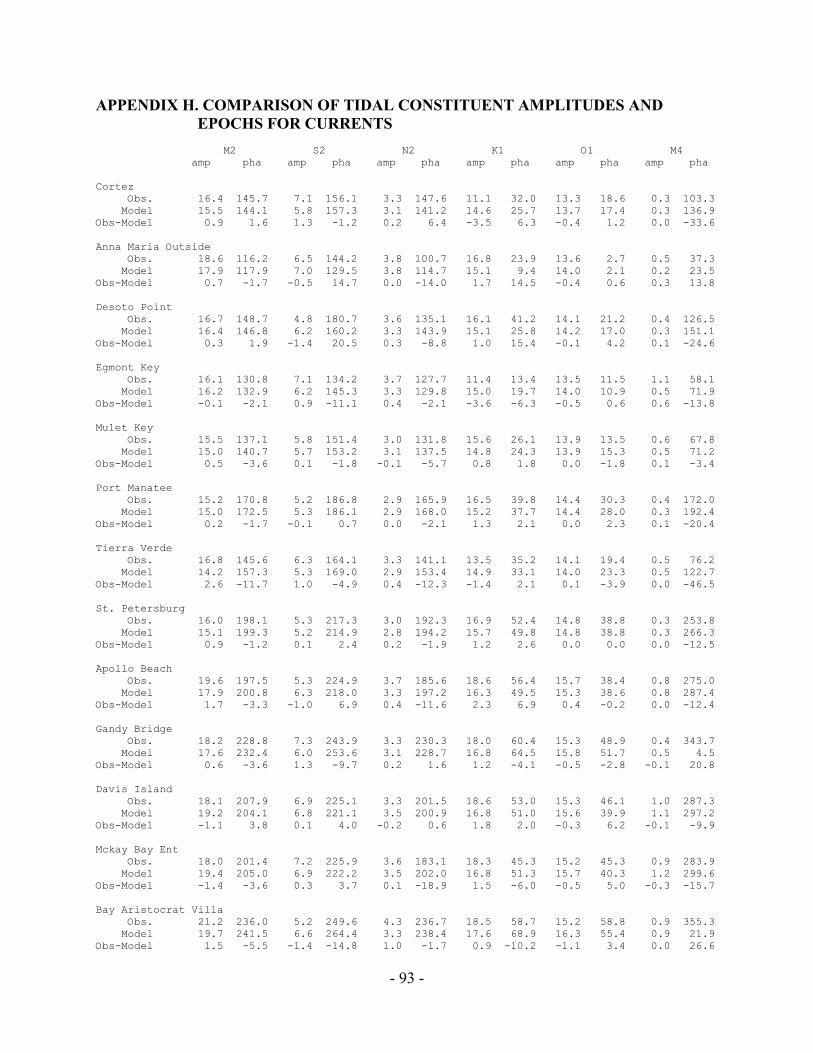
- 93 -
APPENDIX H. COMPARISON OF TIDAL CONSTITUENT AMPLITUDES AND EPOCHS FOR CURRENTS
M2 S2 N2 K1 O1 M4
amp pha amp pha amp pha amp pha amp pha amp pha Cortez Obs. 16.4 145.7 7.1 156.1 3.3 147.6 11.1 32.0 13.3 18.6 0.3 103.3 Model 15.5 144.1 5.8 157.3 3.1 141.2 14.6 25.7 13.7 17.4 0.3 136.9 Obs-Model 0.9 1.6 1.3 -1.2 0.2 6.4 -3.5 6.3 -0.4 1.2 0.0 -33.6 Anna Maria Outside Obs. 18.6 116.2 6.5 144.2 3.8 100.7 16.8 23.9 13.6 2.7 0.5 37.3 Model 17.9 117.9 7.0 129.5 3.8 114.7 15.1 9.4 14.0 2.1 0.2 23.5 Obs-Model 0.7 -1.7 -0.5 14.7 0.0 -14.0 1.7 14.5 -0.4 0.6 0.3 13.8 Desoto Point Obs. 16.7 148.7 4.8 180.7 3.6 135.1 16.1 41.2 14.1 21.2 0.4 126.5 Model 16.4 146.8 6.2 160.2 3.3 143.9 15.1 25.8 14.2 17.0 0.3 151.1 Obs-Model 0.3 1.9 -1.4 20.5 0.3 -8.8 1.0 15.4 -0.1 4.2 0.1 -24.6 Egmont Key Obs. 16.1 130.8 7.1 134.2 3.7 127.7 11.4 13.4 13.5 11.5 1.1 58.1 Model 16.2 132.9 6.2 145.3 3.3 129.8 15.0 19.7 14.0 10.9 0.5 71.9 Obs-Model -0.1 -2.1 0.9 -11.1 0.4 -2.1 -3.6 -6.3 -0.5 0.6 0.6 -13.8 Mulet Key Obs. 15.5 137.1 5.8 151.4 3.0 131.8 15.6 26.1 13.9 13.5 0.6 67.8 Model 15.0 140.7 5.7 153.2 3.1 137.5 14.8 24.3 13.9 15.3 0.5 71.2 Obs-Model 0.5 -3.6 0.1 -1.8 -0.1 -5.7 0.8 1.8 0.0 -1.8 0.1 -3.4 Port Manatee Obs. 15.2 170.8 5.2 186.8 2.9 165.9 16.5 39.8 14.4 30.3 0.4 172.0 Model 15.0 172.5 5.3 186.1 2.9 168.0 15.2 37.7 14.4 28.0 0.3 192.4 Obs-Model 0.2 -1.7 -0.1 0.7 0.0 -2.1 1.3 2.1 0.0 2.3 0.1 -20.4 Tierra Verde Obs. 16.8 145.6 6.3 164.1 3.3 141.1 13.5 35.2 14.1 19.4 0.5 76.2 Model 14.2 157.3 5.3 169.0 2.9 153.4 14.9 33.1 14.0 23.3 0.5 122.7 Obs-Model 2.6 -11.7 1.0 -4.9 0.4 -12.3 -1.4 2.1 0.1 -3.9 0.0 -46.5 St. Petersburg Obs. 16.0 198.1 5.3 217.3 3.0 192.3 16.9 52.4 14.8 38.8 0.3 253.8 Model 15.1 199.3 5.2 214.9 2.8 194.2 15.7 49.8 14.8 38.8 0.3 266.3 Obs-Model 0.9 -1.2 0.1 2.4 0.2 -1.9 1.2 2.6 0.0 0.0 0.0 -12.5 Apollo Beach Obs. 19.6 197.5 5.3 224.9 3.7 185.6 18.6 56.4 15.7 38.4 0.8 275.0 Model 17.9 200.8 6.3 218.0 3.3 197.2 16.3 49.5 15.3 38.6 0.8 287.4 Obs-Model 1.7 -3.3 -1.0 6.9 0.4 -11.6 2.3 6.9 0.4 -0.2 0.0 -12.4 Gandy Bridge Obs. 18.2 228.8 7.3 243.9 3.3 230.3 18.0 60.4 15.3 48.9 0.4 343.7 Model 17.6 232.4 6.0 253.6 3.1 228.7 16.8 64.5 15.8 51.7 0.5 4.5 Obs-Model 0.6 -3.6 1.3 -9.7 0.2 1.6 1.2 -4.1 -0.5 -2.8 -0.1 20.8 Davis Island Obs. 18.1 207.9 6.9 225.1 3.3 201.5 18.6 53.0 15.3 46.1 1.0 287.3 Model 19.2 204.1 6.8 221.1 3.5 200.9 16.8 51.0 15.6 39.9 1.1 297.2 Obs-Model -1.1 3.8 0.1 4.0 -0.2 0.6 1.8 2.0 -0.3 6.2 -0.1 -9.9 Mckay Bay Ent Obs. 18.0 201.4 7.2 225.9 3.6 183.1 18.3 45.3 15.2 45.3 0.9 283.9 Model 19.4 205.0 6.9 222.2 3.5 202.0 16.8 51.3 15.7 40.3 1.2 299.6 Obs-Model -1.4 -3.6 0.3 3.7 0.1 -18.9 1.5 -6.0 -0.5 5.0 -0.3 -15.7 Bay Aristocrat Villa Obs. 21.2 236.0 5.2 249.6 4.3 236.7 18.5 58.7 15.2 58.8 0.9 355.3 Model 19.7 241.5 6.6 264.4 3.3 238.4 17.6 68.9 16.3 55.4 0.9 21.9 Obs-Model 1.5 -5.5 -1.4 -14.8 1.0 -1.7 0.9 -10.2 -1.1 3.4 0.0 26.6
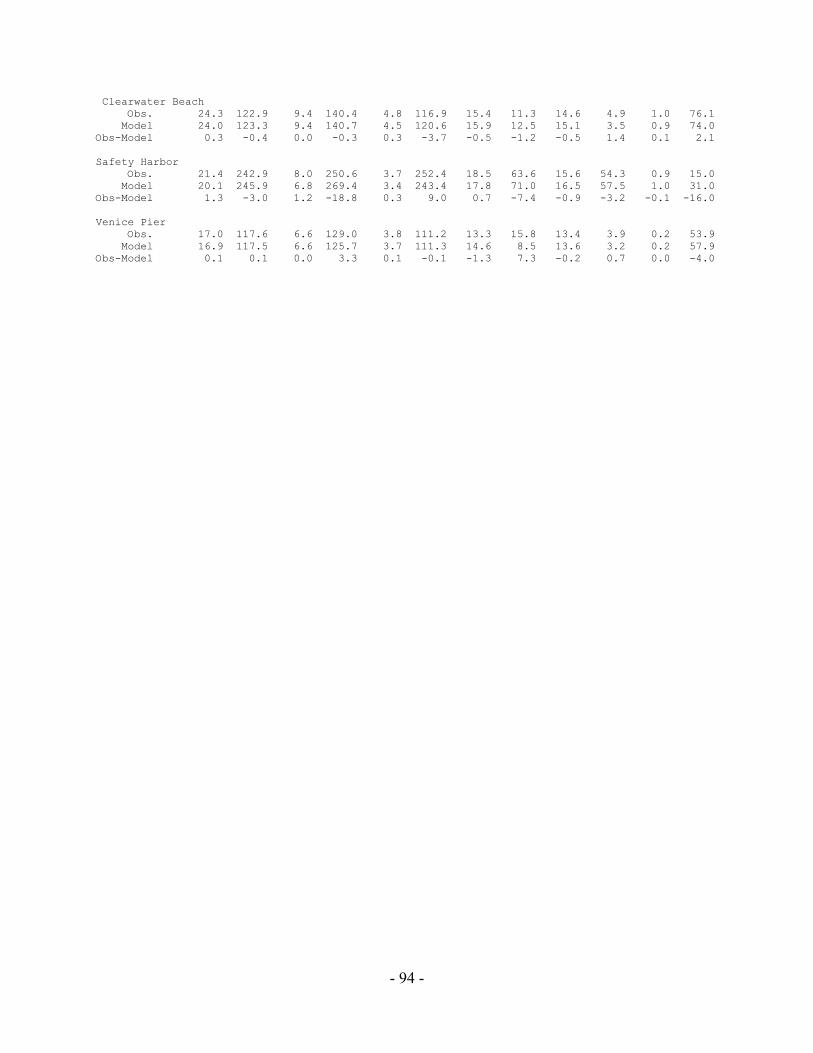
- 94 -
Clearwater Beach Obs. 24.3 122.9 9.4 140.4 4.8 116.9 15.4 11.3 14.6 4.9 1.0 76.1 Model 24.0 123.3 9.4 140.7 4.5 120.6 15.9 12.5 15.1 3.5 0.9 74.0 Obs-Model 0.3 -0.4 0.0 -0.3 0.3 -3.7 -0.5 -1.2 -0.5 1.4 0.1 2.1 Safety Harbor Obs. 21.4 242.9 8.0 250.6 3.7 252.4 18.5 63.6 15.6 54.3 0.9 15.0 Model 20.1 245.9 6.8 269.4 3.4 243.4 17.8 71.0 16.5 57.5 1.0 31.0 Obs-Model 1.3 -3.0 1.2 -18.8 0.3 9.0 0.7 -7.4 -0.9 -3.2 -0.1 -16.0 Venice Pier Obs. 17.0 117.6 6.6 129.0 3.8 111.2 13.3 15.8 13.4 3.9 0.2 53.9 Model 16.9 117.5 6.6 125.7 3.7 111.3 14.6 8.5 13.6 3.2 0.2 57.9 Obs-Model 0.1 0.1 0.0 3.3 0.1 -0.1 -1.3 7.3 -0.2 0.7 0.0 -4.0
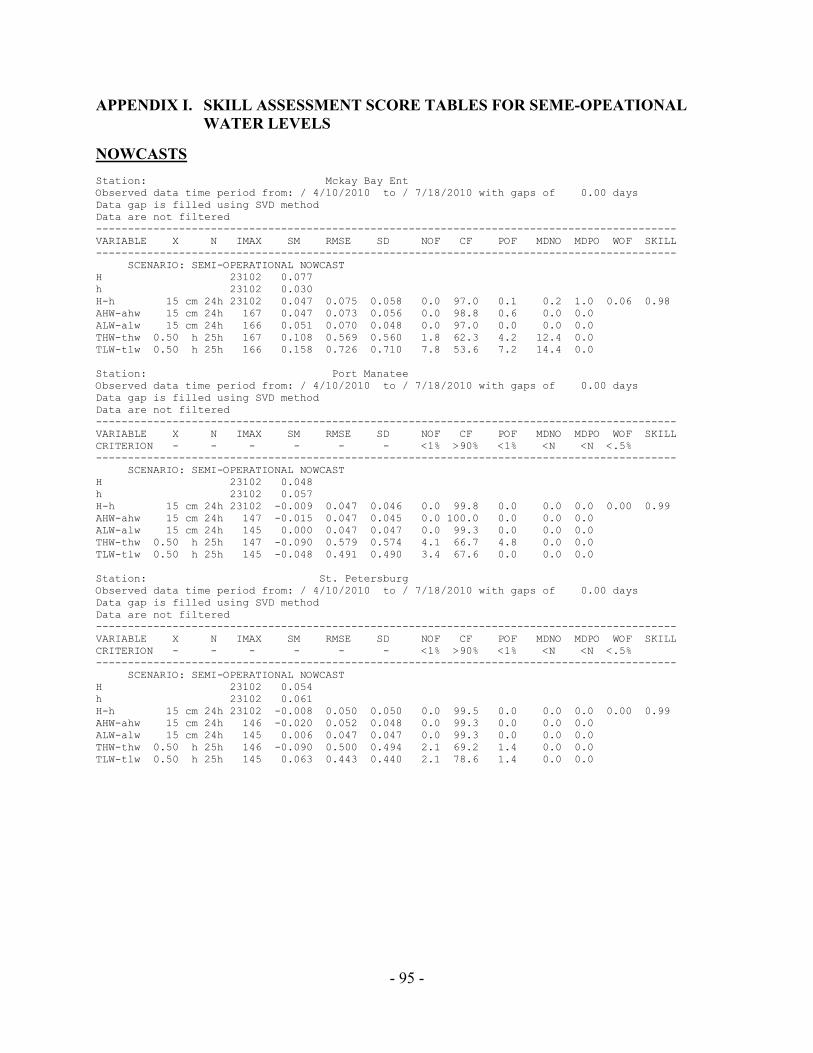
- 95 -
APPENDIX I. SKILL ASSESSMENT SCORE TABLES FOR SEME-OPEATIONAL WATER LEVELS
NOWCASTS Station: Mckay Bay Ent Observed data time period from: / 4/10/2010 to / 7/18/2010 with gaps of 0.00 days Data gap is filled using SVD method Data are not filtered ------------------------------------------------------------------------------------------- VARIABLE X N IMAX SM RMSE SD NOF CF POF MDNO MDPO WOF SKILL ------------------------------------------------------------------------------------------- SCENARIO: SEMI-OPERATIONAL NOWCAST H 23102 0.077 h 23102 0.030 H-h 15 cm 24h 23102 0.047 0.075 0.058 0.0 97.0 0.1 0.2 1.0 0.06 0.98 AHW-ahw 15 cm 24h 167 0.047 0.073 0.056 0.0 98.8 0.6 0.0 0.0 ALW-alw 15 cm 24h 166 0.051 0.070 0.048 0.0 97.0 0.0 0.0 0.0 THW-thw 0.50 h 25h 167 0.108 0.569 0.560 1.8 62.3 4.2 12.4 0.0 TLW-tlw 0.50 h 25h 166 0.158 0.726 0.710 7.8 53.6 7.2 14.4 0.0 Station: Port Manatee Observed data time period from: / 4/10/2010 to / 7/18/2010 with gaps of 0.00 days Data gap is filled using SVD method Data are not filtered ------------------------------------------------------------------------------------------- VARIABLE X N IMAX SM RMSE SD NOF CF POF MDNO MDPO WOF SKILL CRITERION - - - - - - <1% >90% <1% <N <N <.5% ------------------------------------------------------------------------------------------- SCENARIO: SEMI-OPERATIONAL NOWCAST H 23102 0.048 h 23102 0.057 H-h 15 cm 24h 23102 -0.009 0.047 0.046 0.0 99.8 0.0 0.0 0.0 0.00 0.99 AHW-ahw 15 cm 24h 147 -0.015 0.047 0.045 0.0 100.0 0.0 0.0 0.0 ALW-alw 15 cm 24h 145 0.000 0.047 0.047 0.0 99.3 0.0 0.0 0.0 THW-thw 0.50 h 25h 147 -0.090 0.579 0.574 4.1 66.7 4.8 0.0 0.0 TLW-tlw 0.50 h 25h 145 -0.048 0.491 0.490 3.4 67.6 0.0 0.0 0.0 Station: St. Petersburg Observed data time period from: / 4/10/2010 to / 7/18/2010 with gaps of 0.00 days Data gap is filled using SVD method Data are not filtered ------------------------------------------------------------------------------------------- VARIABLE X N IMAX SM RMSE SD NOF CF POF MDNO MDPO WOF SKILL CRITERION - - - - - - <1% >90% <1% <N <N <.5% ------------------------------------------------------------------------------------------- SCENARIO: SEMI-OPERATIONAL NOWCAST H 23102 0.054 h 23102 0.061 H-h 15 cm 24h 23102 -0.008 0.050 0.050 0.0 99.5 0.0 0.0 0.0 0.00 0.99 AHW-ahw 15 cm 24h 146 -0.020 0.052 0.048 0.0 99.3 0.0 0.0 0.0 ALW-alw 15 cm 24h 145 0.006 0.047 0.047 0.0 99.3 0.0 0.0 0.0 THW-thw 0.50 h 25h 146 -0.090 0.500 0.494 2.1 69.2 1.4 0.0 0.0 TLW-tlw 0.50 h 25h 145 0.063 0.443 0.440 2.1 78.6 1.4 0.0 0.0
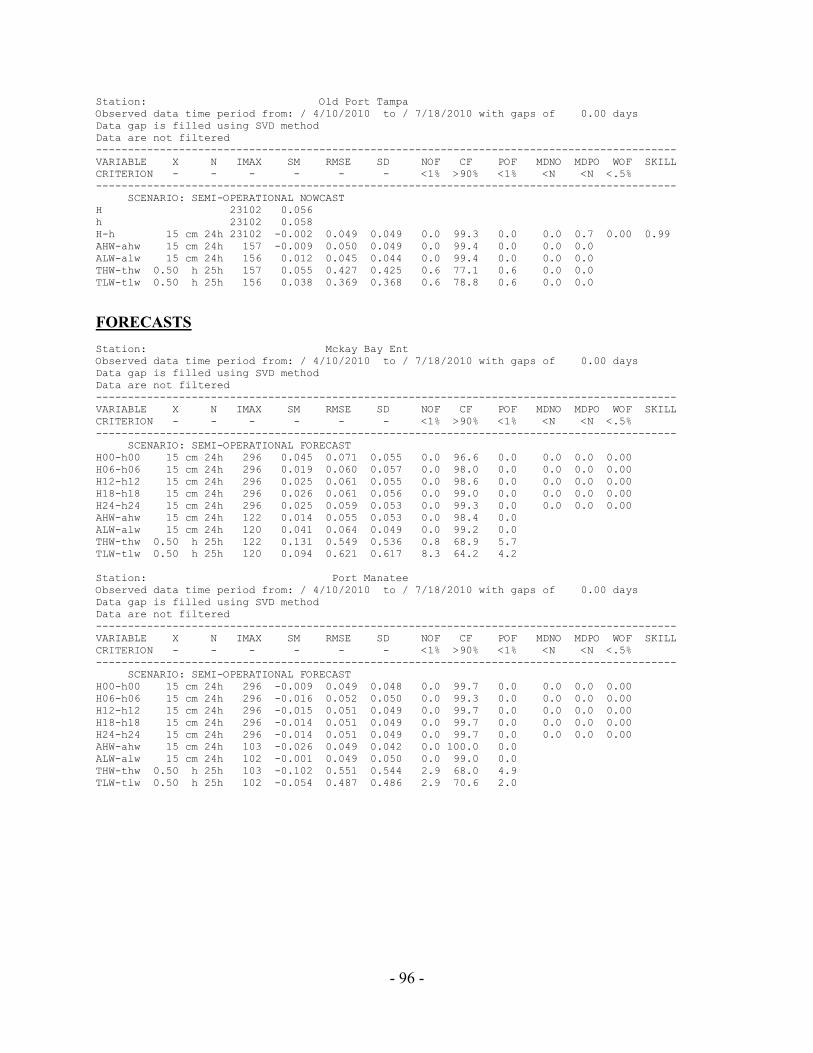
- 96 -
Station: Old Port Tampa Observed data time period from: / 4/10/2010 to / 7/18/2010 with gaps of 0.00 days Data gap is filled using SVD method Data are not filtered ------------------------------------------------------------------------------------------- VARIABLE X N IMAX SM RMSE SD NOF CF POF MDNO MDPO WOF SKILL CRITERION - - - - - - <1% >90% <1% <N <N <.5% ------------------------------------------------------------------------------------------- SCENARIO: SEMI-OPERATIONAL NOWCAST H 23102 0.056 h 23102 0.058 H-h 15 cm 24h 23102 -0.002 0.049 0.049 0.0 99.3 0.0 0.0 0.7 0.00 0.99 AHW-ahw 15 cm 24h 157 -0.009 0.050 0.049 0.0 99.4 0.0 0.0 0.0 ALW-alw 15 cm 24h 156 0.012 0.045 0.044 0.0 99.4 0.0 0.0 0.0 THW-thw 0.50 h 25h 157 0.055 0.427 0.425 0.6 77.1 0.6 0.0 0.0 TLW-tlw 0.50 h 25h 156 0.038 0.369 0.368 0.6 78.8 0.6 0.0 0.0
FORECASTS Station: Mckay Bay Ent Observed data time period from: / 4/10/2010 to / 7/18/2010 with gaps of 0.00 days Data gap is filled using SVD method Data are not filtered ------------------------------------------------------------------------------------------- VARIABLE X N IMAX SM RMSE SD NOF CF POF MDNO MDPO WOF SKILL CRITERION - - - - - - <1% >90% <1% <N <N <.5% ------------------------------------------------------------------------------------------- SCENARIO: SEMI-OPERATIONAL FORECAST H00-h00 15 cm 24h 296 0.045 0.071 0.055 0.0 96.6 0.0 0.0 0.0 0.00 H06-h06 15 cm 24h 296 0.019 0.060 0.057 0.0 98.0 0.0 0.0 0.0 0.00 H12-h12 15 cm 24h 296 0.025 0.061 0.055 0.0 98.6 0.0 0.0 0.0 0.00 H18-h18 15 cm 24h 296 0.026 0.061 0.056 0.0 99.0 0.0 0.0 0.0 0.00 H24-h24 15 cm 24h 296 0.025 0.059 0.053 0.0 99.3 0.0 0.0 0.0 0.00 AHW-ahw 15 cm 24h 122 0.014 0.055 0.053 0.0 98.4 0.0 ALW-alw 15 cm 24h 120 0.041 0.064 0.049 0.0 99.2 0.0 THW-thw 0.50 h 25h 122 0.131 0.549 0.536 0.8 68.9 5.7 TLW-tlw 0.50 h 25h 120 0.094 0.621 0.617 8.3 64.2 4.2 Station: Port Manatee Observed data time period from: / 4/10/2010 to / 7/18/2010 with gaps of 0.00 days Data gap is filled using SVD method Data are not filtered ------------------------------------------------------------------------------------------- VARIABLE X N IMAX SM RMSE SD NOF CF POF MDNO MDPO WOF SKILL CRITERION - - - - - - <1% >90% <1% <N <N <.5% ------------------------------------------------------------------------------------------- SCENARIO: SEMI-OPERATIONAL FORECAST H00-h00 15 cm 24h 296 -0.009 0.049 0.048 0.0 99.7 0.0 0.0 0.0 0.00 H06-h06 15 cm 24h 296 -0.016 0.052 0.050 0.0 99.3 0.0 0.0 0.0 0.00 H12-h12 15 cm 24h 296 -0.015 0.051 0.049 0.0 99.7 0.0 0.0 0.0 0.00 H18-h18 15 cm 24h 296 -0.014 0.051 0.049 0.0 99.7 0.0 0.0 0.0 0.00 H24-h24 15 cm 24h 296 -0.014 0.051 0.049 0.0 99.7 0.0 0.0 0.0 0.00 AHW-ahw 15 cm 24h 103 -0.026 0.049 0.042 0.0 100.0 0.0 ALW-alw 15 cm 24h 102 -0.001 0.049 0.050 0.0 99.0 0.0 THW-thw 0.50 h 25h 103 -0.102 0.551 0.544 2.9 68.0 4.9 TLW-tlw 0.50 h 25h 102 -0.054 0.487 0.486 2.9 70.6 2.0
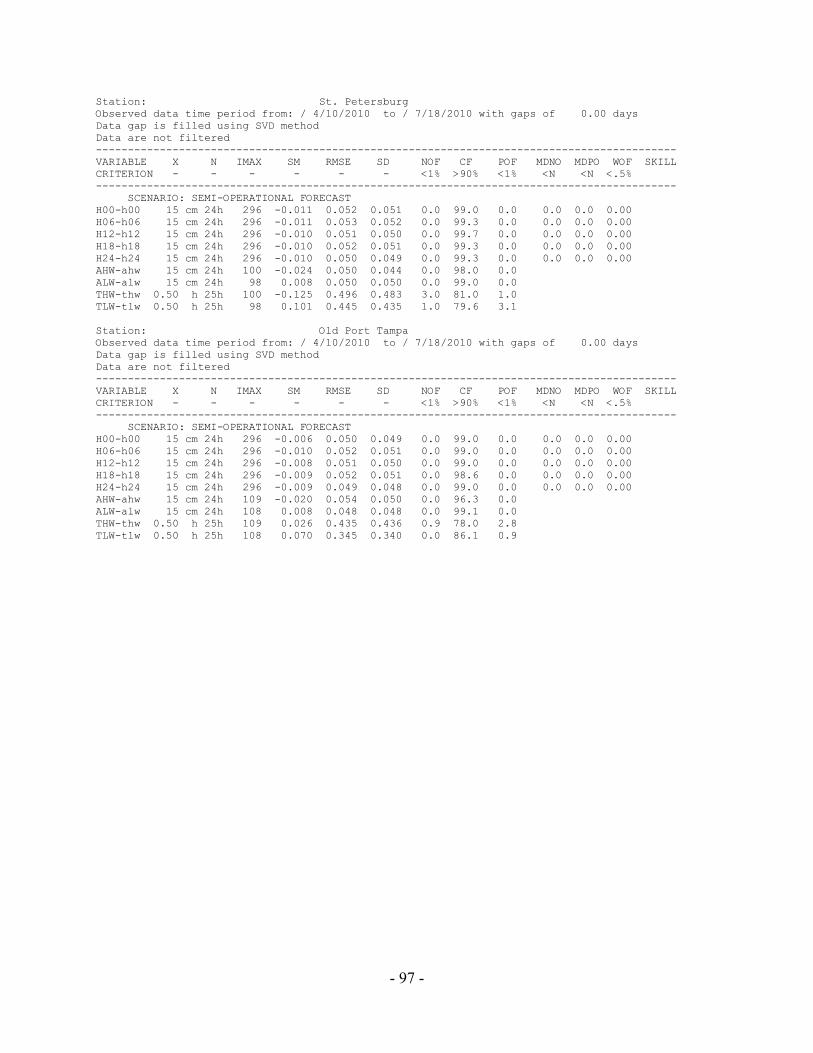
- 97 -
Station: St. Petersburg Observed data time period from: / 4/10/2010 to / 7/18/2010 with gaps of 0.00 days Data gap is filled using SVD method Data are not filtered ------------------------------------------------------------------------------------------- VARIABLE X N IMAX SM RMSE SD NOF CF POF MDNO MDPO WOF SKILL CRITERION - - - - - - <1% >90% <1% <N <N <.5% ------------------------------------------------------------------------------------------- SCENARIO: SEMI-OPERATIONAL FORECAST H00-h00 15 cm 24h 296 -0.011 0.052 0.051 0.0 99.0 0.0 0.0 0.0 0.00 H06-h06 15 cm 24h 296 -0.011 0.053 0.052 0.0 99.3 0.0 0.0 0.0 0.00 H12-h12 15 cm 24h 296 -0.010 0.051 0.050 0.0 99.7 0.0 0.0 0.0 0.00 H18-h18 15 cm 24h 296 -0.010 0.052 0.051 0.0 99.3 0.0 0.0 0.0 0.00 H24-h24 15 cm 24h 296 -0.010 0.050 0.049 0.0 99.3 0.0 0.0 0.0 0.00 AHW-ahw 15 cm 24h 100 -0.024 0.050 0.044 0.0 98.0 0.0 ALW-alw 15 cm 24h 98 0.008 0.050 0.050 0.0 99.0 0.0 THW-thw 0.50 h 25h 100 -0.125 0.496 0.483 3.0 81.0 1.0 TLW-tlw 0.50 h 25h 98 0.101 0.445 0.435 1.0 79.6 3.1 Station: Old Port Tampa Observed data time period from: / 4/10/2010 to / 7/18/2010 with gaps of 0.00 days Data gap is filled using SVD method Data are not filtered ------------------------------------------------------------------------------------------- VARIABLE X N IMAX SM RMSE SD NOF CF POF MDNO MDPO WOF SKILL CRITERION - - - - - - <1% >90% <1% <N <N <.5% ------------------------------------------------------------------------------------------- SCENARIO: SEMI-OPERATIONAL FORECAST H00-h00 15 cm 24h 296 -0.006 0.050 0.049 0.0 99.0 0.0 0.0 0.0 0.00 H06-h06 15 cm 24h 296 -0.010 0.052 0.051 0.0 99.0 0.0 0.0 0.0 0.00 H12-h12 15 cm 24h 296 -0.008 0.051 0.050 0.0 99.0 0.0 0.0 0.0 0.00 H18-h18 15 cm 24h 296 -0.009 0.052 0.051 0.0 98.6 0.0 0.0 0.0 0.00 H24-h24 15 cm 24h 296 -0.009 0.049 0.048 0.0 99.0 0.0 0.0 0.0 0.00 AHW-ahw 15 cm 24h 109 -0.020 0.054 0.050 0.0 96.3 0.0 ALW-alw 15 cm 24h 108 0.008 0.048 0.048 0.0 99.1 0.0 THW-thw 0.50 h 25h 109 0.026 0.435 0.436 0.9 78.0 2.8 TLW-tlw 0.50 h 25h 108 0.070 0.345 0.340 0.0 86.1 0.9

- 98 -
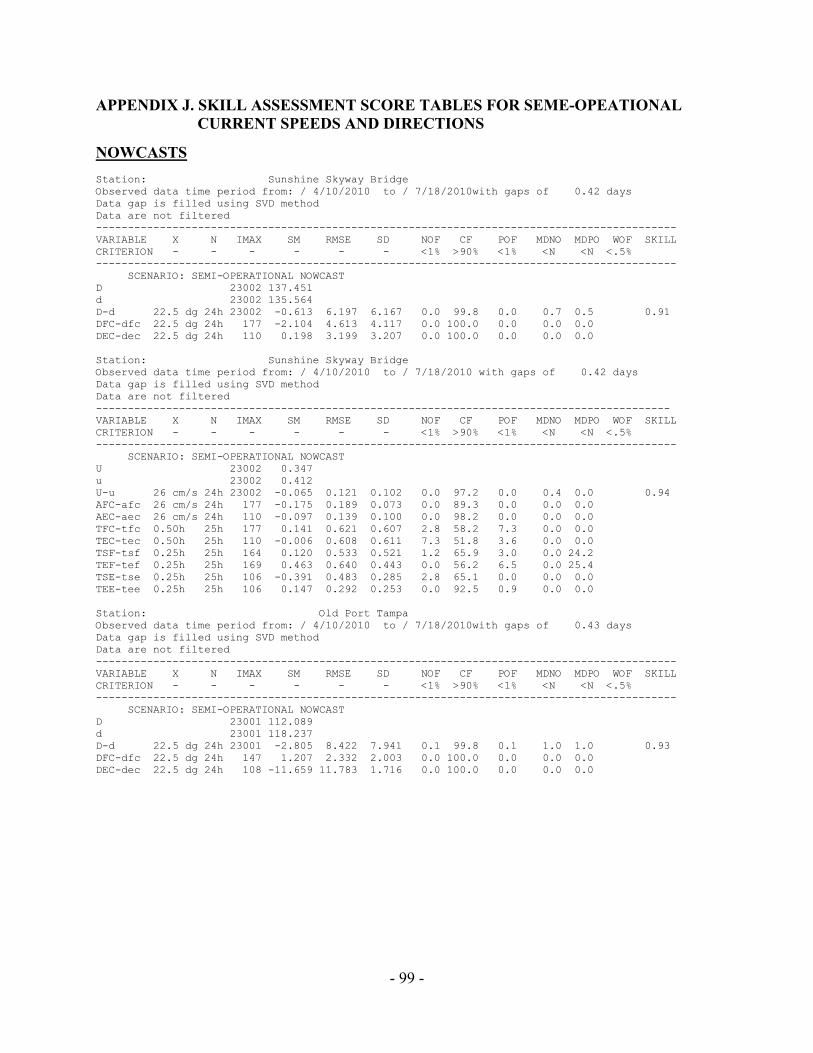
- 99 -
APPENDIX J. SKILL ASSESSMENT SCORE TABLES FOR SEME-OPEATIONAL CURRENT SPEEDS AND DIRECTIONS
NOWCASTS Station: Sunshine Skyway Bridge Observed data time period from: / 4/10/2010 to / 7/18/2010with gaps of 0.42 days Data gap is filled using SVD method Data are not filtered ------------------------------------------------------------------------------------------- VARIABLE X N IMAX SM RMSE SD NOF CF POF MDNO MDPO WOF SKILL CRITERION - - - - - - <1% >90% <1% <N <N <.5% ------------------------------------------------------------------------------------------- SCENARIO: SEMI-OPERATIONAL NOWCAST D 23002 137.451 d 23002 135.564 D-d 22.5 dg 24h 23002 -0.613 6.197 6.167 0.0 99.8 0.0 0.7 0.5 0.91 DFC-dfc 22.5 dg 24h 177 -2.104 4.613 4.117 0.0 100.0 0.0 0.0 0.0 DEC-dec 22.5 dg 24h 110 0.198 3.199 3.207 0.0 100.0 0.0 0.0 0.0 Station: Sunshine Skyway Bridge Observed data time period from: / 4/10/2010 to / 7/18/2010 with gaps of 0.42 days Data gap is filled using SVD method Data are not filtered ------------------------------------------------------------------------------------------ VARIABLE X N IMAX SM RMSE SD NOF CF POF MDNO MDPO WOF SKILL CRITERION - - - - - - <1% >90% <1% <N <N <.5% ------------------------------------------------------------------------------------------- SCENARIO: SEMI-OPERATIONAL NOWCAST U 23002 0.347 u 23002 0.412 U-u 26 cm/s 24h 23002 -0.065 0.121 0.102 0.0 97.2 0.0 0.4 0.0 0.94 AFC-afc 26 cm/s 24h 177 -0.175 0.189 0.073 0.0 89.3 0.0 0.0 0.0 AEC-aec 26 cm/s 24h 110 -0.097 0.139 0.100 0.0 98.2 0.0 0.0 0.0 TFC-tfc 0.50h 25h 177 0.141 0.621 0.607 2.8 58.2 7.3 0.0 0.0 TEC-tec 0.50h 25h 110 -0.006 0.608 0.611 7.3 51.8 3.6 0.0 0.0 TSF-tsf 0.25h 25h 164 0.120 0.533 0.521 1.2 65.9 3.0 0.0 24.2 TEF-tef 0.25h 25h 169 0.463 0.640 0.443 0.0 56.2 6.5 0.0 25.4 TSE-tse 0.25h 25h 106 -0.391 0.483 0.285 2.8 65.1 0.0 0.0 0.0 TEE-tee 0.25h 25h 106 0.147 0.292 0.253 0.0 92.5 0.9 0.0 0.0 Station: Old Port Tampa Observed data time period from: / 4/10/2010 to / 7/18/2010with gaps of 0.43 days Data gap is filled using SVD method Data are not filtered ------------------------------------------------------------------------------------------- VARIABLE X N IMAX SM RMSE SD NOF CF POF MDNO MDPO WOF SKILL CRITERION - - - - - - <1% >90% <1% <N <N <.5% ------------------------------------------------------------------------------------------- SCENARIO: SEMI-OPERATIONAL NOWCAST D 23001 112.089 d 23001 118.237 D-d 22.5 dg 24h 23001 -2.805 8.422 7.941 0.1 99.8 0.1 1.0 1.0 0.93 DFC-dfc 22.5 dg 24h 147 1.207 2.332 2.003 0.0 100.0 0.0 0.0 0.0 DEC-dec 22.5 dg 24h 108 -11.659 11.783 1.716 0.0 100.0 0.0 0.0 0.0
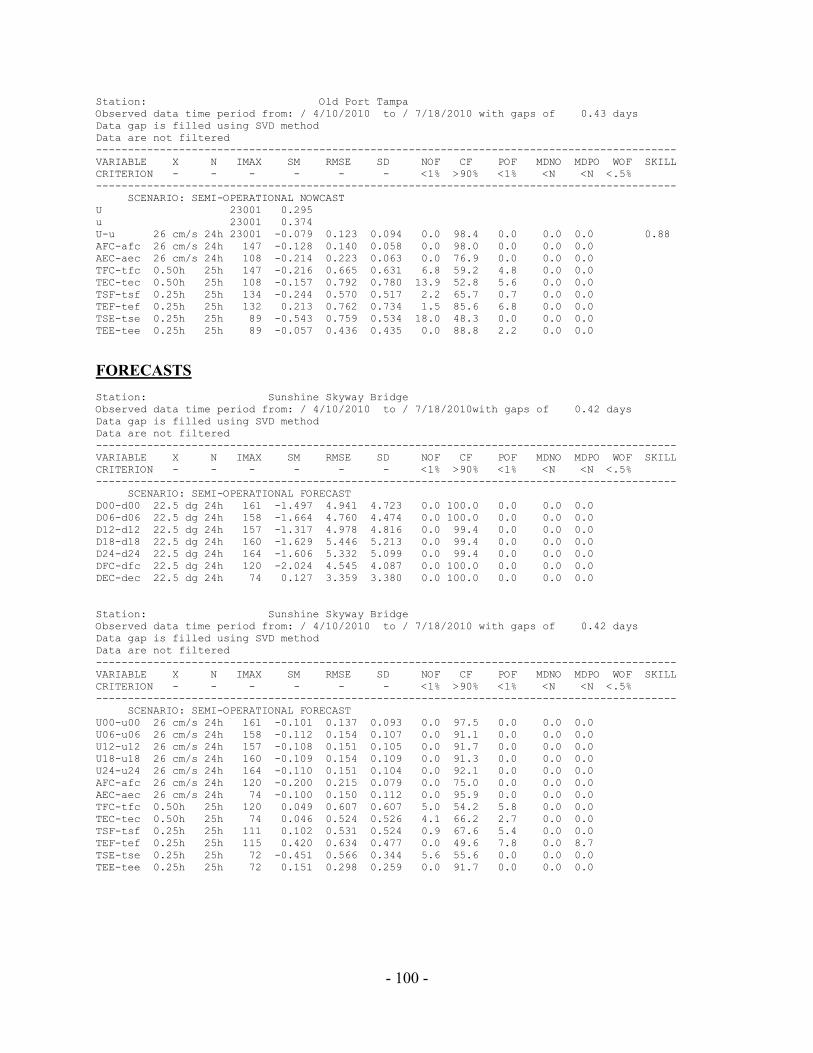
- 100 -
Station: Old Port Tampa Observed data time period from: / 4/10/2010 to / 7/18/2010 with gaps of 0.43 days Data gap is filled using SVD method Data are not filtered ------------------------------------------------------------------------------------------- VARIABLE X N IMAX SM RMSE SD NOF CF POF MDNO MDPO WOF SKILL CRITERION - - - - - - <1% >90% <1% <N <N <.5% ------------------------------------------------------------------------------------------- SCENARIO: SEMI-OPERATIONAL NOWCAST U 23001 0.295 u 23001 0.374 U-u 26 cm/s 24h 23001 -0.079 0.123 0.094 0.0 98.4 0.0 0.0 0.0 0.88 AFC-afc 26 cm/s 24h 147 -0.128 0.140 0.058 0.0 98.0 0.0 0.0 0.0 AEC-aec 26 cm/s 24h 108 -0.214 0.223 0.063 0.0 76.9 0.0 0.0 0.0 TFC-tfc 0.50h 25h 147 -0.216 0.665 0.631 6.8 59.2 4.8 0.0 0.0 TEC-tec 0.50h 25h 108 -0.157 0.792 0.780 13.9 52.8 5.6 0.0 0.0 TSF-tsf 0.25h 25h 134 -0.244 0.570 0.517 2.2 65.7 0.7 0.0 0.0 TEF-tef 0.25h 25h 132 0.213 0.762 0.734 1.5 85.6 6.8 0.0 0.0 TSE-tse 0.25h 25h 89 -0.543 0.759 0.534 18.0 48.3 0.0 0.0 0.0 TEE-tee 0.25h 25h 89 -0.057 0.436 0.435 0.0 88.8 2.2 0.0 0.0
FORECASTS Station: Sunshine Skyway Bridge Observed data time period from: / 4/10/2010 to / 7/18/2010with gaps of 0.42 days Data gap is filled using SVD method Data are not filtered ------------------------------------------------------------------------------------------- VARIABLE X N IMAX SM RMSE SD NOF CF POF MDNO MDPO WOF SKILL CRITERION - - - - - - <1% >90% <1% <N <N <.5% ------------------------------------------------------------------------------------------- SCENARIO: SEMI-OPERATIONAL FORECAST D00-d00 22.5 dg 24h 161 -1.497 4.941 4.723 0.0 100.0 0.0 0.0 0.0 D06-d06 22.5 dg 24h 158 -1.664 4.760 4.474 0.0 100.0 0.0 0.0 0.0 D12-d12 22.5 dg 24h 157 -1.317 4.978 4.816 0.0 99.4 0.0 0.0 0.0 D18-d18 22.5 dg 24h 160 -1.629 5.446 5.213 0.0 99.4 0.0 0.0 0.0 D24-d24 22.5 dg 24h 164 -1.606 5.332 5.099 0.0 99.4 0.0 0.0 0.0 DFC-dfc 22.5 dg 24h 120 -2.024 4.545 4.087 0.0 100.0 0.0 0.0 0.0 DEC-dec 22.5 dg 24h 74 0.127 3.359 3.380 0.0 100.0 0.0 0.0 0.0 Station: Sunshine Skyway Bridge Observed data time period from: / 4/10/2010 to / 7/18/2010 with gaps of 0.42 days Data gap is filled using SVD method Data are not filtered ------------------------------------------------------------------------------------------- VARIABLE X N IMAX SM RMSE SD NOF CF POF MDNO MDPO WOF SKILL CRITERION - - - - - - <1% >90% <1% <N <N <.5% ------------------------------------------------------------------------------------------- SCENARIO: SEMI-OPERATIONAL FORECAST U00-u00 26 cm/s 24h 161 -0.101 0.137 0.093 0.0 97.5 0.0 0.0 0.0 U06-u06 26 cm/s 24h 158 -0.112 0.154 0.107 0.0 91.1 0.0 0.0 0.0 U12-u12 26 cm/s 24h 157 -0.108 0.151 0.105 0.0 91.7 0.0 0.0 0.0 U18-u18 26 cm/s 24h 160 -0.109 0.154 0.109 0.0 91.3 0.0 0.0 0.0 U24-u24 26 cm/s 24h 164 -0.110 0.151 0.104 0.0 92.1 0.0 0.0 0.0 AFC-afc 26 cm/s 24h 120 -0.200 0.215 0.079 0.0 75.0 0.0 0.0 0.0 AEC-aec 26 cm/s 24h 74 -0.100 0.150 0.112 0.0 95.9 0.0 0.0 0.0 TFC-tfc 0.50h 25h 120 0.049 0.607 0.607 5.0 54.2 5.8 0.0 0.0 TEC-tec 0.50h 25h 74 0.046 0.524 0.526 4.1 66.2 2.7 0.0 0.0 TSF-tsf 0.25h 25h 111 0.102 0.531 0.524 0.9 67.6 5.4 0.0 0.0 TEF-tef 0.25h 25h 115 0.420 0.634 0.477 0.0 49.6 7.8 0.0 8.7 TSE-tse 0.25h 25h 72 -0.451 0.566 0.344 5.6 55.6 0.0 0.0 0.0 TEE-tee 0.25h 25h 72 0.151 0.298 0.259 0.0 91.7 0.0 0.0 0.0
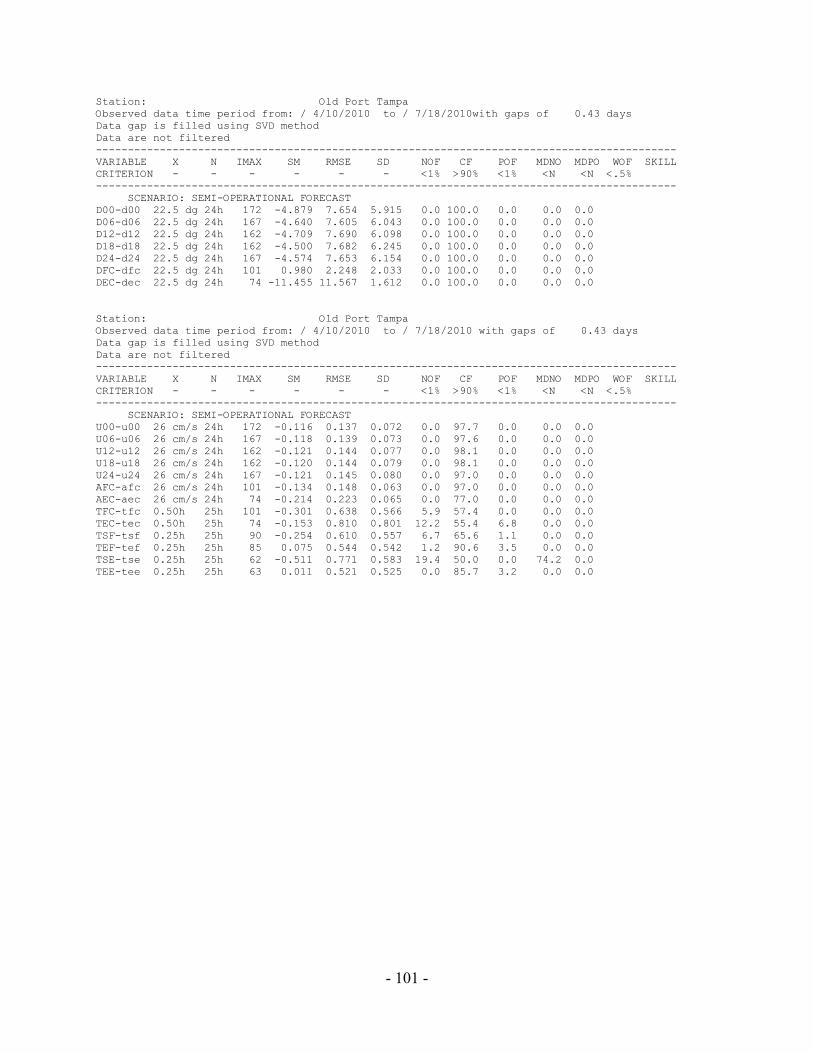
- 101 -
Station: Old Port Tampa Observed data time period from: / 4/10/2010 to / 7/18/2010with gaps of 0.43 days Data gap is filled using SVD method Data are not filtered -------------------------------------------------------------------------------------------VARIABLE X N IMAX SM RMSE SD NOF CF POF MDNO MDPO WOF SKILL CRITERION - - - - - - <1% >90% <1% <N <N <.5% ------------------------------------------------------------------------------------------- SCENARIO: SEMI-OPERATIONAL FORECAST D00-d00 22.5 dg 24h 172 -4.879 7.654 5.915 0.0 100.0 0.0 0.0 0.0 D06-d06 22.5 dg 24h 167 -4.640 7.605 6.043 0.0 100.0 0.0 0.0 0.0 D12-d12 22.5 dg 24h 162 -4.709 7.690 6.098 0.0 100.0 0.0 0.0 0.0 D18-d18 22.5 dg 24h 162 -4.500 7.682 6.245 0.0 100.0 0.0 0.0 0.0 D24-d24 22.5 dg 24h 167 -4.574 7.653 6.154 0.0 100.0 0.0 0.0 0.0 DFC-dfc 22.5 dg 24h 101 0.980 2.248 2.033 0.0 100.0 0.0 0.0 0.0 DEC-dec 22.5 dg 24h 74 -11.455 11.567 1.612 0.0 100.0 0.0 0.0 0.0 Station: Old Port Tampa Observed data time period from: / 4/10/2010 to / 7/18/2010 with gaps of 0.43 days Data gap is filled using SVD method Data are not filtered ------------------------------------------------------------------------------------------- VARIABLE X N IMAX SM RMSE SD NOF CF POF MDNO MDPO WOF SKILL CRITERION - - - - - - <1% >90% <1% <N <N <.5% ------------------------------------------------------------------------------------------- SCENARIO: SEMI-OPERATIONAL FORECAST U00-u00 26 cm/s 24h 172 -0.116 0.137 0.072 0.0 97.7 0.0 0.0 0.0 U06-u06 26 cm/s 24h 167 -0.118 0.139 0.073 0.0 97.6 0.0 0.0 0.0 U12-u12 26 cm/s 24h 162 -0.121 0.144 0.077 0.0 98.1 0.0 0.0 0.0 U18-u18 26 cm/s 24h 162 -0.120 0.144 0.079 0.0 98.1 0.0 0.0 0.0 U24-u24 26 cm/s 24h 167 -0.121 0.145 0.080 0.0 97.0 0.0 0.0 0.0 AFC-afc 26 cm/s 24h 101 -0.134 0.148 0.063 0.0 97.0 0.0 0.0 0.0 AEC-aec 26 cm/s 24h 74 -0.214 0.223 0.065 0.0 77.0 0.0 0.0 0.0 TFC-tfc 0.50h 25h 101 -0.301 0.638 0.566 5.9 57.4 0.0 0.0 0.0 TEC-tec 0.50h 25h 74 -0.153 0.810 0.801 12.2 55.4 6.8 0.0 0.0 TSF-tsf 0.25h 25h 90 -0.254 0.610 0.557 6.7 65.6 1.1 0.0 0.0 TEF-tef 0.25h 25h 85 0.075 0.544 0.542 1.2 90.6 3.5 0.0 0.0 TSE-tse 0.25h 25h 62 -0.511 0.771 0.583 19.4 50.0 0.0 74.2 0.0 TEE-tee 0.25h 25h 63 0.011 0.521 0.525 0.0 85.7 3.2 0.0 0.0

- 102 -
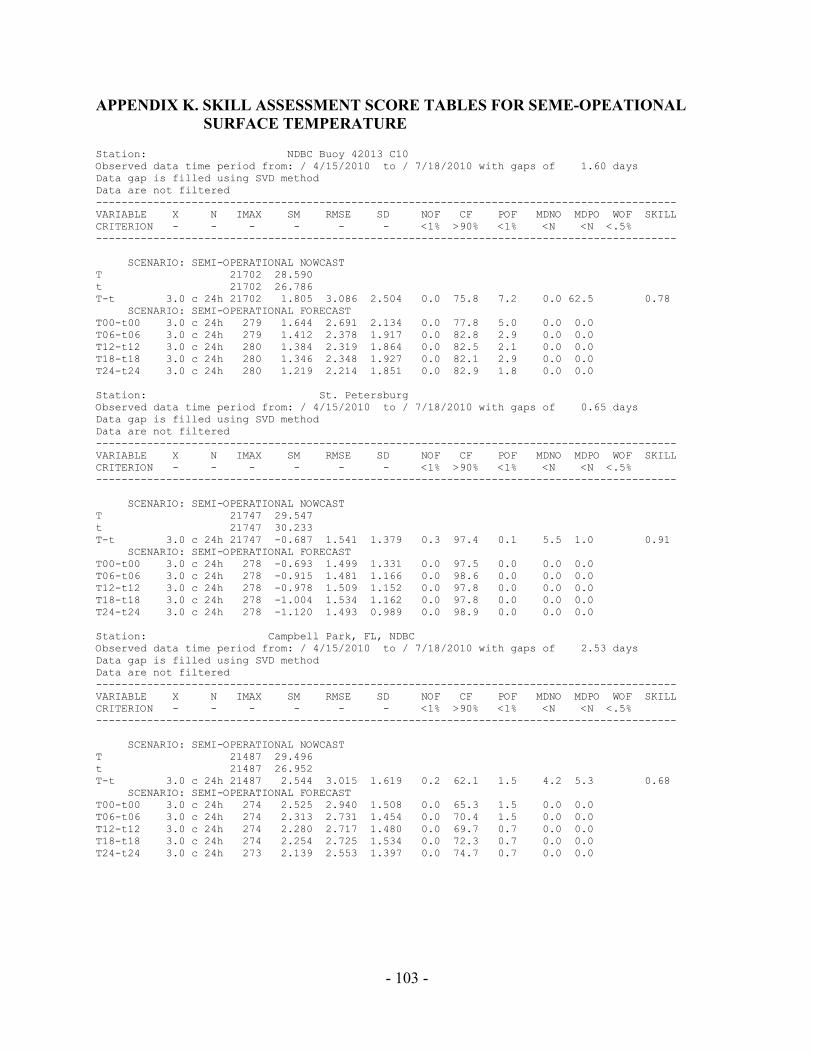
- 103 -
APPENDIX K. SKILL ASSESSMENT SCORE TABLES FOR SEME-OPEATIONAL SURFACE TEMPERATURE
Station: NDBC Buoy 42013 C10 Observed data time period from: / 4/15/2010 to / 7/18/2010 with gaps of 1.60 days Data gap is filled using SVD method Data are not filtered ------------------------------------------------------------------------------------------- VARIABLE X N IMAX SM RMSE SD NOF CF POF MDNO MDPO WOF SKILL CRITERION - - - - - - <1% >90% <1% <N <N <.5% ------------------------------------------------------------------------------------------- SCENARIO: SEMI-OPERATIONAL NOWCAST T 21702 28.590 t 21702 26.786 T-t 3.0 c 24h 21702 1.805 3.086 2.504 0.0 75.8 7.2 0.0 62.5 0.78 SCENARIO: SEMI-OPERATIONAL FORECAST T00-t00 3.0 c 24h 279 1.644 2.691 2.134 0.0 77.8 5.0 0.0 0.0 T06-t06 3.0 c 24h 279 1.412 2.378 1.917 0.0 82.8 2.9 0.0 0.0 T12-t12 3.0 c 24h 280 1.384 2.319 1.864 0.0 82.5 2.1 0.0 0.0 T18-t18 3.0 c 24h 280 1.346 2.348 1.927 0.0 82.1 2.9 0.0 0.0 T24-t24 3.0 c 24h 280 1.219 2.214 1.851 0.0 82.9 1.8 0.0 0.0 Station: St. Petersburg Observed data time period from: / 4/15/2010 to / 7/18/2010 with gaps of 0.65 days Data gap is filled using SVD method Data are not filtered ------------------------------------------------------------------------------------------- VARIABLE X N IMAX SM RMSE SD NOF CF POF MDNO MDPO WOF SKILL CRITERION - - - - - - <1% >90% <1% <N <N <.5% ------------------------------------------------------------------------------------------- SCENARIO: SEMI-OPERATIONAL NOWCAST T 21747 29.547 t 21747 30.233 T-t 3.0 c 24h 21747 -0.687 1.541 1.379 0.3 97.4 0.1 5.5 1.0 0.91 SCENARIO: SEMI-OPERATIONAL FORECAST T00-t00 3.0 c 24h 278 -0.693 1.499 1.331 0.0 97.5 0.0 0.0 0.0 T06-t06 3.0 c 24h 278 -0.915 1.481 1.166 0.0 98.6 0.0 0.0 0.0 T12-t12 3.0 c 24h 278 -0.978 1.509 1.152 0.0 97.8 0.0 0.0 0.0 T18-t18 3.0 c 24h 278 -1.004 1.534 1.162 0.0 97.8 0.0 0.0 0.0 T24-t24 3.0 c 24h 278 -1.120 1.493 0.989 0.0 98.9 0.0 0.0 0.0 Station: Campbell Park, FL, NDBC Observed data time period from: / 4/15/2010 to / 7/18/2010 with gaps of 2.53 days Data gap is filled using SVD method Data are not filtered ------------------------------------------------------------------------------------------- VARIABLE X N IMAX SM RMSE SD NOF CF POF MDNO MDPO WOF SKILL CRITERION - - - - - - <1% >90% <1% <N <N <.5% ------------------------------------------------------------------------------------------- SCENARIO: SEMI-OPERATIONAL NOWCAST T 21487 29.496 t 21487 26.952 T-t 3.0 c 24h 21487 2.544 3.015 1.619 0.2 62.1 1.5 4.2 5.3 0.68 SCENARIO: SEMI-OPERATIONAL FORECAST T00-t00 3.0 c 24h 274 2.525 2.940 1.508 0.0 65.3 1.5 0.0 0.0 T06-t06 3.0 c 24h 274 2.313 2.731 1.454 0.0 70.4 1.5 0.0 0.0 T12-t12 3.0 c 24h 274 2.280 2.717 1.480 0.0 69.7 0.7 0.0 0.0 T18-t18 3.0 c 24h 274 2.254 2.725 1.534 0.0 72.3 0.7 0.0 0.0 T24-t24 3.0 c 24h 273 2.139 2.553 1.397 0.0 74.7 0.7 0.0 0.0
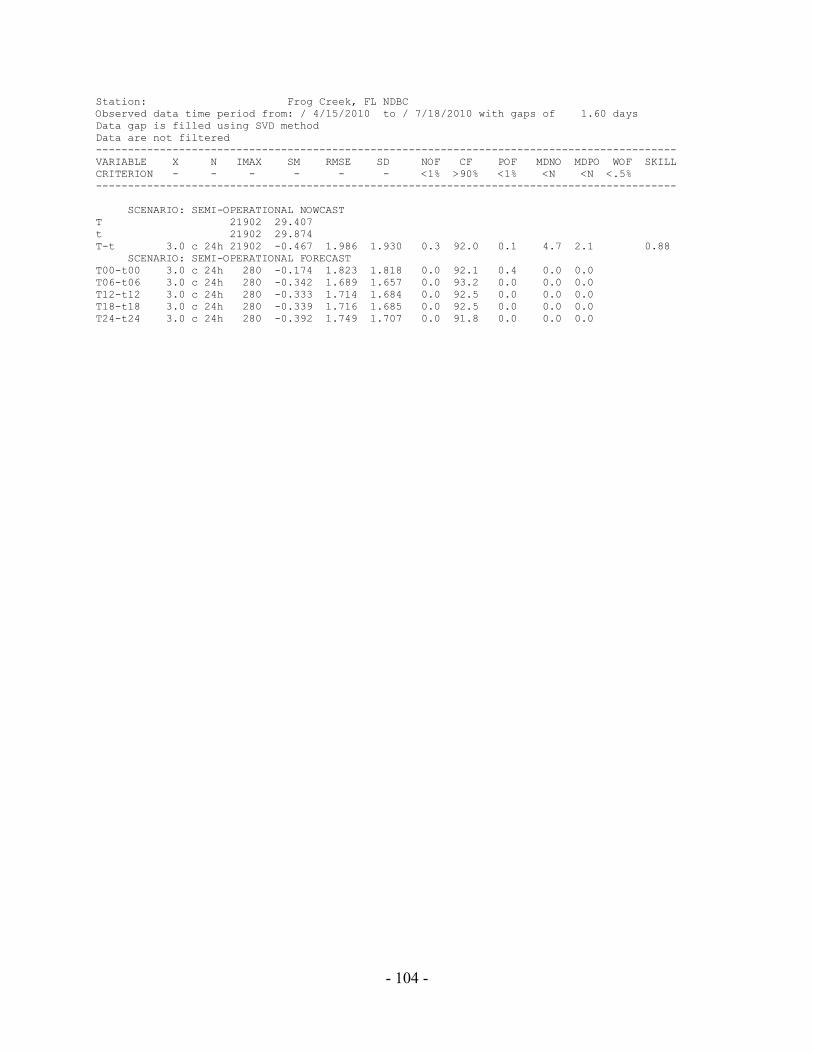
- 104 -
Station: Frog Creek, FL NDBC Observed data time period from: / 4/15/2010 to / 7/18/2010 with gaps of 1.60 days Data gap is filled using SVD method Data are not filtered ------------------------------------------------------------------------------------------- VARIABLE X N IMAX SM RMSE SD NOF CF POF MDNO MDPO WOF SKILL CRITERION - - - - - - <1% >90% <1% <N <N <.5% ------------------------------------------------------------------------------------------- SCENARIO: SEMI-OPERATIONAL NOWCAST T 21902 29.407 t 21902 29.874 T-t 3.0 c 24h 21902 -0.467 1.986 1.930 0.3 92.0 0.1 4.7 2.1 0.88 SCENARIO: SEMI-OPERATIONAL FORECAST T00-t00 3.0 c 24h 280 -0.174 1.823 1.818 0.0 92.1 0.4 0.0 0.0 T06-t06 3.0 c 24h 280 -0.342 1.689 1.657 0.0 93.2 0.0 0.0 0.0 T12-t12 3.0 c 24h 280 -0.333 1.714 1.684 0.0 92.5 0.0 0.0 0.0 T18-t18 3.0 c 24h 280 -0.339 1.716 1.685 0.0 92.5 0.0 0.0 0.0 T24-t24 3.0 c 24h 280 -0.392 1.749 1.707 0.0 91.8 0.0 0.0 0.0
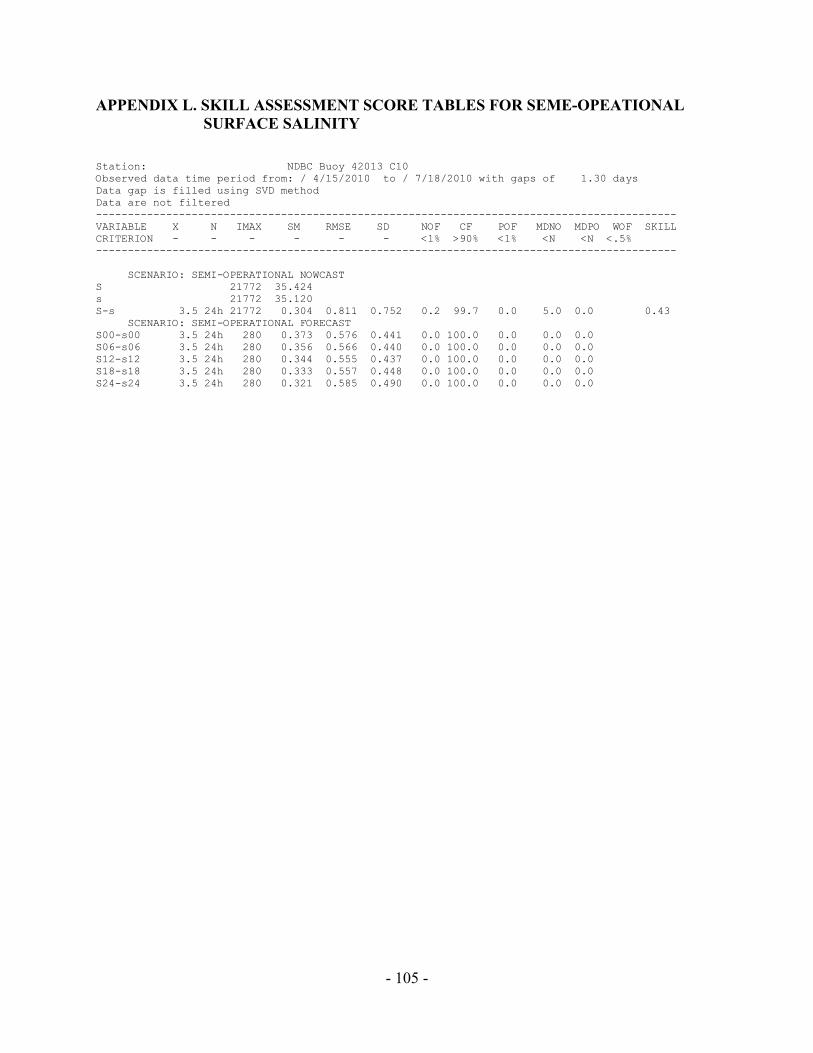
- 105 -
APPENDIX L. SKILL ASSESSMENT SCORE TABLES FOR SEME-OPEATIONAL SURFACE SALINITY
Station: NDBC Buoy 42013 C10 Observed data time period from: / 4/15/2010 to / 7/18/2010 with gaps of 1.30 days Data gap is filled using SVD method Data are not filtered ------------------------------------------------------------------------------------------- VARIABLE X N IMAX SM RMSE SD NOF CF POF MDNO MDPO WOF SKILL CRITERION - - - - - - <1% >90% <1% <N <N <.5% ------------------------------------------------------------------------------------------- SCENARIO: SEMI-OPERATIONAL NOWCAST S 21772 35.424 s 21772 35.120 S-s 3.5 24h 21772 0.304 0.811 0.752 0.2 99.7 0.0 5.0 0.0 0.43 SCENARIO: SEMI-OPERATIONAL FORECAST S00-s00 3.5 24h 280 0.373 0.576 0.441 0.0 100.0 0.0 0.0 0.0 S06-s06 3.5 24h 280 0.356 0.566 0.440 0.0 100.0 0.0 0.0 0.0 S12-s12 3.5 24h 280 0.344 0.555 0.437 0.0 100.0 0.0 0.0 0.0 S18-s18 3.5 24h 280 0.333 0.557 0.448 0.0 100.0 0.0 0.0 0.0 S24-s24 3.5 24h 280 0.321 0.585 0.490 0.0 100.0 0.0 0.0 0.0