The strength of thick-walled steel cylinders at elevated ... 2/C... · ultimate pressure is not...
20
CROS-B 69-0618 High Temperatures - High Pressures, 1969, volume 1, pages 133-152 The strength of thick-walled steel cylinders at elevated temperatures B.Crossland The Queen's University of Belfast, Belfast, Northern Ireland W.F.K.Kerr Belfast College of Technology, Belfast, Northern Ireland Received 23 April 1969 Abstract. A brief resume of the reasons for requiring data on the hot strength of thick-walled cylinders and of the work so far published in the field is given. The design of a torsion testing machine for use at elevated temperatures is described. Torsion data at temperatures from 20 to 370°C have been obtained for three steels: Hykro (EN40), Vibrac V30 (EN2S) and a mild steel EN3. Tension data at the same temperatures have been obtained and are reported. Thick-walled cylinder pressure tests have also been carried out on these three steels at various temperatures up to 370°C and this information is presented. It is concluded that the results have continued to demonstrate the simpliCity and desirability of using shear stress-strain data, as derived from torsion tests on solid specimens, in the design of cylinders. However, with EN3 the agreement between experiment and theory in relation to the ultimate pressure is not nearly so good as with Hykro and Vibrac. This is due to the fact that EN3 cylinders fail on a rising pressure/expansion curve at strains below those needed to give the maximum pressure. Introduction The yield, flow, and fracture of thick-walled cylinders subjected to internal pressure has been extensively studied and a review of the literature is given by Crossland and Bones (1958). The current interest arises from the design of gun barrels, chemical reaction vessels, vessels for isostatic compaction, etc. In some of these cases the vessels operate at elevated temperatures. These temperatures are often sufficiently high .to have a significant effect on the strength of vessels, though insufficient to give rise to the danger of short term failure by creep except at pressure close to the ultimate or maximum pressure which the vessel can contain. Crossland and Bones (1958), Crossland, Jorgensen and Bones (1958), and Crossland (1964) have on the basis of papers by Manning (1945), Turner (1909), Cook (1934; 1938), and Morrison (1948) suggested a logical basis of design of thick-walled cylinders based on shear stress-strain data derived from torsion tests on solid or tubular cylindrical specimens. They have also published results of room temperature pressure tests on thick-walled cylinders, which show excellent agreement with theory based on torsion data. The only paper which reports results of tension and thick-walled cylinder tests at elevated temperatures is that of Faupel (1956). At initial yield the results showed reasonable agreement with values predicted from tension tests on the basis of the Maxwell or Mises-Hencky criterion. Reasonable agreement between the ultimate or maximum pressure found experimentally and those predicted by a completely empirically based equation was reported. Unfortunately Faupel gave insufficient tension data to allow a more fundamentally based analysis suggested by Crossland, Jorgensen and Bones (1958) to be applied. No torsion data were reported, though shear stress-strain data have more direct relevance to the analysis of thick-walled cylinders subjected to internal pressure than tension data, as noted by Crossland (1964). It was this paucity of information at elevated temperatures that led to the programme of work reported here, in which tension, torsion, and thick-walled
Transcript of The strength of thick-walled steel cylinders at elevated ... 2/C... · ultimate pressure is not...

CROS-B 69-0618 High Temperatures - High Pressures, 1969, volume 1, pages 133-152
The strength of thick-walled steel cylinders at elevated temperatures
B.Crossland The Queen's University of Belfast, Belfast, Northern Ireland W.F.K.Kerr Belfast College of Technology, Belfast, Northern Ireland Received 23 April 1969
Abstract. A brief resume of the reasons for requiring data on the hot strength of thick-walled cylinders and of the work so far published in the field is given.
The design of a torsion testing machine for use at elevated temperatures is described. Torsion data at temperatures from 20 to 370°C have been obtained for three steels: Hykro (EN40), Vibrac V30 (EN2S) and a mild steel EN3. Tension data at the same temperatures have been obtained and are reported. Thick-walled cylinder pressure tests have also been carried out on these three steels at various temperatures up to 370°C and this information is presented.
It is concluded that the results have continued to demonstrate the simpliCity and desirability of using shear stress-strain data, as derived from torsion tests on solid specimens, in the design of cylinders. However, with EN3 the agreement between experiment and theory in relation to the ultimate pressure is not nearly so good as with Hykro and Vibrac. This is due to the fact that EN3 cylinders fail on a rising pressure/expansion curve at strains below those needed to give the maximum pressure.
Introduction The yield, flow, and fracture of thick-walled cylinders subjected to internal pressure has been extensively studied and a review of the literature is given by Crossland and Bones (1958). The current interest arises from the design of gun barrels, chemical reaction vessels, vessels for isostatic compaction, etc. In some of these cases the vessels operate at elevated temperatures. These temperatures are often sufficiently high . to have a significant effect on the strength of vessels, though insufficient to give rise to the danger of short term failure by creep except at pressure close to the ultimate or maximum pressure which the vessel can contain.
Crossland and Bones (1958), Crossland, Jorgensen and Bones (1958), and Crossland (1964) have on the basis of papers by Manning (1945), Turner (1909), Cook (1934; 1938), and Morrison (1948) suggested a logical basis of design of thick-walled cylinders based on shear stress-strain data derived from torsion tests on solid or tubular cylindrical specimens. They have also published results of room temperature pressure tests on thick-walled cylinders, which show excellent agreement with theory based on torsion data. The only paper which reports results of tension and thick-walled cylinder tests at elevated temperatures is that of Faupel (1956). At initial yield the results showed reasonable agreement with values predicted from tension tests on the basis of the Maxwell or Mises-Hencky criterion. Reasonable agreement between the ultimate or maximum pressure found experimentally and those predicted by a completely empirically based equation was reported.
Unfortunately Faupel gave insufficient tension data to allow a more fundamentally based analysis suggested by Crossland, Jorgensen and Bones (1958) to be applied. No torsion data were reported, though shear stress-strain data have more direct relevance to the analysis of thick-walled cylinders subjected to internal pressure than tension data, as noted by Crossland (1964).
It was this paucity of information at elevated temperatures that led to the programme of work reported here, in which tension, torsion, and thick-walled

134 B.Crossland, W.F.K.Kerr
cylinder tests have been carried out on three steels at temperatures from 20 to 370°C. Note that all data are given in tonf in-2 (= 2240 p.s.i. = 0·1544 kbar).
Apparatus and technique of testing Figure I shows the torsion testing machine designed for carrying out torsion tests at elevated temperatures. The specimen is mounted in the oven in self-aligning grips to ensure that only a pure couple is applied. These grips are described in greater detail by Crossland (1965). One end of the specimen is coupled through a shaft to a torque bar external to the oven, and the other to a worm gear which can apply a twist to the specimen. The oven is fitted with a door with a double glass window for heat insulation through which the extensometer can be viewed. With full heating power the maximum temperature achievable is a little over 370°C.
Figure 2 shows the design of mirror clips used on the specimen. They consist of two stainless steel circular members with a degree scale scribed on their periphery,
worm gear mirror clips
Ii] 0 ~
convective electric oven
double glass window
Figure 1. General arrangement of torsion testing machine for elevated temperatures.
one of three setting pieces to ensure mirror clips are fixed at
a known distance apart
degree scale
torsion grips
Section X X
Figure 2. General arrangement of torsiometer for measuring small and large strains.
torque bar

Strength of thick-walled cylinders at elevated temperatures 135
which can be fixed to the specimen by three screws with pointed ends which are disposed at 1200 to one another. A special distance piece has been designed which ensures that the clips are fixed at a known distance apart in the parallel gauge length of the specimen. Mirrors are fixed to each clip and these are made of stainless steel which has been optically polished. Pointers are fixed in the oven which are located close to the degree scale on the clips so that a course strain reading can be taken. With suitable illuminated scales and telescopes it is possible to detect a shear strain of 10-5 .
Tension tests were carried out in a 30 tonf Amsler testing machine fitted with a furnace and mirror extensometer supplied by Electronic and Mechanical Engineering Co.Ltd. A saturable reactor type of proportional controller with a platinum resistance thermometer was used for temperature control. The temperature distribution was measured by three Pt/Pt-IO%Rh thermocouples. The temperature distribution could be adjusted by trimming the power in each of three furnace windings. To avoid damaging the extensometer it was removed before fracture of the specimen.
In both torsion and tension tests a period of 3 min was allowed after an increment of strain or load had been applied to allow equilibrium to be reached before the readings of load and strain were taken. In some torsion tests the relaxation of stress after an increment of strain had been applied was observed for periods up to 30 min, to get some idea of whether creep was significant.
In the pressure tests on thick-walled cylinders it was assumed that the axial strain was negligible as found by Crossland and Bones (1958) and consequently no axial extensometer was fitted. Again Crossland and Bones found that the diametral expansion of cylinders was perfectly symmetrical except for materials with an appreciable drop of stress at yield , and even then at strains appreciably beyond those at initial yield it was found that there was no significant difference between the strain readings on different diameters. Consequently a single diametral extensometer of the form shown in Figure 3 was used, and the sensitivity was made as large as possible consistent with it having the range to enable it to be used right up to the strains associated with the maximum pressure.
The pressure was generated with the 125000 Ibf in-2 intensifier described by Crossland and Austin (1965) and measured with a Bourdon tube or an eccentric tube gauge, which was calibrated against a dead weight pressure tester before and after such test. The specimen was mounted in the oven used for torsion tests and the mirrors on the diametral extensometer were viewed through the glass window. Brake fluid was used as the pressure transmitting fluid, though when a cylinder failed the fluid frequently caught fire and sometimes a minor explosion occurred, so that the door of the oven had to be elastically constrained.
During the pressure tests the pressure was maintained for a short time, and then readings of pressure and diametral strain were recorded after a delay of 3 min.
mirro
Figure 3. General arrangement of extensometer.

136 B.Crossland, W.F.K.Kerr
Materials tested Table I gives the analysis of the steels tested. The Hykro and Vibrac V30 were provided in the form of hot-rolled bar which had been hardened and tempered. As the tensile strength of the Hykro proved to be higher than for the Vibrac and as comparability was desired, all the specimens made from the Hykro bar were subjected to 600°C for an hour in a high vacuum furnace which served as a re-tempering and stress relieving heat treatment. The Vibrac specimens were stress relieved in the high vacuum furnace at 600°C which was 50 deg below the original tempering temperature. After machining the EN3 specimens were normalised in the high vacuum furnace at 880°C for an hour and allowed to cool down in the furnace before removal.
Table 1. Analysis of the steels tested.
Steel C Si S Ph Mn Cr Mo Ni
Hykro EN40 0·175 0·15 0·002 0·015 0·48 3 ·18 0·62 0·17 Vibrac V30-EN25 0 ·29 0 ·21 0·021 0·022 0·61 0 ·66 0·56 2·43 Mild steel EN3 0·26 0 ·13 0 ·037 0 ·024 0 ·65
Very careful consideration was given to the cutting up of the bar material so that tension and torsion specimens and hardness cheek pieces were positioned between each pair of cylinder specimens, to enable any variation of properties along the bars to be established. The torsion and tension specimens were cut in the longitudinal direction, as the diameter of the bar did not allow for reasonable sized transverse specimens, and they were cut from material at the same radius as the cylinder wall material. The form of torsion, tension and cylinder specimens is shown in Figures 4, 5 and 6.
Figure 4. Torsion specimen.
N .
~ .2 .:.
;Ii --+---+ftt--- ----1--- --tfH--+ --+t- ::l
2'
Figure 5. Tension specimen.

Strength of thick-walled cylinders at elevated temperatures 137
Results A large number of torsion specimens have been tested mainly at 20, 160, 300 and 370°C, though a few specimens of EN3 were also tested at 90 and 230°C. In order to keep down the number of graphs the curves of the ratio of torque to the section modulus against shear strain at the outer surface have been plotted and envelope curves drawn, though it should be noted that all the experimental points for a given test lay reasonably on a smooth curve. The shear stress-strain curves were then derived using the method ascribed to Nadai and fully described for instance by Crossland (1964, 1965). These derived curves alone are given here to reduce the number of graphs. Figures 7 and 8 are the curves at small and large strains for Hykro at various temperatures; similarly curves in Figures 9 and 10 are for Vibrac and curves in Figures II and 12 are for EN3.
In the Nadai construction for deriving shear stress-strain data from torque-twist measurements from a torsion test on solid specimens it is assumed that the material is homogeneous. However, if the material is strain rate dependent then it is effectively non-homogeneous as the strain rate will vary with radius. In order to investigate if the assumption of homogeneity was justified, especially at elevated temperatures, some torsion tests on tubes and solid specimens of Hykro and Vibrac were carried out, to establish if the same shear stress-strain curve was obtained with tubes as could be deduced from solid specimens. Tests at 300°C indicated satisfactory agreement.
Relaxation tests in which an increment of strain was applied and the torque was then measured at various intervals of elapsed time were also carried out to get some indication of time-dependent effects. The difference in the torque-twist curves after intervals of 3, 10 and 30 min were established up to temperatures of 370°C for Hykro and Vibrac and up to 230°C for EN3. The differences were negligibly small except at 370°C for Vibrac where there was a more significant difference in the three curves at 3, 10 and 30 min, though probably the errors in using the Nadai construction were still not unacceptably large.
The number of tension tests carried out was less than with torsion as the furnace could not be satisfactorily used below 160°C, and the strains which could be recorded were limited by the extensometer as it had to be removed at relatively small strains.
*-~----~~-- . ----- . ~-----
2-BSP .l2Q..Q K. A
Figure 6. Detail of cylinder assembly.

138
30 .------.-------,--~~~------~------~ 370"e
~
~5 20 rJr-""-:!===:t:]2~=+===:;;;t::;;;;;;;;;;;;;;~ ! 300"e
~ 10U)~r-~=:==~~~~~~~4 ! (370") 0 I./t' 11Ir-=;;;+;;;;;;;;;;;;;;=$=2~1;~e~(9=======t=====j j (300°) 0 ~V+-'/I+ir_-+ __ ----1r----_+-__ -+-__ --i
(160") 0 ,...,/f---+---I-------+---+------l (20")0L-----~-------L------~------~----~
o 100 200 300 400 500 Shear strain x I 0 4
Figure 7. Derived shear stress-strain curves at small strains for Hykro.
~ .. :5 ... <: g :! e t; :; .. ..c:
<I:l
40
30 3700e
ir -300"e
20 ~
160"e 10 ?'
200e
(370°) 0 ~
(300°) 0
(160°) 0
(20°) 0 L---' __ ---'-_---'-_-L_-'-_--'-_-'--_-'--_'-----' o 0 ·5 1·0 1·5 2 ·0 2·5 3 ·0 3·5 4·0 4·5 5 ·0
Shear strain
Figure 8. Derived shear stress-strain curves at large strains for Hykro.
30 ~ .. ~5 ... 20 <: g
10 .. .. e t; ... (370°) 0 .. .. ..c: <I:l
(300°) 0
(160°) 0
(20°) 0
! //1 /1, II I
0
~700e
p-3000e
160"e
20"e
100 200 300 Shear strain x 104
400 500
Figure 9. Derived shear stress-strain curves at small strains for Vibrac.
B.Crossland, W.F.K.Kerr

Strength of thick-walled cylinders at elevated temperatures
30 - 370".( ~
~5 20 ... c ~
1/ 1600r
I~ 300°C ::! 10 ~ .. ..
(370°) 0 .. .. ..c
.~ 20°C I-"
~ VI
(300°) 0
(160°) 0
(20°) 0 o 0-5 1·0 1·5 2-0 2-5
Shear strain
Figure 10. Derived shear stress-strain curves at large strains for Vibrac.
~
~= '-c ~ ~
~ -" .. ..c VI
8
6
4
2
(370°) 0
2
(300°) 0
2
(230°) 0
2
(160°) 0
2
(90°) 0
2
---~ ).--- f--
~ I--~ -~ l.-----
I----'
/.
( 300°C ~ ~ p---
II t~ ~ ~p
I !\ f.---,..-
2~ ----'IA II~ 160°C --=::. ~
1/ 111
II r~ 90°C
III A
II r~ 20°C
"/ ~ II
(20°) 0 0 50 100 150
Shear strain x 10·
- I--I-:: I-- f--"
-=
V I-
----~ ~ --::;::::.
----l--- I---
lJ
200 250
Figure 11. Derived shear stress-strain curves at small strains for EN3.
139

140 B.Crossland, W.F.K.Kerr
In any case, at strains higher than that associated with the ultimate stress, the current area of the neck is required, and the radius of the curvature of the neck in the plane containing the axis of the specimen is needed to be able to apply the Bridgman (1952) analysis of the state of stress at the neck. Figures 13, 14 and 15 give the tension data at various temperatures for the three steels tested.
With mild steel it was noted, especially at temperatures above room temperature, that after the upper yield had been exceeded the material, after an elapse of 3 min, had again developed an upper yield stress. Appreciably higher stresses than the equilibrium stress achieved after 3 min had to be applied before yield took place, and
20 iJ70°C
15
10
5 ~ N
Ie ~ (370°) 0
! "' 5 "' e ';; ...
(300°) 0 to II> .c '"
(230°) ° (160°) 0
~
/ 300°C
I¥ # ~ 23~ -f/ / ~ -=
~
Iflp ~ ----.........
90°C ----r / V 20"C
'(/-~ V
1'-(( IV
(90°) 0
(20°) ° ° 0 ·2 0 ·4 0 ·6 0 ·8 1·0 1·2 1·4 1·6 1·8 2·0 Shear strain
Figure 12. Derived shear stress-strain curves at large strains for EN3.
50
40
30
';' 20 .= 'c ! 10 ~
~ (370°) ° (300°) 0
(160°) 0
(20°) 0
~ ...-( /O°C
If 160°C '/2iJoc
IJ V (II III; III II o 0 ·01
Figure 13. Tension tests on Hykro .
0 ·02 Strain
0 ·03 0 -04

Strength of thick-walled cylinders at elevated temperatures
when yield occurred a considerable increment of plastic strain was noted. This phenomenon continued right up to failure.
141
It should be noted that the degree of axiality of loading in the initial stages of the test was probably not high because of the coarse threads on the end of the specimen. Also with two axial extensometers opposite one another it is impossible to estimate the magnitude of the non-axiality. Consequently it is impossible to determine the exact value of the upper yield stress in EN3, and even in material such as Vibrac which has a sharp yield there was significant non-linearity in the curve below the true yield. As a consequence it was decided to quote the 0.1 % proof stress. Table 2 gives a summary of the results of torsion and tension tests.
Pressure tests have been carried out on cylinders with various values of diameter ratio K, made from the three steels being investigated, and at various temperatures. It is impossible to present all the graphs of the immense amount of data accumulated, and only those necessary to get the salient feature across are given. Figures 16 and 17 show the pressure/expansion curves at small and large strains for Vibrac specimens
50
40
30
370·e -/
V-- 300·e - -.....--~ I(
160·e --N 20 , .s
----- -20·e ....
c: g 10 rr-------
~ ~
~ en (370·) 0
(300·) 0
(160·) 0
(20·) 0 0 0·01 0 ·02 0 ·03
Strain
Figure 14. Tension tests on Vibrac.
.. ~5 .... c:
30
20
10
g (370·) 0 ~
/~ ~ --~ -------f.-----
160·e
-----
0·04
~ en (300·) 0
I~ _____ --- -C 20·e -~
0·01 0 ·02 0 ·03 0 ·04 Strain
Figure 1 S. Tension tests on mild steel EN3A.
0·05
0 ·05 0·06 0 ·07

142 B.Crossland, W.F.K.Kerr
Table 2. Summary of torsion and tension tests (readings after 3 min delay).
Temperature ('C) 20 90 160 230 300
Hykro (EN40) Torsion test Number of torsion specimens 4 2 5 Shear strain at failure 4·3 4'9 3'4 Modulus of rigidity G (tonf in-2
) 5350 5110 4830 Upper yield stress (tonf in-2
)
Lower yield stress (tonf in-2) 23·2-24'2 22·6-23'2 21'8
Shear stress at failure (tonf in-2) 38·2-37·2 35 · 5-35 37'2-35'8
Tension test % Elongation 14'5 12'8 11'3 % Reduction of area 74 73 '2 72'3 Modulus of elasticity E (tonfin-2
) 13600 12890 12300 Upper tensile yield stress (tonf in-2)
Lower tensile yield stress (tonf in-2) 42 (d) 38'2(d) 36(d)
Ultimate tensile stress (tonf in-2) 57'1 50'9 48'8
Vibrac (EN25) Torsion test Number of torsion specimens 10 4 5 Shear strain at failure 2·51 2·0 1·34 Modulus of rigidity G (tonf in-2
) 5260 4970 4770 Upper yield stress (tonf in -2)
Lower yield stress (tonf in-2) 23·8-25-4 21'1-23 20'4-21'8
Shear stress at failure (tonf in-2) 37·8-36'2 38-37 32'4
Tension test % Elongation 17'2-17' 5 15·6 15·8 % Reduction of area 66'0-71 70·9 61·6 Modulus of elasticity E (tonf in-2
) 13 250 12730 12000 Upper tensile yield stress (tonf in-2
)
Lower tensile yield stress (tonf in-2) 44'I(d) 39'2(d) 35'5(d)
Ultimate tensile stress (tonf in-2) 55'5-54'3 50'2 52'5
EN3 Torsion test . Number of torsion specimens Shear strain at failure
6 3 1 4 1 ' 81 1'21 1'1 0·8 0'94
Modulus of rigidity G (tonf in -2) Upper yield stress (tonf in-2
)
Lower yield stress (tonf in-2)
Shear stress at failure (tonf in-2)
5200 5055 5045 4900 4695 9·6-9'1 9'4 9'4-8'9 8 ' 3 5'9 6·8-6·6 6'6 6'9~'6 6'0 4'9-4'8
21'3 20'8-20'3 23'8-23'2 24'0 23·8-23'2
Tension test % Elongation 33'7 % Reduction of area 68·6 Modulus of elasticity E (tonf in-2
) 13370 Upper tensile yield stress (tonfin-2
) 17'3-18'4(c) -Lower tensile yield stress (tonfin-2
) 15·0 Ultimate tensile stress (tonf in-2
) 29·7
14'7-14'9% -46'5-46'2% -13270 17 ·4-1 5'1 (c) -13'3-13'1 32·4-32'1
26'7 47·7
12360 small drop
10'3 33·3
370
2 2'0
4680
18'6-18'8 31'7-30'2
12 70'4
12000
34'0(d) 49 '4
5 2'17 (a)
4590
17'1-18 26-25 ·4
17·3 66
11600
29 '0(d) 47 ' 5
2 2'3(a)
4385 3 ·6
16'9-16'5(b)
24'2-28·6 63-59,6 11600
7'5 28·6-29'4
(a) The torque reached a maximum then decreased so that the shear strain is no longer uniform along the gauge length. (b) The specimen failed at a lower torque than the maximum; maximum shear stress is quoted. (c) No correction for eccentricity, so upper yield probably much higher; see Crossland and Bones (1958). (d) 0'1 % proof stress as distinct yield was not obtained.

Strength of thick-walled cylinders at elevated temperatures 143
tested at 300°C, and Figures 18 and 19 show similar data for EN3 cylinders tested at 300°C. Other data for Hykro cylinders at 20 and 300°C, Vibrac cylinders at 20 and 370°C an9 EN3 cylinders at 20 and 160°C have been obtained and are tabulated in the next section.
~ .. ~5 .... .: g e! '" !:l e! .....
,i, •
50.-----.-----.-----.----,,----,,----.
t:
40~----+---~+-----~--~~--==~----~
30
20
0 ·001
K=N
K = 2·0
K = 1·8
K = 1-6
K= 1-4
-- theoretical yiel pressure - - - theoretical elastic line --- theor~tical collapse pressure -- ex penmen tal curves
0-004 Diametral strain
0-005 0-006
Figure 16. Pressure-expansion curve at small strains for Vibrac cylinders tested at 300°C_
K = 2-5
/~ -=~r---- :.:.~_=-::.~ 40 r-------1--------r------~--------r-----~
__ --- - _ K=2-0 .::~_.f----.-----_- ~
~ 30 r------~-:~~~~~::~~~~~~~~~~-~-____ :=~ .: ......... 1--"""" K - I -8 ~ ~
.--__ :$. 1·6
--1--~ /~=-=-~ 20 ~--~--r_------r_------T_------T_----~ "" K= 1-4
~f..:-::::::::-----=-cl:=-:=:=c-=-:.:::......:: =--::'::.:: '::"'1---: =-=-=
___ maximum theoretical curves ___ minimum theoretical curves ---experimental curves
OL------L----~------~I----~-~I----~ o 0-01 0-02 0·03 0·04 0·05
Diametral strain
Figure 17. Pressure-exp~nsion curve at large strains ~or Vibrac cylinders tested at 300°C.

144
Discussion of results Hykro (EN40)
B.Crossliind. W.F.K.Kerr
At 20 ~nd 300°C the elastic line and yield pressure have been calculated from torsion data given in Table 2, using the equations in Appendix 1. Good agreement between these theoretical values and the experimental curves from cylinder tests was pbtained, similar to that depicted in figure 16 fQr Vibrac.
The pressure-expansion curves at large strains have been calculated from the maximum and minimum shear stress-str~in curves of Figures 7 and 8, using the theory proposed by Crossland, JorgensFn and Bones (1958) or Crossland (1964), which was based on the theory given by Manning (1945). There is reasonable agrej:mept between these theoretical curves and the expetimelltal pressure-expansion curves. The peak pressure or ultimate pressure can be read off these theoretical pressure-expansion curves and compared with the experimental values. The data are given in Table 3;
~
" ~5 ... c g ~
'" l:!
£
30
25
20
15
10 // ~_-~:;O
/ ,-:_~-::::-- K 1·8 K 1'~ 5
F o ~t=t=+=~~=r=f=t~~ 0 1
/ K- j'365
K 1' 4
o 0 ·0010·0020-003 0-0040 -0050 ·0060-0070-0080-009 0 ·01 Diametral strain
Figure 18. Pressure-expansion curves at small strains for EN3A cylinders tested at 300°C.
" ~S ... c B ~
'" ~ ~
""'
/ K ~ 2j2....p_-=-""= ~=:= ==1== F~- _:::-=1==-'=~=--=F-==F-=7": r=--==I--
25
20
15
I
10
5
//v ~ K-l, ' 4 / 4~7( = 1-365 I " ___ maximum theoretical curves
---minimum theoretical purves o '--_'--_-'--_-'--_-'--_-=-e"-x"'p.:..:en.:.:· m:,;e:..::n.:..:tl::..1 ::..;.cu:::.rv.:...:ec:.s -ll_----'L----....l o 0 ·01 0 ·02 0 ·03 0·04 0-05 0-06 0·07 0 ·08 0-09 o· 10
Diametral strain
Figure 19. Pressure-expansion curves at large strains for EN3A cylinders tested af ?OO°C.

Strength pf thick-walled cylinders at elevated temperatures 145
the numbers in brackets give the percentage difference between the calculated and experimental values of ultimate pressure_ The table also gives the ultimate pressure cillculated with the ai~ of the mean diameter fonnula (see Appendix) which relies on t~nsion data_
Study of Table 3 shows that there is good agreement between the ultimate pressure calculated with the mean diameter formula and ~xperiment, and also the ultimate pressure calculated from shear stress-strain data and experiment. Figure 20 shows the ultimate pressure calculated from the average shear stress-strain curve plotted against the diameter ratio K for various temperatures; the experimental values are also shown.
Table 3. Theoretical and experimental values of ultimate pressure for Hykro (EN40).
Diameter Temp. Experimental Calculated ultimate pressure (tonf in-2) ratio K (C) ultimate pres- based on shear stress-strain sure (tonf in -2) mean
diameter maximum minimum
1'6 20° 25'5 26'4 (+3'5%) 26'9 (+1'9%) 26'3 (-0'4%) 1'2 300° 9'25 8'9 (-3'8%) 9'75 (+5-4%) 9'39 (+1'5%) 1'4 300° 17'00 16'3 (-4'1%) 17·9 (+5'3%) 17· 26 (+ I . 5%) 1'6 300° 23'4 22'5 (-3'9%) 24'9 (+6'4%) 24'01 (+2 '6%) 1'8 300
0 28·8 27'8 (-3' 5%) 31'0 (+7 ' 6%) 29'94 (+4'0%) 2'0 3000 34·6 32'5 (-6%) 36'4 (+5 ' 2%) 35'19(+1'7%)
Vibrac (EN25) At 20, 300 and 370°C the pressure-expansion curves at small and large strains have been calculated from shear stress-strain data. The elastic line, initial yield and the pressure when yield has just spread through the cylinder wall, that is the collapse pressure, have been calculated using the equations in the Appendix. The excellent agreement between theory and experiment at 300°C can be seen in Figure 16 and
50 .--------,---------,----~~-r~----__,
40~-------1--------~~~~---r--------~
" ~5 ... g 30
e ~ e Q,
~ 20~----~~~-------+---------r--------~
.§ 5 • experimental point 20°C
• experimental points 300°C
10~~~---1---------+---------r--------~
oL-------~--------~---------L--------~ 1·0 1·5 2·0 2' 5 3·0
Diametral nl\io K
Figure 20. Ultimate pressure of Hykro cylinders calculated from torsion data.

..
146 B.Crossland, W.F .K.Kerr
Table 4. Theoretical and experimental values of initial yield pressure and collapse pressure for .)
Vibrac (EN}S).
Diameter . Temp. Experimental Calculateil'initial yield . Experimental Calculated collapse ratioK (C) initial yield pressure (tonf in-2) collapse pres- pressure (tonf in -2)
sure (tcinfin-~) . pressure maximum minimum minimum (tonf in-2) maxunum
1'4 20 12'7 13·5 12"8 . 17'2 18·4 17' 5 1·2 300 6 6·7 6·2 7·8 8'0 7·5 1·4 300 10·2 10 ·8 TO 15'0 .. 15 ·4 . 1<-3 ) ,6 300 13·0 13 ·4 12'5 20 ·2 21·2 20'0 1·8 300 15 ·0 15·2 14·2 25·5 27'0 25·2 2·0 300 17'0 16'5 :'15'4 . ·' 31(a}· 32'0 30·0 ,: I .. .
2·5 300 18 ·5 17'2 41 (a) 42'S 40'5 1·4 370 9'0 8·9 8'3 13'7 13'4 12 ·4 2'0 370 13 13'6 12'7 29'0 30'0 28'0
(a) It will be seen from Figure 16 that there is no very well defmed region of reasonably constant pressure as with the other curves.
Table 4. The collapse pressure is given by Tpy In~ which assumes a constant plastic shear yield stress, whereas from Figure 9 it can be seen that this is not completely true. The value Tpy, taken for the calculation of collapse pressure, was the shear stress at the mean strain in the cylinder wall given by '!(K2 + '1) x shear strain at initial yield. This is based on the fact that at the collapse pressure yield has just spread throughout the cylinder wall, and the shear strain at the outer diameter (OD) will be ' equal to that at the initial shear yield and the shear strain at the bore will be approximately ~ times the strain at OD. The theoretical and experimental values of initial yield pressure and collapse pressure have been collected together in Figure 21 and Table 4.
N
50 ,--------,---------.---------,--------,
20·C
160·C collapse 300·C pressur
40 ~--------r---------+_ __ ~~~.
~= 30 ~--------r-----+#¥--------+_------____1 'c ,g e ~ 20·C J: 20 ~-------.,f#'Y-------+-=-=='--I160·C yield
10 1-----/hL#O:"".J.-<'=-----
~-::::::::;:::::::;:::::::::~300·C pressur
L);
•• experimental points 20·C •• experimental points 300·C •• experimental points 370·C
o L-______ ~ ________ ~ ________ -L ________ ~
1·0 1· 5 2·0 2·5 3 ·0 Diametral ratio K
Figure 21 . Yield and collapse pressures of Vibrac cylinders . calculated from torsion data. .' ,

Strength of thick-walled cylinders at elevated temperatures 147
Table S. Theoretical and experimental values of ultimate pressure for Vibrac (EN25).
Diameter Temp. Experimental Calculated ultimate pressure (tonf in-2) ratio K (0C) ultimate pres-
based on shear stress-strain sure (tonf in -2) mean diameter maximum minimum
1'4 20 18·8 18 ' 1 (-3'7%) 18'6(-1%) 17'6 (-6'4%) 18'5 (-1'6%)
1·2 300 9'2 9'55 (+3'8%) 9'2 (0%) 8'84 (-3'9%) 1'4 300 17 '4 17· 5 (+0'6%) 17'0 (-2 ' 3%) 16 ' 3 (-6 '3%) 1·6 300 24'5 (-1'2%) (-3'3%) (-7'3%)
24'1 24·2 (+0'4%) 23'7(-1'7%) 22'7 (-5'8%) 1' 8 300 28'9 30 ·0 (+3 '8%) 29'6 (+2'4%) 28'4 (-0 ' 17%) 2'0 300 34·8 35'0 (+0'6%) 34'9 (+0'3%) 33-4 (-4%) 2·5 300 45 ' 7 45'0 (-1 ' 5%) 45·8 (+0'2%) 43'9 (-3 '9%) 1·4 370 16'04 15·8 (-1 ' 5%) 15 ' 5 (-3'3%) 14'6 (-9%) 2 '0 370 32·0 31·7 (-0'9%) 31'9 (-0'3%) 30 ' 1 (-6%)
The pressure-expansion curves at large strains have been calculated by Crossland (1964) from the maximum and minimum shear stress-strain curves and compared with experimental curves, as for example in Figure 17. It yvill be seen that the agreement is reasonable. The ultimate pressures have been taken from these theoretical pressureexpansion curves and also calculated on the basis of the mean diameter formula (Appendix). 'Figure 22 shows the theoretical ultimate pressure based on the mean shear stress-strain data plotted against the diameter ratio K for 20, 160, 300 and 370°C with the experimental points included. Table 5 gives the experimental and calculated values of ultimate pressure; the numbers in brackets are the percentage differences compared with experimental values. It will be seen that both the mean diameter values of ultimate pressure and those computed from shear stress-strain data are in good agreement with the experimental data.
SO .--------,---------.---------r-~~----,
40 ~------~---------+-r~~~~~~----~
M
~5 ... " g 30 ~------~----7Yr-~---------+--------~
~ ::I ~ ~ Co
~ ~ 20 ~------~7L-------+---------+--------~ 'E 5
• experimental point 20°C • experimental points 300°C • experimental points 370°C
10 ~~~--~~------~---------+--------4
oL-______ -L ________ L-______ -L ______ ~
1·0 1·5 2·0 2·5 3·0 Diametral ratio K
Figure 22. Ultimate pressure of Vibrac cylinders calculated from torsion data.

148 B.Crossland, W.F .K.Kerr
Table 6. Theoretical and experimental values of initial yield pressure and of collapse pressure for mild steel EN3.
Diameter Temp. Experimental Calculated initial yield Experimental Calculated ratioK eC) initial yield pressure (tonf in-1) collapse pres- collapse
pressure maximum minimum sure (tonf in-1) pressure (tonf in-1 ) (tonf in-1)
1' 4 20 4 ·75 4 ·7 4'45 4·7 4'5 1·6 20 5·45 5 ' 85 5 '55 6'07 6 '3 1·8 20 6'5 6·64 6'3 7 ' 8 7 ·85 2'0 20 6·8 7 ' 2 6'8 9 '05 9·3 1'4 160 4'0 4 '6 4'35 4'2 4'5 1·8 160 6'2 6'5 6 ' 15 7'45 7 ' 85 1' 4 300 2'6 2'81 - -1·6 300 3·3 3·6 - -1·8 300 4'0 4 '09 - -
Mild Steel (EN3) The initial yield pressures based on the upper shear yield stresses given in Table 2 are shown for various temperatures in Figure 23, together with the experimental values, and these values are also listed in Table 6. The agreement is excellent though some influence of stress gradient on the upper yield stress might be expected according to Crossland (1964). Figure 24 shows the collapse pressures calculated on the plastic or lower shear yield stress for 20 to 160°C together with the experimental values. At higher temperatures it will be seen from Figure 11 there is no yielding at a constant
.. ~5
10r-------r-------~------._~--__.
20·C 90·C - -160·C
P~·~:.-
E ,. .., 300°C ~ ;' --- --~..:::.
~ 5~/ .... _ --! /r" ~ /. _----- - -'-f---37ifc .~ /~- -- • experimental points at 20·C :s Z·· • experimental points at 160·C
• experimental points at 300·C
5 Diametral ratio K
Figure 23. Initial yield pressure of EN3A cylinders at various temperatures.
,-.. .. ~5 .... c g
20·C 9Q·C 16~·C 10.--------Tlv~t.M~~-e~tic-~"V~------'
e
~sv ;. • experimental points 20·C
~ · "porim'r poID" 1 'O-C
0"----------'----------1.---------' I 1·5 2·0
Diametral ratio K
Figure 24. Collapse pressure of EN3A cylinders at 20 and 160°C.
~
Strength of thick-walled cylinders at elevated temperatures 149
value of the lower shear stress, and it is consequently not possible to calculate meaningful collapse pressures. From Figure 24 it will be seen that there is reasonable agreement between theory and experiment. Table 6 gives the experimental and computed values of collapse pressure.
The pressure-expansion curves at large strains have been computed from the maximum and minimum shear stress-strain curves and they are plotted for instance in Figure 19. From this figure it will be seen that there is exceptionally good agreement between the theoretical and experimental pressure-expansion curve in the region before failure. However, the cylinders failed at diametral strains well below the strain at the maximum or ultimate pressure. Consequently it cannot be expected that there will be good agreement between the calculated and experimental values of ultimate pressure. The method of calculating the pressure-expansion curve from shear stressstrain data is proved beyond reasonable doubt, but there is insufficient knowledge or data available to predict when fracture will occur. The equivalent shear strain at the bore at failure can be computed by the analysis given by Crossland (1964), and it is found to be very much less than the strains to failure in simple torsion given in Table 2.
The values of ultimate pressures computed from shear stress-strain data are compared with experimental values in Table 7 where the mean diameter values of ultimate pressure are also given. It will be seen that the errors are much greater than for Hykro and Vibrac but they are less for values based on the shear stress-strain data than for those calculated from the mean diameter formula which is based on tension data.
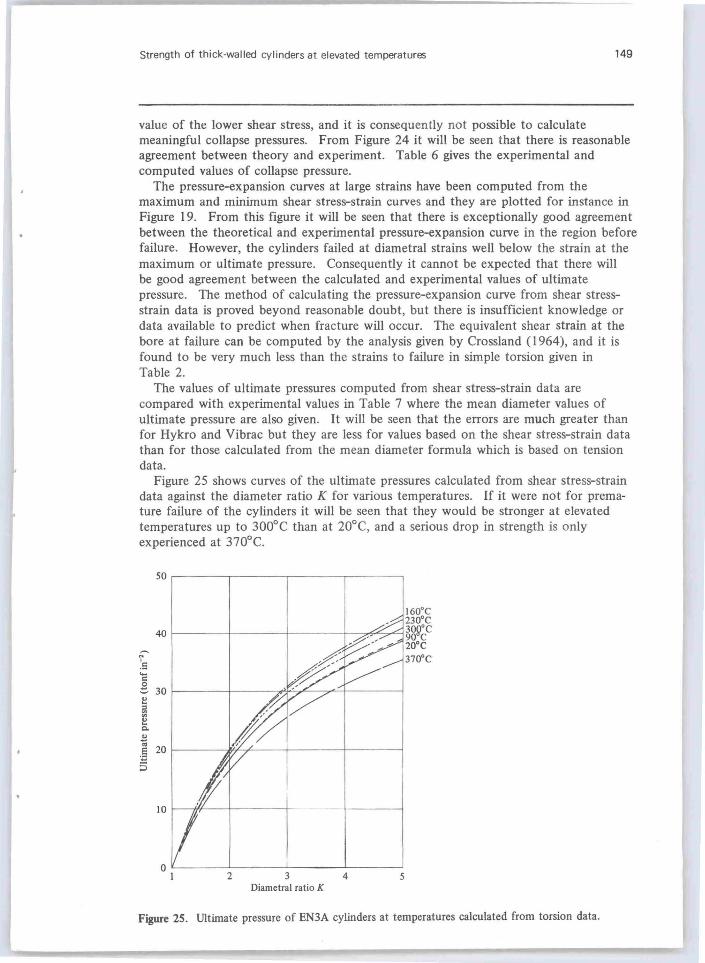
Figure 25 shows curves of the ultimate pressures calculated from shear stress-strain data against the diameter ratio K for various temperatures. If it were not for premature failure of the cylinders it will be seen that they would be stronger at elevated temperatures up to 300°C than at 20°C, and a serious drop in strength is only experienced at 370°C.
~
:5 ... c g ~ ii! ~ c.. E .. ] ::;
50r-------.-------.-------.-------~
40
30
20
IO
2 3 Diametral ratio K
4 5
Figure 25. Ultimate pressure of EN3A cylinders at temperatures calculated from torsion data.

150 B.Crossland, W.F.K.Kerr
Table 7. Theoretical and experimental values of ultimate pressure for mild steel EN3 .
Diameter Temp. Experimental . Calculated ultimate pressure (tonf in-1)
ratio K (oC) ultimate pres-based on shear stress-strain sure (tonf in-1 )
mean diameter maximum minimum
1'365 20 7'55 9'16(+21'3%) 1'4 20 8'6 9'9 (+15'1%) 9'26 (+ 7 ' 7%) 8·82 (+ 2'6%) 1'6 20 11'32 13'7 (+21%) 12'90 (+14%) 12'26 (+ 8'3%) 1'8 20 14 ' 72 17'0 (+15'5%) 16'05 (+ 9%) 15'21 (+ 3'3%) 2·0 20 17'3 19'8 (+14'4%) 18'8 (+ 8'7%) 17 ' 83 (+ 3%) 3'0 20 26'9 29'7 (+10'4%) 28 ' 8 (+ 7%) 27'34(+ 1'6%) 5'0 20 37·2 39 ·6 (+ 6'5%) 39 '8 (+ 7%) 37'78(+ 1'6%) 1'365 160 8'0-8'4 9'97 (+21'6%) 1'4 160 9'55 10·75 (+12'6%) 10 '0 (+ 5%) 9 ' 75(+ 2'1%) 1'8 160 15'8 18' 5 ( + 17 . 1 %) 17'38 (+10%) 16'88 (+ 6'9%) 1'365 300 7'70 10'3 (+30%) 1·4 300 9'08 11'1 (+22'2%) 9 ' 73 (+ 7 '2%) 9'49(+ 4'5%) 1' 6 300 12'4 15 ·4 (+24'2%) 13'45 (+ 7'8%) 13'11 (+ 5'7%) 1'8 300 14'6 19 '0 (+30%) 16'74 (+14'5%) 16'33 (+11'8%) 2'0 300 18'7 22'2 (+18'8%) 19'58(+ 4'7%) 19'12 (+ 2'3%) 3'0 300 26'1 33 ' 3 (+27'6%) 30'02 (+15%) 29'24 (+12%)
Conclusions From relaxation tests it would appear that creep is becoming of significance at 370°C for Hykro and more importantly so for Vibrac. In the case of EN3 there is significant relaxation even at 300°C, which is in agreement with creep work on a mild steel being carried out in Belfast.
The agreement between yield pressures and collapse pressures computed from shear stress-strain data and experimental values is excellent for all materials and temperatures. Again there is reasonable agreement between the theoretical pressure-expansion curves based on shear stress-strain data and the experimental curves. However, with EN3 most of the cylinders failed at strains well below those associated with the ultimate pressure.
For Vibrac and Hykro it was found that there was reasonable agreement at all temperatures between experimental values of ultimate pressures and those computed from shear stress-strain data or those based on the mean diameter formula. For EN3 cylinders the agreement between experimental values of ultimate pressures and those computed from shear stress-strain data is poor and the disagreement with values based on the mean diameter formula is even worse. The reason for this disagreement is that failure occurred on a rising pressure-expansion curve before reaching the peak value predicted by theory. The fmal fracture of materials is still not clearly understood and no method of predicting the strain to failure in a thick-walled cylinder has yet been established which explains these results.
The present work has continued to demonstrate the simplicity and desirability of using shear stress-strain data in the design of cylinders, and the simplicity of getting such data has also been demonstrated. It should be noted that it would be extremely difficult to get large strain tensile data at elevated temperature, as some means of measuring the diameter and radius of curvature of the neck would be necessary.
Acknowledgements. The authors would like to acknowledge the interest of Mr. W. R. D. Manning and Mr. R. B. Winn in this work. The assistance of Dr. W. J. Skelton and Mr. R. W. E. Shannon in some of this work is gratefully acknowledged. Thanks are also due to Mr. C. Ludlow for producing the graphs and figures.

Strength of thick-walled cylinders at elevated temperatures 151
The work was carried out in the Mechanical Engineering Laboratories of the Queen's University of Belfast, and thanks are due to the staff of the Departmental Workshop and in particular Mr. R. H. Agnew and Mr. R. Jack who assisted in the experimental work.
Appendix Elastic region The Lame analysis for a thick-walled closed-ended cylinder gives radial, tangential and axial stresses which can be interpreted as being equivalent to a shear stress of
P R; T----
- [(2 -I r2
together with a hydrostatic or volumetric tensile stress of
P am = [(2-1 .
Here P is the internal pressure, K = Ro/Rj is the ratio of the outer to the inner radius, and r is any intermediate radius.
The maximum shear stress occurs at the bore where r = Ri and yield will occur when
K2 T yield = [(2 - 1 P yield
or
([(2-1) Pyield = [(2 T yield·
Pyield is the pressure at initial yield. The diametral (hoop) strain in the elastic region will be
where E is Young's modulus and" is Poisson's ratio.
Collapse pressure If the material of which the cylinder is made yields at a constant shear stress then, when yield has spread to the outer diameter, straining will continue at constant pressure until the material begins to strain harden. The pressure required to just cause complete yielding is known as the collapse pressure, though it is sometimes wrongly termed ballooning pressure, which might give the impression that local instability or local bulging was occurring, which in fact does not occur until the ultimate pressure is exceeded. The collapse pressure can be shown to be
Pc = Tpy In [(2
where Tpy is the shear stress at plastic yield.
Ultimate pressure When the pressure is raised above the collapse pressure the material is becoming strain hardened while the diameter ratio K is decreasing due to wall thinning. Finally, the weakening effect due to reduction of K exceeds the strengthening effect due to work hardening, and the eqUilibrium pressure passes through a maximum which is termed the ultimate pressure. The analysis of this regime is dealt with fully by Crossland,

152 B.Crossland. W.F.K.Kerr
Jorgensen and Bones- (1958), Crossland (1964) and Manning (1945) and space does not permit its consideration here.
Several empirical equations have been suggested including that due to Faupel (1956) which is expressed in the form
Pull = 20py (2 _ Opy) inK .J3 0Ull
and the mean diameter formula
K-l Pult = 20 ult K + I .
Here Pult is the ultimate pressure, and 0Ull the ultimate tensile stress.
References Bridgman, P. W., 1952, Studies in Large Plastic Flow and Fracture (McGraw-Hill Book Co., New
York and London). Cook, G., 1934, Proc. Inst. Mech. Engrs., 126,407-455. Cook, G., 1938, Institution of Engineers and Shipbuilders in Scotland, 81,371-431. Crossland, B., 1964, The Design of Thick-walled Closed-ended Cylinders Based on Torsion Data,
Welding Research Council Bulletin No.94. Crossland, B., 1965, Proc. Inst. Mech. Engrs., 180,243-254. Crossland, B., and Austin, B. A., 1965, Proc. Inst. Mech. Engrs., 180, 118-133. Crossland, B., and Bones, J. A., 1958, Proc. Inst. Mech. Engrs., 172,777-804. Crossland, B., Jorgensen, S. H., and Bones, J. A., 1958, Trans. Amer. Soc. Mech. Engrs., 81,95-114. Faupel, J. H., 1956, Trans. Amer. Soc. Mech. Engrs., 78, 1031-1061. Manning, W. RD., 1945, Engineering, 159, 101-104. Morrison, J. L. M., 1948, Proc. Inst. Mech. Engrs., 159,81-94. Turner, L. B., 1909, Transactions of the Cambridge Philosophical Society, 21, 377-396.
P a Pion publication· printed in Great Bri tain
•