THE STATUS OF THE NURSING WORKFORCE IN MONTANA Market... · This tight labor market suggests it is...
14
THE STATUS OF THE NURSING WORKFORCE IN MONTANA A Summary of the Results from the National Council State Board of Nursing 2015 Survey
Transcript of THE STATUS OF THE NURSING WORKFORCE IN MONTANA Market... · This tight labor market suggests it is...

THE STATUS OF THE NURSING WORKFORCE IN MONTANA
A Summary of the Results from the National Council State Board of Nursing 2015 Survey

THE STATUS OF THE NURSING WORKFORCE IN MONTANA
A Summary of the Results from the National Council State Board of Nursing 2015 Survey
STATE OF MONTANASteve Bullock, Governor
Mike Cooney, Lieutenant Governor
MONTANA DEPARTMENT OF LABOR & INDUSTRYPam Bucy, Commissioner
AUTHORSAmy Watson, Economist
Emily Klungtvedt, Economist
PRODUCED BYResearch & Analysis Bureau
P.O. Box 1728Helena, MT 59624-1728
(406) 444-2430www.lmi.mt.gov
NOVEMBER 30, 2016
ABOUT THE NCSBN 2015 SURVEYThe National Workforce Survey, conducted by the National Council of State Boards of Nursing and the National Forum of State Nursing Workforce Centers, is a national-level survey that is focused on providing an overview of the nursing workforce. The survey is sent out to a random sample of individuals that hold either an active registered nurse (RN) license or an active licensed practical/vocational nurse (LPN/VN) license. In Montana, 1,965 RN licensees were mailed a survey, and 832 responded. Of the 1,516 Montana LPN/VN licensees that were mailed a survey, 594 responded. This analysis focuses on the responses of those Montana licensee respondents.
This analysis weighted the national data by region and age in order to adjust the sample to appropriately represent the Montana nursing population. The national results are also weighted, but the calculations differ in methodology. Caution should be used when directly comparing results from this report and the national results published in the Journal of Nursing Regulation due to these methodology differences.

3 Montana Department of Labor & Industry
The development of a highly-skilled nursing workforce is critical to ensuring a safe and effective health care system in Montana. Currently, there are over 15,000 actively licensed registered nurses (RN), and 2,800 actively licensed practical nurses (LPN) in the state. Understanding the demographics of these workers is essential to predicting future workforce needs. To provide this insight, the National Council State Board of Nursing (NCSBN) conducted a national survey in 2015 on the current RN and LPN workforce. The survey includes information on educational attainment, employment, earnings, and other demographic information. This information can be used to help guide the discussion of whether the nursing supply is sufficient to meet demand in the evolving healthcare environment.
HIGHLIGHTS FROM THE SURVEY• Montana’s LPN and RN labor markets are currently tighter than the national average. Only 1.3% of
Montana’s RNs and 2.9% of Montana’s LPNs report that they are unemployed and actively seeking work, compared to 2.3% and 5.1% nationally. This tight labor market suggests it is more difficult for Montana employers to find the nurses they need to provide healthcare services.
• While Montana’s LPN and RN populations are aging, Montana’s nurses are similar in age to the national average. This suggests that the potential nursing shortage in Montana will not get worse relative to the U.S. shortage overtime strictly due to a retiring population.
• Most RNs in Montana have a bachelor’s degree, and bachelor’s degrees appear to be becoming more popular over time. Bachelor degree attainment is highest among nurses under 30.
• There is a correlation between educational attainment and earnings. However, the difference in earnings between associate and bachelor’s degree RNs is relatively small.
• Capacity to train a qualified nursing workforce is essential to combat a nursing shortage in Montana. Nursing faculty typically hold a Master’s degree in nursing. Despite higher education levels, the median wage for nursing faculty is the same as the median wage reported by Bachelor’s and Associate’s degree RN staff nurses. Nursing faculty are paid significantly less than other occupations that typically employ Master’s degree RNs, making it difficult to recruit and retain qualified faculty.
• A little more than 96% of nurses are white, compared to 92% of the Montana population. Only about 3% of nurses identify as American Indian, compared to 8% of the Montana population. The racial disparity indicated by the survey suggests schools and health centers may wish to consider increasing recruitment of American Indians into nursing, particularly in tribal communities where having American Indian nurses can help build trust with patients and may lead to better health outcomes.
THE STATUS OF THE NURSING WORKFORCE IN MONTANA

The Status of the Nursing Workforce in Montana 4
DEMOGRAPHICS REGISTERED NURSES AND LICENSED PRACTICAL NURSES
The Montana Department of Labor & Industry projects there will be an average of 445 additional registered nursing (RN) jobs in Montana every year through 2025. Licensed practical nursing (LPN) is also estimated to experience large employment growth over the next ten years, adding 107 jobs per year through 2025. Some of this growth in nursing occupations is due to an increase in the demand for nursing as Montana’s population continues to age and demand more services. However, over half of the projected employment needs in nursing are estimated to occur because of replacement needs. The Bureau of Labor Statistics (BLS) estimates 23.6% of RNs and 28.5% of LPNs will retire or otherwise leave their job over the next ten years.
In Montana, the average age of registered nurses is about 49 years old, which is roughly equal to the average age of RNs across the U.S.1 In general, the age distribution of RNs in Montana is similar to the nation. LPNs are slightly older in Montana than in the U.S. The median age of LPNs in Montana is 51 years old, compared to 48 nationally. Figure 1 compares the age distribution of Montana RNs and LPNs to the nation using the 2015 survey data collected by NCSBN.
FIGURE 1Age Distribution of Actively Licensed LPNs and RNs, Montana vs. U.S.
Notes: Montana estimates displayed in white. Error bars display 95% confidence limits on Montana estimates. Confidence limits on national estimates were not available.Source: National Council State Board of Nursing 2015 Survey. Montana estimates compiled by Montana Department of Labor & Industry.
The Bureau of Labor Statistics (BLS) estimates 23.6% of RNs and 28.5% of LPNs will retire or otherwise leave
their job over the next ten years.

5 Montana Department of Labor & Industry
The only statistically significant difference in Montana’s RN age distribution when compared to the U.S. is that Montana has a slightly higher percentage of RNs over 60 years old, and a smaller percentage of RNs between 50 and 59.2 Montana has a larger percentage of LPNs over the age of 60, and a smaller percentage between the ages of 30 and 49 compared to the U.S. The similarities between the age of RNs and LPNs in Montana and the U.S. suggest that Montana nurses will retire at similar rates to the national average.
Results from the survey suggest that the racial composition of the nursing workforce is different from the racial composition of the state. A little over 96% of RNs and LPNs are white, 3% are American Indian, and 2-3% responded with some other race.3 In comparison, 92% of Montana residents are white, 8% are American Indian, and 3% are all other.4 The difference between white and American Indian as a percent of the nursing workforce compared to all of Montana is statistically different. Results are in Figure 2.
Differences in the racial composition of the nursing workforce compared to all residents in Montana may have an effect on patient outcomes. Having American Indian nurses provide services in tribal communities helps build trust with the patient and leads to better care. The racial disparity indicated by the survey suggest that schools and health centers may wish to consider programs to increase recruiting of American Indians into nursing professions.
FIGURE 2Racial Composition of RNs and LPNs compared to Montana’s Population
Note: Error bars display 95% confidence limits. Source: National Council State Board of Nursing 2015 Survey. Montana estimates compiled by Montana Department of Labor & Industry. Montana racial composition from the 2014 American Community Survey 5-Year Estimates, U.S. Census.

The Status of the Nursing Workforce in Montana 6
EDUCATION REGISTERED NURSING
The NCSBN survey provides new insight into the academic progression of nurses in Montana. Nationally, there has been a push towards RNs obtaining a bachelor’s degree. This year was the first year the BLS identified a bachelor’s degree as the typical degree held by RNs. In the United States, 46.5% of RNs hold a bachelor’s degree, compared to 36.7% with an associate degree.5 The NCSBN survey data suggests the trend towards bachelor’s degree nursing education is occurring in Montana. In fact, Montana is estimated to have more RNs entering nursing with a BSN than the national average, with over half (53%) of actively licensed RNs in Montana having entered their nursing career with a bachelor’s in nursing (BSN). Figure 3 shows the initial nursing degree earned by Montana RNs as a percentage of all licensed RNs in Montana.
The prevalence of bachelor’s degrees as the typical entry-level degree for RNs is a more recent development in Montana. An estimated 75% of RNs under 30 years old hold a BSN as their initial nursing degree, compared to only 41% of RNs 50 and older.
While the percentage of RNs entering nursing with BSN has increased among younger nurses, the percent entering with an associate degree in nursing (ASN) remains more consistent among age cohorts. Twenty-two percent under 30 started with an associate degree compared to 31% for RNs between 30 and 50, and 35% for those over 50. Nurses over 50 are more likely to have entered nursing with a certificate or diploma than nurses under 50.
The NCSBN survey data suggests nurses are entering the field with higher education levels; however, once they obtain their license, most do not achieve a higher degree in nursing. The academic progression of RNs in Montana is displayed in Figure 4 across all age cohorts.
In general, most licensed RNs who obtained an ASN or BSN as their initial degree still hold that nursing degree as their highest level of education. The NCSBN survey data suggests about 18% of licensed RNs in Montana began their career with an ASN and have since progressed to achieve a BSN. Another 8% obtained a Master’s in nursing, or higher. About 59% of licensed RNs who entered their career with an ASN still hold that degree as their highest education level. By age, younger RNs who enter nursing with an ASN appear to be more likely to pursue higher education.
FIGURE 3First Degree Earned by RNs Working in Montana
Source: National Council State Board of Nursing 2015 Survey. MT estimates compiled by Montana Department of Labor & Industry.
Approximately 53% of registered nurses in Montana entered the
profession with a bachelor’s degree.

7 Montana Department of Labor & Industry
A bachelor’s degree is the most common degree held by registered nurses when they entered the career. Most of these nurses (83%) have not obtained a nursing degree higher than a bachelor’s degree. Another 11% continued on to receive a master’s degree in nursing, and 4% hold a master’s degree in another field or a doctorate degree in nursing or other field as their highest degree. Most nurses who qualified for their first nursing license with a vocational or practical nursing certificate and are now working as RNs hold an ASN as their highest level of education (71%). Another 22% of these nurses were able to obtain a BSN.
The survey results suggest a bachelor’s degree in nursing is the most common level of education achieved by RNs in three of five regions in Montana. Figure 5 shows the educational attainment of RNs in Montana by region.
FIGURE 4Academic Progression of RNs by Initial Nursing Degree Type
Source: National Council State Board of Nursing 2015 Survey. Montana estimates compiled by Montana Department of Labor & Industry.
An estimated 26% of registered nurses in
Montana began their RN career with an ASN and have since achieved a BSN degree or higher.
FIGURE 5Highest Degree of RNs in Montana by Region
Source: National Council State Board of Nursing 2015 Survey. Montana estimates compiled by Montana Department of Labor & Industry.

The Status of the Nursing Workforce in Montana 8
FIGURE 6Highest Degree by Age Category
Note: Degrees are Associate in Nursing and vocational/practical nursing certificate.Source: National Council State Board of Nursing 2015 Survey. Montana estimates compiled by Montana Department of Labor & Industry.
While all five regions show a higher percentage of BSN than ASN RNs, the difference is not statistically significant in the North Central or Eastern regions. The lack of statistical significance is partly because smaller populations in the North Central and Eastern regions make it more difficult to generate statistically significant estimates. The less populated regions of the state are also estimated to have more severe RN worker shortage and increased difficulty in accessing nursing education, making it more likely RNs in those regions have lower education levels. The data suggest more populated regions that are in closer proximity to educational institutions have a more educated RN workforce.
LICENSED PRACTICAL NURSING
Around half of all LPNs in Montana hold a vocational or practical nursing certificate as their highest level of education. However, the NCSBN survey data suggests it is becoming more common for LPNs to receive an associate degree. The data suggests younger LPNs are more likely to have obtained an associate degree than older LPNs.
Figure 6 shows the educational attainment of LPNs by age category.
The largest difference in educational attainment of LPNs is observed when comparing LPNs over 50 years old, to those under 50. Over 70% of all LPNs over 50 hold a certificate, compared to 31% of those under 50. For LPNs under 50, the difference between the percentage of LPNs holding an associate degree versus a certificate is not statistically different from each other.
Licensed practical nurses appear to be pursuing higher levels of education to enter the profession. However, once licensed, LPNs do not tend to achieve higher education while remaining an LPN. About 83% of LPNs that entered their career with a certificate still hold that certificate as their highest level of education. Similarly, about 75% of LPNs who entered with an associate degree still hold that degree. There are not any associate degree LPNs who go on to achieve a bachelor’s degree in nursing and remain a licensed practical nurse. These individuals likely become a registered nurse and no longer need to maintain a license in practical nursing.
9 Montana Department of Labor & Industry
EMPLOYMENT REGISTERED NURSES
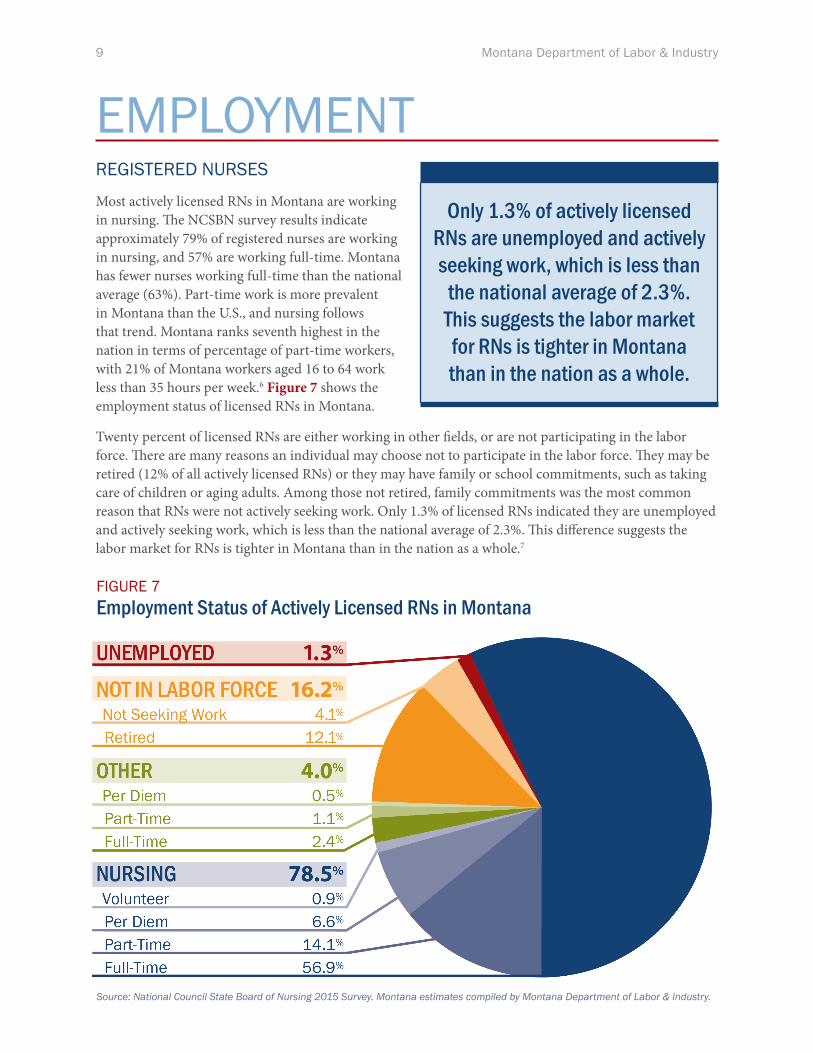
Most actively licensed RNs in Montana are working in nursing. The NCSBN survey results indicate approximately 79% of registered nurses are working in nursing, and 57% are working full-time. Montana has fewer nurses working full-time than the national average (63%). Part-time work is more prevalent in Montana than the U.S., and nursing follows that trend. Montana ranks seventh highest in the nation in terms of percentage of part-time workers, with 21% of Montana workers aged 16 to 64 work less than 35 hours per week.6 Figure 7 shows the employment status of licensed RNs in Montana.
Twenty percent of licensed RNs are either working in other fields, or are not participating in the labor force. There are many reasons an individual may choose not to participate in the labor force. They may be retired (12% of all actively licensed RNs) or they may have family or school commitments, such as taking care of children or aging adults. Among those not retired, family commitments was the most common reason that RNs were not actively seeking work. Only 1.3% of licensed RNs indicated they are unemployed and actively seeking work, which is less than the national average of 2.3%. This difference suggests the labor market for RNs is tighter in Montana than in the nation as a whole.7
FIGURE 7Employment Status of Actively Licensed RNs in Montana
Source: National Council State Board of Nursing 2015 Survey. Montana estimates compiled by Montana Department of Labor & Industry.
Only 1.3% of actively licensed RNs are unemployed and actively seeking work, which is less than
the national average of 2.3%. This suggests the labor market for RNs is tighter in Montana than in the nation as a whole.

The Status of the Nursing Workforce in Montana 10
Even though there has been an increase in the number of RNs obtaining bachelor’s degrees, there is not a statistically significant difference in employment between BSNs and ASN nurses. Across all levels of education, roughly half of RNs are working. For workers across all occupations, workers with greater education levels typically have higher likelihood of being employed. The lack of difference in employment levels across nursing occupations suggests that worker shortages result in all nurses being employed, regardless of education levels. However, it could also suggest that employers do not perceive major differences in skill levels between BNS and ASN educated nurses.
Figure 8 shows the occupation and wages of licensed RNs by educational attainment. The most common occupation among ASN and BSN RNs is staff nurse. An estimated 68% of RNs who are working in nursing are working as a staff nurse. Most RN staff nurses work in hospitals. Over half of staff nurses hold a bachelor’s degree in nursing (58%), another quarter (26%) hold an associate degree.
Both BSN and ASN staff nurses reported a median salary of $50,000. Staff nurses with a master’s degree make more, reporting a median salary of $62,000. Increased education does correlate with increase in wages; however, the
difference is minimal between an associate and bachelor’s degree, and is much greater between a bachelor’s and master’s degree.
Advanced practice registered nurses (APRNs) have the highest median wage ($91,000) across all nursing occupations. The majority (70%) of APRNs hold a master’s degree in nursing. Most RN nursing faculty hold a master’s degree (57%), but their reported salaries are much less competitive than APRNs’ salaries or master’s degree staff nurses’ salaries, at $52,000. Nursing faculty have the lowest reported salary among occupations that typically require a Master’s degree in nursing, making it difficult to recruit and retain a qualified faculty.
FIGURE 8Occupation and Wages of Licensed RNs in Montana by Highest Degree
ASSOCIATE RN BACHELOR’S RN MASTER’S RN
Average Wage $ 51,000 $ 53,000 $ 68,000
Top 3 Occupations, Median Wage, and Percent Employed
#1. Staff Nurse $50,000 (72%)
#1. Staff Nurse $50,000 (74%)
#1. APRN $91,000 (50%)
#2. Case Manager $53,000 (9%)
#2. Nurse Manager $66,700 (7%)
#2. Nurse Faculty $52,000 (16%)
#3. Nurse Manager $58,200 (6%)
#3. Case Manager $52,000 (6%)
#3. Staff Nurse $62,000 (12%)
Source: National Council State Board of Nursing 2015 Survey, compiled by Montana Department of Labor & Industry.
Increased education correlates with an increase in salary. While
the difference is small between an associate degree ($51,000) and a bachelor’s degree ($53,000),
those with a master’s degree report a median salary of $68,000.
11 Montana Department of Labor & Industry
LICENSED PRACTICAL NURSING
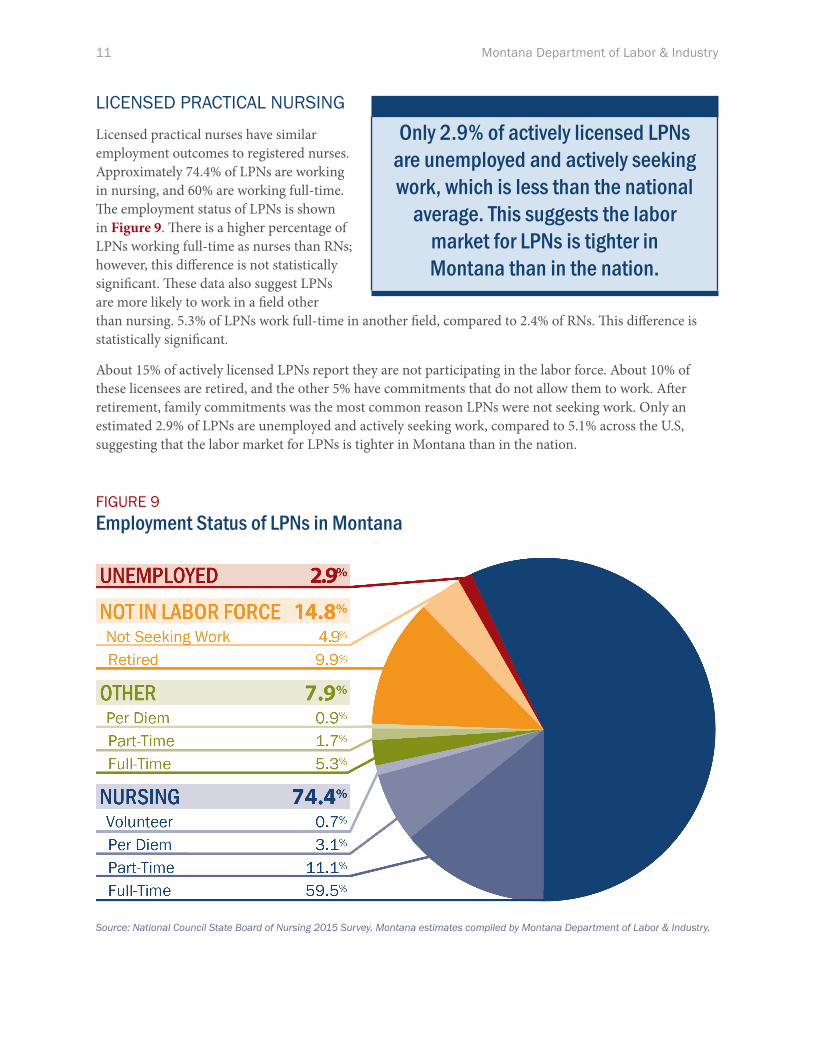
Licensed practical nurses have similar employment outcomes to registered nurses. Approximately 74.4% of LPNs are working in nursing, and 60% are working full-time. The employment status of LPNs is shown in Figure 9. There is a higher percentage of LPNs working full-time as nurses than RNs; however, this difference is not statistically significant. These data also suggest LPNs are more likely to work in a field other than nursing. 5.3% of LPNs work full-time in another field, compared to 2.4% of RNs. This difference is statistically significant.
About 15% of actively licensed LPNs report they are not participating in the labor force. About 10% of these licensees are retired, and the other 5% have commitments that do not allow them to work. After retirement, family commitments was the most common reason LPNs were not seeking work. Only an estimated 2.9% of LPNs are unemployed and actively seeking work, compared to 5.1% across the U.S, suggesting that the labor market for LPNs is tighter in Montana than in the nation.
FIGURE 9Employment Status of LPNs in Montana
Source: National Council State Board of Nursing 2015 Survey. Montana estimates compiled by Montana Department of Labor & Industry.
Only 2.9% of actively licensed LPNs are unemployed and actively seeking work, which is less than the national
average. This suggests the labor market for LPNs is tighter in Montana than in the nation.

The Status of the Nursing Workforce in Montana 12
Most LPNs are working as staff nurses and making a median wage of $36,000. Figure 10 shows the percent of LPNs employed by occupation, and the median salary and hours worked reported by LPNs in those occupations.
FIGURE 10Salary and Hours Worked per Week of Primary Job for LPNs in Montana
Primary Job Title Percent Employed Median Salary Median Hours Worked
Clinical Nurse Leader 2.6% +/-1.6% $50,000 40
Nurse Faculty 5.7% +/-2.8% $35,000 37
Nurse Manager 4.4% +/-2.2% $43,860 40
Other-Health Related 7.2% +/-2.7% $39,000 40
Staff Nurse 76.4% +/-4.8% $36,000 40Notes: Occupations with less than 10 responses are excluded. Standard error shown next to percent employed.Source: National Council State Board of Nursing 2015 Survey compiled by Montana Department of Labor & Industry.
Both RNs and LPNs primarily work as staff nurses. The main difference between the two license types is not in their primary job, but rather in their job setting. While most RNs work in hospitals (50%), LPN staff nurses work in a variety of different settings. The most common places for LPNs to work is in an ambulatory care setting (22%), nursing home, or extended care facility (21%). Only about 14% of LPNs report working in a hospital. Figure 11 shows LPN employment by primary setting.
FIGURE 11LPN Primary Employment Setting
Source: National Council State Board of Nursing 2015 Survey. Montana estimates compiled by Montana Department of Labor & Industry.

13 Montana Department of Labor & Industry
CONCLUSION Understanding the supply of RNs and LPNs is important in a time where the demand for nurses is expected to grow rapidly and the unemployment rate for these licensees is already very low. The results from the National Council State Board of Nursing’s survey have provided new insight into the status of Montana nursing workforce. The survey suggests Montana’s nursing labor market is tighter than the national average, meaning it is more difficult for employers to find the nurses they need to continue to provide healthcare services to Montana’s aging population.
A critical element to addressing the worker shortage is to ensure there are qualified faculty available to train future nurses. The survey shows Master’s degree RN nursing faculty report a similar median salary to ASN and BSN staff nurses, despite higher educational attainment. The discrepancy between wages of nursing faculty and other occupations requiring similar levels of education
make it difficult to recruit and retain qualified faculty. Although RNs are investing in higher education, they are not always being compensated for this investment. For example, bachelor’s degree attainment of RNs is a recent trend, yet both BSN and ASN staff nurses report a median salary of $50,000.
The racial composition of the nursing workforce is also noteworthy as American Indians only make up 3% of all RNs and LPNs, but 8% of all Montana residents. Because a difference in racial composition may have an effect on patient outcomes, the results suggest it may be beneficial to focus on recruiting American Indians into health care professions. This information of the supply of RNs and LPNs will continue to be important as Montana looks for ways to train a highly-skilled nursing workforce in the most efficient way.
ENDNOTES 1 The National Council of State Board of Nursing
2015 Survey indicates the average age reported by RNs across the U.S. was 48.8, compared to 48.4 in Montana as of 3/11/16 according to licensure data.
2 The confidence limits were not available for the national data in Figure 1. After considering the confidence limits on the national data, there may not be a statistically significant difference between the U.S and Montana distribution for RNs 50 years old and older.
3 Percentages sum to over 100% because respondents could choose more than one race.
4 2014 American Community Survey 5-Year Estimates, U.S. Census Bureau
5 For a complete list of educational attainment by occupation used by the BLS to determine typical education requirements, please visit: http://www.bls.gov/emp/ep_table_111.htm
6 Labor Day Report 2016. Montana Department of Labor & Industry, Research & Analysis Bureau. lmi.mt.gov/Portals/135/Publications/LMI-Pubs/Labor%20Market%20Publications/LDR16.pdf
7 Confidence limits were not available for national statistics. The national estimate of unemployed RNs seeking work lies outside the 95% confidence limits for the Montana estimate.

20 copies of this public document were produced at an estimated cost of $0.97 per copy, for a total cost of $19.43, which includes $19.43 for printing and $0.00 for distribution.
Research and Analysis BureauP. O. Box 1728
Helena, MT 59624-1728Phone: (406) 444-2430
Toll-free: (800) 541-3904www.lmi.mt.gov