The State of the Columbia River Basin · The State of the Columbia River Basin ... Canadian...
21
Northwest Power and Conservation Council The State of the Columbia River Basin To Congress and Citizens of the Pacific Northwest October 1, 2013 - September 30, 2014 FISCAL YEAR 2014 ANNUAL REPORT
Transcript of The State of the Columbia River Basin · The State of the Columbia River Basin ... Canadian...

Northwest Power and Conservation Council
Northwest Power and Conservation Council
The State of the Columbia River Basin
To Congress and Citizens of the Pacific Northwest October 1, 2013 - September 30, 2014
FISCAL YEAR 2014 ANNUAL REPORT
Submitted to the
Committee on Energy and Natural ResourcesUnited States Senate
Committee on Energy and CommerceUnited States House of Representatives
and
Committee on Natural ResourcesUnited States House of Representatives
851 S.W. Sixth AvenueSuite 1100
Portland, Oregon 97204503-222-5161
Toll Free: 800-452-5161www.nwcouncil.org
The Northwest Power and Conservation Council was established pursuant to the Pacific Northwest Electric Power Planning and Conservation Act of 1980 (Public Law 96-501) by the states of Idaho, Montana, Oregon, and Washington. The Act authorized the Council to serve as a comprehensive planning agency for energy policy and fish and wildlife policy in the Columbia River Basin and to inform the public about energy and fish and wildlife issues and involve the public in decision-making.
This annual report has been developed pursuant to Section 4(h)(12)(A) of the Northwest Power Act. The Council’s bylaws, which include its organizational structure, practices, and procedures, are available to the public at www.nwcouncil.org/about/policies/bylaws.
January 2015
To members of Congress and citizens of the Pacific Northwest:
In the 1980 Northwest Power Act, Congress granted the states a major role in planning future energy resources and protecting fish and wildlife affected by the Columbia River hydroelectric system. Today, as the Council continues to fulfill that mandate, we can look back on a series of accomplishments that have made the Pacific Northwest a national leader in the efficient use of electricity and in protecting and rebuilding the region’s signature fish and wildlife, including threatened and endangered species.
Thanks to the efforts of the Bonneville Power Administration, the region’s public and private electric utilities, and evolving federal energy standards, the region has improved energy efficiency by nearly 5,600 average megawatts — enough electricity for five cities the size of Seattle — at a cost that is about four times less than the cost of power from new generating plants. Efficiency is now the Pacific Northwest’s second largest energy source, and growing.
Meanwhile, the excellent salmon and steelhead returns of 2013 were followed by another remarkable year in 2014 — a record return since counting began at Bonneville Dam in 1938. Working with our regional partners, we believe that the science-based projects funded by Bonneville customers to implement our Columbia River Basin Fish and Wildlife Program, from improved passage at the dams to enhanced habitat and effective use of hatcheries, have contributed to the recent positive trend.
The Council is proud to submit its 2014 Annual Report to Congress. We hope that after reviewing it you’ll share our enthusiasm for the work we do to strengthen the nation’s cleanest, most efficient energy system while protecting fish and wildlife resources.
Stephen L. Crow, Executive Director
Phil Rockefeller Chair
Washington
Tom Karier Washington
Henry Lorenzen Oregon
Bill Bradbury Oregon
W. Bill Booth Vice Chair
Idaho
James Yost Idaho
Pat Smith Montana
Jennifer Anders Montana
PAGE 4 > 2014 ANNUAL REPORT TO CONGRESS > COLUMBIA RIVER BASIN COLUMBIA RIVER BASIN < 2014 ANNUAL REPORT TO CONGRESS < PAGE 5
Artificial Production . . . . . . . . . . . . . . . . . . . . . . . . . . . . . . . . . . . . . . . . . . . . . . . .23
Snake River sockeye . . . . . . . . . . . . . . . . . . . . . . . . . . . . . . . . . . . . . . . . . . . . . 23
Kootenai white sturgeon and burbot . . . . . . . . . . . . . . . . . . . . . . . . . . . . . . . 23
Lake Roosevelt kokanee . . . . . . . . . . . . . . . . . . . . . . . . . . . . . . . . . . . . . . . . . 24
Walla Walla spring Chinook . . . . . . . . . . . . . . . . . . . . . . . . . . . . . . . . . . . . . . . 24
Research . . . . . . . . . . . . . . . . . . . . . . . . . . . . . . . . . . . . . . . . . . . . . . . . . . . . . . . . . .24
Review of proposed 10-year spill test . . . . . . . . . . . . . . . . . . . . . . . . . . . . . . . 24
Ocean science forum . . . . . . . . . . . . . . . . . . . . . . . . . . . . . . . . . . . . . . . . . . . 25
Effectiveness of actions taken under the fish and wildlife program . . . . . . . . .26
Council Public Affairs Overview . . . . . . . . . . . . . . . . . . . . . . . . . . . . . . . . . . . 28
Outreach, information, and communication . . . . . . . . . . . . . . . . . . . . . . . . . . . 28
Canadian relations . . . . . . . . . . . . . . . . . . . . . . . . . . . . . . . . . . . . . . . . . . . . . . . . . 29
Selected news articles that mention the Council . . . . . . . . . . . . . . . . . . . . . 30
Council Administrative Overview . . . . . . . . . . . . . . . . . . . . . . . . . . . . . . . . . . 32
Funding . . . . . . . . . . . . . . . . . . . . . . . . . . . . . . . . . . . . . . . . . . . . . . . . . . . . . . . . . . . 32
Fiscal Year 2016 budget and Fiscal Year 2015 revisions . . . . . . . . . . . . . . . . . . 32
Background of the Council . . . . . . . . . . . . . . . . . . . . . . . . . . . . . . . . . . . . . . . . . .33
Organization . . . . . . . . . . . . . . . . . . . . . . . . . . . . . . . . . . . . . . . . . . . . . . . . . . . 33
History . . . . . . . . . . . . . . . . . . . . . . . . . . . . . . . . . . . . . . . . . . . . . . . . . . . . . . . . . 34
Council Meetings, Fiscal Year 2014 . . . . . . . . . . . . . . . . . . . . . . . . . . . . . . . . . 35
Comments of the Bonneville Power Administration . . . . . . . . . . . . . . . . . . . 36
Council members and offices, Fiscal Year 2014 . . . . . . . . . . . . . . . . . . . . . . 38
23
24
28
32
35
ContentsEnergy, Fish, Wildlife: The State of the Columbia River Basin, 2014 . . . . . . . 6
Council Energy Overview . . . . . . . . . . . . . . . . . . . . . . . . . . . . . . . . . . . . . . . . . 11
The Seventh Northwest Power Plan . . . . . . . . . . . . . . . . . . . . . . . . . . . . . . . . . . . .11
Energy Efficiency . . . . . . . . . . . . . . . . . . . . . . . . . . . . . . . . . . . . . . . . . . . . . . . . . . .12 The second-largest power resource in the Northwest . . . . . . . . . . . . . . . . . . . . 12
Impact on electricity rates . . . . . . . . . . . . . . . . . . . . . . . . . . . . . . . . . . . . . . . . . . 13
Federal codes and standards . . . . . . . . . . . . . . . . . . . . . . . . . . . . . . . . . . . . . . . . 13
Energy Efficiency Funding . . . . . . . . . . . . . . . . . . . . . . . . . . . . . . . . . . . . . . . . 14
Regional Technical Forum . . . . . . . . . . . . . . . . . . . . . . . . . . . . . . . . . . . . . . . . 14
NEEA’s strategic and business plans . . . . . . . . . . . . . . . . . . . . . . . . . . . . . . . . 14
Power Planning . . . . . . . . . . . . . . . . . . . . . . . . . . . . . . . . . . . . . . . . . . . . . . . . . . . .15
EPA’s carbon-reduction rule . . . . . . . . . . . . . . . . . . . . . . . . . . . . . . . . . . . . . . 15
Regional Load Growth . . . . . . . . . . . . . . . . . . . . . . . . . . . . . . . . . . . . . . . . . . . 16
Analysis of power shortage risk . . . . . . . . . . . . . . . . . . . . . . . . . . . . . . . . . . . . 16
Natural gas price forecast . . . . . . . . . . . . . . . . . . . . . . . . . . . . . . . . . . . . . . . . 17
Future cost of nuclear power . . . . . . . . . . . . . . . . . . . . . . . . . . . . . . . . . . . . . 17
State renewable resource portfolio standards . . . . . . . . . . . . . . . . . . . . . . . 17
Council Fish and Wildlife Overview . . . . . . . . . . . . . . . . . . . . . . . . . . . . . . . . . 18
The Columbia River Basin Fish and Wildlife Program . . . . . . . . . . . . . . . . . . . . .18
2014 Program amendment . . . . . . . . . . . . . . . . . . . . . . . . . . . . . . . . . . . . . . . 18
Bonneville Power Administration fish and wildlife costs . . . . . . . . . . . . . . . . 19
Geographic review projects . . . . . . . . . . . . . . . . . . . . . . . . . . . . . . . . . . . . . . 23
0611
15
18

PAGE 6 > 2014 ANNUAL REPORT TO CONGRESS > COLUMBIA RIVER BASIN COLUMBIA RIVER BASIN < 2014 ANNUAL REPORT TO CONGRESS < PAGE 7
The Columbia pours 192 million acre-feet of water into the Pacific Ocean on average every year. That’s 57 cubic miles, or nearly half the volume of Lake Erie.
This wealth of water descends through the river’s mostly deep and rocky canyon to the ocean at more than two feet per mile. The volume, geology, and descent make the Columbia one of the world’s premier hydropower rivers, and the combination of clear, cold water, annual snowmelt-driven freshet, and broad geographic diversity of its many tributaries make the Columbia also one of the world’s great salmon and steelhead rivers.
In all, 14 multipurpose hydroelectric dams span the Columbia River mainstem (11 in the United States), and many more are located on Columbia tributaries. In an average water year, dams in the American part of the Columbia River Basin provide more than 16,000 average megawatts of carbon-free, low-cost, renewable electricity to consumers in the Pacific Northwest states and as far south as Arizona and southern California. Expressed as
power consumption, that’s enough for about 13 cities the size of Seattle.
The Columbia supports ocean-going fish including six species of Pacific salmon plus sturgeon and lamprey, many species of cold-water and warm-water resident fish, and abundant species of wildlife. Dams on the Columbia and its tributaries support commercial and recreational navigation as far as 450 miles inland from the ocean, irrigation of more than 3 million acres, and flood control for some 2 million people.
The Columbia is a unique river system, as habitat for fish and wildlife, as the largest single source of electricity for a region of 13.5 million people, and as a vital asset for the Pacific Northwest economy.
The Northwest’s electricity system remains the cleanest in the nation. More than 70 percent of the region’s energy supply, including energy efficiency, is carbon neutral, and the efficiency of electricity use continues to improve.
Energy, Fish, Wildlife: The State of the Columbia River Basin in 2014The Columbia River is one of the great rivers of the world.Fourth-largest by volume in North America, the Columbia drains 259,000 square miles across portions of seven states and the Province of British Columbia, an area the size of France.
cleanest in the nationThe Northwest’s electricity system remains the

PAGE 8 > 2014 ANNUAL REPORT TO CONGRESS > COLUMBIA RIVER BASIN COLUMBIA RIVER BASIN < 2014 ANNUAL REPORT TO CONGRESS < PAGE 9
Not only does the Northwest lead the nation in hydropower, the Northwest also is a leader in reducing demand for electricity through improvements in energy efficiency. Congress declared energy efficiency the primary resource to meet new demand for power in the Northwest Power Act of 1980, the law that authorized the states of Idaho, Montana, Oregon, and Washington to create the Power and Conservation Council. In Fiscal Year 2014, the region is on track to meet or beat the Council’s energy efficiency goal in its Sixth Northwest Power Plan (2010) to improve efficiency by saving 1,200 average megawatts in the five years between 2010 and 2014.
Energy efficiency is the second-largest energy resource in the Northwest. It now comprises about 17 percent of the region’s electricity resources. The Council expects that percentage to increase over time.
Every year since 2005, the region has exceeded energy-efficiency targets in the Council’s Fifth (2005) and Sixth (2010) Power Plans. In 2012, the region improved its electric energy efficiency by 253 average megawatts, or an amount equal to the annual electricity use of 170,000 Northwest homes. Accomplishments in 2013 are being calculated and will be announced by the Council in early 2015.
Renewable resources, mainly wind power, comprise a small but growing part of the region’s generating resources. Wind power developed rapidly in the Northwest over the last 10 years and now totals about 9,000 megawatts of installed capacity. Of this amount, 80 percent (7,100 megawatts) is located in the states of Washington, Oregon, Idaho, and Montana. The remainder is primarily in Wyoming with small amounts in Utah and Nevada.
Northwest wind power capacity accounts for about 14 percent of the total regional power-generating capacity and about 8 percent of average annual electricity generation. About 2,100 megawatts of new wind power capacity came online in 2012 alone, but just 105 megawatts were added in 2013. Two projects, one in Montana and the other in Oregon, were planned to come online in 2014, totaling 18.4 megawatts of capacity.
The recent rapid development of wind power pushed topics such as generating resource integration, power
system flexibility, and marketing and scheduling practices to the forefront of conversations in the region about the future of the electricity supply. The Council is addressing these issues as it works on the Seventh Northwest Power Plan, which we expect to complete in late 2015.
International power issues attracted public attention in the Northwest in 2014, as the United States and Canada continued considering the future of the 1964 Columbia River Treaty. Because the 60-year Treaty requires a minimum of 10 years’ notice before termination and the treaty was ratified in September 1964, September 2014 is the last opportunity for either the U.S. or Canada to announce its intention to terminate the Treaty at the earliest possible date of September 2024.
In 2013, the United States Entity under the Treaty, comprising the Bonneville Power Administration and the U.S. Army Corps of Engineers, and the Canadian Entity, which is the Province of British Columbia, issued recommendations to their respective federal governments on the future of the treaty following extensive public processes in both countries. The Council is following this issue carefully, as the treaty affects how the Columbia River hydropower system is operated.
Meanwhile, the Council completed the latest revision of the Columbia River Basin Fish and Wildlife Program early in Fiscal Year 2015. The Council developed the first program in 1982 and revises it every five years. The new revision updates the existing program by focusing on reducing threats from invasive species, predators, toxic substances, and climate change; protecting strongholds (areas of good habitat and the fish associated with them); enhancing conservation of wild fish; investigating restoration of salmon and steelhead into blocked areas, notably above Chief Joseph and Grand Coulee dams; and repairing aging structures and equipment related to projects that implement the program
The program is the largest regional effort of its kind in the nation, guiding more than $250 million of Bonneville Power Administration expenditures annually to habitat improvements, hatchery operations, hydropower system fish-passage improvements, research, and related activities. Other costs related to implementation of the program, including forgone hydropower revenues and power purchases that result from spilling water over dams to assist juvenile salmon and steelhead passage, and fixed expenses related to capital investments, more than double that amount. In Fiscal Year 2013, for example, the total of all costs Bonneville attributes to fish and wildlife was $682.4 million.
Meanwhile, there was good news in Fiscal Year 2014 about most Columbia River Basin salmon and steelhead runs.
Snake River fall Chinook salmon are making an amazing resurgence. The return of adult fish from the Pacific Ocean to Idaho rivers in calendar year 2013 was 75,846 fish. Of these, 20,222 were wild fish, a remarkable 26,000 percent increase from 1990, when just 78 wild fish were counted. 1990 was the year the Nez Perce Tribe and partners including the Idaho Department of Fish and Game, NOAA Fisheries, the Northwest Power and Conservation Council, and many others began an effort to rebuild the stock. The 2014 run was anticipated to be large, as well.
The 2014 sockeye run in the Columbia River was the largest since fish-counting began at the dam in 1938. The Bonneville Dam count totaled more than 614,000 fish. The previous record count at Bonneville was 516,000 in 2012. By far, the largest share of the Columbia sockeye run originates in Lake Osoyoos on the Okanagan River in British Columbia. Of these, more than 85 percent are believed to be fish that spawn in the wild, as opposed to fish that return to hatcheries. The second-largest component returns to Lake Wenatchee — expected to be about 64,000 fish in 2014 — and the smallest component returns to Idaho’s Redfish Lake. An endangered species, the Snake River component exceeded 2,200 fish at Lower Granite Dam this year, a number that rivaled the big return of 2010 but otherwise has not been seen since the dam was completed in 1975. In 1990, the count was zero and for many years after, and before, the count was fewer than 100 fish.
NOAA Fisheries reported to the Council in 2014 that survival of juvenile spring/summer Chinook salmon

ENERGY OVERVIEW < 2014 ANNUAL REPORT TO CONGRESS < PAGE 11PAGE 10 > 2014 ANNUAL REPORT TO CONGRESS > COLUMBIA RIVER BASIN
through the hydrosystem in 2013 in the Columbia and Snake rivers was above average, and survival of juvenile steelhead was about equal to the long-term average. As well, travel times for juvenile fish migrating through the eight dams and reservoirs on the Columbia/Snake hydrosystem improved over the period prior to 2005. NOAA scientists attribute the decreased travel time primarily to increased water spills and installation of new surface-passage structures at dams.
The chart above shows adult salmon and steelhead counted at Bonneville Dam since 1981. In fact, the total through the end of 2014, 2,574,444 fish, was a record since counting began at the dam in 1938.
We note a number of important accomplishments through the fish and wildlife program since it was first adopted by the Council in 1982:
• More than 2,400 river miles of habitat have been improved for fish
• Endangered Snake River sockeye are being recovered
• Fish hatcheries have been constructed to help recover threatened and endangered species
• More than 725,000 acres1 of habitat have been protected for the benefit of wildlife affected by Federal Columbia River Power System dams, which inundated approximately 350,000 acres
• Scientific research has contributed to steadily improving knowledge about fish, wildlife, and habitat in the basin
We are proud to be part of the steadily improving supply of clean energy in the Pacific Northwest, and the ongoing efforts to protect and restore fish, wildlife, and habitat in the Columbia River Basin including survival improvements for many ESA-listed fish species. The Council is not alone in these efforts, collaborating on a regular basis with state and federal fish and wildlife agencies, Indian tribes, the Bonneville Power Administration, environmental and electric utility organizations, and others. In short, and consistent with the mandates of the Northwest Power Act, the Council is working to ensure that the Northwest power supply remains adequate, efficient, economical and reliable while protecting and enhancing fish and wildlife in the Columbia River Basin.
1 The total posted at www.cbfish.org under “Wildlife Acres Protected ” is 413,691 acres. According to Bonneville, this total does not include 262,613 acres protected in Montana under that state’s Montana Trust agreement with Bonneville, nor the Craig Mountain settlement in Idaho, which totals more than 60,000 acres.
The Seventh Northwest Power PlanAs required by the Northwest Power Act, following completion of the latest revision of the Columbia River Basin Fish and Wildlife Program, the Council will begin revising the Northwest Power Plan. The next plan will be the seventh in the Council’s history, as the Act requires the Council to review the plan at least every five years.
Under the law, the power plan incorporates the fish and wildlife program. The Council approved the first fish and wildlife program in 1982 and the first power plan in 1983.
The draft schedule for the Seventh Northwest Power Plan proposes its adoption in late 2015.
Among the questions the Council will address in the Seventh Plan are:
• How much will loads grow or decline over the next 20 years?
• What mix of new low-cost resources will best meet the region’s needs, and what is the cost and risk of constructing those resources?
• How much cost-effective energy efficiency is available to meet a portion of the region’s load growth?
• What will happen with wholesale electricity prices in the future?
Growing renewable generation, technological advances, and initiatives to lower carbon emissions all add to this complex planning exercise, which relies on a planning model to evaluate how well a resource would perform under various conditions. The regional portfolio model analyzes different portfolios to understand their cost and risk tradeoffs across a large number of potential futures. It may also be used to test various policy propositions, such as strategies for reducing carbon emissions from the power system.
During 2013 and 2014, the Council staff worked to develop inputs for the Seventh Plan including load forecasts, generation assessments, energy efficiency analyses, analytical tools, and related research. Engaging the public and stakeholders in developing the plan is a Council priority. Stakeholder advisory committees met throughout the year to review analyses and approaches in developing the new plan. Along with the advisory committee work, staff has presented energy primers at Council meetings, and also held symposiums on plan-related topics like carbon emissions and California’s energy markets.
Some of the issues we expect to address in the new power plan include 1) the impacts of load-forecast
CouncilEnergy Overview
Salmon and Steelhead Counted at Bonneville Dam through December 17, 2014
-
500,000
1,000,000
1,500,000
2,000,000
2,500,000 Coho SockeyeSteelhead Chinook
Source: Fish Passage Center

PAGE 12 > 2014 ANNUAL REPORT TO CONGRESS > ENERGY OVERVIEW ENERGY OVERVIEW < 2014 ANNUAL REPORT TO CONGRESS < PAGE 13
uncertainty; 2) the cost and pace of future energy efficiency improvements; 3) the cost and availability of new generating resources; 4) power system reliability and adequacy; 5) the effect of proposed federal regulations to reduce carbon emissions from power plants; 6) integration of variable-output resources like wind and solar power into the power grid; and 7) the ongoing transformation of the utility industry regarding issues such as the creation of energy imbalance markets and adaptation to lower load growth.
The coming year will include developing an environmental methodology, extensive public outreach, framing issues for analysis, and continued work on forecasts, assumptions, and inputs.
Energy Efficiency
The second-largest power resource in the NorthwestEnergy efficiency in the Pacific Northwest was the second-largest electricity resource in 2012, comprising
17 percent of the region’s energy. Hydropower is the top resource, at 46 percent. Data for 2013 were expected to be reported by the federal Energy Information Administration in early 2015.
Meanwhile, Pacific Northwest energy efficiency savings in 2013 totaled 268 average megawatts, an amount equal to the annual electricity use of about 170,000 Northwest homes. This exceeded the Council’s Sixth Power Plan target of 260 average megawatts for the year by about 5 percent. The 2013 savings were equal to about 1.34 percent of regional retail electricity sales, which was twice the national average.
The Council reports annually on energy efficiency improvements reported to the Regional Technical Forum by electric utilities, the Energy Trust of Oregon, the Bonneville Power Administration, the Northwest Energy Efficiency Alliance, and others. The Forum is an advisory committee established by the Council in 1999 to develop standards to verify and evaluate energy efficiency savings.
Based on reporting utilities, the projections for 2014
amount to 172 average megawatts. This is more than the 153 average megawatts required to meet the five-year energy-efficiency target in the Sixth Power Plan. Because the reporting utilities represent about 85 percent of the region’s electricity load, the total savings in 2014 are expected to be greater.
Northwest utilities, the Energy Trust of Oregon, and their partners have been acquiring energy efficiency resources since 1978. Cumulative savings from 1978 through 2013 from utility and NEEA efficiency programs, state codes, and federal standards stood at 5,569 average megawatts — more than the annual output of the six largest hydroelectric dams in the Northwest. That’s enough electricity to serve nearly the entire state of Oregon and all of western Montana today. Over those 34 years, energy efficiency met nearly 60 percent of the new demand for power.
In aggregate, regional utility investments in energy efficiency in 2013 were $375 million (2006$) or about 3.4 percent of retail electricity revenues. The average levelized cost to utilities of 2013 savings was just over $17 per megawatt hour (2006$), and regional utility investments in energy efficiency averaged just over $28 per capita in 2013 compared to the national average of just over $16 per capita.
Impact on electricity ratesAs we have reported, the efficiency of electricity use in the Northwest is improving rapidly – we are doing more with our power and using less to do it. But in addition, a Council analysis shows that investments in energy efficiency are not having a major effect on electricity rates.
Reports by electric utilities in the Northwest to the U.S. Department of Energy for the years 2007 through 2013 show that energy productivity, expressed as improvements in economic output per unit of energy, improved 6 percent in Oregon, 4 percent in Idaho, 3 percent in Washington, and 2 percent in Montana for an overall regional improvement of 4 percent during that period.
As part of its power planning, the Council tracks changes in the regional economy, as well as electricity
sales and revenues. The current analysis shows that:
• Electricity use by residential and commercial users is decreasing while industrial use is increasing
• Regional residential electric bills are 16 percent lower than the national average
• Total revenues to Northwest electric utilities grew an inflation-adjusted 1.7 percent per year
• Gross state product, another measure of economic activity, increased 2.2 percent per year
• Employment is recovering, but is not back to pre-2008 (pre-recession) levels (approximately 6.32 million employed in 2008, 6.22 million employed in 2013)
Federal codes and standardsOne of the primary ways energy efficiency is improved is through programs conducted by utilities and agencies like the Energy Trust of Oregon. Another important means of building energy efficiency is through energy codes and standards. The Council staff reported on efficiency accomplishments through federal standards in 2014.
Federal standards for appliances and equipment have been in place since the mid-1970s, but in the last few years a host of new standards have come into play that will dampen long-term load growth and achieve the energy efficiency that otherwise would have been captured through programs. Going forward, programs will need to focus on efficiency opportunities not affected by federal standards.
The Council estimates that the cumulative savings from existing federal standards were just under 1,000 average megawatts in 2012, or almost 20 percent of the region’s savings since 1978.
The Department of Energy is responsible for setting federal standards for more than 50 categories of appliances and equipment used in homes, commercial buildings, and industries according to a schedule mandated by Congress, but has had a pattern of failing to meet it. Only after several states and interest groups sued the agency in 2005, did it finally adopt a plan to
1978-2013 Utility and BPA Programs, Energy Codes and Federal Efficiency Standards Have Produced Almost 5,600 MWa of Savings
0
1000
2000
3000
4000
5000
6000
1978
1979
1980
1981
1982
1983
1984
1985
1986
1987
1988
1989
1990
1991
1992
1993
1994
1995
1996
1997
1998
1999
2000
2001
2002
2003
2004
2005
2006
2007
2008
2009
2010
2011
2012
2013
Cum
ula
tive
Savi
ngs (
Mw
a)
Federal Standards State Codes
NEEA Programs BPA and Utility Programs

PAGE 14 > 2014 ANNUAL REPORT TO CONGRESS > ENERGY OVERVIEW ENERGY OVERVIEW < 2014 ANNUAL REPORT TO CONGRESS < PAGE 15
address the backlog. Under federal energy legislation enacted in 2007, the DOE must now review each product standard every six years. As a result, federal rulemaking in the last couple of years has been brisk: 23 new or revised standards have been finalized since the Council’s Sixth Power Plan was adopted, with a dozen more scheduled to be completed in 2014.
It is estimated that Northwest consumers saved $10 billion in their electricity bills during 1986-2010 thanks to federal standards and state codes.
Energy Efficiency FundingIn 2014, the Bonneville Power Administration kicked-off two processes that will define its spending amounts going into its next two-year rate case: the integrated program review and the capital investment review. In these two processes, the Council considers it important that Bonneville commit adequate financial resources to implement the Council’s power plans, particularly to acquire energy efficiency.
Bonneville has surpassed the Council’s five-year targets for acquiring energy efficiency since 2005. In reviewing the initial capital investment review proposal, however, the Council was concerned that the proposed funding levels would reduce Bonneville’s ability to continue meeting increasing targets in the Council’s Sixth Power Plan. The Council raised the issue early in the process so that Bonneville and others in the region could work together to resolve the issue. The Council sent a letter to Bonneville outlining its perspective. Bonneville and the Council then worked together to develop an interim funding proposal for energy efficiency.
Regional Technical ForumIn November, the Council approved the 2014 budget and workplan for the Regional Technical Forum. The $1.5 million budget will support the work of the Forum to update and develop efficiency measures that meet its guidelines. Funding comes from contributions from the Bonneville Power Administration, the region’s utilities, and in-kind contributions of staff-time by the Council and other organizations.
The Forum workplan is largely driven by requests from
utilities, Bonneville, Energy Trust of Oregon, Northwest Energy Efficiency Alliance, and state energy agencies. During 2013 the Forum continued to improve its processes and the quality of its overall work products. The list of remaining measures that need to be brought into compliance with Forum guidelines is dwindling. The completion of this task will allow the Forum to focus more of its resources developing standard protocols, scoping the research needed for future measure updates, and seeking regional implementation of such research.
The organizational shift the Forum made in early 2013 is bearing fruit. The Forum’s full-time contractors are now well integrated into Forum processes and understand Forum guidelines and work product expectations. The five contract staff bought on in early 2013 have been instrumental in allowing the Forum to dive deeper into analysis when needed and provide consistent work products meeting after meeting. This business model shift helped streamline many processes, and the contract staff are adding significant value to the Forum. Coupled with an external third-party review of all staff work products and a thorough knowledge of the guidelines, the Forum is now providing quality analyses at a level that was not possible before.
Another reason for the region’s successes in improving energy efficiency is the unique, collaborative role that the Forum plays in providing a systematic way to validate energy efficiency savings for the region. Reliable savings estimates allow power system planners to incorporate efficiency into their resource-acquisition strategies. Validated savings also inform efficiency program planners.
NEEA’s strategic and business plansThe Northwest Energy Efficiency Alliance (NEEA), which the Council helped create in 1997, continues to successfully promote the development of energy-efficient technologies and strategies to acquire all cost-effective energy efficiency in the Northwest.
NEEA’s strategic plan identifies two major goals: filling the energy efficiency pipeline with new opportunities and creating market conditions to accelerate and sustain market adoption. In a letter to NEEA on its draft
2015-2019 strategic and business plans, the Council confirmed its support for both goals, especially the organization’s focus on looking for new technologies and conducting strategic market analyses.
Also important to the Council is NEEA’s regional approach in its work. The Council believes it is important that the Bonneville Power Administration, Energy Trust of Oregon, and Northwest utilities pool their resources to support NEEA’s work. This collaborative approach is more cost-effective than utilities’ funding individual efforts because it avoids duplication of effort, which would mean higher costs for both the region and utilities.
Power Planning
EPA’s carbon-reduction ruleIn June 2014 the U.S. Environmental Protection Agency announced a proposed federal rule to limit emissions of carbon dioxide from power plants. The proposed rule would require power plant CO2 emissions to be reduced by 30 percent from 2005 levels by 2030.
In the Pacific Northwest, carbon emissions from electricity production are below the national average because carbon-free hydropower provides more than half of the region’s electricity. These emissions fluctuate widely based on the hydropower supply. Differences among utility resource portfolios are dramatic — some utilities rely more on coal and natural gas than others. As well, the Northwest has been effectively reducing its carbon footprint through energy efficiency, renewable resource development, and retiring coal plants for more than 30 years.
As a region, the Northwest has a decided advantage in meeting the Environmental Protection Agency’s proposed carbon emission rules for power plants: energy efficiency and our success in achieving it. Unlike most prior EPA air emissions regulations, this proposal sets limits on CO2 emission rates (pounds per megawatt-hour of electricity generated) at the state level rather than for generating facilities themselves, but the EPA would allow states to join together to develop and implement carbon-reduction plans to comply as a region. Such collaboration could include a regional cap-and-trade program or regional development of zero-

PAGE 16 > 2014 ANNUAL REPORT TO CONGRESS > ENERGY OVERVIEW ENERGY OVERVIEW < 2014 ANNUAL REPORT TO CONGRESS < PAGE 17
carbon resources like energy efficiency and renewable resources.
If this sounds familiar, it’s because the Northwest states have been collaborating on long-term energy planning for more than 30 years. Over that time, the region has saved nearly 5,600 average megawatts, the power equivalent of five cities the size of Seattle. The Council’s Sixth Power Plan predicted that more than 85 percent of the new demand for power over the 20-year planning horizon could be met with energy efficiency.
If the energy efficiency goals in the Council’s Sixth Power Plan and state renewable portfolio standard goals are met, the Northwest is well positioned as a region to meet the EPA’s proposed CO2 emission reductions. However, the ability to achieve emission reductions varies according to a state’s generating resource portfolio. These issues will be addressed by the Council in its Seventh Power Plan. Work on the new plan began in late 2014.
Regional Load GrowthThe conventional wisdom of the past few years has been that the region’s peak loads are growing, but the data does not support this perception, according to a review by the Council.
According to the review of historical trends, since 1995 annual energy loads grew at an average rate of only 0.40 percent, and winter peak loads haven’t grown at all. Slow or no load growth may signal the need for a change in traditional utility planning and regulatory practices. Utilities earn returns on investment in capital needed for system expansion.
One thing that has changed in the last 20-30 years is the rapid development of energy efficiency, which dampened load growth while helping the region grow economically without having to rely too heavily on adding new electricity-generating resources. The Council plans to address the load-growth issue in the Seventh Power Plan.
Analysis of power shortage riskThe likelihood of future power shortages in the Pacific Northwest has declined over the last year, a Council
analysis shows.
The predicted likelihood of shortage, known by the shorthand “loss of load probability” or LOLP, declined from 7 percent for the year 2017 in a Council analysis in December 2012 to 6 percent for the year 2019 in the Council’s current analysis. The Northwest power supply is deemed adequate if the likelihood of future shortages, LOLP, is less than 5 percent.
The LOLP declined in the most recent analysis because the amount of electricity from new power plants soon to come online in the Northwest is greater than the anticipated new demand for electricity in 2019. Important to this conclusion is the Council’s anticipation that the Northwest will achieve the Council’s energy efficiency savings target of about 350 average megawatts per year between 2017 and 2019. That achievement helps offset the need for more costly new power plants.
However, the risk, or LOLP, increases again by 2021 as the result of the planned retirements of coal-fired
power plants in Boardman, Oregon, and Centralia, Washington. In response to those closures, the LOLP increases to 11 percent.
Actions to bring the LOLP down to the Council’s 5-percent standard will vary. For example, utilities have plans for new power plants totaling 1,800 megawatts of capacity for construction through 2024. These were not included in the analysis because it only includes plants that are sited and licensed or under construction. Another possibility to reduce LOLP on a short-term, seasonal basis is that utilities in the Northwest could import excess power from the Southwest when it is needed here, and send excess power from the Northwest to the Southwest when it is needed there.
Natural gas price forecastThe Council monitors its power planning assumptions on a regular basis to identify any significant changes that would affect its power plan. In 2014 the Council revised its forecast for fuel prices, which will be used to develop its Seventh Power Plan.
The natural gas price forecast is the most important fuel forecast for the plan, and it’s also the most widely used by others in the region for their analyses. The current projected price range for natural gas is broader than past Council forecasts, reflecting greater uncertainty about future supply and demand because of reliance on gas-fueled generation for future resources.
Low natural gas prices would mean lower wholesale electricity prices, while high natural gas prices would mean higher wholesale prices. A more complete picture of how these fuel prices would play out will be tested during the development of the Seventh Power Plan.
Future cost of nuclear powerTo help the region better understand the cost of power from the region’s only operating nuclear power plant, in May the Council hosted presentations by the authors of two reports that have opposite conclusions. The opposing conclusions result from different assumptions about future costs of the plant, called the Columbia Generating Station and operated by Energy Northwest.
One report, commissioned by the Oregon and Washington chapters of Physicians for Social Responsibility (PSR) and prepared by Portland-based energy consultant Robert McCullough, concluded that power from the Columbia Generating Station (CGS) is significantly more expensive than power from other sources and recommended that the facility be decommissioned in 2015. The other report, commissioned by Energy Northwest, which operates the plant, and prepared by Cambridge Energy Research Associates of Cambridge, Mass., concluded that the plant is economical to operate until the end of its anticipated life in 2043.
Uncertainties highlighted by the two reports include the future cost and performance of the nuclear plant, safety considerations of nuclear power, and costs of alternative power supplies. The Council was interested in the “dueling experts” reports because future resource costs are critical to making the best decisions about future sources of electricity.
State renewable resource portfolio standardsThe Council tracks progress in the three Northwest states that have renewable energy portfolio standards toward meeting those goals. Montana, Oregon, and Washington have state-mandated renewable resource portfolio standards; Idaho does not.
The three state portfolio standards all require a certain percentage of qualifying utilities’ electricity sales to be produced from renewable resources. While each state has a unique standard with varying factors (for example, eligible resources, technology minimums, resource banking provisions), they all have the same overall intentions that encourage the development and procurement of renewable resources in the Pacific Northwest over the next decade or so.
According to the Council’s analysis, the region is in good shape to comply through 2019-2020. In a change from the last decade, the pace of wind development has dropped off significantly, partly as the result of the termination of the federal energy production tax credit at the end of 2012 and partly because development has reached the state standard levels.

PAGE 18 > 2014 ANNUAL REPORT TO CONGRESS > FISH & WILDLIFE OVERVIEW FISH & WILDLIFE OVERVIEW < 2014 ANNUAL REPORT TO CONGRESS < PAGE 19
The Columbia River Basin Fish and Wildlife Program
2014 Program amendmentThe Northwest Power Act requires the Council to review the Northwest Power Plan, of which the Fish and Wildlife Program is a component, at least every five years, beginning with the program.
The program, which is funded by the federal Bonneville Power Administration under authority of the Northwest Power Act of 1980, is designed to protect, mitigate, and enhance fish and wildlife, and related spawning grounds and habitat, of the basin that have been affected by hydropower dams. Bonneville’s direct spending on projects that implement the program totaled $239 million in Fiscal Year 2013. Costs for Fiscal Year 2014 were being calculated when this report was completed, in January 2015.
Under the Power Act, the Council largely bases the program on recommendations of state and federal fish and wildlife agencies and Indian tribes in the Northwest, but anyone can submit recommendations. In Fiscal Year 2013, the Council issued a call for recommendations to amend the program, following on work the Council did in 2012 to identify issues and gather information in preparation for the amendment rulemaking.
The Council issued a draft program for public comment in May 2014 and, following the comment period, approved the final, amended program in October. The program is posted on the Council’s website. Here are some key points of the 2014 Program:
Habitat:• Ecosystems: The program stresses the importance of
restoring functioning ecosystems.
• Strongholds: States and tribes may designate strongholds to help manage wild or naturally spawning fish.
• Water quality: Support efforts to identify, assess, and reduce toxic contaminants.
• Mainstem dam operations: Where there are demonstrated benefits for fish, manage flows to more closely approximate natural patterns.
• Climate change: Assess whether climate change effects are altering or are likely to alter critical river flows, water temperatures or habitat, evaluate possible actions to mitigate effects.
• Columbia River estuary: Assess opportunities for floodplain reconnection and removal or lowering of dikes and levees that block access to habitat.
Council Fish & Wildlife Overview
Fish:• Wild fish: Functioning ecosystems will support and
protect wild fish
• Resident fish: Preserve, enhance, and restore native fish in native habitats.
• Non-native and invasive species: Detect their presence, respond early, minimize their spread, educate the public.
• Hatcheries: Defer to the agencies and tribes to define scope, purpose, methods, and appropriate management techniques, consistent with current and evolving scientific principles.
• Reintroduction into blocked areas: Science-based, phased approach to put salmon back into historic habitats blocked by dams.
• Sturgeon: Operate dams to provide flows that encourage sturgeon to spawn without harming ESA-listed salmon and steelhead.
• Lamprey: Evaluate dam passage, passage efficiency, and direct mortality.
Wildlife:• Mitigation: Acquire and protect habitat units
identified in loss assessments, encourage settlement agreements.
• Protected areas: Protect 44,000 miles of river reaches form new hydroelectric development, provide for exemption where projects would have exceptional benefits for fish and wildlife.
The Program:• Adaptive management: Improve understanding of
what efforts are working, evaluate program progress.
Bonneville Power Administration fish and wildlife costsThe Council reports annually to the four Northwest governors on costs of the Bonneville Power Administration to implement the Council’s fish and wildlife program. As noted above, costs for Fiscal Year 2014 had not been calculated when this report was issued in January 2015.
However, as is the Council’s practice in these annual reports to Congress, we include a synopsis of Bonneville’s costs in the previous fiscal year — the same information we reported to the Governors. The Council issued its Report
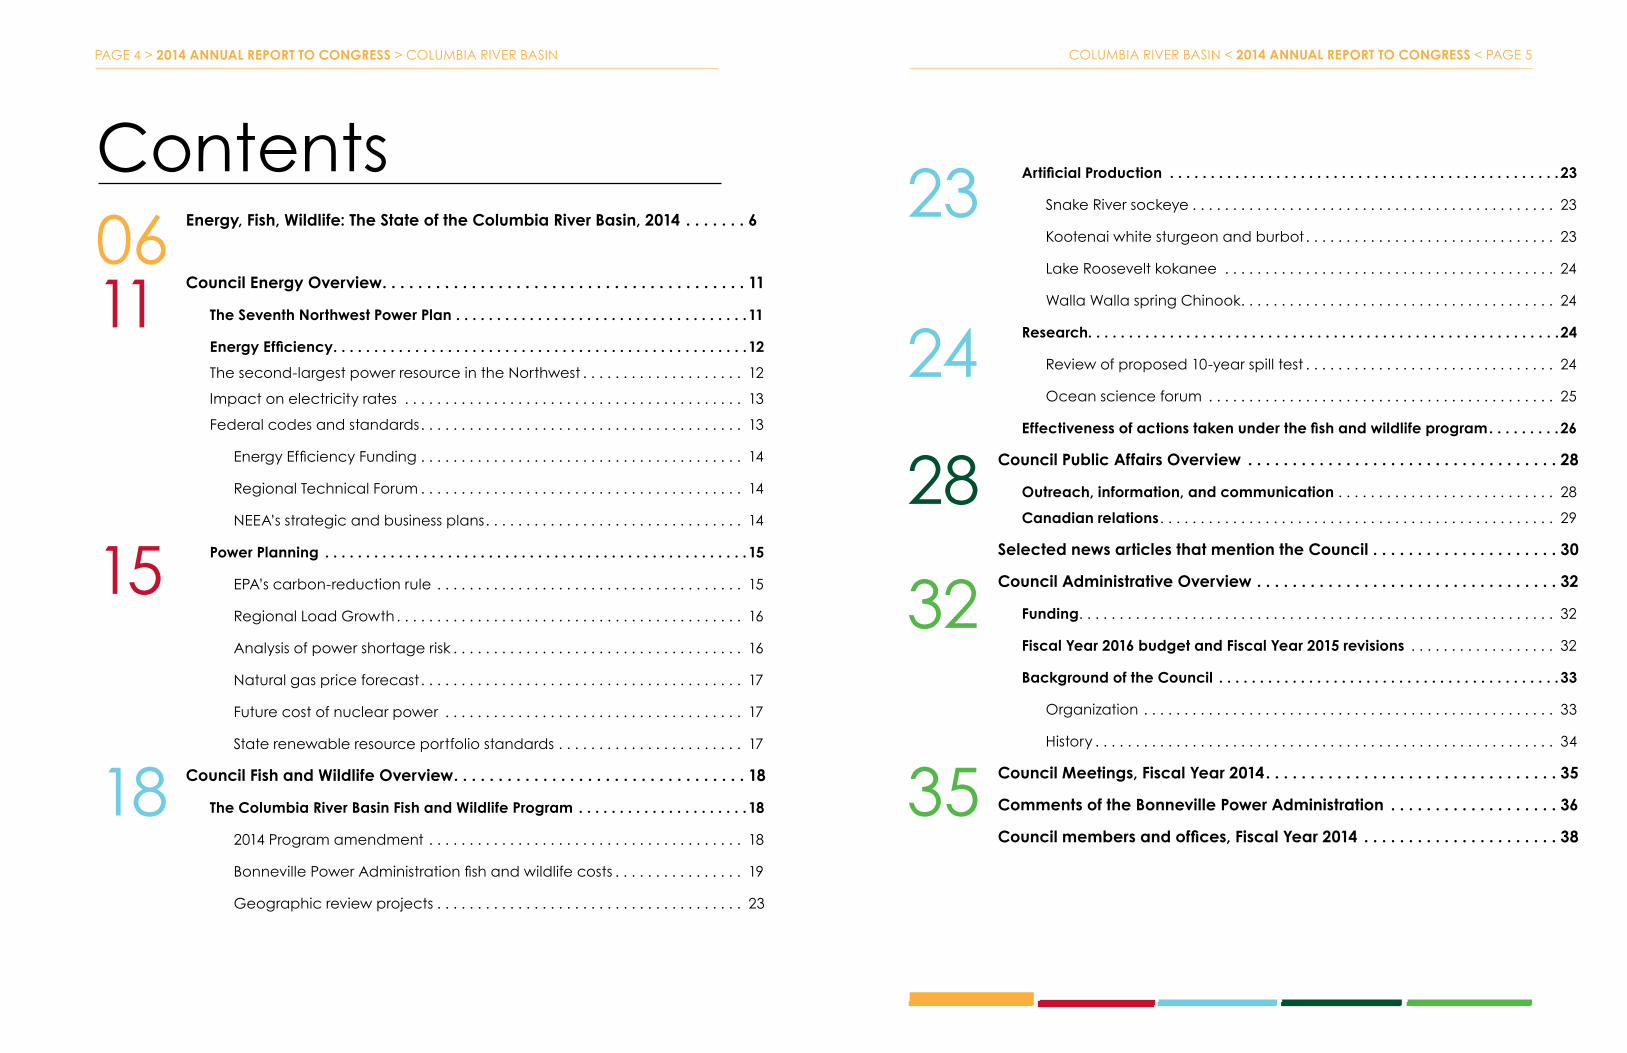
Beacon Rock, Columbia River Gorge National Scenic Area
The Columbia is one of the great rivers of the world. Its wealth of water makes it one of the world’s premier hydropower rivers, and also one of the world’s great salmon and steelhead rivers.
PAGE 22 > 2014 ANNUAL REPORT TO CONGRESS > FISH & WILDLIFE OVERVIEW FISH & WILDLIFE OVERVIEW < 2014 ANNUAL REPORT TO CONGRESS < PAGE 23
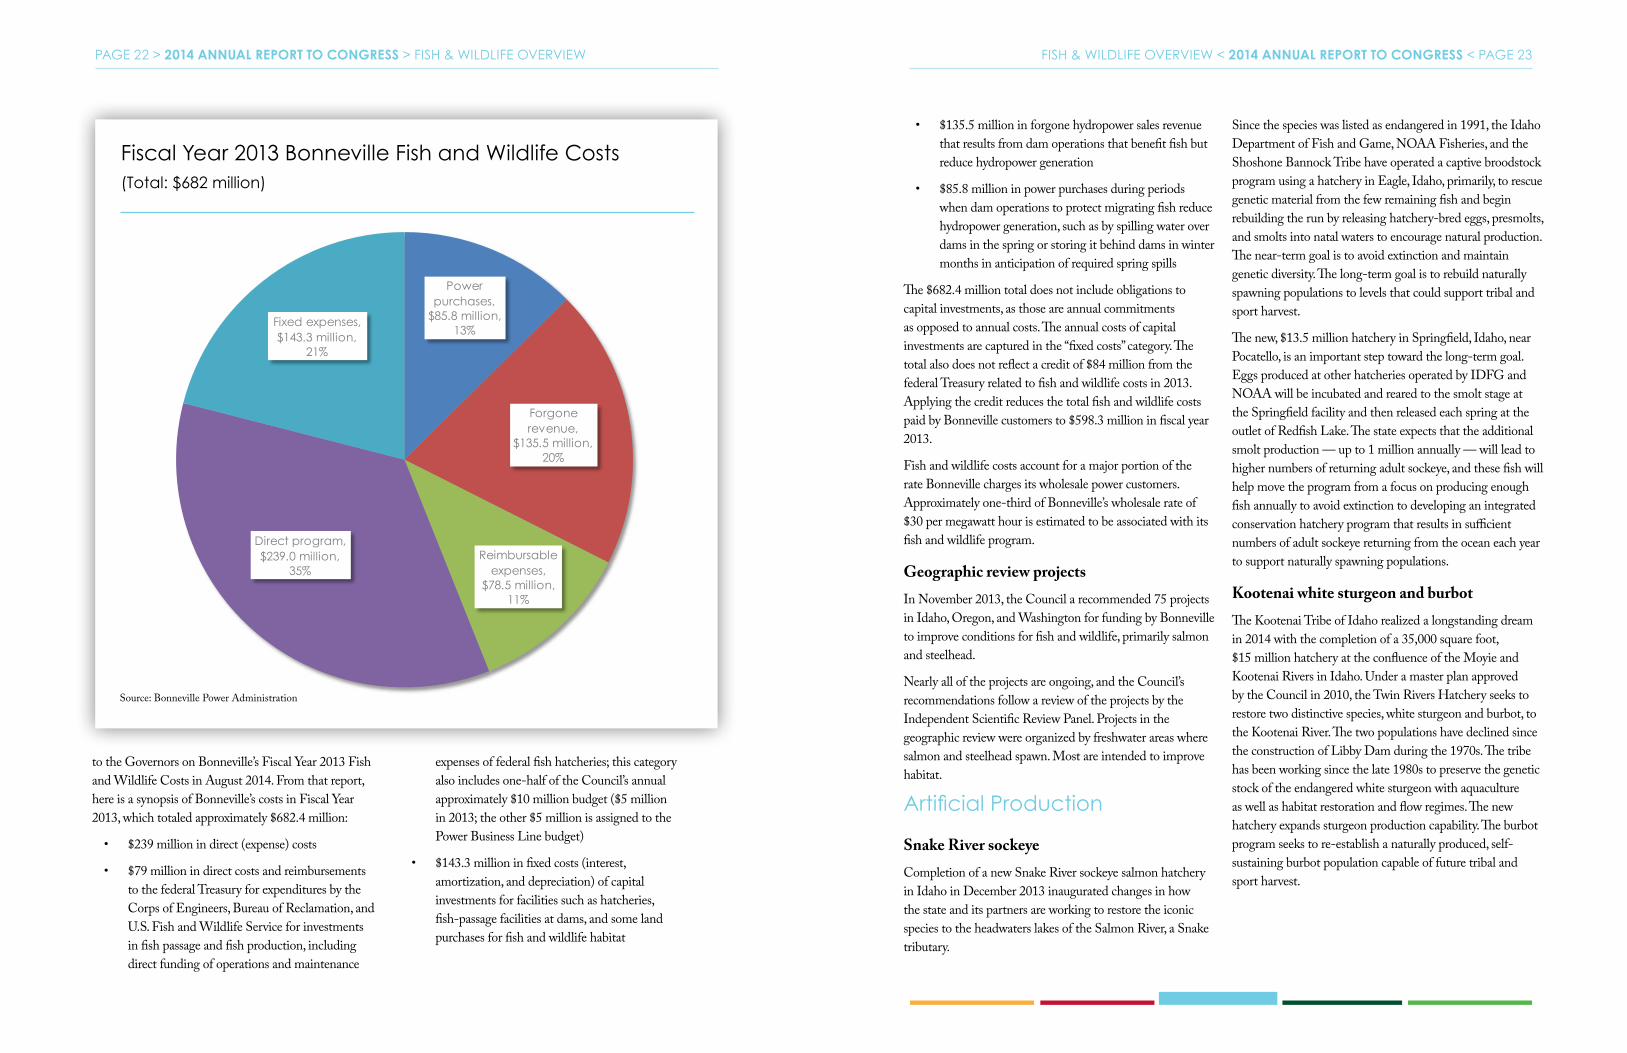
to the Governors on Bonneville’s Fiscal Year 2013 Fish and Wildlife Costs in August 2014. From that report, here is a synopsis of Bonneville’s costs in Fiscal Year 2013, which totaled approximately $682.4 million:
• $239 million in direct (expense) costs
• $79 million in direct costs and reimbursements to the federal Treasury for expenditures by the Corps of Engineers, Bureau of Reclamation, and U.S. Fish and Wildlife Service for investments in fish passage and fish production, including direct funding of operations and maintenance
expenses of federal fish hatcheries; this category also includes one-half of the Council’s annual approximately $10 million budget ($5 million in 2013; the other $5 million is assigned to the Power Business Line budget)
• $143.3 million in fixed costs (interest, amortization, and depreciation) of capital investments for facilities such as hatcheries, fish-passage facilities at dams, and some land purchases for fish and wildlife habitat
Source: Bonneville Power Administration
(Total: $682 million)
Fiscal Year 2013 Bonneville Fish and Wildlife Costs• $135.5 million in forgone hydropower sales revenue
that results from dam operations that benefit fish but reduce hydropower generation
• $85.8 million in power purchases during periods when dam operations to protect migrating fish reduce hydropower generation, such as by spilling water over dams in the spring or storing it behind dams in winter months in anticipation of required spring spills
The $682.4 million total does not include obligations to capital investments, as those are annual commitments as opposed to annual costs. The annual costs of capital investments are captured in the “fixed costs” category. The total also does not reflect a credit of $84 million from the federal Treasury related to fish and wildlife costs in 2013. Applying the credit reduces the total fish and wildlife costs paid by Bonneville customers to $598.3 million in fiscal year 2013.
Fish and wildlife costs account for a major portion of the rate Bonneville charges its wholesale power customers. Approximately one-third of Bonneville’s wholesale rate of $30 per megawatt hour is estimated to be associated with its fish and wildlife program.
Geographic review projectsIn November 2013, the Council a recommended 75 projects in Idaho, Oregon, and Washington for funding by Bonneville to improve conditions for fish and wildlife, primarily salmon and steelhead.
Nearly all of the projects are ongoing, and the Council’s recommendations follow a review of the projects by the Independent Scientific Review Panel. Projects in the geographic review were organized by freshwater areas where salmon and steelhead spawn. Most are intended to improve habitat.
Artificial Production
Snake River sockeyeCompletion of a new Snake River sockeye salmon hatchery in Idaho in December 2013 inaugurated changes in how the state and its partners are working to restore the iconic species to the headwaters lakes of the Salmon River, a Snake tributary.
Since the species was listed as endangered in 1991, the Idaho Department of Fish and Game, NOAA Fisheries, and the Shoshone Bannock Tribe have operated a captive broodstock program using a hatchery in Eagle, Idaho, primarily, to rescue genetic material from the few remaining fish and begin rebuilding the run by releasing hatchery-bred eggs, presmolts, and smolts into natal waters to encourage natural production. The near-term goal is to avoid extinction and maintain genetic diversity. The long-term goal is to rebuild naturally spawning populations to levels that could support tribal and sport harvest.
The new, $13.5 million hatchery in Springfield, Idaho, near Pocatello, is an important step toward the long-term goal. Eggs produced at other hatcheries operated by IDFG and NOAA will be incubated and reared to the smolt stage at the Springfield facility and then released each spring at the outlet of Redfish Lake. The state expects that the additional smolt production — up to 1 million annually — will lead to higher numbers of returning adult sockeye, and these fish will help move the program from a focus on producing enough fish annually to avoid extinction to developing an integrated conservation hatchery program that results in sufficient numbers of adult sockeye returning from the ocean each year to support naturally spawning populations.
Kootenai white sturgeon and burbotThe Kootenai Tribe of Idaho realized a longstanding dream in 2014 with the completion of a 35,000 square foot, $15 million hatchery at the confluence of the Moyie and Kootenai Rivers in Idaho. Under a master plan approved by the Council in 2010, the Twin Rivers Hatchery seeks to restore two distinctive species, white sturgeon and burbot, to the Kootenai River. The two populations have declined since the construction of Libby Dam during the 1970s. The tribe has been working since the late 1980s to preserve the genetic stock of the endangered white sturgeon with aquaculture as well as habitat restoration and flow regimes. The new hatchery expands sturgeon production capability. The burbot program seeks to re-establish a naturally produced, self-sustaining burbot population capable of future tribal and sport harvest.
Power purchases,
$85.8 million, 13%
Forgone revenue,
$135.5 million, 20%
Reimbursable expenses,
$78.5 million, 11%
Direct program, $239.0 million,
35%
Fixed expenses, $143.3 million,
21%

PAGE 24 > 2014 ANNUAL REPORT TO CONGRESS > FISH & WILDLIFE OVERVIEW FISH & WILDLIFE OVERVIEW < 2014 ANNUAL REPORT TO CONGRESS < PAGE 25
Lake Roosevelt kokaneeThe Council approved a proposal by the Spokane Tribe of Indians to continue producing kokanee — freshwater sockeye salmon — and releasing the fish into Lake Roosevelt behind Grand Coulee Dam. Kokanee provide a culturally important fishery for tribal members.
The Council’s Independent Scientific Review Panel earlier recommended against continued funding of the kokanee production project because the panel considered the tribe’s management plan insufficient and fish-rearing problems in the reservoir environment of Lake Roosevelt difficult if not impossible to overcome. But the tribe responded that it would work with co-managers, the Washington Department of Fish and Wildlife and the Colville Confederated Tribes to respond to the science panel’s concerns and meet production goals. A key challenge is the fact that Lake Roosevelt fluctuates in both elevation and the velocity of water flow because of Grand Coulee Dam operations. The tribe’s challenge is to raise fish in that difficult, complex environment.
The tribe chose to raise and release kokanee as mitigation for the impacts of Chief Joseph and Grand Coulee dams, which blocked salmon passage, so that tribal members would have access to a salmon species for subsistence and as a cultural resource. The annual budget for the ongoing kokanee production, which is funded by Bonneville through the Council’s fish and wildlife program, is less than $200,000 per year.
Walla Walla spring ChinookIn October 2013, the Council approved a master plan developed by the Confederated Tribes of the Umatilla Indian Reservation to move ahead with a new, $11.8 million spring Chinook salmon hatchery. It was a major step because the Tribes worked for more than two decades to secure agreements to leave water in the river for fish while also ensuring that agricultural businesses that also rely on Walla Walla River water remain viable.
The Tribes are proposing to add incubation, early-rearing, and final-rearing facilities to an existing adult-fish holding and spawning facility that is a component of the tribes’ Umatilla Hatchery. The new facility would produce 500,000 yearling spring Chinook smolts annually for
release into the Walla Walla River Basin — 400,000 into the South Fork and 100,000 into the Touchet River. The Tribes’ long-term goal is to provide in‐basin harvest for treaty and non‐treaty fisheries, and restore natural spawning. Spring Chinook were extirpated in the Walla Walla Basin over many decades as the result of altered habitat and water depletions from agricultural practices. Under the current schedule, the new facility would be constructed in 2015 and the first fish would be released in 2017.
Research
Review of proposed 10-year spill testIn response to the Council’s request, the ISAB reviewed an experiment proposed to the Council by the State of Oregon, the Nez Perce Tribe, and others to boost spill at Snake and Columbia river dams when juvenile salmon and steelhead are migrating to the ocean and then determine whether higher spill leads to higher smolt-to-adult survival rates. Proponents of the spill test recommended it as an amendment to the Council’s fish and wildlife program in 2014.
The proposed test would increase spill to 125 percent of total dissolved gas level or biological constraints (at 125 percent, total dissolved gas exceeds water quality criteria set by the states of Oregon and Washington, and criteria modifications through regulatory processes are required). The national EPA total dissolved gas criterion is 110 percent. Fish survival would be monitored and compared to survival under the current spill program, which has lower spill levels that are tailored to each dam compared to the experiment proposed.
The Council asked the ISAB to consider a number of questions, which the ISAB answered in its report submitted to the Council in April. The ISAB could not determine from the prospective modeling whether the proposed experiment would lead to increased smolt-to-adult survival ratios. The report also said that the proposal suffered from an inadequate experimental design and may lead to unintended consequences such as increased gas-bubble disease in juvenile fish and increased fallback of adult fish trying to pass the dams.
Informed by the ISAB report, comments on the report, the recommendations of proponents and opponents of the proposed test, and comments on the recommendations, the Council addressed spill experiments in its 2014 Fish and Wildlife Program. The program says such experiments must be 1) based on the best available science; 2) have appropriate study designs; 3) be subject to review by independent scientists; 4) address issues raised by independent scientific review and peer review; and 5) receive the necessary regulatory approvals consistent with all federal and state laws.
Ocean science forumThe Council’s Ocean and Plume Science and Management Forum met for the first time in October 2013, beginning the task of identifying fisheries management implications of ocean research and priorities for future research. The Forum is expected to produce a list of priority critical uncertainties with clear and measureable hypotheses
that can be reflected in the Council’s research plan and considered for future funding.
The forum includes scientists and fish managers from state and federal agencies, tribes, and the Canadian federal fisheries agency. Information about the forum is posted on a dedicated page on the Council’s website.
Creating the forum as an advisory committee to the Council is an outcome of the Council’s 2010 review of all research, monitoring, and evaluation projects in the fish and wildlife program. That review identified a need to develop a better understanding of research on the effects of the ocean environment on salmon and steelhead from the Columbia River Basin and led to a report by researchers that synthesized various ocean research efforts.

PAGE 26 > 2014 ANNUAL REPORT TO CONGRESS > FISH & WILDLIFE OVERVIEW FISH & WILDLIFE OVERVIEW < 2014 ANNUAL REPORT TO CONGRESS < PAGE 27
Effectiveness of actions taken under the fish and wildlife programSection 4.(h)(12)(A) of the Northwest Power Act directs the Council to include in this annual report to Congress a description of the effectiveness of the fish and wildlife program.
For the last several years, as improvements in storing, accessing, and reporting data gathered through monitoring and evaluation of fish and wildlife projects has improved, the Council began tracking progress of fish and wildlife efforts in the Columbia River Basin using three high-level indicators. Posed as questions, they are:
1. Are Columbia River Basin fish species abundant, diverse, productive, spatially distributed, and sustainable?
2. Are operations of the mainstem Columbia and Snake River hydropower dams meeting the fish-passage survival objectives of the program?
3. What is being accomplished by projects that implement the program?
Over time, the Council expects to augment and refine the initial indicators to provide a more comprehensive picture of fish and wildlife in the basin. For example, at this point most of the indicators for Council actions are related to habitat work. As more information becomes available, this indicator should be expanded to better reflect the breadth of actions that implement the program. While this information stops short of providing evidence of the effectiveness of the Council’s program or individual projects, the Council is separately pursuing additional approaches to shed light on the issue.
With the figure showing adult salmon and steelhead counted at Bonneville Dam on Page 10 of this report, here are three additional figures, copied from the High Level Indicator website (www.nwcouncil.org/ext/hli), that provide an indication of juvenile salmon and steelhead survival through the hydrosystem, and habitat restoration activities:
Miles of Habitat Improved, 2005-2013 (HLI 3A)Reach Survival of Juvenile Snake River Salmon and Steelhead, Lower Granite to Bonneville Dams (HLI 2A)
Source: Fish Passage Center. Calculations for the four populations were provided by Paul Kline, Assistant Chief of Fisheries for the Idaho Department of Fish and Game.
Reach Survival of Juvenile Upper Columbia Hatchery Chinook and Steelhead, McNary to Bonneville Dams (HLI 2B)
Source: Table 32, page 54, Survival Estimates for the Passage of Spring-Migrating Juvenile Salmonids through Snake and Columbia River Dams and Reservoirs, 2013 , Fish Ecology Division, Northwest Fisheries Science Center, National Marine Fisheries Service, National Oceanic and Atmospheric Administration, Seattle, February, 2013. Steelhead estimates were not possible prior to 2003. Multiple release sites were used in each year and not all release sites occurred consistently among years.
Source: www.cbfish.org/project and program information, “Program at a Glance.” Click on the interactive map from www.cbfish.org or on ‘detailed data download’ at that site for a description of the work elements and work completed each year. Data for years prior to 2005 are not included because it is not available on a public website. Work elements reported in this graphic are: • 29: Increase Instream Habitat Complexity and Stabilization • 30: Realign, Connect, and/or Create Channel • 40: Install Fence • 44: Enhance Nutrients Instream • 47: Plant Vegetation • 53: Remove Vegetation • 197: Maintain/Remove Vegetation
0
10
20
30
40
50
60
70
80
90
1997 1998 1999 2000 2001 2002 2003 2004 2005 2006 2007 2008 2009 2010 2011 2012
Rea
ch S
urvi
val (
%)
Wild Chinook Hatchery Chinook
Wild Steelhead Hatchery Steelhead
0
20
40
60
80
100
120
1999 2000 2001 2002 2003 2004 2005 2006 2007 2008 2009 2010 2011 2012 2013
Rea
ch S
urvi
val (
%)
Steelhead Chinook
0
500
1000
1500
2000
2500
3000
3500
4000
2005 2006 2007 2008 2009 2010 2011 2012 2013
Mile
s
Total: 3,613.5 miles Resident fish Anadromous
PAGE 28 > 2014 ANNUAL REPORT TO CONGRESS > PUBLIC AFFAIRS OVERVIEW PUBLIC AFFAIRS OVERVIEW < 2014 ANNUAL REPORT TO CONGRESS < PAGE 29
Outreach, information, and communicationThe Northwest Power Act directs the Council to provide for the participation and consultation of the Pacific Northwest states, tribes, local governments, consumers, electricity customers, users of the Columbia River System, and the public at large in developing regional plans and programs related to energy efficiency, renewable energy resources, other energy resources, and protecting, mitigating, and enhancing fish and wildlife resources. The Council’s Public Affairs Division has the primary responsibility to implement this portion of the Act.
The Division uses a variety of communication tools to perform its mission, including printed and electronic publications, the Council’s website, social media platforms, video, public meetings, and press releases.
The Council’s website, www.nwcouncil.org, functions as the hub of its outreach efforts and public information strategy. The website, which was revised and given a new look in 2013 and 2014, contains myriad documents, publications, data bases, and other forms of information. Included on the site are the current versions of the Northwest Power Plan (www.nwcouncil.org/energy/
powerplan/6) and the 2014 Columbia River Basin Fish and Wildlife Program (www.nwcouncil.org/fw/program/2014-12/), as well as news stories, press releases, Council white papers, official public comment on Council products, PowerPoint presentations, videos, Council newsletters, and links to the Council’s social media platforms.
Social media are used increasingly by the Council to communicate with the public. These include Facebook (www.facebook.com/nwcouncil), Twitter (@nwcouncil), and the Council’s blog, which is posted to our Facebook page and the Council website.
In 2014, the Public Affairs Division transitioned away from a quarterly newsletter and expanded the monthly Council Spotlight (www.nwcouncil.org/news/newsletters/) to include news about the monthly Council meetings and links to posts on the Council blog (www.nwcouncil.org/news/blog/).
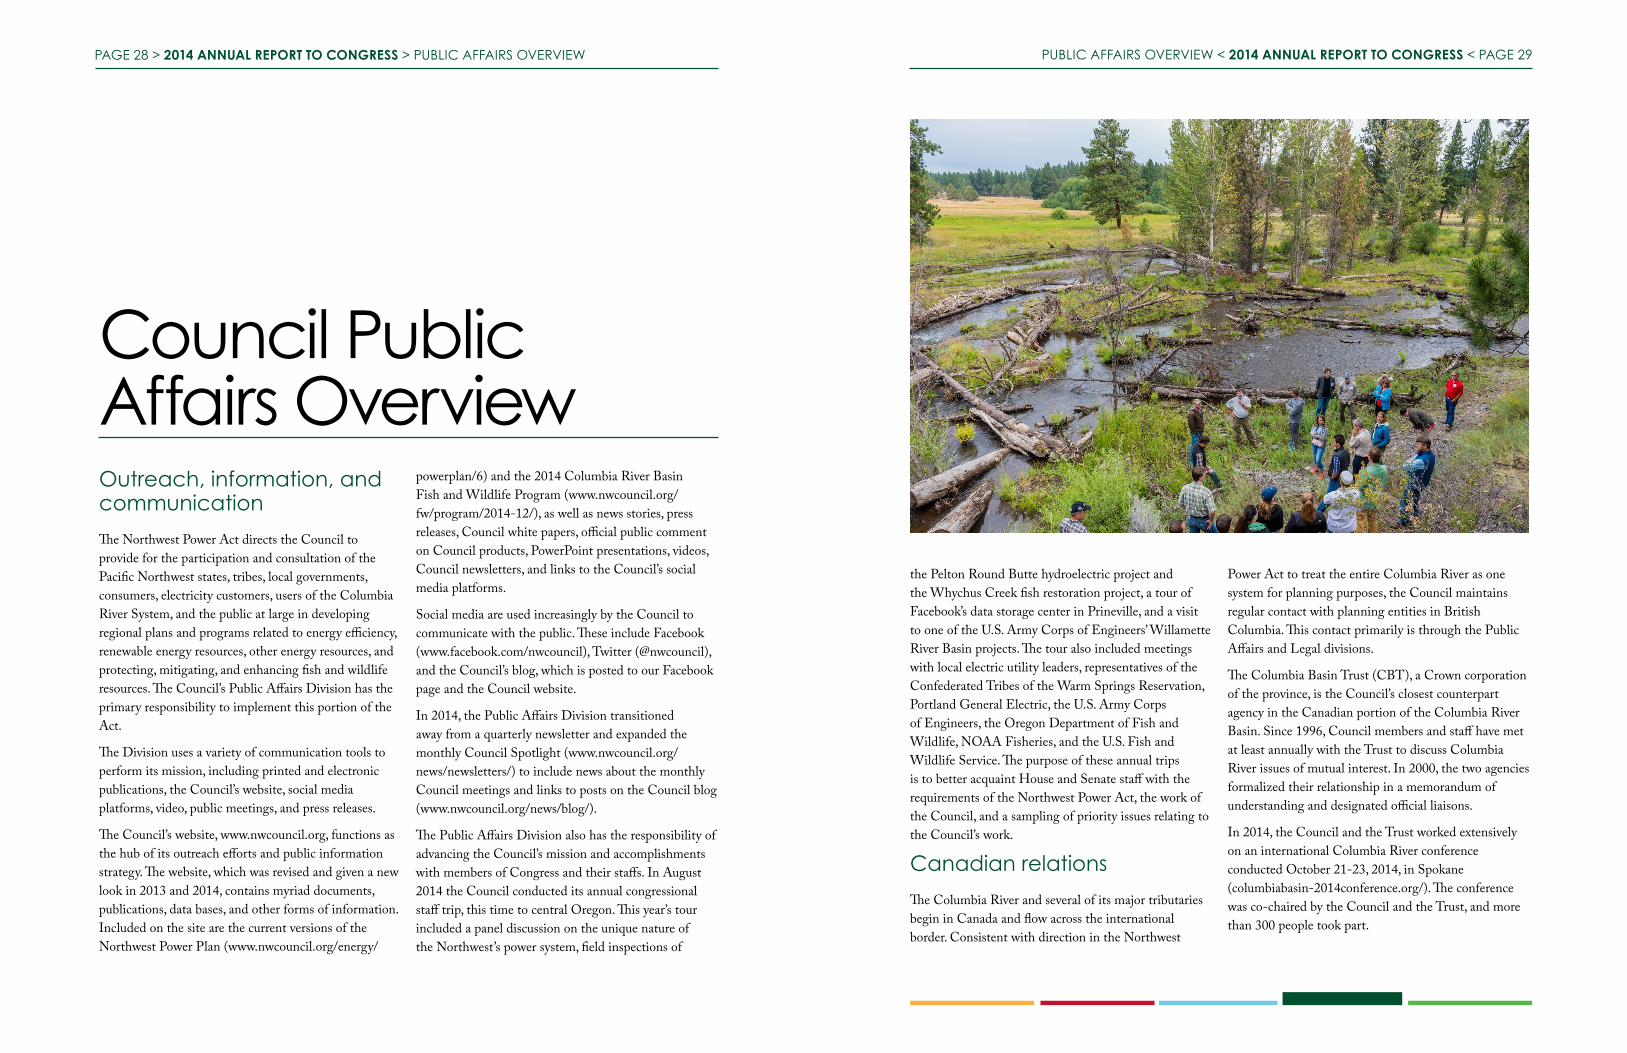
The Public Affairs Division also has the responsibility of advancing the Council’s mission and accomplishments with members of Congress and their staffs. In August 2014 the Council conducted its annual congressional staff trip, this time to central Oregon. This year’s tour included a panel discussion on the unique nature of the Northwest’s power system, field inspections of
Council Public Affairs Overview
the Pelton Round Butte hydroelectric project and the Whychus Creek fish restoration project, a tour of Facebook’s data storage center in Prineville, and a visit to one of the U.S. Army Corps of Engineers’ Willamette River Basin projects. The tour also included meetings with local electric utility leaders, representatives of the Confederated Tribes of the Warm Springs Reservation, Portland General Electric, the U.S. Army Corps of Engineers, the Oregon Department of Fish and Wildlife, NOAA Fisheries, and the U.S. Fish and Wildlife Service. The purpose of these annual trips is to better acquaint House and Senate staff with the requirements of the Northwest Power Act, the work of the Council, and a sampling of priority issues relating to the Council’s work.
Canadian relationsThe Columbia River and several of its major tributaries begin in Canada and flow across the international border. Consistent with direction in the Northwest
Power Act to treat the entire Columbia River as one system for planning purposes, the Council maintains regular contact with planning entities in British Columbia. This contact primarily is through the Public Affairs and Legal divisions.
The Columbia Basin Trust (CBT), a Crown corporation of the province, is the Council’s closest counterpart agency in the Canadian portion of the Columbia River Basin. Since 1996, Council members and staff have met at least annually with the Trust to discuss Columbia River issues of mutual interest. In 2000, the two agencies formalized their relationship in a memorandum of understanding and designated official liaisons.
In 2014, the Council and the Trust worked extensively on an international Columbia River conference conducted October 21-23, 2014, in Spokane (columbiabasin-2014conference.org/). The conference was co-chaired by the Council and the Trust, and more than 300 people took part.

PAGE 30 > 2014 ANNUAL REPORT TO CONGRESS > PUBLIC AFFAIRS OVERVIEW PUBLIC AFFAIRS OVERVIEW < 2014 ANNUAL REPORT TO CONGRESS < PAGE 31
Selected News Articles that Mention the Council
PAGE 32 > 2014 ANNUAL REPORT TO CONGRESS > ADMINISTRATIVE OVERVIEW ADMINISTRATIVE OVERVIEW < 2014 ANNUAL REPORT TO CONGRESS < PAGE 33
FundingThe Northwest Power Act of 1980 establishes a funding mechanism to enable the Council to carry out its functions and responsibilities. The Bonneville Power Administration provides this funding through ratepayer revenues.
The Act establishes a formula to determine a funding limitation threshold and authorizes the Council to determine its organization and prescribe practices and procedures to carry out its functions and responsibilities under the Act. The Act further provides that the funding limitation applicable to annual Council budgets will be calculated on a basis of 0.02 mill multiplied by the kilowatt hours of firm power forecast by Bonneville to be sold during the year to be funded. The limitation may be increased to .10 mill, provided the Council makes an annual showing that such limitation will not permit the Council to carry out its functions and responsibilities under the Act.
The Council has made such a showing in recent years and explains the need for this adjustment in the current budget document, which is posted on our website.
The Council is aware of the current economic challenges facing the four-state region, and the need to maintain
healthy financial conditions for the Bonneville Power Administration. In an effort to be responsive, the Council in Fiscal Year 2015 and Fiscal Year 2016 will continue to adhere to the budget constraints initiated in 1998.
To accomplish this, the Council will:
1. Continue to identify efficiencies in operations and administration in order to limit inflationary increases to below 3 percent on average during fiscal years 2009-2016.
2. Reallocate staffing where possible to absorb new workload without increasing FTEs.
3. Re-prioritize resources as necessary to respond to new requests for technical analysis. Reschedule or postpone work anticipated during the budget-development process in order to respond to the most essential requests for studies and analyses.
Fiscal Year 2016 budget and Fiscal Year 2015 revisionsBased on the major issues and levels of effort discussed in the budget document, the Council determined that the proposed budget expenditures are necessary
Council Administrative Overview
and appropriate for the performance of its functions and responsibilities as authorized by the Northwest Power Act, Section 4(c)(10)(A). The Council further has determined that the 0.02 mill per kilowatt-hour limitation on expenses will not permit the Council to carry out its functions and responsibilities under the Act, Section 4(c)(10)(A). The Council proposes that the projected budget in the amount of $11,236,000 for Fiscal Year 2016, equal to 0.089 mills per kilowatt-hour for the estimate of forecasted firm power sales, be included in the Bonneville administrator’s Fiscal Year 2016 budget submittal.
The Council’s Fiscal Year 2015 revised budget of $10,784,000 includes a $9,000 decrease from the previously submitted Fiscal Year 2015 budget request of $10,793,000. The Council’s budget for Fiscal Year 2016 and Revised Fiscal Year 2015 is based on current-year expenditure levels plus adjustments for shifting workloads, certain program improvements, and cost-of-living adjustment factors as provided by the U.S. Department of Energy (Bonneville) and the Oregon Economic and Revenue Forecast. A number of cost-containment measures for personal services, travel, contracts, and services and supplies have been incorporated in the budget.
Background of the Council
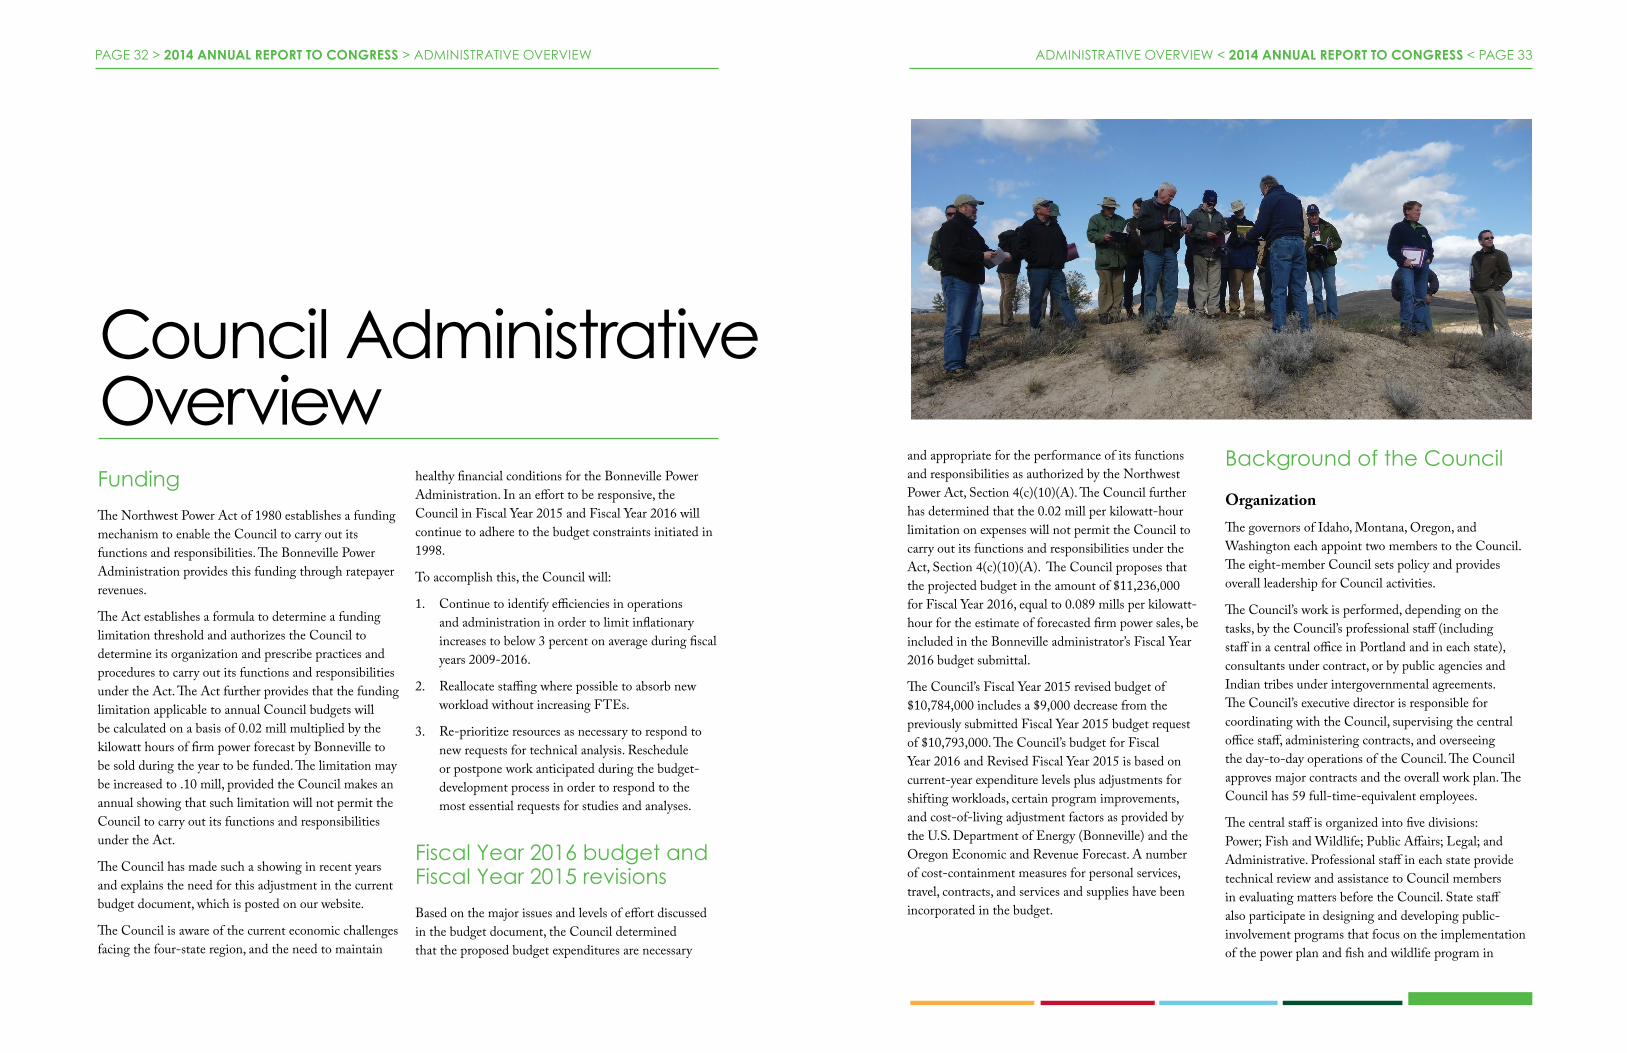
OrganizationThe governors of Idaho, Montana, Oregon, and Washington each appoint two members to the Council. The eight-member Council sets policy and provides overall leadership for Council activities.
The Council’s work is performed, depending on the tasks, by the Council’s professional staff (including staff in a central office in Portland and in each state), consultants under contract, or by public agencies and Indian tribes under intergovernmental agreements. The Council’s executive director is responsible for coordinating with the Council, supervising the central office staff, administering contracts, and overseeing the day-to-day operations of the Council. The Council approves major contracts and the overall work plan. The Council has 59 full-time-equivalent employees.
The central staff is organized into five divisions: Power; Fish and Wildlife; Public Affairs; Legal; and Administrative. Professional staff in each state provide technical review and assistance to Council members in evaluating matters before the Council. State staff also participate in designing and developing public-involvement programs that focus on the implementation of the power plan and fish and wildlife program in

PAGE 34 > 2014 ANNUAL REPORT TO CONGRESS > ADMINISTRATIVE OVERVIEW ADMINISTRATIVE OVERVIEW < 2014 ANNUAL REPORT TO CONGRESS < PAGE 35
their particular states. This support is provided through existing state agencies or by individuals directly under Council member direction.
HistoryThe Council, known until 2003 as the Northwest Power Planning Council, is an agency of the states of Idaho, Montana, Oregon, and Washington and was created as an interstate compact agency by the legislatures of the four states under the authority of the Pacific Northwest Electric Power Planning and Conservation Act of 1980. The Council’s first meeting was in April 1981.
The Northwest Power Act gives the Council three distinct responsibilities: 1) to assure the region an adequate, efficient, economical, and reliable electric power supply; 2) to prepare a program to protect, mitigate, and enhance fish and wildlife, and related spawning grounds and habitat, of the Columbia River Basin affected by the development and operation of any hydroelectric project on the Columbia River and its tributaries; and 3) to inform the Pacific Northwest public regarding these issues and involve them in decision-making. This annual report is organized around the Council’s three key responsibilities.
The Power Act created a special relationship between the Council and the federal agencies that regulate and operate dams in the Columbia River Basin and
sell the electricity that is generated. The administrator of the Bonneville Power Administration, the federal power marketing agency that sells the output of the Federal Columbia River Power System (a system that includes 29 federal dams within the basin and two outside (in southern Oregon), and one non-federal nuclear power plant), is required to make decisions in a manner consistent with the Council’s Northwest Power Plan and its Columbia River Basin Fish and Wildlife Program. Other federal agencies with responsibilities for Columbia River Basin dams (the U.S. Army Corps of Engineers, U.S. Bureau of Reclamation, and Federal Energy Regulatory Commission) are required to take the Council’s power plan and fish and wildlife program into account “at every relevant stage of decision-making to the fullest extent practicable,” in the words of the Act.Despite its relationship to federal agencies, the Council is not a federal agency and its employees are not federal employees. The Council headquarters are in Portland.
More informationFor additional information about the Northwest Power and Conservation Council’s activities, budget, meetings, comment deadlines, policies, or bylaws, call 1-800-452-5161 or visit our website, www.nwcouncil.org. Copies of Council publications are available at the website or by calling the Council. All Council publications are free.
October 8 - 9, 2013, Helena, Montana
November 5-6, 2013, Boise, Idaho
December 10-11, 2013, Portland
January 14-15, 2014, Portland
February 11-12, 2014, Portland
March 11-12, 2014, Portland
April 8-9, 2014, Spokane
April 30, 2014, Portland
May 6-7, 2014, Boise
June 10-11, 2014, Missoula
July 8-9, 2014, Portland
August 5-6, 2014, Portland
August 18, 2014, Portland
August 21, 2014, Portland
September 8-10, 2014
Council Meetings, Fiscal Year 2014Meeting agendas and minutes are posted at www.nwcouncil.org/news/meetings.

PAGE 36 > 2014 ANNUAL REPORT TO CONGRESS > ADMINISTRATIVE OVERVIEW ADMINISTRATIVE OVERVIEW < 2014 ANNUAL REPORT TO CONGRESS < PAGE 37
Comments of the Bonneville Power Administration

PAGE 38 > 2014 ANNUAL REPORT TO CONGRESS > ADMINISTRATIVE OVERVIEW ADMINISTRATIVE OVERVIEW < 2014 ANNUAL REPORT TO CONGRESS < PAGE 39
Council Members, Fiscal Year 2014
Executive Director: Steve Crow
Power Planning Director: Tom Eckman
Fish and Wildlife Director: Tony Grover
Public Affairs Director: Mark Walker
General Counsel: John Shurts
Administrative Officer: Sharon Ossmann
Central Office
851 S.W. Sixth Avenue, Suite 1100 Portland, OR 97204 503-222-5161 fax 503-820-2370 Toll Free: 1-800-452-5161 [email protected]
Phil Rockefeller 924 Capitol Way South, Suite 105 Olympia, WA 98501 360-943-1439 [email protected]
Washington
Tom Karier
668 N Riverpoint Blvd, Suite 137 Spokane, WA 99202 509-828-1210 [email protected]
Idaho
Bill Booth E. 1677 Miles Ave, Suite 103 Hayden Lake, ID 83835 208-772-2447 [email protected]
Jim Yost
450 W. State (UPS only) P.O. Box 83720 Boise, ID 83720-0062 208-334-6970 [email protected]
Oregon
Bill Bradbury, Chair 851 SW Sixth Ave., Suite 1020 Portland, OR 97204 503-229-5171 [email protected]
Henry Lorenzen
222 S. E. Dorion Avenue P.O. Box 218 Pendleton, Oregon 97801 541-276-3331 [email protected]
Montana
Jennifer Anders, Vice Chair 30 W 14th St #207 Helena, MT 59601 406-603-4013 [email protected]
Pat Smith
30 W 14th St #207 Helena, MT 59601 406-603-4013 [email protected]

851 S.W. SIXTH AVENUE, SUITE 1100 | PORTLAND, OREGON 97204-1348 WWW.NWCOUNCIL.ORG | 503-222-5161 | 800-452-5161 | FAX: 503-820-2370 STEVE CROW, EXECUTIVE DIRECTOR | DOCUMENT 2015-02
Northwest Power andConservation Council