THE STATE HOSPITALS BOARD FOR SCOTLAND
17
Paper No. 19/47 1 | Page THE STATE HOSPITALS BOARD FOR SCOTLAND Date of Meeting: 20 June 2019 Agenda Reference: Item: 21 Sponsoring Director: Finance and Performance Management Director Author: Clinical Effectiveness Team Leader Title of Report: LDP Performance Report 2018/2019 and Comparative Annual Figures. Purpose of Report: To provide KPI data and information on performance management activities. 1 SITUATION This report presents a high-level summary of organisational performance for the year from 1 st April 2018 until 31 st March 2019 and is based on the Local Delivery Plan (LDP) and its associated targets and measures. The data for Q1-Q4 are reported to present an overview of performance over the year (Appendix 1). The only national LDP standards directly relevant to the State Hospital are as follows: Psychological Therapies Waiting Times and Sickness Absence. Additional local KPIs are reported to the Board and included in this report. Going forward, the LDP process has been replaced by a requirement for each Board to submit an Annual Operational Plan for 2018-19. A review of the broader LDP standards is also being undertaken at a national level. The figures from the previous three years have been included for comparison. The comparisons between the years have been made on the same periods – annual data against annual data, rolling figures against rolling figures etc (Appendix 2). Quarterly trend graphs have been included (Appendix 3) to show trends over time since 2017. It should be noted that due to the low number of patients, natural variations in the population can have an effect on the sample and small changes in our Key Performance Indicators (KPI) figures can look more significant when presented as percentages. These limitations should be borne in mind when considering this comparative data. 2 BACKGROUND Members receive quarterly updates on Key Performance Indicator (KPI) performance as well as an Annual Overview of performance and a Year-on-Year comparison each June.
Transcript of THE STATE HOSPITALS BOARD FOR SCOTLAND

Paper No. 19/47
1 | P a g e
THE STATE HOSPITALS BOARD FOR SCOTLAND
Date of Meeting: 20 June 2019 Agenda Reference: Item: 21 Sponsoring Director: Finance and Performance Management Director Author: Clinical Effectiveness Team Leader Title of Report: LDP Performance Report 2018/2019 and Comparative
Annual Figures. Purpose of Report: To provide KPI data and information on performance
management activities.
1 SITUATION This report presents a high-level summary of organisational performance for the year from 1st April 2018 until 31st March 2019 and is based on the Local Delivery Plan (LDP) and its associated targets and measures. The data for Q1-Q4 are reported to present an overview of performance over the year (Appendix 1). The only national LDP standards directly relevant to the State Hospital are as follows: Psychological Therapies Waiting Times and Sickness Absence. Additional local KPIs are reported to the Board and included in this report. Going forward, the LDP process has been replaced by a requirement for each Board to submit an Annual Operational Plan for 2018-19. A review of the broader LDP standards is also being undertaken at a national level. The figures from the previous three years have been included for comparison. The comparisons between the years have been made on the same periods – annual data against annual data, rolling figures against rolling figures etc (Appendix 2). Quarterly trend graphs have been included (Appendix 3) to show trends over time since 2017. It should be noted that due to the low number of patients, natural variations in the population can have an effect on the sample and small changes in our Key Performance Indicators (KPI) figures can look more significant when presented as percentages. These limitations should be borne in mind when considering this comparative data. 2 BACKGROUND
Members receive quarterly updates on Key Performance Indicator (KPI) performance as well as an Annual Overview of performance and a Year-on-Year comparison each June.

Paper No. 19/47
2 | P a g e
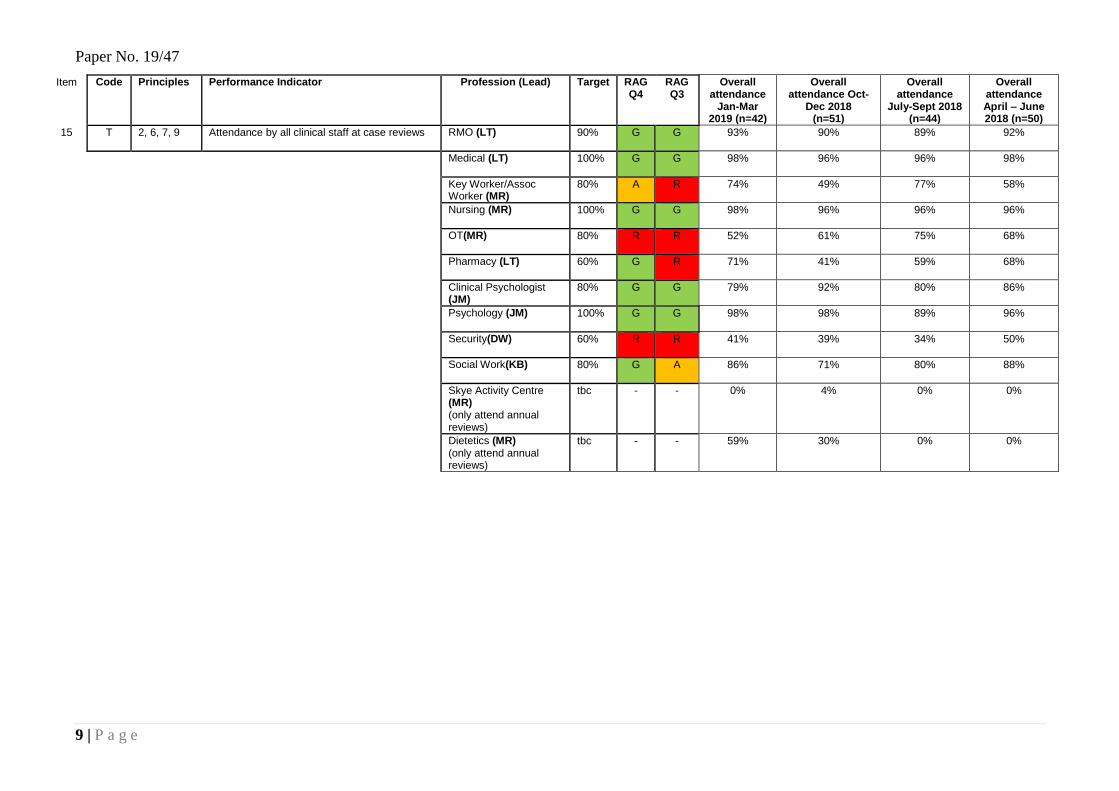
3 ASSESSMENT No 1 Patient have their care and treatment plans reviewed at 6 monthly intervals. Performance has improved further in 2018/19 and the figure for March 2019 was 96.9% compared with 95.4% the previous year. On 31 March 2019 there were 109 patients in the hospital. 8 of these patients were in the admission phase. 4 CPA documents had not been reviewed within the 6 month period. All 4 were out of date (one was completed shortly after the due date, the other 3 are outstanding). Health Records staff continue to send reminder emails to RMOs and medical secretarial staff to advise that a patient’s review or renewal of detention is due. The renewal of detention ties in with the annual CPA document being completed. These continue to be completed and uploaded to RiO by secretarial staff in shorter timescales than previously noted. No 2 Patients will be engaged in psychological therapy. Performance over the course of the year was consistently above target. Psychological Therapy Services have been actively engaging patients in the last quarter to ensure that all patients are encouraged to participate in psychological therapies. No 3 Patients will be engaged in off-hub activities. This indicator has seen an improvement from 78.7% in 2017/18 to 81.7% in 2018/19. There was slight fluctuation during the year that was mainly due to patient discharges and new admissions not being approved by the Clinical Team to attend activity at the Skye Centre. No 4 Annual Physical Health Review and No 10 Access to Primary Care. The Health Centre consistently meets its targets. There was a slight dip in Q4 when invite letters were not sent for the month of March but this has been highlighted. The 48-hour access statistics are based on access to the appropriate healthcare professional, not solely the GP. Currently this would include the Practice Nurse, General Practitioners, Junior Doctors, Physiotherapist, Optician, Dental Team and NHS24. No 5 Patients will undertake 90 minutes of exercise each week. This is the first full year that we have been able to report data for this indicator. The forms are being completed on RiO that now allows us to access physical activity data. The target of 60% was met in Q2 and Q3 but Q3 saw a reduction to 38.8%. Q4 saw an improvement to 59.3% just under the target. Overall for the year the 60% target was missed by 3.7%. The reduction from 62.2% in Q2 to 38.8% in Q3 was, in part, due to the reduced number of hours patients can utilise ground access in the winter season. Other reasons included the 2 public holidays through the month of December whereby patients were unable to access facilities like the Sports and Fitness Centre, Gardens Department and walking groups either on a 1:1 or group basis. No 6 Healthier BMI. The percentage of patients who have a healthier BMI decreased from 15.8% in the previous year to 13.7%. In Q3 it was shown to be down to patients with healthy BMIs being discharged and patients with unhealthy BMIs being admitted. In 2018/19 the Supporting Healthy Choices Group action plan was delivered to improve BMIs. Some examples from the action plan were:

Paper No. 19/47
3 | P a g e
Every patient receives an information pack on admission which includes information on nutrition, physical wellbeing and obesity risk factors.
A new information sheet has been developed for carers and is included within each Carer Welcome pack.
An electronic patient exercise recording system was successfully piloted and introduced throughout the hospital.
Eight healthy wellbeing plans have been approved and are being piloted.
A physical activity booklet had been produced and is being piloted.
The Hospital Shop continues with its Healthy Retail Standards (80% healthy)
External food procurement has ceased. The data for BMI is now being input directly into RiO my nursing staff on the wards on a monthly basis rather than the dietetic assistant visiting wards on a 6 monthly basis to take these measurements. This allows for more frequent analysis on the BMI of our patients.
No 7 Sickness absence. In the reporting period 1 April 2018 to 31 March 2019 the rate of absence was 8.26% compared to 8.52% in the previous year. This is against a 5% target. The financial year 18/19 saw sustained pressure on staffing as a direct consequence of sickness absence that significantly exceeds the required standard. This has impacted negatively on the requirement for additional hours, with a subsequent pressure on front line staff to fill shifts, demands on staff to work additional hours, and a detrimental impact on budget. This has been an area of concern for the SMT and for the Board, with a new approach required to enhance governance and assurance in relation to these areas. An improvement plan led by the Human Resources Director was commissioned by the Staff Governance Committee. The improvement plan includes a number of specific areas of work including:
Improved Workforce Information to support managers identify trends and target
interventions.
Enhanced support for managers to ensure Policy Compliance.
Data only collected 6 monthly
Data only collected 6 monthly
Data collection changed to quarterly
Data collection changed and
coming from RiO
0%
5%
10%
15%
20%
25%
Apr-Jun '17 Jul-Sept '17 Oct-Dec '17 Jan-Mar '18 Apr-Jun '18 Jul-Sept 18 Oct-Dec '18 Jan-Mar '19
Percentage of patients with a healthy BMI - Target is 25%

Paper No. 19/47
4 | P a g e
Enhanced Human Resource support for managers.
OHS and EASY performance.
Agreement on individual or collective actions.
Employee engagement and responsibilities.
Supplementary staffing alternatives.
Whilst there is evidence of a reduction in absence from 2017 onward, the improvement work will continue until this is sustained. No 8 Staff have an approved PDP. The PDR compliance level at 31 March 2019 was 80.9%. Although this is a reduction from the 2018 figure of 84.7% it should be noted that a new system, called Turas Appraisal, officially went live in April 2018. This means that documentation for review is now completed electronically and recorded within Turas Appraisal. Monthly monitoring is indicating a positive upwards trajectory and there is clear evidence of month-on-month improvements in organisational compliance throughout Quarter 4. Staffing resource pressures and high levels of staff absence, which impact on reviewer and reviewee availability and capacity to undertake reviews, are a key contributory factors to lower levels of compliance in some wards and departments.
No 9 Patients are transferred using CPA. 97% of patients were discharged / transferred using the Care Programme Approach (CPA) against a target of 100%, which is a decline on last year’s performance of 99%. The one patient who was not discharged using the Care Programme Approach was discharged to hospice care. This transfer was handled successfully with State Hospital staff supporting hospice staff for a number of days post transfer.
No 10 – refer to No 4. No 11 Patients will commence psychological therapies <18 weeks from referral date. All but one patient commenced treatment within this timescale in the course of the year. No 12 Patients will engage in meaningful activity on a daily basis. No 13 Hubs have a monthly community meeting. Indicators 12 and 13 are to be replaced. A Performance Management Task Force has been set up to review all the current KPIs and suggest more appropriate KPIs. Four logical models are being worked on at present as part of this piece of work. No 14 Patients will have their clinical risk assessment reviewed annually. Performance has remained only slightly below the 100% target throughout the year. The figure for March 2019 is 100%. The system put in place from April 2017 has worked well over the past year and clinical risk assessments are now being completed timeously and in line with significant dates for each patient (e.g. date of renewal of detention or annual report). Monitoring and auditing of this system are ongoing.

Paper No. 19/47
5 | P a g e
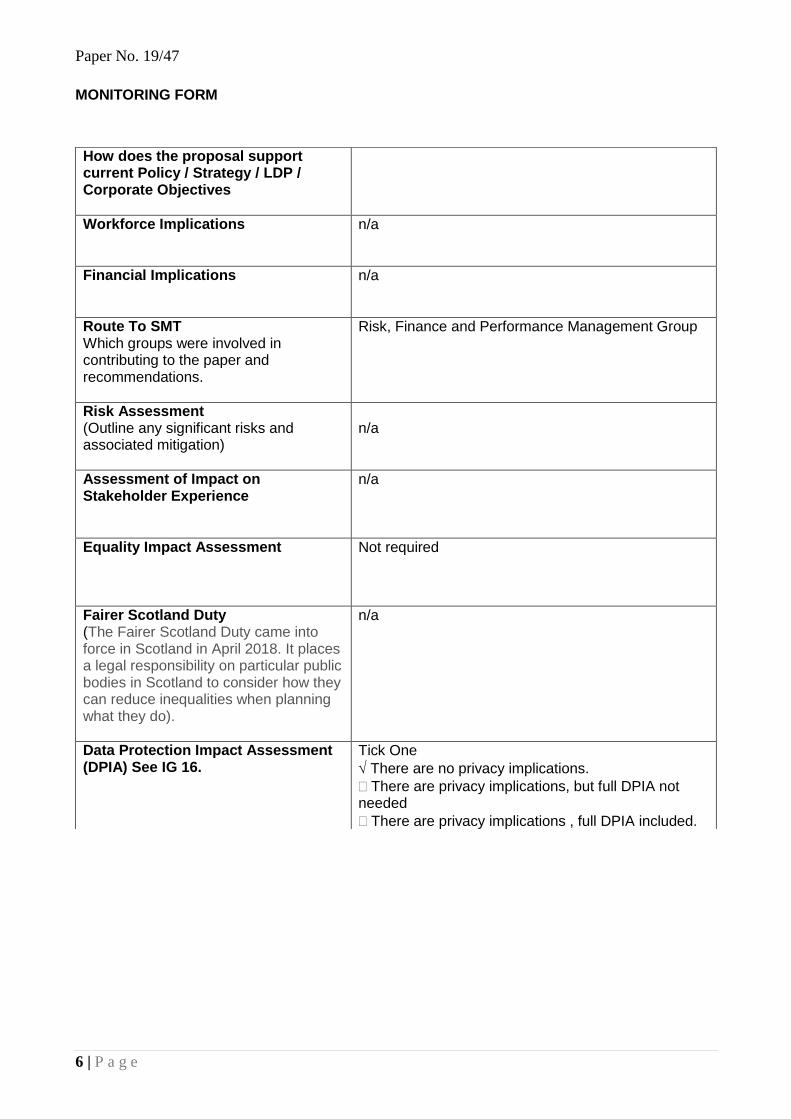
No 15 Attendance by clinical staff at case reviews. The table below provides comparative data on the extent to which professions met their attendance target.
Target 16/17 17/18 18/19 Increase/Decrease
RMO 90% 97.0% 94.8% 90.9% -3.9%
KW/AW 80% 72.0% 75.2% 63.6% -11.6%
OT 80% 48.0% 65.5% 64.2% -1.3%
Skye Activity Centre tbc 0.0% 1.0% 1.1%
0.1%
Pharmacy 60% 75.0% 57.2% 59.4% 2.2%
Psychology 80% 72.0% 69.6% 84.5% 14.9%
Security 60% 60.0% 59.8% 41.2% -18.6%
Social Work 80% 76.0% 79.9% 80.8% 0.9%
Dietetics tbc 12.0% 3.0% 23.6% 20.6%
Hospital Wide n/a 59.0% 57.9% 56.6% -1.3%
RMO – during 2018/19 there was a reduction in RMO attendance at case reviews. Whilst his reduced by 3.9% the 90% target was still reached. Key Worker/Associate Worker – attendance by KW/AW has fallen by 11.6% to 63.6%. This is the lowest annual attendance figure since trend reporting commenced in 2012 and is 16.4% away from the 80% target. Occupational Therapy – during 2018/19 there remained challenges with Occupational Therapy staff that resulted in some wards having no OT input. This was reflected within the attendance figures at annual and intermediate case reviews. Psychology – there has been an increase of 14.9% attendance for 2018/19. This means that the target of 80% has now been met. Security – Performance has reduced through the year with the target of 60% not being met. There has been an 18.6% reduction to 41.2% in their attendance at annual and intermediate case reviews during 2018/19. This is the lowest annual attendance figure since trend reporting commenced in 2012. Dietetics – during 2018/19 attendance improved by 20.6% compared to the previous year. This is, in the main, due to the recruitment of a Dietitian post that had been vacant for some time.
4 RECOMMENDATION The Board is asked to note the contents of this report.
Paper No. 19/47
6 | P a g e
MONITORING FORM
How does the proposal support current Policy / Strategy / LDP / Corporate Objectives
Workforce Implications n/a
Financial Implications n/a
Route To SMT Which groups were involved in contributing to the paper and recommendations.
Risk, Finance and Performance Management Group
Risk Assessment (Outline any significant risks and associated mitigation)
n/a
Assessment of Impact on Stakeholder Experience
n/a
Equality Impact Assessment
Not required
Fairer Scotland Duty (The Fairer Scotland Duty came into force in Scotland in April 2018. It places a legal responsibility on particular public bodies in Scotland to consider how they can reduce inequalities when planning what they do).
n/a
Data Protection Impact Assessment (DPIA) See IG 16.
Tick One
There are no privacy implications.
There are privacy implications, but full DPIA not needed
There are privacy implications , full DPIA included.

Paper No. 19/47
7 | P a g e

Paper No. 19/47
8 | P a g e
APPENDIX 1 Key Performance Indicators 2018/19: Comparison across Q1-4
Item Item Principles Performance Indicator Target Q1 Apr-Jun Q2 Jul-Sep Q3 Oct-Dec Q4 Jan- Mar LEAD
1 8 Patients have their care and treatment plans reviewed at 6 monthly intervals 100% 100 94.9 96.9 96.1 LT
2 8 Patients will be engaged in psychological treatment 85% 96.3 94 93 88 JM
3 8 Patients will be engaged in off-hub activity centres 90% 81.7 79 84 82 MR
4 8 Patients will be offered an annual physical health review 90% 100 100 100 71 LT
5 8 Patients will undertake 90 minutes of exercise each week 60% 64.9 62.2 38.8 59.3 MR
6 8 Patients will have a healthier BMI (bi-annual audit) 25% 18.8 14.5 11.6 10 LT
7 5 Sickness absence (National HEAT standard is 4%) 5% 9.73 6.83 7.3 6.34 KS
8 5 Staff have an approved PDP 100% 74.1 59.2 74.7 80.9 KS
9 1, 3 Patients transferred/discharged using CPA 100% 100 87.5 100 100 LT
10 1, 3 Patients requiring primary care services will have access within 48 hours 100% 100 100 100 100 LT
11 1, 3 Patients will commence psychological therapies <18 weeks from referral date 100% 100 94 100 100 JM
12 1, 3 Patients will engage in meaningful activity on a daily basis - New indicators to be agreed. MR
13 2,6,7,9 Hubs have a monthly community meeting - New indicators to be agreed. MR
14 2, 6, 7, 9 Patients have their clinical risk assessment reviewed annually. 100% 100 98.1 98.1 99 LT
15 Refer to next table. All Clinical Leads
Paper No. 19/47
9 | P a g e
Item Code Principles Performance Indicator Profession (Lead) Target RAG Q4
RAG Q3
Overall attendance
Jan-Mar 2019 (n=42)
Overall attendance Oct-
Dec 2018 (n=51)
Overall attendance
July-Sept 2018 (n=44)
Overall attendance April – June 2018 (n=50)
15 T 2, 6, 7, 9 Attendance by all clinical staff at case reviews RMO (LT) 90% G G 93% 90% 89% 92%
Medical (LT) 100% G G 98% 96% 96% 98%
Key Worker/Assoc Worker (MR)
80% A R 74% 49% 77% 58%
Nursing (MR) 100% G G 98% 96% 96% 96%
OT(MR) 80% R R 52% 61% 75% 68%
Pharmacy (LT) 60% G R 71% 41% 59% 68%
Clinical Psychologist (JM)
80% G G 79% 92% 80% 86%
Psychology (JM) 100% G G 98% 98% 89% 96%
Security(DW) 60% R R 41% 39% 34% 50%
Social Work(KB) 80% G A 86% 71% 80% 88%
Skye Activity Centre (MR) (only attend annual reviews)
tbc - - 0% 4% 0% 0%
Dietetics (MR) (only attend annual reviews)
tbc - - 59% 30% 0% 0%

Paper No. 19/47
10 | P a g e
APPENDIX 2: KEY PERFORMANCE INDICATORS 2018-19 AND COMPARISION WITH 2017-18, 2016-17 AND 2015-16
Item Principles Performance Indicator Target RAG 18/19 17/18 16/17 15/16 LEAD
1 8 Patients have their care and treatment plans reviewed at 6 monthly intervals
100% G 96.9% 95.4% 91% 98% Figure to March each year. LT
2 8 Patients will be engaged in psychological treatment
85% G 92.8% 94.4% 96.4% 90.6% Figure to March each year. MS/ GM
3 8 Patients will be engaged in off-hub activity centres 90% A 81.7% 78.7% 79.3% 81% Attendance averaged for the year. MR
4 8 Patients will be offered an annual physical health review.
90% G 93% 100% 100% 100% Figure for Apr 2018 - Mar 2019. LT
5 8 Patients will undertake 90 minutes of exercise each week (Annual Audit)
60% A 56.3% Q4 only 48.7%
- - Average figure for April 2018 – March 2019 MR
6 8 Patients will have a healthier BMI 25% R 13.7% 15.8% 13.6% 15%
Average figure from April 2018 – March 2019 LT
7 5 Sickness absence (National HEAT standard is 4%) ** 5% R 8.26 8.52% 8.35% 8.03% Figure for April 2017-March 2018. JW
8 5 Staff have an approved PDP *100% R 80.9% 84.7% 73%
82.7% Figure to March 2019. JW
9 1, 3 Patients transferred/discharged using CPA 100% G 97% 99% 100% 100% Figures for April 2018 - March 2019. 1 patient in year. KB
10 1, 3 Patients requiring primary care services will have access within 48 hours
*100% G 100% 100% 100% 100% Figures for April 2017 - March 2018. LT
11 1, 3 Patients will commence psychological therapies <18 weeks from referral date
**100% G 98.5% 100% 100% 100% Figure to March 2018. MS/ GM
12 1, 3 Patients will engage in meaningful activity on a daily basis
100% - - - - New indicators to be agreed. MR
13 Hubs have a monthly community meeting 100% - - - - New indicators to be agreed. MR
14 2, 6, 7, 9 Patients have their clinical risk assessment reviewed annually.
100% G 99% 99.1% 97% 97.3% Figure to March 2019. LT
15 2, 6, 7, 9 Attendance by all clinical staff at case reviews
See above
- 56.6% overall
57.9% overall
59% overall
59% overall
Figures for April 2018- Mar 2019.
All Leads
Definitions for red, amber and green zone
o For all but item 6 and 7 green is 5% or less away from target, amber is between 5.1% and 10% away from target and Red will mean we are over
10% away from target
o For item 6 ‘Patients have a healthier BMI’ green will be 3% or less away from target, amber will be between 3.1% and 5% away from target and red
will be over 5% away from target
o For 7 ‘Sickness absence’ green is less than 0.5% from target, amber will be between 0.51% and 1% away from target and red will be over 1% and
away from target

Paper No. 19/47
11 | P a g e
Appendix 3 : Trend Graphs for Performance Management Data
Item 1 : Patients have their care and treatment plans reviewed at 6 monthly intervals
Item 2 : Patients will be engaged in psychological treatment
0%
10%
20%
30%
40%
50%
60%
70%
80%
90%
100%
Apr-Jun '17 Jul-Sept '17 Oct-Dec '17 Jan-Mar '18 Apr-Jun '18 Jul-Sept 18 Oct-Dec '18 Jan-Mar '19
Patients have their care and treatment plans reviewed at 6 monthly intervals - target = 100%
0%
10%
20%
30%
40%
50%
60%
70%
80%
90%
100%
Apr-Jun '17 Jul-Sept '17 Oct-Dec '17 Jan-Mar '18 Apr-Jun '18 Jul-Sept 18 Oct-Dec '18 Jan-Mar '19
Patients will be engaged in psychological treatment - target = 85%

Paper No. 19/47
12 | P a g e
Item 3 : Patients will be engaged in off-hub activity centres
Item 4 : Patients will be offered an annual physical health review
0%
10%
20%
30%
40%
50%
60%
70%
80%
90%
100%
Apr-Jun '17 Jul-Sept '17 Oct-Dec '17 Jan-Mar '18 Apr-Jun '18 Jul-Sept 18 Oct-Dec '18 Jan-Mar '19
Patients will be engaged in off-hub activity centres - target = 90%
0%
10%
20%
30%
40%
50%
60%
70%
80%
90%
100%
Apr-Jun '17 Jul-Sept '17 Oct-Dec '17 Jan-Mar '18 Apr-Jun '18 Jul-Sept 18 Oct-Dec '18 Jan-Mar '19
Patients will be offered an annual physical health review - target = 90%
Paper No. 19/47
13 | P a g e
Item 5: Patients will undertake 90 minutes of exercise each week
Item 6: Patients will have a healthier BMI
0%
10%
20%
30%
40%
50%
60%
70%
80%
90%
100%
Jan-Mar '18 Apr-Jun '18 Jul-Sept 18 Oct-Dec '18 Jan-Mar '19
Patients will undertake 90 minutes of exercise each week - target = 80%
Data only collected 6 monthly Data only collected 6 monthly
Data collection changed to quarterly
Data collection method changed - now from RiO0%
10%
20%
30%
40%
50%
60%
70%
80%
90%
100%
Apr-Jun '17 Jul-Sept '17 Oct-Dec '17 Jan-Mar '18 Apr-Jun '18 Jul-Sept 18 Oct-Dec '18 Jan-Mar '19
Percentage of patients with a healthy BMI - Target is 25%

Paper No. 19/47
14 | P a g e
Item 7: Sickness Absence
Item 8: Staff have an approved PDR
0.00%
2.00%
4.00%
6.00%
8.00%
10.00%
12.00%
14.00%
16.00%
18.00%
20.00%
Apr-Jun '17 Jul-Sept '17 Oct-Dec '17 Jan-Mar '18 Apr-Jun '18 Jul-Sept 18 Oct-Dec '18 Jan-Mar '19
Sickness absence (National HEAT standard is 4%)
0%
10%
20%
30%
40%
50%
60%
70%
80%
90%
100%
Apr-Jun '17 Jul-Sept '17 Oct-Dec '17 Jan-Mar '18 Apr-Jun '18 Jul-Sept 18 Oct-Dec '18 Jan-Mar '19
Staff have an approved PDR - target = 100%

Paper No. 19/47
15 | P a g e
Item 9: Patients transferred/discharged using CPA
Item 10: Patients requiring primary care services will have access within 48 hours – No target line has been used as target has been met every quarter
0%
10%
20%
30%
40%
50%
60%
70%
80%
90%
100%
Apr-Jun '17 Jul-Sept '17 Oct-Dec '17 Jan-Mar '18 Apr-Jun '18 Jul-Sept 18 Oct-Dec '18 Jan-Mar '19
Patients transferred/discharged using CPA - target = 100%
0%
10%
20%
30%
40%
50%
60%
70%
80%
90%
100%
Apr-Jun '17 Jul-Sept '17 Oct-Dec '17 Jan-Mar '18 Apr-Jun '18 Jul-Sept 18 Oct-Dec '18 Jan-Mar '19
Patients requiring primary care services will have access within 48 hours - target = 100%

Paper No. 19/47
16 | P a g e
Item 11: Patients will commence psychological therapies <18 weeks from referral date
Item 13: Patients have their clinical risk assessment reviewed annually
0%
10%
20%
30%
40%
50%
60%
70%
80%
90%
100%
Apr-Jun '17 Jul-Sept '17 Oct-Dec '17 Jan-Mar '18 Apr-Jun '18 Jul-Sept 18 Oct-Dec '18 Jan-Mar '19
Patients will commence psychological therapies <18 weeks from referral date - target = 100%
0%
10%
20%
30%
40%
50%
60%
70%
80%
90%
100%
Apr-Jun '17 Jul-Sept '17 Oct-Dec '17 Jan-Mar '18 Apr-Jun '18 Jul-Sept 18 Oct-Dec '18 Jan-Mar '19
Patients have their clinical risk assessment reviewed annually - target = 100%

Paper No. 19/47
17 | P a g e
Item 15: MDT Attendance at Case Review
0.00%
10.00%
20.00%
30.00%
40.00%
50.00%
60.00%
70.00%
80.00%
90.00%
100.00%
Axi
s Ti
tle
Professional Attendance at CPA Reviews
Apr-Jun '17
Jul-Sept '17
Oct-Dec '17
Jan-Mar '18
Apr-Jun '18
Jul-Sept 18
Oct-Dec '18
Jan-Mar '19