
The spatial modelling of high-latitude plant richness and ...
50
The spatial modelling of high-latitude plant richness and refugia in a changing environment ANNINA NISKANEN DEPARTMENT OF GEOSCIENCES AND GEOGRAPHY A61 / HELSINKI 2018 ACADEMIC DISSERTATION To be presented, with the permission of the Faculty of Science of the University of Helsinki, for public examination in auditorium XII, University main building, on 16th March 2018, at 12 o’clock noon.
Transcript of The spatial modelling of high-latitude plant richness and ...

The spatial modelling of high-latitude plant richness and refugia in a changing environment
ANNINA NISKANEN
DEPARTMENT OF GEOSCIENCES AND GEOGRAPHY A61 / HELSINKI 2018
ACADEMIC DISSERTATIONTo be presented, with the permission of the Faculty of Science of the University of Helsinki, for public examination in auditorium XII, University main building, on 16th March 2018, at 12 o’clock noon.

ISSN-L 1798-7911ISSN 1798-7911 (print)ISBN 978-951-51-2947-5 (paperback) ISBN 978-951-51-2948-2 (PDF)http://ethesis.helsinki.fi Printed in Painosalama OyTurku 2018
© Annina Niskanen (synopsis)© Springer (Papers I and III)© Geografiska Annaler: Series A, Physical Geography (Paper II)Cover photo: Annina Niskanen
Author´s address: Annina Niskanen Department of Geosciences and Geography P.O.Box 64 00014 University of Helsinki Finland [email protected]
Supervised by: Professor Miska Luoto Department of Geosciences and Geography University of Helsinki, Finland
Co–supervised by: Dr. Risto Heikkinen Finnish Environmental Institute, Finland
Reviewed by: Professor Yvonne Buckleyt School of Natural Sciences Trinity College Dublin, Ireland
Professor Jon Sadler School of Geography, Earth and Environmental Sciences University of Birmingham, United Kingdom
Discussed with: Professor Thomas Hickler Institute of Physical Geography Goethe Universität Frankfurt am Main, Germany
Niskanen A., 2018. The spatial modelling of high-latitude plant richness and refugia in a changing environment. Department of Geosciences and Geography A61. 49 pages and 8 figures.
Abstract
Arctic-alpine regions are facing notable chang-es in climatic conditions. The impacts of cli-mate change on the environment and biota have been tackled in a range of earlier studies, but im-proved understanding is needed to assess how these changes cascade into the distributions of species in space and time, and ultimately, what they might mean for the Arctic-alpine realm as we know it. Such information is crucial as these high-latitude environments are expected to be among those most susceptible to ongoing glob-al change. This vulnerability highlights the im-portance of identifying the key drivers of Arc-tic-alpine plant richness patterns as well as the landscape features that support the persistence of species populations and richness.
This thesis will address the aforementioned k nowledge gaps by 1) examining the determi-nants and spatial nature of present-day refugia; 2) investigating drivers of plant richness features and how projected richness hotspots coincide with conservation areas; 3) forecasting refugia for species persistence and how they are relat-ed to topo-geological features; and 4) predicting forthcoming changes in species distributions and sensitivity, and whether these are affected by bio-geographic history. To accomplish these objec-tives, multiple statistical modelling approaches were combined with extensive data on species occurrences and ecologically relevant environ-mental drivers. Models were built for refugia, individual vascular plant species, and various as-pects of species richness. Changes in species re-sponses were projected across different climate
scenarios and landscapes in an environmentally variable, large geographic area in Fennoscandia.
Results revealed a pronounced climate-de-pendency of high-latitude species and refugia, suggesting that climate change will have a sub-stantial impact on the region’s flora. However, the incorporation of topo-geological drivers con-sistently and significantly improved models and forecasts of refugia. Given this, refugia may be especially important for species persistence un-der more severe climate scenarios and could be particularly critical for threatened and range-re-stricted species. Diversity hotspots exhibited low congruence due to variance in key drivers: for example, total species richness prospers in warm-er conditions, while hotspots of range-restricted species occur near the cooler Northern Scandes. Protected areas in northern Fennoscandia offer limited coverage – on average, 50% – for these important culminations of biodiversity. The sensitivity of high-latitude flora to climate change depends not only on predicted levels of warming, but on regional geography and spe-cies biogeographic history. As such – and con-trary to global estimates – the findings herein do not predict poleward range center shifts. North-ern Arctic species are more likely to experience southward contractions and become endangered through range loss. The Northern Scandes are projected to be particularly susceptible to change. The forecast southbound and upslope migrations draw attention to high elevations in the South-ern Scandes for the persistence of cold-adapted flora, though suitable habitat may not persist for
3

DEPARTMENT OF GEOSCIENCES AND GEOGRAPHY A61
4
all threatened species.This thesis demonstrates the potential sig-
nificance – and some unexpected effects – of climate change in the Arctic-alpine realm. Find-ings of substantial, non-poleward range contrac-tions and a decrease in species richness may be counterbalanced by results highlighting the rel-evance of refugia in safeguarding Arctic-alpine vegetation. Importantly, forecasts of species dis-tributions are affected by landscape-scale fac-tors and biogeographical history, opening inter-esting avenues for future research. In general, this study demonstrates the critical role of high-quality data, sampled at resolutions reflecting sig-nificant environmental gradients, for developing useful models of species distributions and rich-ness patterns. The methods used allowed refugia and diversity to be successfully modelled. This provides further insight into current and future conditions for high-latitude flora, and highlights the importance of underlying ecological knowl-edge. From an applied point of view, the results of this thesis highlight the significance of recog-nizing topo-geologically defined areas in future forecasts of diversity patterns. These findings of the potential locations and environmental param-eters of refugia and ecosystem changes can be used to inform conservation strategies within the Arctic-alpine realm and beyond.

5
Acknowledgements
This work was made more enjoyable - not to mention possible - by a support network of the best people in the world. I thank you all for your encouragement, humour, and support during my PhD. Words cannot convey how grateful I am for everything. I think each of you has contrib-uted something special in the past 4+ years for which I would particularly like to say thanks:
Thank you to my supervisors: First and fore-most, the biggest acknowledgement to the won-derful Miska Luoto, for your energy, mentorship and understanding. I couldn’t have done this all without you and your relentless drive and per-severance. Risto Heikkinen, for your help and expertise, delivered with a kind and enthusiastic demeanor. Thank you to my preliminary examin-ers for their supportive feedback. Thank you to my co-authors: Henry Väre, for your plant wis-dom and fast responses to my questions. Juha Aalto, for your help with gathering environmen-tal data and analysis, and laidback chillness and helpfulness. Pekka Niittynen, for your insight and thirst for knowledge and refreshments. Heidi Mod, muoriseni, for always inspiring me with your adventurous spirit, and for being there with me from the first train ride north up to this point.
Thank you to the old and new occupants of room B116a, quite frankly the best office in the world, full of the smartest and funniest colleagues who I am glad to call my friends too: Jenny, for your fire and the hugs, and for all your help during this last squeeze in particular. Henri, for your creative ideas and one liners. Anna, for your pep and relentless drive. Thank you to Team Phyl-lodoce/Kilpis and my extended fieldwork fam-ily! Julia, leidiseni, for your enthusiasm and the dancing. Konsta, for your sense of wonder and
laughter. Susse, for your chilled-out go-getter at-titude. Jussi, for your thoughts and the walks. Joona, Atte, Elina, Maikki, you rock.
Thanks to YGPN and the coffee room gang! Es-pecially Arttu, for your classy sense of humour and all the coffee. A huge thanks to Tua, Maija, Virpi, Markus, Rami, Henkka, and Katariina! Vuokko, Anna, Eduardo, you are amazing.
Thank you to my family: Mamma, for being so proud of me and for always drying my hair after a sauna. Isi, for unceasing support in everything I do and for getting us fresh croissants for break-fast. Susanna, for being the best and smartest sis-ter in the world and for staying silly with me. Thank you to my best friend, home and adven-ture, Niall, for your continuing support, through my, addiction, with commas.
Thank you to all my friends and loved ones: Hessu, for helping me bang my head against a wall; Meri, for Ishtar and shbam; Natalia, for everything; and Tanja, Johku, Wycliffe, Katri, Tatu, Fiona, Minna, Aija, Janni, Suski, Cesca, for your friendship and all the good times, and for believing in me.
Thanks to everyone at Kilpisjärvi research sta-tion, Pirjo in particular. I would also like to thank the financial funders of this PhD: The Doctoral school of Geosciences; Nordenskiöld samfun-det; The Lapland Regional Fund (Finnish Cul-tural Foundation); Societas pro Fauna et Flo-ra Fennica; The Finnish Foundation for Nature Conservation. I would like to thank the Finnish Museum of Natural History as one of the main contributors of the data on vascular plant spe-cies for papers I, II, and III.

6
Contents
Abstract ........................................................................................................................3Acknowledgements ......................................................................................................5Contents .......................................................................................................................6List of original publications .........................................................................................7Author’s contributions to the publications ...................................................................8Abbreviations ...............................................................................................................9List of figures and tables ............................................................................................10
1 Introduction .............................................................................................................11 1.1 High-latitude environments and plant species in a changing climate ............11 1.2 Species range change......................................................................................13 1.3 Refugia ...........................................................................................................13 1.4 Biodiversity and diversity hotspots ................................................................14 1.5 Modelling plant species distributions .............................................................15 1.6 Aims of the study ............................................................................................15
2 Materials and Methods ............................................................................................16 2.1 Study areas .....................................................................................................16 2.2 Species occurrence and environmental data ...................................................17 2.3 Species distribution modelling .......................................................................21 2.4 Defining refugia ..............................................................................................24 2.5 Defining biodiversity and diversity hotspots ..................................................25 2.6 Defining the Arctic-alpine realm and metrics of change ................................25
3 Results .....................................................................................................................26 3.1 Drivers and distributions of refugia................................................................26 3.2 Drivers of diversity and their hotspots ...........................................................27 3.3 Current and future patterns of high-latitude flora ...........................................29
4 Discussion ...............................................................................................................30 4.1 Drivers and distributions of refugia................................................................30 4.2 Drivers of diversity and their hotspots ...........................................................32 4.3 Current and future patterns of high-latitude flora ...........................................33 4.4 Prospects for conservation..............................................................................34 4.5 Methodological issues ....................................................................................36 4.6 Future perspectives .........................................................................................37
5 Conclusions .............................................................................................................39
References ..................................................................................................................40Supplementary Material .............................................................................................49
Publications I-IV

7
List of original publications
This thesis is based on the following publications:
I Niskanen, A.K.J., Luoto, M., Väre, H., Heikkinen, R.K. 2017. Models of Arctic-alpine refugia highlight importance of climate and local topography. Polar Biol-ogy 40, 489-502. DOI: 10.1007/s00300-016-1973-3 i
II Niskanen, A.K.J., Heikkinen, R.K., Mod, H.K., Väre, H., Luoto, M. 2017. Improving forecasts of arctic-alpine refugia persistence with landscape-scale variables. Geografiska Annaler Series A. Physical Geography 99, 2-14. DOI: 10.1080/04353676.2016.1256746 ii
III Niskanen, A.K.J., Heikkinen, R.K., Väre, H., Luoto, M. 2017. Drivers of high-latitude plant diversity hotspots and their congruence. Biological Conservation 212, 288-299. DOI: 10.1016/j.biocon.2017.06.019 iii
IV Niskanen, A.K.J., Niittynen, P., Aalto, J., Väre, H., Luoto, M. Declining high-latitude montane flora may contract in an unexpected direction. Manuscript
i The publisher for this copyrighted material is Springerii This is the authors accepted manuscript of an article published as the version of
record in Geografiska Annaler: Series A, Physical Geography on 5th December 2016. http://www.tandfonline.com/doi/full/10.1080/04353676.2016.1256746
iii The publisher for this copyrighted material is Springer
The publications are referred to in the text by their roman numerals.
DEPARTMENT OF GEOSCIENCES AND GEOGRAPHY A61

8
Authors’ contribution to the publications
I The study was planned by M. Luoto, R. Heikkinen and A. Niskanen. H. Väre pro-vided the floristic data. A. Niskanen and M. Luoto prepared the data for statistical analysis. A. Niskanen conducted the analyses and was responsible for preparing the manuscript, with all authors commenting and contributing to writing.
II The study was planned by M. Luoto, R. Heikkinen, H. K. Mod and A. Niskanen. H. Väre provided the floristic data. A. Niskanen and H. K. Mod prepared the data for the statistical analyses, and were responsible for the analyses and preparation of the manuscript, with all authors commenting and contributing to the writing.
III The study was planned by M. Luoto and A. Niskanen. H. Väre provided the flo-ristic data. A. Niskanen prepared the data for the statistical analyses, conducted the analyses, and was responsible for preparing the manuscript, with all authors commenting and contributing to writing.
IV The study was planned by M. Luoto, P. Niittynen, and A. Niskanen. H. Väre pro-vided some of the floristic data. M. Luoto calculated the geological variable. J. Aalto provided the climatic and topographical data. P. Niittynen was instrumen-tal in gathering the floristic data. A. Niskanen prepared the data for the statistical analyses. A. Niskanen conducted the analyses and was responsible for preparing the manuscript, with all authors commenting and contributing to writing.

9
Abbreviations
Aster advanced spaceborne thermal emission and reflection radiometerAUC area under receiver operating characteristics curveBRT boosted regression tree model, combines the strengths of boosting and multiple
regression treesCALC proportion of calcareous bedrockCR critically endangered species according to the Red List of FinlandDEM digital elevation model, here used to develop the topographic variablesEN endangered species according to the Red List of FinlandEX regionally extinct species according to the Red List of FinlandFDD freezing degree days, representing average overwintering conditionsGAM generalized additive modelGBM generalized boosted model, synonym for BRTGDD growing degree days, representing average growing conditionsGIS geographical information systemGLM generalized linear modelLCBD local contribution to β-diversity of a sitem a.s.l meters above sea levelNT near threatened species according to the Red List of FinlandPA protected areaRAD incoming solar radiationRRR (relative) range-rarity richness of a siteR2 coefficient of determinationSDM species distribution modelTCQ temperature of coldest quarter (January – February)TSR total species richness of an areaTHR richness of species of elevated conservation concern (based on the IUCN Red List)
of a siteTSS true skill statistic, a widely used measure of model performanceTWI topographic wetness indexVU vulnerable species according to the Red List of FinlandWAB water balance, representing the range of available moisture
DEPARTMENT OF GEOSCIENCES AND GEOGRAPHY A61

10
List of figures
Figure 1 Characteristics of high-latitude environments and their flora, page 12Figure 2 Diagram of potential responses of species to climate change, page 14Figure 3 The study region, page 17Figure 4 Overview of the modelling framework, page 22Figure 5 Congruence of hotspots with conservation areas, page 27Figure 6 Species richness changes in future climate scenarios, page 28Figure 7 Predictions of range change, page 29Figure 8 Synthesis diagram, page 31
List of tables
Table 1 The concepts or metrics of interest used in this thesis, page 18Table 2 Descriptions of the plant occurrence datasets used in this thesis, page 19Table 3 The environmental variables used in this thesis, page 20

11
1 Introduction
Arctic-alpine regions are highly vulnerable to climatic modifications such as changes in tem-perature and precipitation regimes (Grabherr et al. 1994, Parmesan and Yohe 2003). As these regions will face uncertain climatic conditions in the future (Sturm et al. 2001, Hinzman et al. 2005, Post et al. 2009), we need ways to de-tect how species will respond to these changes (Thuiller 2004). Furthermore, it is imperative to identify where in the landscape we might find valuable features such as refugia or hotspots, and study what drives these manifestations of species persistence (Dobrowski 2011, Moritz and Agudo 2013) and high biodiversity (Orme et al. 2005, Magurran 2013). This thesis will shed light in-to these questions by focusing on three aspects of the distribution and diversity of Arctic-alpine vegetation from a macroecological spatial mod-elling perspective. Firstly, I explore the poten-tial of these landscapes for species persistence in refugia (papers I & II). Secondly, I inves-tigate species richness patterns in the form of diversity hotspots (paper III). Finally, I quanti-fy prospective changes in species distributions due to climate change impacts (paper IV). The combined use of spatially explicit climatic, topo-graphic, and geologic data – supported by eco-logical knowledge (Pickett and Cadenasso 1995, Willis and Bhagwat 2009, Bellard et al. 2012) – enables the unravelling of the potential future of cold-adapted plant species.
This study incorporates extensive regional information on remotely sensed environmental attributes at different hierarchical levels and data-sets of vascular plant observations with a spatial modelling approach to investigate plant distribu-tion patterns in an environmentally variable area. By determining the effects of the environment on species occurrences along broad gradients span-
ning from forested taiga to treeless tundra, this thesis will develop understanding of the roles of climate and topo-geological setting in driving species’ geographic distributions and, ultimate-ly, of what the future may hold for Arctic-alpine flora. Spatially quantifying and increasing the general knowledge of Arctic-alpine plant diver-sity have exciting potential for applied purposes. Identifying refugia (Keppel et al. 2012, Reside et al. 2013), diversity hotspots (Prendergast et al. 1993, Myers et al. 2000), differences between diversity metrics (Brooks et al. 2006, Cañadas et al. 2014), or the impacts of species’ responses to climatic change on future biodiversity (Hunt-ley et al. 2008) can help assess potential threats to biodiversity. This could be helpful for focus-ing field surveys, conservation efforts, or adap-tation strategies. Comparing the distributions of hotspots with existing protected areas can help in determining conservation shortfalls, such as a lack of protected area coverage for different as-pects of diversity (Scott et al. 1993, Flather et al. 1997, Virkkala et al. 2013, Huang et al. 2016). On the whole, the results of this thesis provide useful insights for conservation planning aiming to preserve valuable Arctic-alpine landscapes.
1.1 High-latitude environments and plant species in a changing climate
Moving northwards from the Equator towards high-latitude environments such as Fennoscandia (see Fig 1), temperatures decrease and the snow-free period is significantly shortened, particularly at the highest elevations (Körner 2016). Arctic-alpine plant species are particularly characteris-tic of these cold, mountainous habitats above or beyond the tree line (Birks 2008) (Fig 1). Fur-thermore, the low angle of incoming solar radi-ation means that topography, along with strong seasonality, can influence light and temperature conditions (Wielgolaski and Inouye 2003).
DEPARTMENT OF GEOSCIENCES AND GEOGRAPHY A61
12
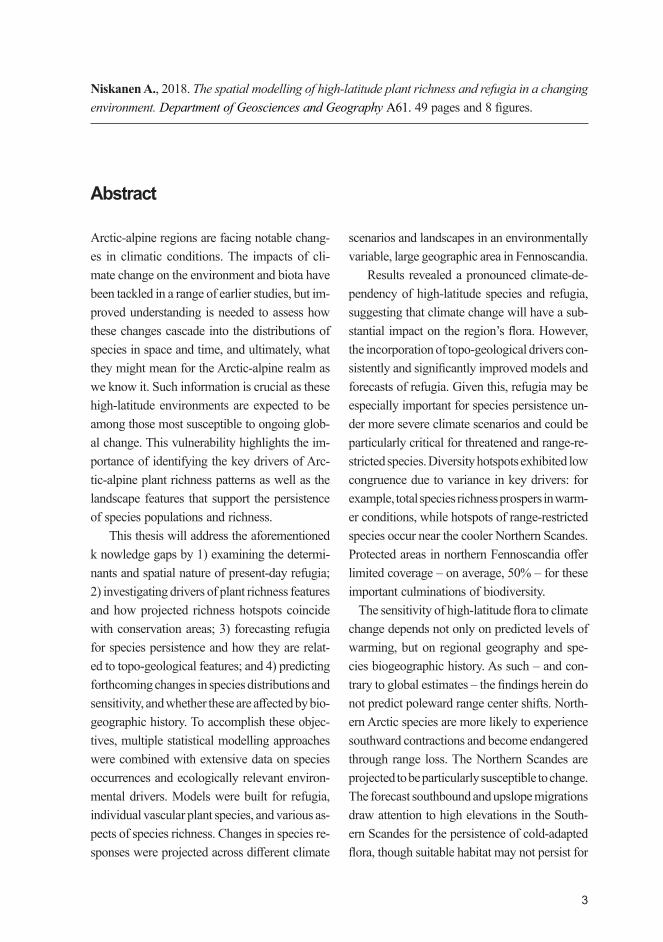
High-latitude regions provide an ideal set-ting for the spatial modelling of species distri-butions. Being fairly remote, they have endured relatively little anthropogenic disturbance (Han-nah et al. 1994) and are less complex systems than more southern ecosystems in terms of in-teracting species (Wisz et al. 2013), vegetation
layers, and trophic levels. This being said, they nevertheless provide an array of environmen-tal gradients (Billings and Mooney 1968) to be utilized by various Arctic-alpine plant species (Bliss 1971). The high-latitude mountain flora of Europe is a mix of species from the true Arctic and mid-latitude alpine regions (Fig 1). Plants
Figure 1. Some features of high-latitude areas (such as Fennoscandia, the study area for this thesis) and their heterogeneous environments (inset photos). These regions ¬and many of the plant species found there are predicted to be sensitive to climate warming.

13
of many growth forms (Fig 1) have adapted to the prevailing heat- and nutrient-deficient con-ditions (Bliss 1971, Press et al. 1998, Callaghan et al. 2004). Furthermore, topographically het-erogenous mountainous areas can act as region-al hotspots of biodiversity, as multiple different habitats can be found within relatively short el-evational distances (compared to latitudinal gra-dients; Körner 2004, 2007).
Importantly, high-latitude regions are consid-ered to be extremely vulnerable to global warm-ing (Sala et al. 2000, Parmesan and Yohe 2003, Nogués-Bravo et al. 2007). Cold-adapted alpine (Gottfried et al. 2012) and northern (Epstein et al. 2013) vegetation has already been affected by physical, hydrological, and biogeochemi-cal changes. The plant species characteristic of these regions are likely to experience range loss (Lenoir et al. 2008) and/or range shifts to track suitable climates (Thuiller et al. 2005, Engler et al. 2011). Furthermore, species with different biogeographic histories have overlapping macro-climatic niches but different recolonization histo-ries since the last glacial period (Wasof 2015) and may be expected to showcase disparate responses to change (Pellissier et al. 2016). For example, species of Arctic origin may be less adapted to warming climate at their southern range margins than alpine species are at their northern margins.
1.2 Species range change
Environmental changes pose pressure on species to shift their ranges in order to follow the spatial changes in their climatic niche (e.g. range; Fig 2) (Bellard et al. 2012) as well as to alter the timing of key seasonal phenomena (e.g. phenology; Cle-land et al. 2007). Of these, range changes – taking place along latitudinal, longitudinal, and eleva-tional gradients over time (Lenoir and Svenning 2015) – are more likely for Arctic plant species (Callaghan et al. 2004). Many studies show that
species are shifting their ranges poleward (e.g. Parmesan and Yohe 2003, Hickling et al. 2006) and to higher elevations (e.g. Lenoir et al. 2008, Chen et al. 2011). However, such assumptions of one-directional range shifts may not tell the whole story (VanDerWal et al. 2013).
The role that temperature has on species’ ranges largely determines the volume of range shift, referred to as their climate change “sensi-tivity” (Sunday et al. 2015). Species with dif-ferent biogeographic histories have overlapping macroclimatic niches but different recolonization histories since the last glacial (Wasof et al. 2015) and thus may showcase dissimilar responses to changing climate (Pellissier et al. 2016). For ex-ample, species of Arctic origin may be less adapt-ed to warming at their southern range margin than alpine species at their northern margin, and species with narrower climate envelopes may be more sensitive to changes in climate (Thuiller et al. 2005).
Recent reviews highlight the importance of predicting how range changes may proceed un-der climate change (Urban 2015, Bonebrake et al. 2017), for example, for assessments of extinction risk (Lenoir and Svenning 2015), climate change adaptation (Hickler et al. 2012), and conserva-tion measures (Huntley et al. 2008).
1.3 Refugia
Refugia is a concept originally used to refer to locations where species survived past climatic fluctuations (Bennett and Provan 2008). Follow-ing its conception, numerous studies have sought to define the concept of refugia based on bio-logical or climatic evidence. The term has in-creasingly been used to refer to areas that could limit the adverse impacts of climate change on biota (Barnosky 2008, Rull 2009, Ashcroft 2010, Vegas-Vilarrúbia et al. 2012) by providing suit-able habitats deviant from the average regional
DEPARTMENT OF GEOSCIENCES AND GEOGRAPHY A61
14
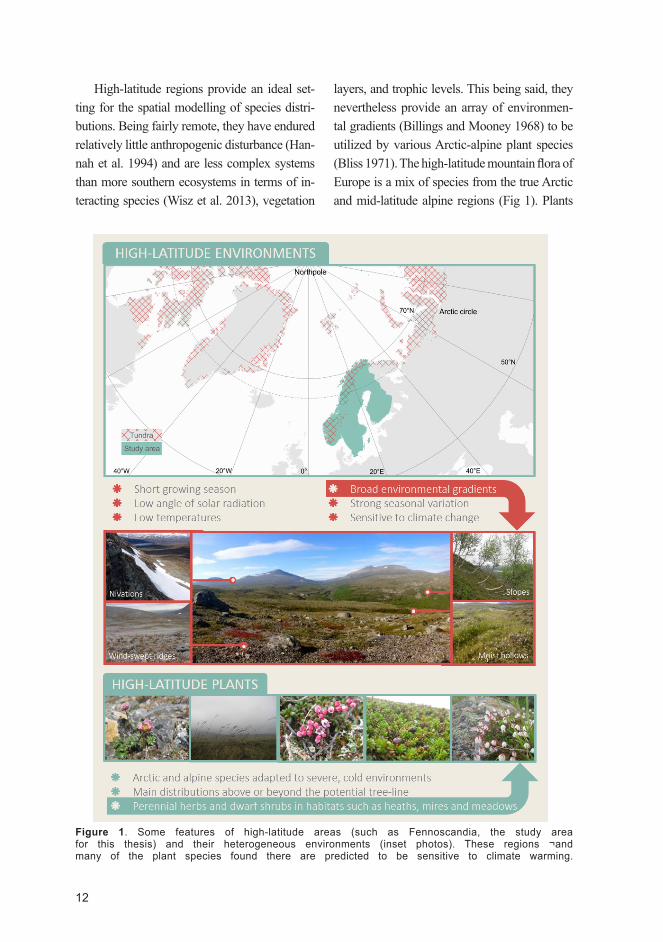
climate where species can persist during unfa-vourable periods (Dobrowski 2011, Keppel et al. 2012). Taken together, these can be applied to formulate a holistic point of view where a refu-gia is an area that buffers species from adverse climate and allows them to persist (Fig 2; see Table S1 for a list of refugia definitions).
A number of studies call for increased at-tention to be paid to the identification of poten-tial refugia (Noss 2001, Ashcroft 2010, Game et al. 2011, Keppel et al. 2015). Due to the impor-tance of refugia for species survival in the past (Taberlet 1998, Svenning et al. 2008), their im-portance for current species distributions (Birks
and Willis 2008), and how current distributions play an imperative role in deriving estimates of past refugia (Stewart and Lister 2001), present-day refugia can be expected to be important for species distributions in the future.
1.4 Biodiversity and diversity hotspots
Biological diversity, or biodiversity, encompass-es biotic variation from the gene to the ecosys-tem level (Noss 1990) and is forecast to be sig-nificantly affected by global change (Pereira et al. 2010). The successful conservation of nature depends on our understanding of the key drivers of biodiversity and how well we can predict spa-tial and temporal patterns (Gould 2000, Smith et al. 2001, Zellweger et al. 2015). Though all the complexities of biodiversity can never be ful-ly captured by any single number, some facets of biodiversity are easier to quantify than oth-ers (Purvis and Hector 2000). One such facet is species diversity (Heywood and Watson 1995), which is perhaps easiest to understand as the total number of species living in a specific a region i.e. species richness (Magurran 2013).
Species richness has a central, traditional role in conservation (Myers et al. 2000, Stein et al. 2000) and threat detection (Cañadas et al. 2014). Identifying the most species rich areas – diversity hotspots – can be useful in recognizing priority sites for conservation (Prendergast et al. 1993, Myers et al. 2000). Diversity hotspots are com-monly quantified as the richest 5% of cells as measured by, for example, the total number of species at a particular site or how many rare or threatened species occur there (Prendergast et al. 1993, Williams et al. 1996, Reid 1998, Arms-worth et al. 2004, Ceballos and Ehrlich 2006). The degree to which different diversity hotspots overlap (which could ease conservation efforts) remains contradictory (Bonn et al. 2002, Orme
Figure 2. Diagrammatic representation of some of the spatial responses of species to climatic change discussed in this thesis. Such responses include species persistence in different types of refugia, or different kinds of range shifts (such as contractions across latitudinal or elevational gradients), in order to track spatial changes in their suitable climatic niche. In situ refugia exist within a species currently suitable niche, whereas ex situ refugia require range shift. Refugia have also been categorized according to their size or distribution across landscapes (see also e.g. Bennett & Provan 2008; Rull 2009).

15
et al. 2005), and little is known of their driversalpine species are at their northern margins.
1.5 Modelling plant species distributions
Forecasting the responses of species and bio-divesity to climate change is important for in-forming researchers, conservationists, and poli-cymakers of potential future impacts (Elith and Leathwick 2009, Pereira et al. 2010, Parmesan et al. 2011). Quantitative and spatially explicit estimates of these responses and consequential impacts on future biodiversity can be projected using species distribution modelling (SDM) that relate species distribution data to current and/or future climate (Guisan and Zimmermann 2000). SDMs assume that the best indicator of a spe-cies’ environmental requirements is its current distribution (Pearson and Dawson 2003) and ex-trapolate conditions in the suitable environmen-tal space onto geographical space (for example, a grid of cells covering a region of interest) to represent potential suitable habitats or distribu-tion (Araújo and Guisan 2006). The realism of SDMs thus depends on the careful selection of the data in addition to careful consideration of appropriate modelling methods and parameters (Elith and Leathwick 2009, Franklin 2010).
Models of the distributional changes of spe-cies – or the areas deemed as environmental-ly suitable for them -– provide spatially explicit functions of projected change which can be used to assess the impacts of climate change on biota (Guisan and Thuiller 2005, Botkin et al. 2007). In general, previous efforts to model species’ cli-mate change vulnerability in Europe have mainly been conducted at broad spatial resolutions (50 – 75 km) and based largely on coarser scale cli-matic data (e.g. Bakkenes et al. 2002; Pearson & Dawson 2003; Engler et al. 2011) (but see e.g. Randin et al. 2009); or have been carried out at
smaller observational scales (e.g. Klanderud and Birks 2003). Regarding range contraction into refugia, SDM studies have mainly approached this topic from the viewpoint of a single species (Hugall et al. 2002, Austin and Van Niel 2011a) and/or past distributions (Fløjgaard et al. 2009), or at coarser spatial scales (Hodd et al. 2014).
It is increasingly recognized that SDMs benefit from non-climatic variables capable of describing more local environmental condi-tions (Franklin 1995, Beauregard and de Blois 2014). Alongside climate, landscape features – such as those relating to topography and ge-ology – can also strongly influence the grow-ing conditions experienced by plants (Ackerly et al. 2010) through numerous geomorphologi-cal (Wondzell et al. 1996, Scherrer and Körner 2011), hydrological (Austin and Van Niel 2011b, Moeslund et al. 2013), biological (Moore et al. 1991, Guisan et al. 1998), and geological pro-cesses (Anderson and Ferree 2010). Topographi-cal (Luoto and Heikkinen 2008) and geological parameters (Dubuis et al. 2013) improve model predictive ability as they aid in capturing the buffering effect of environmental heterogeneity against climate change (Randin et al. 2009, Aus-tin and Van Niel 2011a). Environmentally hetero-geneous cells may remain relatively unchanged and support species persistence by providing a wide range of habitats within the same cell (Jack-son and Overpeck 2000). Thus, models that ig-nore landscape-scale processes may provide in-accurate forecasts of extinction risk and refugia.
1.6 Aims of the study
Understanding what drives species patterns and their responses to climate change would enable a more comprehensive view of how biodiversity manifests across changing high-latitude landscapes (Thuiller 2004). This thesis combines fine-grain occurrence and

16
environmental data on a sub-continental scale to assess patterns of Arctic-alpine flora in high-latitude regions. Despite the importance and vulnerability of these regions (Parmesan and Yohe 2003) few studies have focused on their climate change sensitivity (see Urban [2015] for a review). This work provides new knowledge – from detailed forecasts of local persistence to range changes – to help further project potential future changes in these systems (VanDerWal et al. 2013). Multiple statistical modelling methods were combined with species occurrence and environmental data from Fennoscandia (Finland, Sweden, and Norway) and from a subset study region in northern Fennoscandia. The aims are outlined as follows:
Aim I: Develop models for current refugia and refugial species richness and examine the impor-tance of topo-geological factors in their identifi-cation (paper I).
Aim II: Define the drivers and distributions of sites with resilient climatic suitability harbour-ing future refugia (paper II).
Aim III: Investigate patterns of high-latitude plant diversity, the congruence of their hotspots, and the spatial overlap of hotspots with protected areas (paper III).
Aim IV: Determine potential patterns of spe-cies range changes and how species vulnerabil-ity manifests in terms of range contraction under climate change, and whether the biogeographic history of species influences their responses to climate change (paper IV)
2 Materials and Methods
2.1 Study areas
Two overlapping study areas were used in this thesis (Fig 3). The broader study region (paper IV) encompasses Fennoscandia in Northern Eu-rope (55 – 72°N) and the smaller subset study area (papers I-III) is located in northern Finland and Norway (67°N – 69°N). This latitudinal gra-dient, from the northern limits of the temperate biome (Southern Sweden) to the tundra and the southern limits of the Arctic biome (subset study region in Lapland), encompasses a large range of climatic conditions from -9.2 °C to 9.3 °C in an-nual mean temperatures and an eight-fold spatial variance in annual precipitation (366 mm to 3 058 mm). The climate is influenced by the Eur-asian continent, the Polar Front, the warm North Atlantic current, and westerly winds that trans-fer heat from the south. Along with noticeable climatic gradients, the area is characterized by strong topographic and geologic gradients (Ok-sanen and Virtanen 1995).
The Scandes run along the western side of the Scandinavian Peninsula. This region – in-tensely shaped by glacial and fluvial processes – hosts some of the most rugged terrain in Europe. The Scandes also have a significant effect on the growing conditions of the region (Tikkanen 2005, Aalto et al. 2014) as, for example, the west-ern and eastern regions experience extreme dif-ferences in rainfall (Tikkanen 2005). Elevation ranges from sea-level coastlines to the highest peaks of the Scandes Mountains. Besides broad elevational gradients, the study region is char-acterised by significant topographical variation between different landscapes, ranging from flat-lands (Southern Finland) to steep terrain (Scan-des Mountains) (Fig 3) associated with a wide range of microclimatic conditions.
DEPARTMENT OF GEOSCIENCES AND GEOGRAPHY A61

17
Most of the high-latitude mountain flora of Europe reach their distributional limits in the northern parts of Fennoscandia (see e.g. Cor-ner 2005). The subset study area encompasses a boundary area between northern boreal and Arctic-alpine habitats. Here, the vegetation var-ies from spruce (Picea abies) and Scots pine (Pinus sylvestris) forests in the South to moun-tain birch (Betula pubescens subsp. czerepano-vii) and shrub-dominated tundra-like vegetation above the tree-line in the North (Sormunen et al. 2011, le Roux et al. 2012). The mainly con-tinuous ice sheet cover during the last glacial (Svendsen et al. 2004) and East¬–West orienta-tion of other European mountain ranges limited the postglacial recolonization of Fennoscandia (Wasof et al. 2015). Long-distance recoloniza-tion by repeated founder events from both south-ern and eastern refugia (Eidesen et al. 2013) may have reduced population adaptability and genet-
ic variation, shrinking the fundamental climatic niche towards cooler growing conditions (Gie-secke 2005).
2.2 Species occurrence and environmental data
In short, in papers I-III, an extensive environ-mental data set of climatic, topographic, and geo-logic variables was resampled to a 1 km resolu-tion grid matching the species data and covering the subset study region (n = 25 766) to model specific response variables (Table 1). For pa-per IV, a similar protocol was followed but for the larger, sub-continental study region (n = 195 211 grid cells).
The response variables are based on two 1 km × 1 km vascular plant species distribu-tion data sets (Table 2; Fig 3). Different sub-sets of a plant species data set in North Western Finland served as the basis for papers I to III
Figure 3. The study region of Fennoscandia including Norway, Sweden, and Finland (paper IV) with the subset study region in northern Finland outlined in white (papers I-III). The framing photos (taken before, during, and after the growing season between May and September in the years 2013 – 2016) show a wide range of environmental gradients and growing conditions present throughout the region..

18
(593 species in 2 081 1 km × 1 km grid cells). These species data were collected for each cell by professional botanists and complemented us-ing species records from scientific literature and herbaria. The floristic material is maintained in the Kastikka-database, property of the Botanical Museum (University of Helsinki, Finnish Mu-seum of Natural History). The sampling covered all important biomes present in the study region (ranging from taiga to treeless tundra). The north-ern parts of the study region were subjected to a higher sampling intensity. This was accounted
for in paper III by spatially thinning the occur-rence data (Aiello‐Lammens et al. 2015). How-ever, it is important to acknowledge that this did not significantly alter model results.
In paper IV, the species occurrence data (195 211 occurrences) were collected and com-bined from the national species data banks of Finland, Sweden and Norway (http://www.laji.fi/en/; https://www.artportalen.se/; http://www.artsdatabanken.no/, respectively), the Global Biodiversity Information Facility (GBIF; http://www.gbif.org/), and observational data collected
DEPARTMENT OF GEOSCIENCES AND GEOGRAPHY A61
Metrics Abbreviation and/or calculation
Details and descriptions Paper References
Current refugia
Sites with ≥5 refugial species
Enables determination of current refugial environmental conditions
I Novel approach
Refugial species richness
Number of refugial species in current refugia
Sites rich in refugial species potentially more valuable for conservation
I Novel approach
Future refugia*
Sites where current and future distributions of ≥5 species overlap
In situ refugia, robust as reaching them requires only local or no range-shifts
II Austin, & Van Niel 2011a; Reside et al. 2014
Total species richness
TSR = number of vascular plant species within a grid cell
Diversity metric. TSR is the number of vascular plant species within a grid cell; a direct proxy for local diversity
III Whittaker 1972
Threatened/ near-threatened species richness
THR = number of threatened or near-threatened vascular plant species within a grid cell
Diversity metric. Combines threat risk of Red Listed species
III Gjerde et al. 2004
Local contribution to β-diversity
LCBD = 𝑆𝑆𝑆𝑆𝑖𝑖𝑆𝑆𝑆𝑆𝑇𝑇𝑇𝑇𝑇𝑇𝑇𝑇𝑇𝑇
Diversity metric. SSi is the sum of squares of the ith sampling unit, SStotal is the sum of squares of the species data. Gives the relative contribution of a site to β-diversity
III Legendre et al. 2013
Relative range-rarity richness
RRR = ∑ 𝑊𝑊𝑊𝑊𝑛𝑛𝑖𝑖=1𝑇𝑇𝑆𝑆𝑇𝑇
Diversity metric, where n is the number of species in a grid cell, Wi is the weighting of species i, here the inverse of its range, TSR as below. RRR combines richness with range size, accounts for total species richness
III Williams et al. 1996
Species range change*
Change between predicted current and future distribution
Enables determination of potential changes in species ranges and richness. Proportion of range contraction can be used to assess climate change sensitivity
IV Thuiller et al. 2005
Table 1. The concepts or metrics of interest based on the vascular plant species distribution data used in this thesis (see Table 2). The variables listed here for papers I and III were modelled explicitly. *In papers II and IV, species occurrences were used as the response variable; future refugia and species range changes were derived from predictions of current (1981 – 2010) and future distributions (2070 – 2099; Representative Concentration Pathways 2.6 (paper IV), 4.5, and 8.5 (papers II & IV).

19
in the field (see Data Accessibility in paper IV for further information). The online search, under-taken in November-December 2016, was filtered to include georeferenced occurrences since 1990 with a location accuracy of 100 meters. Analy-ses were conducted for 165 Arctic-alpine plant species (defined according to expert opinion and their biogeographic distribution from observa-tion maps [Hultén and Fries 1986]) with a mini-mum occurrence of eight cells within the study area for which projections could be made (Fig 3). To account for differences related to biogeo-graphical history, four different categories were distinguished in paper IV: Arctic (n = 66), alpine (n = 10), Arctic-alpine (n = 81), and endemic (n = 8) species, based on current distributions and expert opinion.
The environmental predictors (see descrip-tions in Table 3) represent important ecophysio-logical conditions relating to temperature, water, light, and nutrients that are generally considered to be important for high-latitude vascular plant species (Guisan and Zimmermann 2000, Austin and Van Niel 2011b, Mod et al. 2016).
In papers I to III, climate data from the normal period of 1981 – 2010 were acquired from the national observation networks of Fin-land (Finnish Meteorological Institute), Norway (Norwegian Meteorological Institute), and Swe-den (Swedish Meteorological and Hydrological Institute). For paper IV, climate data (1981 –
2010) was acquired from a high resolution 1 km × 1 km data set from the European Climate As-sessment & Dataset (ECA&D; Klok and Klein Tank, 2009). Monthly mean temperature and precipitation values were modelled across both study domains using generalized additive models incorporating geographical position, topography, and water cover, and were spatially averaged to a 1 km × 1 km resolution grid following Aalto et al. (2017).
Growing season and overwintering tempera-tures were accounted for using growing degree days (GDD); freezing degree days (FDD); and temperature of coldest quarter (TCQ). Moisture conditions were described using water balance (WAB). Extreme climatic events, including in-creased frequency of days with temperature ex-tremes are predicted to increase around the globe (Meehl and Tebaldi 2004). Such effects are pro-jected to be particularly strong at high latitudes (Przybylak 2002, Marchand et al. 2006). To ac-knowledge such events two variables of extreme temperatures, the lowest absolute minimum and maximum temperatures, were included in pa-per I.
Refugia (paper II) and species distributions (paper IV) were projected into scenarios of future climates with different emission, greenhouse gas (GHG) concentration, and land-use trajectories (Van Vuuren et al. 2011) referred to as Represen-tative Concentration Pathways (RCPs; Moss et
Paper Number of cells Number of species
Details and descriptions
I 2 081 73 Refugial species = vascular plant species with ≥66% of their regional distribution occurring in the Scandes
II 1 341 (non-analogue regions excluded)
111 Arctic-alpine vascular plant species, occurrence in minimum of eight cells
III 812 (thinned data due to sampling bias)
593 All vascular plant species found in the study region
IV 31 659 165 High-latitude montane vascular plant species, occurrence in minimum of eight cells
Table 2. Descriptions of the plant occurrence datasets used. Papers I-III are all based on different subsets of a dataset covering the smaller study area (67°N – 69°N) in northern Fennoscandia. Paper IV is based on a larger dataset for the broader study region encompassing Fennoscandia (55 – 72°N). All the plant species data were modelled at a spatial resolution of 1 km × 1 km.
20
DEPARTMENT OF GEOSCIENCES AND GEOGRAPHY A61
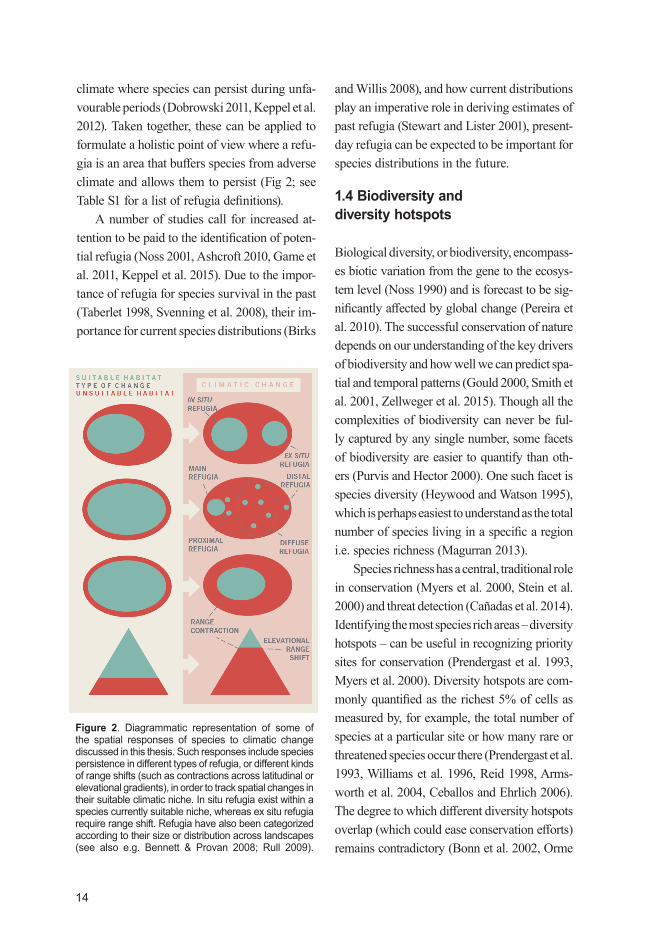
al. 2010). These climate projections were based on an ensemble of 23 global climate models ex-tracted from the Coupled Model Intercomparison Project phase 5 (CMIP5) archive (Taylor et al. 2012). Here, I explored the implications of RCP
2.6 (paper IV), 4.5, and 8.5 (papers II & IV; the number refers to radiative forcing in watts/m² by the year 2100). The data were processed to represent the change in mean temperature and precipitation (between 1981 – 2010 and 2070 –
Variable group and abbreviation
Variable calculation Description Paper
Clim
ate
FDD Freezing degree days (°C) = annual accumulated daily temperature sum <0°C
Overwintering conditions I-III
GDD Growing degree days (°C) = annual accumulated daily temperature sum, >3°C (papers I-III), >5°C (IV)
Growing conditions I-IV
TCQ Temperature of coldest quarter (°C) = Mean temperature Dec-Feb
Overwintering conditions IV
Tmax Lowest absolute maximum temperatures (°C)
Coolest within-cell summer temperatures
I
Tmin Lowest absolute minimum temperatures (°C)
Lowest within-cell winter temperatures I
WAB Water balance (mm) = difference between annual precipitation sum and potential evaporation
Available moisture conditions I-III
Conn
ectiv
ity
Arctic-alpine habitat
Arctic-alpine habitat = heathland, sparse vegetation, bare rock
A combination of three Corine land cover classes for scrubs and open areas with little/no vegetation (%)
I
Conn. Current connectivity of cell i to Arctic-alpine habitat j
= 𝛴𝛴 𝑒𝑒𝑥𝑥𝑝𝑝 −𝛼𝛼𝑑𝑑𝑖𝑖𝑗𝑗 𝐴𝐴𝑗𝑗 𝑗𝑗 ≠ 𝑖𝑖 (1)
α = scaling constant; djj = distance i to j; Aj = size of j within radius. α = 1. Exp = more weight to j if closer to i
I
History Historical connectivity (km) = distance to Andøya, Norway
Focal area for glacial survival of plants I
Geo
logy
Bedrock class Categorical parameter of bedrock type Substrate calcareousness IV
Calcareousness Cover of calcareous substrates (%) Soil pH; proportion of nutrient-rich bedrock
I-IV
Rock cover Cover of cliffs, rocky outcrops, and scree (%)
Significance in predicting species distributions in harsh environments
I & III
Soil (diversity) Number of substrate types Variability of growing substrate: rock, sand, peat, till
I
Soil (evenness) Evenness of substrate type (Simpson’s E) = (𝐸𝐸 = 𝐷𝐷
𝑆𝑆) D = one divided by proportion of substrates relative to number of substrates; S = number of substrates
III
Topo
grap
hy
Radiation Potential annual direct radiation. Calculated in ArcView 3.2 Solar analyst extension
Surface temperature; latitude, elevation, slope angle, aspect, topographical shadows, solar angle
I-II
Slope Mean/range of slope angle within cell Slope processes/ topographic heterogeneity
I/ III
Topographic heterogeneity
Maximum elevational difference within a given grid cell
Slope range; widely used proxy for microclimatic and habitat variation
IV
TWI Topographic wetness index Availability of soil moisture from upslope contributing areas
I-III
Table 3. The environmental variables used in this thesis. Climate variables refer to the mean for the period 1981 – 2010. All predictors were resampled to a 1 km × 1 km grid matching the species data.

21
2099) and the climate predictors (Table 3) were recalculated for each scenario. RCP 2.6 assumes drastic policy intervention and the lowest radia-tive forcing level of all the scenarios. RCP 4.5 is an intermediate mitigation scenario. RCP 8.5 represents the highest GHG emission profile with no stabilization (Riahi et al. 2011, Van Vuuren et al. 2011). A mitigation agreement has been adopted by many countries and the European Union to limit global warming to 2°C (relative to pre-industrial levels; Meinshausen et al. 2009), which is likely only in RCP 2.6 (Pachauri et al. 2014). A probabilistic analysis of future climate change by Raftery et al. (2017) suggests that out of these scenarios only RCP 4.5 is within the 90% credibility interval.
The topographic variables used in papers I-III were based on an Aster digital elevation model (DEM: NASA Land Processes Distrib-uted Active Archive Center (2013); spatial res-olution 30 m × 30 m). Slope processes and top-ographical variability were accounted for with slope mean and range; surface temperature con-ditions were represented by incoming potential solar radiation (McCune and Keon 2002); and, topographic wetness index (TWI) was used as a surrogate for soil moisture (Beven and Kirkby 1979). These variables are commonly used prox-ies for the microclimatic (Guisan and Zimmer-mann 2000, Dobrowski 2011), soil hydrological (Penna et al. 2009), and geomorphological pro-cesses (Randin et al. 2009) influencing high-lat-itude vegetation (le Roux et al. 2013a, le Roux et al. 2013b). Paper IV included a topographic predictor of topographical heterogeneity (Luo-to and Heikkinen 2008) which was calculated for each 1 km² grid cell using ArcGIS software (zonal statistics –function) from a DEM (com-bined from national DEMs provided by the land surveys of Finland, Sweden, and Norway) as the difference between the highest and lowest eleva-tion in a given cell.
Variations of three substrate variables were used in papers I to III: calcareousness, repre-senting the proportion of nutrient-rich bedrock and thus soil pH (Dubuis et al. 2013); substrate evenness to represent growing substrate hetero-geneity; soil diversity; and cover of rocky sub-strate which may be critical for modelling spe-cies in severe environments (Guisan et al. 1998). The substrate variables were reclassified from a digital database (Geological Survey of Finland 2010) and transformed following Aalto and Luo-to (2014). Paper IV included one geology vari-able of bedrock class, representing the calcare-ousness of geological substrates in a given 1 km² grid cell that was reclassified from a collated 1:1 million geological dataset of the Fennoscandian shield (obtained from the Geological Surveys of Finland, Sweden, and Norway).
Furthermore, the importance of two differ-ent connectivity measures was tested in paper I: historical connectivity (distance to glacial refu-gia on Andøya in north-western Norway [Alm and Birks 1991, Parducci et al. 2012, Vorren et al. 2013]), and current connectivity to grid cells with Arctic-alpine habitat. The calculations and sources for the variables are described in more detail in Table 3 and in papers I-IV.
2.3 Species distribution modelling
The spatial modelling of species’ distributions is an important topic in contemporary envi-ronmental and climate change impact studies (Pearson and Dawson 2003, Franklin 2010). The methodology implemented in this thesis is based on a correlative spatial modelling frame-work (Guisan and Zimmermann 2000, Elith and Leathwick 2009, Franklin 2010) which provides possibilities for the statistical characterization of complex species responses to different processes along environmental gradients (Barry and Elith 2006). The geographical distribution of the re-

22
DEPARTMENT OF GEOSCIENCES AND GEOGRAPHY A61
sponse variables (Table 1) were linked to mul-tiple explanatory variables (Table 3) within an SDM framework (Fig 4). The results from the SDMs were used to explain current refugia and refugial species richness (paper I) and diversi-ty patterns (paper III), and employed to derive information on the potential for refugial persis-tence (paper II), locations of diversity hotspots (paper III), and measures of species distribution
changes (paper IV; Fig 4).Boosted regression trees (BRT) were applied
to model environmental drivers and distributions of refugia (paper I) and diversity metrics (paper III). BRT modelling combines the strengths of boosting and multiple regression trees (Elith et al. 2008) and comparative analyses have rated their performance highly (Anderson et al. 2006, Heikkinen et al. 2012). BRT models can fit com-
Figure 4. An overview of the modelling framework. The ecological model is based on the theory used to build a conceptual model linking the controlling factors to spatiotemporal species distributions. The data model includes the location data and the environmental variables determining distribution or suitable habitat. The statistical model includes the modelling framework to create the predicted occurrence maps and derivations thereof. Modified from Fig 10.1 in Franklin (2010).
23
plex nonlinear relationships, do not require prior data transformation or outlier elimination, and consider interactions between predictors. They have a high predictive performance and can be summarized to provide deep ecological insight (Elith et al. 2008).
In papers II and IV, observed species distri-butions were related to the environmental pre-dictors using multiple statistical modelling tech-niques implemented in the BIOMOD2 platform (Thuiller et al. 2013). These included generalized linear modelling (GLM; McCullagh and Nelder 1989), generalized additive modelling (GAM; Hastie and Tibshirani 1990), multivariate adap-tive regression splines (MARS; Friedman 1991), boosted regression trees (BRT; Elith et al. 2008), random forest (RF; Breiman 2001), classifica-tion tree analysis (CTA; Breiman et al. 1984), and maximum entropy (MAXENT; Phillips et al. 2004). For the larger study area in paper IV, the species presence data were combined with pseudo-absence data to increase model predic-tive ability (Barbet‐Massin et al. 2012). The mod-elling techniques are described in more detail in papers I-IV.
In the first phase of the modelling process, models are calibrated using the available 1 km × 1 km species data (papers II & IV; Table 1) or the data of the chosen response variable information (refugial parameters in paper I; diversity metrics in paper III; Table 2). In papers I and II, climate-only SDM are compared with more complicat-ed SDM to investigate whether the inclusion of landscape-scale variables improves refugia pre-diction. In paper I, a baseline climate-only model was built, model complexity was increased with additions of topographic, geologic, or connectiv-ity variables, and the final climate-plus-landscape model incorporated all variable groups simulta-neously. Two additional models were used to fur-ther explore the application potential of SDM for refugia detection: the most-influential-variables
model, and the uncorrelated-variables model. A similar but simplified comparison was under-taken in paper II between a climate-only and a climate-plus-landscape model. All models in papers III and IV were climate-plus-landscape models (see Table 1 and 3 for a comprehensive view of the variables used). Additionally, two statistical techniques were used to calculate the relative importance of environmental variables: 1) variable influence in BRTs (papers I & III), a combination of the frequency the variable was selected as a model predictor and the improve-ment resulting from the inclusion of the variable (Elith et al. 2008); and 2) variable importance from multiple models (paper II) by randomizing each variable individually and then projecting the model with the randomized variable while keep-ing the other variables unchanged, thus identify-ing the relative importance of individual predic-tors (Thuiller et al. 2013).
In papers II and IV, species-specific pres-ence/absence predictions for each raster cell were also projected into future climate scenari-os. Models were calibrated with current climat-ic data and projected with global CMIP5 data (averages from a 23 model ensemble; see Ma-terials section for the climate change scenarios). Probabilities of occurrence were transformed in-to binary presence/absence predictions using a TSS cutoff that maximizes model accuracy. The consensus approach was used to construct an en-semble of forecasts combining the binary predic-tions from all models to create the final maps of predicted species distributions. This accounts for uncertainty related to different modelling tech-niques (Araújo and New 2007) and underlying assumptions (Guisan and Zimmermann 2000) and is particularly useful when predictions are made into future climate scenarios (Thuiller et al. 2008, Franklin 2010). A majority’s vote of a minimum of three out of five (paper II) or six (paper IV) modelling techniques was used to de-

24
DEPARTMENT OF GEOSCIENCES AND GEOGRAPHY A61
note a presence value for a given species inside a given 1 km × 1 km grid cell.
Multiple determinations of model accura-cy are necessary to validate result interpretation (Fielding and Bell 1997). Model fit, or explana-tory power, expresses how well a model can pre-dict data points already used to estimate its pa-rameters. Model prediction accuracy – or trans-ferability i.e. how well a model can predict to “unknown” data points – must also be assessed for predictive purposes.
Model transferability was assessed using four-fold cross-validation (CV) throughout the thesis, which combines measures of fit to derive a more robust estimate of the predictive accuracy of the model. Models were cross-validated based on multiple separate runs which account for sam-pling variability and yields the distribution – rath-er than a single value – of a given evaluation metric (see below for metrics). In each CV run, a different random data sample is selected while verifying model accuracy against the remainder (e.g. 70/30%). The accuracy of predicted binary occurrences (papers I, II & IV) were evaluated with commonly used metrics such as the area under the curve of a receiver operating charac-teristic (AUC) plot (Fielding and Bell 1997), true skill statistics (TSS; Allouche et al. 2006), and Cohen’s kappa (Cohen 1960) based on the evalu-ation runs. These metrics were calculated based on the portion of the data that was set aside in the withheld portion. Pairwise diversity hotspot congruence (paper III) was also measured with TSS and Cohen’s kappa. The accuracy of the predicted occurrences of the continuous response variables (papers I & III) were examined with the same CV procedure, but by comparing the observed and predicted values of the evaluation data with a Spearman’s rank correlation analy-sis (refugial species richness in paper I) and R2 analysis (diversity metrics in paper III).
In papers I and II, a non-parametric Wilcox-
on’s test was employed to examine whether ex-planatory power and predictive accuracy differed significantly between the climate-only and cli-mate-plus-landscape models. Furthermore, spa-tial autocorrelation (SAC) of the species richness data was tested for by calculating Moran’s I with no significant (p < 0.01) SAC found within raw data or model residuals (paper I). All statistical analyses in the thesis were executed in the sta-tistical software R (R Foundation for Statistical Computing, Vienna, AT).
The second major phase in the modelling, model application, enables prediction for the whole area of interest based on all training da-ta. In papers I to III, I produced predictive maps for refugia and the four diversity metrics by fit-ting the models to cover all 1 km × 1 km grid cells in the study region (number of cells = 25 766). In paper IV, predictive maps were made to cover the larger
2.4 Defining refugia
There are a multitude of refugia definitions (Ta-ble S1). Technically, each of them can be com-bined to formulate a holistic description of a re-fugia as a site exhibiting environmental charac-teristics that buffer species from adverse climates thus facilitating their persistence. Here, I explore a novel method for locating and describing cur-rent refugia with a combination of a biotic (re-fugia based on the current distributions of mul-tiple plant species) and climatic view (species survival potential in regionally adverse climates), previously used separately to identify past refu-gia (Svenning et al. 2008, Hampe et al. 2013, re-spectively). The agglomerations of cold-adapted plant species occurrence (see Table 1) in the study area outside of the Scandes were delineated as proxies for current refugia (see paper I). Refu-gia are often species specific (Bennett and Pro-van 2008, Stewart et al. 2010b), but the favour-

25
able environmental conditions supporting refu-gia may overlap for several species (Keppel et al. 2012). Here, I employed a prerequisite for a refu-gia that it should provide suitable conditions for the occurrence of multiple (≥5) refugial species. This summing-by-the-species determination of a given cell as a refugia improves confidence in refugia detection, as well as in determining the most influential environmental drivers. Current refugia were thus defined a priori to modelling as isolated satellite sites (here, occurrence out-side the Scandes) of multiple Arctic-alpine plant species. SDMs were applied to two refugia de-rivatives: current refugia distribution, and current refugial species richness (paper I).
The quantification of current refugia in pa-per I relied on the identification method used and did not take refugia temporality or the ef-fects of climate change into account. This was done in paper II, in which the species were mod-elled separately to predict species-specific suit-able habitat for both present-day conditions and future climate. Future in situ refugia (see Fig 2) were thus defined based on the outputs from the SDMs as sites where suitable habitat con-ditions prevail both currently and in the future (Thomas et al. 2004, Pearson 2006, Temunović et al. 2013) for at least five species. Estimates of such in situ persistence are robust as they re-quire only local or no range-shifts (Shoo et al. 2013, Reside et al. 2014).
2.5 Defining biodiversity and diversity hotspots
Similarly to the multitude of ways to define re-fugia, biodiversity can be defined in a number of ways (Heywood and Watson 1995). Here, biodi-versity was defined through species diversity. In paper III the focus was on the number of spe-cies within a site, i.e. species richness. Species richness can also be tackled through numerous
metrics. Four richness metrics were calculated from species occurrence data (Table 2) to capture different aspects of contemporary biodiversity, namely total species richness (TSR), threatened/near-threatened species richness (THR), relative range-rarity richness (RRR), and local contribu-tion to β-diversity (LCBD). The metric equations and corresponding details are listed in Table 1.
Predictions of the four diversity metrics across the study landscape were subsequently used to define the richest 5% of cells of each prediction raster as diversity hotspots (see e.g. Prendergast et al. 1993, Reid 1998, Myers et al. 2000), and their spatial congruence was mea-sured. Furthermore, potential overlap between predicted hotspots and currently protected area (PA; from the World Database on Protected Ar-eas [Chape et al. 2005, UNEP-WCMC 2016]) was also studied to evaluate PA effectiveness in protecting the vascular plant diversity within the study region (Virkkala et al. 2013, Hodd et al. 2014, Huang et al. 2016).
2.6 Defining the Arctic-alpine realm and metrics of change
Paper IV investigated the changes in the Arctic-alpine realm under climate change as predicted by current and future projections of high-latitude montane plant species distributions. Firstly, the Arctic-alpine realm was defined as the region of Fennoscandia predicted to be currently (1981 – 2010) occupied by at least ten high-latitude montane plant species per 1 km × 1 km grid cell. Changes in the species richness of the Arc-tic-alpine realm were calculated between predic-tions of current species richness and predictions in three climate scenarios (2070 – 2099). The climate change responses and sensitivity of indi-vidual species were quantified through predicted changes in currently suitable habitat according to the different climate scenarios. Range contrac-
26
DEPARTMENT OF GEOSCIENCES AND GEOGRAPHY A61
tion predictions were used to quantify the species expected to become threatened by the year 2100.
The mean distance and direction of poten-tial range changes (altitudinal and elevational differences between predicted current and fu-ture ranges) were estimated for individual spe-cies and species distribution types (see section 2.2). Altitudinal shifts were quantified using the centroid of a species’ current range calculated as the center of gravity (COG) of each predic-tion raster (VanDerWal et al. 2014). The effect of biogeographic history on range changes was studied by associating the biogeographic history category of each species with its predicted range change using non-parametric ANOVA (Kruskal–Wallis test).
Vulnerability was quantified as the change in predicted range size between current and future projections (Bakkenes et al. 2002) for individ-ual species. A simplistic Red Listing approach was used (sensu Thuiller et al. 2005), based on the amount of decline in range (number of cells) by 2100 according to the IUCN Red List crite-rion A3(c) (Categories 2001). Species were as-signed to one of four threat categories depend-ing on projected range loss: critically endangered (CR) after ≥80% range loss; endangered (EN) after ≥50% range loss; and vulnerable (VU) af-ter ≥30% range loss. Regional extinction (EX) was expected for species predicted to lose 100% of suitable habitat within the study area. Though threat status is also driven by parameters other than climate change, this method can provide in-sights on species vulnerability which is likely to increase due to any reduction in range (Thomas et al. 2004).
3 Results
3.1 Drivers and distributions of refugia
Papers I and II successfully identified Arctic-al-pine refugia and showed that the landscape-scale parameters are among the key drivers for the spa-tial patterns of refugia. Paper I identified 109 1 km × 1 km refugia mainly with a proximal distri-bution in respect to the continuous Arctic-alpine region, with a few outliers situated diffusely in the South. Thus, overall, the geographic distribu-tion of refugia showed a gradual decrease with distance to the Arctic-alpine species’ core area. All refugia distribution models performed well (mean AUC > 0.85), but statistically significant differences were evident in that topography and connectivity improved on climate-only models. Refugia are found in sites which are neither too hot in summer nor too cold during winter. Areas of high WAB promote the occurrence of mul-tiple refugial species.
Additions of topography – slope in particular – and connectivity significantly improved model predictive performance for the current refugia. They are more likely to occur in steeper terrain with a high connectivity to other Arctic-alpine habitat. Though not important for current refu-gia (paper I), geological parameters mattered for future refugia (paper II): the use of topo-geological predictors significantly (p<0.001) im-proved model accuracy for future predictions, with the mean AUC value improving from 0.77 (climate-only) to 0.86 (climate-plus-landscape) based on the CV runs. Furthermore, the climate-plus-landscape models predicted fewer species range reductions and higher species persistence. In RCP 4.5, the spatial congruence of refugia from both the climate-only and climate-plus-landscape models was 79%. Most (>95%) of the

27
climate-plus-landscape refugia in RCP 4.5 sup-ported higher species persistence than climate-only predictions. Considerably less refugia were predicted into the more extreme RCP 8.5.
The potential locations for future refugia were found mainly around cool and calcare-ous mountainous regions. However, inclusions of topo-geological variables suggest that refu-gia may also persist in cells with a higher GDD than what was indicated by climate-only models. GDD and calcareousness were the most influ-ential variables for most of the species (69 and 26 species, respectively). The most important landscape conditions for species persistence in the derived models were higher solar radiation, a higher cover of calcareous substrates, and a lower TWI (paper II).
3.2 Drivers of diversity and their hotspots
The results in paper III showed a good model fit, i.e. the models were good at explaining diver-sity metrics. However, they also showed a decid-edly poorer model predictive ability, indicating that the models performed poorly in extrapolat-ing the diversity patterns into the unknown. The more commonly used diversity metrics (TSR, RRR, THR) were explained fairly well by cli-mate, topography and geology, but prediction us-ing these parameters was difficult for TSR and THR. LCBD models performed poorly on both accounts. TSR showed a particularly strong rela-tionship with GDD. A significant portion of the otherwise scattered TSR hotspot distribution was found in the warmer growing conditions in the South (Fig 5). The RRR hotspots were highly
Figure 5.The findings from paper III increase the conservational importance of congruent hotspot areas (yellow and green), and knowledge of current conservation gaps (orange or red) in northern Fennoscandia. a) The congruence of total species richness (TSR) and threatened/near-threatened species richness (THR) hotspots and protected area (PA) shows how conserving overall species diversity could benefit at-risk species, though these have low coverage from PA. The calcareous mires of the Leppävuoma-Murtovuoma-Saattoporanvuoma reserve (LMS) appear important for TSR and THR hotspots. b) Relative range-rarity richness (RRR) and local contribution to beta-diversity (LCBD) hotspots exhibit low congruence but are well covered by PA, mainly the Käsivarsi wilderness area (KWA) which is, however, not a strict nature reserve. Numbers refer to the amount of congruent hotspots.

28
DEPARTMENT OF GEOSCIENCES AND GEOGRAPHY A61
clustered and concentrated in the northernmost areas with cooler growing seasons and milder winters (Fig 5), combined with a high TWI. THR was strongly affected by GDD and topo-geolog-ical drivers, with hotspots predicted for calcare-ous, high TWI areas somewhat clustered in the
South. The spatially patchy distribution of LCBD was mainly influenced by climate (GDD and FDD) with predominantly northerly hotspots.
Diversity hotspots covered 17% and cur-rent terrestrial PAs 38% of the study region. The hotspot analysis revealed a low spatial con-
Figure 6. Substantial changes are forecast for high-latitude flora. Total species richness (TSR) per 1 km × 1km grid cell within the current Arctic-alpine realm (TSR ≥ ten high-latitude montane vascular plant species) and its area as predicted for the current (1981 – 2010) and future climate (2070 – 2099) in the three different Representative Concentration Pathway (RCP) scenarios (RCP 2.6, RCP 4, and RCP 8.5) in Fennoscandia.
29
gruence between the diversity metrics (Fig 5): 21% were congruent for two metrics, no hotspots overlapped for more than two metrics. Half of the predicted hotspots were found to be current-ly protected. Hotspot congruence with existing conservation areas depended markedly on the metric, with RRR and LCBD being the most congruent (Fig 5; paper III).
3.3 Current and future patterns of high-latitude flora
The results from paper IV displayed a currently vast and continuous geographical range of high-latitude montane flora which is nevertheless sub-ject to substantial future range loss. Following warming, the Arctic-alpine realm is predicted to diminish by 46 – 82% by 2100, depending on climate scenario (Fig 6). The Arctic-alpine realm is projected to become increasingly concentrated
to two centers of lower biodiversity. The mean TSR is predicted to decrease by 55 – 90%, and regions with ≥100 species will disappear from the Northern Scandes in RCP 8.5.
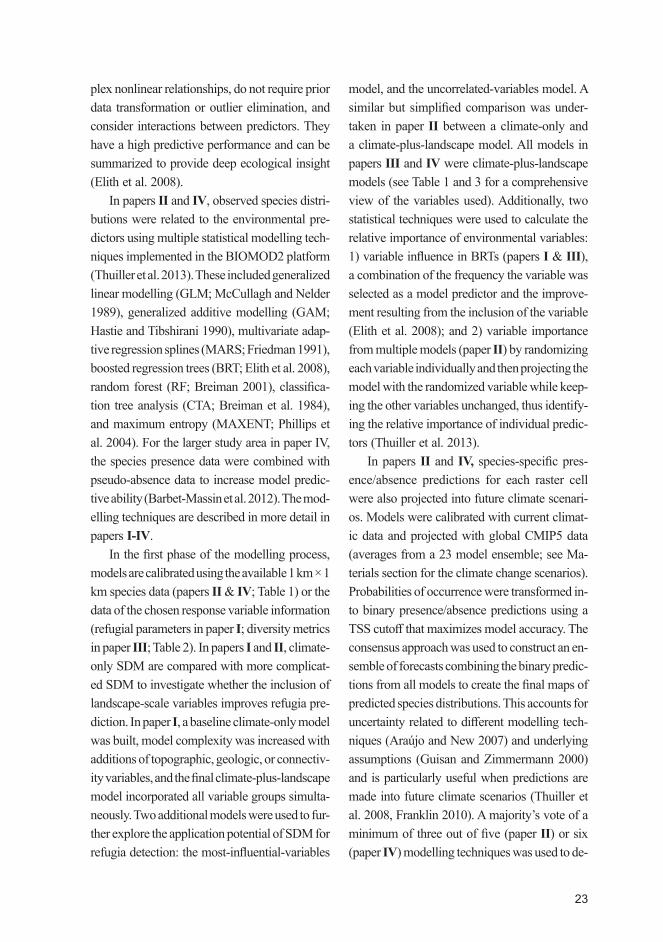
Range contraction is predicted for over 96% of the species (Fig 7). The mean range contrac-tion averaged across all species ranges from 58% to 89%, depending on climate scenario. More than 88% of the studied species will be classi-fied as at least VU and up to 7% of the species are projected to lose all suitable habitat in Fen-noscandia by 2100. Non-poleward COG range shifts increase with the degree of climate change, from 47 to 79% of species not predicted to go extinct. Upslope range shifts are predicted for ≥98% of these species.
Differences in the impact of climate change on projected range loss depend highly signifi-cantly on biogeographic history (Kruskal-Wallis rank sum test; p < 0.005; Fig 7). The average
Figure 7. Predictions of range change and range contraction direction (paper IV) in Representative Concentration Pathway (RCP) 4.5. Results in the top two panels are shown for different biogeographic histories. The bottom panel shows how the range change (top left panel) affects species vulnerability by the year 2100.

30
DEPARTMENT OF GEOSCIENCES AND GEOGRAPHY A61
range sizes decrease by 80% for Arctic species and 53% for alpine species. A significant differ-ence between the COG shifts of Arctic species (southerly shifts) and alpine species (northerly shifts) was found in RCP 2.6 (Wilcoxon non-paired rank sum test; p < 0.05). Only Arctic spe-cies with a COG in the Northern Scandes are predicted to become EX in RCP 4.5 (Fig 7).
4 Discussion
4.1 Drivers and distributions of refugia
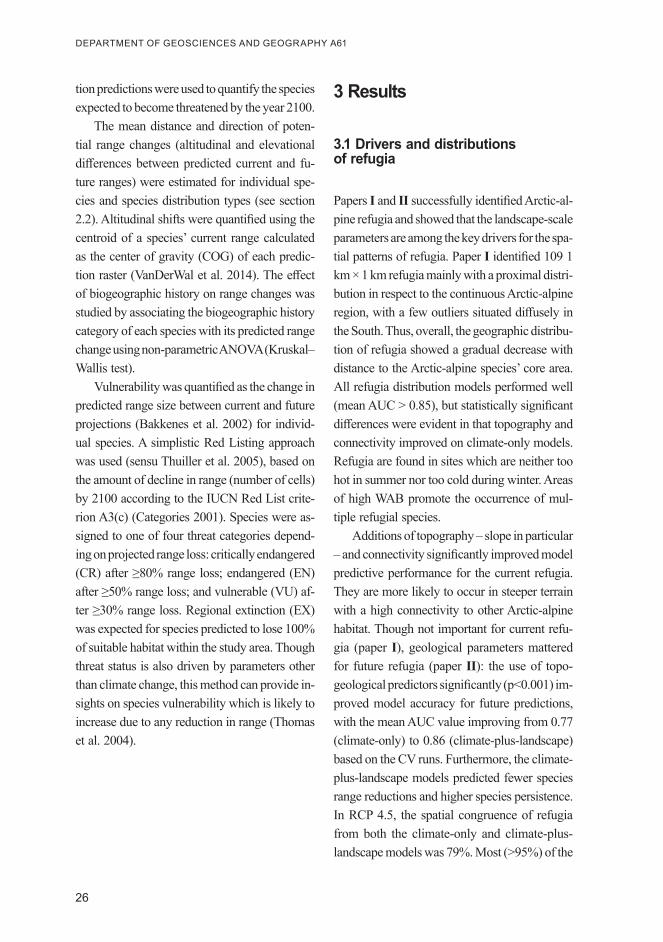
The distributions of both current and future re-fugia appear highly dependent on climate (Fig 9). Firstly, current refugia can be explained fair-ly well with climatic predictors (paper I). Sec-ondly, patterns of species persistence are simi-lar regardless of the variables used with lesser warming (paper II). However, this persistence may be greatly reduced by more extreme warm-ing but, importantly, also significantly increased by landscape-scale variables (Birks 2008, Sor-munen et al. 2011). Concordant with previous studies (Noss 2001, Shoo et al. 2010, Ashcroft and Gollan 2013), potential refugia are charac-terized by cooler conditions when temperatures reach their maximum (paper II). This, along with the importance of temperature extremes for cur-rent refugia (paper I), show that refugia may be more susceptible to changes in climatic ex-tremes than to seasonal temperature fluctuation. The increased temperature gradients potentially afforded to the landscape by cooler refugia in a warmer matrix can also significantly increase habitat diversity (Fridley 2009, Ashcroft 2010).
As climate is certainly controlling where re-fugia occur, climate change will inevitably cause a spatially dispersed pattern of species persis-tence. This pattern is, however, also affected by
meso-scale topo-geological landscape properties (papers I & II), echoing the conclusions of Luoto and Heikkinen (2008) and Austin and Van Niel (2011b). The finer resolution spatiotemporal as-pects of species distributions (i.e. the extent and persistence of suitable habitat; Franklin 2010) can be accounted for with even fairly simple topo-geological parameters that indicate suitable refugia for plants with limited dispersal capacity. Suitable topographic conditions also support the occurrence (steeper terrain in paper I) and per-sistence (higher radiation, lower TWI in paper II) of the most species-rich refugia. The impor-tance of topography could result from the wider range of growing conditions (Luoto and Heikki-nen 2008) on steep slopes providing open terrain (Pigott and Walters 1954, Birks 2008) and nu-trient-rich water (Heikkinen 1998). Importantly, the climatic decoupling by topographically in-duced thermal variability can also buffer areas from climate change (Lenoir et al. 2013), thus enabling species persistence (Ackerly et al. 2010, Austin and Van Niel 2011a, Dobrowski 2011). This was supported in paper II as the climate-plus-landscape models predicted suitable future conditions into a number of cells with warmer growing conditions compared to predictions by climate-only models.
Topographically controlled moisture condi-tions are important as current refugia were char-acterized by higher WAB (theoretically indicat-ing moister growing conditions) (Fickert et al. 2007, Ackerly et al. 2010), and future refugia by lower TWI (indicative of low topographically-induced soil moisture). This could be a signal that current refugial species favour higher mois-ture capable of reducing plant exposure to tem-perature extremes (the relevance of which was shown in paper I). If so, this would further boost the refugial capacity of moist sites (Ashcroft and Gollan 2013). However, the lower average wa-ter retention capacity of steep slopes (Beven &
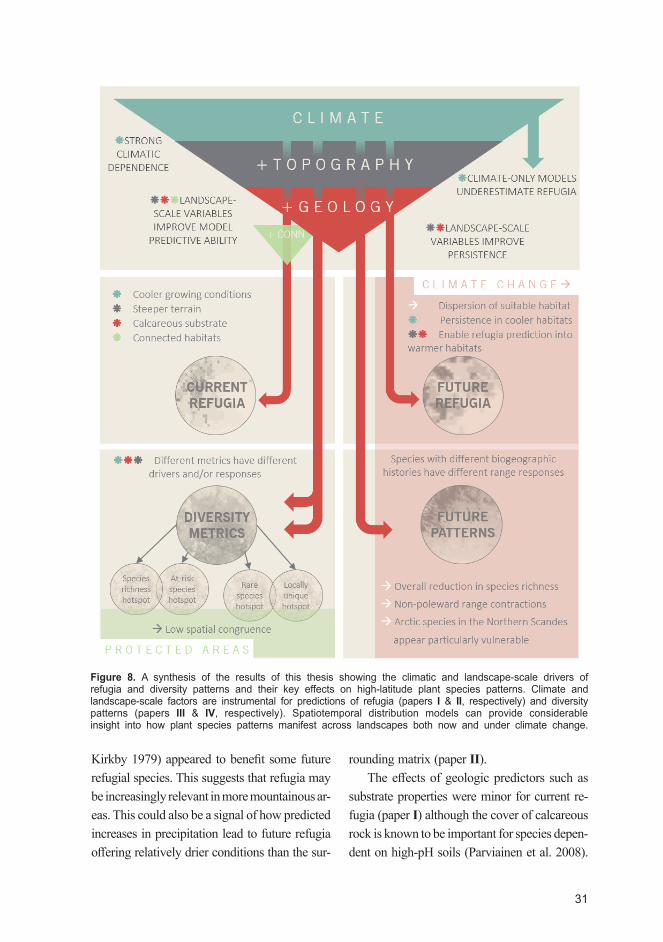
31
Kirkby 1979) appeared to benefit some future refugial species. This suggests that refugia may be increasingly relevant in more mountainous ar-eas. This could also be a signal of how predicted increases in precipitation lead to future refugia offering relatively drier conditions than the sur-
rounding matrix (paper II). The effects of geologic predictors such as
substrate properties were minor for current re-fugia (paper I) although the cover of calcareous rock is known to be important for species depen-dent on high-pH soils (Parviainen et al. 2008).
Figure 8. A synthesis of the results of this thesis showing the climatic and landscape-scale drivers of refugia and diversity patterns and their key effects on high-latitude plant species patterns. Climate and landscape-scale factors are instrumental for predictions of refugia (papers I & II, respectively) and diversity patterns (papers III & IV, respectively). Spatiotemporal distribution models can provide considerable insight into how plant species patterns manifest across landscapes both now and under climate change.
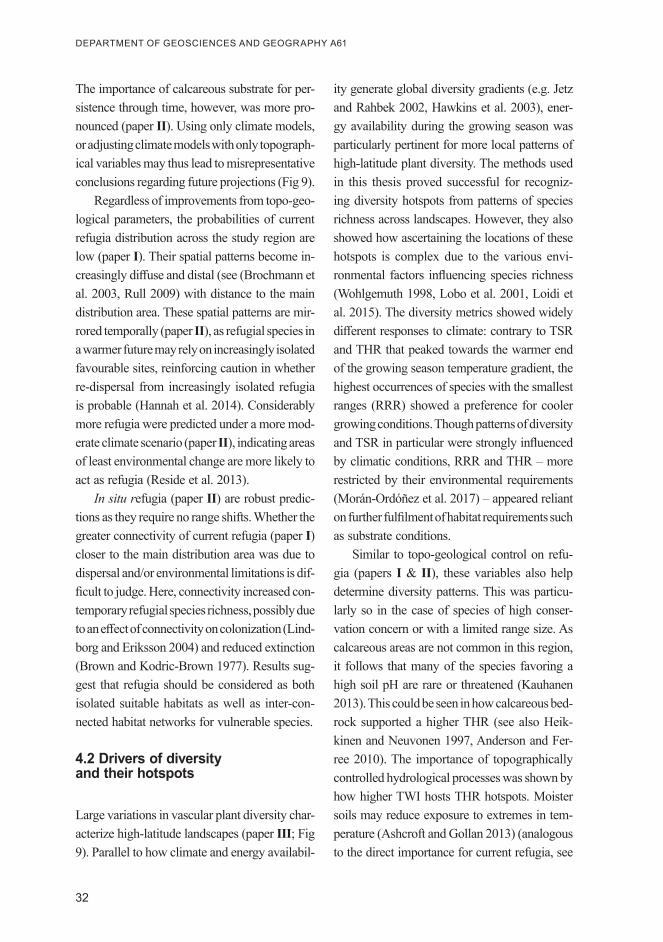
32
DEPARTMENT OF GEOSCIENCES AND GEOGRAPHY A61
The importance of calcareous substrate for per-sistence through time, however, was more pro-nounced (paper II). Using only climate models, or adjusting climate models with only topograph-ical variables may thus lead to misrepresentative conclusions regarding future projections (Fig 9).
Regardless of improvements from topo-geo-logical parameters, the probabilities of current refugia distribution across the study region are low (paper I). Their spatial patterns become in-creasingly diffuse and distal (see (Brochmann et al. 2003, Rull 2009) with distance to the main distribution area. These spatial patterns are mir-rored temporally (paper II), as refugial species in a warmer future may rely on increasingly isolated favourable sites, reinforcing caution in whether re-dispersal from increasingly isolated refugia is probable (Hannah et al. 2014). Considerably more refugia were predicted under a more mod-erate climate scenario (paper II), indicating areas of least environmental change are more likely to act as refugia (Reside et al. 2013).
In situ refugia (paper II) are robust predic-tions as they require no range shifts. Whether the greater connectivity of current refugia (paper I) closer to the main distribution area was due to dispersal and/or environmental limitations is dif-ficult to judge. Here, connectivity increased con-temporary refugial species richness, possibly due to an effect of connectivity on colonization (Lind-borg and Eriksson 2004) and reduced extinction (Brown and Kodric-Brown 1977). Results sug-gest that refugia should be considered as both isolated suitable habitats as well as inter-con-nected habitat networks for vulnerable species.
4.2 Drivers of diversity and their hotspots
Large variations in vascular plant diversity char-acterize high-latitude landscapes (paper III; Fig 9). Parallel to how climate and energy availabil-
ity generate global diversity gradients (e.g. Jetz and Rahbek 2002, Hawkins et al. 2003), ener-gy availability during the growing season was particularly pertinent for more local patterns of high-latitude plant diversity. The methods used in this thesis proved successful for recogniz-ing diversity hotspots from patterns of species richness across landscapes. However, they also showed how ascertaining the locations of these hotspots is complex due to the various envi-ronmental factors influencing species richness (Wohlgemuth 1998, Lobo et al. 2001, Loidi et al. 2015). The diversity metrics showed widely different responses to climate: contrary to TSR and THR that peaked towards the warmer end of the growing season temperature gradient, the highest occurrences of species with the smallest ranges (RRR) showed a preference for cooler growing conditions. Though patterns of diversity and TSR in particular were strongly influenced by climatic conditions, RRR and THR – more restricted by their environmental requirements (Morán‐Ordóñez et al. 2017) – appeared reliant on further fulfilment of habitat requirements such as substrate conditions.
Similar to topo-geological control on refu-gia (papers I & II), these variables also help determine diversity patterns. This was particu-larly so in the case of species of high conser-vation concern or with a limited range size. As calcareous areas are not common in this region, it follows that many of the species favoring a high soil pH are rare or threatened (Kauhanen 2013). This could be seen in how calcareous bed-rock supported a higher THR (see also Heik-kinen and Neuvonen 1997, Anderson and Fer-ree 2010). The importance of topographically controlled hydrological processes was shown by how higher TWI hosts THR hotspots. Moister soils may reduce exposure to extremes in tem-perature (Ashcroft and Gollan 2013) (analogous to the direct importance for current refugia, see
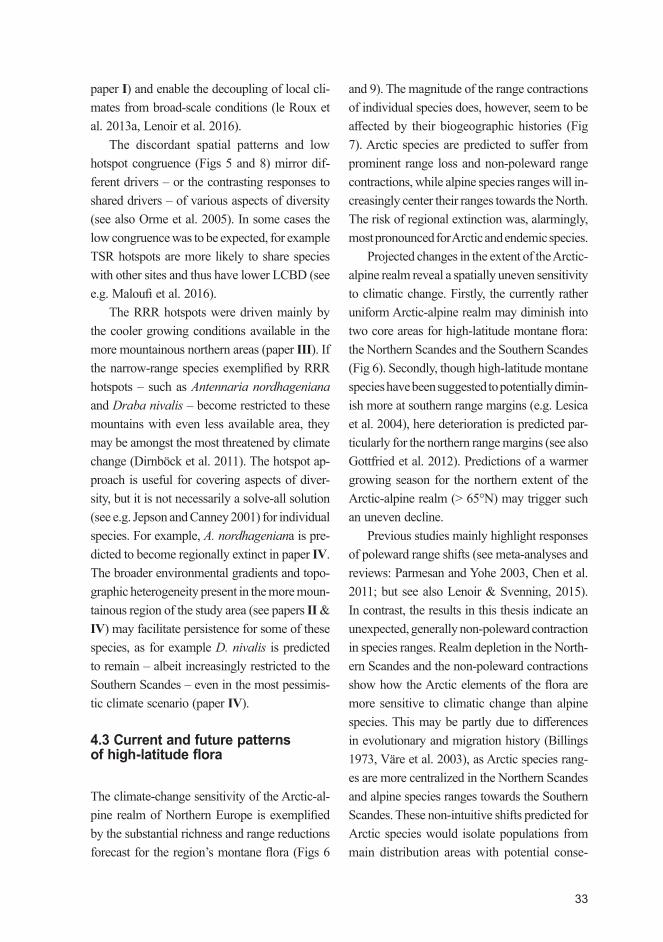
33
paper I) and enable the decoupling of local cli-mates from broad-scale conditions (le Roux et al. 2013a, Lenoir et al. 2016).
The discordant spatial patterns and low hotspot congruence (Figs 5 and 8) mirror dif-ferent drivers – or the contrasting responses to shared drivers – of various aspects of diversity (see also Orme et al. 2005). In some cases the low congruence was to be expected, for example TSR hotspots are more likely to share species with other sites and thus have lower LCBD (see e.g. Maloufi et al. 2016).
The RRR hotspots were driven mainly by the cooler growing conditions available in the more mountainous northern areas (paper III). If the narrow-range species exemplified by RRR hotspots – such as Antennaria nordhageniana and Draba nivalis – become restricted to these mountains with even less available area, they may be amongst the most threatened by climate change (Dirnböck et al. 2011). The hotspot ap-proach is useful for covering aspects of diver-sity, but it is not necessarily a solve-all solution (see e.g. Jepson and Canney 2001) for individual species. For example, A. nordhageniana is pre-dicted to become regionally extinct in paper IV. The broader environmental gradients and topo-graphic heterogeneity present in the more moun-tainous region of the study area (see papers II & IV) may facilitate persistence for some of these species, as for example D. nivalis is predicted to remain – albeit increasingly restricted to the Southern Scandes – even in the most pessimis-tic climate scenario (paper IV).
4.3 Current and future patterns of high-latitude flora
The climate-change sensitivity of the Arctic-al-pine realm of Northern Europe is exemplified by the substantial richness and range reductions forecast for the region’s montane flora (Figs 6
and 9). The magnitude of the range contractions of individual species does, however, seem to be affected by their biogeographic histories (Fig 7). Arctic species are predicted to suffer from prominent range loss and non-poleward range contractions, while alpine species ranges will in-creasingly center their ranges towards the North. The risk of regional extinction was, alarmingly, most pronounced for Arctic and endemic species.
Projected changes in the extent of the Arctic-alpine realm reveal a spatially uneven sensitivity to climatic change. Firstly, the currently rather uniform Arctic-alpine realm may diminish into two core areas for high-latitude montane flora: the Northern Scandes and the Southern Scandes (Fig 6). Secondly, though high-latitude montane species have been suggested to potentially dimin-ish more at southern range margins (e.g. Lesica et al. 2004), here deterioration is predicted par-ticularly for the northern range margins (see also Gottfried et al. 2012). Predictions of a warmer growing season for the northern extent of the Arctic-alpine realm (> 65°N) may trigger such an uneven decline.
Previous studies mainly highlight responses of poleward range shifts (see meta-analyses and reviews: Parmesan and Yohe 2003, Chen et al. 2011; but see also Lenoir & Svenning, 2015). In contrast, the results in this thesis indicate an unexpected, generally non-poleward contraction in species ranges. Realm depletion in the North-ern Scandes and the non-poleward contractions show how the Arctic elements of the flora are more sensitive to climatic change than alpine species. This may be partly due to differences in evolutionary and migration history (Billings 1973, Väre et al. 2003), as Arctic species rang-es are more centralized in the Northern Scandes and alpine species ranges towards the Southern Scandes. These non-intuitive shifts predicted for Arctic species would isolate populations from main distribution areas with potential conse-
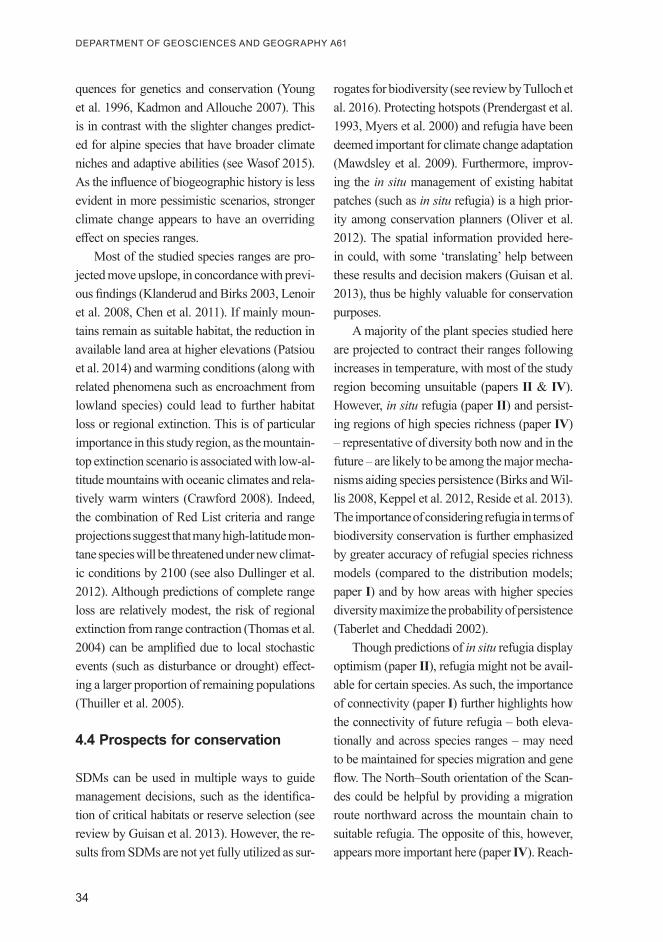
34
DEPARTMENT OF GEOSCIENCES AND GEOGRAPHY A61
quences for genetics and conservation (Young et al. 1996, Kadmon and Allouche 2007). This is in contrast with the slighter changes predict-ed for alpine species that have broader climate niches and adaptive abilities (see Wasof 2015). As the influence of biogeographic history is less evident in more pessimistic scenarios, stronger climate change appears to have an overriding effect on species ranges.
Most of the studied species ranges are pro-jected move upslope, in concordance with previ-ous findings (Klanderud and Birks 2003, Lenoir et al. 2008, Chen et al. 2011). If mainly moun-tains remain as suitable habitat, the reduction in available land area at higher elevations (Patsiou et al. 2014) and warming conditions (along with related phenomena such as encroachment from lowland species) could lead to further habitat loss or regional extinction. This is of particular importance in this study region, as the mountain-top extinction scenario is associated with low-al-titude mountains with oceanic climates and rela-tively warm winters (Crawford 2008). Indeed, the combination of Red List criteria and range projections suggest that many high-latitude mon-tane species will be threatened under new climat-ic conditions by 2100 (see also Dullinger et al. 2012). Although predictions of complete range loss are relatively modest, the risk of regional extinction from range contraction (Thomas et al. 2004) can be amplified due to local stochastic events (such as disturbance or drought) effect-ing a larger proportion of remaining populations (Thuiller et al. 2005).
4.4 Prospects for conservation
SDMs can be used in multiple ways to guide management decisions, such as the identifica-tion of critical habitats or reserve selection (see review by Guisan et al. 2013). However, the re-sults from SDMs are not yet fully utilized as sur-
rogates for biodiversity (see review by Tulloch et al. 2016). Protecting hotspots (Prendergast et al. 1993, Myers et al. 2000) and refugia have been deemed important for climate change adaptation (Mawdsley et al. 2009). Furthermore, improv-ing the in situ management of existing habitat patches (such as in situ refugia) is a high prior-ity among conservation planners (Oliver et al. 2012). The spatial information provided here-in could, with some ‘translating’ help between these results and decision makers (Guisan et al. 2013), thus be highly valuable for conservation purposes.
A majority of the plant species studied here are projected to contract their ranges following increases in temperature, with most of the study region becoming unsuitable (papers II & IV). However, in situ refugia (paper II) and persist-ing regions of high species richness (paper IV) – representative of diversity both now and in the future – are likely to be among the major mecha-nisms aiding species persistence (Birks and Wil-lis 2008, Keppel et al. 2012, Reside et al. 2013). The importance of considering refugia in terms of biodiversity conservation is further emphasized by greater accuracy of refugial species richness models (compared to the distribution models; paper I) and by how areas with higher species diversity maximize the probability of persistence (Taberlet and Cheddadi 2002).
Though predictions of in situ refugia display optimism (paper II), refugia might not be avail-able for certain species. As such, the importance of connectivity (paper I) further highlights how the connectivity of future refugia – both eleva-tionally and across species ranges – may need to be maintained for species migration and gene flow. The North–South orientation of the Scan-des could be helpful by providing a migration route northward across the mountain chain to suitable refugia. The opposite of this, however, appears more important here (paper IV). Reach-

ing regions with larger elevation gradients that provide species with the opportunity for upslope migration may entail significant non-poleward – i.e. not northward – range shifts. The potential of connectivity (paper I) in assisting predicted range shifts (paper IV) is worthy of future study.
However, some Arctic-alpine species are not predicted to find any suitable habitat in future climate (even with the assumption of universal migration: paper IV). This further underlines the difficulty in locating refugia for individual spe-cies and a possible need to prioritise species at greatest risk (Skov and Svenning 2004), such as A. nordhageniana and Dryopteris fragrans (en-demic to the study region; rare in Europe; paper IV). Furthermore, the substantial and often non-poleward range contractions (paper IV) predict-ed for Arctic and endemic species in particular would have significant impacts on their evolu-tion and our efforts to conserve them.
The results of this thesis consistently high-light how environmentally heterogeneous high-elevation regions are expected to become ex-ceedingly important for refugia and diversity (see also Loarie et al. 2008, Luoto and Heikki-nen 2008, Scherrer and Körner 2011). However, the significance of potential mountain refugia is likely to be affected by species’ biogeographic history. This could be especially true for true Arctic species at risk from range reduction and restriction to higher elevations (paper IV). It fol-lows that research efforts and conservation atten-tion should be given to steep, rugged landforms and mountainous habitats, such as the South-ern Scandes (paper IV) and the in situ refugial expanse near the Northern Scandes (paper II). The refugial potential of the diminishing realm of the Northern Scandes and what this means for individual species certainly deserves further investigation. As mountain refugia are disputed to be of little avail to small, scattered popula-tions (Birks 2008), further insights into the per-
sistence of hotspots for range-restricted species (paper III) could also be valuable. As these RRR hotspots are characterized by cooler tempera-tures, they may be more adversely affected than those with a positive response to temperature (TSR and THR). Alternatively, they may also be buffered from climate change via topo-geo-logical attributes.
Recognizing current – and overlapping (Brooks et al. 2006) – areas of diversity in or-der to protect them is preferable to be able to limit uncertainties in projections (Thuiller et al. 2008). The results of this thesis, however, dem-onstrate the difficulties in simultaneously sustain-ing multi-faceted biodiversity (paper III), ob-structing the usability of the hotspot approach (e.g. Feng et al. 2011, Daru et al. 2015). Differ-ent hotspots may thus have contrasting value for conservation efforts (see Possingham and Wilson 2005, Feng et al. 2011, Daru et al. 2015). Take, for example, how prioritizing TSR hotspots, a commonly used conservation target (May 1988), would exclude hotspots of range-restricted spe-cies that are potentially more sensitive to envi-ronmental change (Thuiller et al. 2005). How-ever, the partial congruence of TSR and THR hotspots would mean that conserving areas of high overall species diversity might be inadver-tently beneficial for at-risk species (Fig 5; paper III). Furthermore, the more topo-geologically defined THR hotspots may have a higher chance of being buffered from climate change than more climatically influenced hotspots.
These results also highlight how areas out-side of PAs can hold crucial elements of biodi-versity. Although the study region has an exten-sive PA network, only a fifth of the predicted hotspots are currently protected (mainly in the North by the Käsivarsi wilderness area which is not a strict nature reserve; paper III). This illus-trates how evaluating protective capacity based on PA spatial extent alone may not be a good
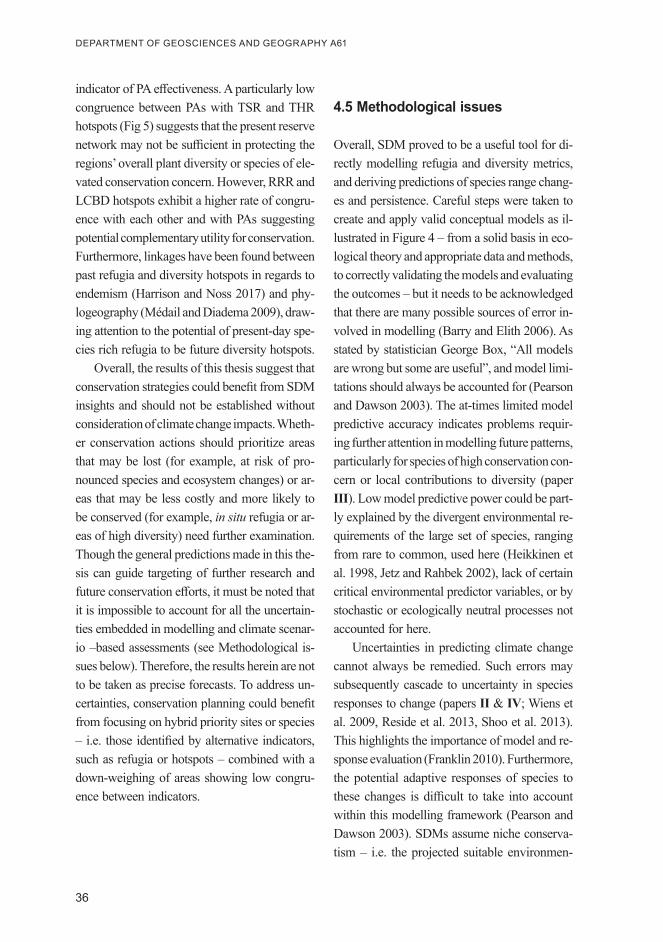
36
DEPARTMENT OF GEOSCIENCES AND GEOGRAPHY A 61
indicator of PA effectiveness. A particularly low congruence between PAs with TSR and THR hotspots (Fig 5) suggests that the present reserve network may not be sufficient in protecting the regions’ overall plant diversity or species of ele-vated conservation concern. However, RRR and LCBD hotspots exhibit a higher rate of congru-ence with each other and with PAs suggesting potential complementary utility for conservation. Furthermore, linkages have been found between past refugia and diversity hotspots in regards to endemism (Harrison and Noss 2017) and phy-logeography (Médail and Diadema 2009), draw-ing attention to the potential of present-day spe-cies rich refugia to be future diversity hotspots.
Overall, the results of this thesis suggest that conservation strategies could benefit from SDM insights and should not be established without consideration of climate change impacts. Wheth-er conservation actions should prioritize areas that may be lost (for example, at risk of pro-nounced species and ecosystem changes) or ar-eas that may be less costly and more likely to be conserved (for example, in situ refugia or ar-eas of high diversity) need further examination. Though the general predictions made in this the-sis can guide targeting of further research and future conservation efforts, it must be noted that it is impossible to account for all the uncertain-ties embedded in modelling and climate scenar-io –based assessments (see Methodological is-sues below). Therefore, the results herein are not to be taken as precise forecasts. To address un-certainties, conservation planning could benefit from focusing on hybrid priority sites or species – i.e. those identified by alternative indicators, such as refugia or hotspots – combined with a down-weighing of areas showing low congru-ence between indicators.
4.5 Methodological issues
Overall, SDM proved to be a useful tool for di-rectly modelling refugia and diversity metrics, and deriving predictions of species range chang-es and persistence. Careful steps were taken to create and apply valid conceptual models as il-lustrated in Figure 4 – from a solid basis in eco-logical theory and appropriate data and methods, to correctly validating the models and evaluating the outcomes – but it needs to be acknowledged that there are many possible sources of error in-volved in modelling (Barry and Elith 2006). As stated by statistician George Box, “All models are wrong but some are useful”, and model limi-tations should always be accounted for (Pearson and Dawson 2003). The at-times limited model predictive accuracy indicates problems requir-ing further attention in modelling future patterns, particularly for species of high conservation con-cern or local contributions to diversity (paper III). Low model predictive power could be part-ly explained by the divergent environmental re-quirements of the large set of species, ranging from rare to common, used here (Heikkinen et al. 1998, Jetz and Rahbek 2002), lack of certain critical environmental predictor variables, or by stochastic or ecologically neutral processes not accounted for here.
Uncertainties in predicting climate change cannot always be remedied. Such errors may subsequently cascade to uncertainty in species responses to change (papers II & IV; Wiens et al. 2009, Reside et al. 2013, Shoo et al. 2013). This highlights the importance of model and re-sponse evaluation (Franklin 2010). Furthermore, the potential adaptive responses of species to these changes is difficult to take into account within this modelling framework (Pearson and Dawson 2003). SDMs assume niche conserva-tism – i.e. the projected suitable environmen-
37
tal space does not ‘evolve’ along with climate change – even though species may show local evolutionary responses and be able to adapt or maladapt faster than predicted range contractions (Cotto et al. 2017). Future distributions are like-ly to be influenced by other factors than those accounted for here, such as biotic interactions (Callaway et al. 2002) and dispersal (Bateman et al. 2013). Dispersal uncertainty was taken in-to account in paper II by only modelling in situ refugia, though this approach could lead to un-derestimates of species persistence. Furthermore, dominant processes may vary within a species range (Barry and Elith 2006) which could be useful for locating outliers such as refugia. This could be explored through stratified cross vali-dation (Thuiller et al. 2013) or geographically weighted regression (Fotheringham et al. 2003).
Limitations can also be introduced through different classification methods. For example, re-sults may differ according to the somewhat arbi-trary ways of defining refugia, diversity hotspots (Daru et al. 2015), or IUCN categories. The usage of the IUCN Red List approach for examining the consequences of climate change is also limited as it estimates species vulnerability based only on climate scenarios and range change predic-tions (Thuiller et al. 2005, Akçakaya et al. 2006, Pacifici et al. 2015).
Although this thesis shows how refugia, di-versity, and species distribution patterns can be spatiotemporally modelled with environmental variables, these predictions are bound to have limited surrogacy for observations. Improving model realism, particularly in terms of addition-al variables and spatial scales, is discussed fur-ther in the following section on future research perspectives.
4.6 Future perspectives
This thesis contributes to the understanding of high-latitude plant responses to climate change, and additionally, it also raises many important research questions to be addressed some of which are presented below. As the results of this thesis show, both coarse and more local scale processes are relevant for assessing changes in species’ dis-tributions under changing climate. Complemen-tary finer scale or more integrated (Carlson et al. 2013), trait- (Kattge et al. 2011), or process-based (Snell et al. 2014) analyses could supplement the results herein and help generate even more ac-curate projections of the changes in plant species ranges and assemblages. Further modelling ef-forts should focus on improving the knowledge on the particular species, areas, or habitats threat-ened by future climatic change (Thuiller et al. 2005, Williams et al. 2005, Loarie et al. 2008). This thesis also provides useful insights for both scientific knowledge and conservation planning. For example, results could help identify the most stable or, contrastingly, the most threatened el-ements of biodiversity to guide further model-ling efforts or be used as indicators of change (Pauli et al. 2014).
The importance of the topographic setting indicates that future research on species persis-tence would benefit from examining different as-pects of geodiversity (Bailey et al. 2017), topo-climatic decoupling (Dobrowski 2011, Scherrer and Körner 2011, Hylander et al. 2015), and their importance for habitat stability. For example, it appears that the avoidance of summer time tem-perature highs (Dahl 1951) is more critical than winter conditions for future refugia. This, togeth-er with the findings of the importance of tempera-ture extremes for current refugia and a predicted increase in extreme temperature events (Meehl and Tebaldi 2004) highlights the relevance of ex-

38
DEPARTMENT OF GEOSCIENCES AND GEOGRAPHY A
treme temperatures for high-latitude refugia and raises questions on whether they can be buffered or not. Studies at more local scales in the rug-ged, mountainous areas would potentially require more fine-scale mapping of environmental pre-dictors (Randin et al. 2009), as has been done via mapping topographic features and canopy den-sity with light detection-and-ranging (LiDAR) technology to detect local-scale refugia (Lenoir et al. 2016). However, it should be acknowl-edged that other recent efforts have successfully modelled local-scale refugia over a large spatial domain through the integration of topographic climate-forcing factors with climate station data (Meineri and Hylander 2016).
The significance of steep landforms in this thesis reflects the potentially important role of active geomorphic and slope processes on spe-cies occurrences (Randin et al. 2009, le Roux et al. 2013b, Slaton and Linder 2015). In fact, these phenomena have been shown to improve local-scale SDM accuracy for Arctic–alpine spe-cies (le Roux and Luoto 2014). The relevance of disturbance regimes should thus be acknowl-edged in future studies, but progress in this field is hindered by a lack of appropriate data. More-over, though the higher altitude mountainous re-gions are highlighted here, it has been suggested that also lowland refugia could facilitate species’ adaptations to environmental change and thus lower extinction risk (Mosblech et al. 2011). Ex-ploring potential high-latitude refugia at different elevations could thus be crucial.
The role of habitat connectivity and disper-sal ability are also worthy of further investiga-tion. Accounting for circumstances with no spa-tial overlap between current and future habitats would require information on species dispersal capacities (Reside et al. 2014) to ex situ refugia (Shoo et al. 2013) and analyses of where new refugia might be found in the future. Biotic in-teractions (Godsoe et al. 2015, Mod et al. 2015)
could provide more realistic projections of fu-ture patterns of species and diversity (Araújo and Luoto 2007), though their relevance is likely to be more pronounced at finer spatial scales. The same is likely true for soil moisture, a key driver of fine-scale vegetation properties and a poten-tially significant mechanism in a changing cli-mate (le Roux et al. 2013a). Moisture condi-tions were represented here by the WAB and TWI variables, which were demonstrated to be important for Arctic-alpine vegetation. The dif-fering responses of current and future refugia to substrate conditions deserve further examination, although their impacts may be more pronounced at finer spatial scales.
Results of this thesis (for example, the high importance of slope in preliminary SDMs for paper III including all available data points, but a substantially lower importance when using a thinned dataset) show how the data used is criti-cal in finding the underlying drivers of diversity. Furthermore, the data used in paper III included boreal alongside Arctic-alpine species (papers I and II). Taken together with the effect of spe-cies’ biogeographic histories on range projec-tions (paper IV), these highlight a need for a further understanding of climate change impacts on different assemblages of high-latitude species. Differences may be found between slope and flat-land assemblages of species as well as between species with different biogeographic histories.
The results of this thesis support the notion that the potential differences between refugia and hotspots and how they are defined must be care-fully considered in future research. A species-specific approach would ensure that every spe-cies is accounted for, and could predict which species are most likely to be protected by – and even restricted to – refugia in the future.
61
39
5 Conclusions
Identifying the main drivers and patterns of Arctic-alpine plant species – through analyses of their refugia, diversity hotspots, and climate change vulnerability – is of importance for un-derstanding and preserving high-latitude ecosys-tems. This thesis shows that species distribution modelling and a geographically explicit context can help us not only recognize where changes may take place, but also identify where environ-mental conditions might facilitate (i.e. refugia) or maximize (i.e. diversity hotspots) species’ per-sistence. Though the variability in projected spe-cies responses to climate change often make it difficult to assess the future, these findings show that consistent patterns and drivers can be found for high-latitude flora. This highlights the im-portance of employing comprehensive species and environmental data in predicting diversity across landscapes.
Current and future diversity patterns exhib-it high variability, illustrating the complexity of driving factors and species responses. The low congruence of diversity hotspots, both with each other and present-day protected areas, reduces the proxy potential of hotspots and draws at-tention to possible insufficiencies in the current conservation area network.
Climate significantly controls Arctic-alpine vascular plant species distribution patterns and their manifestations, suggesting that high-lati-tude flora on the whole may face significant al-terations due to projected climatic change. The sensitivity of high-latitude montane species to ongoing climate change depends not only on the predicted severity of this change, but also on re-gional geography and species’ biogeographic his-tories. As such, projections of future distributions deviate from simplistic “poleward-and-upslope” movements. Alarmingly, a prominent decrease
in suitable Arctic-alpine environments is pre-dicted for the entire Fennoscandian peninsula, but of particular concern are its northernmost (>68°N) regions where true Arctic and endemic species may be disproportionately vulnerable to a changed climate. Potential drastic changes ac-centuate the importance of refugia and diversity hotspots for conservation measures.
Predictions of species responses to climate change based on climate alone may be inaccu-rate in estimating refugia or extinction risk as they ignore topographic and geological condi-tions which may critically affect species distribu-tions. Despite forecasted future regional warm-ing, several refugia could be found in places where locally optimal environments are predict-ed to remain constant over time. Landscape-scale features create suitable habitats and can shelter species from a matrix of unfavourable condi-tions, possibly even sustaining local populations of at-risk plants under climate change. Knowl-edge of topo-geological parameters is thus vital for identifying potential refugia, particularly in mountainous regions such as the Scandes. How-ever, some species may not find suitable habitats even at higher elevations, and refugia and range shifts alone may not be sufficient in ensuring the survival of individual at-risk species.
The findings of this thesis provide a tem-plate for ways in which to develop a better un-derstanding of species distributions in changing landscapes. Furthermore, the potential refugia, diversity hotspots, and range changes described herein have implications for future efforts aim-ing to predict or protect biodiversity.

40
DEPARTMENT OF GEOSCIENCES AND GEOGRAPHY A
ReferencesAalto, J., H. Riihimäki, E. Meineri, K. Hylander, and
M. Luoto. 2017. Revealing topoclimatic hetero-geneity using meteorological station data. Inter-national Journal of Climatology.
Aalto, J., A. Venäläinen, R. K. Heikkinen, and M. Luo-to. 2014. Potential for extreme loss in high-latitude Earth surface processes due to climate change. Geophysical Research Letters 41:3914-3924.
Ackerly, D. D., S. R. Loarie, W. K. Cornwell, S. B. Weiss, H. Hamilton, R. Branciforte, and N. J. B. Kraft. 2010. The geography of climate change: implications for conservation biogeography. Di-versity and Distributions 16:476-487.
Aiello‐Lammens, M. E., R. A. Boria, A. Radosav-ljevic, B. Vilela, and R. P. Anderson. 2015. spThin: an R package for spatial thinning of species occur-rence records for use in ecological niche models. Ecography 38:541-545.
Akçakaya, H. R., S. H. Butchart, G. M. Mace, S. N. Stuart, and C. Hilton‐Taylor. 2006. Use and mis-use of the IUCN Red List Criteria in projecting climate change impacts on biodiversity. Global Change Biology 12:2037-2043.
Allouche, O., A. Tsoar, and R. Kadmon. 2006. Assess-ing the accuracy of species distribution models: prevalence, kappa and the true skill statistic (TSS). Journal of Applied Ecology 43:1223-1232.
Alm, T., and H. H. Birks. 1991. Late Weichselian flo-ra and vegetation of Andøya, Northern Norway‐macrofossil (seed and fruit) evidence from Nedre Æråsvatn. Nordic Journal of Botany 11:465-476.
Anderson, M. G., and C. E. Ferree. 2010. Conserv-ing the stage: climate change and the geophysi-cal underpinnings of species diversity. PloS one 5:e11554.
Anderson, P., M. Robert Dudík, S. Ferrier, A. Guisan, R. J Hijmans, F. Huettmann, J. R Leathwick, A. Lehmann, J. Li, and L. G Lohmann. 2006. Novel methods improve prediction of species’ distribu-tions from occurrence data. Ecography 29:129-151.
Araújo, M. B., and A. Guisan. 2006. Five (or so) chal-lenges for species distribution modelling. Journal of biogeography 33:1677-1688.
Araújo, M. B., and M. Luoto. 2007. The importance of biotic interactions for modelling species distribu-tions under climate change. Global Ecology and Biogeography 16:743-753.
Araújo, M. B., and M. New. 2007. Ensemble forecast-ing of species distributions. Trends in ecology & evolution 22:42-47.
Armsworth, P. R., B. E. Kendall, and F. W. Davis. 2004. An introduction to biodiversity concepts for environmental economists. Resource and energy Economics 26:115-136.
Ashcroft, M. B. 2010. Identifying refugia from climate
change. Journal of biogeography 37:1407-1413.Ashcroft, M. B., and J. R. Gollan. 2013. Moisture, ther-
mal inertia, and the spatial distributions of near-surface soil and air temperatures: Understanding factors that promote microrefugia. Agricultural and Forest Meteorology 176:77-89.
Austin, M. P., and K. P. Van Niel. 2011a. Impact of landscape predictors on climate change modelling of species distributions: a case study with Eu-calyptus fastigata in southern New South Wales, Australia. Journal of biogeography 38:9-19.
Austin, M. P., and K. P. Van Niel. 2011b. Improving species distribution models for climate change studies: variable selection and scale. Journal of biogeography 38:1-8.
Bailey, J. J., D. S. Boyd, J. Hjort, C. P. Lavers, and R. Field. 2017. Modelling native and alien vas-cular plant species richness: At which scales is geodiversity most relevant? Global Ecology and Biogeography.
Bakkenes, M., J. Alkemade, F. Ihle, R. Leemans, and J. Latour. 2002. Assessing effects of forecasted climate change on the diversity and distribution of European higher plants for 2050. Global Change Biology 8:390-407.
Barbet‐Massin, M., F. Jiguet, C. H. Albert, and W. Thuiller. 2012. Selecting pseudo‐absences for species distribution models: how, where and how many? Methods in Ecology and Evolution 3:327-338.
Barnosky, A. D. 2008. Climatic change, refugia, and biodiversity: where do we go from here? An edito-rial comment. Climatic Change 86:29-32.
Barry, S., and J. Elith. 2006. Error and uncertainty in habitat models. Journal of Applied Ecology 43:413-423.
Bateman, B. L., H. T. Murphy, A. E. Reside, K. Mo-kany, and J. VanDerWal. 2013. Appropriateness of full‐, partial‐and no‐dispersal scenarios in climate change impact modelling. Diversity and Distribu-tions 19:1224-1234.
Beauregard, F., and S. de Blois. 2014. Beyond a cli-mate-centric view of plant distribution: edaphic variables add value to distribution models. PloS one 9:e92642.
Bellard, C., C. Bertelsmeier, P. Leadley, W. Thuiller, and F. Courchamp. 2012. Impacts of climate change on the future of biodiversity. Ecol Lett 15:365-377.
Bennett, K., and J. Provan. 2008. What do we mean by ‘refugia’? Quaternary Science Reviews 27:2449-2455.
Beven, K. J., and M. J. Kirkby. 1979. A physically based, variable contributing area model of basin hydrology / Un modèle à base physique de zone d’appel variable de l’hydrologie du bassin versant. Hydrological Sciences Bulletin 24:43-69.
Billings, W. 1973. Arctic and alpine vegetations: simi-larities, differences, and susceptibility to distur-
61

41
bance. BioScience 23:697-704.Billings, W., and H. Mooney. 1968. The ecology of
arctic and alpine plants. Biol. Rev 43:481-529.Birks, H. H. 2008. The Late-Quaternary history of
arctic and alpine plants. Plant Ecology & Diver-sity 1:135-146.
Birks, H. J. B., and K. J. Willis. 2008. Alpines, trees, and refugia in Europe. Plant Ecology & Diversity 1:147-160.
Bliss, L. C. 1971. Arctic and alpine plant life cycles. Annual Review of Ecology and Systematics 2:405-438.
Bonebrake, T. C., C. J. Brown, J. D. Bell, J. L. Blanchard, A. Chauvenet, C. Champion, I. Chen, T. D. Clark, R. K. Colwell, and F. Danielsen. 2017. Managing consequences of climate‐driven spe-cies redistribution requires integration of ecol-ogy, conservation and social science. Biological Reviews:DOI: 10.1111/brv.12344.
Bonn, A., A. S. Rodrigues, and K. J. Gaston. 2002. Threatened and endemic species: are they good indicators of patterns of biodiversity on a national scale? Ecol Lett 5:733-741.
Botkin, D. B., H. Saxe, M. B. AraÚJo, R. Betts, R. H. W. Bradshaw, T. Cedhagen, P. Chesson, T. P. Dawson, J. R. Etterson, D. P. Faith, S. Ferrier, A. Guisan, A. S. Hansen, D. W. Hilbert, C. Loehle, C. Margules, M. New, M. J. Sobel, and D. R. B. Stockwell. 2007. Forecasting the Effects of Global Warming on Biodiversity. BioScience 57:227.
Breiman, L. 2001. Random forests. Machine Learn-ing 45:5-32.
Breiman, L., J. H. Friedman, R. A. Olshen, and C. J. Stone. 1984. Classification and regression trees. Wadsworth & Brooks. Monterey, CA.
Brochmann, C., T. M. Gabrielsen, I. Nordal, J. Y. Landvik, and R. Elven. 2003. Glacial survival or tabula rasa? The history of North Atlantic biota revisited. Taxon 52:417-450.
Brooks, T. M., R. A. Mittermeier, G. A. da Fonseca, J. Gerlach, M. Hoffmann, J. F. Lamoreux, C. G. Mittermeier, J. D. Pilgrim, and A. S. Rodrigues. 2006. Global biodiversity conservation priorities. Science 313:58-61.
Brown, J. H., and A. Kodric-Brown. 1977. Turnover rates in insular biogeography: effect of immigra-tion on extinction. Ecology 58:445-449.
Callaghan, T. V., L. O. Björn, Y. Chernov, T. Chapin, T. R. Christensen, B. Huntley, R. A. Ims, M. Jo-hansson, D. Jolly, S. Jonasson, N. Matveyeva, N. Panikov, W. Oechel, G. Shaver, J. Elster, H. Hent-tonen, K. Laine, K. Taulavuori, E. Taulavuori, and C. Zöckler. 2004. Biodiversity, Distributions and Adaptations of Arctic Species in the Context of Environmental Change. AMBIO: A Journal of the Human Environment 33:404-417.
Callaway, R. M., R. Brooker, P. Choler, and Z. Kikvid-ze. 2002. Positive interactions among alpine plants increase with stress. Nature 417:844.
Cañadas, E. M., G. Fenu, J. Peñas, J. Lorite, E. Mat-tana, and G. Bacchetta. 2014. Hotspots within hotspots: Endemic plant richness, environmental drivers, and implications for conservation. Bio-logical Conservation 170:282-291.
Carlson, B. Z., C. F. Randin, I. Boulangeat, S. Lavergne, W. Thuiller, and P. Choler. 2013. Work-ing toward integrated models of alpine plant dis-tribution. Alpine Botany 123:41-53.
Categories, I. R. L. 2001. Criteria: Version 3.1. IUCN Species Survival Commission, Gland, Switzer-land.
Ceballos, G., and P. R. Ehrlich. 2006. Global mammal distributions, biodiversity hotspots, and conserva-tion. Proceedings of the National Academy of Sci-ences 103:19374-19379.
Chape, S., J. Harrison, M. Spalding, and I. Lysenko. 2005. Measuring the extent and effectiveness of protected areas as an indicator for meeting global biodiversity targets. Philosophical Transactions of the Royal Society of London B: Biological Sci-ences 360:443-455.
Chen, I.-C., J. K. Hill, R. Ohlemüller, D. B. Roy, and C. D. Thomas. 2011. Rapid range shifts of species associated with high levels of climate warming. Science 333:1024-1026.
Cleland, E. E., I. Chuine, A. Menzel, H. A. Mooney, and M. D. Schwartz. 2007. Shifting plant phe-nology in response to global change. Trends in ecology & evolution 22:357-365.
Corner, G. D. 2005. Scandes Mountains. Pages 229-254 in M. Seppälä, editor. The Physical Geogra-phy of Fennoscandia. Oxford University Press, United States.
Cotto, O., J. Wessely, D. Georges, G. Klonner, M. Schmid, S. Dullinger, W. Thuiller, and F. Guil-laume. 2017. A dynamic eco-evolutionary model predicts slow response of alpine plants to climate warming. Nature Communications 8.
Dahl, E. 1951. On the relation between summer tem-perature and the distribution of alpine vascular plants in the lowlands of Fennoscandia. Oikos 3:22-52.
Daru, B. H., M. Bank, and T. J. Davies. 2015. Spatial incongruence among hotspots and complementary areas of tree diversity in southern Africa. Diversity and Distributions 21:769-780.
Dirnböck, T., F. Essl, and W. Rabitsch. 2011. Dis-proportional risk for habitat loss of high‐altitude endemic species under climate change. Global Change Biology 17:990-996.
Dobrowski, S. Z. 2011. A climatic basis for microre-fugia: the influence of terrain on climate. Global Change Biology 17:1022-1035.
Dubuis, A., S. Giovanettina, L. Pellissier, J. Pottier, P. Vittoz, and A. Guisan. 2013. Improving the predic-tion of plant species distribution and community composition by adding edaphic to topo‐climatic variables. Journal of Vegetation Science 24:593-
42
DEPARTMENT OF GEOSCIENCES AND GEOGRAPHY A
606.Dullinger, S., A. Gattringer, W. Thuiller, D. Moser,
N. E. Zimmermann, A. Guisan, W. Willner, C. Plutzar, M. Leitner, and T. Mang. 2012. Extinction debt of high-mountain plants under twenty-first-century climate change. Nature climate change 2:619-622.
Eidesen, P. B., D. Ehrich, V. Bakkestuen, I.G. Alsos, O. Gilg, P. Taberlet, and C. Brochmann. 2013. Genetic roadmap of the arctic: plant dispersal highways, traffic barriers and capitals of diver-sity. New Phytologist 200:898-910.
Elith, J., and J. R. Leathwick. 2009. Species distribu-tion models: ecological explanation and prediction across space and time. Annual review of ecology, evolution, and systematics 40:677-697.
Elith, J., J. R. Leathwick, and T. Hastie. 2008. A work-ing guide to boosted regression trees. Journal of Animal Ecology 77:802-813.
Engler, R., C. F. Randin, W. Thuiller, S. Dullinger, N. E. Zimmermann, M. B. Araújo, P. B. Pearman, G. Le Lay, C. Piedallu, and C. H. Albert. 2011. 21st century climate change threatens mountain flora unequally across Europe. Global Change Biology 17:2330-2341.
Epstein, H. E., I. Myers-Smith, and D. A. Walker. 2013. Recent dynamics of arctic and sub-arctic vegetation. Environmental Research Letters 8:015040.
Feng, J.-M., Z. Zhang, and R.-Y. Nan. 2011. Non-con-gruence among hotspots based on three common diversity measures in Yunnan, south-west China. Plant Ecology & Diversity 4:353-361.
Fickert, T., D. Friend, F. Grüninger, B. Molnia, and M. Richter. 2007. Did debris-covered glaciers serve as Pleistocene refugia for plants? A new hypothesis derived from observations of recent plant growth on glacier surfaces. Arctic, Antarctic, and Alpine Research 39:245-257.
Fielding, A. H., and J. F. Bell. 1997. A review of methods for the assessment of prediction errors in conservation presence/absence models. Envi-ronmental Conservation 24:38-49.
Flather, C. H., K. R. Wilson, D. J. Dean, and W. C. McComb. 1997. Identifying gaps in conservation networks: of indicators and uncertainty in geo-graphic‐based analyses. Ecological Applications 7:531-542.
Fløjgaard, C., S. Normand, F. Skov, and J. C. Sven-ning. 2009. Ice age distributions of European small mammals: insights from species distribu-tion modelling. Journal of biogeography 36:1152-1163.
Fotheringham, A. S., C. Brunsdon, and M. Charlton. 2003. Geographically weighted regression: the analysis of spatially varying relationships. John Wiley & Sons.
Franklin, J. 1995. Predictive vegetation mapping: geo-graphic modelling of biospatial patterns in relation
to environmental gradients. Progress in physical geography 19:474-499.
Franklin, J. 2010. Mapping species distributions: spa-tial inference and prediction. Cambridge Univer-sity Press.
Fridley, J. D. 2009. Downscaling Climate over Com-plex Terrain: High Finescale (<1000 m) Spatial Variation of Near-Ground Temperatures in a Mon-tane Forested Landscape (Great Smoky Moun-tains)*. Journal of Applied Meteorology and Cli-matology 48:1033-1049.
Friedman, J. H. 1991. Multivariate adaptive regression splines. The annals of statistics 19:1-67.
Game, E. T., G. LIPSETT‐MOORE, E. Saxon, N. Peterson, and S. Sheppard. 2011. Incorporating climate change adaptation into national con-servation assessments. Global Change Biology 17:3150-3160.
Gavin, D. G., M. C. Fitzpatrick, P. F. Gugger, K. D. Heath, F. Rodriguez-Sanchez, S. Z. Dobrowski, A. Hampe, F. S. Hu, M. B. Ashcroft, P. J. Bartlein, J. L. Blois, B. C. Carstens, E. B. Davis, G. de Lafontaine, M. E. Edwards, M. Fernandez, P. D. Henne, E. M. Herring, Z. A. Holden, W. S. Kong, J. Liu, D. Magri, N. J. Matzke, M. S. McGlone, F. Saltre, A. L. Stigall, Y. H. Tsai, and J. W. Williams. 2014. Climate refugia: joint inference from fossil records, species distribution models and phylo-geography. New Phytol 204:37-54.
Giesecke, T. 2005. Moving front or population ex-pansion: how did Picea abies (L.) Karst. become frequent in central Sweden? . Quaternary Science Reviews 24:2495–2509.
Godsoe, W., R. Murray, and M. J. Plank. 2015. In-formation on biotic interactions improves trans-ferability of distribution models. The American Naturalist 185:281-290.
Gottfried, M., H. Pauli, A. Futschik, M. Akhalkatsi, P. Barancok, J. L. B. Alonso, G. Coldea, J. Dick, B. Erschbamer, and G. Kazakis. 2012. Continent-wide response of mountain vegetation to climate change. Nature climate change 2:111.
Gould, W. 2000. Remote sensing of vegetation, plant species richness, and regional biodiversity hotspots. Ecological Applications 10:1861-1870.
Grabherr, G., M. Gottfried, and H. Pauli. 1994. Cli-mate effects on mountain plants. Nature 369:448-448.
Graham, C. H., J. VanDerWal, S. J. Phillips, C. Moritz, and S. E. Williams. 2010. Dynamic refugia and species persistence: tracking spatial shifts in habi-tat through time. Ecography 33:1062-1069.
Guisan, A., J. P. Theurillat, and F. Kienast. 1998. Pre-dicting the potential distribution of plant species in an alpine environment. Journal of Vegetation Science 9:65-74.
Guisan, A., and W. Thuiller. 2005. Predicting species distribution: offering more than simple habitat models. Ecol Lett 8:993-1009.
61
43
Guisan, A., R. Tingley, J. B. Baumgartner, I. Nau-jokaitis‐Lewis, P. R. Sutcliffe, A. I. Tulloch, T. J. Regan, L. Brotons, E. McDonald‐Madden, C. Mantyka‐Pringle, T. G. Martin, J. R. Rhodes, R. Maggini, S. A. Setterfield, J. Elith, M. W. Schwartz, B. A. Wintle, O. Broennimann, M. Austin, S. Ferrier, M. R. Kearney, H. P. Possing-ham, and Y. M. Buckley. 2013. Predicting species distributions for conservation decisions. Ecol Lett 16:1424-1435.
Guisan, A., and N. E. Zimmermann. 2000. Predictive habitat distribution models in ecology. Ecological modelling 135:147-186.
Hampe, A., F. Rodríguez‐Sánchez, S. Dobrowski, F. S. Hu, and D. G. Gavin. 2013. Climate refugia: from the Last Glacial Maximum to the twenty‐first century. New Phytologist 197:16-18.
Hannah, L., L. Flint, A. D. Syphard, M. A. Moritz, L. B. Buckley, and I. M. McCullough. 2014. Fine-grain modeling of species’ response to climate change: holdouts, stepping-stones, and microre-fugia. Trends Ecol Evol 29:390-397.
Hannah, L., D. Lohse, C. Hutchinson, J. L. Carr, and A. Lankerani. 1994. A preliminary inventory of human disturbance of world ecosystems. Am-bio:246-250.
Harrison, S., and R. Noss. 2017. Endemism hotspots are linked to stable climatic refugia. Annals of Botany 119:207-214.
Hastie, T. J., and R. J. Tibshirani. 1990. Generalized additive models. CRC Press.
Hawkins, B. A., R. Field, H. V. Cornell, D. J. Currie, J.-F. Guégan, D. M. Kaufman, J. T. Kerr, G. G. Mit-telbach, T. Oberdorff, and E. M. O’Brien. 2003. Energy, water, and broad‐scale geographic pat-terns of species richness. Ecology 84:3105-3117.
Heikkinen, R., H. Birks, and R. Kalliola. 1998. A numerical analysis of the mesoscale distribution patterns of vascular plants in the subarctic Kevo Nature Reserve, northern Finland. Journal of bio-geography 25:123-146.
Heikkinen, R. K. 1998. Can richness patterns of rari-ties be predicted from mesoscale atlas data? A case study of vascular plants in the Kevo Reserve. Biological Conservation 83:133-143.
Heikkinen, R. K., M. Marmion, and M. Luoto. 2012. Does the interpolation accuracy of species distri-bution models come at the expense of transfer-ability? Ecography 35:276-288.
Heikkinen, R. K., and S. Neuvonen. 1997. Species richness of vascular plants in the subarctic land-scape of northern Finland: modelling relationships to the environment. Biodiversity & Conservation 6:1181-1201.
Heywood, V. H., and R. T. Watson. 1995. Global biodiversity assessment. Cambridge University Press Cambridge.
Hickler, T., K. Vohland, J. Feehan, P. A. Miller, B. Smith, L. Costa, T. Giesecke, S. Fronzek, T. R.
Carter, and W. Cramer. 2012. Projecting the future distribution of European potential natural vegeta-tion zones with a generalized, tree species‐based dynamic vegetation model. Global Ecology and Biogeography 21:50-63.
Hickling, R., D. B. Roy, J. K. Hill, R. Fox, and C. D. Thomas. 2006. The distributions of a wide range of taxonomic groups are expanding polewards. Global Change Biology 12:450-455.
Hinzman, L. D., N. D. Bettez, W. R. Bolton, F. S. Chapin, M. B. Dyurgerov, C. L. Fastie, B. Griffith, R. D. Hollister, A. Hope, H. P. Huntington, A. M. Jensen, G. J. Jia, T. Jorgenson, D. L. Kane, D. R. Klein, G. Kofinas, A. H. Lynch, A. H. Lloyd, A. D. McGuire, F. E. Nelson, W. C. Oechel, T. E. Osterkamp, C. H. Racine, V. E. Romanovsky, R. S. Stone, D. A. Stow, M. Sturm, C. E. Tweedie, G. L. Vourlitis, M. D. Walker, D. A. Walker, P. J. Webber, J. M. Welker, K. S. Winker, and K. Yoshikawa. 2005. Evidence and Implications of Recent Climate Change in Northern Alaska and Other Arctic Regions. Climatic Change 72:251-298.
Hodd, R. L., D. Bourke, and M. S. Skeffington. 2014. Projected range contractions of European protect-ed oceanic montane plant communities: focus on climate change impacts is essential for their future conservation. PloS one 9:e95147.
Huang, J., J. Huang, C. Liu, J. Zhang, X. Lu, and K. Ma. 2016. Diversity hotspots and conservation gaps for the Chinese endemic seed flora. Biologi-cal Conservation 198:104-112.
Hugall, A., C. Moritz, A. Moussalli, and J. Stanisic. 2002. Reconciling paleodistribution models and comparative phylogeography in the Wet Tropics rainforest land snail Gnarosophia bellendenkeren-sis (Brazier 1875). Proceedings of the National Academy of Sciences 99:6112-6117.
Huntley, B., and H. J. B. Birks. 1983. An atlas of past and present pollen maps for Europe, 0-13,000 years ago.
Huntley, B., Y. C. Collingham, S. G. Willis, and R. E. Green. 2008. Potential impacts of climatic change on European breeding birds. PloS one 3:e1439.
Hylander, K., J. Ehrlen, M. Luoto, and E. Meineri. 2015. Microrefugia: Not for everyone. Ambio 44 Suppl 1:60-68.
Jackson, S. T., and J. T. Overpeck. 2000. Responses of plant populations and communities to environ-mental changes of the late Quaternary. Paleobiol-ogy 26:194-220.
Jepson, P., and S. Canney. 2001. Biodiversity hotspots: hot for what? Global Ecology and Biogeography 10:225-227.
Jetz, W., and C. Rahbek. 2002. Geographic range size and determinants of avian species richness. Sci-ence 297:1548-1551.
Kadmon, R., and O. Allouche. 2007. Integrating the effects of area, isolation, and habitat heterogene-

44
DEPARTMENT OF GEOSCIENCES AND GEOGRAPHY A
ity on species diversity: a unification of island biogeography and niche theory. The American Naturalist 170:443-454.
Kattge, J., S. Diaz, S. Lavorel, I.C. Prentice, P. Lead-ley, G. Bönisch, E. Garnier, M. Westoby , P.B . Reich, I.J. Wright, J.H.C. Cornelissen, C. Violle, S.P. Harrison, P.M. Van Bodegom, M. Reichstein, B.J. Enquist, N.A. Soudzilovskaia, D.D. Ackerly, M. Anand, O. Atkin, M. Bahn, T.R. Baker, D. Bal-docchi, R. Bekker , C.C. Blanco , B. Blonder, W.J. Bond, R. Bradstock, D.E. Bunker, F. Casanoves, J. Cavender-Bares, J. Q. Chambers, F.S. Chapin, J. Chave, D. Coomes, W.K. Cornwell, J.M. Craine, B.H. Dobrin, L. Duarte, W. Durka, J. Elser, G. Esser, M. Estiarte, W.F. Fagan, J. Fang, F. Fer-nandez-Mendez, A. Fidelis, B. Finegan, O. Flores, H. Ford, D. Frank, G.T. Freschet, N.M. Fyllas, R.V. Gallagher, W.A . Green, A.G. Gutierrez, T. Hickler, S.I. Higgins, J.G. Hodgson, A. Jalili, S. Jansen, C.A. Joly, A.J. Kerkhoff, D. Kirkup, K. Kitajima, M. Kleyer, S. Klotz, J.M.H. Knops, K. Kramer, I. Kuhn, H. Kurokawa, D. Laughlin, T.D. Lee, M. Leishman, F. Lens, T. Lenz, S.L. Lewis, J. Lloyd, J. Llusia, F. Louault, S. Ma, M.D. Ma-hecha , P. Manning, T. Massad , B.E. Medlyn, J. Messier, A.T. Moles, S.C. Muller, K. Nadrowski, S. Naeem, U. Niinemets, S. Nöllert, A. Nuske, R. Ogaya, J. Oleksyn, V.G . Onipchenko, Y. Onoda, J. Ordonez, G. Overbeck, W.A. Ozinga, S. Patinoz, S. Paula, J.G. Pausas, J. Penuelas , O.L. Phillips, V. Pillar, H. Poorter, L. Poorter, P. Poschlod, A. Prinzing, R. Proulx , A. Rammig, S. Reinsch, B. Reu, L. Sack, B. Salgado-Negret, J. Sardans, S. Shiodera, B. Shipley, A. Siefert, E. Sosinski, J.-F. Soussana, E. Swaine, N. Swenson, K. Thompson, P. Thornton, M. Waldram, E. Weiher, M. White, S. White, S.J. Wright, B. Yguel, S. Zaehle, A.E. Zanne and C . Wirth. 2011. TRY – a global da-tabase of plant traits. Global Change Biology 17:2905-2935.
Kauhanen, H. O. 2013. Mountains of Kilpisjärvi host an abundance of threatened plants in Finnish Lap-land. Botanica Pacifica: A journal of plant science and conservation 2:43-52.
Keppel, G., K. Mokany, G. W. Wardell-Johnson, B. L. Phillips, J. A. Welbergen, and A. E. Reside. 2015. The capacity of refugia for conservation planning under climate change. Frontiers in Ecology and the Environment 13:106-112.
Keppel, G., K. P. Van Niel, G. W. Wardell‐Johnson, C. J. Yates, M. Byrne, L. Mucina, A. G. Schut, S. D. Hopper, and S. E. Franklin. 2012. Refugia: identifying and understanding safe havens for bio-diversity under climate change. Global Ecology and Biogeography 21:393-404.
Klanderud, K., and H. J. B. Birks. 2003. Recent in-creases in species richness and shifts in altitudinal distributions of Norwegian mountain plants. The Holocene 13:1-6.
Körner, C. 2004. Mountain biodiversity, its causes and function. Ambio:11-17.
Körner, C. 2007. The use of ‘altitude’in ecological research. Trends in ecology & evolution 22:569-574.
Körner, C. 2016. Plant adaptation to cold climates. F1000Research 5:DOI: 10.12688/f11000re-search.19107.12681.
le Roux, P. C., J. Aalto, and M. Luoto. 2013a. Soil moisture’s underestimated role in climate change impact modelling in low-energy systems. Global Change Biology 19:2965-2975.
le Roux, P. C., and M. Luoto. 2014. Earth surface processes drive the richness, composition and oc-currence of plant species in an arctic–alpine envi-ronment. Journal of Vegetation Science 25:45-54.
le Roux, P. C., R. Virtanen, R. K. Heikkinen, and M. Luoto. 2012. Biotic interactions affect the eleva-tional ranges of high-latitude plant species. Ecog-raphy 35:1048-1056.
le Roux, P. C., R. Virtanen, and M. Luoto. 2013b. Geomorphological disturbance is necessary for predicting fine‐scale species distributions. Ecog-raphy 36:800-808.
Lenoir, J., J.-C. Gégout, P. Marquet, P. De Ruffray, and H. Brisse. 2008. A significant upward shift in plant species optimum elevation during the 20th century. Science 320:1768-1771.
Lenoir, J., B. J. Graae, P. A. Aarrestad, I. G. Alsos, W. S. Armbruster, G. Austrheim, C. Bergendorff, H. J. Birks, K. A. Brathen, J. Brunet, H. H. Bru-un, C. J. Dahlberg, G. Decocq, M. Diekmann, M. Dynesius, R. Ejrnaes, J. A. Grytnes, K. Hy-lander, K. Klanderud, M. Luoto, A. Milbau, M. Moora, B. Nygaard, A. Odland, V. T. Ravolainen, S. Reinhardt, S. M. Sandvik, F. H. Schei, J. D. Speed, L. U. Tveraabak, V. Vandvik, L. G. Velle, R. Virtanen, M. Zobel, and J. C. Svenning. 2013. Local temperatures inferred from plant commu-nities suggest strong spatial buffering of climate warming across Northern Europe. Global Change Biology 19:1470-1481.
Lenoir, J., T. Hattab, and G. Pierre. 2016. Climat-ic microrefugia under anthropogenic climate change: implications for species redistribution. Ecography:DOI: 10.1111/ecog.02788.
Lenoir, J., and J. C. Svenning. 2015. Climate-related range shifts - a global multidimensional synthesis and new research directions. Ecography 38:15-28.
Lesica, P., B. McCune, and E. Ezcurra. 2004. Decline of arctic-alpine plants at the southern margin of their range following a decade of climatic warm-ing. Journal of Vegetation Science 15:679-690.
Lindborg, R., and O. Eriksson. 2004. Historical land-scape connectivity affects present plant species diversity. Ecology 85:1840-1845.
Loarie, S. R., B. E. Carter, K. Hayhoe, S. McMahon, R. Moe, C. A. Knight, and D. D. Ackerly. 2008. Climate change and the future of California’s en-
61

45
demic flora. PloS one 3:e2502.Lobo, J. M., I. Castro, and J. C. Moreno. 2001. Spa-
tial and environmental determinants of vascular plant species richness distribution in the Iberian Peninsula and Balearic Islands. Biological Journal of the Linnean Society 73:233-253.
Loidi, J., J. A. Campos, M. Herrera, I. Biurrun, I. García-Mijangos, and G. García-Baquero. 2015. Eco-geographical factors affecting richness and phylogenetic diversity patterns of high-mountain flora in the Iberian Peninsula. Alpine Botany 125:137-146.
Luoto, M., and R. K. Heikkinen. 2008. Disregarding topographical heterogeneity biases species turn-over assessments based on bioclimatic models. Global Change Biology 14:483-494.
Magurran, A. E. 2013. Ecological diversity and its measurement. Springer Science & Business Me-dia.
Maloufi, S., A. Catherine, D. Mouillot, C. Louvard, A. Couté, C. Bernard, and M. Troussellier. 2016. En-vironmental heterogeneity among lakes promotes hyper β‐diversity across phytoplankton communi-ties. Freshwater Biology 61:633-645.
Marchand, F., M. Verlinden, F. Kockelbergh, B. Graae, L. Beyens, and I. Nijs. 2006. Disentangling effects of an experimentally imposed extreme tempera-ture event and naturally associated desiccation on Arctic tundra. Functional Ecology 20:917-928.
Mawdsley, J. R., R. O’Malley, and D. S. Ojima. 2009. A review of climate-change adaptation strategies for wildlife management and biodiversity con-servation. Conservation Biology 23:1080-1089.
May, R. M. 1988. How many species are there on earth? Science(Washington) 241:1441-1449.
McCullagh, P., and J. A. Nelder. 1989. Generalized linear models. CRC press.
McCune, B., and D. Keon. 2002. Equations for po-tential annual direct incident radiation and heat load. Journal of Vegetation Science 13:603-606.
Médail, F., and K. Diadema. 2009. Glacial refugia influence plant diversity patterns in the Mediter-ranean Basin. Journal of biogeography 36:1333-1345.
Meehl, G. A., and C. Tebaldi. 2004. More intense, more frequent, and longer lasting heat waves in the 21st century. Science 305:994-997.
Meineri, E., and K. Hylander. 2016. Fine‐grain, large‐domain climate models based on climate station and comprehensive topographic information im-prove microrefugia detection. Ecography.
Meinshausen, M., N. Meinshausen, W. Hare, S. C. Raper, K. Frieler, R. Knutti, D. J. Frame, and M. R. Allen. 2009. Greenhouse-gas emission tar-gets for limiting global warming to 2 C. Nature 458:1158-1162.
Mod, H. K., P. C. le Roux, A. Guisan, and M. Luoto. 2015. Biotic interactions boost spatial models of species richness. Ecography 38:913-921.
Mod, H. K., D. Scherrer, M. Luoto, and A. Guisan. 2016. What we use is not what we know: envi-ronmental predictors in plant distribution models. Journal of Vegetation Science 27:1308-1322.
Moeslund, J. E., L. Arge, P. K. Bøcher, T. Dalgaard, and J.-C. Svenning. 2013. Topography as a driver of local terrestrial vascular plant diversity patterns. Nordic Journal of Botany 31:129-144.
Moore, I. D., R. Grayson, and A. Ladson. 1991. Digi-tal terrain modelling: a review of hydrological, geomorphological, and biological applications. Hydrological processes 5:3-30.
Morán‐Ordóñez, A., J. J. Lahoz‐Monfort, J. Elith, and B. A. Wintle. 2017. Evaluating 318 continental‐scale species distribution models over a 60‐year prediction horizon: what factors influence the reli-ability of predictions? Global Ecology and Bio-geography 26:371-384.
Moritz, C., and R. Agudo. 2013. The future of spe-cies under climate change: resilience or decline? Science 341:504-508.
Mosblech, N. A. S., M. B. Bush, and R. van Woesik. 2011. On metapopulations and microrefugia: pa-laeoecological insights. Journal of biogeography 38:419-429.
Moss, R. H., J. A. Edmonds, K. A. Hibbard, M. R. Manning, S. K. Rose, D. P. Van Vuuren, T. R. Cart-er, S. Emori, M. Kainuma, and T. Kram. 2010. The next generation of scenarios for climate change research and assessment. Nature 463:747-756.
Myers, N., R. A. Mittermeier, C. G. Mittermeier, G. A. Da Fonseca, and J. Kent. 2000. Biodiver-sity hotspots for conservation priorities. Nature 403:853-858.
NASA Land Processes Distributed Active Archive Center. 2013. ASTER DEM.
Nekola, J. C. 1999. Paleorefugia and neorefugia: the influence of colonization history on community pattern and process. Ecology 80:2459-2473.
Nogués-Bravo, D., M. B. Araújo, M. Errea, and J. Mar-tinez-Rica. 2007. Exposure of global mountain systems to climate warming during the 21st Cen-tury. Global Environmental Change 17:420-428.
Noss, R. F. 1990. Indicators for monitoring biodiver-sity: a hierarchical approach. Conservation Biol-ogy 4:355-364.
Noss, R. F. 2001. Beyond Kyoto: forest management in a time of rapid climate change. Conservation Biology 15:578-590.
Oksanen, L., and R. Virtanen. 1995. Topographic, al-titudinal and regional patterns in continental and suboceanic heath vegetation of northern Fen-noscandia. Acta Botanica Fennica 153:1-80.
Oliver, T. H., R. J. Smithers, S. Bailey, C. A. Walms-ley, and K. Watts. 2012. A decision framework for considering climate change adaptation in biodi-versity conservation planning. Journal of Applied Ecology 49:1247-1255.
Olson, D., D. A. DellaSala, R. F. Noss, J. R. Strit-

46
DEPARTMENT OF GEOSCIENCES AND GEOGRAPHY A
tholt, J. Kass, M. E. Koopman, and T. F. Allnutt. 2012. Climate Change Refugia for Biodiversity in the Klamath-Siskiyou Ecoregion. Natural Ar-eas Journal 32:65-74.
Orme, C. D., R. G. Davies, M. Burgess, F. Eigen-brod, N. Pickup, V. A. Olson, A. J. Webster, T. S. Ding, P. C. Rasmussen, R. S. Ridgely, A. J. Stattersfield, P. M. Bennett, T. M. Blackburn, K. J. Gaston, and I. P. Owens. 2005. Global hotspots of species richness are not congruent with ende-mism or threat. Nature 436:1016-1019.
Pachauri, R. K., M. R. Allen, V. R. Barros, J. Broome, W. Cramer, R. Christ, J. A. Church, L. Clarke, Q. Dahe, and P. Dasgupta. 2014. Climate change 2014: synthesis report. Contribution of Working Groups I, II and III to the fifth assessment re-port of the Intergovernmental Panel on Climate Change. IPCC.
Pacifici, M., W. B. Foden, P. Visconti, J. E. Watson, S. H. Butchart, K. M. Kovacs, B. R. Scheffers, D. G. Hole, T. G. Martin, and H. R. Akçakaya. 2015. Assessing species vulnerability to climate change. Nature climate change 5:215-224.
Parducci, L., T. Jorgensen, M. M. Tollefsrud, E. El-verland, T. Alm, S. L. Fontana, K. D. Bennett, J. Haile, I. Matetovici, Y. Suyama, M. E. Edwards, K. Andersen, M. Rasmussen, S. Boessenkool, E. Coissac, C. Brochmann, P. Taberlet, M. Hou-mark-Nielsen, N. K. Larsen, L. Orlando, M. T. Gilbert, K. H. Kjaer, I. G. Alsos, and E. Will-erslev. 2012. Glacial survival of boreal trees in northern Scandinavia. Science 335:1083-1086.
Parmesan, C., C. Duarte, E. Poloczanska, A. J. Rich-ardson, and M. C. Singer. 2011. Overstretching attribution. Nature climate change 1:2.
Parmesan, C., and G. Yohe. 2003. A globally coher-ent fingerprint of climate change impacts across natural systems. Nature 421:37-42.
Parviainen, M., M. Luoto, T. Ryttäri, and R. K. Heik-kinen. 2008. Modelling the occurrence of threat-ened plant species in taiga landscapes: method-ological and ecological perspectives. Journal of biogeography 35:1888-1905.
Patsiou, T. S., E. Conti, N. E. Zimmermann, S. The-odoridis, and C. F. Randin. 2014. Topo-climatic microrefugia explain the persistence of a rare endemic plant in the Alps during the last 21 mil-lennia. Global Change Biology 20:2286-2300.
Pauli, H., M. Gottfried, and G. Grabherr. 2014. Ef-fects of climate change on the alpine and ni-val vegetation of the Alps. Journal of mountain ecology 7.
Pearson, R. G. 2006. Climate change and the migra-tion capacity of species. Trends in ecology & evolution 21:111-113.
Pearson, R. G., and T. P. Dawson. 2003. Predicting the impacts of climate change on the distribu-tion of species: are bioclimate envelope mod-els useful? Global Ecology and Biogeography
12:361-371.Pellissier, L., P. B. Eidesen, D. Ehrich, P. Descombes,
P. Schönswetter, A. Tribsch, K. B. Westergaard, N. Alvarez, A. Guisan, and N. E. Zimmermann. 2016. Past climate‐driven range shifts and popula-tion genetic diversity in arctic plants. Journal of biogeography 43:461-470.
Penna, D., M. Borga, D. Norbiato, and G. Dalla Fon-tana. 2009. Hillslope scale soil moisture variability in a steep alpine terrain. Journal of Hydrology 364:311-327.
Pereira, H. M., P. W. Leadley, V. Proença, R. Alke-made, J. P. Scharlemann, J. F. Fernandez-Manjar-rés, M. B. Araújo, P. Balvanera, R. Biggs, and W. W. Cheung. 2010. Scenarios for global biodiver-sity in the 21st century. Science 330:1496-1501.
Petit, R., I. Aguinagalde, J. L. de Beaulieu, C. Bitt-kau, S. Brewer, R. Cheddadi, R. Ennos, S. Fin-eschi, D. Grivet, M. Lascoux, A. Mohanty, G. Muller-Starck, B. Demesure-Musch, A. Palme, J. P. Martin, S. Rendell, and G. G. Vendramin. 2003. Glacial refugia: hotspots but not melting pots of genetic diversity. Science 300:1563-1565.
Phillips, S. J., M. Dudík, and R. E. Schapire. 2004. A maximum entropy approach to species distri-bution modeling. Page 83 in Proceedings of the twenty-first international conference on Machine learning. ACM.
Pickett, S. T., and M. L. Cadenasso. 1995. Landscape ecology: spatial heterogeneity in ecological sys-tems. Science 269:331.
Pigott, C., and S. M. Walters. 1954. On the interpre-tation of the discontinuous distributions shown by certain British species of open habitats. The Journal of Ecology 42:95-116.
Possingham, H. P., and K. A. Wilson. 2005. Biodi-versity: Turning up the heat on hotspots. Nature 436:919-920.
Post, E., M. C. Forchhammer, M. S. Bret-Harte, T. V. Callaghan, T. R. Christensen, B. Elberling, A. D. Fox, O. Gilg, D. S. Hik, and T. T. Høye. 2009. Eco-logical dynamics across the Arctic associated with recent climate change. Science 325:1355-1358.
Prendergast, J., R. Quinn, J. Lawton, B. Eversham, and D. Gibbons. 1993. Rare species, the coincidence of diversity hotspots and conservation strategies. Nature 365:335-337.
Press, M., J. Potter, M. Burke, T. Callaghan, and J. Lee. 1998. Responses of a subarctic dwarf shrub heath community to simulated environmental change. Journal of Ecology:315-327.
Provan, J., and K. D. Bennett. 2008. Phylogeograph-ic insights into cryptic glacial refugia. Trends in Ecology and Evolution 23:564-571.
Przybylak, R. 2002. Changes in seasonal and annual high‐frequency air temperature variability in the Arctic from 1951 to 1990. International Journal of Climatology 22:1017-1032.
Purvis, A., and A. Hector. 2000. Getting the measure
61

47
of biodiversity. Nature 405:212.Raftery, A. E., A. Zimmer, D. M. W. Frierson, R.
Startz, and P. Liu. 2017. Less than 2 C warming by 2100 unlikely. Nature climate change 7:637-643.
Randin, C. F., R. Engler, S. Normand, M. Zappa, N. E. Zimmermann, P. B. Pearman, P. Vittoz, W. Thuiller, and A. Guisan. 2009. Climate change and plant distribution: local models predict high-elevation persistence. Global Change Biology 15:1557-1569.
Reid, W. V. 1998. Biodiversity hotspots. Trends in ecology & evolution 13:275-280.
Reside, A. E., J. VanDerWal, B. L. Phillips, L. P. Shoo, D. F. Rosauer, B. J. Anderson, J. A. Welbergen, C. Moritz, S. Ferrier, and T. D. Harwood. 2013. Climate change refugia for terrestrial biodiversity.
Reside, A. E., J. A. Welbergen, B. L. Phillips, G. W. Wardell-Johnson, G. Keppel, S. Ferrier, S. E. Wil-liams, and J. VanDerWal. 2014. Characteristics of climate change refugia for Australian biodi-versity. Austral Ecology 39:887-897.
Riahi, K., S. Rao, V. Krey, C. Cho, V. Chirkov, G. Fischer, G. Kindermann, N. Nakicenovic, and P. Rafaj. 2011. RCP 8.5—A scenario of compara-tively high greenhouse gas emissions. Climatic Change 109:33-57.
Rull, V. 2009. Microrefugia. Journal of biogeography 36:481-484.
Sala, O. E., F. S. Chapin, J. J. Armesto, E. Berlow, J. Bloomfield, R. Dirzo, E. Huber-Sanwald, L. F. Huenneke, R. B. Jackson, and A. Kinzig. 2000. Global biodiversity scenarios for the year 2100. Science 287:1770-1774.
Scherrer, D., and C. Körner. 2011. Topographically controlled thermal‐habitat differentiation buffers alpine plant diversity against climate warming. Journal of biogeography 38:406-416.
Scott, J. M., F. Davis, B. Csuti, R. Noss, B. Butterfield, C. Groves, H. Anderson, S. Caicco, F. D’Erchia, and T. C. Edwards Jr. 1993. Gap analysis: a geo-graphic approach to protection of biological di-versity. Wildlife monographs:3-41.
Shoo, L. P., A. A. Hoffmann, S. Garnett, R. L. Pressey, Y. M. Williams, M. Taylor, L. Falconi, C. J. Yates, J. K. Scott, and D. Alagador. 2013. Making deci-sions to conserve species under climate change. Climatic Change 119:239-246.
Shoo, L. P., C. Storlie, Y. M. Williams, and S. E. Williams. 2010. Potential for mountaintop boul-der fields to buffer species against extreme heat stress under climate change. International journal of biometeorology 54:475-478.
Skov, F., and J. C. Svenning. 2004. Potential impact of climatic change on the distribution of forest herbs in Europe. Ecography 27:366-380.
Slaton, M. R., and P. Linder. 2015. The roles of distur-bance, topography and climate in determining the leading and rear edges of population range limits. Journal of biogeography 42:255-266.
Smith, T. B., S. Kark, C. J. Schneider, R. K. Wayne, and C. Moritz. 2001. Biodiversity hotspots and beyond: the need for preserving environmental transitions. Trends in ecology & evolution 16:431.
Snell, R. S., A. Huth, J. E. M. S. Nabel, G. Bocedi, J. M. J. Travis, D. Gravel, H. Bugmann, A. G. Gutiérrez, T. Hickler, S. I. Higgins, B. Reineking, M. Scherstjanoi, N. Zurbriggen, and H. Lischke. 2014. Using dynamic vegetation models to simu-late plant range shifts. Ecography 37:1184–1197.
Sormunen, H., R. Virtanen, and M. Luoto. 2011. In-clusion of local environmental conditions alters high-latitude vegetation change predictions based on bioclimatic models. Polar Biology 34:883-897.
Stein, B. A., L. S. Kutner, and J. S. Adams. 2000. Precious heritage: the status of biodiversity in the United States. Oxford University Press on Demand.
Stewart, J. R., and A. M. Lister. 2001. Cryptic northern refugia and the origins of the modern biota. Trends in ecology & evolution 16:608-613.
Stewart, J. R., A. M. Lister, I. Barnes, and L. Dalen. 2010a. Refugia revisited: individualistic respons-es of species in space and time. Proc Biol Sci 277:661-671.
Stewart, J. R., A. M. Lister, I. Barnes, and L. Dalén. 2010b. Refugia revisited: individualistic respons-es of species in space and time. Proceedings of the Royal Society of London B: Biological Sci-ences 277:661-671.
Sturm, M., C. Racine, and K. Tape. 2001. Climate change: increasing shrub abundance in the Arctic. Nature 411:546.
Sunday, J. M., G. T. Pecl, S. Frusher, A. J. Hobday, N. Hill, N. J. Holbrook, G. J. Edgar, R. Stuart‐Smith, N. Barrett, and T. Wernberg. 2015. Spe-cies traits and climate velocity explain geographic range shifts in an ocean‐warming hotspot. Ecol Lett 18:944-953.
Svendsen, J. I., H. Alexanderson, V.I. Astakhov, I. Demidov, J.A. Dowdeswell, S. Funder, V.Gataullin, M. Henriksen, C. Hjort, M. Hou-mark-Nielsen, and H. W. Hubberten. 2004. Late Quaternary ice sheet history of northern Eurasia. Quaternary Science Reviews 23:1229–1271.
Svenning, J. C., S. Normand, and M. Kageyama. 2008. Glacial refugia of temperate trees in Europe: in-sights from species distribution modelling. Journal of Ecology 96:1117-1127.
Taberlet, P. 1998. Biodiversity at the intraspecific level: the comparative phylogeographic approach. Jour-nal of Biotechnology 64:91-100.
Taberlet, P., and R. Cheddadi. 2002. Quaternary re-fugia and persistence of biodiversity. Science 297:2009-2010.
Taylor, K. E., R. J. Stouffer, and G. A. Meehl. 2012. An overview of CMIP5 and the experiment design. Bulletin of the American Meteorological Society 93:485-498.
48
DEPARTMENT OF GEOSCIENCES AND GEOGRAPHY A
Temunović, M., N. Frascaria‐Lacoste, J. Franjić, Z. Satovic, and J. F. Fernández‐Manjarrés. 2013. Identifying refugia from climate change using coupled ecological and genetic data in a transi-tional Mediterranean‐temperate tree species. Mo-lecular ecology 22:2128-2142.
Thomas, C. D., A. Cameron, R. E. Green, M. Bak-kenes, L. J. Beaumont, Y. C. Collingham, B. F. Erasmus, M. F. De Siqueira, A. Grainger, and L. Hannah. 2004. Extinction risk from climate change. Nature 427:145-148.
Thuiller, W. 2004. Patterns and uncertainties of spe-cies’ range shifts under climate change. Global Change Biology 10:2020-2027.
Thuiller, W., C. Albert, M. B. Araújo, P. M. Berry, M. Cabeza, A. Guisan, T. Hickler, G. F. Midgley, J. Paterson, F. M. Schurr, M. T. Sykes, and N. E. Zimmermann. 2008. Predicting global change im-pacts on plant species’ distributions: Future chal-lenges. Perspectives in Plant Ecology, Evolution and Systematics 9:137-152.
Thuiller, W., D. Georges, and R. Engler. 2013. bio-mod2: Ensemble platform for species distribution modeling. R package version 2:r560.
Thuiller, W., S. Lavorel, M. B. Araújo, M. T. Sykes, and I. C. Prentice. 2005. Climate change threats to plant diversity in Europe. Proceedings of the Na-tional Academy of Sciences of the United States of America 102:8245-8250.
Tikkanen, M. 2005. Climate. Pages 97-112 in M. Seppälä, editor. The Physical Geography of Fen-noscandia. Oxford University Press, United States.
Tulloch, A. I., P. Sutcliffe, I. Naujokaitis-Lewis, R. Tingley, L. Brotons, K. M. P. Ferraz, H. Possing-ham, A. Guisan, and J. R. Rhodes. 2016. Conser-vation planners tend to ignore improved accuracy of modelled species distributions to focus on mul-tiple threats and ecological processes. Biological Conservation 199:157-171.
Tzedakis, P. C., B. C. Emerson, and G. M. Hewitt. 2013. Cryptic or mystic? Glacial tree refugia in northern Europe. Trends Ecol Evol 28:696-704.
UNEP-WCMC. 2016. The World Database on Pro-tected Areas (WDPA) Cambridge, UK: UNEP-WCMC.
Urban, M. C. 2015. Accelerating extinction risk from climate change. Science 348:571-573.
Van Vuuren, D. P., J. Edmonds, M. Kainuma, K. Riahi, A. Thomson, K. Hibbard, G. C. Hurtt, T. Kram, V. Krey, and J.-F. Lamarque. 2011. The repre-sentative concentration pathways: an overview. Climatic Change 109:5-31.
VanDerWal, J., L. Falconi, S. Januchowski, L. Shoo, C. Storlie, and M. J. VanDerWal. 2014. Package ‘SDMTools’. Citeseer.
VanDerWal, J., H. T. Murphy, A. S. Kutt, G. C. Perkins, B. L. Bateman, J. J. Perry, and A. E. Reside. 2013. Focus on poleward shifts in species’ distribution underestimates the fingerprint of climate change.
Nature climate change 3:239.VanDerWal, J., L. P. Shoo, and S. E. Williams. 2009.
New approaches to understanding late Quater-nary climate fluctuations and refugial dynamics in Australian wet tropical rain forests. Journal of biogeography 36:291-301.
Väre, H., R. Lampinen, C. Humphries, and P. Wil-liams. 2003. Taxonomic diversity of vascular plants in the European alpine areas. Ecological studies:133-148.
Vegas-Vilarrúbia, T., S. Nogué, and V. Rull. 2012. Global warming, habitat shifts and potential refu-gia for biodiversity conservation in the neotropi-cal Guayana Highlands. Biological Conservation 152:159-168.
Virkkala, R., R. K. Heikkinen, S. Fronzek, and N. Leikola. 2013. Climate change, northern birds of conservation concern and matching the hotspots of habitat suitability with the reserve network. PloS one 8:1-12.
Vorren, T. O., K.-D. Vorren, O. Aasheim, K. I. T. Dahl-gren, M. Forwick, and K. Hassel. 2013. Palaeoen-vironment in northern Norway between 22.2 and 14.5 cal. ka BP. Boreas:n/a-n/a.
Wasof, S., J. Lenoir, P.A. Aarrestad, I.G Alsos, W.S. Armbruster, G. Austrheim, V. Bakkestuen, H.J. Birks, K.A. Bråthen, O. Broennimann, J. Brunet, H.B. Bruun, C.J. Dahlberg, M. Diekmann, S. Dull-inger, M. Dynesius, R. Ejrnæs, J-C. Gégout, B. J. Graae, J-A. Grytnes, A. Guisan, K. Hylander, I.S. Jónsdóttir, J. Kapfer, K. Klanderud, M. Luoto, A. Milbau, M. Moora, B. Nygaard, A. Odland, H. Pauli, V. Ravolainen, S. Reinhardt, S.M. Sand-vik, F.H. Schei, J.D.M. Speed, J-C. Svenning,W. Thuiller, L.U. Tveraabak, V. Vandvik, L.G. Velle, R. Virtanen, P. Vittoz, W. Willner, T. Wohlgemuth, N.E. Zimmermann, M. Zobel and G. Decocq. 2015. Disjunct populations of European vascu-lar plant species keep the same climatic niches. Global Ecology and Biogeography 24:1401-1412.
Wielgolaski, F. E., and D. W. Inouye. 2003. High Lati-tude Climates. Pages 175-194 in M. D. Schwartz, editor. Phenology: An Integrative Environmental Science. Springer Netherlands, Dordrecht.
Wiens, J. A., D. Stralberg, D. Jongsomjit, C. A. How-ell, and M. A. Snyder. 2009. Niches, models, and climate change: assessing the assumptions and uncertainties. Proceedings of the National Acad-emy of Sciences 106:19729-19736.
Williams, P., D. Gibbons, C. Margules, A. Rebelo, C. Humphries, and R. Pressey. 1996. A comparison of richness hotspots, rarity hotspots, and comple-mentary areas for conserving diversity of British birds. Conservation Biology 10:155-174.
Williams, P., L. E. E. Hannah, S. Andelman, G. U. Y. Midgley, M. AraÚJo, G. Hughes, L. Manne, E. Martinez-Meyer, and R. Pearson. 2005. Plan-ning for Climate Change: Identifying Minimum-Dispersal Corridors for the Cape Proteaceae. Con-
61
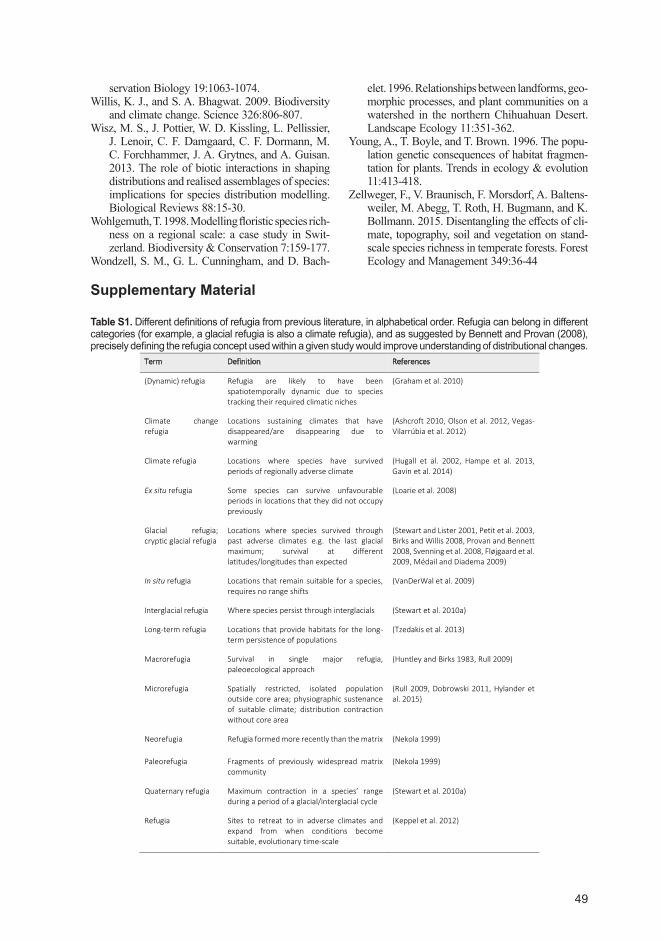
49
servation Biology 19:1063-1074.Willis, K. J., and S. A. Bhagwat. 2009. Biodiversity
and climate change. Science 326:806-807.Wisz, M. S., J. Pottier, W. D. Kissling, L. Pellissier,
J. Lenoir, C. F. Damgaard, C. F. Dormann, M. C. Forchhammer, J. A. Grytnes, and A. Guisan. 2013. The role of biotic interactions in shaping distributions and realised assemblages of species: implications for species distribution modelling. Biological Reviews 88:15-30.
Wohlgemuth, T. 1998. Modelling floristic species rich-ness on a regional scale: a case study in Swit-zerland. Biodiversity & Conservation 7:159-177.
Wondzell, S. M., G. L. Cunningham, and D. Bach-
elet. 1996. Relationships between landforms, geo-morphic processes, and plant communities on a watershed in the northern Chihuahuan Desert. Landscape Ecology 11:351-362.
Young, A., T. Boyle, and T. Brown. 1996. The popu-lation genetic consequences of habitat fragmen-tation for plants. Trends in ecology & evolution 11:413-418.
Zellweger, F., V. Braunisch, F. Morsdorf, A. Baltens-weiler, M. Abegg, T. Roth, H. Bugmann, and K. Bollmann. 2015. Disentangling the effects of cli-mate, topography, soil and vegetation on stand-scale species richness in temperate forests. Forest Ecology and Management 349:36-44
Supplementary Material
Table S1. Different definitions of refugia from previous literature, in alphabetical order. Refugia can belong in different categories (for example, a glacial refugia is also a climate refugia), and as suggested by Bennett and Provan (2008), precisely defining the refugia concept used within a given study would improve understanding of distributional changes.
Term Definition References
(Dynamic) refugia Refugia are likely to have been spatiotemporally dynamic due to species tracking their required climatic niches
(Graham et al. 2010)
Climate change refugia
Locations sustaining climates that have disappeared/are disappearing due to warming
(Ashcroft 2010, Olson et al. 2012, Vegas-Vilarrúbia et al. 2012)
Climate refugia Locations where species have survived periods of regionally adverse climate
(Hugall et al. 2002, Hampe et al. 2013, Gavin et al. 2014)
Ex situ refugia Some species can survive unfavourable periods in locations that they did not occupy previously
(Loarie et al. 2008)
Glacial refugia; cryptic glacial refugia
Locations where species survived through past adverse climates e.g. the last glacial maximum; survival at different latitudes/longitudes than expected
(Stewart and Lister 2001, Petit et al. 2003, Birks and Willis 2008, Provan and Bennett 2008, Svenning et al. 2008, Fløjgaard et al. 2009, Médail and Diadema 2009)
In situ refugia Locations that remain suitable for a species, requires no range shifts
(VanDerWal et al. 2009)
Interglacial refugia Where species persist through interglacials (Stewart et al. 2010a)
Long-term refugia Locations that provide habitats for the long-term persistence of populations
(Tzedakis et al. 2013)
Macrorefugia Survival in single major refugia, paleoecological approach
(Huntley and Birks 1983, Rull 2009)
Microrefugia Spatially restricted, isolated population outside core area; physiographic sustenance of suitable climate; distribution contraction without core area
(Rull 2009, Dobrowski 2011, Hylander et al. 2015)
Neorefugia Refugia formed more recently than the matrix (Nekola 1999)
Paleorefugia Fragments of previously widespread matrix community
(Nekola 1999)
Quaternary refugia Maximum contraction in a species’ range during a period of a glacial/interglacial cycle
(Stewart et al. 2010a)
Refugia Sites to retreat to in adverse climates and expand from when conditions become suitable, evolutionary time-scale
(Keppel et al. 2012)

50
DEPARTMENT OF GEOSCIENCES AND GEOGRAPHY A 61


