The Size and Characteristics of Informal (“Gig”) Work in ... … · from informal activities...
21
Bank of Canada staff analytical notes are short articles that focus on topical issues relevant to the current economic and financial context, produced independently from the Bank’s Governing Council. This work may support or challenge prevailing policy orthodoxy. Therefore, the views expressed in this note are solely those of the authors and may differ from official Bank of Canada views. No responsibility for them should be attributed to the Bank. www.bank-banque-canada.ca Staff Analytical Note/Note analytique du personnel 2019-6 The Size and Characteristics of Informal (“Gig”) Work in Canada by Olena Kostyshyna and Corinne Luu Canadian Economic Analysis Department Bank of Canada Ottawa, Ontario, Canada K1A 0G9 [email protected] [email protected]
Transcript of The Size and Characteristics of Informal (“Gig”) Work in ... … · from informal activities...

Bank of Canada staff analytical notes are short articles that focus on topical issues relevant to the current economic and financial context, produced independently from the Bank’s Governing Council. This work may support or challenge prevailing policy orthodoxy. Therefore, the views expressed in this note are solely those of the authors and may differ from official Bank of Canada views. No responsibility for them should be attributed to the Bank.
www.bank-banque-canada.ca
Staff Analytical Note/Note analytique du personnel 2019-6
The Size and Characteristics of Informal (“Gig”) Work in Canada
by Olena Kostyshyna and Corinne Luu
Canadian Economic Analysis Department Bank of Canada Ottawa, Ontario, Canada K1A 0G9 [email protected] [email protected]

ISSN 2369-9639 © 2019 Bank of Canada
Acknowledgements
We would like to thank Patrick Sabourin, Russell Barnett, Bob Fay, Eric Santor and Lena Suchanek for their helpful input and suggestions. We would also like to thank Meredith Fraser-Ohman and Alison Arnot for their editorial assistance.

ii
Abstract
Underlying wage growth has fallen short of what would be consistent with an economy operating with little or no slack. While many factors could explain this weakness, the availability of additional labour resources from informal (“gig”) work—not fully captured in standard measures of employment and hours worked—may play a role. We investigate this possibility through the Bank of Canada’s Canadian Survey of Consumer Expectations (CSCE) by documenting the characteristics and size of such working arrangements. We find that just under one-third of Canadians participate in this type of work, and this participation is often consistent with labour market slack. Just over one-third of respondents who take part in informal work do so as a result of weak economic conditions, and over half would switch their hours worked for hours in formal employment with no increase in pay. Part-time workers, youth and people in provinces with historically high unemployment rates were most likely to participate in informal employment. A portion of these workers would not be considered part of the labour force by standard labour market measures due in part to the irregularity of their work schedules. Accounting for these workers could boost participation rates by 2–3 percentage points. Moreover, the magnitude of labour supply from such work that could become available to the formal sector is sizable. It amounts to roughly 700,000 full-time equivalent jobs or 3.5 per cent of the labour force on average over the third and fourth quarters of 2018. This additional margin of labour market supply may be contributing to reducing wage pressures.
Bank topics: Labour markets; Recent economic and financial developments JEL codes: E, E2, E24, E26, J2, J20, J3, J30, J46
Résumé
Le taux de croissance des salaires reste paradoxalement peu élevé pour une économie affichant une marge de capacités excédentaires faible, voire nulle. Parmi les nombreuses explications possibles, un facteur ressort : la disponibilité d’une main-d’œuvre additionnelle qui vit d’emplois atypiques (de « petits boulots ») et que les mesures normales de l’emploi et des heures travaillées ne prennent pas entièrement en compte. Nous étudions cette possibilité en introduisant certaines questions dans l’enquête sur les attentes des consommateurs au Canada pour documenter les caractéristiques et l’ampleur de telles formes de travail. Nous constatons que près du tiers des Canadiens participent à l’économie informelle et que cette activité atypique concorde souvent avec une marge de ressources inutilisées sur le marché du travail. Un peu plus du tiers des répondants qui occupent des emplois atypiques le font en raison de la conjoncture économique défavorable, et, à heures
iii
de travail égales, plus de la moitié de ces personnes préféreraient un emploi plus structuré, même sans augmentation de salaire. Parmi les personnes occupant des emplois atypiques, on note une surreprésentation des travailleurs à temps partiel, des jeunes et des habitants des provinces où le taux de chômage est historiquement élevé. Or, selon les mesures usuelles du marché du travail, certaines de ces personnes ne rentrent pas dans la population active, en raison notamment de l’irrégularité de leurs périodes de travail. La prise en compte de ces travailleurs pourrait accroître les taux d’activité de 2 à 3 points de pourcentage. De plus, le bassin potentiel de main-d’œuvre qu’ils représentent – soit quelque 700 000 postes à temps plein ou 3,5 % de la population active, en moyenne, aux troisième et quatrième trimestres de 2018 – n’est pas négligeable. Cette marge de ressources disponibles exerce peut-être des pressions à la baisse sur les salaires.
Sujets : Marchés du travail; Évolution économique et financière récente Codes JEL : E, E2, E24, E26, J2, J20, J3, J30, J46
1
1. Motivation and summary Underlying wage growth has fallen short of what would be consistent with an economy operating with little or no slack (i.e., sum of trend labour productivity and inflation target). While structural causes may be playing a role, non-standard or informal work arrangements (also called “gig” employment) may be on the rise in Canada, as studies have found for the United States.1, 2 Such employment may not be fully reflected in standard labour market statistics. The availability of these additional labour resources has likely been facilitated through the diffusion of digital technology, reducing matching costs, and this additional supply may be suppressing measured wage growth. To the extent that these resources reflect labour market slack, additional labour supply may be made available to the formal sector if labour market conditions continue to improve, producing less upward pressure on wages than would be expected based on measures such as the unemployment rate. We assess this possibility through a special survey of households, similar to that conducted by the Federal Reserve Bank of New York (Bracha and Burke 2016) for the US economy. This note is a first step in documenting the size of such activities in Canada and the characteristics of those engaging in informal paid activities.
Key takeaways are as follows:
• Some 30 per cent of respondents reported currently participating in some form of informal work (2018Q2–2018Q4). This includes those who work only a few hours a week, while for others it reflected their main job. The highest rate of participation in informal work was among youth (58 per cent of youth respondents).
• A large share of informal work likely reflects labour market slack. Part-time workers (including those who are looking for full-time work) are the most likely to engage in informal paid activities, and just over one-third (37 per cent) of respondents participated in such work as a result of weak economic conditions. Moreover, slightly over half of respondents would substitute informal hours for hours worked in the formal sector, for no increase in pay.
• Participation in informal activities is higher in provinces where unemployment rates are above pre-crisis averages and wage growth is weaker.
• Earnings motives were the primary reason for engaging in such work. Income earned from informal activities tends to be lower than income earned in a formal job for an equivalent amount of time. Moreover, participation in informal jobs also likely reflects precautionary motives: those who did participate in informal work had a higher
1 For example, see Katz and Krueger (2019). 2 We use “informal” (paid) work to describe such working relationships throughout this note.

2
perceived probability of job loss over the coming year and more irregular work schedules.
• Some of those who participated in informal work would not be considered part of the labour force, based on the Bank of Canada’s Canadian Survey of Consumer Expectations (CSCE). Adding them would increase labour force participation rates by between 2–3 percentage points, with the largest impact from youth and seniors. This may reflect, in part, more irregular work schedules, with informal workers participating an average of 1.7 months out of the past 3 months in such activities.
• The magnitude of labour supply from informal (gig) work that could become available to the formal sector is sizable. It amounts to roughly 700,000 full-time equivalent (FTE) jobs or 3.5 per cent of the labour force on average over 2018Q3–2018Q4. This additional margin of labour market supply may be putting downward pressure on wages.
2. Measuring informal paid activities As little information is available on the size and characteristics of informal (gig) employment in Canada, we introduced special questions related to such work into the Bank’s CSCE for the second, third and fourth quarters of 2018, similar to Bracha and Burke (2016). The CSCE is a nationally representative, online quarterly survey of Canadian households (for more details on the survey, see Gosselin and Khan [2015]).3 Specifically, we asked respondents if they are currently or have engaged in certain side jobs or informal activities for pay over the past two years, and allow them to cite other activities not listed (Table 1). An individual had to select at least one activity, or indicate an alternative activity, to be considered an informal worker. One potential advantage of asking about informal activities over the past two years is that responses should be less seasonal. However, we find a similar participation rate in informal activities using either current or past participation; therefore, we have chosen to focus on current participation. Using these responses, we found that 66 per cent of respondents reported currently participating in informal activities.4 Excluding those respondents whose informal activities relate solely to income generated from physical capital (i.e., selling goods or renting property) rather than labour and survey-taking, this share falls to 30 per cent. As such, informal (gig)
3 Note that the survey sample was increased from 1,000 respondents to 2,000 respondents in 2018Q2. 4 This is based on those surveyed responding “yes” to at least one of the activities (or indicating an unlisted informal activity) as shown in Table 1. For a detailed breakdown of response rates by type of informal work, see Chart A-1.

3
work refers to this latter definition unless otherwise noted.5 That said, if we exclude those who mention participating in informal paid work for fun (as a hobby), this share falls to 18 per cent. Table 1: Participation in informal work For each of the informal paid activities or side jobs listed in the table below, please respond to the following question: Are you currently engaged in this activity?* Yes No Babysitting o o House sitting o o Dog walking o o Yard or lawn care (i.e., mowing, weeding, etc.) o o Housecleaning o o House painting o o Eldercare services o o Providing services to other people (for example, picking up their dry cleaning, helping people move houses, running errands, booking travel, or other personal assistance)
o o
Selling goods at consignment shops** o o Selling goods on eBay, craigslist or similar websites** o o Renting out property such as your car, your place of residence or other items you own** o o Driving for a ride-sharing service like Uber or Lyft o o Responding to surveys, including phone surveys, online surveys and in-person surveys** o o Getting paid to complete tasks online through websites such as Amazon Mechanical Turk, Fiverr or similar sites (examples of such tasks include, but are not limited to, editing documents, reviewing résumés, writing songs, creating graphic designs, rating pictures, etc.)
o o
Posting videos, blog posts or other content online, such as on YouTube, and receiving pay (including ad revenues or commissions) as a result
o o
Freelance computer programming, graphic or web design o o Other informal paid activity or side jobs (please specify) ____________ o o *For the question related to past participation, the question is, “Have you engaged in this activity in the past two years?” **These activities are excluded from our preferred measure of informal (“gig”) work.
3. Characteristics of informal paid activities and participants Based on our definition of informal work discussed above, which excludes individuals solely selling goods, renting property or taking surveys, we compare participation in these activities with respondents’ characteristics including age, location of work and reasons for engaging in such work, as captured by our regular CSCE questions and special questions included in the CSCE from 2018Q2 to 2018Q4. Overall, the results suggest that participants are more likely to be young and to participate in these activities to earn money. Moreover, their labour-force characteristics are consistent with some continued margin of slack in labour markets, particularly for youth. In addition, their participation in
5 Bracha and Burke (2018) calculate that for the United States, 19 per cent of the non-retired adult population (aged 21 and above) participated in informal paid activities (excluding survey-taking and renting property and selling goods) and reported non-zero hours in a typical month when they are engaged in the stated activity. The comparable ratio for Canada based on the 2018Q3 and 2018Q4 surveys is 29 per cent.
4
informal work may act as a safety net against (formal) job loss, as informal job participants report a comparatively higher probability of losing their main job. Wages in informal activities tend to be lower than in formal jobs and participation is higher in provinces with weak wage growth and historically high unemployment rates.
3.1 Participant characteristics and reasons for informal paid work
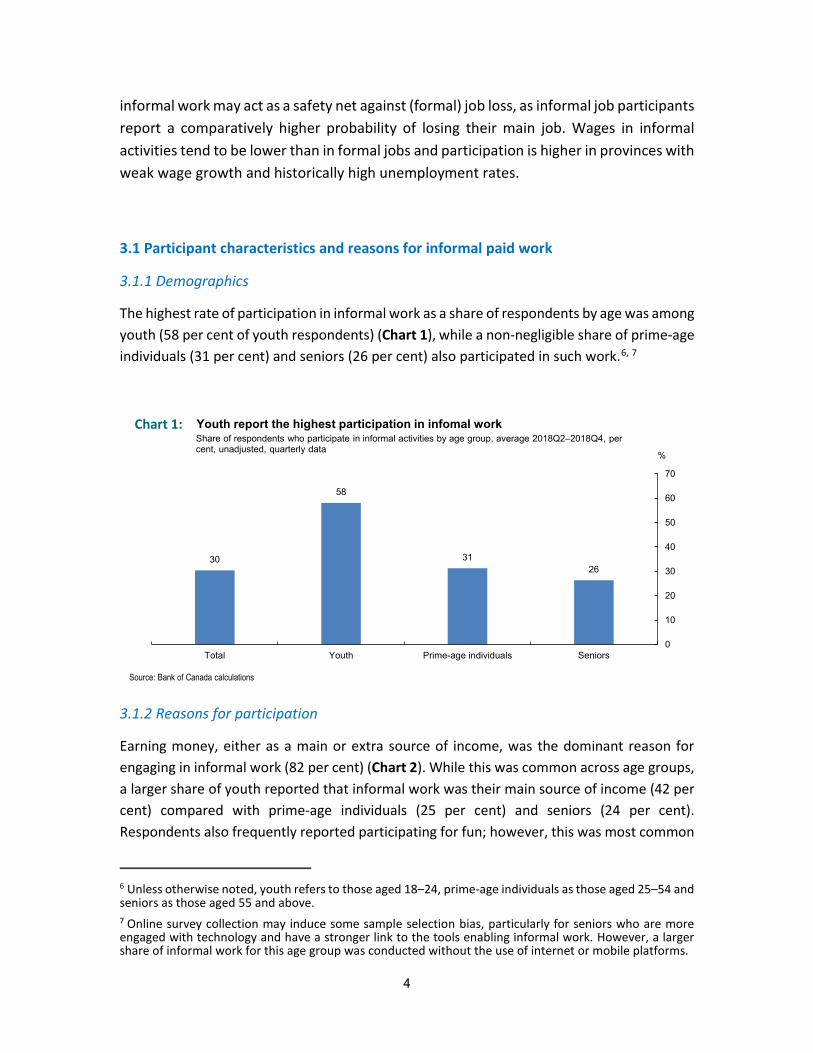
3.1.1 Demographics The highest rate of participation in informal work as a share of respondents by age was among youth (58 per cent of youth respondents) (Chart 1), while a non-negligible share of prime-age individuals (31 per cent) and seniors (26 per cent) also participated in such work.6, 7
3.1.2 Reasons for participation Earning money, either as a main or extra source of income, was the dominant reason for engaging in informal work (82 per cent) (Chart 2). While this was common across age groups, a larger share of youth reported that informal work was their main source of income (42 per cent) compared with prime-age individuals (25 per cent) and seniors (24 per cent). Respondents also frequently reported participating for fun; however, this was most common
6 Unless otherwise noted, youth refers to those aged 18–24, prime-age individuals as those aged 25–54 and seniors as those aged 55 and above. 7 Online survey collection may induce some sample selection bias, particularly for seniors who are more engaged with technology and have a stronger link to the tools enabling informal work. However, a larger share of informal work for this age group was conducted without the use of internet or mobile platforms.
30
58
3126
0
10
20
30
40
50
60
70
Total Youth Prime-age individuals Seniors
Chart 1:Share of respondents who participate in informal activities by age group, average 2018Q2–2018Q4, per cent, unadjusted, quarterly data
Youth report the highest participation in infomal work
Source: Bank of Canada calculations
%

5
for seniors (62 per cent) relative to prime-age individuals (35 per cent) and youth (22 per cent). About 15 per cent of informal work participants reported the unavailability of regular employment as a reason for informal work, which suggests that informal work picks up some slack from the regular labour market. Further supporting this, 37 per cent of respondents engaging in informal activities did so to earn money because of negative consequences of weak economic conditions such as job loss, reduced hours, reduced pay or stagnant wages. Of this 37 per cent, 81 per cent reported that this income somewhat or very much helped them offset the negative effects of income loss.
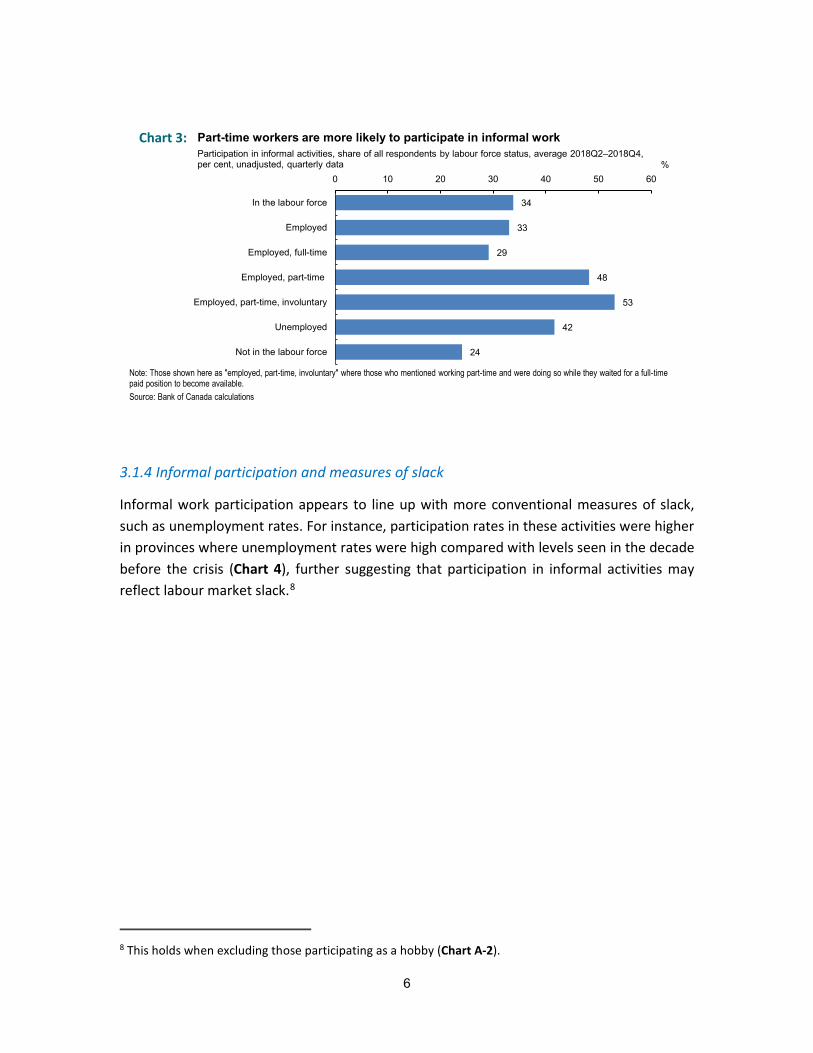
3.1.3 Labour force status Part-time workers, including those looking for full-time jobs, had a higher propensity to work in informal jobs than other employed individuals (Chart 3), while full-time workers had the second-lowest incidence of informal work. This suggests that informal activities may reflect labour market slack, and these labour resources could be supplied to the formal market should the labour market continue to improve.
82
57
25
62
20
16
15
14
11
0 20 40 60 80 100
To earn money
To earn extra money
To earn main income
Just for fun/hobby
Other
To network
Regular/salaried employment is not available
To maintain existing job-related skills
To acquire new job-related skills
Earning money is the dominant reason for engaging in informal workChart 2:Reasons for participating in informal activities, share of informal workers, average 2018Q2–2018Q4, per cent, unadjusted, quarterly data %
Source: Bank of Canada calculations
Note: The reason "to earn money" is the sum of those reporting participating to earn extra money and those reporting participating to earn main income. Individuals can report more than one reason for participating in informal work.
6
3.1.4 Informal participation and measures of slack Informal work participation appears to line up with more conventional measures of slack, such as unemployment rates. For instance, participation rates in these activities were higher in provinces where unemployment rates were high compared with levels seen in the decade before the crisis (Chart 4), further suggesting that participation in informal activities may reflect labour market slack.8
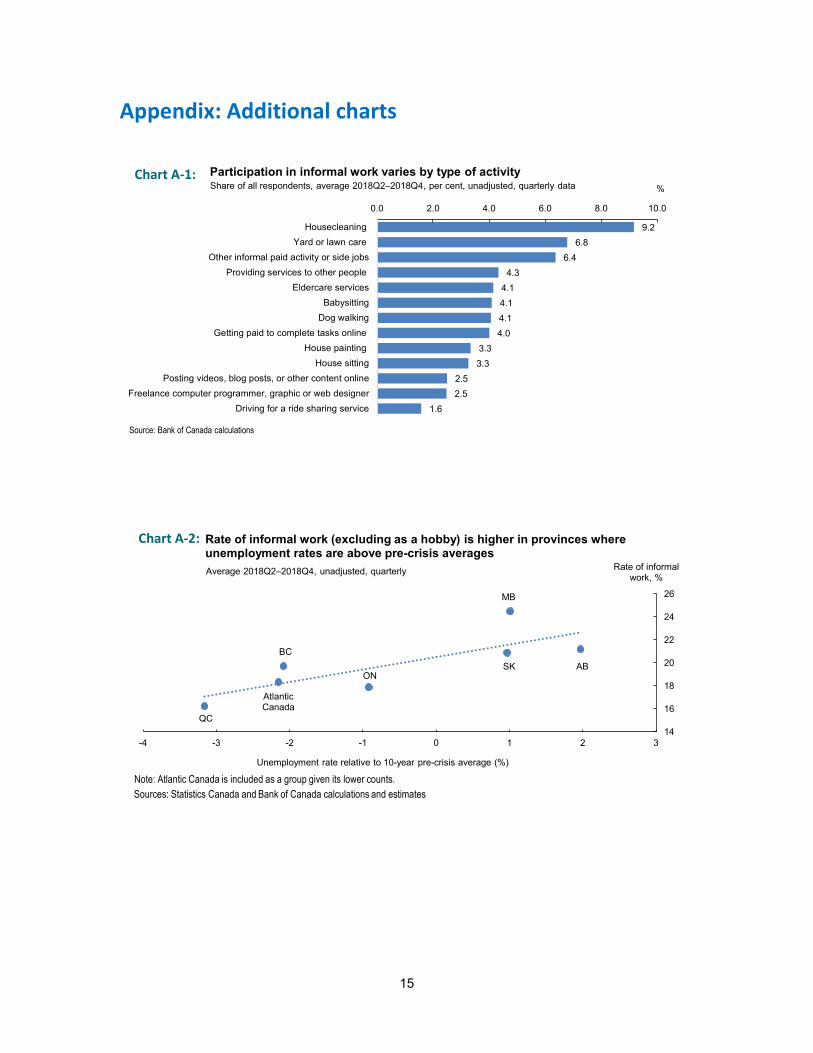
8 This holds when excluding those participating as a hobby (Chart A-2).
34
33
29
48
53
42
24
0 10 20 30 40 50 60
In the labour force
Employed
Employed, full-time
Employed, part-time
Employed, part-time, involuntary
Unemployed
Not in the labour force
Part-time workers are more likely to participate in informal workChart 3:Participation in informal activities, share of all respondents by labour force status, average 2018Q2–2018Q4, per cent, unadjusted, quarterly data %
Source: Bank of Canada calculations
Note: Those shown here as "employed, part-time, involuntary" where those who mentioned working part-time and were doing so while they waited for a full-time paid position to become available.

7
To get a better sense of the degree to which informal activities represent slack, we added questions to the 2018Q3 and 2018Q4 surveys about participants’ willingness to switch informal hours worked for formal hours at various levels of pay. We found that even for the same pay, slightly over half (57 per cent) of respondents would be somewhat or very likely to substitute informal work hours for hours worked at a formal job, lending further support to the view that a large share of such work reflects untapped resources.9 For youth, this share was even higher at 90 per cent, consistent with a greater availability of labour resources among this demographic.
3.2 Wages and informal work participation
Most participants perceived that their wages were weaker than what they could obtain in a formal job. Specifically, 60 per cent of informal workers reported that informal pay was lower than pay from a formal job they have or could have for a similar amount of time. Only 15 per cent reported it was higher, while 25 per cent reported it was about the same.10
9 This is based on questions similar to those posed by Bracha and Burke (2018) and results are comparable for the United States. They found the majority are likely (either somewhat likely or very likely) to switch informal hours if the pay was as much or greater than the informal pay. 10 Excluding respondents who reported participating in an informal activity as a hobby or for fun would bring the informal pay a bit more in line with that from formal employment. Specifically, the percentage of respondents reporting lower pay for informal work would fall to 53 per cent, while the share of those reporting the same and higher would increase to 28 per cent and 19 per cent, respectively.
25
27
29
31
33
35
37
-4 -3 -2 -1 0 1 2 3Unemployment rate relative to 10-year pre-crisis average (%)
Chart 4: Rate of informal work is higher in provinces where unemployment rates are above pre-crisis averagesAverage 2018Q2–2018Q4, unadjusted, quarterly
Sources: Statistics Canada and Bank of Canada calculations and estimates
Rate of informal work, %
Note: Atlantic Canada is included as a group given its lower counts.
QC
AtlanticCanada
ON
BC SK
MB
AB
8
In 2018Q3 and 2018Q4 we also added questions on the hours and earnings of workers in informal activities. We found that the average informal worker dedicated 43 hours to informal work in a given month and earned $465.11
While average wage rates for informal work appear lower than in formal jobs, respondents’ past wage growth (main job) and household income growth expectations are not statistically different from other workers’ once we account for relevant characteristics.12, 13
In contrast, higher wage growth expectations are associated with doing informal work, even after accounting for relevant characteristics.14 This could reflect the expected wage effects of skill and experience acquisition through such work.15
As tentative support for potential broader (macro) effects on wage growth, higher participation in informal activities at the provincial level is associated with lower wage growth in the province (Chart 5).16
11 To reduce the effect of outliers, we exclude anyone reporting greater than 365 hours per month and earning over $8,000 per month from these calculations. 12 That said, as this question about wage growth reflects the respondent’s main job, it likely excludes informal activities, and higher participation rates in informal work could also have broader macro implications for wage growth at present. 13 This finding is statistically significant and based on a regression analysis controlling for age, gender, education and province. In addition, regression of wage growth expectations includes past wage growth and inflation expectations as independent variables. Regression of income growth expectations includes controls for wage growth and inflation expectations, and regression of spending growth expectations includes controls for income growth and inflation expectations. 14 This finding is statistically significant. 15 Roughly 11 per cent of informal workers reported participating in such work to acquire new job-related skills. 16 This result holds when looking at alternative wage measures. For example, see Chart A-3.

9
3.3 Other participant characteristics
Our survey results reveal that participation in informal activities appears to be associated with more irregular hours and may reflect precautionary motives. The diffusion of digital platforms has likely facilitated such work, with roughly one-third of all participants (a higher share for youth) using mobile or web platforms in the course of doing this work. 3.3.1 Benefits, pension coverage and job security Some 35 per cent of those participating in informal activities had access to benefits or pension coverage in their main jobs relative to 40 per cent of those not participating in informal work. Meanwhile, higher probabilities of losing or leaving a job are associated with doing informal work.17 Therefore, informal work participation may reflect precautionary motives, acting as a safety net against (formal) job loss. Moreover, irregular work schedules were associated with informal work participation. Some 41 per cent of those with irregular hours participated in informal work relative to 29 per cent with fixed schedules. In addition, those engaged in informal activities reported working an average of 1.7 months out of the last 3 months.18 Given more irregular work schedules, such informal work may not be captured (at least fully) in official employment surveys, which tend to ask about work over a certain period (a reference week).
17 This result is based on the regression controlling for age, gender, education and province and is statistically significant. 18 Based on 2018Q3 and 2018Q4.
25
27
29
31
33
35
37
1.0 1.2 1.4 1.6 1.8 2.0 2.2 2.4 2.6 2.8 3.0Wage growth based on wage-common, year-over-year, four-quarter moving average (%)
Chart 5: Rate of informal work is higher in provinces with lower wage growthAverage 2018Q2–2018Q4, unadjusted, quarterly
Sources: Statistics Canada and Bank of Canada calculations and estimates
Rate of informal work (%)
Note: Atlantic Canada is included as a group given its lower counts, and wage growth for this region is constructed using the provincial wage-common measure weighted using Labour Force Survey employment shares. For more details on the construction of the provincialwage-common, see Lachaine (2018).
SK
MBAtlanticCanada
BCAB
ONQU

10
3.3.2 Informal work and internet platforms About 35 per cent of respondents engaging in informal activities used websites and/or mobile platforms in the course of doing this work. This was more common for youth (50 per cent) compared with prime-age individuals (43 per cent) and seniors (16 per cent).
4. Impact on participation rates Labour force participation rates constructed using the CSCE data are close to those constructed using data from the Labour Force Survey (LFS).19, 20 Since a sizable share of workers reported doing informal work as a hobby, the labour market attachment for these individuals may be relatively weak. They may not compete for jobs or have the same labour market and wage implications as those who participate for other reasons (including for income, skills development, networking or because regular employment is unavailable). Therefore, we compute an adjusted participation rate including informal work but excluding those individuals who participate in informal work as a hobby. As a result, we find an average of 11 per cent of those who were not in the labour force reported doing such informal work. If we were to include those who reported participating in informal work (not as a hobby) but were not in the labour force based on CSCE, participation rates would increase by about 3 percentage points (pps) overall (Chart 6). The largest boost was to youth participation rates (8 pps) and to a lesser extent the seniors’ rate (5 pps). If such activities have increased in the post-crisis period, this could help explain some of the weakness in youth participation rates. To realign the labour force estimates in the CSCE for greater consistency with the LFS, we added questions, including on job search, in the 2018Q3 and 2018Q4 surveys. The impact of informal work on participation rates using this more refined definition of labour force participation is similar (see Chart A-4 and Chart A-5 for more details), albeit slightly lower. In particular, based on the average for 2018Q3 and 2018Q4, participation rates could be boosted by 2 pps, accounting for informal work. While lower than our estimates based on data over 2018Q2–2018Q4, part of this reflects seasonality, with a lower share of
19 Specifically, we define those in the labour force in the CSCE as those reporting working full-time or part-time, those not working but who would like to work, those temporarily laid off and those on sick or other leave. In the 2018Q3 and 2018Q4 surveys we added questions on job search, among others, to further refine our labour force estimates to be more consistent with LFS. However, even without this additional information, our measures based on CSCE data are close to the LFS (see Chart A-4 and Chart A-5 for more details). 20 Specifically, in Chart 6 we show the CSCE participation rate for those aged 18 and older, relative to the LFS measure for those 17 and older on an unadjusted basis, available from the LFS Public Use Microdata File. Despite this slight difference in age, our CSCE estimates remain very close to those in the LFS.

11
respondents reporting engaging in informal activities in 2018Q3 and 2018Q4. Therefore, this additional information, together with the effects of seasonality, suggests that accounting for informal work could boost participation rates by 2–3 pps. While we do not have Canadian data to assess the dynamics of informal work and the impact on participation rates over a longer period of time, the diffusion of digital platforms would support some increase.21 Moreover, studies for the United States (e.g., Katz and Krueger 2019) find a modest upward trend in the share of workforce in alternative work arrangements in the United States between 2000 and 2017. As such, this additional margin of supply may have dampened wage growth in the post-crisis period.
5. Quantifying labour supplied through informal work In the 2018Q3 and 2018Q4 surveys, we added questions on hours worked in each informal activity. This allows us to quantify not only the share of Canadians who are participating in informal work, but also how many hours they are likely supplying to the labour market through such work.22 If the aggregate number of hours were low in relation to the overall hours worked in the economy, informal work would have a limited effect on wage growth.
21 As highlighted above, about 35 per cent of those engaged in informal work used websites and mobile platforms in the course of doing this work. 22 We find that the average monthly hours supplied by those participating not as a hobby varies considerably by their labour force status, with the highest for those who were employed and the lowest for those who were not in the labour force (Chart A-6).
66.470.8
87.2
37.8
66.371.7
88.3
31.5
69.4
80.1
90.0
36.5
20
30
40
50
60
70
80
90
100
Total Youth Prime-age individuals Seniors
LFS participation rate CSCE participation rate CSCE participation rate, including informal work but not as a hobby
Accounting for informal work would boost the labour force participation rateParticipation rates based on the Labour Force Survey (LFS) and the Canadian Survey of Consumer Expectations (CSCE), average 2018Q2–2018Q4, per cent, unadjusted, quarterly data
Chart 6:
%
Sources: Statistics Canada, Statistics Canada Public Use Microdata File and Bank of Canada calculationsNote: Youth participation rates are for those aged 17–24, while in the CSCE it is for those aged 18–24.
12
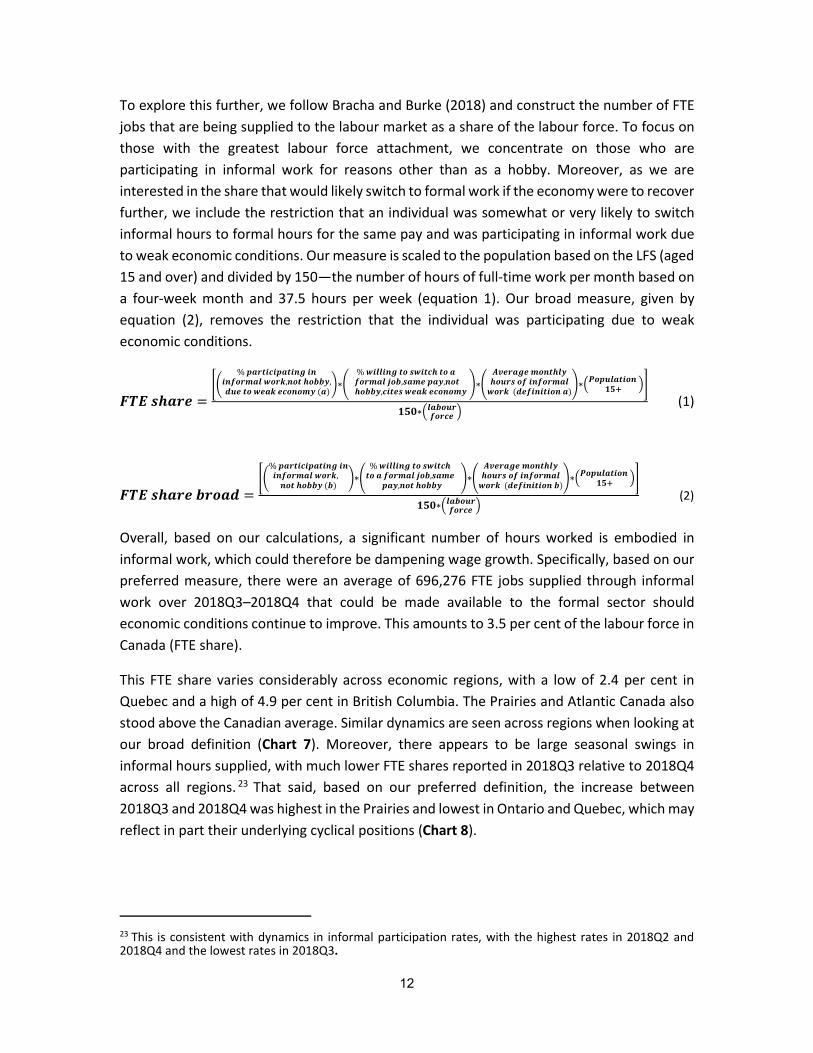
To explore this further, we follow Bracha and Burke (2018) and construct the number of FTE jobs that are being supplied to the labour market as a share of the labour force. To focus on those with the greatest labour force attachment, we concentrate on those who are participating in informal work for reasons other than as a hobby. Moreover, as we are interested in the share that would likely switch to formal work if the economy were to recover further, we include the restriction that an individual was somewhat or very likely to switch informal hours to formal hours for the same pay and was participating in informal work due to weak economic conditions. Our measure is scaled to the population based on the LFS (aged 15 and over) and divided by 150—the number of hours of full-time work per month based on a four-week month and 37.5 hours per week (equation 1). Our broad measure, given by equation (2), removes the restriction that the individual was participating due to weak economic conditions.
𝑭𝑭𝑭𝑭𝑭𝑭 𝒔𝒔𝒔𝒔𝒔𝒔𝒔𝒔𝒔𝒔 =��
% 𝒑𝒑𝒔𝒔𝒔𝒔𝒑𝒑𝒑𝒑𝒑𝒑𝒑𝒑𝒑𝒑𝒔𝒔𝒑𝒑𝒑𝒑𝒑𝒑𝒑𝒑 𝒑𝒑𝒑𝒑𝒑𝒑𝒑𝒑𝒊𝒊𝒊𝒊𝒔𝒔𝒊𝒊𝒔𝒔𝒊𝒊 𝒘𝒘𝒊𝒊𝒔𝒔𝒘𝒘,𝒑𝒑𝒊𝒊𝒑𝒑 𝒔𝒔𝒊𝒊𝒉𝒉𝒉𝒉𝒉𝒉, 𝒅𝒅𝒅𝒅𝒔𝒔 𝒑𝒑𝒊𝒊 𝒘𝒘𝒔𝒔𝒔𝒔𝒘𝒘 𝒔𝒔𝒑𝒑𝒊𝒊𝒑𝒑𝒊𝒊𝒊𝒊𝒉𝒉 (𝒔𝒔)
�∗�% 𝒘𝒘𝒑𝒑𝒊𝒊𝒊𝒊𝒑𝒑𝒑𝒑𝒑𝒑 𝒑𝒑𝒊𝒊 𝒔𝒔𝒘𝒘𝒑𝒑𝒑𝒑𝒑𝒑𝒔𝒔 𝒑𝒑𝒊𝒊 𝒔𝒔
𝒊𝒊𝒊𝒊𝒔𝒔𝒊𝒊𝒔𝒔𝒊𝒊 𝒋𝒋𝒊𝒊𝒉𝒉,𝒔𝒔𝒔𝒔𝒊𝒊𝒔𝒔 𝒑𝒑𝒔𝒔𝒉𝒉,𝒑𝒑𝒊𝒊𝒑𝒑
𝒔𝒔𝒊𝒊𝒉𝒉𝒉𝒉𝒉𝒉,𝒑𝒑𝒑𝒑𝒑𝒑𝒔𝒔𝒔𝒔 𝒘𝒘𝒔𝒔𝒔𝒔𝒘𝒘 𝒔𝒔𝒑𝒑𝒊𝒊𝒑𝒑𝒊𝒊𝒊𝒊𝒉𝒉 �∗�
𝑨𝑨𝑨𝑨𝒔𝒔𝒔𝒔𝒔𝒔𝒑𝒑𝒔𝒔 𝒊𝒊𝒊𝒊𝒑𝒑𝒑𝒑𝒔𝒔𝒊𝒊𝒉𝒉𝒔𝒔𝒊𝒊𝒅𝒅𝒔𝒔𝒔𝒔 𝒊𝒊𝒊𝒊 𝒑𝒑𝒑𝒑𝒊𝒊𝒊𝒊𝒔𝒔𝒊𝒊𝒔𝒔𝒊𝒊𝒘𝒘𝒊𝒊𝒔𝒔𝒘𝒘 (𝒅𝒅𝒔𝒔𝒊𝒊𝒑𝒑𝒑𝒑𝒑𝒑𝒑𝒑𝒑𝒑𝒊𝒊𝒑𝒑 𝒔𝒔)
�∗�𝑷𝑷𝒊𝒊𝒑𝒑𝒅𝒅𝒊𝒊𝒔𝒔𝒑𝒑𝒑𝒑𝒊𝒊𝒑𝒑 𝟏𝟏𝟏𝟏+ ��
𝟏𝟏𝟏𝟏𝟏𝟏∗�𝒊𝒊𝒔𝒔𝒉𝒉𝒊𝒊𝒅𝒅𝒔𝒔𝒊𝒊𝒊𝒊𝒔𝒔𝒑𝒑𝒔𝒔 � (1)
𝑭𝑭𝑭𝑭𝑭𝑭 𝒔𝒔𝒔𝒔𝒔𝒔𝒔𝒔𝒔𝒔 𝒉𝒉𝒔𝒔𝒊𝒊𝒔𝒔𝒅𝒅 =��
% 𝒑𝒑𝒔𝒔𝒔𝒔𝒑𝒑𝒑𝒑𝒑𝒑𝒑𝒑𝒑𝒑𝒔𝒔𝒑𝒑𝒑𝒑𝒑𝒑𝒑𝒑 𝒑𝒑𝒑𝒑𝒑𝒑𝒑𝒑𝒊𝒊𝒊𝒊𝒔𝒔𝒊𝒊𝒔𝒔𝒊𝒊 𝒘𝒘𝒊𝒊𝒔𝒔𝒘𝒘, 𝒑𝒑𝒊𝒊𝒑𝒑 𝒔𝒔𝒊𝒊𝒉𝒉𝒉𝒉𝒉𝒉 (𝒉𝒉)
�∗�% 𝒘𝒘𝒑𝒑𝒊𝒊𝒊𝒊𝒑𝒑𝒑𝒑𝒑𝒑 𝒑𝒑𝒊𝒊 𝒔𝒔𝒘𝒘𝒑𝒑𝒑𝒑𝒑𝒑𝒔𝒔𝒑𝒑𝒊𝒊 𝒔𝒔 𝒊𝒊𝒊𝒊𝒔𝒔𝒊𝒊𝒔𝒔𝒊𝒊 𝒋𝒋𝒊𝒊𝒉𝒉,𝒔𝒔𝒔𝒔𝒊𝒊𝒔𝒔
𝒑𝒑𝒔𝒔𝒉𝒉,𝒑𝒑𝒊𝒊𝒑𝒑 𝒔𝒔𝒊𝒊𝒉𝒉𝒉𝒉𝒉𝒉 �∗�
𝑨𝑨𝑨𝑨𝒔𝒔𝒔𝒔𝒔𝒔𝒑𝒑𝒔𝒔 𝒊𝒊𝒊𝒊𝒑𝒑𝒑𝒑𝒔𝒔𝒊𝒊𝒉𝒉𝒔𝒔𝒊𝒊𝒅𝒅𝒔𝒔𝒔𝒔 𝒊𝒊𝒊𝒊 𝒑𝒑𝒑𝒑𝒊𝒊𝒊𝒊𝒔𝒔𝒊𝒊𝒔𝒔𝒊𝒊𝒘𝒘𝒊𝒊𝒔𝒔𝒘𝒘 (𝒅𝒅𝒔𝒔𝒊𝒊𝒑𝒑𝒑𝒑𝒑𝒑𝒑𝒑𝒑𝒑𝒊𝒊𝒑𝒑 𝒉𝒉)
�∗�𝑷𝑷𝒊𝒊𝒑𝒑𝒅𝒅𝒊𝒊𝒔𝒔𝒑𝒑𝒑𝒑𝒊𝒊𝒑𝒑 𝟏𝟏𝟏𝟏+ ��
𝟏𝟏𝟏𝟏𝟏𝟏∗�𝒊𝒊𝒔𝒔𝒉𝒉𝒊𝒊𝒅𝒅𝒔𝒔𝒊𝒊𝒊𝒊𝒔𝒔𝒑𝒑𝒔𝒔 � (2)
Overall, based on our calculations, a significant number of hours worked is embodied in informal work, which could therefore be dampening wage growth. Specifically, based on our preferred measure, there were an average of 696,276 FTE jobs supplied through informal work over 2018Q3–2018Q4 that could be made available to the formal sector should economic conditions continue to improve. This amounts to 3.5 per cent of the labour force in Canada (FTE share).
This FTE share varies considerably across economic regions, with a low of 2.4 per cent in Quebec and a high of 4.9 per cent in British Columbia. The Prairies and Atlantic Canada also stood above the Canadian average. Similar dynamics are seen across regions when looking at our broad definition (Chart 7). Moreover, there appears to be large seasonal swings in informal hours supplied, with much lower FTE shares reported in 2018Q3 relative to 2018Q4 across all regions. 23 That said, based on our preferred definition, the increase between 2018Q3 and 2018Q4 was highest in the Prairies and lowest in Ontario and Quebec, which may reflect in part their underlying cyclical positions (Chart 8).
23 This is consistent with dynamics in informal participation rates, with the highest rates in 2018Q2 and 2018Q4 and the lowest rates in 2018Q3.

13
6. Conclusion A large share of Canadians participate in informal paid activities in one form or another. Focusing on those activities that most directly relate to the supply of labour (i.e., excluding survey-taking, selling goods and renting property) suggests that informal work participation rates could be as high as 30 per cent. We obtain lower estimates of around 18 per cent if we focus on those whose labour force attachment is more related to earning income or developing skills (i.e., excluding those participating as a hobby). Because a sizable share of these individuals is likely not counted as part of the labour force, participation rates may be
3.5
4.94.0
3.4
2.4
4.55.7
7.6
6.1 6.0
4.2
6.6
0.0
1.0
2.0
3.0
4.0
5.0
6.0
7.0
8.0
9.0
Canada British Columbia Prairies Ontario Quebec Atlantic
FTE share FTE share, broad
Average 2018Q3–2018Q4, unadjusted, quarterly data
Chart 7:
Sources: Statistics Canada and Bank of Canada calculations
%
Informal work measured in full-time equivalents as a share of the labour force is highest in British Columbia and lowest in Quebec
Note: FTE is full-time equivalent. The broad definition removes the restriction that one is participating due to weak economic conditions.
2.2
4.2 4.6
0.7 0.8
2.7
-1.0
0.0
1.0
2.0
3.0
4.0
5.0
6.0
7.0
8.0
Canada British Columbia Prairies Ontario Quebec Atlantic
FTE share FTE share, broad
Difference between 2018Q3 and 2018Q4, percentage points, unadjusted, quarterly data
Chart 8:
Sources: Statistics Canada and Bank of Canada calculations
Percentage points
The increase in the informal full-time equivalent share between 2018Q3 and 2018Q4 was highest in the Prairies
Note: FTE is full-time equivalent. The broad definition removes the restriction that one is participating due to weak economic conditions.

14
underestimated. Based on estimates presented above, aggregate labour force participation rates could be boosted by 2–3 pps if such individuals were counted as part of the labour force. Moreover, since part-time workers have a higher incidence of informal work and over half of informal work participants would switch hours to a formal job for no increase in pay, informal activities likely reflect (in part) labour market slack. Our estimates suggest that informal hours that may be made available to the formal market amount to roughly 700,000 FTE jobs, or 3.5 per cent of the labour force. They also suggest that as the labour market continues to improve, the supply of informal hours to the formal market may result in less upward pressure on wages than would be expected based on standard unemployment rates.
References
Bracha, A. and M. A. Burke. 2016. “Who Counts as Employed? Informal Work, Employment Status, and Labor Market Slack.” Federal Reserve Bank of Boston Research Department Working Papers, 2016 Series, No. 16-29. ———. 2018. “Wage Inflation and Informal Work.” Federal Reserve Bank of Boston Current Policy Perspectives, 2018 Series, No. 18-2. Gosselin, M.-A. and M. Khan. 2015. “A Survey of Consumer Expectations for Canada.” Bank of Canada Review (Autumn): 14–23. Katz, L. and A. Krueger. 2019. “Understanding Trends in Alternative Work Arrangements in the United States.” NBER Working Paper No. 25425. Lachaine, J. 2018. “Applying the Wage-Common to Canadian Provinces.” Bank of Canada Staff Analytical Note No. 2018-16.
15
Appendix: Additional charts
9.26.8
6.44.3
4.14.14.14.0
3.33.3
2.52.5
1.6
0.0 2.0 4.0 6.0 8.0 10.0
HousecleaningYard or lawn care
Other informal paid activity or side jobsProviding services to other people
Eldercare servicesBabysitting
Dog walkingGetting paid to complete tasks online
House paintingHouse sitting
Posting videos, blog posts, or other content onlineFreelance computer programmer, graphic or web designer
Driving for a ride sharing service
Chart A-1:Share of all respondents, average 2018Q2–2018Q4, per cent, unadjusted, quarterly dataParticipation in informal work varies by type of activity
%
Source: Bank of Canada calculations
14
16
18
20
22
24
26
-4 -3 -2 -1 0 1 2 3
Unemployment rate relative to 10-year pre-crisis average (%)
Chart A-2: Rate of informal work (excluding as a hobby) is higher in provinces where unemployment rates are above pre-crisis averagesAverage 2018Q2–2018Q4, unadjusted, quarterly
Sources: Statistics Canada and Bank of Canada calculations and estimates
Rate of informal work, %
Note: Atlantic Canada is included as a group given its lower counts.
AB
MB
SKON
Atlantic Canada
BC
QC

16
25
27
29
31
33
35
37
0.0 0.5 1.0 1.5 2.0 2.5 3.0 3.5 4.0Wage growth, year-over-year, 12-month moving average (%)
Chart A-3: Rate of informal work is higher in provinces where wage growth is lowerVariable-weighted wage growth, unadjusted, October 2018; rate of informal work, average 2018Q2–2018Q4, unadjusted, quarterly
Sources: Statistics Canada Survey of Employment Payrolls and Hours (SEPH) and Bank of Canada calculations and estimates
Rate of informal work (%)
QU
BC
MB
ON
Atlantic Canada
ABSK
66.370.2
87.3
37.7
67.2
79.2
88.9
33.7
69.2
82.790.1
37.3
20
30
40
50
60
70
80
90
100
Total Youth Prime-age individuals Seniors
LFS participation rate CSCE participation rate (refined) CSCE participation rate (refined), including informal work but not as a hobby
Participation rates including additional questions to determine labour force status, 2018Q3–2018Q4Participation rates based on the Labour Force Survey (LFS) and the Canadian Survey of Consumer Expectations (CSCE), average 2018Q3–2018Q4, per cent, unadjusted, quarterly data
Chart A-4:
%
Sources: Statistics Canada, Statistics Canada Public Use Microdata File and Bank of Canada calculationsNote: Youth participation rates are for those aged 17–24, while in the CSCE it is for those aged 18–24.

17
66.370.2
87.3
37.7
66.0
76.3
88.5
31.5
68.4
81.0
90.0
35.6
20
30
40
50
60
70
80
90
100
Total Youth Prime-age individuals Seniors
LFS participation rate CSCE participation rate CSCE participation rate, including informal work but not as a hobby
Participation rates excluding additional questions to determine labour force status, 2018Q3–2018Q4Participation rates based on the Labour Force Survey (LFS) and the Canadian Survey of Consumer Expectations (CSCE), average 2018Q3–2018Q4, per cent, unadjusted, quarterly data
Chart A-5:
%
Sources: Statistics Canada, Statistics Canada Public Use Microdata File and Bank of Canada calculationsNote: Youth participation rates are for those aged 17–24, while in the CSCE it is for those aged 18–24.
46 47 4841
45
33 33
52 5358 56
44 43
33
0
10
20
30
40
50
60
70
In the labourforce
Employed Employed, full-time
Employed, part-time
Employed, part-time, waiting for
full-time
Unemployed Not in the labourforce
All reasons Not as a hobby
Average hours worked per month by labour force status, average 2018Q3–2018Q4, unadjusted, quarterly data
Chart A-6:
Source: Bank of Canada calculations
Hours per month
Average hours of informal work per month varies by labour force status