
THE SCUBA-2 COSMOLOGY LEGACY SURVEY: MULTI …
23
THE SCUBA-2 COSMOLOGY LEGACY SURVEY: MULTIWAVELENGTH COUNTERPARTS TO 10 3 SUBMILLIMETER GALAXIES IN THE UKIDSS-UDS FIELD Chian-Chou Chen (陳建州) 1,2 , Ian Smail 1,2 , Rob J. Ivison 3,4 , Vinodiran Arumugam 3,4 , Omar Almaini 5 , Christopher J. Conselice 5 , James E. Geach 6 , Will G. Hartley 5,7 , Cheng-Jiun Ma 1,2 , Alice Mortlock 3,5 , Chris Simpson 8 , James M. Simpson 1,2 , A. Mark Swinbank 1,2 , Itziar Aretxaga 9 , Andrew Blain 10 , Scott C. Chapman 11 , James S. Dunlop 3 , Duncan Farrah 12 , Mark Halpern 13 , Michal J. Michalowski 3 , Paul van der Werf 14 , Aaron Wilkinson 5 , and Jorge A. Zavala 9 1 Centre for Extragalactic Astronomy, Department of Physics, Durham University, South Road, Durham DH1 3LE, UK 2 Institute for Computational Cosmology, Durham University, South Road, Durham DH1 3LE, UK 3 Institute for Astronomy, University of Edinburgh, Royal Observatory, Blackford Hill, Edinburgh EH9 3HJ, UK 4 European Southern Observatory, Karl Schwarzschild Strasse 2, Garching, Germany 5 University of Nottingham, School of Physics and Astronomy, Nottingham, NG7 2RD, UK 6 Center for Astrophysics Research, Science & Technology Research Institute, University of Hertfordshire, Hatfield AL10 9AB, UK 7 ETH Zürich, Institut für Astronomie, HIT J 11.3, Wolfgang-Pauli-Strasse 27, CH-8093 Zürich, Switzerland 8 Astrophysics Research Institute, Liverpool John Moores University, Liverpool Science Park, 146 Brownlow Hill, Liverpool L3 5RF, UK 9 Instituto Nacional de Astrofísica, Óptica y Electrónica (INAOE), Luis Enrique Erro 1, Sta. Ma. Tonantzintla, Puebla, Mexico 10 Physics & Astronomy, University of Leicester, Leicester, LE1 7RH, UK 11 Department of Physics and Atmospheric Science, Dalhousie University, 6310 Coburg Road, Halifax, NS B3H 4R2, Canada 12 Department of Physics, Virginia Tech, Blacksburg, VA 24061, USA 13 Department of Physics & Astronomy, University of British Columbia, 6224 Agricultural Road, Vancouver, BCV6T 1Z1, Canada 14 Leiden Observatory, Leiden University, P.O. Box 9513, NL-2300 RA Leiden, The Netherlands Received 2015 September 24; accepted 2015 December 17; published 2016 March 22 ABSTRACT We present multiwavelength identifications for the counterparts of 1088 submillimeter sources detected at 850 μm in the SCUBA-2 Cosmology Legacy Survey study of the UKIRT Infrared Deep Sky Survey-Ultra-Deep Survey (UDS) field. By utilizing an Atacama Large Millimeter Array (ALMA) pilot study on a subset of our bright SCUBA-2 sample as a training set, along with the deep optical–near-infrared (OIR) data available in this field, we develop a novel technique, Optical–IR Triple Color (OIRTC), using z−K, K−[3.6], [3.6]−[4.5] colors to select the candidate submillimeter galaxy (SMG) counterparts. By combining radio identification and the OIRTC technique, we find counterpart candidates for 80% of the Class = 1 4σ SCUBA-2 sample, defined as those that are covered by both radio and OIR imaging and the base sample for our scientific analyses. Based on the ALMA training set, we expect the accuracy of these identifications to be 82%±20%, with a completeness of 69%±16%, essentially as accurate as the traditional p-value technique but with higher completeness. We find that the fraction of SCUBA-2 sources having candidate counterparts is lower for fainter 850 μm sources, and we argue that for follow-up observations sensitive to SMGs with S 850 1 mJy across the whole ALMA beam, the fraction with multiple counterparts is likely to be >40% for SCUBA-2 sources at S 850 4 mJy. We find that the photometric redshift distribution for the SMGs is well fit by a lognormal distribution, with a median redshift of z = 2.3±0.1. After accounting for the sources without any radio and/or OIRTC counterpart, we estimate the median redshift to be z = 2.6±0.1 for SMGs with S 850 >1 mJy. We also use this new large sample to study the clustering of SMGs and thefar-infrared properties of the unidentified submillimeter sources by stacking their Herschel SPIRE far-infrared emission. Key words: catalogs – cosmology: observations – galaxies: formation – galaxies: high-redshift – galaxies: starburst – submillimeter: galaxies Supporting material: extended figures, machine-readable tables 1. INTRODUCTION Ultraluminous infrared galaxies (ULIRGs, with infrared luminosities of L IR 10 12 L e ; Sanders & Mirabel 1996) are relatively rare at z ∼ 0, but their space density rapidly increases with look-back time and apparently peaks around z ∼ 2–3 (e.g., Barger et al. 1999; Chapman et al. 2005; Le Floc’h et al. 2005; Gruppioni et al. 2013). The vast majority of the luminosity of these sources escapes in the far-infrared (FIR) and submilli- meter,and as a result, they are the brightest extragalactic sources in the FIR/submillimeter sky. The shape of the dust spectral energy distribution (SED) peaks around ∼100 μm and declines at longer wavelengths (e.g., Vivian et al. 2012; Symeonidis et al. 2013; Swinbank et al. 2014). This characteristic form yields a “negative K-correction” for observations in the submillimeter waveband (Blain & Long- air 1993), with the apparent flux of a source with a fixed infrared luminosity remaining almost constant over a wide range in redshift, z ∼ 1–6 (e.g., Blain et al. 2002; Casey et al. 2014). When combined with the typical sensitivities and confusion limits of existing FIR/submillimeter observatories (e.g., Herschel, the James Clerk Maxwell telescope [JCMT]or the Large Millimeter Telescope [LMT]), the negative K- correction means that surveys for high-redshift ULIRGs are most efficiently undertaken in wavebands around ∼1 mm, leading to the association of thename “submillimeter galaxies” (SMGs) with this population (e.g., Smail et al. 1997). Moreover, the surface density of high-redshift ULIRGs is also The Astrophysical Journal, 820:82 (23pp), 2016 April 1 doi:10.3847/0004-637X/820/2/82 © 2016. The American Astronomical Society. All rights reserved. 1
Transcript of THE SCUBA-2 COSMOLOGY LEGACY SURVEY: MULTI …

THE SCUBA-2 COSMOLOGY LEGACY SURVEY: MULTIWAVELENGTH COUNTERPARTSTO 103 SUBMILLIMETER GALAXIES IN THE UKIDSS-UDS FIELD
Chian-Chou Chen (陳建州)1,2, Ian Smail1,2, Rob J. Ivison
3,4, Vinodiran Arumugam
3,4, Omar Almaini
5,
Christopher J. Conselice5, James E. Geach
6, Will G. Hartley
5,7, Cheng-Jiun Ma
1,2, Alice Mortlock
3,5, Chris Simpson
8,
James M. Simpson1,2, A. Mark Swinbank
1,2, Itziar Aretxaga
9, Andrew Blain
10, Scott C. Chapman
11, James S. Dunlop
3,
Duncan Farrah12, Mark Halpern
13, Michał J. Michałowski
3, Paul van der Werf
14, Aaron Wilkinson
5, and
Jorge A. Zavala9
1 Centre for Extragalactic Astronomy, Department of Physics, Durham University, South Road, Durham DH1 3LE, UK2 Institute for Computational Cosmology, Durham University, South Road, Durham DH1 3LE, UK
3 Institute for Astronomy, University of Edinburgh, Royal Observatory, Blackford Hill, Edinburgh EH9 3HJ, UK4 European Southern Observatory, Karl Schwarzschild Strasse 2, Garching, Germany
5 University of Nottingham, School of Physics and Astronomy, Nottingham, NG7 2RD, UK6 Center for Astrophysics Research, Science & Technology Research Institute, University of Hertfordshire, Hatfield AL10 9AB, UK
7 ETH Zürich, Institut für Astronomie, HIT J 11.3, Wolfgang-Pauli-Strasse 27, CH-8093 Zürich, Switzerland8 Astrophysics Research Institute, Liverpool John Moores University, Liverpool Science Park, 146 Brownlow Hill, Liverpool L3 5RF, UK
9 Instituto Nacional de Astrofísica, Óptica y Electrónica (INAOE), Luis Enrique Erro 1, Sta. Ma. Tonantzintla, Puebla, Mexico10 Physics & Astronomy, University of Leicester, Leicester, LE1 7RH, UK
11 Department of Physics and Atmospheric Science, Dalhousie University, 6310 Coburg Road, Halifax, NS B3H 4R2, Canada12 Department of Physics, Virginia Tech, Blacksburg, VA 24061, USA
13 Department of Physics & Astronomy, University of British Columbia, 6224 Agricultural Road, Vancouver, BCV6T 1Z1, Canada14 Leiden Observatory, Leiden University, P.O. Box 9513, NL-2300 RA Leiden, The Netherlands
Received 2015 September 24; accepted 2015 December 17; published 2016 March 22
ABSTRACT
We present multiwavelength identifications for the counterparts of 1088 submillimeter sources detected at 850 μmin the SCUBA-2 Cosmology Legacy Survey study of the UKIRT Infrared Deep Sky Survey-Ultra-Deep Survey(UDS) field. By utilizing an Atacama Large Millimeter Array (ALMA) pilot study on a subset of our brightSCUBA-2 sample as a training set, along with the deep optical–near-infrared (OIR) data available in this field, wedevelop a novel technique, Optical–IR Triple Color (OIRTC), using z−K, K−[3.6], [3.6]−[4.5] colors toselect the candidate submillimeter galaxy (SMG) counterparts. By combining radio identification and the OIRTCtechnique, we find counterpart candidates for 80% of the Class= 1� 4σ SCUBA-2 sample, defined as those thatare covered by both radio and OIR imaging and the base sample for our scientific analyses. Based on the ALMAtraining set, we expect the accuracy of these identifications to be 82%±20%, with a completeness of69%±16%, essentially as accurate as the traditional p-value technique but with higher completeness. We find thatthe fraction of SCUBA-2 sources having candidate counterparts is lower for fainter 850 μm sources, and we arguethat for follow-up observations sensitive to SMGs with S850 1 mJy across the whole ALMA beam, the fractionwith multiple counterparts is likely to be>40% for SCUBA-2 sources at S850 4 mJy. We find that thephotometric redshift distribution for the SMGs is well fit by a lognormal distribution, with a median redshift ofz= 2.3±0.1. After accounting for the sources without any radio and/or OIRTC counterpart, we estimate themedian redshift to be z= 2.6±0.1 for SMGs with S850>1 mJy. We also use this new large sample to study theclustering of SMGs and thefar-infrared properties of the unidentified submillimeter sources by stacking theirHerschel SPIRE far-infrared emission.
Key words: catalogs – cosmology: observations – galaxies: formation – galaxies: high-redshift – galaxies: starburst– submillimeter: galaxies
Supporting material: extended figures, machine-readable tables
1. INTRODUCTION
Ultraluminous infrared galaxies (ULIRGs, with infraredluminosities of LIR� 1012 Le; Sanders & Mirabel 1996) arerelatively rare at z∼ 0, but their space density rapidly increaseswith look-back time and apparently peaks around z∼ 2–3 (e.g.,Barger et al. 1999; Chapman et al. 2005; Le Floc’h et al. 2005;Gruppioni et al. 2013). The vast majority of the luminosity ofthese sources escapes in the far-infrared (FIR) and submilli-meter,and as a result, they are the brightest extragalacticsources in the FIR/submillimeter sky. The shape of the dustspectral energy distribution (SED) peaks around ∼100 μm anddeclines at longer wavelengths (e.g., Vivian et al. 2012;Symeonidis et al. 2013; Swinbank et al. 2014). This
characteristic form yields a “negative K-correction” forobservations in the submillimeter waveband (Blain & Long-air 1993), with the apparent flux of a source with a fixedinfrared luminosity remaining almost constant over a widerange in redshift, z∼ 1–6 (e.g., Blain et al. 2002; Casey et al.2014). When combined with the typical sensitivities andconfusion limits of existing FIR/submillimeter observatories(e.g., Herschel, the James Clerk Maxwell telescope [JCMT]orthe Large Millimeter Telescope [LMT]), the negative K-correction means that surveys for high-redshift ULIRGs aremost efficiently undertaken in wavebands around ∼1 mm,leading to the association of thename “submillimeter galaxies”(SMGs) with this population (e.g., Smail et al. 1997).Moreover, the surface density of high-redshift ULIRGs is also
The Astrophysical Journal, 820:82 (23pp), 2016 April 1 doi:10.3847/0004-637X/820/2/82© 2016. The American Astronomical Society. All rights reserved.
1
bestmatched to the wide-field capabilities of single-dishtelescopes, rather than the narrow field of view of current(sub)millimeter interferometers. This has been the motivationfor a series of panoramic (sub)millimeter surveys over the pastdecade using first-generation bolometer cameras on the JCMT,the IRAM 30 m, APEX, and ASTE (e.g., Barger et al. 1998;Hughes et al. 1998; Scott et al. 2002, 2010; Coppin et al. 2006;Bertoldi et al. 2007; Weiss et al. 2009; Ikarashi et al. 2011). Byexploiting the technical advances in the fabrication ofbolometer cameras, specifically the SCUBA-2 camera onJCMT, recent submillimeter surveys have been mapping thesky in an unprecedented speed (Casey et al. 2013; Chen et al.2013a, 2013b; Geach et al. 2013). Most recently, aninternational team completed the SCUBA-2 CosmologyLegacy Survey (S2CLS), undertaking panoramic surveys onsquare degree areas down to mJy sensitivity limits (see J. E.Geach et al. 2016, in preparation for a description of thesurvey).
To use these (sub)millimeter surveys to understand the causeof the rapid evolution of the ULIRG population and its relationto the galaxy populations seen both today and at earlier times, itis essential to reliably locate the counterparts to the (sub)millimeter sources at other wavelengths, necessary to under-stand the physical properties and astrophysics of these systems.However, the combination of the high dust obscuration in thesesystems, their high redshifts, and the coarse resolution of the(sub)millimeter maps (10″–30″ FWHM) provided by single-dish observatories makes this process challenging. Much of theearly work on the properties of high-redshift ULIRGs relied onidentifications based on indirect tracers of the FIR/submilli-meter emission such as the radio, near-IR (NIR), and mid-IR(e.g., Ivison et al. 1998, 2002; Smail et al. 2000; although seeDownes et al. 1999; Dannerbauer et al. 2002). Thesetechniques have been used to derive identifications for samplesof∼100 SMGs from a number of surveys (e.g., Popeet al. 2006; Biggs et al. 2011; Lindner et al. 2011; Michałowskiet al. 2012; Yun et al. 2012; Alberts et al. 2013), but are knownto be biased against identifying the highest-redshift ULIRGsowingto the absence of a negative K-correction in the radio orIR (e.g., Chapman et al. 2005).
Luckily, in parallel with the developments of new large-format (sub)millimeter bolometer cameras, the commissioningof the Atacama Large Millimeter Array (ALMA) and upgradesto the Submillimeter Array (SMA) and the Northern ExtendedMillimeter Array (NOEMA) have produced a similar advancein the capabilities of (sub)millimeter interferometers forstudying submillimeter sources (e.g., Gear et al. 2000; Dan-nerbauer et al. 2002, 2008; Iono et al. 2006; Tacconiet al. 2006; Wang et al. 2007, 2011; Younger et al. 2007,2008, 2009; Cowie et al. 2009; Aravena et al. 2010; Knudsenet al. 2010; Tamura et al. 2010; Chen et al. 2011, 2014; Bargeret al. 2012, 2014; Smolčić et al. 2012; Hodge et al. 2013;Ikarashi et al. 2015; Miettinen et al. 2015; Simpson et al.2015a, 2015b).
The first results from ALMA on the identifications of SMGcounterparts to submillimeter sources by Hodge et al. (2013)confirmed some of the biases and incompleteness arising fromthe use of radio and mid-IR, with ∼80% of SMGs correctlyidentified but with a completeness of just 45%. While suchinterferometric studies highlight the usefulness of obtainingidentifications in the submillimeter for SMGs, the limited timeavailable on these facilities means that it is currently time-
expensive to use them to map the very large samples of (sub)millimeter sources from the latest bolometer surveys. For thisreason we are driven back to using the indirect tracers.However, techniques that are used to select the counterpartcandidates can be investigated, trained, and improved by usingthe results of these interferometric observations.Here we present counterparts to the∼1000 submillimeter
sources that have been detected in the S2CLS 850 μm map ofthe UKIDSS Ultra-Deep Survey field (UDS). This is one of thewidest and most sensitive blank-field 850 μm surveys yetcompleted, with a median 1σ noise of 1σ= 0.9 mJy across ∼1deg2 (Geach et al. 2016, in preparation). The UKIDSS-UDSfield is an exceptionally well-studied region of the extragalacticsky with sensitive multiwavelength coverage of the ∼1 deg2region from the ultraviolet to mid-infrared and radio (seeSection 2 for references). Our analysis also takes advantage ofdeep ALMA Cycle 1 observations of a subset of thesubmillimeter sources in this region (Simpson et al. 2015a,2015b), which provide an invaluable resource for training anddeveloping new techniques to select the SMG counterparts tothe submillimeter sources detected in the low-resolution single-dish observations.The structure of the paper is as follows: In Section 2 we
describe the submillimeter survey of the UKIDSS-UDS field,along with the ancillary data from X-ray to radio that are usedin this study. Section 3 then describes the process, including thenovel OIRTC technique, developed for the identifications,which exploits the ALMA identifications of SMGs associatedwith a sample of the brighter submillimeter sources in the field.In Section 4 we present the catalog of counterpart candidatesand discuss their properties, while Section 5 gives oursummary. Throughout this paper we adopt the AB magnitudesystem (Oke & Gunn 1983), and we assume the Planckcosmology: H0= 67.77 km s−1 Mpc−1, ΩM= 0.31, andΩΛ= 0.69 (Planck Collaboration et al. 2014).
2. OBSERVATIONS, REDUCTION, ANDSUPPORTING DATA
2.1. SCUBA-2
The SCUBA-2 data at 850 μm in the UDS field were takenas part of the S2CLS. The full data reduction steps aredescribed fully in J. E. Geach et al. (2016, in preparation), butwe describe the main steps here. The Dynamical Iterative Map-Maker (DIMM) within the Sub-Millimeter Common UserReduction Facility (SMURF; Chapin et al. 2013) is used toextract astronomical signal from each SCUBA-2 bolometertime stream, mapping the result onto a celestial projection. AllS2CLS maps are projected on a tangential coordinate systemwith 2″ pixels.Flatfields are applied to the time streams using flat scans
that bracket each observation, and a polynomial baseline fit issubtracted from each time stream. Data spikes are rejected(using a 5σ threshold in a box size of 50 samples), DC steps areremoved, and gaps filled. Next, an iterative process begins thataims to fit the data with a model comprising a common modesignal, astronomical signal, and noise. The common modemodeling is performed independently for each SCUBA-2subarray, deriving a template for the average signal seen by allthe bolometers; it is removed from the stream, and anextinction correction is applied (Dempsey et al. 2013). Next,a filtering step is performed in the Fourier domain, which
2
The Astrophysical Journal, 820:82 (23pp), 2016 April 1 Chen et al.

rejects data at frequencies corresponding to angular scalesθ>150″ and θ<4″. Finally, a model of the astronomicalsignal is determined by gridding the time streams onto acelestial projection (since a given sky position will have beenvisited by many independent bolometers) and then subtractedfrom the input time streams. The iterative process continuesuntil the residual between the model and the data converges.
The last processing step is to apply a matched filter to themaps, convolving with the instrumental point-spread function(PSF) to optimize the detection of point sources. We use thePICARD recipe scuba2_matched_filter, which first smooths themap (and the PSF) with a 30″ Gaussian kernel andthensubtracts this from both to remove any large-scale structurenot eliminated in the filtering steps that occurred duringthe DIMM reduction. The map is then convolved withthe smoothed beam. A flux conversion factor of591 Jy beam−1 pW−1 is applied; this canonical calibration isthe average value derived from observations of hundreds ofstandard submillimeter calibrators observed during theS2CLS campaign (Dempsey et al. 2013)and includes a10% correction necessary to account for losses that occur as aresult ofthe combination of filtering steps we apply to thedata (see Geach et al. 2013). The flux calibration is expectedto be accurate to within 15%.
The final matched-filtered map has a noise of 0.82 mJybeam−1 at the deepest part and better than�1.3 mJy rms over∼1.0 deg2 (a ∼1°.1 diameter circle). The coverage is relativelyuniform, and the median depth within this region is 0.89 mJybeam−1 (Figure 1).
We apply a simple source detection and extractionalgorithm, described in more detail in J. E. Geach et al.(2016, in preparation). In brief, we apply a top-down detection
algorithm, first identifying the peakpixel in the signal-to-noiseratio (S/N) map, recording position and flux and instrumentalrms,and then subtracting a peak-scaled model of the PSF atthis position. The next peak value is identified and the processrepeated until a floor S/N threshold is met, which we setto 3.5σ.In total we detect 1088 submillimeter sources at�3.5σ
within the region where rms noise is�1.3 mJy beam−1. Wedefine a MAIN sample of 716 submillimeter sources thathave�4.0σ, for which we expect a false detection rateof∼1% based on simulations and source extractions onnegative signals (J. E. Geach et al. 2016, in preparation). Wealso define a SUPPLEMENTARY sample of 372 submiliimetersources that are detected at 3.5σ–4.0σ and have a falsedetection rate of ∼10%. In this paper, we provide counterpartcandidates for both MAIN and SUPPLEMENTARY samples;however,the scientific analyses were performed on the MAIN sample.The maps are corrected for astrometry by adopting a shift of
0 67 in R.A. and −2 33 in decl., based on stacking of the850 μm maps at the location of the radio sources. We have alsostacked on the 850 μm maps centered on the MIPS and K-bandsources and found consistent results.
2.2. ALMA
We have carried out ALMA follow-up observations at870 μm on 30 of the brighter SCUBA-2 sources in a Cycle 1project 2012.1.00090.S (Simpson et al. 2015a, 2015b). Thesesources were selected to have S850�8 mJy from an earlierversion of the S2CLS map, but the sensitivity of the map hassince improved, and as a result, 27 of the 30 ALMA targets stillremain in our MAIN sample. Two of the three ALMA-observed
Figure 1. Overview of S2CLS-UDS. Left:matched-filtered S2CLS SCUBA-2 850 μm flux density map of the UKIDSS-UDS field, linearly scaled between −1 and5 mJy. The green circle roughly outlines the survey area with a ∼1°. 1 diameter, ∼4× larger than the previously largest 850 μm uniform survey in a single field—theLABOCA survey in the ECDFS (LESS; Weiss et al. 2009). For comparison, the size of LESS is shown in the white dashed box. Right: color plot showing the rmsvalues of the matched-filtered S2CLS map, linearly scaled between 0.82 and 1.3 mJy beam−1. White contours are at 0.85, 1.0, and 1.15 mJy beam−1. Green pointsmark our 716 � 4σ detections in the MAIN sample. Our SCUBA-2 map is ∼40% deeper in sensitivity and has spatial resolution ∼30% higher compared to LESS,yielding an SMG sample ∼6× bigger than the LESS survey and making the S2CLS-UDS the largest uniform 850 μm survey by far.
3
The Astrophysical Journal, 820:82 (23pp), 2016 April 1 Chen et al.

sources that fall out of our MAIN sample (UDS252, UDS421)have no detection in the high-resolution ALMA observations,but both are detected in Herschel/SPIRE imaging, while theremaining one (UDS298) is just below the 3.5σ cut and theSCUBA-2 flux is consistent with the integrated flux of the twoALMA detections (Simpson et al. 2015b). With a median rmsof σ= 0.26 mJy beam−1, the primary ALMA catalog consistsof 52 SMGs detected by ALMA at>4σ, with a synthesizedbeam of∼0 8 FWHM. Higher-resolution versions of the maps,with ∼0 3 FWHM, were used by Simpson et al. (2015a) tostudy the sizes and light profile of the brighter SMGs at870 μm, while the descriptions of the bright source counts andthe data reduction and source extraction can be found inSimpson et al. (2015b). In this paper, we use these ALMA-detected SMGs as the training set to formulate our methodol-ogy to identify candidatecounterparts for the rest of theSCUBA-2 SMG sample. Note that although the ALMAobservations were conducted at a slightly different wavelengthcompared to the selection wavelength from SCUBA-2 (870versus 850 μm), the difference in flux measurements isexpected at the∼5% level, which is negligible compared tothe flux calibration error. Throughout this paper, we thereforedenote S850 as the fluxes that are measured at both 850 and870 μm.
2.3. Multiwavelength Ancillary Data
The∼1 square degree UDS field contains a rich set ofancillary data. Figure 2 roughly outlines the coverage of eachindicated waveband.
The K-band-based multiwavelength photometry adopted inthis paper is based on the UDS data release 8 (DR8) of theUKIRT Infrared Deep Sky Survey (UKIDSS; Lawrenceet al. 2007). The UDS field is the deepest of the fivesubsurveys of UKIDSS, consisting of four Wide-FieldCamera (WFCAM; Casali et al. 2007) pointings, covering0.77 square degrees in J, H, and K bands. The DR8 releasecontains all UDS data taken from 2005 to 2010. The 5σmedian depths are J= 24.9, H= 24.2, and K= 24.6 (in a2″ diameter aperture). Detailed descriptions of mosaicking,catalog extraction, and depth estimation will be presented in Almaini et al. (2016, in preparation). After maskingbad regions andremoving bright stars and image artifactsproduced by amplifier cross-talk, a K-band parent sample of atotal of 159,871 sources was constructed for our analyses.The UDS field was observed by the Subaru telescope using
the Suprime-Cam in five broadband filters, B, V, Rc, i′, and z′,to the limiting depths of B= 28.4, V= 27.8, Rc= 27.7,i′= 27.7, and z′= 26.6, respectively (3σ, 2″ diameter aper-tures). Details of the Suprime-Cam survey are provided inFurusawa et al. (2008). The field was also covered by theMegacam u′-band on the Canada–France–Hawaii Telescope(CFHT), with a 5σ depth reaching u′= 26.75 in a 2″ diameteraperture. The X-ray data were obtained as part of the Subaru-XMM/Newton Deep Survey (SXDS), consisting of sevencontiguous fields with a total exposure of 400 ks in the0.2–10 keV band (Ueda et al. 2008). Finally, the UDS field wasimaged in mid-infrared with IRAC and 24 μm MIPS by theSpitzer Legacy Program SpUDS. SpUDS data reach 5σ depthsof 24.2 and 24.0 AB magnitude at 3.6 and 4.5 μm.Eleven-band photometry (UBVRIzJHK[3.6][4.5]) was
measured with 3″ diameter apertures placed on each alignedimage at the position of the K-band sources, motivated by thefact that Kband is generally a good stellar mass indicator thatis less affected by dust compared to other optical/NIR bands,with a data quality that is deeper and has a higher angularresolution compared to that of the IRAC bands. To accountfor the correlated noise that is not represented in the weightmaps, the magnitude uncertainties estimated by SEXTRACTOR
are corrected by scaling the weight maps such that theuncertainty in source-free regions matches the rms measuredfrom apertures placed on the science image. Three of thebands (the CFHT u′ band and the two IRAC channels)required aperture corrections to their photometry in order toobtain correct colors. This correction was performed based onsmoothing the K-band images to the appropriate PSF andrecomputing the aperture photometry to evaluate theexpected changes. More details can be found in Hartleyet al. (2013).Photometric redshifts (zphoto) have been derived for the DR8
parent sample, and the full description can be found in Hartleyet al. (2013) and Mortlock et al. (2013). In summary, thephotometric redshifts are estimated using the EAZY template-fitting package (Brammer et al. 2008) through a maximumlikelihood analysis. The default set of six templates does notsufficiently represent all of our galaxies, in particular, the u′-band flux is significantly overestimated on the blue objects athigh redshift. A seventh template is therefore constructed byapplying a small amount of Small-Magellanic-Cloud-likeextinction (Prevot et al. 1984) to the bluest template in EAZY.To assess the accuracy of these photometric redshifts and to
determine the cut on the χ2 from the templatefitting, we
Figure 2. Multiwavelengthcoverage of K-band, Spitzer, and VLA in the UDSfield, overlaid on the SCUBA-2 field shown as the black background. Similarto Figure 1, the points mark the positions of our 716 � 4.0σ MAIN SCUBA-2sample, while those enclosed with white circles were observed in our Cycle 1ALMA program. Among the MAIN sample, all but the rightmost two in thefigure (brown; Class = 3 sources) are covered by the radio imaging, andthemajority (73%) of them have optical–NIR coverage suitable for our novelOIRTC technique (cyan; Class = 1 sources), with at least two colormeasurements available among z−K, K−[3.6], and [3.6]−[4.5] (seeSection 3.3). The yellow points are Class = 2 sources that are covered by theradio imaging but not suitable for the OIRTC technique (formore aboutclassifications see Section 4.1).
4
The Astrophysical Journal, 820:82 (23pp), 2016 April 1 Chen et al.
compare the derived values to the spectroscopic redshifts (zspec)that are available in the UDS. A large fraction of these zspeccame from the UDSz, a European Southern Observatory largespectroscopic survey (ID:180.A-0776; Almaini et al. 2016, inpreparation) and also from the literature (see Simpsonet al. 2012 and references therein). After excluding brightX-ray and radio sources that are likely to be active galacticnuclei (Simpson et al. 2006; Ueda et al. 2008), there are 2745sources with measured spectroscopic redshifts (zspec). If weonly consider 2,461 sources that have χ2<10 in the zphotofitting, we find thata dispersion in (zphoto−zspec)/(1+zspec),after excluding outliers (Δz/(1+zspec)>0.15;<4%), is Δz/(1+zspec)∼ 0.02, slightly better than what was found inHartley et al. (2013). We therefore apply a χ2 cut of 10in thispaper.
For the 24μm MIPS image, we use SEXTRACTOR (Bertin &Arnouts 1996) to extract sources. Following Shupe et al.(2008), the local background is estimated using a box with128× 128 pixels with a pixel size of 1 2, which then is usedto weight the source extraction. Given thatMIPS has a beamFWHM of ∼6″ at 24 μm, we expect most extragalacticsources to be unresolved and so to appear as point sources.We thus set the detection threshold to be 20 connected�2σpixels (1 beam area). This selection corresponds to a ∼4σpoint-source detection. In total,we detect 12,127 24 μmsources within the SCUBA-2 coverage. We estimate thenumber of false detections by inverting the map andextracting the negative sources using the same detectionparameters. We find the false detection rate to be -
+0.03 0.020.04%,
consistent with a ∼4σ detection, which increases to 0.1% ifwe account for sources close to the edge of the 24 μm map.We measure photometry in a 15″-diameter aperture. Weestimate the aperture correction by median stacking theunsaturated bright stars and compute the curve of growth.We find an aperture correction factor of 1.5, consistent withthe MIPS maps in the SWIRE fields (Shupe et al. 2008). The1σ uncertainty is 24 μJy, estimated using a 7 5-radiusaperture in the source-free regions.
The VLA radio observations at 1.4 GHz (20 cm) werecarried out by the project UDS20 (V. Arumugam et al. 2016, inpreparation), which comprises a mosaic of 14 pointingscovering a total area of∼1.3 deg2 centered on the UDS. Allbut two�4σ SCUBA-2 sources are covered by the VLA map(Figure 2). The total integration time is ∼160 hr in A, B, and C–D configurations, yielding a nearly constant rms noiseof∼10 μJy across the full field (<8 μJy at the field center)and a beam size of 1 8 FWHM. A total of∼7000 sources aredetected above 4σ. The full descriptions of the observations,data reductions, and the catalog are presented in V. Arumugamet al. (2016, in preparation).
3. COUNTERPART IDENTIFICATION
In this section, we utilize the sample of 52 ALMA-detectedSMGs with S850 1.0 mJy from Simpson et al. (2015a, 2015b)found in the vicinity of 30 of the brighter SCUBA-2 sources inthe UDS to test various counterpart identification methods thatare widely used in the literature. We also use this training set todevelop a novel optical–NIR color method to supplement thetraditional radio selection. We then apply the counterpartidentification methodology to the whole sample of SCUBA-2submillimeter sources.
The main parameters we consider in the tests and the trainingare accuracy and completeness, which are defined as
= ´
= ´
N
NN
N
Accuracy 100%
Completeness 100%,
confirmed
selected
confirmed
total
where Nselected is the number of selected candidate counterpartsbased on the selection methods, Nconfirmed is the number ofselected candidates that are actually confirmed by ALMAbased on the training set, and Ntotal= 52 representsthe totalnumber of the ALMA-detected SMGs. The decision of the beststrategy is made by maximizing the product of both parameters,and the quoted errors are Poisson if not specifically stated.
3.1. Radio Identifications
We first test the use of radio sources to locate SMGsassociated with submillimeter sources selected from low-resolution, single-dish submillimeter surveys (e.g., Ivisonet al. 1998, 2002, 2005; Lindner et al. 2011). This approachutilizes the corrected-Poissonian probability, or the p-values, toestimate the likelihood of radio sources being a random chanceassociation to the submillimeter sources. The calculation of thep-value is described in Downes et al. (1986) as
p q= - -p n1 exp , 12( ) ( )
where n represents the radio source density and θ is the angularoffset between the radio and the submillimeter source. A matchistypically considered reliable if p<0.05 (e.g., Ivison et al. 2002;Pope et al. 2006; Chapin et al. 2009; Yun et al. 2012).We investigate the accuracy and completeness of the radio
counterpart identifications for ALMA-detected SMGs that arelocated within the ALMA primary beam (8 7). To account for allpossible counterparts to the single-dish submillimeter sources, wedo not scale our search radius as a function of the SCUBA-2detection S/N in calculating p-values, as has been done in someprevious work (e.g., Biggs et al. 2011). This is motivated bystudies showing that owingto the fact that single-dish-detectedSMGs tend to break into multiple subcomponents in high-resolution follow-up observations, the separation between thesubcomponents and the corresponding single-dish source doesnot correlate with the S/N of the single-dish detection (Hodgeet al. 2013). This result suggests that employing a fixed searchradius, instead of an S/N-dependent radius, during the process ofidentifying candidate counterparts may be a better strategy. Note,however, that Simpson et al. (2015b) found that by convolvingthe ALMA maps with the SCUBA-2 beam, the radial separationbetween the convolved ALMA map centroid and the SCUBA-2source is indeed a function of the S/N of the SCUBA-2 detectionand consistent with Gaussian distribution.Among the 52 ALMA SMGs in the training set, we found 27
that have radio counterparts matched to 1 5. While all 27 ofthem have p< 0.1, 23 have p< 0.05 (the canonical value usedin the literature to select “robust” SMG counterparts). On theother hand, if we look at all30 radio sources located within theALMA primary beam, 24 of them have p< 0.05. As a result,the accuracy of identifying SMG counterparts using radiosources with p< 0.05 is -
+92 278 % (22/24),15and that by using
15 Two ALMA SMGs, UDS 156.0 and UDS 156.1, are matched to the sameradio source.
5
The Astrophysical Journal, 820:82 (23pp), 2016 April 1 Chen et al.

all radio sources (in this case p< 0.1) is only slightly lower at-+87 23
13% (26/30). In fact, the accuracy ranges between 85% and100% if we adopt any choice of p below p= 0.1 as theselection criterion, with no statistical difference (Figure 3).Although the accuracy is indeed lower for radio-identifiedcounterparts with p= 0.05–0.1 at -
+66 4334%, the result suffers
from small number statistics and the difference is insignificant.In addition, these high-p sources are generally located fartheraway from the pointing center (the centroid of the SCUBA-2source), and the decrease in ALMA sensitivity for thesesources due to primary beam coverage could be the cause ofthis slight but insignificant drop in accuracy.
On the other hand, we find that the majority (88-+
2512%; 23/
26) of the ALMA-confirmed radio identifications are theprimary SMGs in the ALMA maps, defined as those brightestALMA detections, which are found to dominate and contributeon average of∼75% of the total flux measured by SCUBA-2(Simpson et al. 2015b), although 18%±9% (5/28) of theprimaries are not detected in the radio imaging.
In summary, we conclude that, at p<0.1, the accuracy ofthe radio identifications does not appear to depend on the p-value, and taking all radio sources within the ALMA primarybeam as the SMG counterparts actually yields better complete-ness (27 out of 52; 52%± 12%) and an overall identificationperformance by maximizing the product of accuracy andcompleteness.
3.2. MIPS 24 μm Identifications
We conduct a similar test of the p-value method using the24μm MIPS counterparts. We found that of the 52 ALMA
SMGs, there are 21 that have MIPS counterparts matched towithin 2″, and among them 10 have p< 0.05. There are 27MIPS sources in total located within the ALMA primary beamsof the 30 submillimeter sources, 14 of which have p< 0.05. Thepercentage of p< 0.05 MIPS sources thatare confirmed SMGsis -
+71 3029% (10/14), and that of all MIPS sources is -
+78 2322% (21/
27). This is a slightly lower rate than for the radio, reflecting thedifferent strengths of the correlations between the radio and mid-IR emission to the FIR/submillimeter, as well as the differinglevels of contaminations from foreground populations. More-over, the FWHM of the 24 μm MIPS images is 6″, much worsethan that of the radio maps, and in this case source blendingbecomes an issue. Deciding to what extent to match MIPSsources to the ALMA SMGs is not straightforward. Byexpanding the matching radius to 3″, almost all (24/27) MIPSsources are matched to at least one ALMA-identified SMG.However, we find that by detailed comparison of the imagessome of these MIPS sources are not correct counterparts. For thisreason we chose 2″ as a good balance to match most of theobviously correct counterparts without including many spuriousones. In the right panels of Figure 3 we show that, similar to theradio counterparts, the accuracy of the MIPS counterparts doesnot depend on the p values, and again, the completeness issignificantly improved if one includes all MIPS sources that arelocated within the ALMA primary beam. We stress thatchanging the matching radius does not affect this result.
3.3. Optical–IR Triple Color (OIRTC)
Previous studies have shown that SMGs are in general red inoptical–NIR (OIR) colors such as i−K, J−K(DRGs),
Figure 3. Left: the upper panel shows a plot on the radio flux vs. the p-value of all 52 ALMA-detected SMGs in the UDS field (Simpson et al. 2015b), with upperlimits given for SMGs without radio counterparts to within 1 5. We identify where the SMGs are the primary source, meaning that they are the brightest sources ifthere are multiple detections in the ALMA maps, as well as where they are fainter than the brightest SMG in the map. Single detections are counted as primaries, andwe also indicate the radio sources that are not detected in the ALMA imaging. The lower panel shows the accuracy and completeness of the identifications to all 52SMGs and the combined product of accuracy and completeness for sources with p lower than specified values on the abscissa. Right: same as the left panels, but onMIPS 24 μm sources.
6
The Astrophysical Journal, 820:82 (23pp), 2016 April 1 Chen et al.

andK−[4.5] (KIEROs) (e.g., Smail et al. 2002; Dannerbaueret al. 2004; Frayer et al. 2004; Wang et al. 2012), suggestinghigh-z and dusty nature. OIR color cuts had therefore been usedto identify potential counterparts (e.g., Michałowskiet al. 2012). However, while adopting single color cuts mightselect SMGs, the contaminations from the field sources canalso be large. Color–color cuts, or characteristic densitydistribution, based on the Spitzer mid-IR observations havebeen proposed and used (Yun et al. 2008; Alberts et al. 2013;Umehata et al. 2014). However, the training set for the mid-IRcolor–color techniques isheterogeneous, usually mixing withradio-, CO-, or SMA-identified SMGs, and the true accuracyand completeness of each technique are hard to understand.Armed with our ALMA data, which are based on a flux-limitedSCUBA-2 sample, we can start looking into the best methodusing OIR colors to select SMGcounterparts.
To separate SMGs from non-SMG field galaxies usingmultiwavelength photometry, we constructed a training setbased on the results of our ALMA follow-up observations,which targeted 30 brighter SMGs selected in the UKIDSS-UDSfield. We first selected all K-band sources located within theALMA primary beam (17 4 FWHM) centered on the ALMApointings;we then matched the K-band sources to the ALMA-detected SMGs presented in Simpson et al. (2015b) to within1″ radius. By excluding one ALMA-detected SMG that islikely to be lensed by a nearby foreground source and thereforehas its photometry contaminated (UDS286.0; Simpson et al.2015a), in total the training sample comprises 164 K-bandsources, of which 30 out of 52 (∼60% of the ALMA-detectedSMGs) have S850> 1.5 mJy. However, taking the primarybeam correction into account, our ALMA observations are onlysensitive to sources with S850� 2.7 mJy across the full ALMAprimary beam. To make a clean comparison and to derive ourmodel to separate SMGs from field galaxies, out of the 30SMGs in the training sample, we only include the 22 that haveS850� 2.7 mJy as SMGs, and the rest with S850< 2.7 mJy areregarded as part of the non-SMG comparison sample.
One way to identify possible parameters that can be used toseparate SMGs from non-SMG field galaxies is to search forcorrelations between S850 and the chosen parameters. In orderto do so, we use the maximal information coefficient (MIC)statistics of the MINE package (Reshef et al. 2011) todetermine the relative strength of the correlations betweenS850 and the other source colors (for both ALMA-detected andALMA-undetected sources)and to identify the primary criteriathat isolate SMG counterparts from the contaminating fieldpopulation located within the ALMA primary beam. Theadvantage of MIC over other correlation coefficients (such asPearson and Spearman) is that it can identify nonlinearrelationship types, such as exponential or sinusoidal relation(Reshef et al. 2011).
We select the following colors to search for correlations toS850 (assigning zero flux to non-SMG comparisons): (U−V),(V−J), (B−z), (z−K), (K−[3.6]), ([3.6]−[4.5]). Note thatwe only consider measurements that have at least 3σ detectionsin both bands used in the color. The best correlation is found inthe (z−K) color, followed by ([3.6]−[4.5]), (K−[3.6]), (B−z), (V−J), and (U−V).16 In Figure 4 we compare the
histogram of the SMGs and the non-SMG comparisons in eachcolor. Indeed, the better the correlation in the MIC statistics, thebetter the separation between the two populations, as revealedin the higher fractions of SMGs in the redder colors,quantitatively expressed as the SMG fraction (fOIRTC).
=f N Ni i i,OIRTC ,SMG corresponds to the fraction of SMGs tothe total number of sources in each color bin i. The errors offOIRTC are estimated through Monte Carlo simulations, inwhich we derive standard deviation of theSMG fraction with100 realizations of randomly populated data points based ontheir measured colors and errors, and the results are shown inthe upper panels of Figure 4.In the three best-correlated colors (z−K), (K−[3.6]), and
([3.6]−[4.5]), SMGs are mostly located in the redder part ofthe color space. At a typical SMG redshift, z∼ 2, these colorscorrespond to roughly rest frame (U−R), (R−J), and(J−H), suggesting that both the Balmer/4000 Å break anddust extinction could be the cause of SMGs being red in thesecolors (Simpson et al. 2014). Indeed, in Figure 5 we plot therest-frame UVJ color diagram of the UDS sample along withthe sources that are selected based on these three OIR colors(OIRTC; described below)and find that OIRTC-selectedsources are located in the regions where high AV is expected.Moreover, >99% of the OIRTC-selected sources are locatedat z>1.Next, motivated by the distinct red color space that SMGs
occupy in (z−K), (K−[3.6]), and ([3.6]−[4.5]), we plotthree-dimensional (3D) color–color–color along with two-dimensional (2D) color–color diagrams in Figure 6. Interest-ingly, while the contamination fraction from the field sources isat best ∼30% in the single color histograms (reddest bin inz−K; Figure 4), the 2D and 3D color diagram efficientlyremove most of the contaminants, revealing the red nature ofSMGs as they are mostly clustered in the reddest color space.We note that the fainter SMGs with S850<2.7 mJy haveconsistent colors to their brighter counterparts, except[3.6]−[4.5], in which the fainter SMGs are bluer (mediancolor 0.25± 0.03 versus 0.46± 0.04).To select SMGs, by considering the product of accuracy and
completeness, we propose the following triple-color cut:
- > -> - >z K K1.1 3.6
1.25 3.6 4.5 0.22,( ) ( [ ])
([ ] [ ])
where ∧ is the logical AND symbol. This triple-color cut worksthe best if the source has at least two color measurements.Based on the training sample, the triple-color cut successfullyselects an SMG -
+86 2414% (24/28) of the time and has a
completeness of 46%±11% (24/52).While color cuts are easy to adopt, they do not consider
information on the errors in the color measurements, and theselected cuts are somewhat arbitrary. Below we employ adifferent approach, the OIRTC technique, whichaccounts forthe uncertainties of the color measurements, and define cuts ina quantitative way.The SMG fraction (fOIRTC) shown in Figure 4 represents the
fractional number density in each color bin, and its calculationtakes color errors into account, as the uncertainties of fOIRTC areobtained through Monte Carlo simulations. By describingfOIRTC with model functions and calibrating the training setwith those models, it is possible to determine cuts in aquantitative way.
16 We also note that the MIC analysis identifies radio emission as a powerfulindicator of the correct ALMA counterpart, while indicating that MIPS 24 μmemission provides no statistically compelling indication of the correctidentification.
7
The Astrophysical Journal, 820:82 (23pp), 2016 April 1 Chen et al.

We therefore first model fOIRTC as a function of color byfitting a functional form, parameterized as + - -a e1 b x c( )( ) , inwhich x is the corresponding color. The parameterization issimilar to the Fermi–Dirac distribution, which provides anappropriate description to the distribution of the measuredfOIRTC, where the fractions on both sides of the color spaceconverge, connecting by a smooth transition in between. Whenthe colors are very red, the function converges to 1/a, and to 0when the colors are very blue. The parameter b describes thesharpness of the transition, whereas the parameter c gives thecolor at which the value equals 1/(a+1). The best-fit forms ofthis function are shown in Figure 7, which all fit the distributionswell (χ2 1), and we have confirmed that they are not sensitiveto the chosen binning. The fitting results are given in Table 1.
Based on the best-fit parameterized model, we then calculatethe weighted-mean SMG fraction, á ñfOIRTC , defined as
åå
á ñ =´
ff W
W, 2i i i
i iOIRTC
,OIRTC ( )
where i= z−K, K−[3.6], [3.6]−[4.5]and s=W Ni i i2
represents the weight of each color, and Ni= 148, 161, and147, respectively, is the number of available measurements inthe training set for each color. As a result ofthe sensitivity andcoverage of the imaging, 80% (132/164) of the training samplehave all three colormeasurements (i.e.,�3σ detections in bothbands used in the color), and three field sources have only oneor none. Thus, the mean SMG fraction is weighted, for eachcolor, by both the model uncertainties and the number ofavailable measurements in the training sample. Because of thenature of this training sample, when applying the OIRTCtechnique to identify candidate counterparts in the wholeSCUBA-2 sample, we only consider sources that have at leasttwo color measurements.Based on the best-fit models, we derive á ñfOIRTC based on the
color measurements of every source in the training sample, andwe plot the results in Figure 8. We find that, within the trainingsample, the mean SMG fraction of á ñ =f 0.05OIRTC best
Figure 4. Lower section in each subpanel: histograms in each specified color of the training sample, which are 164 K-band sources that are located within the primarybeam of our 30 ALMA observations in the UDS (Simpson et al. 2015b), with red representing the 22 SMGs with S850 > 2.7 mJy that have matches to the K-band sourceswithin 1″. The non-SMG field sources are shown in blue. Upper panels in each subpanel:SMG fraction as calculated by dividing the number of SMGs bythe total numberof sources in each color bin. The errors are estimated through Monte Carlo simulations, in which we derive thestandard deviation of theSMG fraction with 100realizations of randomly populated data points based on their measured colors and errors. Distinct color distributions between SMGs and field sources are found in (z−K),(K−[3.6]), and ([3.6]−[4.5]), which are used to develop our OIRTC technique (Section 3.3). At a typical SMG redshift, z ∼ 2, these colors correspond to roughly restframe (U−R), (R−J), and (J−H), suggesting thatboth the Balmer/4000 Å break and dust extinction could be the cause of SMGs being red in these colors.
8
The Astrophysical Journal, 820:82 (23pp), 2016 April 1 Chen et al.

separates the SMG and non-SMG populations, if we maximizethe product of accuracy and completeness. Above the cut of theá ñ =f 0.05OIRTC , the accuracy of correct SMG identification is
-+87 23
13% (27/31), and the completeness is 52% ±12% (27/52).Interestingly, although we only used SMGs withS850� 2.7 mJy to derive models of the SMG fraction, themodel is equally successful in identifying fainter SMGs, inwhich 75% (6/8) are above the cut. While tentative evidence ofbluer colors for SMGs with S850 1 mJy has been reported byHatsukade et al. (2015), we find that in the S850 1 mJy regimethere are no strong color variations among SMGs with differentfluxes. Furthermore, those non-SMG comparisons with highá ñfOIRTC could also be faint SMGs with S850< 2.7 mJy that areundetected by ALMA because they are located in the outskirtsof the ALMA pointings, where the sensitivity is slightly poorer.
In summary, the OIRTC technique performs slightly betterthanthe triple-color cut in both accuracy and completeness,although subject to the size of the training sample, thedifferences are not statistically significant. We neverthelessadopt the OIRTC technique as the main method for selectingSMGs using optical–infrared colors as it performs the best inthe training set. We note that our basic results are not sensitiveto the chosen method.
3.4. Our Methodology: Radio+OIRTC Identifications
The test results shown in Sections 3.1–3.3 are summarized inTable 2, which demonstrate that the accuracy of both radio andOIRTC identification is 87%, while the MIPS identification isless accurate, with an additional issue of larger positionaluncertainty. In addition, as hinted in Figure 8, the radio andOIRTC selections compliment each other in identifying SMGsin different flux ranges—at S850>6 mJy five SMGs can onlybe identified by radio, while all the SMGs that can be selectedby theOIRTC techniquebut are missed in radiohaveS850<6 mJy.
In Figure 9 we plot the 850 μm flux distribution of theALMA SMGs, in which the subsamples of SMGs identified by
different methods are highlighted. Indeed, we find that whilethe radio sources preferentially identify brighter SMGs, thecolor analysis picks up fainter ones, and MIPS-identified SMGshave S850 in between, as revealed in the median flux of SMGseach method identifies. By combining the radio sources and theOIRTC technique, we are able to identify 35 out of 52 ALMASMGs (67%± 14% completeness), with the accuracy of
-+83 19
17% (35/42). We emphasize that of all52 ALMA-detectedSMGs, 14 have no counterpart in any of our ancillary images.In other words, the radio+OIRTC can identify all but three(92%; 35/38) ALMA SMGs,which canpossibly be identifiedin other wavebands. We also find that all but one of the MIPS-identified SMGs can be selected through either radio oroptical–IR color. In addition to the lower positional accuracy ofMIPS sources, adding them into the counterpart selectionmethod does not provide better results considering bothaccuracy and completeness.As a result of this analysis, in this study we adopt the radio
+OIRTC technique as our major tool to identify the candidateSMG counterparts of SCUBA-2-detected submillimetersources. Operationally,this involves us taking all the radiosources that are matched to the submillimeter sources to within8 7, supplemented by the radio-undetected, K-selected sourcesidentified using the OIRTC technique as candidate SMGcounterparts. The chosen search radius of 8 7, based on thetheoretical calculations assuming Gaussian distribution(σ∼0.6 (S/N)−1 FWHM; Ivison et al. 2007), corresponds toa 4σ positional uncertainty for a 4σ SCUBA-2 detection (14 5FWHM). The search radius of 8 7 also matchesour ALMAprimary beam, within which the training set is obtained.
3.4.1. Testing Our Identification Methodology
We test our counterpart identification technique on twoindependent samples that are obtained from ALMA and SMAobservations. The first sample of 12 is based on the SMAobservations on nine of our MAIN SCUBA-2 sources (noneoverlapwith the ALMA targets). The rms noise rangesbetween σ= 1 and2 mJy beam−1, with a synthesizedbeam∼2″ FWHM (Chapman et al. 2016, in preparation). Thesecond test sample is the ALESS MAIN sample with 99 ALMA-detected SMGs, constructed by an ALMA follow-up study at870 μm on a flux-limited sample of 126 single-dish submilli-meter sources detected on the LABOCA maps in the ExtendedChandra Deep Field South (ECDFS; Hodge et al. 2013). TheALESS observations have a median rms of σ ∼0.4 mJy beam−1, with a synthesized beam of ∼1 6 FWHM.For the SMA sample, by excluding one source that is
associated with a Class= 2 SCUBA-2 source (UDS.0010;although that source is accurately predicted by our identifica-tion method), we successfully identify 6 out of 11 sources(completeness= 55%± 28%) with an accuracy of -
+70 3430% (7/
10). While the SMA sample might be too small, bothcompleteness and accuracy are consistent with our trainingresults.To compare to the second test sample, we first take the
IRAC-based photometric catalog of sources in ECDFS fromSimpson et al. (2014). This includes 13-band photometry fromthe Uband to 8 μm and derived photometric redshifts usingHYPERZ (Bolzonella et al. 2000) for∼45,000 sources in thewhole field. We then take those sources lying within theALMA primary beam centered at the positions of the 88 LESSsubmillimeter sources from Weiss et al. (2009) for which there
Figure 5. Rest-frame UVJ diagram for z>1 sources. The red points representthe sources that are selected by the OIRTC technique, and thegrayscalebackground shows the density of the field galaxies in UDS, with higher densitycorresponding to darker color. Note that the pattern of the distribution isquantized owingto the EAZY template fitting for deriving zphoto (Section 2.3).This is to show that themajority of the OIRTC-selected sources are at z>1and occupy the color regions in which high dust extinction is expected.
9
The Astrophysical Journal, 820:82 (23pp), 2016 April 1 Chen et al.

are good-quality ALMA maps from Hodge et al. (2013). Thisyields a total of 326 sources, and we match these to the ALESSmain sample to within 1 5 radius. This yields 64 ALESSSMGs with IRAC counterparts and 262 non-SMG sources. Wealso match to this catalog the catalog of 1.4 GHz VLA� 5σradio sources from Biggs et al. (2011). Finally, we generate acounterpart candidate catalog based on our radio+OIRTCtechnique, in which we find an accuracy of 82% ±17% (40/49) and completeness of 40%±8% (40/99), which areconsistent with the robust identifications based on the p-valuespresented in Biggs et al. (2011) (Hodge et al. 2013).
This test result is very encouraging considering that theOIRTC model is derived based on our K-selected trainingsample in UDS, completely different fromthe IRAC-selectedphotometric sample in ECDFS, yet our empirical method yieldsmatched results to that based on the p-values. Perhaps moreimportantly, as theALESS SMGs have fainter 850 μm fluxes(median flux of S850= 2.5 mJy versus S850= 4.2 mJy for theALMA-UDS sample), the equally high success rate for theALESS sample suggests that the radio properties and/or theOIR colors do not vary significantly as a function of 850 μmfluxes. This result reassures us that our method does not sufferfrom a bias owing to the fact that the ALMA training sample isbiased toward brighter SCUBA-2 sources.
A slightly lower completeness on ALESS, on the other hand,is caused by the fact that there are more fainter SMGs, whichare more likely to have no detectable counterpart. The findingof a different completeness in ALESS compared to that of ourALMA training sample also highlights the fact that the depth ofthe ancillary data affects the completeness of theidentifications.
3.4.2. What Are We Missing?
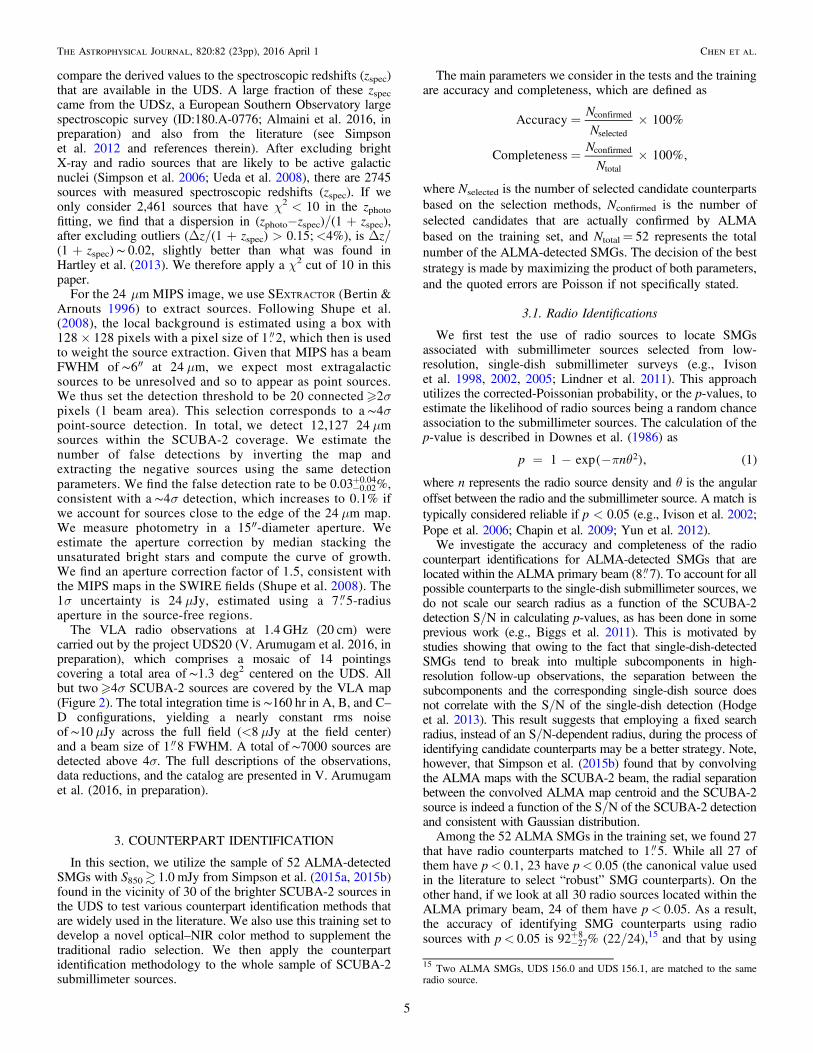
Before we proceed and discuss the scientific implications, itis important to understand what SMGs are missed by ouridentification process. In Figure 10 we plot the expected fluxdensities of an SMG as a function of redshift at 2.2 μm, 24 μm,850 μm, and 20 cm. We adopt an SED shape based on theCosmic Eyelash, a strongly lensed SMG with a typical intrinsicS850 similar to that of the SMGs we are probing (Swinbanket al. 2010), normalized to a total star formation rate (SFR) of500Me yr−1 (unlensed S850∼3 mJy) assuming a Salpeterinitial mass function. We also plot the results based on thecomposite rest-frame SED of the ALESS SMGs (Simpson et al.2014; Swinbank et al. 2014).First of all, as the SEDs are matched to the same LIR, it is not
surprising that both SEDs have similar 850 μm and radio fluxesas a function of redshift. However, ALESS SMGs have
Figure 6. Triple-color (topleft) or color–color diagrams in z−K, K−[3.6], and [3.6]−[4.5]. The large circles are SMGs, color-scaled based on their S850, and bluedots are field sources. The top and left panels in the color–color diagrams are histograms in each specified color, normalized to the total number of sources in eachcategory, with assigned colors that are the same as those in Figure 4. The SMGs are distinctively red compared to the non-SMG field sources in all three colors. Theproposed color cuts (dashed lines) are given in Section 3.3.
10
The Astrophysical Journal, 820:82 (23pp), 2016 April 1 Chen et al.

brighter observed 24 μm fluxes and bluer color in optical/NIRas shown in a shallower decrease on the observed 2.2 μm flux.We attribute this effect to the selection bias. As shown inSimpson et al. (2014) and Swinbank et al. (2014), by necessitythe composite rest-frame SED of the ALESS SMGs can onlybe constructed for those sources that have well-constrainedphotometric redshifts, meaning thatthey are preferentiallybrighter, especially in the optical/UV. In addition, thecomparable detection limits in the optical–IR wavebands inthe ECDFS (the location of the ALESS SMGs) biasthedetection toward bluer SMGs.
Figure 10 nicely illustrates that the negative K-correction of850 μm allows us to detect SMGs in a wide range of the
redshift space (Blain et al. 2002), while optical–IR and radiosuffer from positive K-corrections. The main implication isthat our methodology of identifying counterpart candidatesusing radio/OIR imaging is likely to miss the high-redshiftSMGs, as seen in Figure 10 and many other studies in theliterature (e.g., Walter et al. 2012; Riechers et al. 2013). Weare also likely to miss more faint SMGs than the bright ones,providedthat the mean redshift of the faint SMGs is similartoor higher than that of the bright ones (e.g., Chenet al. 2014; Simpson et al. 2014), and the SEDs of the fainterSMGs do not differ significantly compared to the brighterones. On the other hand, thanks to the deep K-band imagingavailable in UDS, given the same LIR,higher-redshift SMGsare more likely to be detected in NIR than in radio or at24 μm. Indeed, in Section 4.3 we show that our OIRTCtechnique identifies SMG counterparts that have redshiftdistributions skewed toward higher redshifts compared tothose with radio counterparts.
Figure 7. SMG fractions (fOIRTC) for each specified color. The measurementsare the same as those shown in Figure 4, while the gray curves and the shadedregions are the best-fit models with χ2 1 and their 1σ errors. These modelsare then used to determine the cut that best separates the SMGs from the non-SMG field galaxies in the training sample. Detailed descriptions of the modelfits are given in Section 3.3.
Table 1Best χ2 Fits on the SMG Fraction (fOIRTC)
Color a b c
z−K 1.34±0.31 2.71±0.80 2.61±0.24K−[3.6] 2.35±0.31 17.40±12.74 1.20±0.08[3.6]−[4.5] 2.65±0.34 80.0 0.28±0.02
Note. All errors are obtained assuming Δχ2 = 1 except the b value for[3.6]−[4.5], which is the maximum value we set to prevent numericaloverflow in the fitting process. Our results are not sensitive to this choice.
Figure 8. Left:mean SMG fraction (á ñfOIRTC ) of all 164 K-band sources thatare located within the primary beam of our 30 ALMA observations in the UDS.For each source, based on the parameterized fits shown in Figure 7, á ñfOIRTC iscalculated by taking the weighted averaging of all the corresponding valuesobtained from each measured color. We show both the non-SMG field sources(those not detected by ALMA) and the ALMA-detected SMGs. The colorpoints enclosed by a circle are those with radio counterparts (matched within1 5). The openblack circles are radio-detected SMGs that do not have K-bandcounterparts, and thus we arbitrarily set their á ñfOIRTC to −0.05. The fact thatmost radio-detected, K-undetected ALMA SMGs have S850>6 mJy and all K-detected, radio-undetected ALMA SMGs have S850<6 mJy highlights the factthat these two ID methods compliment each other in flux space, which isfurther explored in Section 3.4. We find that a threshold of á ñfOIRTC 0.05,shown by the horizontal line, best separates the SMGs and the non-SMG fieldgalaxies when judged on both accuracy and completeness. Right:distributionof á ñfOIRTC for SMGs and non-SMGs, normalized to the total number of sourcesin each category. Detailed discussions on this figure can be found inSection 3.3.
Table 2Test Results Using the ALMA Training Sample
Method Accuracy Completeness
Radio -+87 23
13% (26/30) 52%±12% (27/52)MIPS -
+78 2322% (21/27) 40%±10% (21/52)
OIRTC -+87 23
13% (27/31) 52%±12% (27/52)Radio+OIRTC -
+83 1917% (35/42) 67%±14% (35/52)
11
The Astrophysical Journal, 820:82 (23pp), 2016 April 1 Chen et al.
4. RESULTS AND DISCUSSION
4.1. IDs for the Entire SCUBA-2 UDS Sample
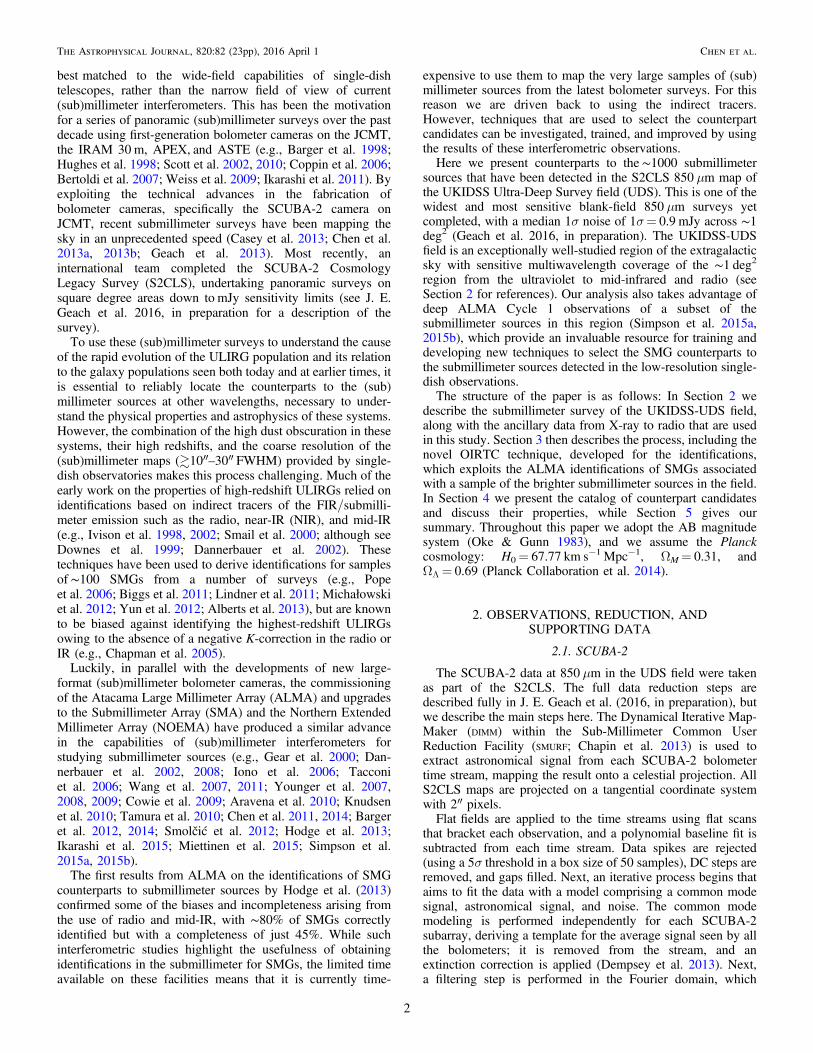
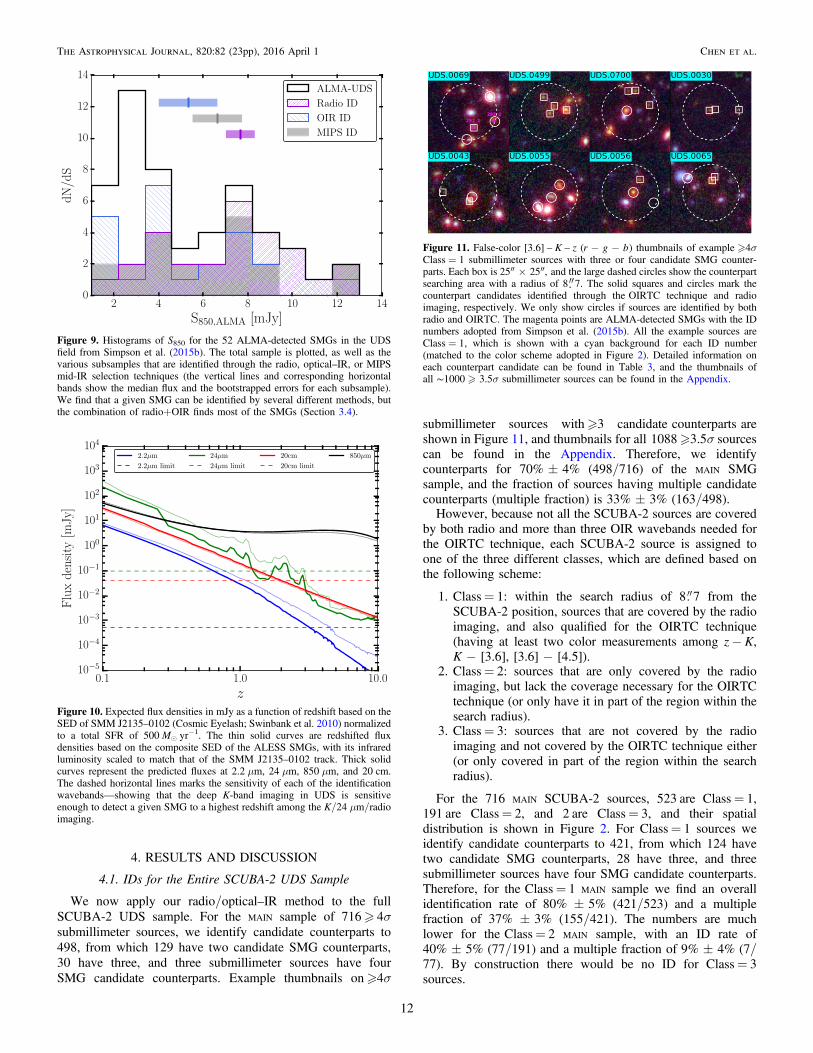
We now apply our radio/optical–IR method to the fullSCUBA-2 UDS sample. For the MAIN sample of 716� 4σsubmillimeter sources, we identify candidate counterparts to498, from which 129 have two candidate SMG counterparts,30 have three, and three submillimeter sources have fourSMG candidate counterparts. Example thumbnails on�4σ
submillimeter sources with�3 candidatecounterpartsareshown in Figure 11, and thumbnails for all1088�3.5σ sourcescan be found in the Appendix. Therefore, we identifycounterparts for 70%±4% (498/716) of the MAIN SMGsample, and the fraction of sources having multiple candidatecounterparts (multiple fraction) is 33%±3% (163/498).However, because not all the SCUBA-2 sources are covered
by both radio andmore than three OIR wavebands needed forthe OIRTC technique, each SCUBA-2 source is assigned toone of the three different classes, which are defined based onthe following scheme:
1. Class= 1: within the search radius of 8 7 from theSCUBA-2 position, sources that are covered by the radioimaging, and also qualified for the OIRTC technique(having at least two color measurements among z− K,K−[3.6], [3.6]−[4.5]).
2. Class= 2: sources that are only covered by the radioimaging, but lack the coverage necessary for the OIRTCtechnique (or only have it in part of the region within thesearch radius).
3. Class= 3: sources that are not covered by the radioimagingand not covered by the OIRTC technique either(or only covered in part of the region within the searchradius).
For the 716 MAIN SCUBA-2 sources, 523 are Class= 1,191 are Class= 2, and 2 are Class= 3, and their spatialdistribution is shown in Figure 2. For Class= 1 sources weidentify candidate counterparts to 421, from which 124 havetwo candidate SMG counterparts, 28 have three, and threesubmillimeter sources have four SMG candidate counterparts.Therefore, for theClass= 1 MAIN sample we find an overallidentification rate of 80% ±5% (421/523) and a multiplefraction of 37% ±3% (155/421). The numbers are muchlower for theClass= 2 MAIN sample, with an ID rate of40%±5% (77/191) and a multiple fraction of 9%±4% (7/77). By construction there would be no ID for Class= 3sources.
Figure 9. Histograms of S850 for the 52 ALMA-detected SMGs in the UDSfield from Simpson et al. (2015b). The total sample is plotted, as well as thevarious subsamples thatare identified through the radio, optical–IR, or MIPSmid-IR selection techniques (the vertical lines and corresponding horizontalbands show the median flux and the bootstrapped errors for each subsample).We find that a given SMG can be identified by several different methods, butthe combination of radio+OIR finds most of the SMGs (Section 3.4).
Figure 10. Expected flux densities in mJy as a function of redshift based on theSED of SMM J2135–0102 (Cosmic Eyelash; Swinbank et al. 2010) normalizedto a total SFR of 500 Me yr−1. The thin solid curves are redshifted fluxdensities based on the composite SED of the ALESS SMGs, with its infraredluminosity scaled to match that of the SMM J2135–0102 track. Thick solidcurves represent the predicted fluxes at 2.2 μm, 24 μm, 850 μm, and 20 cm.The dashed horizontal lines marks the sensitivity of each of the identificationwavebands—showing that the deep K-band imaging in UDS is sensitiveenough to detect a given SMG to a highest redshift among the K/24 μm/radioimaging.
Figure 11. False-color [3.6] – K – z ( - -r g b) thumbnails of example �4σClass = 1 submillimeter sources with three or four candidate SMG counter-parts. Each box is 25″×25″,and the large dashed circles show the counterpartsearching area with a radius of 8 7. The solid squares and circles mark thecounterpart candidates identified through theOIRTC technique and radioimaging, respectively. We only show circles if sources are identified by bothradio and OIRTC. The magenta points are ALMA-detected SMGs with the IDnumbers adopted from Simpson et al. (2015b). All the example sources areClass = 1, which is shown with a cyan background for each ID number(matched to the color scheme adopted in Figure 2). Detailed information oneach counterpart candidate can be found in Table 3, and the thumbnails ofall∼1000 � 3.5σ submillimeter sources can be found in the Appendix.
12
The Astrophysical Journal, 820:82 (23pp), 2016 April 1 Chen et al.

Among the training sample, three of the ALMA pointings,including seven ALMA-detected SMGs, are classified asClass= 2 (UDS306, UDS47, and UDS408 in Simpson et al.2015b), while the rest are Class= 1 sources. Therefore, for theClass= 1 sources, based on the training sample we expect theidentification accuracy to be 82%±20% (31/38)and thecompleteness to be 69%±16% (31/45), while for the Class= 2sources,where only radio coverage is available, based onSection 3.1 we expect an identification accuracy of -
+87 2313%and
a completeness of 52% ±12%. However, because the trainingsample was selected from the typically brighter (S850>8mJy)sources, the ALMA follow-up observations on all theSCUBA-2SMGs are likely to produce more fainter SMGs with S850< 4mJythan those in the training sample. We therefore expect the overallcompleteness to be less than the numbers quoted above.
To estimate the true completeness with our method on SMGswith S850>1 mJy that are located within the beam area of theSCUBA-2 sources, we assume that we have ALMA follow-upobservations for the rest of the SCUBA-2 sample, and wemodel the results by assuming for each SCUBA-2 source a40% chance that it breaks into two subcomponents (seeSection 4.2 regarding the multiple fraction for the SCUBA-2sources). We then assume that for those broken intosubcomponents, the flux contribution is 75% and 25% of theSCUBA-2 flux, respectively, based on Simpson et al. (2015b).We then apply the identification rate based on Figure 9 to themodel flux distributionand compute the completeness bydividing the expected number of identifications bythe totalnumber of the model SMGs. We obtain a completenessof ∼60%.
For the 258 Class= 1 submillimeter sources in theSUPPLEMENTARY 3.5σ–4σ sample, we find candidate counterpartsto 166, with 39 having multiple counterparts. The slightlylower fractions in identification rate (64%± 6%) and multiplefraction (23%± 4%) in the tentative sample could be due to theexpected higher spurious rate (∼10%). The full identificationsare given in Table 3 and Table 4, and the multiwavelengththumbnails are plotted in Figures 16 and 17.
We stress that our counterpart identification method istrained based on the ALMA follow-up observations on part ofour sample SCUBA-2 SMGs in UDSand aims to provide allcounterpart candidates with S850>1 mJy.
4.2. Identification Rate and Multiple Fraction
In Section 3.4.1 we show that, for the�4σ Class= 1submillimeter sources, 81%±5% (the identification rate) haveat least one counterpart candidate, and 37%±3% (multiplefraction) have more than one. In Figure 12 we plot theidentification rate and the multiple fraction as a function of theSCUBA-2 fluxes. We find a ∼90% identification rate forsubmillimeter sources with S850> 5 mJyand∼70% for thosewith S850= 3–5 mJy. The SCUBA-2 sources that wereobserved by ALMA are not significantly different. Theseresults are in good agreement with ALESS (Hodge et al. 2013),in which they also found a >80% ID rate for S850> 3 mJy. Thedecrease in the identification rate for fainter submillimetersources is likely to continue to the S850< 3 mJy regime, whichis shown to drop to50% (e.g., Hodge et al. 2013; Chenet al. 2014; Fujimoto et al. 2016).
Interferometric follow-up observations have shown thatsingle-dish SMGs are likely composed with multiple compo-nents. First,tentative evidence for multiplicity came from
radio-identified counterparts (e.g., Ivison et al. 2002). Subse-quently, the true confirmation with submillimeter interferome-try came from Wang et al. (2011) and many other studies(Barger et al. 2012, 2014; Hodge et al. 2013; Bussmann et al.2015; Simpson et al. 2015b). However, these studies differ inthe multiple fraction, which ranges from 10% to 70%depending on the depth of the follow-up observations(Chen et al. 2013b). The most recent ALMA results suggestmoderate multiplicity, ∼60% for submillimeter sources withS850∼ 8 mJy, with the primary source contributing onaverage∼75% of thetotal flux from the single-dish source(Simpson et al. 2015b).In Figure 12 we also show our results on the multiple
fraction to the�4σ Class= 1 SCUBA-2 sample. We find aconstant multiple fraction of∼40% as a function of 850 μmflux, with a positive (but not significant) slope. While theALMA imaging reveals multiple fractions in broad agreementwith ours, a noticeable but not significant increase (decrease)can be seen in the brightest (faintest) bin, making a correlationbetween multiple fraction and 850 μm flux from SCUBA-2slightly more significant. This can be explained by the fact that,in the multiple systems revealed by the ALMA imaging, manyof the fainter companions have S850< 3 mJy, making themunlikely to be identified through our method, or any othermultiwavelength identification methods, as they are usuallyundetected at almost all other wavelengths. On the other hand,a slightly lower multiple fraction in the faintest bin can beexplained by the sensitivity of the ALMA imaging. The mediansensitivity of the ALMA observations is 0.26 mJy beam−1,providing a 4σ detection limit of ∼1 mJy in the centralregionand 2 mJy within the primary beam. Assuming that thesecondary sources contribute to 25% of the total SCUBA-2 flux(Simpson et al. 2015b), the ALMA observations can detect thesecondary SMGs for SCUBA-2 sources with S850> 8 mJy. ForSCUBA-2 sources fainter than S850< 8 mJy, the ALMAobservations are not sensitive enough to detect the secondarysources if located close to the edge of the primary beam,biasing the fraction toward a lower multiple value. Weconclude that, for follow-up observations that are sensitive toS850∼ 1 mJy across the whole ALMA beam area, the truemultiple fraction for single-dish submillimeter sources with850 μm fluxes of S850 4 mJy is likely to be higher than 40%.
4.3. Redshift Distribution
In Figure 13 we plot the redshift distribution of thecounterpart candidates of the�4σ Class= 1 SCUBA-2sources, in which we also show the distribution of those thathave radio counterparts, ALESS (Simpson et al. 2014), and ourALMA pilot study in UDS (Simpson et al. 2016, inpreparation).The median redshift of the counterpart candidates of
our�4σ Class= 1 SCUBA-2 SMGs is z= 2.3±0.1, and thatbased on the radio identifications is z= 1.9±0.1. The medianredshift of the ALMA-UDS sample is slightly higher atz= 2.7±0.2. The difference is not significant, but this couldsuggest a dependency between 850 μm flux and redshift, sincethe ALMA-UDS sample is much brighter. By conductingphotometric redshift analysis on ALESS SMGs, Simpson et al.(2014) found a weak trend between 870 μm flux and redshift.However, after accounting for the selection bias, Simpson et al.conclude that the median redshift is likely not dependent on the870 μm flux. A weak positive or nonexisting trend is in contrast
13
The Astrophysical Journal, 820:82 (23pp), 2016 April 1 Chen et al.
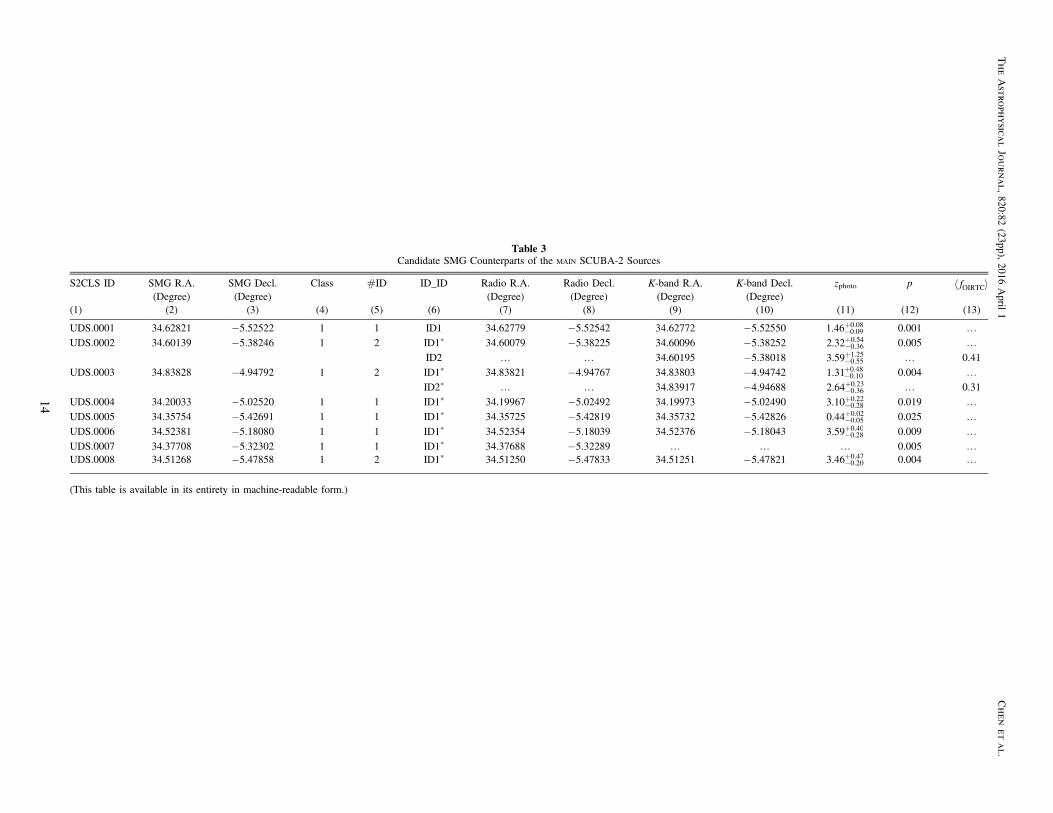
Table 3Candidate SMG Counterparts of the MAIN SCUBA-2 Sources
S2CLS ID SMG R.A. SMG Decl. Class #ID ID_ID Radio R.A. Radio Decl. K-band R.A. K-band Decl. zphoto p á ñfOIRTC(Degree) (Degree) (Degree) (Degree) (Degree) (Degree)
(1) (2) (3) (4) (5) (6) (7) (8) (9) (10) (11) (12) (13)
UDS.0001 34.62821 −5.52522 1 1 ID1 34.62779 −5.52542 34.62772 −5.52550 -+1.46 0.09
0.08 0.001 KUDS.0002 34.60139 −5.38246 1 2 ID1* 34.60079 −5.38225 34.60096 −5.38252 -
+2.32 0.360.54 0.005 K
ID2 K K 34.60195 −5.38018 -+3.59 0.55
1.25 K 0.41
UDS.0003 34.83828 −4.94792 1 2 ID1* 34.83821 −4.94767 34.83803 −4.94742 -+1.31 0.10
0.48 0.004 KID2* K K 34.83917 −4.94688 -
+2.64 0.360.23 K 0.31
UDS.0004 34.20033 −5.02520 1 1 ID1* 34.19967 −5.02492 34.19973 −5.02490 -+3.10 0.28
0.22 0.019 KUDS.0005 34.35754 −5.42691 1 1 ID1* 34.35725 −5.42819 34.35732 −5.42826 -
+0.44 0.050.02 0.025 K
UDS.0006 34.52381 −5.18080 1 1 ID1* 34.52354 −5.18039 34.52376 −5.18043 -+3.59 0.28
0.40 0.009 KUDS.0007 34.37708 −5.32302 1 1 ID1* 34.37688 −5.32289 K K K 0.005 KUDS.0008 34.51268 −5.47858 1 2 ID1* 34.51250 −5.47833 34.51251 −5.47821 -
+3.46 0.200.47 0.004 K
(This table is available in its entirety in machine-readable form.)
14
TheAstrophysicalJournal,820:82
(23pp),2016
April
1Chenetal.

with recent predictions by Cowley et al. (2015a), who, basedon their semianalytic model, predict a negative trend between850 μm flux and redshift.
To obtain errors of the redshift distribution, we performMonte Carlo simulations based on both the Poisson statisticsand uncertainties in the photometric redshifts. We take theerrors estimated from the Monte Carlo simulations and fit thedistribution with a lognormal function described as
p=
+- m+ - +dN
dzz
A
z B2 1e . 3
z z
B
ln 1 ln 1 2
2 2( )( )
( )[ ( ) ( )]
The best-fit parameters are A= 74.6±4.3, B= 0.23±0.01,and zμ= 2.30±0.05, with a reduced χ2= 1.4.
In addition, we observe two peaks in our redshift distribu-tion, one at z∼ 1.6and the other at z∼ 2.5 (althoughconsidering both the Poisson statistics and uncertainties inthe photometric redshifts, a lognormal formalism still providesagood fit to the redshift distribution). The former correspondsto the known z= 1.62 galaxy cluster Cl 0218.3−0510 (e.g.,Papovich et al. 2010), which our previous work has shownlikely contains a population of submillimeter-detected ULIRGs(Smail et al. 2014). In contrast, there areno pre-known large-scale structures at z∼ 2.5 in UDS.
As discussed earlier, our redshift distribution is likely to bebiased against high-redshift sources, which are essentially toofaint to be detected in the NIR survey (Section 3.4.2). Toillustrate this bias in another way, we measure the weightedaverage fluxes at 250, 350, 500, and 850 μm by stacking on theSPIRE and SCUBA-2 maps at the SCUBA-2 source positions.The measurements are made on the SCUBA-2 sources that
have candidate SMG counterparts, those that have radiocandidate counterparts, and those without any counterpartidentification. We plot the results as FIR colors in Figure 14, inwhich we find that SCUBA-2 sources with radio identificationshave the bluest color, followed by those with any kind ofidentifications, and those without counterpart candidates are thereddest. Following Amblard et al. (2010) and Ivison et al.(2012), we derive expected FIR colors on 106 graybody spectraassuming a single dust temperature, Td, where the flux density
nµ -nb n+f exp 1h
kT3
d( )( ) . To account for the flux uncer-
tainties in the data, each model flux density is randomlydeviated by 10% assuming Gaussian distribution. We explorethe parameter space at 15�Td�45, 1�β�2.5, and0�z�5, and the results are plotted in Figure 14 in colorscale. Clearly, the redder the FIR color, the higher redshift thesource is likely to be at.In Figure 14 we also plot the stacked SEDs along with the
best-fit template SEDs based on SMMJ2135–0102 andALESS SMGs. We find the with either template the best-fitredshift of the SCUBA-2 sources that have candidate counter-parts is z= 2.5, while that of the sources without any candidatecounterpart is z= 3.3, consistent with the higher-z nature onsources without candidate counterpartssuggested by the FIRcolor–color diagram.The redder FIR color of the SCUBA-2 sources without
counterpart identification supports the idea that these sourcesare on average at higher redshift compared to those withcounterpart candidates. Furthermore, the fact that sources withboth radio and OIRTC identifications are slightly redder thanthose that only have radio counterparts also supports the ideastated in the previous sections that theOIRTC technique findscandidates at slightly higher redshifts.To roughly estimate the median redshift of the complete�4σ
Class= 1 submillimeter sources, we set the redshifts forthe20% (102/523) that do not have any counterpart candidateto z= 3. We assume a multiple fraction of 40% based on theresults from Section 4.2, and we find the median redshiftshifting to z= 2.6±0.1. This result is not sensitive to theassumed multiple fraction.Recently, simulations have suggested that redshift distribu-
tions of dusty galaxies are dependent ontheir selecting FIRwavelength, in a sense that observations at longer wavelengthstend to select higher-redshift sources (e.g., Zavala et al. 2014;Béthermin et al. 2015). This selection bias is also supported bymany observations (e.g., Chapin et al. 2009; Smolčićet al. 2012; Yun et al. 2012; Casey et al. 2013; Weiss et al.2013; Miettinen et al. 2015). While in some cases thedifferences could be negligible considering the uncertaintiesof the measurements, to ensure like-to-like comparisons, weonly compare our results with those that are also based on theobservations that were carried out at 850/870 μm.Chapman et al. (2005, hereafterC05) reported a median
redshift of 2.2±0.1 based on a sample of SCUBA-detected,radio-identified, and spectroscopically confirmed SMGs. Ourradio-identified counterpart candidates have a median redshiftz= 1.9±0.1, slightly lower thanbut still consistent with thatof C05. This is expected as the radio imaging used in C05 is onaverage slightly deeper than that used in this work, and thusC05 might select SMGs with slightly higher redshifts(Section 3.4.2). Indeed, by only considering samples of C05that are covered by 1.4 GHz VLA imaging with a radio depth
Figure 12. Top:fraction of SCUBA-2 sources that have at least one candidateSMG counterpart (identification rate) in percentage as a function of measuredS850 for the submillimeter sources in the SCUBA-2 map. The errors are Poissonuncertainties for each equal-number bin. We show the results for the 524 � 4σClass = 1 SCUBA-2 sources that are covered by radio and at least three of thez, K, 3.6 μm,or 4.5 μm bands that are used for the OIRTC technique. We alsoillustrate the same quantities for those SCUBA-2 sources thatwere observedby ALMA in our Cycle 1 pilot study. We confirm a decreasing trend ofidentification fraction with decreasing S850. Bottom: fraction of SCUBA-2sources that have more than one counterpart candidate (multiple fraction). Thecolor coding is the same as the panel above, except that we also show theresults based on the ALMA imaging on 27 of our SCUBA-2 sources. We arguethat the true multiple fraction for single-dish submillimeter sources withS850 4 mJy is likely �40%, providedthat follow-up observations aresensitive to ∼1 mJy across the whole ALMA beam area.
15
The Astrophysical Journal, 820:82 (23pp), 2016 April 1 Chen et al.

of 1σ�10 μJy, the median redshift of theC05 samplebecomes z= 1.9±0.4.
Simpson et al. (2014) reported a median redshift ofz= 2.3±0.1 for 77 ALESS ALMA SMGs that have sufficientoptical and NIR photometry to derive reliable photometricredshifts. Our result is in excellent agreement with that ofSimpson et al. (2014). Furthermore, for the remaining 19ALESS SMGs that do not have sufficient photometry, Simpsonet al. (2014) argued that these are likely at z> 3, and by placingthem in the high-redshift tail, the median redshift is raised toz= 2.5±0.2, which is again in good agreement with ourestimate after accounting for the SCUBA-2 sources that do nothave any identified counterpart.
On the theoretical front, Zavala et al. (2014) predicted themedian redshift to be z= 2.43±0.12, and Cowley et al.(2015a) showed that for sources with S850>1 mJy, which is theflux regime probed by our training sample, the median redshift isz= 2.77±0.11. These are all again consistent with our results.
4.4. SMG Clustering
The significant improvement of the SMG sample size indegree-scale fields provides aunique opportunity to investigatethe clustering properties of the SMGs. To study the SMGclustering, we calculate the two-point autocorrelation functionw(θ) using the Landy & Szalay (1993) estimator:
q = - +w1
RRDD 2DR RR , 4( ) ( ) ( )
where DD, DR, and RR are the number of Data–Data, Data–Random, and Random–Random galaxy pairs, respectively,counted in bins of separations θ. DR and RR are normalized tohave the same total pairs as DD, in a sense that given NSMG
SMGs, NR random points, Ngr(θ) and Nrr(θ) in the original
counts, q= -N N NDR 1 2 R grSMG[( ) ] ( ) and= -N NRR 1SMG SMG[ ( )] q-N N N1R R rr( )] ( ).
Because our sample of SMGs are located in a single, area-limited region, w(θ) could be biased owingto the fact that themean density measured in our data is not the true underlyingmean density over the whole sky. The mean density is usuallybiased high, making the observed clustering appear weaker thanthe true value. If the real SMG w(θ) can be described as a power-law model w(θ)true= Aθ−0.8 (which wasfound to be true bothobservationally and theoretically, at the physical separationof∼0.1–10 h−1 Mpc), the observed w(θ) will follow the form
q q= -w w IC, 5true( ) ( ) ( )
with the bias IC known as the integral constraint. The integralconstraint can be numerically estimated (e.g., Infante 1994;Adelberger et al. 2005), using the random–random pairs underthe form
åå
q q
q=
N w
NIC . 6i rr i i
i rr i
true( ) ( )( )
( )
In practice, in Equation (4) we use four times as many randompoints as the number of SMGs (data points) and repeat theestimate 25 times. Using these 25 estimates, we calculate thevariance, the mean w(θ), andthe mean Nrr for the correction ofthe integral constraint. We then perform χ2 minimization usingEquation (5) to find the best-fit w(θ)true on a0 2–6′ scale(~ - -h0.2 6 1 Mpc at z= 2), the power-law regime that isshown below. At this stage the error of the amplitude A in w(θ)true is unrealistically small as the variance only accounts forthe shot noise from thecreation of the random points and thePoission uncertainties of the DD counts (DD0.5).To estimate the systematic uncertainties due to field-to-field
variation, we conduct the “delete one jackknife” resamplingmethod (Norberg et al. 2009). We first divide the chosen
Figure 13. Redshift distributions of various samples. For both panels the black solid curves outline the distribution of all the candidate counterparts of the �4σSCUBA-2 SMGs. Left: the gray hatched regions show the results of our Monte Carlo simulations, showing the uncertainties of the distribution by considering both thePoisson statistics and the errors of the photometric redshifts. The thick brown solid curve is the best-fit lognormal model to the gray hatched regions at z<8, withχ2 = 1.4. The blue hatched regions show the redshift distribution of the ALMA-detected SMGs based on the ALMA follow-up observations of the 30 brighterSCUBA-2 sources in UDS (J. M. Simpson et al. 2016, in preparation). The green solid regions mark the distributions of the ALESS SMGs based on Simpson et al.(2014). Right: the purple hatched regions only show the candidate SMG counterparts that have radio detections. To illustrate our selection biases, we also plot thedistributions of all the radio sources, sources selected by the OIRTC technique, and the full UDS parent sample in dashed, dot-dashed, and double-dot-dashed curves,respectively.
16
The Astrophysical Journal, 820:82 (23pp), 2016 April 1 Chen et al.

rectangular area,17in which we calculate w(θ) for the wholesample, into Nsub= 9 (3× 3) equal-size subareas. Each jack-knife sample is defined by discarding, in turn, each of the Nsub
subareas into which the whole sample has been split. Eachjackknife sample therefore consists of -N 1sub remainingsubareas, with a volume ( -N 1sub )/Nsub times the volume ofthe full rectangular area. The w(θ)true,jk fit is repeated, in eachjackknife sample, for Nsub times (as there are only Nsub
jackknife samples by construction) based on the methoddescribed in the previous paragraph. The systematic uncertain-ties are then estimated through the variance of these w(θ)true,jkfits. Finally, the error of the amplitude A for w(θ)true iscomputed by accounting for the shot noise, Poission errors, andthe systematic uncertainties estimated based on the jackkniferesampling.In Figure 15 we show the w(θ) measurements (corrected for
the integral constraint) of the 169 Class= 1 MAIN submillimetersources that have candidate SMG counterparts at 1<z<3,the redshift range where most of the counterpart SMGs lie andour selection is likely to have higher completeness. While weuse the probability distribution of redshifts, p(z), of thecandidate SMGs, we use the positions of the SCUBA-2sources, not the positions of the candidate SMGs. This isbecause while the SCUBA-2 sources are selected uniformlywith S850 3 mJy, the candidate SMGs might have fluxesdown to S850∼ 1 mJy as they are based on a training set fromthe deeper ALMA imaging. By using all candidate SMGs, weare effectively creating a sample thatis subject to uneven flux
Figure 14. Top and middle: FIR color–color diagram of SCUBA-2 sourcesstacked on SPIRE/SCUBA-2 maps. The SCUBA-2 sources that have(radio) counterpart candidates are shown bydownward-pointingtriangles(diamonds), and those that do not have any counterpart identificationareplotted as a circle. Most errors are smaller than the symbols. The otherpoints color-coded by redshiftsare the expected FIR colors assumingsingle-temperature graybody spectra, in ranges of 15�Td�45,1�β�2.5, and 0�z�5. The redder color of SCUBA-2 sourceswithout any counterpart identification suggests that these sources are likelyto be at higher redshift than those that have candidate counterparts. Bottom:stacked SEDs of the SCUBA-2 sources that do and do not have counterpartidentification, along with the best-fit template SEDs based onSMMJ2135–0102 and ALESS SMGs. The best-fit redshift of theSCUBA-2 sources with(without) counterpart identifications is 2.5(3.3),consistent with the higher-z nature for sources without candidate counter-parts suggested by the FIR color–color diagram.
Figure 15. Angular autocorrelation function of 1<z<3 SMGs (black circlesand gray squares), all corrected for the integral constraint. While both aremeasured from the SCUBA-2 detections that have counterpart candidates at1<z<3, SMGS2 represents measurements based on the positions of theSCUBA-2 detections, and those marked as SMGID are based on the positionsof the counterpart candidates. Both measurements are consistent at >0 3 (aboutthe size of the ALMA beam) scales, but those of SMGID are artificiallyenhanced at <0 3 scales owingto selection biases (see Section 4.4 for detaileddiscussions). The uncertainties shown for each datapoint only include shotnoise and Poission errors. The best-fit power-law model for the SMGs is shownasasolid black line, while the predictions for the SCUBA-2 surveys byCowley et al. (2015b) are plotted as dashed red curves. We detect strongclustering signals on SCUBA-2-detected sources, higher than but statisticallyconsistent with the predictions of Cowley et al. (2015b).
17 For consistency and the ease of estimating the jackknife uncertainties, weonly use counterpart candidates for the Class = 1 submillimeter sources thatare located within a chosen rectangle region with a size of ∼0.5 deg2
(0°. 65×0°. 78).
17
The Astrophysical Journal, 820:82 (23pp), 2016 April 1 Chen et al.

selections within and outside the beam, potentially resulting inan artificial boost in w(θ) on small scales (Figure 15). This isnot to say that the clustering of SMGs is sensitive to 850 μmflux;in fact, as we show in Figure 15, the results at>0 3(greater than the size of the beam) are not sensitive to theadopted positions. At this scale the clustering is determined bythe original SCUBA-2 catalog.
Our clustering measurement is a factor of four higher,though still within uncertainties, than the theoretical predictionsfor the submillimeter single-dish surveys recently proposed byCowley et al. (2015b). Our results are also higher, but stillwithin uncertainties, than the measurements reported pre-viously (Webb et al. 2003; Blain et al. 2004; Weiss et al. 2009;Williams et al. 2011; Hickox et al. 2012).
Based on the dark matter (DM) power spectrum provided bythe HALOFIT code of Smith et al. (2003), our w(θ) measurementssuggest a galaxy bias of = -
+b 9.1 2.82.1 and an autocorrelation
length of = -+ -r h210 7
6 1 Mpc, which corresponds to a DM halomass of Mhalo= (8±5)× 1013h−1Me. While most resultsreport SMG DM halo mass of Mhalo∼1013h−1Me, it isapparent that the measurements of SMG clusteringstill sufferfrom large uncertainties. Larger samples with better determina-tions of their redshifts, or cross-correlation with otherpopulations with larger sample size (A. Wilkinson et al.2016, in preparation), are needed to provide better constraintsto the SMG clustering properties.
5. SUMMARY
We present the results of the identification of counterparts to1088 submillimeter sources that are detected at�3.5σ in ourSCUBA-2 Cosmology Legacy Survey imaging of theUKIDSS-UDS field. We analyze a subset of 716�4σSCUBA-2 sources, expected to have high fidelity with ∼1%false detection rate. The SCUBA-2 sources are categorized intothree classes, based on their multiwavelength coverage, withthe Class= 1 sources having the best coverage for thecounterpart search. The analyses of this paper is built on anALMA pilot study on a subset of 30 brighter SCUBA-2sources (Simpson et al. 2015a, 2015b), as well as lessons learntfrom the ALESS ALMA survey of submililmeter sources in theECDFS (Hodge et al. 2013), and the results are summarized asfollows:
1. Based on ALMA observations of a subset of SCUBA-2sources, we investigate the accuracy and the complete-ness of the p-values that havebeen widely applied in theliterature to find radio/MIPS counterparts for thesubmillimeter sources. We find that at the depth of ourALMA imaging (central 1σ∼0.25 mJy beam−1), theaccuracy of both radio and MIPS identifications is notdependent on the p-value for p<0.1, although MIPS hasa poorer spatial resolution, leading to more blending. Wefind that including all the radio and MIPS sources that arelocated within the ALMA primary beam produces betteridentification results, in terms of maximizing the productof accuracy and completeness, compared to the tradi-tional method of only considering the p<0.05 sources.By doing so, we find the accuracy and the completenessof the radio (MIPS) identification to be -
+87 2313%
( -+78 23
22%)and 52%±12% (40%± 10%).2. Using our 52 ALMA-detected SMGs in the UDS as a
training set, we develop a novel technique for counterpart
identification, OIRTC, by utilizing three optical and NIRcolors (z−K, K−[3.6], and [3.6]−[4.5]). For sourcesabove the mean SMG fraction cut á ñ >f 0.05OIRTC , theOIRTC technique provides accuracy and completenessalmost identical to the radio identification, 87%±23%,and 52%±12%, respectively. Most importantly, theOIRTC technique complements the radio identificationsin selecting SCUBA-2 sources, in a sense that OIRTCselects fainter sources. In addition, the OIRTC techniquerecoversalmost all MIPS identifications. Based on theseresults, we adopt both radio imaging and the OIRTCtechnique (radio+OIRTC) to select counterpart candi-dates in this work.
3. In the two OIR colors that are used to train the OIRTCtechnique, z−K and K−[3.6], we find in theS850 1 mJy regime that there are no strong colorvariations among SMGs with different 850 μm fluxes.In [3.6]−[4.5] color, however, we find that the fainterSMGs with S850<2.7 mJy have a median color bluerthan that of the brighter SMGs (S850>2.7 mJy).
4. For the 523� 4σ Class= 1 SCUBA-2 sources that haveboth radio and OIRTC coverage, we find at least onecandidate counterpart for 80%±5% of the sample, and37%±3% have more than one candidate counterpart.Based on the training sample, the identificationof thissample is accurate to 82%±20%, with a completenessof 69%±16%, although the completeness may be lower(∼60%) owingto the fact that the training sample isbased on bright SCUBA-2 sources. The fact that ouridentification method still yields moderate incomplete-ness highlights the importance of conducting follow-upinterferometric observations to provide completely reli-able sample of SMGs (Hodge et al. 2013). We find thatthe identification rate is lower for fainter SCUBA-2sources,and we argue that for follow-up observationssensitive to SMGs with S850∼1 mJy across the wholeALMA beam, the multiple fraction is likely to be 40%for sources with S850 4 mJy.
5. The redshift distribution based on the photometricredshifts of the candidate SMG counterparts of the�4σClass= 1 SCUBA-2 sources is well fit by a lognormaldistribution, with a median redshift of z= 2.3±0.1 (asfound by Simpson et al. 2014). Based on the selectioncurves and the FIR colors, we argue that submillimetersources without any identification are likely to be locatedat z 3. After accounting for these unidentified sources,we estimatethe median redshift for SMGs withS850>1 mJy to be z= 2.6±0.1. Our results are ingood agreement with model predictions and previousobservational measurements.
6. Using the Landy & Szalay estimator, we find astrongangular clustering signal, although still with largeuncertainties, for candidate SMGs associated with�4σClass= 1 SCUBA-2 sources at 1<z<3. The cluster-ing signal roughly corresponds to a correlation length of
= -+ -r h210 7
6 1 Mpc, or galaxy bias of = -+b 9.1 2.8
2.1, and aDM halo mass of Mhalo= (8±5) ×1013h−1Me. Ourresults highlight the fact that larger samples of SMGswith better determinations on redshifts, or cross-correla-tion with other populations with larger sample size, areneeded to provide better constraints on the SMG
18
The Astrophysical Journal, 820:82 (23pp), 2016 April 1 Chen et al.

Table 4Candidate SMG Counterpars of the SUPPLEMENTARY SCUBA-2 Sources
S2CLS ID SMG R.A. SMG Decl. Class #ID ID_ID Radio R.A. Radio Decl. K-band R.A. K-band Decl. zphoto p á ñfOIRTC(Degree) (Degree) (Degree) (Degree) (Degree) (Degree)
(1) (2) (3) (4) (5) (6) (7) (8) (9) (10) (11) (12) (13)
UDS.0714 34.65998 −5.36077 1 0 K K K K K K K KUDS.0715 33.98784 −5.04675 2 0 K K K K K K K KUDS.0716 34.79200 −4.95184 1 0 K K K K K K K KUDS.0717 34.68288 −5.43243 1 1 ID1 K K 34.68155 −5.43050 -
+1.58 0.070.38 K 0.12
UDS.0718 34.40001 −4.71081 1 1 ID1 34.39950 −4.70931 34.39982 −4.70935 K 0.065 KUDS.0719 34.08140 −5.26570 1 0 K K K K K K K KUDS.0720 34.64493 −5.42466 1 5 ID1 34.64512 −5.42467 34.64504 −5.42456 K 0.004 K
ID2 K K 34.64428 −5.42475 -+1.72 0.03
0.51 K 0.18
ID3 34.64492 −5.42592 34.64489 −5.42591 -+1.65 0.10
0.22 0.018 KID4 34.64342 −5.42486 34.64332 −5.42485 -
+1.07 0.040.06 0.023 K
(This table is available in its entirety in machine-readable form.)
19
TheAstrophysicalJournal,820:82
(23pp),2016
April
1Chenetal.

Figure 16. False-color Ch1 – K – z ( - -r g b) thumbnails (Ch2 – Ch1 – K if zband is not available) for the MAIN SCUBA-2 sources. If less than three photometricbands are available, we show in gray scale the image of the shortest among the three wavebands available. The size of each box is 25″×25″,and the large dashedcircles show the counterpart searching area with a radius of 8 7. The filledsquares and circles mark the counterpart candidates identified through the OIRTCtechnique and radio imaging, respectively. We only show circles if sources are identified by both radio and OIRTC. The magenta points are ALMA-detected SMGswith the ID numbers adopted from Simpson et al. (2015b). The background color for each ID number shows the Class of each source, with cyan, yellow, and brownmarking Class = 1, 2, and 3, respectively (matched to the color scheme adopted in Figure 2). (An extended version of this figure is available.)
20
The Astrophysical Journal, 820:82 (23pp), 2016 April 1 Chen et al.

Figure 17. Same as Figure 16, but on the SUPPLEMENTARYsources. (An extended version of this figure is available.)
21
The Astrophysical Journal, 820:82 (23pp), 2016 April 1 Chen et al.

clustering propertiesand so test the relationship of thispopulation to local galaxies.
We thank the referee for a helpful report that has improved themanuscript. We would like to thank Peder Norberg for helpfuldiscussions on the clustering measurement. C.-C.C. is especiallygrateful to Tzu-Ying Lee (李姿瑩), who ensured the arrival ofHan-Ching Neo Chen (陳翰青). C.-C.C. andI.R.S. acknowledgesupport from the ERC Advanced Investigator program DUSTY-GAL 321334. I.R.S. also acknowledges support from a RoyalSociety/Wolfson Merit Award and STFC through grant numberST/L00075X/1. A.M.S. acknowledges financial support from anSTFC Advanced Fellowship (ST/H005234/1) andthe Lever-hulme foundation. The James Clerk Maxwell telescope hashistorically been operated by the Joint Astronomy Centre onbehalf of the Science and Technology Facilities Council of theUnited Kingdom, the National Research Council of Canada, andthe Netherlands Organisation for Scientific Research. Additionalfunds for the construction of SCUBA-2 were provided by theCanada Foundation for Innovation. This paper makes use of thefollowing ALMA data: ADS/JAO.ALMA#2012.1.00090.S.ALMA is a partnership of ESO (representing its member states),NSF (USA), and NINS (Japan), together with NRC (Canada),NSC and ASIAA (Taiwan), and KASI (Republic of Korea), incooperation with the Republic of Chile. The Joint ALMAObservatory is operated by ESO, AUI/NRAO, and NAOJ. Thisresearch made use of Astropy, a community-developed corePython package for Astronomy (Astropy Collaborationet al. 2013). This research has made use of NASA’s AstrophysicsData System. The authors wish to recognize and acknowledge thevery significant cultural role and reverence that the summit ofMauna Kea has always had within the indigenous Hawaiiancommunity. We are most fortunate to have the opportunity toconduct observations from this mountain.
APPENDIX
The selected candidate counterparts for the MAIN (S/N�4σ) and SUPPLEMENTARY (3.5σ� S/N� 4.0σ) SCUBA-2sources are shown in Tables 3 and 4, respectively. Columns(1)–(3) are short IDs, R.A., and decl. in degrees of theSCUBA-2 sources;Columns (4)–(6) give for each SCUBA-2source its Class (see Section 4.1 for details about theclassification), the total number of the counterpart candidates,and the assigned IDs for each counterpart candidate;Col-umns (7),(8), (9), and (10) show the R.A. and decl. indegrees of each radio andK-bandcounterpart, if any;-Column (11) gives the photometric redshifts with errors;-Column (12) shows the p-value for counterparts that areselected by radio;and Column (13) shows the mean SMGfraction of candidates selected purely based on the OIRTCtechnique (á ñf ;OIRTC see Section 3.3 for the definition of thisquantity). Note that the candidate counterparts that areconfirmed by the ALMA observations (Simpson et al.2015b) are denoted with an asteriskin Column (6). Inaddition, Simpson et al. (2015b) detect additional SMGs inthe following fields (coordinates and properties are given inTable 1 of Simpson et al. 2015b): UDS.0003, UDS.0004,UDS.0005, UDS.0007, UDS.0017, UDS.0020, UDS.0023,UDS.0024, UDS.0033, UDS.0047, UDS.0051, UDS.0078.
REFERENCES
Adelberger, K. L., Steidel, C. C., Pettini, M., et al. 2005, ApJ, 619, 697Alberts, S., Wilson, G. W., Lu, Y., et al. 2013, MNRAS, 431, 194Amblard, A., Cooray, A., Serra, P., et al. 2010, A&A, 518, L9Aravena, M., Younger, J. D., Fazio, G. G., et al. 2010, ApJL, 719, L15Astropy Collaboration, Robitaille, T. P., Tollerud, E. J., et al. 2013, A&A, 558,
A33Barger, A. J., Cowie, L. L., Chen, C.-C., et al. 2014, ApJ, 784, 9Barger, A. J., Cowie, L. L., Sanders, D. B., et al. 1998, Natur, 394, 248Barger, A. J., Cowie, L. L., Smail, I., et al. 1999, AJ, 117, 2656Barger, A. J., Wang, W.-H., Cowie, L. L., et al. 2012, ApJ, 761, 89Bertin, E., & Arnouts, S. 1996, A&AS, 117, 393Bertoldi, F., Carilli, C., Aravena, M., et al. 2007, ApJS, 172, 132Béthermin, M., De Breuck, C., Sargent, M., & Daddi, E. 2015, A&A, 576, L9Biggs, A. D., Ivison, R. J., Ibar, E., et al. 2011, MNRAS, 413, 2314Blain, A. W., Chapman, S. C., Smail, I., & Ivison, R. 2004, ApJ, 611, 725Blain, A. W., & Longair, M. S. 1993, MNRAS, 264, 509Blain, A. W., Smail, I., Ivison, R. J., Kneib, J., & Frayer, D. T. 2002, PhR, 369,
111Bolzonella, M., Miralles, J.-M., & Pelló, R. 2000, A&A, 363, 476Brammer, G. B., van Dokkum, P. G., & Coppi, P. 2008, ApJ, 686, 1503Bussmann, R. S., Riechers, D., Fialkov, A., et al. 2015, ApJ, 812, 43Casali, M., Adamson, A., Alves de Oliveira, C., et al. 2007, A&A, 467, 777Casey, C. M., Chen, C.-C., Cowie, L. L., et al. 2013, MNRAS, 436, 1919Casey, C. M., Narayanan, D., & Cooray, A. 2014, PhR, 541, 45Chapin, E. L., Berry, D. S., Gibb, A. G., et al. 2013, MNRAS, 430, 2545Chapin, E. L., Pope, A., Scott, D., et al. 2009, MNRAS, 398, 1793Chapman, S. C., Blain, A. W., Smail, I., & Ivison, R. J. 2005, ApJ, 622, 772Chen, C.-C., Cowie, L. L., Barger, A. J., et al. 2013a, ApJ, 762, 81Chen, C.-C., Cowie, L. L., Barger, A. J., et al. 2013b, ApJ, 776, 131Chen, C.-C., Cowie, L. L., Barger, A. J., Wang, W.-H., & Williams, J. P. 2014,
ApJ, 789, 12Chen, C.-C., Cowie, L. L., Wang, W.-H., Barger, A. J., & Williams, J. P. 2011,
ApJ, 733, 64Coppin, K., Chapin, E. L., Mortier, A. M. J., et al. 2006, MNRAS, 372, 1621Cowie, L. L., Barger, A. J., Wang, W., & Williams, J. P. 2009, ApJL, 697,
L122Cowley, W. I., Lacey, C. G., Baugh, C. M., & Cole, S. 2015a, MNRAS, 446,
1784Cowley, W. I., Lacey, C. G., Baugh, C. M., & Cole, S. 2015b, MNRAS,
submitted (arXiv:1504.04516)Dannerbauer, H., Lehnert, M. D., Lutz, D., et al. 2002, ApJ, 573, 473Dannerbauer, H., Lehnert, M. D., Lutz, D., et al. 2004, ApJ, 606, 664Dannerbauer, H., Walter, F., & Morrison, G. 2008, ApJL, 673, L127Dempsey, J. T., Friberg, P., Jenness, T., et al. 2013, MNRAS, 430, 2534Downes, A. J. B., Peacock, J. A., Savage, A., & Carrie, D. R. 1986, MNRAS,
218, 31Downes, D., Neri, R., Greve, A., et al. 1999, A&A, 347, 809Frayer, D. T., Reddy, N. A., Armus, L., et al. 2004, AJ, 127, 728Fujimoto, S., Ouchi, M., Ono, Y., et al. 2016, ApJS, 222, 1Furusawa, H., Kosugi, G., Akiyama, M., et al. 2008, ApJS, 176, 1Geach, J. E., Chapin, E. L., Coppin, K. E. K., et al. 2013, MNRAS,
432, 53Gear, W. K., Lilly, S. J., Stevens, J. A., et al. 2000, MNRAS, 316, L51Gruppioni, C., Pozzi, F., Rodighiero, G., et al. 2013, MNRAS, 432, 23Hartley, W. G., Almaini, O., Mortlock, A., et al. 2013, MNRAS, 431, 3045Hatsukade, B., Ohta, K., Yabe, K., et al. 2015, arXiv:1508.00644Hickox, R. C., Wardlow, J. L., Smail, I., et al. 2012, MNRAS, 421, 284Hodge, J. A., Karim, A., Smail, I., et al. 2013, ApJ, 768, 91Hughes, D. H., Serjeant, S., Dunlop, J., et al. 1998, Natur, 394, 241Ikarashi, S., Ivison, R. J., Caputi, K. I., et al. 2015, ApJ, 810, 133Ikarashi, S., Kohno, K., Aguirre, J. E., et al. 2011, MNRAS, 415, 3081Infante, L. 1994, A&A, 282, 353Iono, D., Peck, A. B., Pope, A., et al. 2006, ApJL, 640, L1Ivison, R. J., Greve, T. R., Dunlop, J. S., et al. 2007, MNRAS, 380, 199Ivison, R. J., Greve, T. R., Smail, I., et al. 2002, MNRAS, 337, 1Ivison, R. J., Smail, I., Amblard, A., et al. 2012, MNRAS, 425, 1320Ivison, R. J., Smail, I., Dunlop, J. S., et al. 2005, MNRAS, 364, 1025Ivison, R. J., Smail, I., Le Borgne, J.-F., et al. 1998, MNRAS, 298, 583Knudsen, K. K., Kneib, J.-P., Richard, J., Petitpas, G., & Egami, E. 2010, ApJ,
709, 210Landy, S. D., & Szalay, A. S. 1993, ApJ, 412, 64Lawrence, A., Warren, S. J., Almaini, O., et al. 2007, MNRAS, 379, 1599Le Floc’h, E., Papovich, C., Dole, H., et al. 2005, ApJ, 632, 169Lindner, R. R., Baker, A. J., Omont, A., et al. 2011, ApJ, 737, 83
22
The Astrophysical Journal, 820:82 (23pp), 2016 April 1 Chen et al.

Michałowski, M. J., Dunlop, J. S., Ivison, R. J., et al. 2012, MNRAS, 426,1845
Miettinen, O., Smolčić, V., Novak, M., et al. 2015, A&A, 577, A29Mortlock, A., Conselice, C. J., Hartley, W. G., et al. 2013, MNRAS, 433, 1185Norberg, P., Baugh, C. M., Gaztañaga, E., & Croton, D. J. 2009, MNRAS,
396, 19Oke, J. B., & Gunn, J. E. 1983, ApJ, 266, 713Papovich, C., Momcheva, I., Willmer, C. N. A., et al. 2010, ApJ, 716, 1503Planck Collaboration, Ade, P. A. R., Aghanim, N., et al. 2014, A&A, 571, A16Pope, A., Scott, D., Dickinson, M., et al. 2006, MNRAS, 370, 1185Prevot, M. L., Lequeux, J., Prevot, L., Maurice, E., & Rocca-Volmerange, B.
1984, A&A, 132, 389Reshef, D. N., Reshef, Y. A., Finucane, H. K., et al. 2011, Sci, 334, 1518Riechers, D. A., Bradford, C. M., Clements, D. L., et al. 2013, Natur, 496, 329Sanders, D. B., & Mirabel, I. F. 1996, ARA&A, 34, 749Scott, K. S., Yun, M. S., Wilson, G. W., et al. 2010, MNRAS, 405, 2260Scott, S. E., Fox, M. J., Dunlop, J. S., et al. 2002, MNRAS, 331, 817Shupe, D. L., Rowan-Robinson, M., Lonsdale, C. J., et al. 2008, AJ, 135, 1050Simpson, C., Martínez-Sansigre, A., Rawlings, S., et al. 2006, MNRAS, 372,
741Simpson, C., Rawlings, S., Ivison, R., et al. 2012, MNRAS, 421, 3060Simpson, J. M., Smail, I., Swinbank, A. M., et al. 2015a, ApJ, 799, 81Simpson, J. M., Smail, I., Swinbank, A. M., et al. 2015b, ApJ, 807, 128Simpson, J. M., Swinbank, A. M., Smail, I., et al. 2014, ApJ, 788, 125Smail, I., Geach, J. E., Swinbank, A. M., et al. 2014, ApJ, 782, 19Smail, I., Ivison, R. J., & Blain, A. W. 1997, ApJL, 490, L5Smail, I., Ivison, R. J., Blain, A. W., & Kneib, J. 2002, MNRAS, 331, 495
Smail, I., Ivison, R. J., Owen, F. N., Blain, A. W., & Kneib, J. 2000, ApJ,528, 612
Smith, R. E., Peacock, J. A., Jenkins, A., et al. 2003, MNRAS, 341, 1311Smolčić, V., Aravena, M., Navarrete, F., et al. 2012, A&A, 548, 4Swinbank, A. M., Simpson, J., Smail, I., et al. 2014, MNRAS, 438, 1267Swinbank, A. M., Smail, I., Longmore, S., et al. 2010, Natur, 464, 733Symeonidis, M., Vaccari, M., Berta, S., et al. 2013, MNRAS, 431, 2317Tacconi, L. J., Neri, R., Chapman, S. C., et al. 2006, ApJ, 640, 228Tamura, Y., Iono, D., Wilner, D. J., et al. 2010, ApJ, 724, 1270Ueda, Y., Watson, M. G., Stewart, I. M., et al. 2008, ApJS, 179, 124Umehata, H., Tamura, Y., Kohno, K., et al. 2014, MNRAS, 440, 3462Vivian, U., Sanders, D. B., Mazzarella, J. M., et al. 2012, ApJS, 203, 9Walter, F., Decarli, R., Carilli, C., et al. 2012, Natur, 486, 233Wang, W., Cowie, L. L., Barger, A. J., & Williams, J. P. 2011, ApJL, 726, L18Wang, W., Cowie, L. L., van Saders, J., Barger, A. J., & Williams, J. P. 2007,
ApJL, 670, L89Wang, W.-H., Barger, A. J., & Cowie, L. L. 2012, ApJ, 744, 155Webb, T. M., Eales, S. A., Lilly, S. J., et al. 2003, ApJ, 587, 41Weiss, A., De Breuck, C., Marrone, D. P., et al. 2013, ApJ, 767, 88Weiss, A., Kovács, A., Coppin, K., et al. 2009, ApJ, 707, 1201Williams, C. C., Giavalisco, M., Porciani, C., et al. 2011, ApJ, 733, 92Younger, J. D., Dunlop, J. S., Peck, A. B., et al. 2008, MNRAS, 387, 707Younger, J. D., Fazio, G. G., Huang, J., et al. 2007, ApJ, 671, 1531Younger, J. D., Fazio, G. G., Huang, J.-S., et al. 2009, ApJ, 704, 803Yun, M. S., Aretxaga, I., Ashby, M. L. N., et al. 2008, MNRAS, 389, 333Yun, M. S., Scott, K. S., Guo, Y., et al. 2012, MNRAS, 420, 957Zavala, J. A., Aretxaga, I., & Hughes, D. H. 2014, MNRAS, 443, 2384
23
The Astrophysical Journal, 820:82 (23pp), 2016 April 1 Chen et al.