
The SAM PuttLab: Concept and PGA Tour Data · The SAM PuttLab: Concept and PGA Tour Data ... size...
14
The SAM PuttLab: Concept and PGA Tour Data Christian Marquardt Science&Motion Sports GmbH Schaefergasse 4, 65428 Ruesselsheim, Germany E-mail: [email protected] ABSTRACT The portable SAM PuttLab uses innovative ultra-sound technology to measure all aspects of a putting stroke with high precision. It is considered that in putting a lack of objective feedback will limit learning and performance. The PuttLab uncovers individual strengths and weaknesses and provides relevant feedback to tailor individual training programs. The PuttLab has been used to collect a reference data sample of 99 PGA Tour players. The data reveals a wide variety of different putting techniques and putting strategies. The common attribute between players is the high consistency of the individual performance. A framework for successful putting is discussed with learning being defined as the search for an optimal solution in the individual motor-workspace, trading off sound technique and high consistency of movement automation. Key words: Augmented Feedback, Golf, Technology, Movement Variability INTRODUCTION Skill acquisition can be defined as the search strategy to identify the perfect solution in the perceptual-motor workspace for a specific motor task; i.e., practice involves repeatedly trying to solve a motor task rather than repeating a particular solution of the task [1]. The role of the coach is to support the student in searching for the best solution in his or her own perceptual-motor workspace. If learning is the search for an optimal solution of a specific task [1], then the lack of adequate feedback involved in putting is also critical. Although the putting movement is considerably slow as compared with the full swing, the eyes are still not able to follow the putter in detail, i.e. to monitor the face angle through impact. It is also very difficult for a coach to differentiate the various aspects involved for instance 101 Reviewers: Jon Karlsen (Norwegian School of Sports Sciences, Norway) Phil Kenyon (Harold Swash Putting, Ltd., UK)
Transcript of The SAM PuttLab: Concept and PGA Tour Data · The SAM PuttLab: Concept and PGA Tour Data ... size...

The SAM PuttLab: Concept and PGA Tour Data
Christian MarquardtScience&Motion Sports GmbH
Schaefergasse 4, 65428 Ruesselsheim, GermanyE-mail: [email protected]
ABSTRACT
The portable SAM PuttLab uses innovative ultra-sound technology
to measure all aspects of a putting stroke with high precision. It is
considered that in putting a lack of objective feedback will limit
learning and performance. The PuttLab uncovers individual
strengths and weaknesses and provides relevant feedback to tailor
individual training programs. The PuttLab has been used to collect a
reference data sample of 99 PGA Tour players. The data reveals a
wide variety of different putting techniques and putting strategies.
The common attribute between players is the high consistency of
the individual performance. A framework for successful putting is
discussed with learning being defined as the search for an optimal
solution in the individual motor-workspace, trading off sound
technique and high consistency of movement automation.
Key words: Augmented Feedback, Golf, Technology, Movement
Variability
INTRODUCTIONSkill acquisition can be defined as the search strategy to identify the perfect solutionin the perceptual-motor workspace for a specific motor task; i.e., practice involvesrepeatedly trying to solve a motor task rather than repeating a particular solution ofthe task [1]. The role of the coach is to support the student in searching for the bestsolution in his or her own perceptual-motor workspace.
If learning is the search for an optimal solution of a specific task [1], then the lackof adequate feedback involved in putting is also critical. Although the puttingmovement is considerably slow as compared with the full swing, the eyes are still notable to follow the putter in detail, i.e. to monitor the face angle through impact. It isalso very difficult for a coach to differentiate the various aspects involved for instance
101
Reviewers: Jon Karlsen (Norwegian School of Sports Sciences, Norway)Phil Kenyon (Harold Swash Putting, Ltd., UK)
Annual Review of Golf Coaching 4/9/07 2:25 pm Page 101

in direction of the ball, such as misreading the green, misaiming, face errors, patherrors, rotation errors, impact spot errors, uneven surface, wind and even dimpleerrors. For successful motor learning, it is important to provide consistent feedbackon the consequences of the motor action independent of random variables involved.
Using technology from the fields of medicine and rehabilitation, the SAM PuttLabhas been designed to provide objective, valid and reliable feedback on puttingmovement. Using data from the PuttLab, individual strengths and weaknesses can beidentified. Furthermore, the data can be used to channel the search for appropriatemappings of the perceptual-motor workspace during learning.
To create a reference data sample, data of PGATour players’putting strokes has beencollected since the year 2003. The data sample is divided into six functionalfundamentals of a putting stroke. The reference data is also fed back into the PuttLab tocompare the actual performance of a golfer with the average Tour player’s performance.
THE SAM PUTTLAB MEASURING PRINCIPLEThe SAM PuttLab is based on high precision ultra-sound technology. Miniaturesenders emit high frequency ultra-sound signals to microphones, which are housed ina receiver unit. An infra-red connection synchronizes the process. The travel time ofthe sound pulses enables calculation of the exact distance between sender andreceiver. If three receivers are used, the position of one sender in the three-dimensional space can be calculated. If three senders and three receivers are used, allsix dimensions can be reconstructed (i.e., three translational and three rotational). Theoverall sampling frequency is 210 Hz. The maximum distance of a sender to thereceiver is about 1.5 m. The weight of the triplet, which is mounted onto the puttershaft, amounts to 48 g.
The resolution of the system is 0.1 mm and 0.1 degrees. Because of the datasmoothing methods applied to the data [2], the resolution of the processed data willbe even higher. Tests of accuracy and reliability of the system on putting robots haveshown convincing results. Table 1 shows the results for a series of 10 Putts done ona putting robot (Dave Pelz’s “Perfy” model [3]). Another test has been conducted ona putting robot and has been described in Nilsson et al. [4]. The results for two seriesof 20 putts for standard deviation of face angle at impact were quite similar with 0.1°and 0.09°. It should be noted that the results represent the confounding errors of boththe PuttLab and the robot itself.
Table 1. Resulting Standard Deviations in a PuttLab Test ConductedWith a Putting Robot
Parameter Standard DeviationPath Direction at Impact 0.02°Face Angle at Impact 0.06°Horizontal Impact Spot on Face 0.3 mmShaft Angle at Impact 0.1°Rise Angle at Impact 0.09°Lie Angle at Impact 0.05°
102 Annual Review of Golf Coaching 2007
Annual Review of Golf Coaching 4/9/07 2:25 pm Page 102

An important strength of the system is its high precision and the intrinsic spatialdimension. Because of the nature of sound waves, the signals provide informationdirectly about absolute distances. This is different from video systems where relativesize and position information have to be reconstructed from the pixel information intothe original three-dimensional space due to complicated calibration routines.
There are two limitations of the ultra-sound measurement principle. Duringmeasurement all three sensors have to be ‘visible’ to all of the three microphones,otherwise the signal is lost. This is normally not a problem in limited movements suchas putting. The second limitation arises from the nature of the sound waves. If loudnoise or strong wind affects the signal pulses, then the derived position signal will bedisturbed.
Sam PuttLab 103
Figure 1. Measurement Principle of SAM PuttLab
Annual Review of Golf Coaching 4/9/07 2:25 pm Page 103

SYSTEM COMPONENTSThe three sending sensors are integrated in a light T-shaped triplet, which is mountedonto the shaft at a height of 10 inches above the putter face. An additional batterypack is connected through a thin cable with the triplet and contains the power supplyfor the sensors. The receiver unit contains the three microphones and is placedapproximately 50 cm in front of the ball. The receiver unit is connected to a PCthrough USB and also is powered through USB. During the measurement, all data istransferred to the PC in real-time.
DATA REGISTRATIONAfter mounting the triplet to the shaft, the system has to be once calibrated forposition and direction. A small laser is fixed perpendicular to the putter face and ispointed exactly down the target line. At the same time, the putter is set flat on thesurface and touching the ball at the sweet spot. The calibration thus considers ballposition, lie angle of the putter, and direction of the target. The physical vertical iscalibrated by leveling out a watermark, which is integrated in the receiver unit.
During measurement, the registered data is continuously transferred from thereceiver to a PC via USB. The SAM PuttLab software scans the data stream andautomatically detects valid putting strokes. A sophisticated data tracker requires aspecific sequence of relative positions, movements and timings to identify a validstroke. The sequence considers: the start position; movement start of backswing;minimum size and time of backswing; direction and maximum speed of backswing;and minimum size, direction, speed and timing of forward swing. If errors in theregistered data are detected (i.e., data spikes), then the stroke will be rejected and notstored to file. Putting movements can also be registered without a ball, as long as theystart at the calibrated ball position. Practice putts will not be recorded as long as theydo not start at the calibrated ball position.
DATA ANALYSISTo exclude the inherent noise from the signal (random errors), the data stream issmoothed with a filter method that has been specially developed for kinematicanalysis of movement data [2]. Reliable data filtering is particularly crucial incalculating the derivatives for velocity and acceleration.
To derive the relevant putting parameters, nine relevant positions are identified ineach putting stroke: start of backswing, top of backswing, position of impact, end offorward swing, peak velocity, peak acceleration, peak deceleration, and impact zone10 cm before and 10 cm after impact. For each position, or between any position,numerous parameters can be calculated, including: face angles, putter path directionand geometry, impact spot, dynamic loft and lie, face rotation, speeds andaccelerations, rhythm and timing. Overall more than 60 parameters are calculated foreach stroke and stored to file. The resultant parameters can also be exported to anystatistical software package for further analysis.
SCORE AND CONSISTENCYA z-transformation is a mathematical procedure to compare different parameters on auniform scale by referring the results to the average and standard deviation (SD) of a
104 Annual Review of Golf Coaching 2007
Annual Review of Golf Coaching 4/9/07 2:25 pm Page 104

norm population. The PuttLab uses a norm data sample of 99 Tour players to calculatez-transformed performance ratings for Score and Consistency.
The Score rating represents the deviation of the player’s average performancefrom a theoretical optimal technical data value. The Score relates to the tendency ofa specific movement technique aspect. The optimal data value is eitherunambiguously defined through the task itself (e.g., square aiming or center-hit spot)or defined by the PGA Tour data sample (e.g., backswing ratio or face rotation). AScore of 100% indicates no tendency and optimal technique. A Score of 75% relatesto +- 1 SD of the distribution and thus indicates that about 32% of the Tour playershave a technique that is farther away from the optimum.
The Consistency rating represents the intra-individual distribution of the singledata values for different putts. The Consistency relates to the degree of movementautomation or skill level. A Consistency rating of 100% relates to an intra-individualdistribution that is 2 SD smaller than the average Tour player’s consistency. Only 3%of the Tour players will then have a higher consistency. A Consistency rating of 75%indicates a performance that is equally good as 50% of the Tour players.
DATA DISPLAYThe results are normally displayed in graphical reports, which are defined inprogrammable macro-files. The reports can present the data in any arrangement and ondifferent levels of complexity and detail. Reports can contain the putter in a specificview, numerical data values for average and standard deviation, Score and Consistencyratings, bar graphs for single data values, and time courses of specific variables.Additionally, reference values from the Tour data sample are directly included in thereporting. The bar graphs contain gray shaded areas, which correspond to adistribution of one standard deviation of the Tour player’s performance.
Data tables can contain numerical values for each single putt, the average valuesand standard deviations. Tables are very helpful to provide more specific informationas needed, e.g., for putter fitting. Competence profiles allow display of Score andConsistency values in a bar graph style. Up to ten different measurements can bedirectly compared inside one colour-coded competence profile. Competence profilesare a concise way to compare a particular player with a reference player, to documentbefore/after trainings effects, or to directly compare the performance of differentputters. In the 2D/3D replay mode, the movements of the putter can be replayed witha stick figure graph in different views and speeds. Using the keyboard, the display canalso be scrolled frame by frame.
TRAINING MODEA powerful feature of the PuttLab is the real-time feedback of performance. Thescreen display in the Training Mode is very similar to the graphical reports. For eachputt, the result is displayed graphically and numerically on the screen. Differentscreens are available for all relevant parameters and can be accessed by key press.The effect of any change on the putting stroke can be directly displayed andobjectively evaluated. So as to avoid interrupting the on-going movement, we useterminal feedback or knowledge of results (KR) feedback, which is only presentedafter completion of the task.
Sam PuttLab 105
Annual Review of Golf Coaching 4/9/07 2:25 pm Page 105

106 Annual Review of Golf Coaching 2007
Figure 2. Example of SAM PuttLab Report
Annual Review of Golf Coaching 4/9/07 2:25 pm Page 106

DATA FROM THE PGA TOURSIn this section, relevant statistics of our PGA Tour data sample will be presented.Since 2003 the PuttLab has been used on PGA Tours in order to measure the puttingstrokes of PGA Tour players. The data sample presented in this article represents dataof 99 male PGA Tour players measured at 9 PGA tournaments (eight PGA EuropeanTour and one USPGA Tour events) between 2003 and 2005. The average greens-in-regulation (GIR) putts per round for the sample in 2004 was 1.79 (range, 1.72 to1.87), the average putts per round were 29.6 (range, 28.3 to 31.1) and the GIR puttranking was 67.4 (range, 4 to 147).
For the measurement, a straight and level putt of 4-m length was selected on thepractice green. On slower greens, the distance was slightly reduced. The referencewas a putter speed at impact of 1.5 m/s. Before calibrating the target direction with alaser pointer, the players were allowed to have some practice putts. The players hadto confirm that they considered the putt as being straight otherwise the target directionwas slightly adjusted. Some of the players then decided for a calibration to the rightedge of the hole instead of the center. Although face and path angle refer directly tothe absolute calibration, it should be noted that the relative face-on-path parameter isindependent of the calibration. The players were instructed to run through theircomplete pre-shot routine before each putt and they were asked to use their ownputter. Seven consecutive putts were recorded for each player.
One limitation of this study is the fact that the data has been captured at differenttournaments. Although we tried to always select a similar putt, there is no control ofabsolute environmental conditions. The most important factors were to select a
Sam PuttLab 107
Figure 3. Example of SAM Putt Lab Training Screen
Annual Review of Golf Coaching 4/9/07 2:25 pm Page 107
straight, level putt and to adjust the distance. Nevertheless, some of the parameterswe measured might be more dependent on the different conditions than others andthis might explain some of the variance found in our data. For example, the speed ofthe green might directly influence the effective loft and rise angle that the playersapply to the ball in order to alter launch angle and spin rate. However, most of theparameters we measured can be assumed to be sufficiently independent of theconditions.
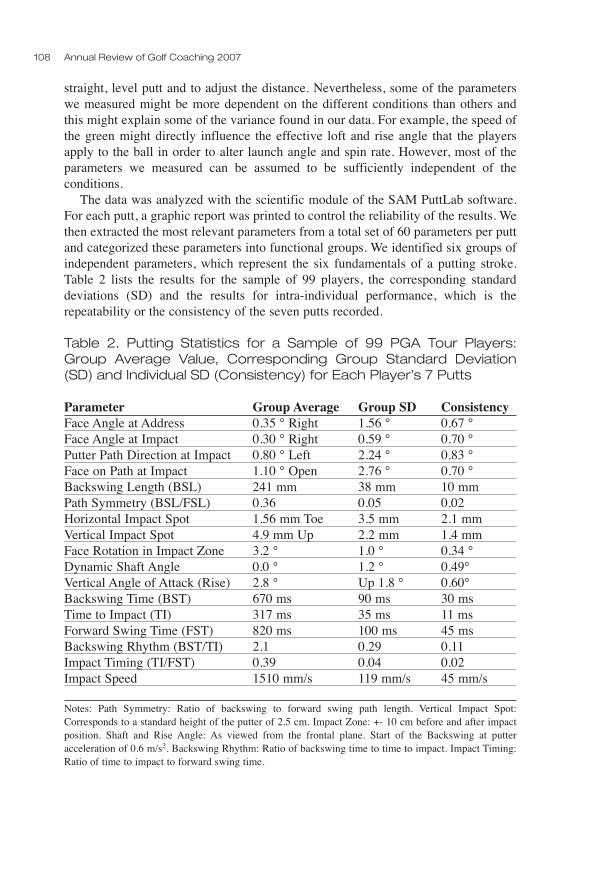
The data was analyzed with the scientific module of the SAM PuttLab software.For each putt, a graphic report was printed to control the reliability of the results. Wethen extracted the most relevant parameters from a total set of 60 parameters per puttand categorized these parameters into functional groups. We identified six groups ofindependent parameters, which represent the six fundamentals of a putting stroke.Table 2 lists the results for the sample of 99 players, the corresponding standarddeviations (SD) and the results for intra-individual performance, which is therepeatability or the consistency of the seven putts recorded.
Table 2. Putting Statistics for a Sample of 99 PGA Tour Players:Group Average Value, Corresponding Group Standard Deviation(SD) and Individual SD (Consistency) for Each Player’s 7 Putts
Parameter Group Average Group SD ConsistencyFace Angle at Address 0.35 ° Right 1.56 ° 0.67 °Face Angle at Impact 0.30 ° Right 0.59 ° 0.70 °Putter Path Direction at Impact 0.80 ° Left 2.24 ° 0.83 °Face on Path at Impact 1.10 ° Open 2.76 ° 0.70 °Backswing Length (BSL) 241 mm 38 mm 10 mm Path Symmetry (BSL/FSL) 0.36 0.05 0.02Horizontal Impact Spot 1.56 mm Toe 3.5 mm 2.1 mmVertical Impact Spot 4.9 mm Up 2.2 mm 1.4 mmFace Rotation in Impact Zone 3.2 ° 1.0 ° 0.34 °Dynamic Shaft Angle 0.0 ° 1.2 ° 0.49°Vertical Angle of Attack (Rise) 2.8 ° Up 1.8 ° 0.60°Backswing Time (BST) 670 ms 90 ms 30 msTime to Impact (TI) 317 ms 35 ms 11 msForward Swing Time (FST) 820 ms 100 ms 45 ms Backswing Rhythm (BST/TI) 2.1 0.29 0.11Impact Timing (TI/FST) 0.39 0.04 0.02 Impact Speed 1510 mm/s 119 mm/s 45 mm/s
Notes: Path Symmetry: Ratio of backswing to forward swing path length. Vertical Impact Spot:Corresponds to a standard height of the putter of 2.5 cm. Impact Zone: +- 10 cm before and after impactposition. Shaft and Rise Angle: As viewed from the frontal plane. Start of the Backswing at putteracceleration of 0.6 m/s2. Backswing Rhythm: Ratio of backswing time to time to impact. Impact Timing:Ratio of time to impact to forward swing time.
108 Annual Review of Golf Coaching 2007
Annual Review of Golf Coaching 4/9/07 2:25 pm Page 108

THE SIX FUNDAMENTALS OF A PUTTING STROKEAIMINGThe average of the Tour players for aiming the putter face is slightly right by 0.35°.What is quite surprising is the wide distribution of aiming over the group. The SD of1.56° indicates that more than 55% of the players aim to a target outside of the holeon a straight 4-m putt. The average consistency of each player is 0.67°.
We did not find any correlation between accuracy of aim and SD of face angle atimpact (Pearson correlation r = 0.07, p > 0.01). But we found a significant correlationbetween SD of aim and SD of face at impact (r = 0.62, p < 0.01) and SD of pathdirection at impact (r = 0.47, p < 0.01). From these results, we conjecture that theconsistency of aim seems more important for consistent ball direction than theaverage direction of aim for elite players. This does not mean the accuracy of aim isof no importance, but rather that accurate aim seems only of value if it can berepeated consistently.
DIRECTIONThe direction of the ball is basically determined by the angle of the putter face andthe direction of the putter path at impact. Following Petz [3], it is generally assumedthat the contribution of face angle to resulting ball direction is 82% with thecontribution from the path being only 18%. Off-center hits can also influence balldirection if the impact spot is outside of the sweet spot. Recent putter technologyreduces this problem by increasing the moment of inertia (MOI) of the putters.
On average, the Tour player hits the ball with a slightly open face of 0.3°. Thegroup SD is now reduced to 0.59°, which means that deviations in aiming arenormally corrected by impact. The average path direction at impact points 0.8° to theleft, thus in the opposite direction than the face. The compensation of an open face ona path pointing to the left allows the ball to still go straight. On average, the Tourplayer’s putter face is 1.1° open relative to the putter path at impact. The group SD ofthe path direction at impact is 2.24°, which is higher than the SD of the face angle atimpact.
In order to calculate the true effect of errors on ball direction, however, it isnecessary to multiply the group SD by the effect on direction; i.e. for face angle, 0.59°x 82% = 0.48°, and for putter path, 2.24° x 18% = 0.40°.
The consistency of the path at impact is 0.83° and slightly less than the consistencyof the face at impact with 0.7°. Again, we can calculate the resulting contribution toball direction consistency. Effective face angle consistency is 0.7° x 82% = 0.57° andeffective putter path consistency is 0.83° x 18% = 0.15°. This means that the effectiveconsistency of putter path is 3.8 times higher than effective consistency of face angle.
PATH GEOMETRY AND IMPACT SPOTInside the impact zone, the swing path of the putter should run parallel to the targetdirection, but it can behave differently at the beginning and end of the swing. Mostplayers show a swing path that is arced to the inside on the backswing and on thefollow through. This ellipse is a consequence of naturally swinging the putter in atilted swing plane and also corresponds to some amount of face rotation (see below).
The length of the backswing is found to be considerably shorter than the length of
Sam PuttLab 109
Annual Review of Golf Coaching 4/9/07 2:25 pm Page 109

the follow through. On average, the backswing is only 36% of the forward swinglength with a group SD of 5%. This means that the swing path geometry issignificantly not centered to the ball. Accurate length of the swing path is particularlyimportant in putting with regard to keeping timing constant. Length of the backswingwill then directly define the speed of the putter at impact and thus length of the putt.The consistency of backswing length in each player is 10 mm at an averagebackswing length of 241 mm.
The geometry of the putter path also determines the resulting impact spot. Ifbackswing and forward swing path are congruent, then the impact spot will exactlymeet the spot where the ball was aimed at. If the swing path crosses inside or outsidethrough impact, then the aiming and impact spots will be different. Inconsistent swingplanes will also result in inconsistent impact spots. The average horizontal impactspot is at an almost neutral position of 1.56 mm at the toe with a group SD of 3.5 mm.Consistency of impact spot is also high with 2.1 mm.
FACE ROTATIONNatural face rotation is a result of moving the putter on a tilted swing plane. The moretilted the plane is, the more the face will rotate relative to the target line. Many playersbelieve that the face is actively opened or closed. Relative to the swing plane,however, the putter is always square to the movement path if naturally moved backand forth. It is only because the swing plane is tilted that the projection of the putterpath to the target line appears as an ellipse and the putter face then opens and closesrelative to the target line. While some players over-rotate the putter by breaking thewrists through impact, other players try to reduce rotation by counteracting thenatural behavior of the putter (i.e., they close the face in the backswing and open theface through impact).
The Tour data reveals that inside of the impact zone of 10 cm before and 10 cmafter impact the putter face is closed 3.2°. The group SD is wide with 1.0°. Eachplayer’s consistency for face rotation is 0.34°. The overall rotation in the forwardswing amounts to about 10°. There is no smooth zero rotation found in Tour players.Only a few players tend to not rotate the putter in the forward swing. A more detailedanalysis shows that these players do not reduce rotation by swinging on a morevertical swing plane, but rather re-open the putter through impact.
LOFT AND RISEIn general, the launch angle of the ball and the spin rate are determined by theeffective loft applied to the ball and the rise angle of the swing path through the ball.We did not measure the static loft on the putters, thus our data refers to the angle ofthe shaft only. The effective loft amounts to shaft angle at impact plus static loft.Positive effective loft imparts backspin to the ball, whereas an upwards strokethrough impact imparts some amount of ‘topspin’ to the ball. The effect of loft andrise on launch angle are quite comparable to the effect of face and path on balldirection. Loft (face) will contribute far more to the resulting launch angle ascompared with rise angle (path).
The average dynamic shaft angle at impact is neutral with 0.0°. However, the widegroup SD of 1.2° indicates that many players are delofting the putter. Others are
110 Annual Review of Golf Coaching 2007
Annual Review of Golf Coaching 4/9/07 2:25 pm Page 110

adding loft with a hand position behind the ball at impact. The behavior of rise angleis also not homogeneous with an average angle of 2.8° upwards and a group SD of1.8°. As most of the putters we measured showed a static loft between 3° and 4°, thelaunch conditions will differ between these players. Many players apply a deloftedface to the ball with an upstroke, resulting in a flat launch angle and considerable‘topspin’; whereas other players are adding loft at a more level impact, which resultsin a steeper launch angle and backspin to the ball. As a consequence of our analysis,some players ended up reducing the static loft on their putter. As soon as there is acommon consensus of the preferred launch conditions available, the PuttLab datacould be used in conjunction with video analysis of launch angle and spin rate inorder to tailor the putter exactly to the needs of the player.
MOVEMENT DYNAMICSThe movement dynamics data directly reflect the organization of the movement itselfand are represented by velocity and acceleration signals. The biggest differences inthe acceleration signals of the Tour players are found between the top of backswingand impact. We categorized the course of acceleration into three stroke types. Theresults are displayed in Table 3 and show that 47% have ‘swing’-type strokes, 23%have ‘hit’-type strokes, and 30% have an intermediate type of stroke. Due to the factthat the speed of the putter changes rapidly at impact, accurate movement timing ismandatory for players using a ‘hit’-type stroke.
Table 3. Classification of Stroke Types Due to Acceleration to Impact
Stroke Type Acceleration Percentage of PlayersSwing Constant Inside of 10% 47 %Intermediate Increasing 30 %Hit Steep Ascending 100% 23 %
Backswing time is on average 670 ms, with a group SD of 90 ms; time to impactis on average 317 ms, with group SD of 35 ms; and time to complete forward swingis 820 ms, with group SD of 100 ms. The high numbers for SD show that the absolutetimes differ widely between players. The consistency of the swing time is high,especially for time to impact (11 ms). Consistency of impact speed of the putter headis also high with 45 mm/s at an average impact speed of 1570 mm/s.
Backswing rhythm and impact timing describe the relations between the differentswing times. Rhythm and timing are ratios that can be similar, even for players withvery different swing tempos. The average backswing rhythm (backswing timedivided by time to impact) is 2.1, with a group SD of 0.29. Average impact timing(time to impact divided by forward swing time) is 0.39, with a group SD of 0.04. Thismeans that the ball is hit early in the stroke before maximum putter speed, thusensuring a smooth acceleration through impact.
DISCUSSIONWe found that ultra-sound technology is suitable for accurate measurement of puttingmovements. The system is easy to use, portable and can be used indoors and
Sam PuttLab 111
Annual Review of Golf Coaching 4/9/07 2:25 pm Page 111
outdoors. Data capture takes only about 5 minutes and the reports immediatelyprovide objective information on relevant details of the putting strokes. Videosystems need some complicated calibration routines to allow translating the pixelinformation into real physical measures. Marker-based systems are still considered tobe state-of-the-art technology in movement analysis especially with regard toprecision. An ultrasound system using a fixed-marker configuration is additionallyeasy for calibration and handling purposes. Tests on several putting robots haveconfirmed the outstanding accuracy of the PuttLab.
A limitation of using the PuttLab outdoors is that strong wind can make itimpossible to register consistent data. Another limitation might be the weight of thesensor triplet added to the putter, but few players have expressed any negativefeelings about the increased weight on the shaft. The added weight might change theswing characteristics of the putter. As the triplet is mounted close to the balance pointon the shaft, however, the swing weight will not be affected too much. Interestingly,we more often got positive feedback on two other consequences of the triplet on theshaft: Some players reported that the swing felt smoother and others reported thatimpact resulted in less vibration of the shaft.
In the PuttLab Training Mode, objective information is provided to channel thesearch for an individually optimal solution for the task of putting [1]. We do not useconcurrent feedback where the information is continuously fed back during theexecution of the movement. Based on the results of research on skilled handwriting,visual, closed-loop feedback in automated movement execution is detrimental tosmooth movement dynamics and should only be used in very early stages of learning[5]. The PuttLab uses terminal feedback and knowledge of results (KR) feedback,which is only presented after completion of the task. The PuttLab also allows thecomplexity and the frequency of augmented feedback to be modified in accordancewith the skill level of the learner and the difficulty of the task [6].
The goal in putting could be simply described as bringing the putter to impactsquare to the ball on a path pointing exactly to the target line at an adequate putterspeed. Surprisingly, the Tour data generally show that there is no such model putt. Incontrast, a wide variety of different putting techniques was found with open or closedputter face, straight or curved swing paths, different path lengths, different levels offace rotation, ‘hit’- or ‘swing’-type strokes, and fast or slow swing tempo. Our datadoes not represent a model putt, but rather a framework within which an individualsolution should lie. The different techniques are not directly related to the ranking ofthe players. There can be several reasons for this variety of putting techniques, e.g.,different physical conditions of the players, different putters used, or differenttechnical and psychological approach. Other reasons might be the discrepancies inthe current training concepts and the lack of objective feedback during practice.
Regarding face rotation, we found that the average Tour player is rotating hisputter about 10° inside of the forward swing. This does not concord with the ‘straightback-straight through’ stroke concept forwarded by Pelz [3]. Some amount of facerotation could also be explained by the use of misfit putters. If we fit putters to anadequate length, we normally end up shortening the shaft by between 1 and 2 inches.As a consequence of the less upright posture and the more vertical swing plane, theface rotation was sometimes immediately reduced to 50%. Our data also suggests
112 Annual Review of Golf Coaching 2007
Annual Review of Golf Coaching 4/9/07 2:25 pm Page 112

there is wide variation in effective loft and rise angle at impact. There will thus bewide variation in effective launch angle and spin rate between the players, which hasto be individually controlled and adjusted. More generally, the putter can be seen asa task-specific constraint that might widely influence learning and performance. Amisfitted putter will thus result in a sub-optimal solution for the task. The differenttypes of putters used by the Tour players, as well as misfitted putters, may explainsome of the variance in our data sample from Tour players. We are in the process ofdeveloping a SAM PuttLab putter-fitting protocol that trades off both aspects ofneutral technique and individual preferences.
Most of the Tour players show one common characteristic in their strokes – a veryhigh repeatability of their individual movement pattern, which is described by theConsistency score. At the same time, many elite players seem to accept a limitedamount of tendency in their technique. A small amount of tendency might evenfacilitate greater consistency through greater reliance on movement instincts. Thebest individual solution might differ from a theoretical technical optimum in a certainworkspace.
Although swing time varies widely among elite players, many players exhibit abackswing rhythm (ratio of backswing time to time to impact) that is very close to theaverage ratio of 2.1. For example, Tiger Woods shows a rhythm of 2.2, with abackswing time of 660 ms; whereas Loren Roberts shows exactly the same rhythm of2.2, but with a backswing time of 977 ms.
Generally, we found a distinction could be made between feel and technicalplayers. Feel players report that they don’t really care about their putting technique.Very often these players did not want to be measured on the PuttLab, because theywere afraid of being flooded with technical thoughts. If we measure feel players, theynormally show very high consistency in their strokes but also a certain amount oftendencies and compensations. Also for feel players, it would make much sense toneutralize the stroke as much as possible without reducing the amount of consistency.Technical-oriented players have minimized their tendencies, but often show reducedconsistency. The technical players like the PuttLab and want to know every detail oftheir putting stroke. Reducing the technical thoughts and allowing the body to moreintuitively act immediately increases the consistency in these players. In technicalplayers, we often work on movement aspects like rhythm or smooth face rotation. Thebalancing out between the two contradictory aspects of control (technique) andmovement (feel) appears to be crucial.
Another important finding relates to the face rotation through impact. There aremany discussions about the correct amount of face rotation, but the consistency offace rotation is rarely considered. Often face rotation is not understood as a naturalconsequence of moving the putter on an inclined swing plane. Face rotation is ofteninterpreted as being detrimental to the stroke. We found many players who tend tomanipulate the putter face to reduce rotation or to block the face square throughimpact. Blocking the natural behavior of the putter face is disturbing the smoothnessof the stroke and is reducing consistency of face rotation. There is another implicationlurking behind blocking of face rotation. In our data, the yips can be typicallyidentified as an involuntary twitching and jerking of the putter face induced by theright hand. This shows up in irregular and large oscillations of face rotation around
Sam PuttLab 113
Annual Review of Golf Coaching 4/9/07 2:25 pm Page 113
impact. The oscillations found in mild forms of the yips look very similar to therotation signal if there is a blocking of face rotation through impact. In some of theplayers, the blocking strategy already resulted in remarkable and inconsistentoscillations. Our data on face rotation provides evidence that there is a continuumbetween (subconsciously driven) manipulations of the putter face at impact and thedevelopment of the yips. Data collected using the PuttLab can uncover the tendencyfor a player to develop the yips. Interestingly, the golfers we identify as being at riskof the yips before outbreak normally do not show signs of anxiety and stress whichis often reported as being the cause for developing the yips. Contrary to a recentreview of the literature [7], the anxiety related to yips could more be a consequenceof the problem rather than the true cause of it.
CONCLUSIONThe aim of this article was to provide objective data on the putting strokes of PGATour players. Although the results are limited in reliability due to the varyingenvironmental conditions at different venues, there is still a wealth of information thatcan help us to better understand the processes involved in successful putting. Insightsinto the yips provided by data on putter face rotation shows the potential value of theSAM PuttLab for multi-disciplinary research in the science and psychology ofputting.
REFERENCES1. Fowler, C.A. and Turvey, M.T., Skill Acquisition: An Event Approach With Special Reference to
Searching for the Optimum of a Function of Several Variables, in: Stelmach, G.E., ed., InformationProcessing in Motor Control and Learning, Academic Press, New York, 1987, 2-38.
2. Marquardt, C. and Mai, N., A Computational Procedure for Movement Analysis in Handwriting,Journal of Neuroscience Methods, 1994, 52(1), 39-45.
3. Pelz, D., Dave Pelz’s Putting Bible, Doubleday, New York, 2000.
4. Nilsson, J. and Karlsen, J., A New Device for Evaluating Distance and Direction Performance ofGolf Putters, Journal of Sports Sciences, 2006, 24(2), 143-147.
5. Marquardt, C., Gentz, W. and Mai, N., On the Role of Vision in Skilled Handwriting, in: Simner,M.L., Leedham, G. and Thomassen, A.J.W.M., eds., Handwriting and Drawing Research, IOSPress, Amsterdam, 1996, 87-97.
6. Guadagnoli, M., Holcomb, W. and Davis, M., The Efficacy of Video Feedback for Learning theGolf Swing, Journal of Sports Sciences, 2002, 20, 615-622.
7. Smith, A.M., Adler, C.H., Crews, D., Wharen, R.E., Laskowski, E.R., Barnes, K., Bell, C.V., Pelz,D., Brennan, R.D., Sorenson, M.C. and Kaufman, K.R., The ‘Yips’ in Golf: A Continuum Betweena Focal Dystonia and Choking, Sports Medicine, 2003, 33(1), 13-31.
114 Annual Review of Golf Coaching 2007
Annual Review of Golf Coaching 4/9/07 2:25 pm Page 114