The Role of Test Data Analysis in Taking MEMS from Initial ... - Galaxy Semi Solutions.pdf ·...
26
GALAXY The Role of Test Data Analysis in Taking MEMS from Initial Characterization to Volume Production Dan King Sr. Applications Engineer, Galaxy Semiconductor Solutions 1 1 www.galaxysemi.com
Transcript of The Role of Test Data Analysis in Taking MEMS from Initial ... - Galaxy Semi Solutions.pdf ·...

GALAXY
The Role of Test Data Analysis in Taking MEMS from Initial Characterization to
Volume Production
Dan King Sr. Applications Engineer, Galaxy Semiconductor Solutions
1
1 www.galaxysemi.com

GALAXY
Agenda
Introduction
Case studies for test data analysis in the MEMS lifecycle
– Characterization: Mcube
– Production yield management: SiTime
– DPM reduction: Analog Devices
2 www.galaxysemi.com

GALAXY
MEMS Challenges
High reliability
High volume
Blood pressure sensors
Air bag sensors Motion
sensors for mobile devices
3 www.galaxysemi.com
Rapid volume ramp with high quality

GALAXY
Test Data Analysis is Key to Successful Ramp
Device characterization
Test program qualification
Subcon acceptance testing
Yield/volume ramp acceleration
Production yield management
DPM reduction/outlier removal
Wafer Sort Final Test
Inspection & Metrology equip Bench
Instruments
ATE
Wafer Fab equip.
Local databases
ATE
Parametric data Bin data
4 www.galaxysemi.com

GALAXY
Case Study #1: mCube
Company/product status:
– Transitioning into production
Products:
– MEMS-based single-chip motion sensors
Target applications:
– Mobile gaming, image stabilization, navigation
Data analysis challenge:
– Device characterization and test limit setting
– Create infrastructure for fast volume ramp
5 www.galaxysemi.com
GALAXY
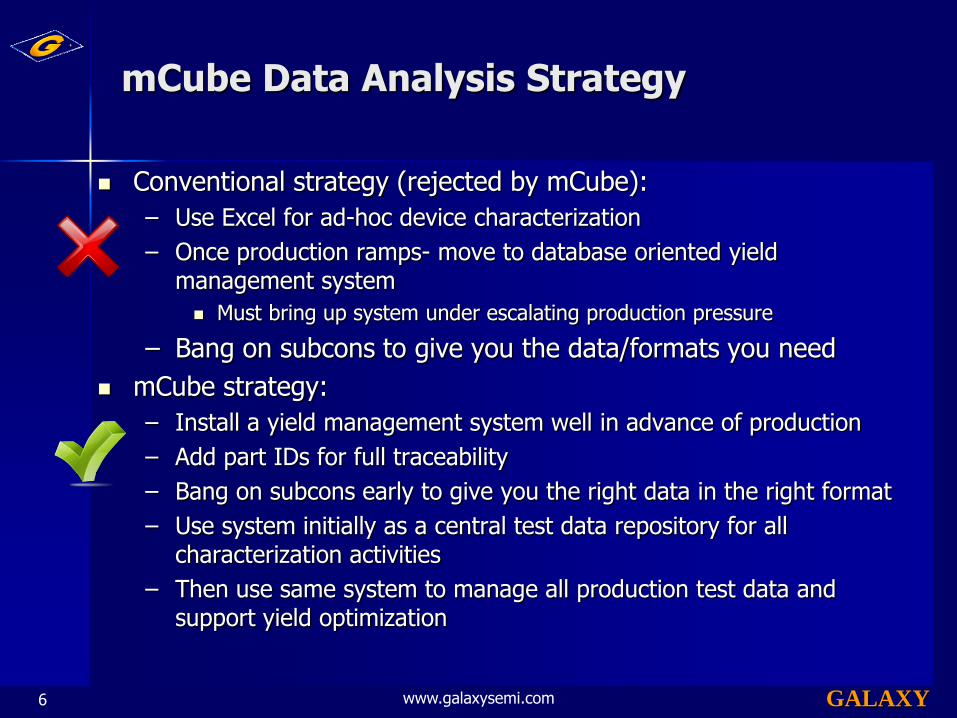
mCube Data Analysis Strategy
Conventional strategy (rejected by mCube):
– Use Excel for ad-hoc device characterization
– Once production ramps- move to database oriented yield management system
Must bring up system under escalating production pressure
– Bang on subcons to give you the data/formats you need
mCube strategy:
– Install a yield management system well in advance of production
– Add part IDs for full traceability
– Bang on subcons early to give you the right data in the right format
– Use system initially as a central test data repository for all characterization activities
– Then use same system to manage all production test data and support yield optimization
6 www.galaxysemi.com

GALAXY
Data Queries
Yield Management System Architecture
Automated FTP Transfer
Test House#1 Test House#2 Test House#N
RDB Query Interface
Interactive analysis
Automated Yield & SPC Alarms
Automated
Data Insertion
Automated Report
Generation
Management reports
Detailed reports
Test Data Repository
(RDB)
MySQL
7 www.galaxysemi.com
GALAXY
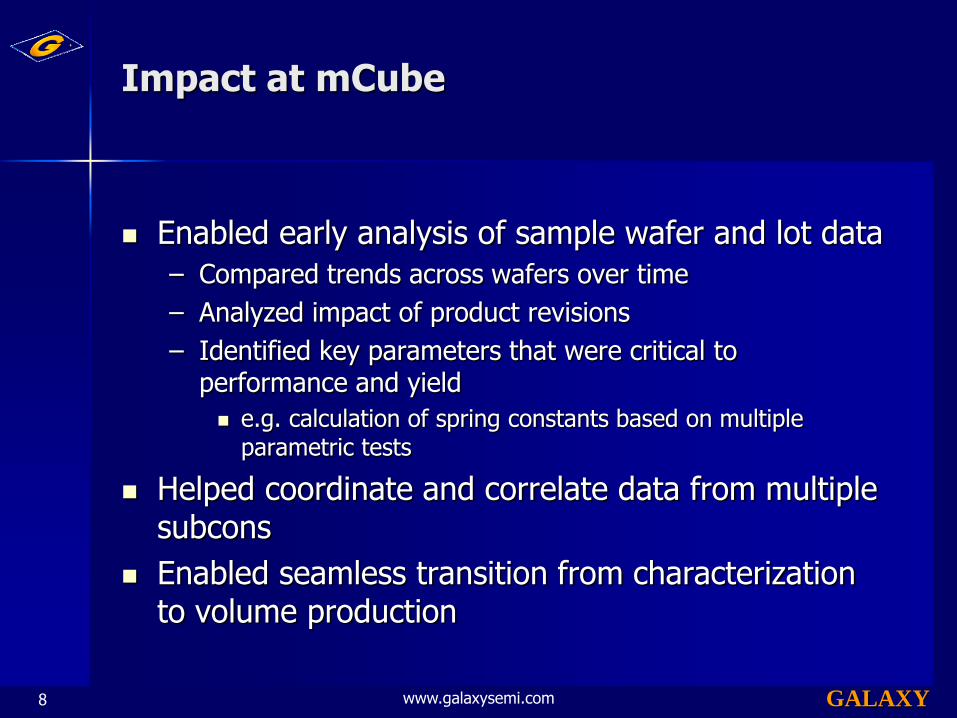
Impact at mCube
Enabled early analysis of sample wafer and lot data
– Compared trends across wafers over time
– Analyzed impact of product revisions
– Identified key parameters that were critical to performance and yield
e.g. calculation of spring constants based on multiple parametric tests
Helped coordinate and correlate data from multiple subcons
Enabled seamless transition from characterization to volume production
8 www.galaxysemi.com
GALAXY
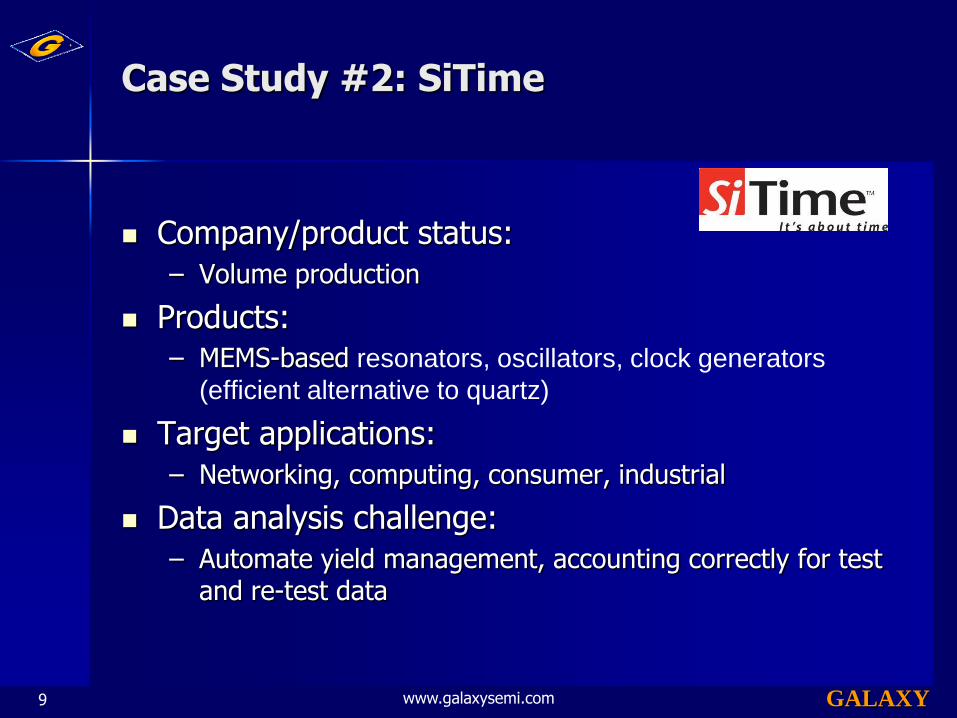
Case Study #2: SiTime
Company/product status:
– Volume production
Products:
– MEMS-based resonators, oscillators, clock generators
(efficient alternative to quartz)
Target applications:
– Networking, computing, consumer, industrial
Data analysis challenge:
– Automate yield management, accounting correctly for test and re-test data
9 www.galaxysemi.com

GALAXY
How SiTime Uses Automated Test Data Management for Yield Monitoring
Data is automatically inserted for all SiTime products:
– Currently 14 product families, with over 25,000 programmable part numbers.
– Data is from in-house production and from global subcons.
– Includes Final Test, WAT, PCM, and Wafersort data
Automated yield reports generated on a weekly basis
Major hurdle was calculation of consolidated yield data with multiple retests
10 www.galaxysemi.com
GALAXY
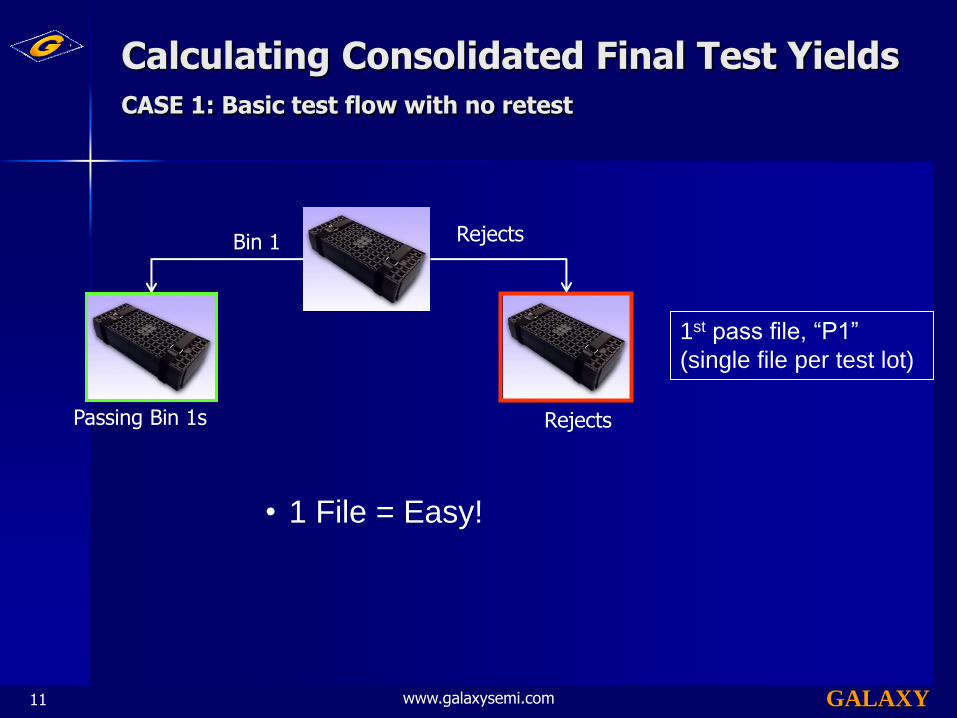
Calculating Consolidated Final Test Yields CASE 1: Basic test flow with no retest
• 1 File = Easy!
Rejects Bin 1
Rejects Passing Bin 1s
1st pass file, “P1”
(single file per test lot)
11 www.galaxysemi.com
GALAXY
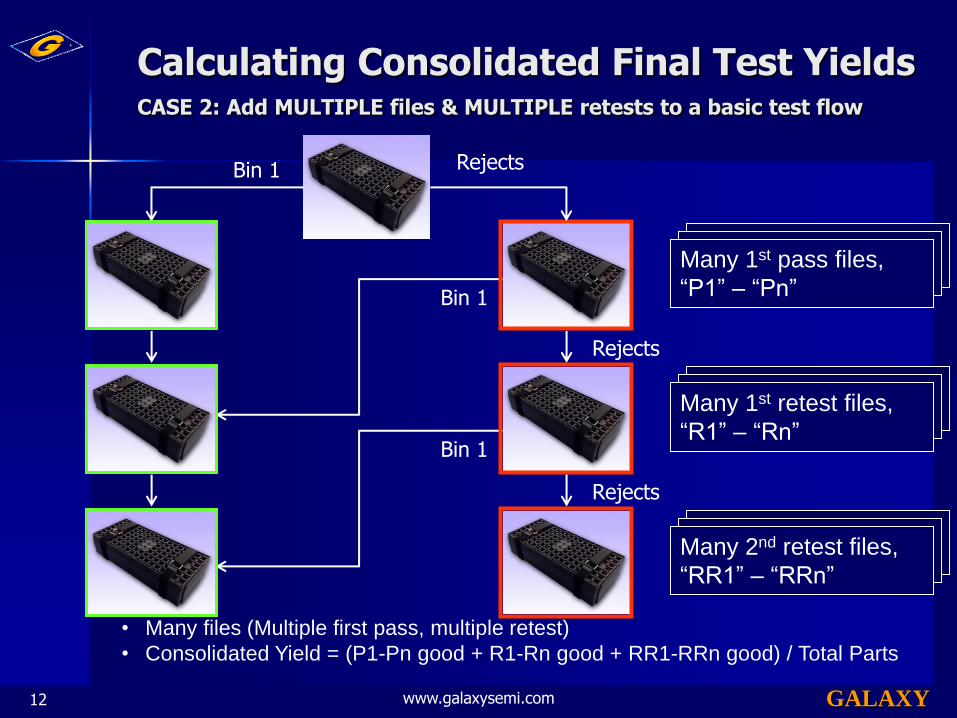
Calculating Consolidated Final Test Yields CASE 2: Add MULTIPLE files & MULTIPLE retests to a basic test flow
Rejects
• Many files (Multiple first pass, multiple retest)
• Consolidated Yield = (P1-Pn good + R1-Rn good + RR1-RRn good) / Total Parts
Bin 1
Rejects
Bin 1
Many 1st pass files,
“P1” – “Pn”
Many 1st retest files,
“R1” – “Rn”
Rejects
Bin 1
Many 2nd retest files,
“RR1” – “RRn”
12 www.galaxysemi.com
GALAXY
Challenges for Accurate Calculation of Consolidated Final Test Yields
Each lot is different
– Multiple files possible for each step (1st pass, retests)
– Number of retests vary from lot-to-lot
Lot quantity inconsistencies:
– Lost parts (Less parts retested than originally failed)
– “Created” parts (More parts retested than originally failed
Manual calculation is possible but not efficient:
– Many places for calculation errors
– Templates can make it a little easier but too many variables
– Extremely time consuming
13 www.galaxysemi.com

GALAXY
The Solution
Establish consistent naming convention for final test and retest lots
• P1 – Pn = 1st pass files
• R1 – Rn = 1st retest files
• RR1 – RRn = 2nd retest files
Set up software to automatically recognize which retest scenario is present
Automate the computation of consolidated yield based on the appropriate formula
– e.g. (P1-Pn good + R1-Rn good + RR1-RRn good) / Total Parts
14 www.galaxysemi.com

GALAXY
Example Consolidated Yield Graph – Weekly report
15 www.galaxysemi.com
GALAXY
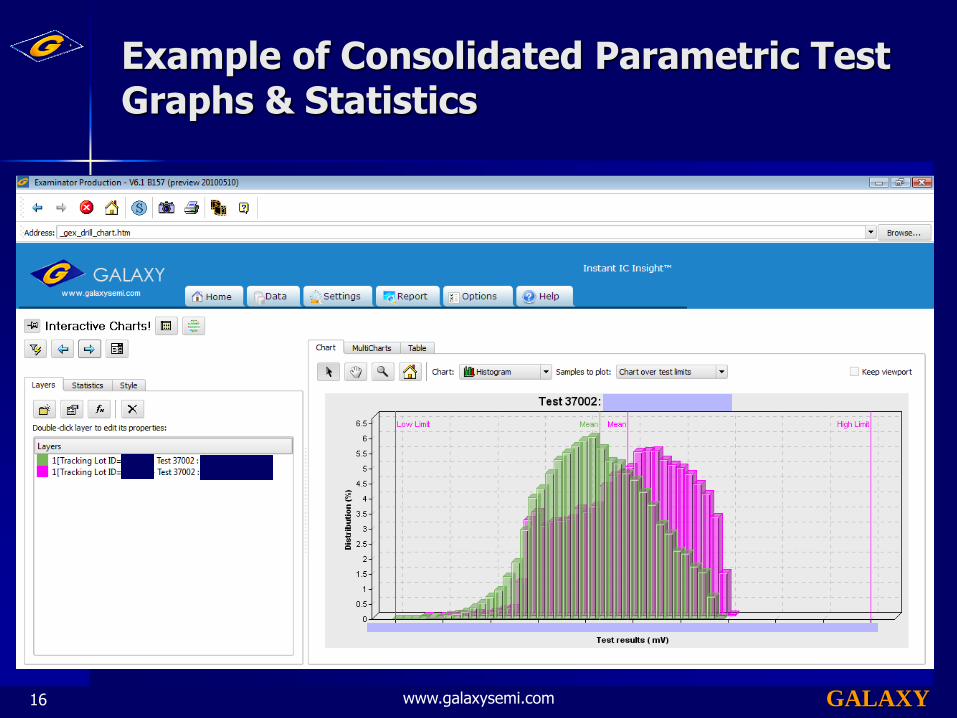
Example of Consolidated Parametric Test Graphs & Statistics
16 www.galaxysemi.com
GALAXY
Impact of Automated Yield Management at SiTime
Allows their engineers to spend time solving problems instead of…
– Manually collecting and storing data
– Filling out spreadsheets for yield graphs
– Manually creating consolidated reports for each lot
– Manually importing and filtering files for consolidated stats, histos, and paretos
Accurate data analysis capabilities has been key to
– Improving process & throughput
– Reducing production costs!
17 www.galaxysemi.com

GALAXY
Case Study #3: Analog Devices
Company/product status:
– High volume production
Products:
– MEMS-based collision sensors
Target applications:
– Automotive air bags
Data analysis challenge:
– Implement DPM reduction techniques dictated by automotive customers without sacrificing too much yield
Test strategy:
– Implement Part Average Testing (PAT) and Geographical outlier removal at wafer sort
18 www.galaxysemi.com
GALAXY
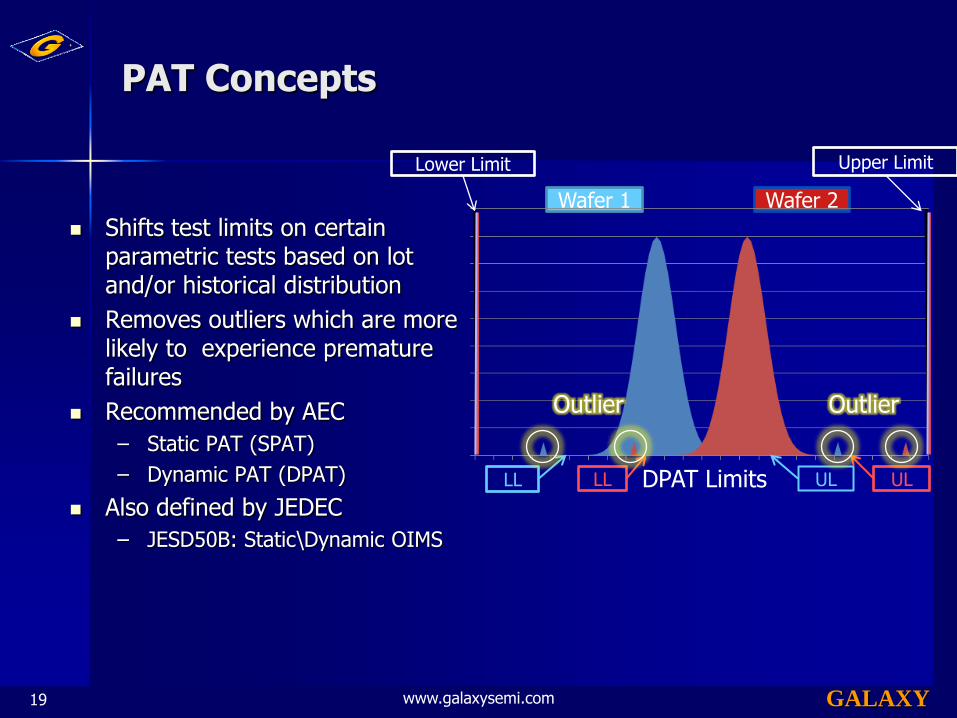
PAT Concepts
Shifts test limits on certain parametric tests based on lot and/or historical distribution
Removes outliers which are more likely to experience premature failures
Recommended by AEC
– Static PAT (SPAT)
– Dynamic PAT (DPAT)
Also defined by JEDEC
– JESD50B: Static\Dynamic OIMS
Wafer 1 Wafer 2
Upper Limit Lower Limit
LL LL UL UL DPAT Limits
Outlier Outlier
19 www.galaxysemi.com

GALAXY
Example of Geographic Outliers
Good die in a bad neighborhood
?
20 www.galaxysemi.com
GALAXY
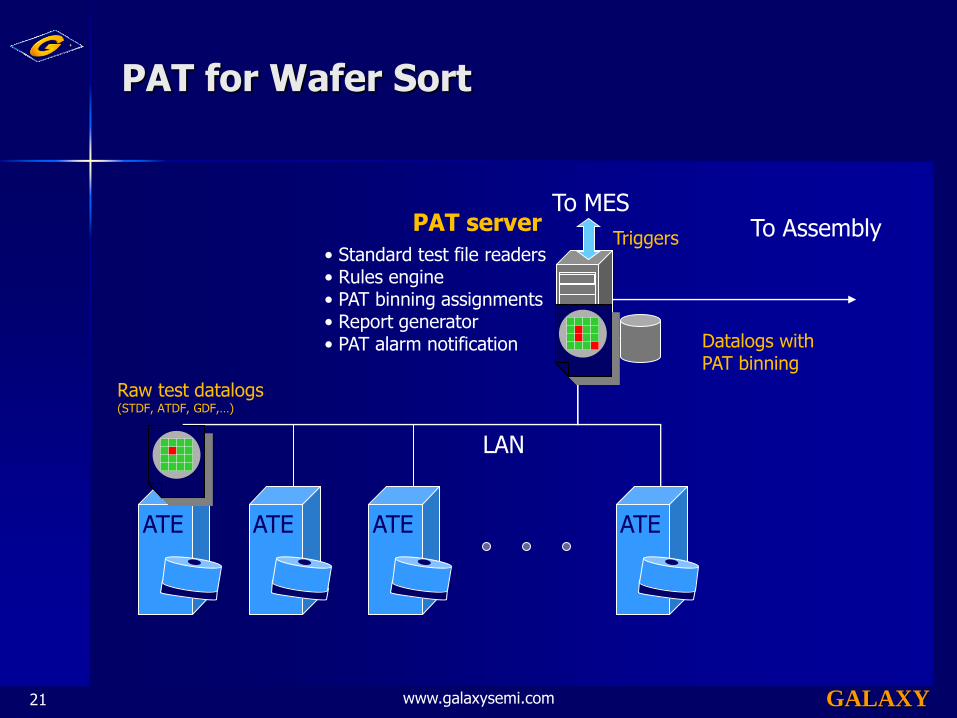
PAT for Wafer Sort
ATE ATE ATE ATE
LAN
PAT server
Raw test datalogs (STDF, ATDF, GDF,…)
• Standard test file readers • Rules engine • PAT binning assignments • Report generator • PAT alarm notification Datalogs with
PAT binning
To Assembly To MES
Triggers
21 www.galaxysemi.com

GALAXY
PAT Background at ADI
Automated Part Average Test solutions were released into Analog Devices wafer sort areas (Probe) in 2005
Initially implemented to satisfy Automotive Market sector requirements
Have extended use of PAT into specific Consumer products
Discovered hidden value of PAT to aid continuous improvement activities in Probe
22 www.galaxysemi.com
GALAXY
DataLog
DataLog
DataLogs
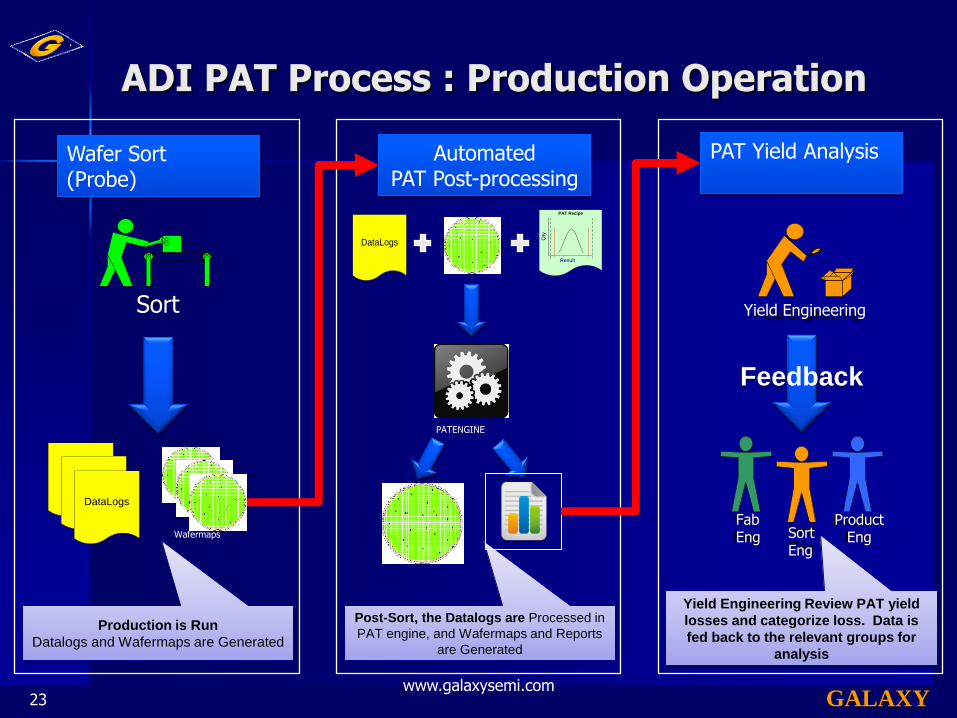
Wafer Sort (Probe)
Production is Run
Datalogs and Wafermaps are Generated
Wafermaps
Sort
ADI PAT Process : Production Operation
www.galaxysemi.com
Sort
Automated PAT Post-processing
PAT Recipe
Qty
Result
Post-Sort, the Datalogs are Processed in
PAT engine, and Wafermaps and Reports
are Generated
PATENGINE
DataLogs
PAT Yield Analysis
Yield Engineering
Yield Engineering Review PAT yield
losses and categorize loss. Data is
fed back to the relevant groups for
analysis
Feedback
Fab
EngSort
Eng
Product
Eng
Yield Engineering
Fab Eng Sort
Eng
Product Eng
23
GALAXY
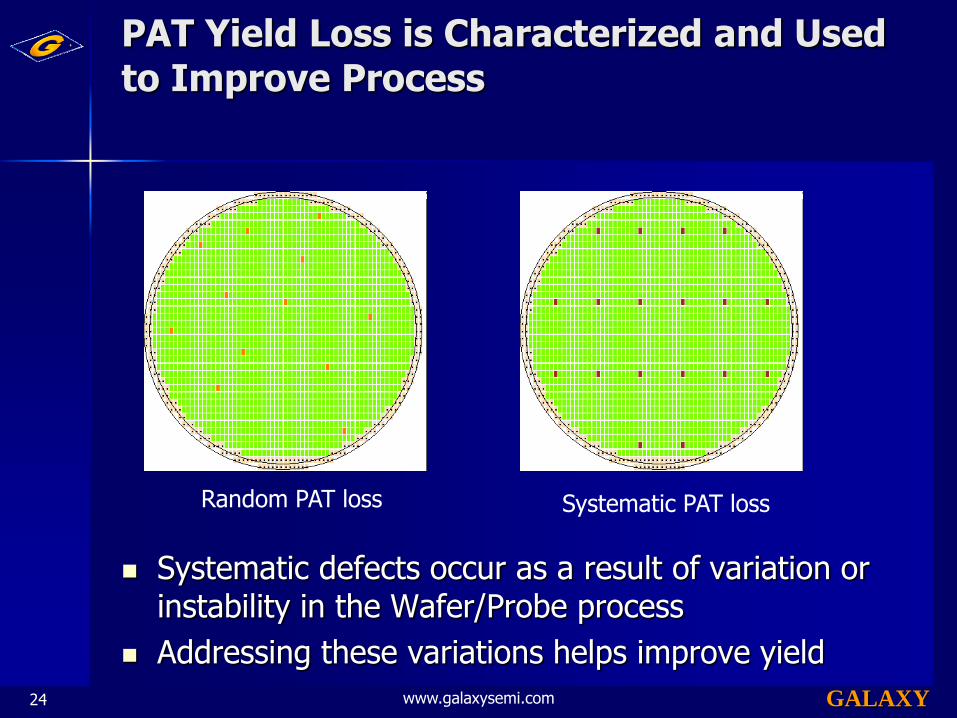
PAT Yield Loss is Characterized and Used to Improve Process
Systematic defects occur as a result of variation or instability in the Wafer/Probe process
Addressing these variations helps improve yield
Random PAT loss Systematic PAT loss
24 www.galaxysemi.com
GALAXY
Lessons Learned at ADI
PAT can lead to both lower DPM and improved yield
PAT loss review is integral to the Continuous Improvement and Quality process
Minimizing variation decreases PAT loss and improves processes for all material
www.galaxysemi.com 25
GALAXY
Summary of Key Lessons Learned
mCube:
– Early deployment of automated test data management is key to rapid production ramp
SiTime:
– Automated yield management with retest consolidation saves a huge amount of time and lets engineers focus on real problem-solving
ADI:
– PAT outlier removal and analysis reduces DPM and actually helps improve yield
Galaxy:
– We are excited to be part of the MEMS community and are here to answer your questions about data analysis
26 www.galaxysemi.com