The Role of Openness in the E ect of ICT on Governance€¦ · · 2018-02-042 2017 African...
37
Munich Personal RePEc Archive The Role of Openness in the Effect of ICT on Governance Simplice Asongu and Jacinta Nwachukwu January 2017 Online at https://mpra.ub.uni-muenchen.de/84344/ MPRA Paper No. 84344, posted 4 February 2018 07:26 UTC
Transcript of The Role of Openness in the E ect of ICT on Governance€¦ · · 2018-02-042 2017 African...

MPRAMunich Personal RePEc Archive
The Role of Openness in the Effect ofICT on Governance
Simplice Asongu and Jacinta Nwachukwu
January 2017
Online at https://mpra.ub.uni-muenchen.de/84344/MPRA Paper No. 84344, posted 4 February 2018 07:26 UTC

1
A G D I Working Paper
WP/17/050
The Role of Openness in the Effect of ICT on Governance
Forthcoming in Information Technology for Development
Simplice A. Asongu
African Governance and Development Institute,
P.O Box 8413, Yaoundé, Cameroon.
E-mail: [email protected]
Jacinta C. Nwachukwu
School of Economics, Finance and Accounting,
Faculty of Business and Law,
Coventry University
Priory Street, Coventry, CV1 5FB, UK
Email: [email protected]

2
2017 African Governance and Development Institute WP/17/050
Research Department
The Role of Openness in the Effect of ICT on Governance
Simplice A. Asongu & Jacinta C. Nwachukwu
January 2017
Abstract
The study investigates how openness influences information and communication technology
(ICT) penetration for improved government quality in sub-Saharan Africa for the period
2000-2012. Openness is measured in terms of trade and financial globalisation whereas ICT is
proxied with mobile phone and internet penetration rates. Ten bundled and unbundled
governance indicators are used. The empirical evidence is based on Generalised Method of
Moments with forward orthogonal deviations. The main findings are: First, financial
openness has an edge over trade openness when combined with ICT to affect both economic
and institutional governance. Second, mobile phones have an edge over internet penetration in
complementing (i) trade openness for economic governance and (ii) financial openness for
institutional governance. Third, net effects on political governance are consistently negative.
Taken together, in the short-run, openness-driven ICT policies are more rewarding in terms of
economic and institutional governance than political governance. Fourth, catch-up in
governance is facilitated by the interaction between openness and ICT. Contributions of these
findings to literature are discussed.
JEL Classification: F40; O38; O40; O55; P37
Keywords: Openness; ICT; Governance; Africa

3
1. Introduction
Information technology has been documented to enhance: living standards (Chavula,
2013); economic growth (Levendis & Lee, 2013; Qureshi, 2013a); welfare externalities
(Carmody, 2013; Qureshi, 2013bc); life for all (Kivuneki et al., 2011; Ponelis & Holmner,
2013ab); banking sector development (Kamel, 2005) and sustainable growth (Byrne, 2011) in
developing countries. While information technology has been established to bring about these
socio-economic and human development rewards, very little is known about the interaction
between information technology and macroeconomic variables for institutional outcomes.
Investigating the role of openness in the effect of information communication
technology (ICT) on governance in sub-Saharan Africa (SSA) is motivated by four
contemporary strands of the literature, notably, the: (i) growth potential of ICT and
recommendations for more scholarly research on the effect of ICT; (ii) ineluctability of
openness in 21st century development
1; (iii) role of institutions in fighting Africa’s extreme
poverty tragedy and (iv) gaps in the literature on ICT and governance.
First, compared to frontier markets in Asia and the Organisation for Economic
Cooperation and Development (OECD) nations that are currently experiencing some degree
of stabilisation in the growth of ICT, there is a growth potential in peripheral markets in
Africa (Asongu, 2017a; Penard et al., 2012). Penard et al. (2012) reported that the mobile
phone and internet penetration rates in Africa were respectively 41 percent and 9.6 percent in
2010. While, the potential for ICT penetration on the continent represents development
opportunities, there have been concerns in scholarly circles not to consider ICT as a silver
bullet for economic development (Asongu & De Moor, 2015; Mpogole et al., 2008, p. 71).
Second, openness is essential for the prosperity of nations in the era of globalisation.
In essence, there is consensus in the literature that integration into the global economy is
indispensable for 21st century development (Oluwatobi et al., 2015; Tchamyou, 2015).
According to this strand of literature, Africa is lagging behind in the drive towards knowledge
economy (KE) which is crucial for contemporary development (Anyanwu, 2012; Asongu,
2017b). The narrative maintains that the course of global development is being charted by
North America and Europe because they are frontier nations that have mastered the dynamics
of KE. While the KE pattern of Japan has set the course for the newly industrialised
economies of Asia, Malaysia and China, Latin American nations have been responding with
policy initiatives that articulate their growing pursuit for KE. This starkly contrasts with KE
1 Openness may be used interchangeably with globalisation throughout the paper.

4
trends in Africa that have been dropping compared to other regions of the world (see,
Anyanwu, 2012).
Third, in the post-2015 sustainable development agenda, institutions are crucial in the
fight against SSA’s extreme poverty tragedy (Kuada, 2015). The sub-region’s poverty tragedy
has been recently emphasised by an April 2015 World Bank report on the attainment of
Millennium Development Goals (MDGs) extreme poverty target which has revealed that
extreme poverty has been decreasing in all regions of the world with the exception of SSA
(World Bank, 2015)2. The evidence that 45 percent of countries in the sub-region are off-track
from achieving the MDG extreme poverty target greatly contrasts with suggestion that it has
been enjoying over two decades of growth resurgence that started in the mid-1990s (see Fosu,
2015, p. 44). This has motivated a recent stream of literature devoted to understanding
Africa’s immiserizing growth, notably: (i) Kuada’s (2015) proposition of a ‘soft economics
paradigm’ based on human capabilities development and (ii) Fosu’s (2015bc) inquiry into
whether Africa’s growth resurgence is a myth or a reality with assessments of
interconnections between institutions and growth in Africa’s development. Moreover, the
quality of institutions has been established to be strongly linked to inclusive growth, through:
strengthening of social change foundations (Efobi, 2015) and improvement of living standards
by means of better resource allocation (Fonchingong, 2014; Anyanwu & Erhijakpor, 2014;
Fosu, 2013ab).
Fourth, despite the established roles of institutional quality (Fosu, 2015bc) and ICT
(Asongu, 2015) in inclusive development, the literature on development outcomes has not
given the link between ICT and institutions the research attention it deserves. Accordingly, as
far as we are aware, only four lines of inquiry have assessed the role of ICT on governance in
Africa, namely: Porter al. (2016); Gagliardone (2015); Mathias (2012) and Snow (2009).
Snow establishes a negative relationship between corruption and ICT while Mathias
documents the evolving role of connectivity in boosting accountability on the continent.
Gargliardone investigates the relationship between mobile-radio interactions and government
quality to establish that such interactions can substantially boost measures taken by the
2 It is important to substantiate how the MDG extreme poverty target, the post-2015 sustainable development
agenda and the poverty Sub-Saharan Africa are related. At least six of the seventeen SDGs are concerned with
the need to enhance inclusive development, namely: Goal 1(end poverty in all its forms everywhere), Goal 2
(end hunger, achieve food security and improved nutrition and promote sustainable agriculture); Goal 3 (ensure
healthy lives and promote well-being for all ages); Goal 4 (ensure inclusive and equitable quality education and
promote lifelong learning opportunities for all); Goal 8 (promote sustained, inclusive and sustainable economic
growth, full and productive employment and decent work for all ) and Goal 10 (reduce inequality within and
among countries). The interested reader can find more information on the SDGs in Michel (2016).
5
government of Kenya towards prevention and correction. Porter et al. conclude that youth
usage of the mobile telephony has great potential of being instrumental for enhancing
practical and policy harmony in a sample of selected African countries, namely: Ghana,
Malawi and South Africa.
The above literature noticeably leaves space for improvement in four key areas. First,
the discussed literature is restricted to selected dimensions of good governance. For example,
Snow has exclusively focused on the corruption dimension of good governance. Second, some
conclusions are characterised with caveats of correlations, such that causality cannot be
inferred for more robust policy implications. For instance, the findings of Snow are
statistically fragile because they are interpreted as correlations, not causality. Third, a bulk of
the literature is oriented towards country-specific inquiries that have limited policy relevance
in terms of scope (e.g. Porter et al., 2016; Snow, 2009). Fourth, the studies have either not
directly: (i) involved the use of ICT for good governance (see Gagliardone, 2015) or (ii)
focused on good governance as a development outcome (see Porter et al., 2016). Moreover, it
is important to model the ICT-governance nexus by integrating openness as a policy tool
in order to internalise the ineluctable phenomenon of globalisation. This modelling approach
steers clear of techniques in the previous studies that are based on interactions among ICT
variables, notably Gargliardone (2015) on radio-mobile interdependencies.
The present inquiry addresses the aforementioned gaps in the literature by
investigating the influence of openness in ICT penetration for governance in SSA. More
specifically, the research question we seek to answer in this inquiry is: how does openness
complement ICT penetration for better governance in SSA?
The rest of the study is organised as follows. Section 2 discusses the theoretical
underpinnings and clarifies the concept of governance. The data and methodology are
discussed in Section 3. The empirical results, discussion and policy implications are covered
in Section 4 while Section 5 concludes.
2. Clarification of Governance Concepts and Theoretical Highlights
2.1 Intuition and theory
The section discusses the theory behind our topic of research in two main strands,
namely: (i) the link between ICT and governance and (ii) the link between openness and
governance. We may deal with each in turn.
2.1.1 Link between ICT and governance

6
In accordance with Hellstorm (2008), ICT is a vital tool for enhancing governance
because it can improve transparency, accountability and the free-flow of information between
several institutions and departments within a government. According to the author, ICT on the
one hand eases the participation of citizens in the adoption of decisions that influence their
living standards and on the other, enables the diffusion of information between citizens and
governments. In summary, better governance is achieved by the means of the ICT enabling
the convergence of societies for more participation and information sharing..
In the same vein as the above intuition, Snow (2009, p. 337-339) provided a
theoretical account of the link between ICT and improved governance. It was pointed out that
the historic dearth of ICT in the African continent provided the elite with a comparative
advantage. Such preferential endowments in ICT facilities enabled the ruling classes and their
sponsors to evade accountability and transparency, especially in the management of public
offices. Under these circumstances, the elite is equally endowed with conducive conditions
for rent seeking and corruption in the management of public goods and services. According to
Snow (2009), ICT decentralisation should lift the barriers of secrecy that have hitherto
enabled the elite to engage in poor governance practices, by improving oversight and
accountability with consequent punishment for mismanagement. In summary, the insight
underlying this concept is consistent with the logic of Hellstorm (2008) in the perspective that
ICT has considerably mitigated information monopoly by the elite which previously
facilitated engagement in poor governance and the mismanagement public goods and services
(Suarez, 2006; Boulianne, 2009; Diamond, 2010; Grossman et al., 2014).
It is important to balance the above narrative with another aspect of the literature
which supports the thesis that ICT could promote political instability and violent actions
which are likely to ultimately worsen governance standards (Breuer et al., 2012; Pierskalla &
Hollenbach, 2013; Weidmann & Shapiro, 2015; Manacorda & Tesei, 2016).
2.1.2 Link between openness and governance
Theoretical underpinnings on the nexus between globalisation and governance has
been documented by an interesting stream of literature, inter alia: Klitgaard (1988); Treisman
(2000); Bonaglia et al. (2001); Lalountas et al (2011); Amavilah et al. (2014) and Asongu
(2014a). These studies are consistent with the positive influence of globalisation on good
governance. Lalountas et al and Asongu established the positive relationship between
globalisation and corruption-control in developing and African countries respectively. The
7
study of Amavilah et al. is based on the positive correlation between globalisation and
political stability. Bonaglia et al. built a model in order to show that globalization decreases
negative governance signals like corruption. The motivation is consistent with Klitgaard
(1998) which maintained that poor governance thrives on scenarios of power monopoly.
According to the writers, the incentive to bribery is less apparent in societies where economic
activities are undertaken within a framework of perfect competition. In the same vein, poor
governance decreases when (i) monopolistic government and economic activities are subject
to stringent accountability and (ii) economic rents are not contingent on the discretionary
power a few public officials. Hence, Treisman (2000) and Bonaglia et al. (2001) reported
political openness to traditions of protestant nature lead to improved governance standards.
This position accords with an earlier view by Klitgaard (1988) that less open countries enjoy
less political governance.
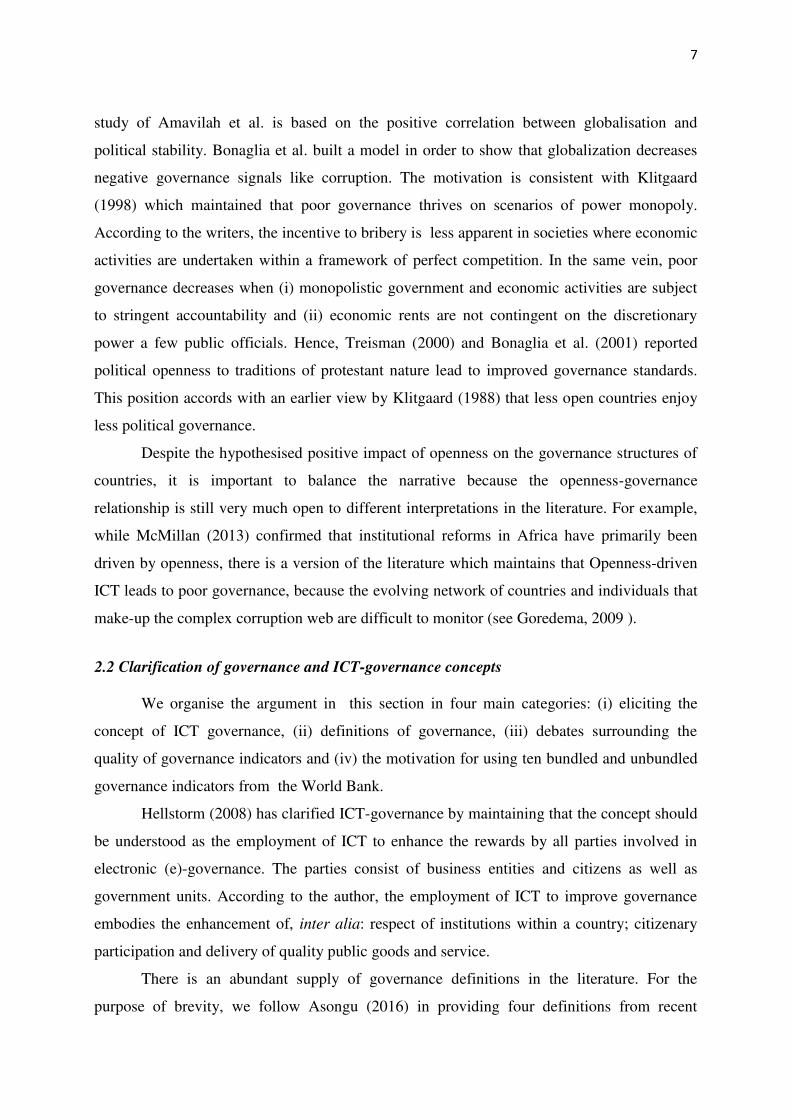
Despite the hypothesised positive impact of openness on the governance structures of
countries, it is important to balance the narrative because the openness-governance
relationship is still very much open to different interpretations in the literature. For example,
while McMillan (2013) confirmed that institutional reforms in Africa have primarily been
driven by openness, there is a version of the literature which maintains that Openness-driven
ICT leads to poor governance, because the evolving network of countries and individuals that
make-up the complex corruption web are difficult to monitor (see Goredema, 2009 ).
2.2 Clarification of governance and ICT-governance concepts
We organise the argument in this section in four main categories: (i) eliciting the
concept of ICT governance, (ii) definitions of governance, (iii) debates surrounding the
quality of governance indicators and (iv) the motivation for using ten bundled and unbundled
governance indicators from the World Bank.
Hellstorm (2008) has clarified ICT-governance by maintaining that the concept should
be understood as the employment of ICT to enhance the rewards by all parties involved in
electronic (e)-governance. The parties consist of business entities and citizens as well as
government units. According to the author, the employment of ICT to improve governance
embodies the enhancement of, inter alia: respect of institutions within a country; citizenary
participation and delivery of quality public goods and service.
There is an abundant supply of governance definitions in the literature. For the
purpose of brevity, we follow Asongu (2016) in providing four definitions from recent

8
literature. First, Dixit (2009) has defined economic governance as the ‘…structure and
functioning of the legal and social institutions that support economic activity and economic
transactions by protecting property rights, enforcing contracts, and taking collective action to
provide physical and organizational infrastructure’3 (p.5). Second, consistent with Fukuyama
(2013), the notion of governance can be improved with the mastery of some main approaches
to ‘state quality’, namely: output measures, political indicators and capacity measures which
consist of resource levels and professionalism. Third, with respect to Tusalem (2015), the
phenomenon of governance entails: corruption, bureaucratic effectiveness, regulation quality
and the rule of law. Fourth, Kaufmann et al. (2010) provide six governance measurements
that are classified in three categories, namely: (i) ‘political governance’ which is the election
and replacement of political leaders (proxied with political stability/no violence and voice and
accountability); (ii) ‘economic governance’, which is defined as the formulation and
implementation of policies that deliver public commodities (measured with government
effectiveness and regulation quality) and (iii) ‘institutional governance’ which is the respect
of the State and citizens of institutions that govern interactions between them (measured with
corruption-control and the rule of law).
Concerns about the quality of governance indicators from Kaufmann et al. have been
raised in the literature. Kaufmann and co-authors have been quick to respond to criticisms
with rebuttals and further clarifications. One of the most heated debates to this end has been
with Marcus Kurtz and Andrew Schrank. For the purpose of brevity, the interested reader can
have more insight into the debates in: measures and mechanisms (Kurtz & Schrank, 2007a); a
reply (Kaufmann et al., 2007a); a defense (Kurtz & Schrank, 2007b) and a rejoinder
(Kaufmann et al., 2007b).
In this study, the governance indicators adopted are those of Kaufmann et al. (2010)
because they are the most widely employed in the literature (see Gani, 2011; Yerrabit &
Hawkes, 2015; Andrés et al., 2015). For the purpose of robustness, we bundle the six
governance measurements into four additional governance composite indicators. The
motivation for bundling and unbundling governance indicators is consistent with an evolving
stream of governance literature, notably: in the prediction of the Arab Spring with negative
governance signals (Asongu & Nwachukwu, 2016a); the importance of economic governance
in innovation (Oluwatobi et al., 2015) and ongoing debates on institutional determinants of
investment (Asongu et al., 2016).
3 Emphasis on original.

9
3. Data and methodology
3.1 Data
This inquiry assesses 49 countries in SSA with data from World Development
Indicators (WDI) and World Governance Indicators (WGI) of the World Bank for the period
2000-2012. Consistent with recent knowledge economy literature (Tchamyou, 2015) and the
motivation for growth potentials in ICT on the continent discussed in the introduction (see
also Penard et al., 2012), ICT is measured in terms of mobile phone and internet penetration
rates. Globalisation is approximated by trade (imports plus exports of commodities) and
financial (foreign direct investment inflows) openness. The rationale for the choice of these
measurements of globalisation is consistent with perception in the existing literature that
trade and financial transactions are intuitively connected with ICT (see Amavilah et al., 2014;
Asongu, 2014a). A potential weakness of the adopted indicators of trade and financial
openness lies in the fact that they are skewed in favour of macroeconomic dimensions. Hence,
other aspects of country-level characteristics such as transparency, political and freedom of
speech are neglected. A reason for this disregard is that they are broadly captured in the
governance structure variables.
The six governance indicators from Kaufmann et al. (2010) are used as dependent
variables. These are bundled in Section 3.2.1 by means of principal component analysis
(PCA). We have already justified the choice of these variables in the preceding section. They
include: corruption-control, the rule of law, institutional governance, government
effectiveness, regulation quality, economic governance, political stability/no violence, ‘voice
and accountability’, political governance and general governance.
Five control variables are adopted in order to control for omission variable bias. After
a preliminary assessment, including more than five variables in the conditioning information
set results in instrument proliferation, meaning that the number of instruments exceeded the
number of cross section units in every specification. The control variables are: the lagged
dependent indicator, Gross Domestic Product (GDP) growth, population growth, educational
quality and foreign aid.
Economic growth and population growth have recently been employed by Asongu and
Nwachukwu (2016a) in predicting the Arab Spring based on catch-up in negative governance
signals. First, we expect GDP growth to be positively associated with good governance
because high-income countries have comparatively better government standards. Second,

10
population growth can also be positively linked to governance because more resources are
expected to be devoted to the management and service of a rising population. As a caution to
this point, it is important to note that population growth may also dampen the government’s
ability to effectively control the anticipated positive demographic change. Third, the impact of
foreign aid on governance has been subject to intense debate. Whereas Okada and Samreth
(2012) have concluded on a positive relationship between foreign aid and institutional quality
(e.g. corruption) in developing countries, Asongu and Nwachukwu (2016b) have used all the
six governance indicators from Kaufmann et al. (2010) employed in this study to consistently
establish a negative effect of foreign aid on the underlying government quality dynamics.
Fourth, the choice of ‘pupil-teacher ratio’ in primary education for educational quality is
motivated by the evidence that compared to other educational levels, it is more associated
with higher social returns in nations at initial stages of industrialisation (see Petrakis &
Stamatakis, 2002; Asiedu, 2014). The expected effect of education is also debatable. While
an element of the literature maintains that education worsens governance (Mocan, 2008;
Truex, 2011; Kaffenberger, 2012), a contending strand is of the position that schooling
improves governance standards (Lederman et al., 2005; Cheung & Chan, 2008).
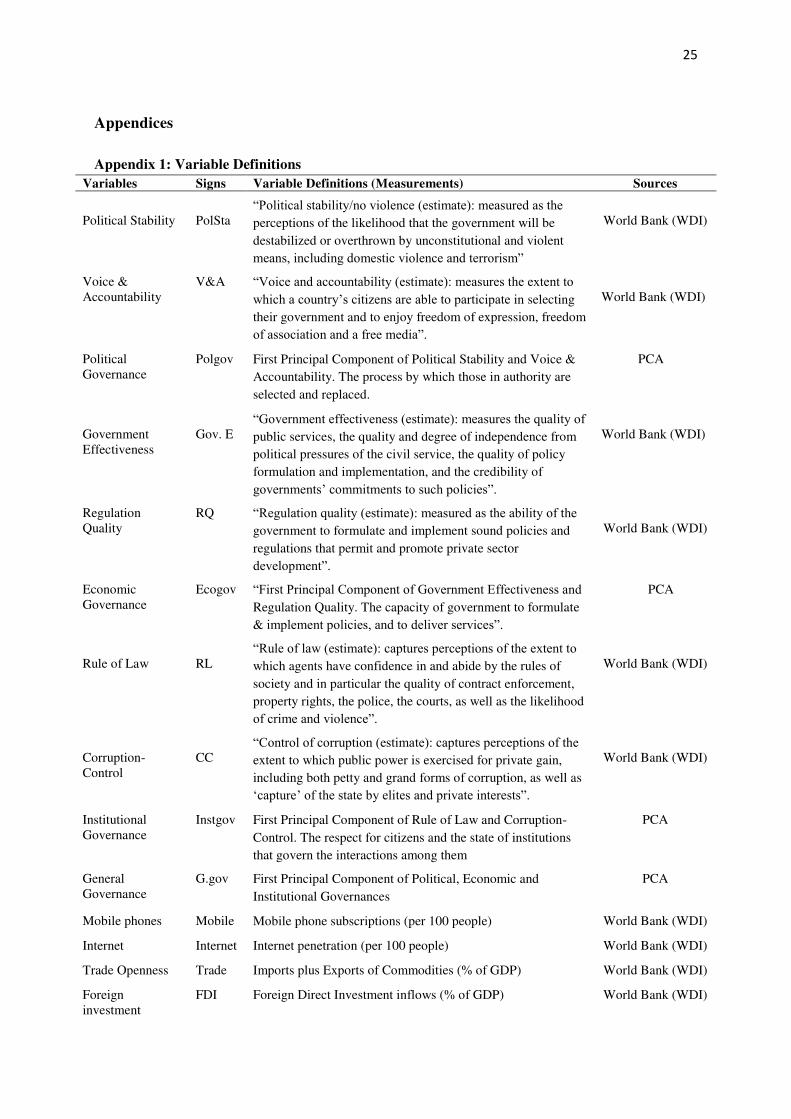
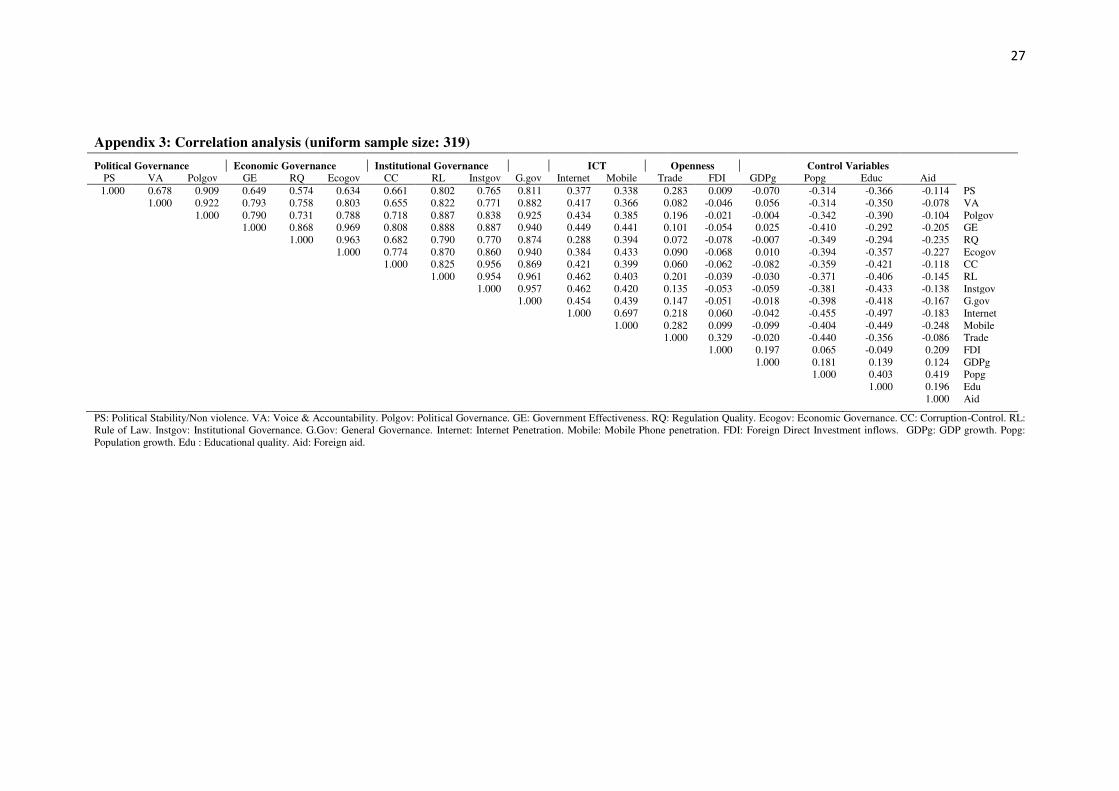
The definition of variables and corresponding sources are provided in Appendix 1.
The summary statistics is provided in Appendix 2 whereas Appendix 3 presents the pairwise
correlation matrix. In the light of information obtained from the summary statistics, two
points are worth emphasising. On the one hand, the average values of the variables are
comparable. On the other, based on variations from corresponding standard deviations, we
can be confident that reasonable estimated linkages would emerge. The objective of the
correlation matrix is to mitigate concerns about multicollinearity. From a preliminary
assessment, such concerns are apparent among governance variables for the most part. This
does not pose any concern about specification bias because the good governance indicators
are employed exclusively as dependent variables. The degree of substitution between ICT
variables is also high. We address the concern by employing the ICT regressors in distinct
specifications.
3.2 Methodology
3.2.1 Principal Component Analysis (PCA)
The paper employs the PCA technique to bundle the six governance measurements
from Kaufmann et al. (2010) into four composite governance measurements, namely:

11
political, economic, institutional and general governances. The same procedure for bundling
governance has been recently in employed in Asongu and Nwachukwu (2016a) in recent
African governance literature. While like in Factor Analysis, PCA is designed for interval
data, the technique can also be employed for ordinal data (such as Likert scales), when the
indicators are linearly related to one another. This is precisely the case with governance
variables which are highly correlated. The PCA is a statistical technique that is used to reduce
a set of highly correlated variables into a smaller set of uncorrelated variables called principal
components (PCs). The derived PCs constitute substantial information and variation in the
dataset. In this light, the six governance measurements are reduced into one common factor
known as general governance. Three more indicators are also derived from the six initial
measurements, namely: institutional governance (encompassing corruption-control and the
rule of the law); political governance (consisting of voice & accountability and political
stability) and economic governance (entailing regulation quality and government
effectiveness). Political governance is the election and replacement of political leaders while
Economic governance is the formulation and implementation of policies that deliver public
commodities. Institutional governance is the respect of the State and citizens of institutions
that govern interactions between them. This procedure for bundling and unbundling
governance variables by means of PCA is consistent with recent African governance literature
(Asongu, 2016; Asongu & Nwachukwu, 2016a).
The Jolliffe (2002) and Kaiser (1974) criterion is used to retain common factors. In
principle, only common factors with an eigenvalue that is higher than the mean or one are
retained as composite indicators. Accordingly, from Table 1, the General governance (G.Gov)
composite indicator represents more than 81 percent of variation in the six governance
variables and has an eigenvalue of 4.892. In the same vein, institutional governance (Instgov),
political governance (Polgov) and economic governance (Ecogov) have total variations
(eigenvalues) of 93.0 percent, 83.5 percent and 93.9 percent and (1.861, 1.671 and 1.878)
respectively.
It is important to allocate space to discussing concerns that may be linked to estimated
parameters that are obtained from previous estimations. According to Asongu and
Nwachukwu (2016c), the anxieties are linked to the consistency, efficiency and inferential
validity of estimated coefficients. According to Pagan (1984, p. 242), whereas two-step
estimators are consistent and efficient, very few valid inferences can be obtained. The caution
of the author is in accordance with a recent stream of literature surrounding the subject,

12
namely: Westerlund and Urbain (2013a); Ba and Ng (2006); McKenzie and McAleer (1997)
and Oxley and McAleer (1993).
“Insert Table 1 here”
Within the framework of this inquiry, we are employing PC-augmented variables.
Building on previous works4, Westerlund and Urbain (2012; 2013b) have provided some
insights into the limitation relating to the inferential quality of PC-derived indicators. The
authors built on argument in previous studies in establishing that normal inferences are
possible from PC-derived regressors provided that estimated coefficients converge to their
true values at the rate NT (with T being the number of time series and N denoting cross-
section observations). The authors have further maintained that for the convergence to take
place, N and T need to be sufficiently large. Unfortunately, the authors (Westerlund and
Urbain) have failed to specify how ‘large is large’. Looking at the specific context of this
study, we are working with all the 49 countries in SSA. Hence, we cannot extend N.
Stretching T further would compromise the validity of specifications because it is likely to
result in instrument proliferation. Moreover, recent institutional literature based on PC-
augmented regressors has concluded using comparatively lower values of T and N that valid
inferences are possible from bundled governance indicators. For instance, Asongu and
Nwachukwu (2016a) is based on 14 Middle East and North African countries for the period
1996-2006 while Asongu (2016) is based on BRICS (Brazil, Russia, India, China and South
Africa) and MINT (Mexico, Indonesia, Nigeria and Turkey) for the period 2001-2011. The
authors have made a case for the inferential validity of estimated coefficients. Compared to
this inquiry, both studies are based on lower values of N and T.
3.2.2 Estimation technique
The study adopts a Generalised Method of Moments (GMM) estimation strategy.
Consistent with Tchamyou and Asongu (2017), there are at least five main motivations for the
choice of the estimation strategy. The first-two are standard requirements for the adoption of
the approach whereas the last-three consist of advantages linked to adoption of the empirical
4 The works include: Stock and Watson (2002); Bai (2003); Pesaran (2006); Bai (2009) and Greenaway-
McGrevy et al. (2012).

13
approach. First, the estimation technique requires that the dependent variables are stable. As
apparent in Appendix 4, the governance indicators are persistent because the correlation
between levels and their corresponding lagged values is higher than the rule of thumb
threshold of 0.800. Second, the number of countries (N) is required to be higher that the
number of years (T). This is the case because the N (49)>T(12) condition is fulfilled. Third,
the estimation technique accounts for endogeneity by controlling for simultaneity and time-
invariant omitted variables. Fourth, cross-country differences are not eliminated in the
estimation approach. While country-fixed effects are eliminated in the GMM approach, cross-
country differences are automatically considered in the estimation because the technique is by
definition linked to panel data framework. Fifth, small sample biases in the difference
estimator are corrected by the system estimator. It is essentially for this fifth reason that Bond
et al. (2001, p. 3-4) have maintained that the system GMM technique (Arellano & Bover,
1995; Blundell & Bond, 1998) is better than the difference GMM approach (Arellano and
Bond, 1991).
This study instead adopts the Roodman (2009ab) extension of Arellano and Bover
(1995) that employs forward orthogonal deviations instead of first differences. This GMM
extension has been documented to control for cross-sectional dependence and restrict the
proliferation of instruments (Love & Zicchino, 2006; Baltagi, 2008). A two-step specification
procedure is adopted because it controls for heteroscedasticity. It is important to note that the
one-step approach is homoscedasticity-consistent.
The following equations in levels (1) and first difference (2) summarize the standard
system GMM estimation procedure.
tititih
h
htititititi WICTOpOpICTGG ,,,
4
1
,4,3,2,10,
(1)
titttihtih
h
h
titititititititititi
WW
ICTOpICTOpOpOpICTICTGGGG
,2,,,,
4
1
,,3,,3,,22,,1,,
)()(
)()()()(
(2)
where tiG , is a governance indicator (political, economic or institutional governance) of
country i at period t ; 0 is a constant;
represents the autoregressive order; ICT ,
information and communication technology (the mobile phone and internet); Op , openness
(trade and foreign direct investment); ICTOp , is the interaction between ICT and openness;

14
W is the vector of control variables (GDP growth, population growth, educational quality
and foreign aid), i
is the country-specific effect, t
is the time-specific constant and ti , the
error term. Since the estimation strategy involves interactive regressions, we are consistent
with Brambor et al. (2006) in including all constituent variables in the specifications.
A principal drawback to the GMM approach is the elimination of country-specific
effects which substantially account for the unobserved heterogeneity. Unfortunately, this
elimination is necessary to avoid estimation biases. Fortunately, the unobserved heterogeneity
is also controlled for in the GMM approach using time-invariant omitted variables. Another
drawback is that estimated coefficients are interpreted as short-term effects because the
employment of GMM is consistent with data averages for the most part. In this study, we are
not using data averages.
3.2.3 Identification and exclusion restriction
In line with recent literature (Love & Zicchino, 2006; Dewan & Ramaprasad, 2014) all
independent variables are treated as suspected endogenous or predetermined variables.
Hence, we adopt the gmmstyle for them. Moreover, only years are treated as exogenous and
the approach for treating ivstyle (years) is ‘iv(years, eq(diff))’ because it is not unfeasible for
the years to become endogenous in first-difference (see Roodman, 2009b).
The issues about simultaneity are addressed by using lagged regressors as instruments
for the forward-differenced indicators. Consequently, fixed effects that are likely to affect
investigated relationships are removed with Helmet transformations that are performed in line
with Love and Zicchino (2006). Such transformations consist of forward mean-differencing of
indicators: as opposed to subtracting past observations from present ones (see Roodman,
2009b, p. 104), the average of future observations is deducted from the variables. The
transformation enables parallel or orthogonal conditions between forward-differenced
indicators and lagged values. Regardless of the number of lags, in order to reduce the loss of
data, the transformations are computed for all observations with the exception of the last for
each country. “And because lagged observations do not enter the formula, they are valid as
instruments” (Roodman (2009b, p. 104).
In the light of the above, years which are hypothesised to exhibit strict exogeneity
influence the dependent variable exclusively via endogenous explaining variables. The
statistical validity of the exclusion restriction is examined with the Difference in Hansen Test
(DHT) for instrument exogeneity. Accordingly, the null hypothesis of the test should not be

15
rejected for the underlying instruments (or years) to explain the outcome variable exclusively
through the endogenous explaining variables. The DHT is therefore employed to investigate
whether years exhibit strict exogeneity, by not explaining governance beyond the engaged
mechanisms (or endogenous explaining variables). Hence, in the section that follows, the
reported results should confirm the validity of the exclusion restriction if the null hypotheses
of DHT corresponding to IV (year, eq(diff)) are not rejected.
4. Empirical results
4.1 Presentation of results
In accordance with recent empirical literature that is based on the GMM approach
(Asongu & De Moor, 2017), four principal post-diagnostic information criteria are employed
to examined the validity of estimation models. First, the absence of autocorrelation in the
residuals is examined by second order Arellano and Bond autocorrelation test in difference
(AR(2)) whose null hypothesis for the absence of autocorrelation should not be rejected.
Second, the null hypothesis of the Sargan (Hansen) over-identification restrictions (OIR) test
which is not robust (robust) because it is based on homoscedasticity (heteroscedasticity)
should be rejected for the validity of instruments. Moreover the Sargan (Hansen) is not
weakened (weakened) by instruments. Concerns about instrument proliferation that can
substantially compromise the validity of estimated models have been limited by ensuring that
the rule of thumb requirement for restricting over-identification is met, notably: for each
specification, the number of instruments is less the corresponding number of countries.
Furthermore, the validity of the Hansen OIR test is further examined with the Difference in
Hansen Test (DHT) for exogeneity of instruments. Fourth, a Fisher test that assesses the joint
validity of estimated coefficients is also disclosed.
Tables 2, 3, 4 and 5 present findings related to linkages between ‘mobile phones, ICT
and respectively ‘political governance’, ‘economic governance’, ‘institutional governance’
and ‘general governance’. In the light of the study’s motivation, we are more apprehensive
about the computation of net effects which are computable when two conditions are fulfilled,
notably: the unconditional and conditional effects of ICTs should be significant. The
conditional or marginal impact is the interaction between ICT and openness. In Table 3 for
instance, the net effect from the interaction between mobile phones and financial openness (or
FDI) on government effects is 0.0015 ([-0.00008× 5.332] + 0.002), where: 5.332 is the mean
value of FDI.

16
The following findings can be established from Table 2. First, there are no significant
net effects from the influence of openness in ICT penetration for political governance.
Second, most of the significant control variables have expected signs.
We note the following in Table 3 on linkages between ICT, openness and economic
governance. First, financial openness is more influential in the positive relationship between
ICT and economic governance (government effectiveness and regulation quality) compared to
trade openness. Second, for significant associations with trade openness, compared to internet
penetration, the mobile phone is more relevant at improving economic governance when
combined with trade openness. Third, the control variables are significant with expected
signs.
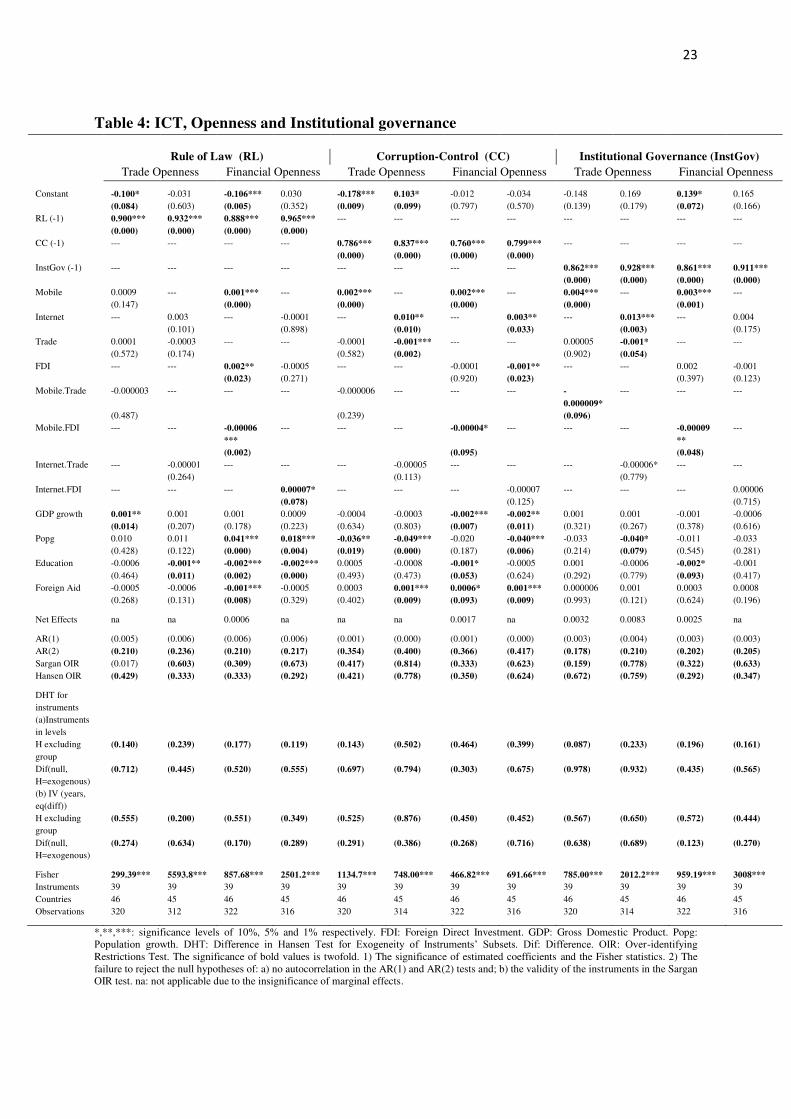
The following findings can be established for Table 4 on linkages between ICT,
openness and institutional governance. First, net effects are more significant in regressions
pertaining to financial openness. Second, in the financial openness regressions, interactions
with mobile phones are more contributory in stimulating institutional governance, compared
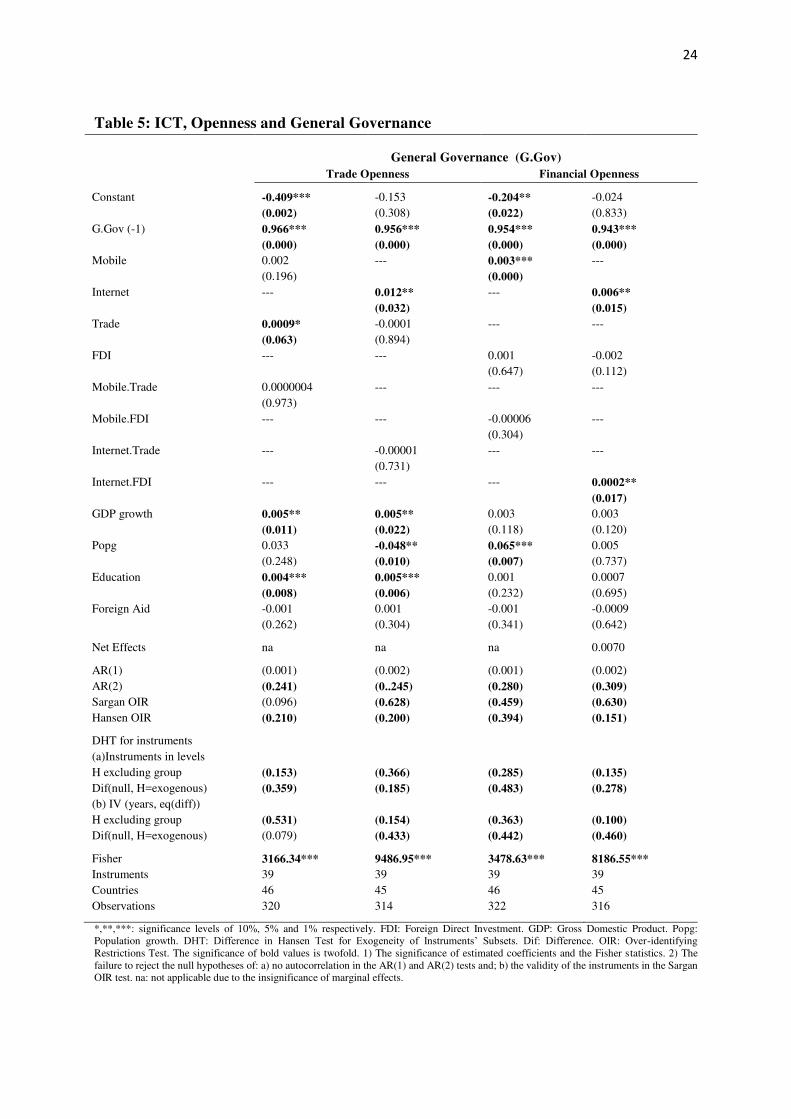
to those with the internet. In Table 5, only the interaction between internet penetration and
financial openness significantly boost general governance. The control variables in Tables 4-5
display expected signs for the most part.
“Insert Tables 2 to 5 here”
4.2 Further discussion of results and implications
4.2.1 Elucidation of positive net effects
We clarify the positive net effects from both theoretical and practical perspectives.
First, from a theoretical angle, the findings are consistent with the theoretical underpinnings
on the relationship between openness and good governance. To be sure Bonaglia et al. (2001)
established the negative relationship between globalisation and corruption; Klitgaard (1998)
opined that in situations of monopoly, poor governance is expected to prosper and Treisman
(2000) reported on the improvement of governance standards in tandem with openness. On
the practical front, consistent with Snow (2009), four possible rationales elicit the established
positive net effects, notably; openness could interact with ICT to enhance: access, reach,
interactions and cost-effectiveness. In summary, the relationship is very likely to be apparent
because openness complements ICT in mitigating conditions that boost opportunities for bad
governance, notably reduction of monopoly and information asymmetry.

17
4.2.2 Practical contributions/implications
The practical implications are discussed in four principal strands, namely, the: (i) edge
of financial openness compared to trade openness in stimulating good governance on the one
hand and the edge of the mobile phone in both ‘trade openness’- and ‘financial openness’-
related estimations, on the other and (ii) consistent absence of significant net effects on
political governance.
First, we have established from the findings that financial openness or financial
globalisation has an edge over trade openness when combined with ICT to affect both
economic and institutional governances. Second, mobile phones have an edge over internet
penetration in complementing (i) trade openness for economic governance and (ii) financial
openness for institutional governance. The consistent edge of mobile phones over internet
penetration may be traceable to the narrative of Penard et al. (2012) and Asongu (2017a) on
the comparatively high penetration of mobile phones over the internet on the continent.
Hence, it is logical that the propensity at which openness dynamics interact with mobile
phone penetration is higher than that at which openness interacts with internet penetration to
affect governance.
Third, an interesting finding that merits substantial clarification is the consistent
insignificant net effects on political governance. While this may be surprising because more
opened economies are theoretically expected to enjoy higher levels of political governance, in
reality however, this may not be the case. We explain this unexpected finding with two
streams of discourse, notably (i) time and level hypotheses of for the benefits of political
governance from openness and (ii) differences between the Beijing Model (BM) and
Washington Consensus (WC) in contemporary development paradigms.
On the one hand, the insignificant effect of the interaction between openness and ICT
on political governance may be expected because sampled countries are at early stages of
industrialisation. Hence, time and level of openness are required to achieve the rewards of
political governance. It is the case of many developing countries after the adoption of
openness policies, namely: Turkey (Sayari, 1977) and India (Wade, 1985); Southeast Asia
(Scott, 1972); Latin America from waves of political openness (Weyland, 1998) and post-
communist countries in the 1990s (Varsee, 1997).
On the other, from a more contemporary perspective, the insignificant findings of
political governance can be elucidated by the two dominant models of development. It is
important to first of all define the WC and BM. According to Asongu (2016) whereas the WC

18
can be defined as ‘liberalised democracy, private capitalism and priority in political rights’
and the BM is defined as ‘de-emphasised democracy, state capitalism and priority in
economic rights’. According to the description, the WC prioritises political governance
whereas the BM places more emphasis on economic governance. Asongu and Ssozi (2016)
have reconciled the BM and the WC by postulating that whereas political governance should
be a priority in the long term, the BM should be a priority in the short run. This is essentially
because economic governance delivers economic needs (like food, shelter, health and
sanitation) while political governance delivers the right to vote (for the most part). The
reconciliation of the BM and the WC builds on the idea that economic governance should be
prioritised at the early stages of industrialisation because a middle class is needed to
sustainably demand political rights in the long-term. Hence political governance should be a
long-term priority.
In the light of the above, China has achieved her spectacular economic development
by tailoring openness for economic and institutional governance and stifling political
governance. In the post-independence era, China and African countries were almost in the
same economic turmoil. Unfortunately, while China decided to chart its own development
course by prioritising economic and institutional governances, most African countries took to
prescriptions of the Washington consensus which places more emphasis on political
governance. Today, differences in development between African countries and China are self-
evident. From the established findings, in the short-run, openness-driven ICT policies are
more rewarding in terms of economic and institutional governance than political governance.
The short-run inference is based on the perspective that GMM estimates are interpreted as
short-run effects.
4.2.3 Theoretical contributions/implications
There are two main theoretical contributions of this paper to the literature, notably,
insights into information asymmetry and catch-up in governance. First, as concerns
information asymmetry, the net positive effects is an indication that ICT reduces information
asymmetry by consolidating oversight by public officials, civil society and households. This
inference is consistent with evidence that ICT is positively (negatively) linked to the informal
(formal) economic sector of African economies (Asongu, 2013) implying that most of civil
society organisations working from informal social and politico-economic sectors can also
substantially contribute to improving government quality at the advent of globalisation and

19
ICT. In summary, ICT driven by openness policies enables information sharing which
mitigates information asymmetry or informational rents that were previously used by the elite
for corruption and mismanagement. In other words, the interaction between openness and ICT
contributes to minimising ‘government cost’ and allocating resources more efficiently. This
inference accords with the theoretical underpinnings of sharing information for financial
allocation efficiency in financial institutions (see Claus & Grimes, 2003). It follows from the
established findings that foundations for information sharing in the banking industry can be
extended to government institutions.
Second, we have consistently established that past differences in good governance
have a less proportionate effect on future differences in good governance. This is essentially
because the absolute value of estimates corresponding to the lagged government variable is
between zero and one. Hence, the left-hand-side of a system equation is decreasing over time
because sampled nations with lower levels of governance are catching-up their counterparts of
higher levels. This economic interpretation is an indication that the catch-up theory can be
conceived beyond income-convergence (see Asongu, 2014b). Such theoretical contribution is
supported both by the literature on the neoclassical growth models (Swan, 1956; Solow,
1956; Baumol, 1986; Barro, 1991; Barro & Sala-i-Martin, 1992, 1995; Mankiw et al., 1992;
Fung, 2009) and other areas of economic development, notably: inclusive human
development (Mayer-Foulkes, 2010); financial markets (Bruno et al., 2012; Narayan et al.,
2011); knowledge economy (Asongu, 2017b) and negative government signals in the
prediction of chaotic events like the 2011 Arab Spring (Asongu & Nwachukwu, 2016a).
5. Conclusion and Future Research Directions
The purpose of this study has been to investigate how openness influences information and
communication technology (ICT) penetration for improved government quality in sub-
Saharan Africa for the period 2000-2012. Openness is measured in terms of trade and
financial globalisation whereas the ICT is proxied with mobile phone and internet penetration
rates. Ten bundled and unbundled governance indicators are used. The empirical evidence is
based on Generalised Method of Moments with forward orthogonal deviations. Five main
findings emerge.
First, financial openness or financial globalisation has an edge over trade openness
when combined with ICT to affect both economic and institutional governance. Second,
mobile phones have an edge over internet penetration in complementing: (i) trade openness

20
for economic governance and (ii) financial openness for institutional governance. Third, net
effects on political governance are consistently negative. Hence, in the short-run openness-
driven ICT policies are more influential in terms of higher levels of economic and
institutional governance than political governance. Fourth, countries with low levels of
governance are catching-up their counterparts with higher levels of governance. Fifth, only
the interaction between internet penetration and financial openness significantly boosts
general governance. Practical and theoretical contributions of the findings to the literature
have been discussed.
Future studies devoted to extending the established findings could engage country-
specific studies for more targeted policy implications. Moreover, assessing openness and ICT
thresholds at which the established findings are more relevant is also an interesting future
research direction. The use of estimation techniques that do not eliminate country-specific
effects and consider other governance variables is worthwhile. Such would require
governance variables from sources like the International Country Risk Guide that have wider
time frames to accommodate Fixed Effects regressions.
Table 1: Principal Component Analysis (PCA) for Composite Governance Principal
Components
Component Matrix(Loadings) Proportion Cumulative
Proportion
Eigen
Value
VA PS RQ GE RL CC
First PC (G.Gov) 0.395 0.372 0.411 0.426 0.439 0.404 0.815 0.815 4.892
Second PC -0.037 0.873 -0.357 -0.303 0.037 -0.124 0.067 0.883 0.407
Third PC 0.747 -0.035 0.157 -0.131 -0.086 -0.626 0.052 0.935 0.314
First PC (Polgov) 0.707 0.707 --- --- --- --- 0.835 0.835 1.671
Second PC -0.707 0.707 --- --- --- --- 0.164 1.000 0.328
First PC (Ecogov) --- --- 0.707 0.707 --- --- 0.939 0.939 1.878
Second PC --- --- -0.707 0.707 --- --- 0.060 1.000 0.121
First PC (Instgov) --- --- --- --- 0.707 0.707 0.930 0.930 1.861
Second PC --- --- --- --- -0.707 0.707 0.069 1.000 0.138
P.C: Principal Component. VA: Voice & Accountability. RL: Rule of Law. R.Q: Regulation Quality. GE: Government Effectiveness. PS:
Political Stability. CC: Control of Corruption. G.Gov (General Governance): First PC of VA, PS, RQ, GE, RL & CC. Polgov (Political
Governance): First PC of VA & PS. Ecogov (Economic Governance): First PC of RQ & GE. Instgov (Institutional Governance): First PC of
RL & CC.

21
Table 2: ICT, Openness and Political governance
Political Stability(PolSta) Voice and Accountability(VA) Political Governance (PolGov) Trade Openness Financial Openness Trade Openness Financial Openness Trade Openness Financial Openness
Constant 0.049 0.046 -0.075 0.174* -0.095* -0.011 0.029 -0.151*** 0.063 0.117 0.199** -0.067
(0.610) (0.678) (0.492) (0.062) (0.059) (0.876) (0.241) (0.000) (0.549) (0.229) (0.011) (0.541)
PolSta (-1) 0.811*** 0.830*** 0.862*** 0.880*** --- --- --- --- --- --- --- ---
(0.000) (0.000) (0.000) (0.000)
VA (-1) --- --- --- --- 0.961*** 0.912*** 0.991*** 0.933*** --- --- --- ---
(0.000) (0.000) (0.000) (0.000)
PolGov (-1) --- --- --- --- --- --- --- --- 0.958*** 0.951*** 0.959*** 0.980***
(0.000) (0.000) (0.000) (0.000)
Mobile 0.002 --- 0.001 --- 0.0009 --- 0.0002 --- 0.001 --- -0.0003 ---
(0.252) (0.179) (0.271) (0.414) (0.590) (0.719)
Internet --- -0.005 --- -0.0006 --- 0.009** --- 0..004*** --- -0.005 --- 0.002
(0.396) (0.789) (0.015) (0.001) (0.303) (0.144)
Trade 0.0005 0.0006 --- --- -0.0005** -0.0004 --- --- 0.0002 -0.0002 --- ---
(0.282) (0.409) (0.043) (0.379) (0.657) (0.702)
FDI --- --- -0.0003 -0.0008 --- --- -0.002*** -0.0003 --- --- -0.004** 0.0007
(0.901) (0.488) (0.004) (0.634) (0.020) (0.598)
Mobile.Trade -0.00001 --- --- --- 0.000001 --- --- --- -0.00001 --- --- ---
(0.198) (0.736) (0.334)
Mobile.FDI --- --- -0.00001 --- --- --- 0.00003* --- --- --- 0.00004 ---
(0.859) (0.095) (0.378)
Internet.Trade --- 0.00006 --- --- --- -0.00004 --- --- --- 0.00006 --- ---
(0.165) (0.115) (0.139)
Internet.FDI --- --- --- 0.00005 --- --- --- -0.00008 --- --- --- -0.0001**
(0.350) (0.134) (0.033)
GDP growth 0.007*** 0.006*** 0.006*** 0.005*** 0.001 0.0008 0.001 0.001 0.005*** 0.003* 0.007*** 0.006**
(0.000) (0.009) (0.000) (0.001) (0.187) (0.500) (0.159) (0.105) (0.002) (0.065) (0.001) (0.010)
Popg 0.032 -0.011 0.079*** 0.052*** -0.001 -0.032*** 0.022* -0.004 -0.007 -0.030* 0.052*** 0.041***
(0.168) (0.556) (0.000) (0.003) (0.886) (0.003) (0.090) (0.500) (0.718) (0.060) (0.000) (0.005)
Education -0.007*** -0.003** -0.005*** -0.005*** 0.001* 0.002** -0.0004 0.002*** -0.002 0.001 -0.004*** -0.0007
(0.000) (0.028) (0.000) (0.009) (0.086) (0.011) (0.634) (0.007) (0.191) (0.552) (0.001) (0.708)
Foreign Aid -0.002*** -0.001** -0.002*** -0.001*** 0.00005 0.001** -0.0005 0.0006 -0.0002 0.0005 -0.0005 -0.001
(0.000) (0.037) (0.000) (0.000) (0.918) (0.024) (0.210) (0.213) (0.694) (0.372) (0.410) (0.155)
Net Effects na na na na na na na na na na na na
AR(1) (0.000) (0.000) (0.000) (0.000) (0.005) (0.005) (0.006) (0.006) (0.001) (0.002) (0.001) (0.002)
AR(2) (0.352) (0.362) (0.454) (0.428) (0.959) (0.993) (0.934) (0.894) (0.404) (0.539) (0.386) (0.497)
Sargan OIR (0.938) (0.788) (0.986) (0.905) (0.040) (0.077) (0.076) (0.068) (0.687) (0.572) (0.924) (0.933)
Hansen OIR (0.600) (0.461) (0.521) (0.740) (0.153) (0.163) (0.435) (0.429) (0.517) (0.411) (0.702) (0.934)
DHT for
instruments
(a)Instruments
in levels
H excluding
group
(0.936) (0.959) (0.939) (0.858) (0.183) (0.519) (0.478) (0.540) (0.947) (0.832) (0.919) (0.790)
Dif(null,
H=exogenous)
(0.298) (0.173) (0.229) (0.515) (0.233) (0.102) (0.390) (0.348) (0.221) (0.201) (0.419) (0.875)
(b) IV (years,
eq(diff))
H excluding
group
(0.944) (0.638) (0.825) (0.541) (0.564) (0.146) (0.406) (0.200) (0.691) (0.825) (0.658) (0.833)
Dif(null,
H=exogenous)
(0.112) (0.239) (0.155) (0.798) (0.040) (0.351) (0.450) (0.822) (0.256) (0.089) (0.569) (0.858)
Fisher 882.26*** 1608.1*** 958.74*** 668.98*** 1151.3*** 1087.1*** 1596.3*** 1037.44 1253.0*** 3406.5*** 1063.4*** 1254.1***
Instruments 39 39 39 39 39 39 39 39 39 39 39
Countries 46 45 46 45 46 45 46 46 45 46 45
Observations 320 314 322 316 320 314 322 320 314 322 316
*,**,***: significance levels of 10%, 5% and 1% respectively. FDI: Foreign Direct Investment. GDP: Gross Domestic Product. Popg:
Population growth. DHT: Difference in Hansen Test for Exogeneity of Instruments’ Subsets. Dif: Difference. OIR: Over-identifying
Restrictions Test. The significance of bold values is twofold. 1) The significance of estimated coefficients and the Fisher statistics. 2) The
failure to reject the null hypotheses of: a) no autocorrelation in the AR(1) and AR(2) tests and; b) the validity of the instruments in the Sargan
OIR test. na: not applicable due to the insignificance of marginal effects.

22
Table 3: ICT, Openness and Economic Governance
Government Effectiveness (GE) Regulation Quality (RQ) Economic Governance (EcoGov) Trade Openness Financial Openness Trade Openness Financial Openness Trade Openness Financial Openness
Constant -0.261*** -0.131** -0.214*** -0.016 -0.226*** -0.203** -0.167*** 0.028 -0.368*** -0.282** -0.203*** 0.094
(0.000) (0.042) (0.001) (0.766) (0.003) (0.018) (0.000) (0.554) (0.000) (0.018) (0.003) (0.283)
GE (-1) 0.869*** 0.867*** 0.876*** 0.849*** --- --- --- --- --- --- --- ---
(0.000) (0.000) (0.000) (0.000)
RQ (-1) --- --- --- --- 0.857*** 0.868*** 0.899*** 0.921*** --- --- --- ---
(0.000) (0.000) (0.000) (0.000)
EcoGov (-1) --- --- --- --- --- --- --- --- 0.885*** 0.926*** 0.926*** 0.916***
(0.000) (0.000) (0.000) (0.000)
Mobile 0.002*** --- 0.002*** --- 0.003*** --- 0.002*** --- 0.005*** --- 0.003*** ---
(0.000) (0.000) (0.000) (0.000) (0.000) (0.000)
Internet --- 0.006*** --- 0.004*** --- 0.007** --- -0.002** --- 0.012*** --- 0.001
(0.003) (0.001) (0.046) (0.015) (0.003) (0.611)
Trade 0.0002 -0.0002 --- --- 0.00006 0.0004 --- --- 0.0004 0.001 --- ---
(0.266) (0.380) (0.784) (0.283) (0.339) (0.154)
FDI --- --- 0.002** -0.0007* --- --- 0.003*** -0.002*** --- --- 0.007*** -0.003***
(0.016) (0.057) (0.005) (0.000) (0.000) (0.000)
Mobile.Trade -0.000006 --- --- --- -0.00001
***
--- --- --- -0.00001* --- --- ---
(0.128) (0.002) (0.059)
Mobile.FDI --- --- -0.00008
***
--- --- --- -0.00007
***
--- --- --- -0.0001
***
---
(0.001) (0.001) (0.000)
Internet.Trade --- -0.000007 --- --- --- -0.00002 --- --- --- -0.00002 --- ---
(0.659) (0.303) (0.423)
Internet.FDI --- --- --- -0.00008
**
--- --- --- 0.0006*** --- --- --- 0.0007***
(0.017) (0.000) (0.000)
GDP growth 0.002*** 0.002*** 0.002*** 0.002** 0.001 0.003*** 0.0007 0.0002 0.005*** 0.003 0.002 0.001
(0.003) (0.007) (0.003) (0.037) (0.134) (0.009) (0.475) (0.824) (0.002) (0.219) (0.108) (0.436)
Popg -0.003 -0.036*** 0.011 -0.016* 0.009 -0.010 0.014* 0.009 0.015 -0.031* 0.042** 0.002
(0.804) (0.003) (0.399) (0.085) (0.161) (0.295) (0.053) (0.174) (0.386) (0.092) (0.016) (0.870)
Education 0.001* 0.002*** 0.0003 -0.0004 0.0003 0.001 0.0008 -0.001* 0.003** 0.005*** 0.002* -0.001
(0.056) (0.007) (0.645) (0.609) (0.645) (0.126) (0.207) (0.084) (0.024) (0.001) (0.099) (0.556)
Foreign Aid -0.00008 0.001*** -0.0005 -0.0002 -0.001** -0.001*** -0.001** -0.001*** -0.001** -0.0002 -0.002** -0.0005
(0.856) (0.009) (0.521) (0.733) (0.023) (0.003) (0.019) (0.003) (0.040) (0.829) (0.014) (0.497)
Net Effects na na 0.0015 0.0035 0.0022 na 0.0016 0.0011 0.0042 na 0.0024 na
AR(1) (0.002) (0.002) (0.002) (0.003) (0.007) (0.011) (0.007) (0.007) (0.000) (0.000) (0.000) (0.000)
AR(2) (0.209) (0.196) (0.275) (0.260) (0.149) (0.308) (0.106) (0.213) (0.119) (0.097) (0.122) (0.156)
Sargan OIR (0.356) (0.376) (0.446) (0.295) (0.001) (0.001) (0.001) (0.000) (0.095) (0.142) (0.098) (0.028)
Hansen OIR (0.478) (0.245) (0.320) (0.549) (0.296) (0.509) (0.349) (0.237) (0.525) (0.280) (0.365) (0.251)
DHT for
instruments
(a)Instruments
in levels
H excluding
group
(0.350) (0.518) (0.744) (0.772) (0.152) (0.576) (0.115) (0.212) (0.558) (0.518) (0.139) (0.142)
Dif(null,
H=exogenous)
(0.533) (0.173) (0.163) (0.351) (0.501) (0.416) (0.650) (0.336) (0.446) (0.206) (0.627) (0.444)
(b) IV (years,
eq(diff))
H excluding
group
(0.476) (0.277) (0.691) (0.288) (0.290) (0.571) (0.275) (0.456) (0.391) (0.269) (0.307) (0.135)
Dif(null,
H=exogenous)
(0.428) (0.299) (0.093) (0.846) (0.374) (0.363) (0.503) (0.133) (0.635) (0.377) (0.476) (0.629)
Fisher 1060.5*** 9169*** 4521.9*** 1745.8*** 7630.2*** 936.90*** 6792.1*** 589.26*** 3545.0*** 2987.9*** 3742.7*** 6867.5***
Instruments 39 39 39 39 39 39 39 39 39 39 39 39
Countries 46 45 46 45 46 45 46 46 46 45 46 45
Observations 320 314 322 316 320 314 322 316 320 314 322 316
*,**,***: significance levels of 10%, 5% and 1% respectively. FDI: Foreign Direct Investment. GDP: Gross Domestic Product. Popg:
Population growth. DHT: Difference in Hansen Test for Exogeneity of Instruments’ Subsets. Dif: Difference. OIR: Over-identifying
Restrictions Test. The significance of bold values is twofold. 1) The significance of estimated coefficients and the Fisher statistics. 2) The
failure to reject the null hypotheses of: a) no autocorrelation in the AR(1) and AR(2) tests and; b) the validity of the instruments in the Sargan
OIR test. na: not applicable due to the insignificance of marginal effects.
23
Table 4: ICT, Openness and Institutional governance
Rule of Law (RL) Corruption-Control (CC) Institutional Governance (InstGov) Trade Openness Financial Openness Trade Openness Financial Openness Trade Openness Financial Openness
Constant -0.100* -0.031 -0.106*** 0.030 -0.178*** 0.103* -0.012 -0.034 -0.148 0.169 0.139* 0.165
(0.084) (0.603) (0.005) (0.352) (0.009) (0.099) (0.797) (0.570) (0.139) (0.179) (0.072) (0.166)
RL (-1) 0.900*** 0.932*** 0.888*** 0.965*** --- --- --- --- --- --- --- ---
(0.000) (0.000) (0.000) (0.000)
CC (-1) --- --- --- --- 0.786*** 0.837*** 0.760*** 0.799*** --- --- --- ---
(0.000) (0.000) (0.000) (0.000)
InstGov (-1) --- --- --- --- --- --- --- --- 0.862*** 0.928*** 0.861*** 0.911***
(0.000) (0.000) (0.000) (0.000)
Mobile 0.0009 --- 0.001*** --- 0.002*** --- 0.002*** --- 0.004*** --- 0.003*** ---
(0.147) (0.000) (0.000) (0.000) (0.000) (0.001)
Internet --- 0.003 --- -0.0001 --- 0.010** --- 0.003** --- 0.013*** --- 0.004
(0.101) (0.898) (0.010) (0.033) (0.003) (0.175)
Trade 0.0001 -0.0003 --- --- -0.0001 -0.001*** --- --- 0.00005 -0.001* --- ---
(0.572) (0.174) (0.582) (0.002) (0.902) (0.054)
FDI --- --- 0.002** -0.0005 --- --- -0.0001 -0.001** --- --- 0.002 -0.001
(0.023) (0.271) (0.920) (0.023) (0.397) (0.123)
Mobile.Trade -0.000003 --- --- --- -0.000006 --- --- --- -
0.000009*
--- --- ---
(0.487) (0.239) (0.096)
Mobile.FDI --- --- -0.00006
***
--- --- --- -0.00004* --- --- --- -0.00009
**
---
(0.002) (0.095) (0.048)
Internet.Trade --- -0.00001 --- --- --- -0.00005 --- --- --- -0.00006* --- ---
(0.264) (0.113) (0.779)
Internet.FDI --- --- --- 0.00007* --- --- --- -0.00007 --- --- --- 0.00006
(0.078) (0.125) (0.715)
GDP growth 0.001** 0.001 0.001 0.0009 -0.0004 -0.0003 -0.002*** -0.002** 0.001 0.001 -0.001 -0.0006
(0.014) (0.207) (0.178) (0.223) (0.634) (0.803) (0.007) (0.011) (0.321) (0.267) (0.378) (0.616)
Popg 0.010 0.011 0.041*** 0.018*** -0.036** -0.049*** -0.020 -0.040*** -0.033 -0.040* -0.011 -0.033
(0.428) (0.122) (0.000) (0.004) (0.019) (0.000) (0.187) (0.006) (0.214) (0.079) (0.545) (0.281)
Education -0.0006 -0.001** -0.002*** -0.002*** 0.0005 -0.0008 -0.001* -0.0005 0.001 -0.0006 -0.002* -0.001
(0.464) (0.011) (0.002) (0.000) (0.493) (0.473) (0.053) (0.624) (0.292) (0.779) (0.093) (0.417)
Foreign Aid -0.0005 -0.0006 -0.001*** -0.0005 0.0003 0.001*** 0.0006* 0.001*** 0.000006 0.001 0.0003 0.0008
(0.268) (0.131) (0.008) (0.329) (0.402) (0.009) (0.093) (0.009) (0.993) (0.121) (0.624) (0.196)
Net Effects na na 0.0006 na na na 0.0017 na 0.0032 0.0083 0.0025 na
AR(1) (0.005) (0.006) (0.006) (0.006) (0.001) (0.000) (0.001) (0.000) (0.003) (0.004) (0.003) (0.003)
AR(2) (0.210) (0.236) (0.210) (0.217) (0.354) (0.400) (0.366) (0.417) (0.178) (0.210) (0.202) (0.205)
Sargan OIR (0.017) (0.603) (0.309) (0.673) (0.417) (0.814) (0.333) (0.623) (0.159) (0.778) (0.322) (0.633)
Hansen OIR (0.429) (0.333) (0.333) (0.292) (0.421) (0.778) (0.350) (0.624) (0.672) (0.759) (0.292) (0.347)
DHT for
instruments
(a)Instruments
in levels
H excluding
group
(0.140) (0.239) (0.177) (0.119) (0.143) (0.502) (0.464) (0.399) (0.087) (0.233) (0.196) (0.161)
Dif(null,
H=exogenous)
(0.712) (0.445) (0.520) (0.555) (0.697) (0.794) (0.303) (0.675) (0.978) (0.932) (0.435) (0.565)
(b) IV (years,
eq(diff))
H excluding
group
(0.555) (0.200) (0.551) (0.349) (0.525) (0.876) (0.450) (0.452) (0.567) (0.650) (0.572) (0.444)
Dif(null,
H=exogenous)
(0.274) (0.634) (0.170) (0.289) (0.291) (0.386) (0.268) (0.716) (0.638) (0.689) (0.123) (0.270)
Fisher 299.39*** 5593.8*** 857.68*** 2501.2*** 1134.7*** 748.00*** 466.82*** 691.66*** 785.00*** 2012.2*** 959.19*** 3008***
Instruments 39 39 39 39 39 39 39 39 39 39 39 39
Countries 46 45 46 45 46 45 46 45 46 45 46 45
Observations 320 312 322 316 320 314 322 316 320 314 322 316
*,**,***: significance levels of 10%, 5% and 1% respectively. FDI: Foreign Direct Investment. GDP: Gross Domestic Product. Popg:
Population growth. DHT: Difference in Hansen Test for Exogeneity of Instruments’ Subsets. Dif: Difference. OIR: Over-identifying
Restrictions Test. The significance of bold values is twofold. 1) The significance of estimated coefficients and the Fisher statistics. 2) The
failure to reject the null hypotheses of: a) no autocorrelation in the AR(1) and AR(2) tests and; b) the validity of the instruments in the Sargan
OIR test. na: not applicable due to the insignificance of marginal effects.
24
Table 5: ICT, Openness and General Governance
General Governance (G.Gov)
Trade Openness Financial Openness
Constant -0.409*** -0.153 -0.204** -0.024
(0.002) (0.308) (0.022) (0.833)
G.Gov (-1) 0.966*** 0.956*** 0.954*** 0.943***
(0.000) (0.000) (0.000) (0.000)
Mobile 0.002 --- 0.003*** ---
(0.196) (0.000)
Internet --- 0.012** --- 0.006**
(0.032) (0.015)
Trade 0.0009* -0.0001 --- ---
(0.063) (0.894)
FDI --- --- 0.001 -0.002
(0.647) (0.112)
Mobile.Trade 0.0000004 --- --- ---
(0.973)
Mobile.FDI --- --- -0.00006 ---
(0.304)
Internet.Trade --- -0.00001 --- ---
(0.731)
Internet.FDI --- --- --- 0.0002**
(0.017)
GDP growth 0.005** 0.005** 0.003 0.003
(0.011) (0.022) (0.118) (0.120)
Popg 0.033 -0.048** 0.065*** 0.005
(0.248) (0.010) (0.007) (0.737)
Education 0.004*** 0.005*** 0.001 0.0007
(0.008) (0.006) (0.232) (0.695)
Foreign Aid -0.001 0.001 -0.001 -0.0009
(0.262) (0.304) (0.341) (0.642)
Net Effects na na na 0.0070
AR(1) (0.001) (0.002) (0.001) (0.002)
AR(2) (0.241) (0..245) (0.280) (0.309)
Sargan OIR (0.096) (0.628) (0.459) (0.630)
Hansen OIR (0.210) (0.200) (0.394) (0.151)
DHT for instruments
(a)Instruments in levels
H excluding group (0.153) (0.366) (0.285) (0.135)
Dif(null, H=exogenous) (0.359) (0.185) (0.483) (0.278)
(b) IV (years, eq(diff))
H excluding group (0.531) (0.154) (0.363) (0.100)
Dif(null, H=exogenous) (0.079) (0.433) (0.442) (0.460)
Fisher 3166.34*** 9486.95*** 3478.63*** 8186.55***
Instruments 39 39 39 39
Countries 46 45 46 45
Observations 320 314 322 316
*,**,***: significance levels of 10%, 5% and 1% respectively. FDI: Foreign Direct Investment. GDP: Gross Domestic Product. Popg:
Population growth. DHT: Difference in Hansen Test for Exogeneity of Instruments’ Subsets. Dif: Difference. OIR: Over-identifying
Restrictions Test. The significance of bold values is twofold. 1) The significance of estimated coefficients and the Fisher statistics. 2) The
failure to reject the null hypotheses of: a) no autocorrelation in the AR(1) and AR(2) tests and; b) the validity of the instruments in the Sargan
OIR test. na: not applicable due to the insignificance of marginal effects.
25
Appendices
Appendix 1: Variable Definitions
Variables Signs Variable Definitions (Measurements) Sources
Political Stability
PolSta
“Political stability/no violence (estimate): measured as the perceptions of the likelihood that the government will be
destabilized or overthrown by unconstitutional and violent
means, including domestic violence and terrorism”
World Bank (WDI)
Voice &
Accountability
V&A “Voice and accountability (estimate): measures the extent to which a country’s citizens are able to participate in selecting
their government and to enjoy freedom of expression, freedom
of association and a free media”.
World Bank (WDI)
Political
Governance
Polgov First Principal Component of Political Stability and Voice &
Accountability. The process by which those in authority are
selected and replaced.
PCA
Government
Effectiveness
Gov. E
“Government effectiveness (estimate): measures the quality of public services, the quality and degree of independence from
political pressures of the civil service, the quality of policy
formulation and implementation, and the credibility of
governments’ commitments to such policies”.
World Bank (WDI)
Regulation
Quality
RQ “Regulation quality (estimate): measured as the ability of the government to formulate and implement sound policies and
regulations that permit and promote private sector
development”.
World Bank (WDI)
Economic
Governance
Ecogov “First Principal Component of Government Effectiveness and Regulation Quality. The capacity of government to formulate
& implement policies, and to deliver services”.
PCA
Rule of Law
RL
“Rule of law (estimate): captures perceptions of the extent to which agents have confidence in and abide by the rules of
society and in particular the quality of contract enforcement,
property rights, the police, the courts, as well as the likelihood
of crime and violence”.
World Bank (WDI)
Corruption-
Control
CC “Control of corruption (estimate): captures perceptions of the extent to which public power is exercised for private gain,
including both petty and grand forms of corruption, as well as
‘capture’ of the state by elites and private interests”.
World Bank (WDI)
Institutional
Governance
Instgov First Principal Component of Rule of Law and Corruption-
Control. The respect for citizens and the state of institutions
that govern the interactions among them
PCA
General
Governance
G.gov First Principal Component of Political, Economic and
Institutional Governances
PCA
Mobile phones Mobile Mobile phone subscriptions (per 100 people) World Bank (WDI)
Internet Internet Internet penetration (per 100 people) World Bank (WDI)
Trade Openness Trade Imports plus Exports of Commodities (% of GDP) World Bank (WDI)
Foreign
investment
FDI Foreign Direct Investment inflows (% of GDP) World Bank (WDI)

26
GDP growth GDPg Gross Domestic Product (GDP) growth (annual %) World Bank (WDI)
Population growth Popg Population growth rate (annual %) World Bank (WDI)
Educational
Quality
Educ Pupil teacher ratio in Primary Education World Bank (WDI)
Foreign aid Aid Total Development Assistance (% of GDP) World Bank (WDI)
WDI: World Bank Development Indicators. PCA: Principal Component Analysis.
Appendix 2: Summary statistics (2000-2012)
Mean SD Minimum Maximum Observations
Political Stability -0.543 0.956 -3.323 1.192 578
Voice & Accountability -0.646 0.737 -2.233 0.990 578
Political Governance 0.000 1.292 -3.440 2.583 578
Government Effectiveness -0.771 0.620 -2.450 0.934 577
Regulation Quality -0.715 0.644 -2.665 0.983 578
Economic Governance 0.002 1.367 -4.049 3.807 577
Rule of Law 0.002 1.367 -4.049 3.807 577
Control of Corruption -0.642 0.591 -1.924 1.249 579
Institutional Governance 0.0002 1.364 -3.588 3.766 578
General Governance 0.004 2.210 -6.308 5.561 577
Mobile phone penetration 23.379 28.004 0.000 147.202 572
Internet Penetration 4.152 6.450 0.005 43.605 566
Trade Openness 78.177 36.138 20.964 209.87 597
Foreign Direct Investment inflows 5.332 8.737 -6.043 91.007 603
GDP growth 4.714 6.322 -47.552 63.379 608
Population growth 2.361 0.948 -1.081 6.576 588
Educational Quality 43.601 14.529 12.466 100.236 444
Foreign aid 11.687 14.193 -0.253 181.187 606
S.D: Standard Deviation.
27
Appendix 3: Correlation analysis (uniform sample size: 319)
Political Governance Economic Governance Institutional Governance ICT Openness Control Variables
PS VA Polgov GE RQ Ecogov CC RL Instgov G.gov Internet Mobile Trade FDI GDPg Popg Educ Aid
1.000 0.678 0.909 0.649 0.574 0.634 0.661 0.802 0.765 0.811 0.377 0.338 0.283 0.009 -0.070 -0.314 -0.366 -0.114 PS
1.000 0.922 0.793 0.758 0.803 0.655 0.822 0.771 0.882 0.417 0.366 0.082 -0.046 0.056 -0.314 -0.350 -0.078 VA
1.000 0.790 0.731 0.788 0.718 0.887 0.838 0.925 0.434 0.385 0.196 -0.021 -0.004 -0.342 -0.390 -0.104 Polgov
1.000 0.868 0.969 0.808 0.888 0.887 0.940 0.449 0.441 0.101 -0.054 0.025 -0.410 -0.292 -0.205 GE
1.000 0.963 0.682 0.790 0.770 0.874 0.288 0.394 0.072 -0.078 -0.007 -0.349 -0.294 -0.235 RQ
1.000 0.774 0.870 0.860 0.940 0.384 0.433 0.090 -0.068 0.010 -0.394 -0.357 -0.227 Ecogov
1.000 0.825 0.956 0.869 0.421 0.399 0.060 -0.062 -0.082 -0.359 -0.421 -0.118 CC
1.000 0.954 0.961 0.462 0.403 0.201 -0.039 -0.030 -0.371 -0.406 -0.145 RL
1.000 0.957 0.462 0.420 0.135 -0.053 -0.059 -0.381 -0.433 -0.138 Instgov
1.000 0.454 0.439 0.147 -0.051 -0.018 -0.398 -0.418 -0.167 G.gov
1.000 0.697 0.218 0.060 -0.042 -0.455 -0.497 -0.183 Internet
1.000 0.282 0.099 -0.099 -0.404 -0.449 -0.248 Mobile
1.000 0.329 -0.020 -0.440 -0.356 -0.086 Trade
1.000 0.197 0.065 -0.049 0.209 FDI
1.000 0.181 0.139 0.124 GDPg
1.000 0.403 0.419 Popg
1.000 0.196 Edu
1.000 Aid
PS: Political Stability/Non violence. VA: Voice & Accountability. Polgov: Political Governance. GE: Government Effectiveness. RQ: Regulation Quality. Ecogov: Economic Governance. CC: Corruption-Control. RL:
Rule of Law. Instgov: Institutional Governance. G.Gov: General Governance. Internet: Internet Penetration. Mobile: Mobile Phone penetration. FDI: Foreign Direct Investment inflows. GDPg: GDP growth. Popg:
Population growth. Edu : Educational quality. Aid: Foreign aid.

28
Appendix 4: Persistence of the dependent variables
Political Governance Economic Governance Institutional Governance
PS VA Polgov GE RQ Ecogov CC RL Instgov G.gov
PS(-1) 0.965
VA(-1) 0.982
Polgov(-1) 0.981
GE(-1) 0.979
RQ(-1) 0.981
Ecogov(-1) 0.986
CC(-1) 0.967
RL(-1) 0.985
Instgov(-1) 0.984
G.gov(-1) 0.990
PS: Political Stability/Non violence. VA: Voice & Accountability. Polgov: Political Governance. GE: Government Effectiveness. RQ:
Regulation Quality. Ecogov: Economic Governance. CC: Corruption-Control. RL: Rule of Law. Instgov: Institutional Governance. G.Gov:
General Governance.
References
Amavilah, A., Asongu, S. A., & Andrés, A. R., (2014). “Globalization, Peace & Stability, Governance, and Knowledge Economy”, African Governance and Development Institute
Working Paper No. 14/012, Yaoundé.
Andrés, R. A, Asongu, S. A., Amavilah, V. H., (2015). “The Impact of Formal Institutions on Knowledge Economy”, Journal of the Knowledge Economy, 6(4), pp. 682-703.
Anyanwu, J. C., (2012). “Developing Knowledge for the Economic Advancement of Africa”, International Journal of Academic Research in Economics and Management Sciences, 1(2),
pp. 73-111.
Anyanwu, J., & Erhijakpor, A., (2014). “Does Oil Wealth Affect Democracy in
Africa?”African Development Review, 26 (1), pp. 15-37.
Arellano, M., & Bond, S., (1991), “Some tests of specification for panel data: Monte Carlo evidence and an application to employment equations” The Review of Economic Studies,
58(2), pp. 277-297.
Arellano, M., & Bover, O., (1995), “Another look at the instrumental variable estimation of error components models”, Journal of Econometrics, 68(1), pp. 29-52.
Asiedu, E., (2014). “Does Foreign Aid in Education Promote Economic Growth? Evidence
From Sub-Saharan Africa”, Journal of African Development, 16(1), pp. 37-59.
Asongu, S. A., (2013). “How has mobile phone penetration stimulated financial development in Africa”, Journal of African Business, 14(1), pp. 7-18.
29
Asongu, S. A., (2014a). “Globalization, (fighting) corruption and development: how are these
phenomena linearly and nonlinearly related in wealth effect?, Journal of Economic Studies,
41(3), pp. 346-369.
Asongu, S. A., (2014b). “African development: beyond income convergence”, South African
Journal of Economics, 83(3), pp. 334-353.
Asongu, S. A., (2017a). “Conditional Determinants of Mobile Phones Penetration and Mobile Banking in Sub-Saharan Africa”, Journal of the Knowledge Economy.
DOI: 10.1007%2Fs13132-015-0322-z
Asongu, S. A., (2017b). “Knowledge Economy Gaps, Policy Syndromes and Catch-Up
Strategies: Fresh South Korean Lessons to Africa”, Journal of the Knowledge Economy, 8(1),
pp. 211–253.
Asongu, S. A., (2015). “The impact of mobile phone penetration on African inequality”, International Journal of Social Economics, 42(8), pp. 706-716.
Asongu, S. A., (2016). “Determinants of Growth in Fast Developing Countries: Evidence from Bundling and Unbundling Institutions”, Politics & Policy, 44(1), pp. 97-134.
Asongu, S. A., Batuo, E., & Tchamyou, S. V., (2016). “Bundling Governance: Finance versus Institutions in Private Investment Promotion”, African Governance and Development
Institute Working Paper No. 15/051, Yaoundé.
Asongu, S. A., & De Moor, L., (2015). “Recent advances in finance for inclusive
development: a survey”, African Governance and Development Institute Working Paper No.
15/005, Yaoundé.
Asongu, S. A., & De Moor, L., (2017). “Financial globalisation dynamic thresholds for financial development: evidence from Africa”, The European Journal of Development 29(1),
pp. 192–212.
Asongu, S. A., & Nwachukwu, J., (2016a). “Revolution empirics: predicting the Arab
Spring” Empirical Economics, 51(2), pp. 439-482.
Asongu, S. A., & Nwachukwu, J., (2016b). “Foreign aid and governance in Africa”, International Review of Applied Economics, 30(1), pp. 69-88.
Asongu, S. A., & Nwachukwu, J., (2016c). “The Role of Lifelong Learning in Political Stability and Non-Violence: Evidence from Africa”, Journal of Economic Studies, 43(1), pp.
141-164.
Asongu, S. A., & Ssozi, J., (2016). “Sino-African Relations: Some Solutions and Strategies
to the Policy Syndromes”, Journal of African Business, 17(1), pp. 33-51.
Ba, J., & Ng S (2006). “Confidence intervals for diffusion index forecasts and inference for
factor-augmented regression”, Econometrica, 74(4), pp. 1133-1150.

30
Bai, J., (2003). “Inferential theory for factor models of large dimensions”. Econometrica, 71
(1),pp.135-173.
Bai, J., (2009). “Panel data models with interactive fixed effects”. Econometrica, 77(4), pp.
1229-1279.
Baltagi, B. H., (2008). “Forecasting with panel data”, Journal of Forecasting, 27(2), pp. 153-
173.
Barro, R., (1991). “Economic Growth in a Cross Section of Countries”. Quarterly Journal of
Economics 196 (2/May), pp. 407–443.
Barro, R. J., & Sala-i-Martin, X., (1992). “Convergence”, Journal of Political Economy,
100(2), pp. 223-251.
Barro, R. J., & Sala-i-Martin, X., (1995). Economic Growth. The MIT Press, Cambridge, MA.
Baumol, W. J., (1986). “Productivity, growth, convergence and welfare: what the long run
data show”, American Economic Review, 76(5), pp. 1072-1085.
Bonaglia, F., Braga de Macedo, J., & Bussolo M., (2001). “How globalization improves
governance”. Working Paper No. 181. OECD Development Center. November.
Bond, S., Hoeffler, A., & Tample, J. (2001) “GMM Estimation of Empirical Growth Models”, University of Oxford.
Boulianne, S., (2009). “Does Internet Use Affect Engagement? A Meta-Analysis of
Research”, Political Communication, 26(2), pp. 193-211.
Blundell, R., & Bond, S., (1998). “Initial conditions and moment restrictions in dynamic panel data models” Journal of Econometrics, 87(1), pp. 115-143.
Brambor, T., Clark, W. M., & Golder, M., (2006). “Understanding Interaction Models:Improving Empirical Analyses”, Political Analysis, 14 (1), pp. 63-82.
Breuer, A., Landmann, T., & Farquhar, D., (2012). “Social media and protest mobilization: evidence from the Tunisian revolution”, Democratization, 22(4), pp. 764-792.
Bruno, G., De Bonis, R., & Silvestrini, A., (2012). “Do financial systems converge? New
evidence from financial assets in OECD countries”. Journal of Comparative Economics;
40(1), pp. 141-155.
Carmody, P., (2013). “A knowledge economy or an information society in Africa? Thintegration and the mobile phone revolution”, Information Technology for Development,
19(1), pp. 24-39.
Byrne, E., Nicholson, B., & Salem, F., (2011). “Information communication technologies and the millennium development goals”, Information Technology for Development, 17(1), pp. 1-3.

31
Chavula, H. K., (2013). “Telecommunications development and economic growth in Africa”, Information Technology for Development, 19(1), pp. 5-23.
Cheung, H. Y., & Chan. A. W. H., (2008). “Corruption Across Countries; Impacts form
Education and Cultural Dimensions.”, The Social Science Journal, 45 (2), pp. 223-239.
Claus, I., & Grimes, A., (2003). “Asymmetric Information, Financial Intermediation and the Monetary Transmission Mechanism: A Critical Review”, NZ Treasury Working Paper No.
13/019, Wellington.
Dewan, S., & Ramaprasad, J., (2014). “Social media, traditional media and music sales”, MIS
Quarterly, 38(1), pp. 101-128.
Diamond, L., (2010). “Liberation Technology”, Journal of Democracy, 21(3), pp. 69-83.
Dixit, A., (2009). “Governance Institutions and Economic Activity”, American Economic
Review, 99(1), pp. 5-24.
Efobi, U., (2015). “Politicians’ Attributes and Institutional Quality in Africa: A Focus on Corruption”, Journal of Economic Issues, 49(3), pp. 787-813.
Fonchingong, C., (2014). “Firming Up Institutional Policy for Deprived Elderly in Cameroon”, Politics & Policy, 42(6), pp. 948-980.
Fosu, A., (2013a), “Growth of African Economies: Productivity, Policy Syndromes and the Importance of Institutions” Journal of African Economies, 22(4), pp. 523-551.
Fosu, A., (2013b). “Growth of African Economies: Productivity, Policy Syndromes and the Importance of Institutions” Journal of African Economies 22(4), pp. 523-551.
Fosu, A. K., (2015a). “Growth, Inequality and Poverty in Sub-Saharan Africa: Recent
Progress in a Global Context”, Oxford Development Studies, 43(1), pp. 44-59.
Fosu, A., (2015b). Growth and Institutions in African Development, First edited by Augustin
K. Fosu, , Routledge Studies in Development Economics: New York
Fosu, A., (2015c). Growth and institutions in African Development, in Growth and
Institutions in African Development, First edited by Augustin K. Fosu, 2015, Chapter 1, pp.
1-17, Routledge Studies in Development Economics: New York.
Fukuyama, F., (2013). “What is Governance?”, Governance, 26(3), pp. 347-368.
Fung, M. K., (2009). “Financial development and economic growth: convergence or divergence?”. Journal of International Money and Finance, 28(1), pp.56-67.
Gagliardone, I., (2015). “‘Can you hear me?’ Mobile–radio interactions and governance in
Africa”, new media and society, doi: 10.1177/1461444815581148.

32
Gani, A., (2011). “Governance and Growth in Developing Countries”, Journal of Economic
Issues, 45(1), pp. 19-40.
Goredema, C, (2009). “Recovery of proceeds of crime: observations on practical challenges in
Sub-Saharan Africa.” In Basel Institute on Governance, Tracing Stolen Assets: A
Practitioner’s Handbook. Available at: http://www.
baselgovernance.org/fileadmin/docs/publications/books/asset-tracing_web-version.pdf (06-
26-14)
Greenaway-McGrevy, R., Han, C., & Sul, D., (2012). “Asymptotic distribution of factor aug-
mented estimators for panel regression”. Journal of Econometrics, 169 (1), pp. 48-53.
Grossman, G., Humphreys, M., and Sacramone-Lutz, G., (2014). ““I wld like u WMP to extend electricity 2 our village”: On Information Technology and Interest Articulation”, American Political Science Review, 108(3), pp. 688-705.
Hellstrom, J. (2008 ), “Mobile phones for good governance– challenges and way forward”, Stockholm University / UPGRAID,
http://www.w3.org/2008/10/MW4D_WS/papers/hellstrom_gov.pdf (Accessed: 22/11/2015).
Jolliffe, I. T. (2002) Principal Component Analysis (2nd Ed.) New York: Springer.
Kaffenberger, M., (2012). “The effect of educational attainment on corruption participation in sub-Saharan Africa”, Graduate School of Vanderbilt University.
Kaiser, H. F. (1974) “An index of factorial simplicity” Psychometrika, 39(1), pp. 31–36.
Kamel, S., (2005). “The use of information technology to transform the banking sector in developing nations”, Information Technology for Development, 11(4), pp. 305-312.
Kaufmann, D., Kraay, A., & Mastruzzi, M., (2007a). “Growth and Governance: A Reply”, Journal of Politics, 69(2), pp. 555-562.
Kaufmann, D., Kraay, A., & Mastruzzi, M., (2007b). “Growth and Governance: A Rejoinder”, Journal of Politics, 69(2), pp. 570-572.
Kaufmann, D., Kraay, A & Mastruzzi, M., (2010). “The worldwide governance indicators: Methodology and analytical Issues”. World Bank Policy Research Working Paper No 5430,
Washington.
Kivuneki, F. N., Ekenberg, L., Danielson, M., & Tusubira. F.F., (2011). “Perceptions of the role of ICT on quality of life in rural communities in Uganda”, Information Technology for
Development, 21(1), pp. 61-80.
Klitgaard, R., (1988). Controlling Corruption, University of California Press, Berkeley and
London.

33
Kuada, J., (2015). Private Enterprise-Led Economic Development in Sub-Saharan Africa The
Human Side of Growth First edition by Kuada, J, Palgrave Macmillan: New York.
Kurtz, M., & Schrank, A., (2007a). “Growth and Governance: Models, Measures, and Mechanisms”, Journal of Politics, 69(2), pp. 538-554.
Kurtz, M., & Schrank, A., (2007b). “Growth and Governance: A Defense”, Journal of
Politics, 69(2), pp. 563-569.
Lalountas, D. A., Manolas, G.A., & Vavouras, I.S., (2011), “ Corruption, globalization and development: How are these three phenomena related?”, Journal of Policy Modeling, 33,
pp.636-648.
Lederman, D., Loayza, N. V., & Soares, R. R., (2005). “Accountability and Corruption: Political Institutions Matter”, Economics & Politics, 7(1), pp. 1-35.
Levendis, J., & Lee, S. H., (2013). “On the endogeneity of telecommunications and economic growth: evidence from Asia”, Information Technology for Development, 19(1), pp.
62-85.
Love, I., & Zicchino, L., (2006). “Financial Development and Dynamic Investment Behaviour: Evidence from Panel VAR” .The Quarterly Review of Economics and Finance,
46(2), pp. 190-210.
Manacorda, M., & Tesei, A., (2016). “Liberation Technology: Mobile Phones and Political Mobilization in Africa”, Queen Mary University of London, http://personal.lse.ac.uk/manacorm/liberation_technology.pdf (Accessed: 24/05/2016).
Mankiw, N. G., Romer, D., & Weil, D. N., (1992). “A contribution to the empirics of economic growth”, Quarterly Journal of Economics, 107(May), pp. 407–437.
Matthias, M., (2012). “Connectivity and Accountability in Africa”, The Futurist, 46(1), pp. 6-
7.
Mayer-Foulkes, D., (2010). “Divergences and Convergences in Human Development”. UNDP Human Development Research Paper 2010/20, Paris.
McKenzie C, R., & McAleer M (1997). “On efficient estimation and correct inference in models with generated regressors: A general approach.” Japanese Economic Review, 48(4),
pp. 368-389.
McMillan, M,S., (2013). “The Changing Structure of Africa’s Economies.” Background Paper for African Economic Outlook 2013. African Development Bank, OECD Development
Center, and United Nations Development Program. Revised version available at:
http://legacy.wlu.ca/documents/57803/McMillian_ChangingAfrica_140317.pdf (Accessed:
24/05/2016).

34
Michel, J., (2016). “Beyond Aid: the Integration of Sustainable Development in a Coherent International Agenda”, Centre for International Private Enterprises,
http://www.cipe.org/publications/detail/beyond-aid-integration-sustainable-development-
coherent-international-agenda (Accessed: 19/07/2016).
Mocan, N., (2008). “What Determines Corruption? International Evidence from Microdata.” Economic Inquiry, 46 (4), pp. 493-510.
Mpogole, H., Usanga, H., & Tedre, M., (2008). “Mobile phones and poverty alleviation: a
survey study in rural Tanzania”, Proceedings of M4D 2008, Karlstad University, Sweden, pp. 62-72.
Narayan, P. K., Mishra, S., & Narayan, S., (2011). “Do market capitalization and stocks traded converge? New global evidence”, Journal of Banking and Finance, 35(10), pp. 2771-
2781.
Okada, K., & Samreth, S.,(2012), “The effect of foreign aid on corruption: A quantile regression approach”, Economic Letters, 115(2), pp. 240-243.
Oluwatobi, S., Efobi, U.R., Olurinola, O.I., Alege, P. (2015), “Innovation in Africa: Why
Institutions Matter”, South African Journal of Economics, 83(3), pp. 390-410.
Oxley L, & McAleer, M., (1993). “Econometric issues in macroeconomic models with generated regressors.” Journal of Economic Surveys, 7(1), pp. 1-40.
Pagan, A., (1984). “Econometric issues in the analysis of regressions with generated regressors” International Economic Review, 25(1), pp. 221-247.
Penard, T., Poussing, N., Yebe, G. Z., & Ella, P. N., (2012). “Comparing the Determinants of
Internet and Cell Phone Use in Africa : Evidence from Gabon ”, Communications &
Strategies, 86 (Second Quarter), pp. 65-83.
Pesaran, M. H., (2006). “Estimation and inference in large heterogeneous panels with a mul- tifactor error structure”. Econometrica 74 (4), pp. 967-1012.
Petrakis, P. E., & Stamatakis, D. (2002). “Growth and educational levels: a comparative analysis”. Economics of Education Review, 21 (2), pp. 513-521.
Pierskalla, J. H., & Hollenbach, F. M., (2013). “Technology and Collective Action: The Effect of Cell Phone Coverage on Political Violence in Africa”, American Political Science
Review, 107(2), pp. 207-224.
Ponelis, S. R., & Holmner, M. A., ( 2013a). “ICT in Africa: Enabling a Better Life for All”, Information Technology for Development, 21(1), pp. 1-11.
Ponelis, S. R., & Holmner, M. A., ( 2013b). “ICT in Africa: Enabling a Better Life for All”, Information Technology for Development, 21(1), pp. 163-177.

35
Porter, G., Hampshire, K., Milner, J., Munthali, A., Robson, E., De Lannoy, A., Bango, A.,
Gunguluza, N., Mashiri, M., Tanle, A., and Abane, A., (2016). “Mobile Phones and Education in Sub-Saharan Africa: From Youth Practice to Public Policy”, Journal of International
Development, 28(1), pp. 22-39.
Qureshi, S., (2013a). “What is the role of mobile phones in bringing about growth?”, Information Technology for Development, 19(1), pp. 1-4.
Qureshi, S., (2013b). “Networks of change, shifting power from institutions to people: how are innovations in the use of information and communication technology transforming
development?” ?”, Information Technology for Development, 19(2), pp. 97-99.
Qureshi, S., (2013c). “Information and Communication Technologies in the Midst of Global Change: How do we Know When Development Takes Place?”, Information Technology for
Development, 19(3), pp. 189-192.
Roodman, D., (2009a). “A Note on the Theme of Too Many Instruments”, Oxford Bulletin of
Economics and Statistics, 71(1), pp. 135-158.
Roodman, D., (2009b). “How to do xtabond2: An introduction to difference and system GMM in Stata”, Stata Journal, 9(1), pp. 86-136.
Sayari, S., (1977). “Political Patronage in Turkey”, in E. Gellner and J. Waterbury (eds.), Patonsand Clients in Mediterranean Societies, London: Duckworth, pp. 103-113.
Scott, J. C., (1972). Comparative Political Corruption, Englewood Cliffs, NJ: Prentice-Hall.
Snow, B. C., (2009). “Mobile Phone Diffusion and Corruption in Africa”, Political
Communication, 26(3), pp.333-353.
Solow, R. M., (1956). “A contribution to the theory of economic growth”, Quarterly Journal
of Economics, 70(1), pp. 65-94.
Stock, J. H. & M. W. Watson (2002). “Forecasting using principal components from a large
number of predictors”. Journal of the American Statistical Association, 97 (460), pp.1167-
1179.
Suarez, S. L., (2006). “Mobile democracy: text messages, voter turnout and the 2004 Spanish
general election”, Representation, 42(2), pp. 117-128.
Swan, T., (1956). “Economic growth and capital accumulation”. Economic Record, 32, pp.
334–361.
http://onlinelibrary.wiley.com/doi/10.1111/saje.12100/abstract
Tchamyou, V. S., (2015). “The role of knowledge economy in African business”, African
Governance and Development Institute Working Paper, No. 15/049, Yaoundé.

36
Tchamyou, V. S., & Asongu, S. A., (2017). “Information Sharing and Financial Sector Development in Africa”, Journal of African Business, 18(1), pp. 24-49.
Treisman, D., (2000).“ The causes of corruption: a cross-national study”, Journal of Public
Economics, 76(3), pp. 399-457.
Truex, R., (2011). “Corruption, Attitudes, and Education: Survey Evidence from Nepal.” World Development, 39 (7), pp. 1133-42.
Tusalem, R. F., (2015), “State Regulation of Religion and the Quality of Governance”, Politics & Policy, 43(1), pp. 94-141.
Varese, F., (1997). “The Transition to the Market and Corruption in Post-socialist Russia”, Political Studies, 45(3), pp. 579-96.
Weidmann, J. N., & Shapiro, N. B., (2015). “Is the Phone Mightier Than the Sword?
Cellphones and Insurgent Violence in Iraq”, International Organisation, 69(2), pp. 247-274.
Westerlund, J., & Urbain, J-P., (2013a). “On the estimation and inference in factor-augmented
panel regressions with correlated loadings”, Economic Letters, 119(3), pp. 247-250.
Westerlund, J., & Urbain, J-P., (2013b). “On the implementation and use of factor-augmented
regressions in panel data”, Journal of Asian Economics, 28(October), pp. 3-11.
Westerlund, J., & Urbain, J-P., (2012). “Cross-sectional averages versus principal
components”, Maastricht University, RM/11/053, Maastricht.
Weyland, K., (1998). “The Politics of Corruption in Latin America”. Journal of Democracy, 9
(2), pp.108-121.
Wade, R., (1985). “The Market for Public Office: Why the Indian State is not better at
Development.”, World Development, 13(4), pp. 467–97.
World Bank (2015). “World Development Indicators”, World Bank Publications
http://www.gopa.de/fr/news/world-bank-release-world-development-indicators-2015
(Accessed: 25/04/2015).
Yerrabati, S., & Hawkes, D., (2015). “Economic Governance and Economic Growth in South and East Asia & Pacific Region: Evidence from Systematic Literature Reviews and Meta-
analysis”. Advances in Economics and Business, 3(1), pp. 1 - 21.