The Role of Gli3 Transcription Factor in the Developing ... · Lastly, I‟d like to thank my...
132
The Role of Gli3 Transcription Factor in the Developing Mouse Stomach by Ruth Choi A thesis submitted in conformity with the requirements for the degree of Masters of Science Institute of Medical Science University of Toronto Copyright ©2012 by Ruth Choi
Transcript of The Role of Gli3 Transcription Factor in the Developing ... · Lastly, I‟d like to thank my...
The Role of Gli3 Transcription Factor in the Developing
Mouse Stomach
by
Ruth Choi
A thesis submitted in conformity with the requirements
for the degree of Masters of Science
Institute of Medical Science
University of Toronto
Copyright ©2012 by Ruth Choi
ii
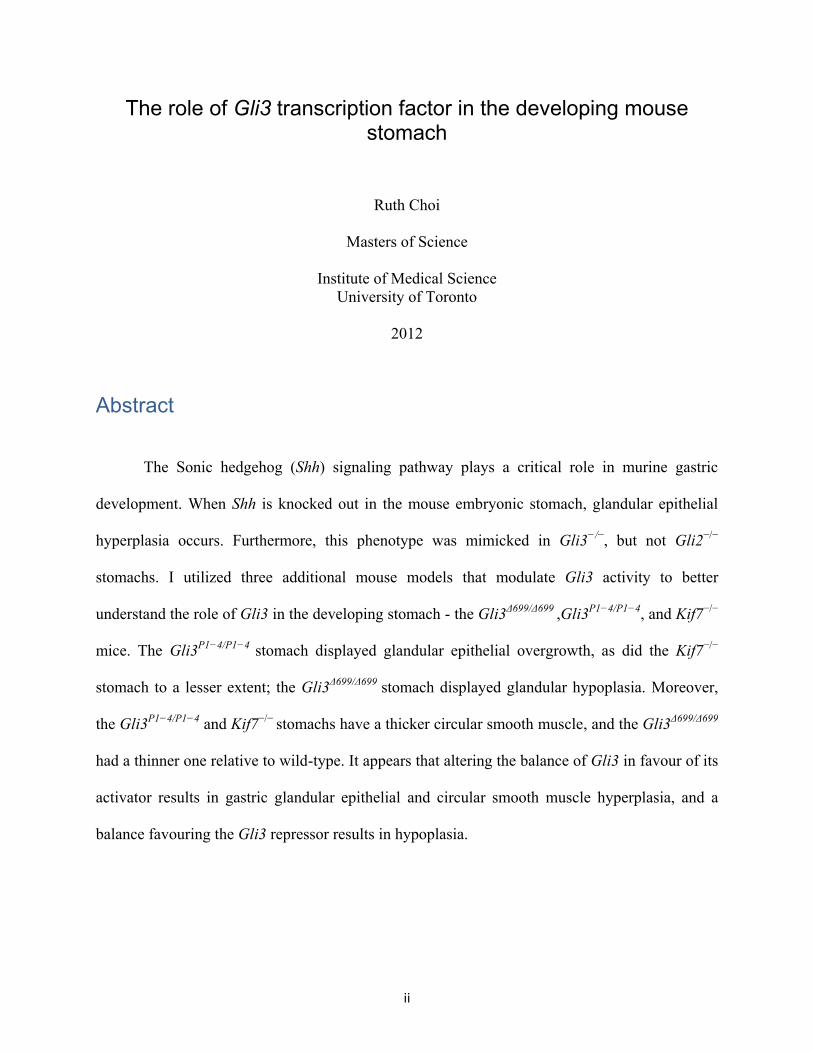
The role of Gli3 transcription factor in the developing mouse stomach
Ruth Choi
Masters of Science
Institute of Medical Science
University of Toronto
2012
Abstract
The Sonic hedgehog (Shh) signaling pathway plays a critical role in murine gastric
development. When Shh is knocked out in the mouse embryonic stomach, glandular epithelial
hyperplasia occurs. Furthermore, this phenotype was mimicked in Gli3−/−
, but not Gli2−/−
stomachs. I utilized three additional mouse models that modulate Gli3 activity to better
understand the role of Gli3 in the developing stomach - the Gli3Δ699/Δ699
,Gli3P1−4/P1−4
, and Kif7−/−
mice. The Gli3P1−4/P1−4
stomach displayed glandular epithelial overgrowth, as did the Kif7−/−
stomach to a lesser extent; the Gli3Δ699/Δ699
stomach displayed glandular hypoplasia. Moreover,
the Gli3P1−4/P1−4
and Kif7−/−
stomachs have a thicker circular smooth muscle, and the Gli3Δ699/Δ699
had a thinner one relative to wild-type. It appears that altering the balance of Gli3 in favour of its
activator results in gastric glandular epithelial and circular smooth muscle hyperplasia, and a
balance favouring the Gli3 repressor results in hypoplasia.

iii
Acknowledgements
First of all, I‟d like to thank my supervisor and committee member, Dr. Peter C. W. Kim,
for providing me the opportunity to work at his lab. Through this journey in my Masters, I grew
as both a researcher and a person. His ongoing drive, guidance, and support have been invaluable
to my research experience. I‟d also like to thank all of the past members of Dr. Kim‟s research
lab of which I‟ve had the pleasure to work with: Felix Young, Jinhyung Park, Irene Trinh,
Michelle Kushida, and Jennifer Zhang. They provided crucial technical support and great
directional advice during my stay at the lab.
I‟m especially grateful for Michelle‟s mentorship, as she taught me many laboratory skill
sets and had the patience to guide me through the basics of research. She was terrific for
bouncing ideas off of, and added a lot of humour to my long days at the lab. Another special
thanks should be given to Jennifer Zhang, who provided a lot of technical help, and spent many
hours helping complete my thesis data set and maintaining my mouse lines. She was also a
wonderful person to work with, and made each of my days at the lab that much brighter. I am
grateful that I‟ve met these two colleagues that I can also consider good friends.
I‟m very grateful for my committee members, Dr. Chi-Chung Hui and Dr. Nicola Jones,
who gave me much-needed feedback on all aspects of my research project. They brought to light
areas in which I needed improvement, as well as insights into how to approach a problem as an
unbiased researcher, and pushed me to strive for excellence. The direction of my research was
very much determined by every committee meeting I attended, and I remember leaving each

iv
meeting looking forward to the ‟new‟ direction of my thesis. They genuinely cared about my best
interests, and challenged me to reach my full potential, and for that I am truly grateful.
I‟d like to especially thank Dr. C.-C. Hui, for going above and beyond his role as a
committee member to help me with the direction and theory of my project. Moreover, he kindly
invited my lab to attend his weekly lab meetings, and these have proved to be of tremendous
value. All the members of his lab are excellent researchers, and through attending their
presentations, I‟ve learned a great deal about presentation skills, experimental methods and
ideas, and what makes a good ‟story‟.
I thank Tyler and Karen, members of Dr. Darius Bagli‟s lab, and Sayeed, in Dr. Walid
Farhat‟s lab, for providing their expertise in my research endeavours. Their specific contributions
to my dissertation will be described in the Contributions section below.
I want to thank my family for their support and understanding in all my academic
endeavours over the years. At times when graduate school work and life was wearing me down,
they were all there to encourage me to get back up. My parents have always taught me to try the
best that I can in everything I do, and my brother has set a great example for me of what hard
work can achieve. I look to my family as a great source of inspiration, and am thankful that I
have such a strong network of support.

v
Contributions
I‟d like to thank Jennifer Zhang, from Dr. Peter Kim‟s lab at Sick Kids Hospital, Toronto, for
performing the q-PCR experiments for my project. The real-time PCR results shown in Figures
21 & 22 are products of her hard work. She also helped me maintain my mice and set up timed-
matings for mouse dissections when I was away from the lab. Her technical support and
expertise were of tremendous help to me.
I‟d also like to thank Rong and Mary, two technicians at Dr. Hui‟s lab (Sick Kids
Hospital, Toronto), who gave me much-needed advice and materials for my in-situ hybridization
and western blot experiments. Rong provided the Ptc1 and Gli1 plasmid DNA to create my
mRNA probes for the in-situ hybridization experiments. Mary provided valuable information
about the materials and conditions for the western blot experiments.
I thank Tyler and Karen, from Dr. Darius Bagli‟s lab, and Sayeed, from Dr. Walid
Farhat‟s lab, both at Sick Kids Hospital in Toronto, for providing their expertise in my research
endeavours. Tyler unhesitatingly offered his expertise with my western blot experiments, helping
me trouble-shoot the protocol step-by-step whenever I needed. Tyler and Karen demonstrated to
me the use of the western blot equipment, and lent me their equipment and materials such as
blotting paper when needed. Sayeed provided great support as well, going above and beyond to
lend me materials and equipment for western blotting such as pipette tips, RIPA buffer, and a
scanner. He taught me how to develop my western blot images as well. I am extremely grateful
to all of them for their kindness and their support.
vi
My lab would like to thank C.C. Hui‟s lab at Sick Kids Hospital, Toronto, for giving us
the Gli2 and Kif7 mice. I also thank the Bose lab at Heinrich-Heine University, Germany [6], for
providing us with the Gli3Δ699
mice. I would also like to thank the Wang lab at Cornell
University, New York State, USA [57], for giving us the Gli3P1−4
mouse. My project goals
would not have been achievable without their help, and I am very grateful for their generosity.
Lastly, I‟d like to thank my supervisor and committee members, Dr. Peter Kim, Dr. Chi-
Chung Hui, and Dr. Nicola Jones, for their invaluable guidance in directing the progress of my
dissertation and reviewing and critiquing my data and thesis.

vii
Table of Contents
Abstract ................................................................................................................................. ii
Acknowledgements ........................................................................................................... iii
Contributions ....................................................................................................................... v
List of Figures ......................................................................................................................ix
Nomenclature ....................................................................................................................... x
Chapter 1: Introduction ...................................................................................................... 1
1.1 Rationale behind this study ...................................................................................... 1
1.2 Goals and objectives of this thesis ........................................................................ 3
1.3 Significance of my study ........................................................................................... 4
1.4 A brief general overview and outline of the thesis............................................. 5
Chapter 2: Background and Current Theories ............................................................... 7
2.1 The Hedgehog signaling pathway: Genetics and Molecular Mechanisms .. 7
2.1.1 Significance of the Hedgehog (Hh) Signaling Pathway ................................... 7
2.1.2 The hedgehog pathway in Drosophila ................................................................ 8
2.1.3 Mechanisms of Hedgehog signaling in mice ..................................................... 9
2.1.4 The Gli3 transcription factor ................................................................................ 14
2.1.5 Genetics and Hedgehog pathway mouse models .......................................... 19
2.2 The murine stomach ................................................................................................. 26
2.2.1 The anatomy and function of the mouse stomach .......................................... 26
2.2.2 Timeline of events in murine gastric development .......................................... 34
2.3 The Hedgehog pathway in murine gastric development: current
knowledge .............................................................................................................................. 40
2.3.1 Expression of Hh pathway components in gastric morphogenesis .............. 40
2.3.2 The role of the Hh pathway in stomach development .................................... 41
2.4 Gastric cancer and its relationship with the Hedgehog pathway ................ 44
Chapter 3: Experimental Plan ......................................................................................... 46
3.1 Hypothesis .................................................................................................................. 46

viii
3.2 General approach to addressing the hypothesis ............................................. 47
3.3 Methods and Materials ............................................................................................. 48
3.3.1 Animal Models ......................................................................................................... 48
3.3.2 Dissections .............................................................................................................. 49
3.3.3 Genotyping .............................................................................................................. 50
3.3.4 Fixation and Slide Preparation ............................................................................. 51
3.3.5 Hematoxylin and Eosin (H&E) Staining .............................................................. 51
3.3.6 Immunofluorescence (IF) ...................................................................................... 52
3.3.7 Apoptosis Assay ..................................................................................................... 53
3.3.8 Cell-counting ............................................................................................................ 53
3.3.9 Periodic Acid Schiff (PAS) Staining ..................................................................... 55
3.3.10 In-situ Hybridization (ISH) ................................................................................... 55
3.3.11 Western Blot .......................................................................................................... 56
3.3.12 Real-time PCR ...................................................................................................... 58
3.3.13 Statistics................................................................................................................. 59
Chapter 4: Results and Interpretation ........................................................................... 61
4.1 Phenotypic analysis of the Shh−/− stomach ........................................................ 61
4.2 Phenotypic analysis of the Gli2−/− and Gli3−/− murine stomachs .................. 65
4.3 The role of Gli3 activator and repressor in stomach development:
assessing the Gli3P1−4/P1−4 and Gli3Δ699/Δ699 murine stomachs ................................... 71
4.3.1 Phenotypic analysis of the Gli3P1−4/P1−4 and Gli3Δ699/Δ699 mouse stomachs . 71
4.3.2 Molecular analysis of the Gli3P1−4/P1−4 and Gli3Δ699/Δ699 mouse stomachs ... 80
4.4 Analysis of the Kif7−/− stomach. ............................................................................. 91
4.5 Discussion ................................................................................................................ 100
4.5.1 Circular smooth muscle layer is affected in all mutants ............................... 100
4.5.2 Glandular epithelial thickness depends on the balance of Gli3 activator and
repressor ............................................................................................................................ 101
4.5.3 How does Gli3 regulate gastric glandular epithelial thickness? ................ 102
Chapter 5: Conclusions and Future Work .................................................................. 108
5.1 Conclusion ................................................................................................................ 108
5.2 Future work ............................................................................................................... 109
Bibliography ..................................................................................................................... 112

ix
List of Figures
Figure 1: The mammalian Shh signalling pathway ...................................................................................... 12
Figure 2: Processing of GLI3 full-length protein to its truncated form ....................................................... 18
Figure 3: Hh pathway mutant mice at E14.5. ............................................................................................. 24
Figure 4: Additional Hh pathway mutant mice at E14.5 used in my study. ................................................ 25
Figure 5: The anatomy of the mouse and human stomach. ....................................................................... 27
Figure 6: The gastric epithelia of the mouse E18.5 stomach. ..................................................................... 28
Figure 7: Major cell types of the E18.5 mouse gastric glandular epithelium. ............................................ 32
Figure 8: Smooth muscle layers in the adult mouse stomach. ................................................................... 33
Figure 9: Stomach development in mice: E12.5. ........................................................................................ 36
Figure 10: Stomach development in mice: E14.5. ...................................................................................... 37
Figure 11: Stomach development in mice: E18.5. ...................................................................................... 39
Figure 12 (See next page for full caption) ............................................................................................... 63
Figure 13: Gli3−/− mice display gastric glandular epithelial overgrowth. (See next page for full caption) . 67
Figure 14: The Gli3 null stomach displays variable degrees of glandular overgrowth. .............................. 69
Figure 15: Circular smooth muscle layer is significantly thicker in both Gli2 and Gli3 null stomachs ........ 70
Figure 16: The Gli3P1−4/P1−4 gastric glandular epithelium is overgrown; the Gli3Δ699/Δ699 gastric glandular
epihtelium is hypoplastic…………………………………………………………………………………………………………………..…..75
Figure 17: The major epithelial cell types in the Gli3P1−4/P1−4 and Gli3Δ699/Δ699 stomachs. ........................... 77
Figure 18: The Gli3P1−4/P1−4 gastric circular smooth muscle is thicker relative to wild-type, and that of the
Gli3Δ699/Δ699 stomach is thinner. ................................................................................................................... 79
Figure 19: Proliferation rates are unaltered in both Gli3P1−4/P1−4 and Gli3Δ699/Δ699 E18.5 gastric glandular
epithelium; apoptosis rates are increased only in the Gli3Δ699/Δ699 E18.5 gastric glandular epithelium. .... 82
Figure 20: The GLI3 full-length level is higher in the Gli3P1−4/P1−4 stomach than wild-type. ................. 84
Figure 21: Patched1 expression and levels in Gli3 mutant stomachs. ........................................................ 87
Figure 22: Gli1 mRNA expression and levels in Gli3 mutant stomachs. ..................................................... 89
Figure 23: The Kif7−/− stomach displays glandular epithelial hyperplasia. .................................................. 94
Figure 24: Expression of gastric glandular epithelial cell types in the Kif7−/− E18.5 stomach .................... 95
Figure 25: The circular smooth muscle in the Kif7−/− E18.5 stomach is thicker relative to wild-type. ....... 97
Figure 26: The proliferation rate is unaltered in the Kif7−/− E18.5 stomach relative to wild-type. ............. 98
Figure 27: The Kif7−/− E18.5 stomach has a higher GLI3 activator-to¬repressor protein ratio than wild-
type. ............................................................................................................................................................ 99
Figure 28: Working model of the relationship between the balance of Gli3 activator and repressor and
the gastric glandular epithelium. (See next page for full caption) ........................................................... 105
Figure 29: Excessive pit-branching appears to contribute to glandular epithelial overgrowth ............... 107
x
Nomenclature
A-P anterior-posterior
AP alkaline phosphatase
APB alkaline phosphatase buffer
Ci Cubitus Interruptus
Cos2 Costal2
Cy-3 Cyanine-3
DAPI 4'-6-Diamidino-2-phenylindole
DEPC diethylpyrocarbonate
dH20 deionized water
Dhh Desert hedgehog
DIG Digoxigenin
dNTP Deoxynucleoside triphosphate
E Embryonic day
ECL enterochromaffin-like
FITC Fluorescein isothiocyanate
fu fused

xi
GCPS Greig cephalopolysyndactyly syndrome
GE glandular epithelium
GI tract gastrointestinal tract
H. pylori Helicobacter pylori
H&E Hematoxylin and Eosin
Hh Hedgehog
HRP Horse radish peroxidase
IF immunofluorescence
Ihh Indian hedgehog
IM intestinal metaplasia
ISH in-situ hybridization
LAS Lab Animal Services
MgCl2 Magnesium chloride
NGE non-glandular epithelium
PAP-A Post-axial Polydactyly type A
PAP-A/B Post-axial Polydactyly type A/B
PAS Periodic Acid Schiff
xii
PARP poly (ADP-ribose) polymerase
PBS phosphate-buffered saline
PCR polymerase chain reaction
PFA paraformaldehyde
PHS Pallister-Hall syndrome
PKA protein kinase A
PPD-IV Pre-axial Polydactyly type IV
Ptc Patched
Ptc1 Patched1
Ptc2 Patched2
RHOD rhodamine
RIPA Radioimmunoprecipitation
qPCR Quantitative polymerase chain reaction
SSC Saline sodium citrate
Shh Sonic hedgehog
SM smooth muscle
Smo Smoothened
xiii
Sufu Suppressor of fused
TBS-T Tris-buffered saline with Tween 20
TCP Toronto Centre for Phenogenomics
TEA Triethanolamine
TNE Tris NaCl EDTA
WFA Wisteria floribunda agglutinin
XtJ
extra toes
zfd zinc finger deletion

1
Chapter 1 Introduction
1.1 Rationale behind this study
Embryogenesis requires a tightly orchestrated and regulated process of patterning, dif-
ferentiation, proliferation, and apoptosis, as well as a highly complex and sophisticated network
of molecular pathways to temporally and spatially coordinate these events. One of the most well-
established and significant signaling pathways in development is the Hedgehog (Hh) signaling
pathway. Hedeghog signaling is critical in regulating developmental and homeostatic processes
and is highly conserved amongst vertebrates [38]; for these reasons, great efforts by researchers
have been made to elucidate Hh mechanisms and functions. Aberrations in Hh signaling are
often associated with congenital disorders and cancers [30]. In the stomach, the pathway has
been implicated in gastric cancer [48].
Gastric cancer is the second most common cause of cancer death worldwide; the prog-
nosis for advanced gastric cancer patients is poor, especially because they usually present at late
stages [23] [28]. Though studies have linked the Hh pathway to gastric cancer, its functional role
in the onset and progression of this disease is still largely unknown [31]. Studies have shown that
the Hh pathway is activated, via the detection of upregulated Hh genes SHH, Patched1 (PTC1),
and GLI1, in gastric adenocarcinomas [23] [28].
2
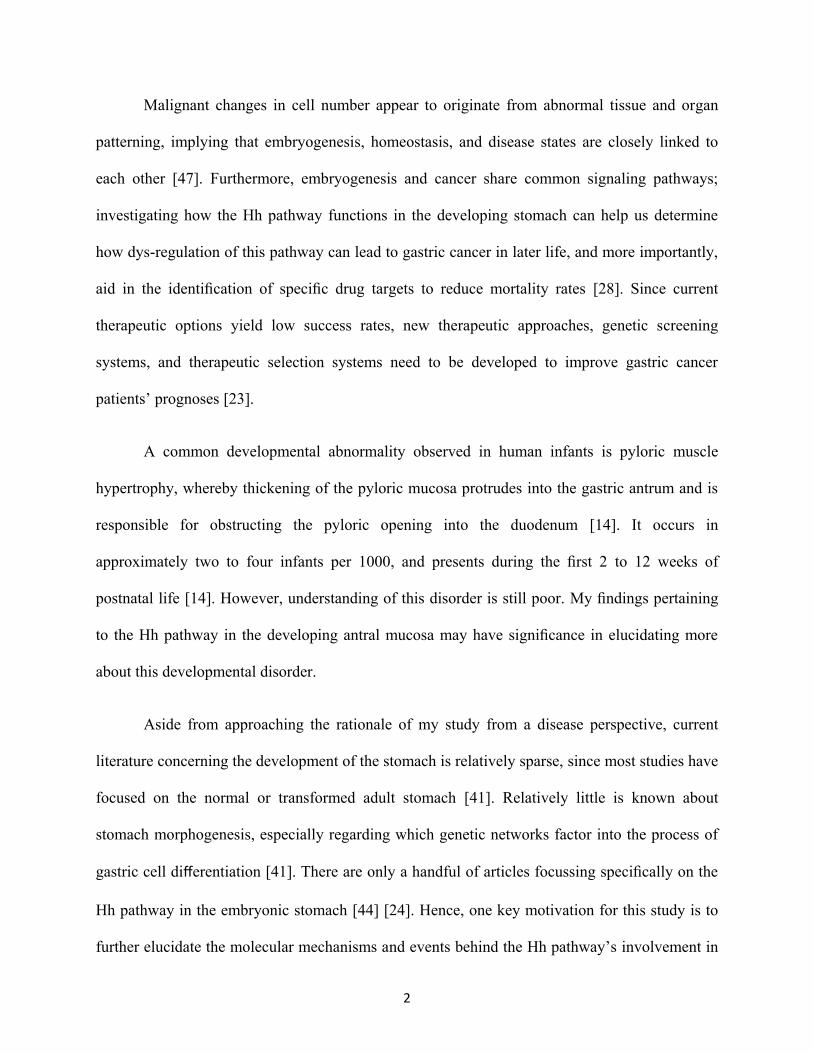
Malignant changes in cell number appear to originate from abnormal tissue and organ
patterning, implying that embryogenesis, homeostasis, and disease states are closely linked to
each other [47]. Furthermore, embryogenesis and cancer share common signaling pathways;
investigating how the Hh pathway functions in the developing stomach can help us determine
how dys-regulation of this pathway can lead to gastric cancer in later life, and more importantly,
aid in the identification of specific drug targets to reduce mortality rates [28]. Since current
therapeutic options yield low success rates, new therapeutic approaches, genetic screening
systems, and therapeutic selection systems need to be developed to improve gastric cancer
patients‟ prognoses [23].
A common developmental abnormality observed in human infants is pyloric muscle
hypertrophy, whereby thickening of the pyloric mucosa protrudes into the gastric antrum and is
responsible for obstructing the pyloric opening into the duodenum [14]. It occurs in
approximately two to four infants per 1000, and presents during the first 2 to 12 weeks of
postnatal life [14]. However, understanding of this disorder is still poor. My findings pertaining
to the Hh pathway in the developing antral mucosa may have significance in elucidating more
about this developmental disorder.
Aside from approaching the rationale of my study from a disease perspective, current
literature concerning the development of the stomach is relatively sparse, since most studies have
focused on the normal or transformed adult stomach [41]. Relatively little is known about
stomach morphogenesis, especially regarding which genetic networks factor into the process of
gastric cell differentiation [41]. There are only a handful of articles focussing specifically on the
Hh pathway in the embryonic stomach [44] [24]. Hence, one key motivation for this study is to
further elucidate the molecular mechanisms and events behind the Hh pathway‟s involvement in
3
gastric development. The molecular mediators of epithelial-mesenchymal cross-talk crucial to
the development of the gastrointestinal (GI) tract are still largely unknown [30], and identifying
some of these players as well as their specific function is important for our understanding.
1.2 Goals and objectives of this thesis
The purpose of this thesis is to determine the role of the Shh pathway in the developing murine
stomach, in the hopes of improving my understanding of the developing human stomach. Two
previous studies set out the framework from which my work builds upon. The first is a study
done by Ramalhos-Santos et. al [44], that highlighted the glandular overgrowth resulting from
knocking out Sonic hedgehog in the developing murine stomach. The next study, done by Kim
et. al in 2005, made use of mouse models lacking Gli2 or Gli3 function to study the effect of
their loss-of-function in the developing murine stomach [24]. Gli2 and Gli3 transcription factors
are downstream of the Shh ligand, and are the endpoint transducers of Hh signaling. The Gli3−/−
stomach displayed glandular overgrowth, whereas the Gli2−/−
stomach appeared normal. These
results led these researchers to conclude that Gli3, and not Gli2, is the mediator of Shh signaling
in the developing murine stomach. Their findings were highly unexpected as Gli2 is considered
the dominant activator of Hh signalling, and Gli3 is thought to be the dominant repressor.
These studies have established that the Shh pathway is important in murine gastric
glandular development; however, many questions still remain. The central question in this thesis
pertains to Gli3 and its action in the developing stomach. Emerging evidence has brought to light
the importance of Gli3 transcription factor in development of many organ systems, e.g. bladder,
4
limbs, brain, neural tube. Moreover, studies are beginning to distinguish between the dual
functions of Gli3, which possesses both activating and repressing properties. The Kim et. al
study [24] made use of the Gli3−/−
mouse, which lacks the ability to form both Gli3 activator and
repressor. Therefore, this mutation does not allow us to investigate the relative contribution of
Gli3 activator versus repressor on gastric development. The question of whether it is the Gli3
activator, repressor, or both exerting some function in regulating gastric glandular development
remains unknown, and it is the central focus of this thesis to address this question.
1.3 Significance of my study
Recent advances in biomedical research have resulted in the creation of three useful
mouse models for my study: Gli3P1−4
, Gli3Δ699
, and Kif7 mice, which are models that possess
only Gli3 activator function, constitutive Gli3 repressor function, and a higher Gli3 activator-to-
repressor ratio, respectively [57] [6] [9]. A more in-depth explanation of these genetic models is
laid out in Section 2.1.5. Importantly, these new models allow us to evaluate the separate
activator and repressor functions of Gli3 transcription factor in the developing murine stomach,
something that was previously impossible to do.
I characterize herein, the gastric phenotypes of three mouse mutants - Gli3P1−4
, Gli3Δ699
,
and Kif7, all of which have not yet been studied. I observed that the Gli3P1−4/P1−4
and Kif7−/−
stomachs, both of which possess a balance favouring Gli3 activator, displayed glandular
epithelial overgrowth. The Gli3P1−4/P1−4
stomach had a more severely overgrown glandular
epithelium than Kif7−/−
. Moreover, the phenotype of the Gli3Δ699/Δ699
, wherein constitutive Gli3
5
repression occurs in the absence of Gli3 activator, resulted in glandular hypoplasia. These
findings demonstrate that the level of Gli3 activator and repressor affects glandular epithelial
growth.. The higher the ratio of activator-to-repressor relative to wild-type, the greater the gastric
glandular overgrowth, and in reverse, the lower this ratio, the more severe the resultant
hypoplasia is. This is contrary to the conclusion arrived at by the 2005 study [24]; they
concluded that Gli3 activator is the dominant transcription factor acting in the stomach to
mediate Shh activity.
My results strongly suggest that both forms of Gli3 are necessary for proper gastric
glandular development; and that the balance between the two forms dictates the extent of
glandular epithelial thickness and circular smooth muscle thickness. My study highlights the
significant role of Gli3 in stomach development, as well as broadens the knowledge concerning
Shh signaling mechanisms in the developing murine stomach. We find a unique and unusual Shh
signaling model in the develoiping stomach, where Gli3 seems to play a more essential role than
Gli2 – the transcription factor that is more commonly associated with mediating Shh activity.
1.4 A brief general overview and outline of the thesis
The first chapter, Chapter 2, discusses the relevant background information necessary for
understanding the results and discussion of the thesis. The first part of the background, Section
2.1.1 to 2.1.4 focuses on the current knowledge concerning mechanisms of vertebrate Hh
signaling, with an emphasis on the Gli3 transcription factor, which will be important for
understanding the rest of the thesis. Section 2.1.5 describes the mouse models that were used in

6
this study; what is known about gastric development in these mutants is discussed in a later
section (Section 2.3). The second part of this chapter, Section 2.2, describes the anatomy and
function of the stomach, but devotes more attention to murine stomach development, as this is
the primary focus of my study. The last part, Section 2.3, ties together the two topics: the Hh
pathway and stomach development. It delineates what is currently known about the Hh signaling
pathway in murine stomach development, as well as points out the knowledge gaps.
Chapter 3 discusses the specific questions that my study seeks to answer in this thesis.
The next part, Section 3.2, describes the research methodology employed to resolve the
aforementioned questions. This section describes in detail the experimental methods and
materials used for this study.
Chapter 4 is organized in an effort to explain the results in a linear and logical fashion. A
brief report on the phenotype for the Shh null stomach is first provided in Section 4.1. Next, I
evaluated the phenotypes of the Gli2−/−
and Gli3−/−
stomachs in Section 4.2. The findings in this
section lead into the next section, which constitutes the main and novel results of my study:
Gli3P1−4/P1−4
and Gli3Δ699/Δ699
gastric phenotypic and molecular analysis in Section 4.3. Finally,
the last section, Section 4.4, contains an analysis of the Kif7−/−
stomach phenotype. As noted
before, the last three mutants were analysed to attain a greater understanding of the role of Gli3
in the developing murine stomach. An overall discussion of the results, with an emphasis on the
novel results, is left for the end of this chapter, Section 4.5.
Chapter 5 summarizes the key findings of this study. Shortcomings in my methodology
are described at length, and then future experiments are recommended.
7
Chapter 2 Background and Current Theories
2.1 The Hedgehog signaling pathway: Genetics and Molecular
Mechanisms
2.1.1 Significance of the Hedgehog (Hh) Signaling Pathway
The Hh signaling pathway is one of the most important developmental signaling pathways
conserved from man to mouse to fly; it has evolved over time to meet the requirements of
increasingly complex multicellular organisms [15] [38]. The Hh signaling pathway is critical for
a diverse array of developmental processes in vertebrates, including body axis formation, skeletal
patterning, chondrogenesis, hematogenesis, angiogenesis, development of the neural tube,
craniofacial structures, limbs, kidney, and gastrointestinal (GI) tract [23] [33] [7] [37] [44] [56]
[19]. Hh pathway components are expressed in many organs and tissues during development,
and the pathway is required for cell fate determination, patterning, proliferation, and
differentiation [36]. Loss-of-function studies have demonstrated with certainty how vital this
pathway is in development as well as revealed some of the mechanisms of Hh pathway function
[17].
Beyond its crucial role in embryogenesis, the Hh pathway is responsible for homeostatic
processes in post-natal and adult life; it has been implicated in stem or progenitor cell

8
maintenance in many adult tissues [19]. Aberrations in Hh signaling have been linked to many
types of cancer, such as gastric cancer, esophageal cancer, pancreatic cancer, medulloblastoma,
melanoma, glioma, small cell lung cancer, prostate cancer, and basal cell carcinoma [23] [19]
[47].
2.1.2 The hedgehog pathway in Drosophila
The hedgehog (hh) pathway was first discovered in the Drosophila (fruit fly) by Nusslein-
Volhard and Wieschaus, who performed a mutagenesis screen that revealed an interesting
phenotype yielding patterning defects in Drosophila embryos [40] [54]. The Drosophila embryo
is segmented such that each segment has a band of bristles called dentricles on the anterior half,
and a smooth naked cuticle on the posterior half. They discovered that in a group of mutants,
while the segment number remained the same, the segment polarity was altered. Each segment
was entirely covered by dentricles, resulting in a larva that resembled a ‟hedgehog‟, and hence
the name.
This group of mutants led to the discovery of four genes involved in the hh pathway: the
Drosophila hedgehog gene, its receptor patched (ptc), downstream transcription factor Cubitus
Interruptus (ci) and a kinase named fused (fu) [15] [54]. Thus, the experiments done by
Nusslein-Volhard and Wieschaus set up the framework for future studies of the Hh pathway and
since then, great efforts have been made to elucidate the functions and mechanisms of this key
signaling pathway. Twelve years after the discovery of the Drosophila hh mutant, in 1992, the
Drosophila hedgehog gene was published.

9
2.1.3 Mechanisms of Hedgehog signaling in mice
The main elements of Hh signaling, as mentioned in the previous section, seem to be conserved
between invertebrates and vertebrates [8] [50], though the vertebrate Hh signaling pathway has
diverged to become more complex.
Three Hedgehog mammalian homologs were identified in the mouse, and assigned the
names: Sonic hedgehog (Shh), Indian hedgehog (Ihh), and Desert hedgehog (Dhh) [13]. Shh is
the closest in homology to the Drosophila hh gene, and is also the most well-studied. These three
ligands have similar genetic sequences. They have overlapping and distinct expression domains
and functions in tissues. Importantly, the three Hh genes are highly conserved between mouse
and human, making the mouse a relevant model for examining how this pathway functions in
humans [54].
The HH protein begins as a 45 kDa precursor protein, which is then cleaved autocat-
alytically, resulting in a 19 kDa amino-terminal fragment and a 26 kDa carboxy-terminal
fragment [59]. The carboxy terminal fragment catalyzes the cleavage of the SHH precursor
protein, while the amino-terminal fragment is the active signaling protein [31] [55]. The mature
NH2 terminal fragment is lipid modified such that a cholesterol and palmitate group are
covalently bonded, making it poorly soluble. Processed HH is released from a HH-producing cell
and its hydrophobicity is critical in associating with cell membranes and regulating its signaling
range [54]. The HH protein does not spread via simple diffusion, though how exactly it spreads is
not fully understood.
HH has the ability to exert its function over a long range, and is considered to be a
morphogen [19] [15]. A morphogen is defined as a substance that is released from a localized
10
source to form a concentration gradient in a tissue. This gradient provides positional information
corresponding to the distance from the source of the morphogen. The morphogen-receiving cells
will express a distinct set of target genes leading to different cell fates depending on its
concentration threshold(s) for the morphogen and the level of morphogen it contains, and the
duration of signaling [19] [54]. This discovery led researchers to investigate how the HH
concentration gradient is created and maintained throughout development, and how different
thresholds for HH translate into distinct cell fates [19].
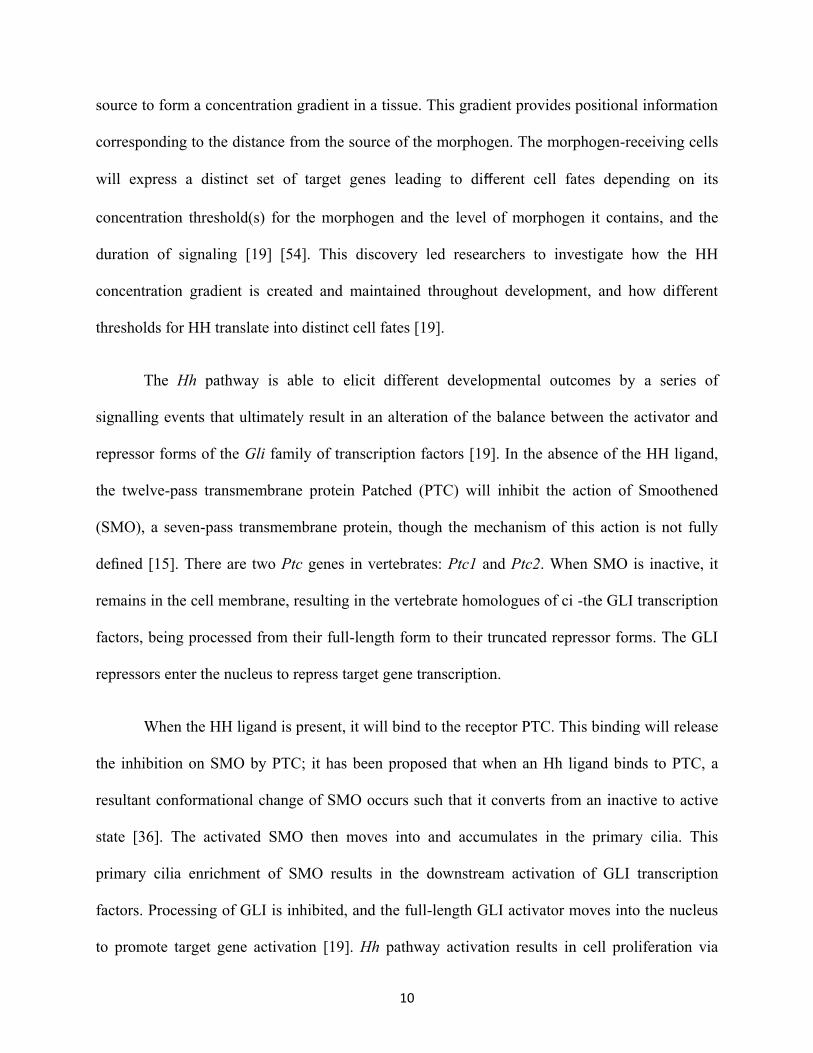
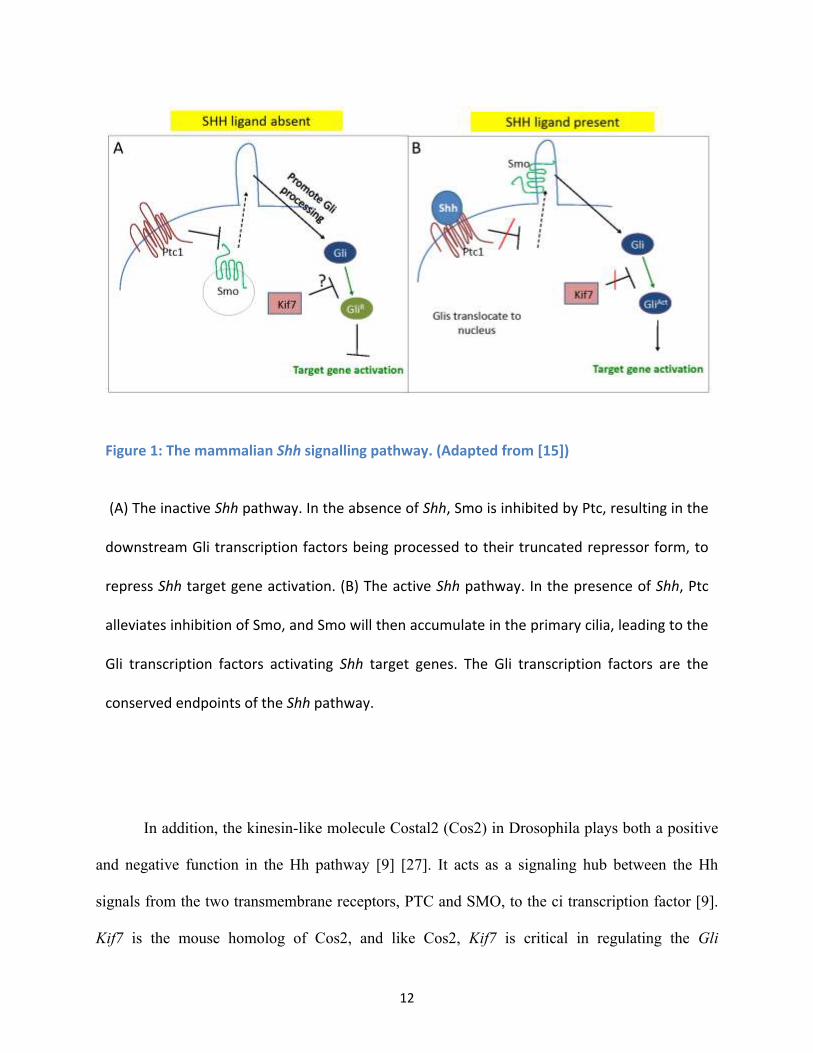
The Hh pathway is able to elicit different developmental outcomes by a series of
signalling events that ultimately result in an alteration of the balance between the activator and
repressor forms of the Gli family of transcription factors [19]. In the absence of the HH ligand,
the twelve-pass transmembrane protein Patched (PTC) will inhibit the action of Smoothened
(SMO), a seven-pass transmembrane protein, though the mechanism of this action is not fully
defined [15]. There are two Ptc genes in vertebrates: Ptc1 and Ptc2. When SMO is inactive, it
remains in the cell membrane, resulting in the vertebrate homologues of ci -the GLI transcription
factors, being processed from their full-length form to their truncated repressor forms. The GLI
repressors enter the nucleus to repress target gene transcription.
When the HH ligand is present, it will bind to the receptor PTC. This binding will release
the inhibition on SMO by PTC; it has been proposed that when an Hh ligand binds to PTC, a
resultant conformational change of SMO occurs such that it converts from an inactive to active
state [36]. The activated SMO then moves into and accumulates in the primary cilia. This
primary cilia enrichment of SMO results in the downstream activation of GLI transcription
factors. Processing of GLI is inhibited, and the full-length GLI activator moves into the nucleus
to promote target gene activation [19]. Hh pathway activation results in cell proliferation via

11
regulation of the cell cycle [23]. As well, it results in the transcription of Gli1 and Ptc1, acting in
a negative-feedback loop to keep Hh signaling in check [47]. The Hh pathway in the absence and
presence of a HH ligand is depicted in Figure 1.
There are three Gli genes: Gli1, Gli2, and Gli3. The Gli genes encode for the GLI
proteins that act as transcription factors. They are part of the Glioblastoma family of
transcription factors, which have five repeats of a zinc finger motif and other regions of
significant sequence similarity to ci [16] [37]. The GLI transcription factors are the conserved
endpoints of Hh signal transduction in vertebrates, and they ultimately decide the outcome of the
Hh signal [54] [50].
Gli1 has only an activating domain, whereas Gli2 and Gli3 have an activating and
repressing domain, lending them bifunctionality [47]. However, Gli3 is processed to its repressor
form much more efficiently than Gli2, and the inherent activator function of Gli3 is weaker than
that of Gli2 [2]. Put together, this makes the full-length GLI2 the dominant activator of Hh
signaling and truncated GLI3, the dominant repressor of Hh signaling [58]. There appears to be
compensating roles for Gli2 and Gli3 in the absence of the other, suggesting that the two work in
cooperation to ensure proper formation of many organs [37]. Gli1 is thought to potentiate
pathway activation, and is sent for proteasomal degradation in the absence of Hh signal. Gli1 is
dispensable for murine embryogenesis, as mice deficient in Gli1 are viable, unlike Gli2−/−
and
Gli3−/−
mice, which both die in-utero [37].
12
In addition, the kinesin-like molecule Costal2 (Cos2) in Drosophila plays both a positive
and negative function in the Hh pathway [9] [27]. It acts as a signaling hub between the Hh
signals from the two transmembrane receptors, PTC and SMO, to the ci transcription factor [9].
Kif7 is the mouse homolog of Cos2, and like Cos2, Kif7 is critical in regulating the Gli
Figure 1: The mammalian Shh signalling pathway. (Adapted from [15])
(A) The inactive Shh pathway. In the absence of Shh, Smo is inhibited by Ptc, resulting in the
downstream Gli transcription factors being processed to their truncated repressor form, to
repress Shh target gene activation. (B) The active Shh pathway. In the presence of Shh, Ptc
alleviates inhibition of Smo, and Smo will then accumulate in the primary cilia, leading to the
Gli transcription factors activating Shh target genes. The Gli transcription factors are the
conserved endpoints of the Shh pathway.
13
transcription factors in murine Hh signaling. Kif7 has been established as a major inhibitor of Hh
signaling that acts downstream of Smo and upstream of Gli2. Kif7 has been shown to suppress
Gli activator-dependent transcription [9] [18] [27]. Furthermore, KIF7 has been demonstrated to
interact with the GLI proteins, controlling their proteolysis and abundance [9]. In the ventral
neural tube, Kif7 promotes Hh signaling during floor plate induction, indicating that there is a
positive role for Kif7 in Hh signaling as well [9]. Kif7 null murine embryos display an increased
level of GLI2 full-length protein and an increased ratio of GLI3 full-length to truncated protein,
indicating that Kif7 is necessary to ensure normal levels of both Gli2 and Gli3 activity [18]
In Drosophila development, a Suppressor of fused (sufu) loss-of-function mutation, in
the absence of any other mutations, results in mild defects, suggesting that sufu does not play an
integral role in Drosophila hh signaling [50]. However, Sufu has been identified as an essential
regulator of the mammalian Hh pathway, since a loss-of-function mutation of Sufu in mice
results in embryonic lethality at ~E9.5 [50]. Sufu acts downstream of Ptc1 and Smo to control the
protein levels of full-length GLIs [8]. Sufu is a potent negative regulator of the Gli transcription
factors in mammalian Hh signaling, as evidenced by higher levels of both Ptc1 and Gli1
signaling in the Sufu null neural tube [8] [50] [58]. Furthermore, loss of Sufu leads to
constitutive activation of the Hh pathway and the destabilization of full-length GLI2 and GLI3
proteins, but not of their truncated versions [58].
In the Hh pathway, Gli1 and Ptc1 are transcriptional targets of Hh signaling, and are
thought to be involved in a negative feedback loop to limit pathway activity [23]. While Ptc1 can
be activated by components outside of the Hh pathway, Gli1 is a more accurate marker for the
level of pathway activation, as only the Hh pathway controls its expression [25]. Gli2 is an
important mediator of pathway activation, but its transcription is not regulated by Hh [25].
14
Therefore, Ptc1 and Gli2-expressing cells are indicative of cells capable of responding to Hh
signals, whereas Gli1-expressing cells denote the cells capable of responding to the Hh signal
[25].
2.1.4 The Gli3 transcription factor
Since this dissertation addresses the role of Gli3 in the developing murine stomach, a more
detailed discussion of what is known about Gli3 and its function in development, its
biochemistry, and its involvement in disorders is provided here.
2.1.4.1 Role of Gli3 activator and repressor in development
Gli3 plays an integral role in embryogenesis: it regulates limb digit patterning, brain
development, spinal cord patterning, renal morphogenesis, gastric epithelial growth, and growth
plate chondrocyte differentiation and proliferation [7] [16] [24] [32] [33] [39] [57]. The
bifunctional GLI3 transcription factor acts as a downstream mediator of Hedgehog signaling,
either activating or repressing transcription of Hh target genes depending on the context. In the
absence of the HH ligand, GLI3 is processed to its truncated form, which is a potent repressor of
Hh signaling [36]. In the presence of the HH ligand, GLI3 remains as an unprocessed full-length
protein [4]. Though GLI3 full-length protein can be detected in embryos, an activator function in
vivo could not be attributed to it initially [2]. Gli3 was generally accepted to be a dominant
repressor of Hh signaling. Only recently is evidence of its activator function beginning to
emerge, such as in spinal cord and limb digit patterning.
A study done in 2002 [42] revealed that the Gli3Δ699
isoform, essentially equivalent to the
truncated repressor form of Gli3, can substitute for Gli3 function in spinal cord patterning. The
Gli3Δ699
mutation could rescue most of the defects observed in the spinal cords of Gli3 null mice.

15
Their group concluded that dorsal-ventral patterning and cell fate of the intermediate region of
the spinal cord requires GLI3 transcriptional repressor [42]. A later study in 2004 [2] revealed
that Gli3 can function as an activator to rescue some Gli2-/-
spinal cord defects. Endogenous Gli2
gene was substituted with human GLI3, and the result was that the GLI3 protein functioned as an
activator to induce expression of Gli1, a marker of Hh pathway activation [2].
In the developing vertebrate limb, Shh expression is restricted to its posterior portion.
Given that Shh signaling opposes GLI3 processing and generates full-length GLI3 protein, the
GLI3 repressor levels are graded from highest in the anterior to lowest in the posterior; this
gradient was widely accepted to be responsible for limb digit patterning [57]. However, a recent
study has established, with the use of Gli3P1−4/P1−4
and Gli3Δ699/Δ699
mouse models, that it is the
ratio of GLI3 activator to repressor that determines limb digit number and identity [57]. A
supporting piece of evidence for this is that the Gli3P1-4
mutation results in a more severely
abnormal limb digit phenotype than a Gli3 null mutation [57]. Wang et. al discovered that the
full-length form of GLI3 acts as a transcription activator in vivo, as it can activate Gli1
transcription in the absence of Shh [57].
2.1.4.2 The biochemistry ofGli3 transcription factor
In an effort to analyze the function of the Gli3 gene on a molecular level, murine Gli3 cDNA
was isolated and sequenced by Thien et. al [52]. They discovered that the 5113 bp cDNA
encoded a protein of 1596 amino acids, the supposed length of full-length GLI3. Mouse and
human GLI3 cDNA showed an overall homology of 85%; several regions of the protein,
hypothesized to be the functional domains of the Gli3 protein, were even more highly conserved
at greater than 95% homology [52].
16
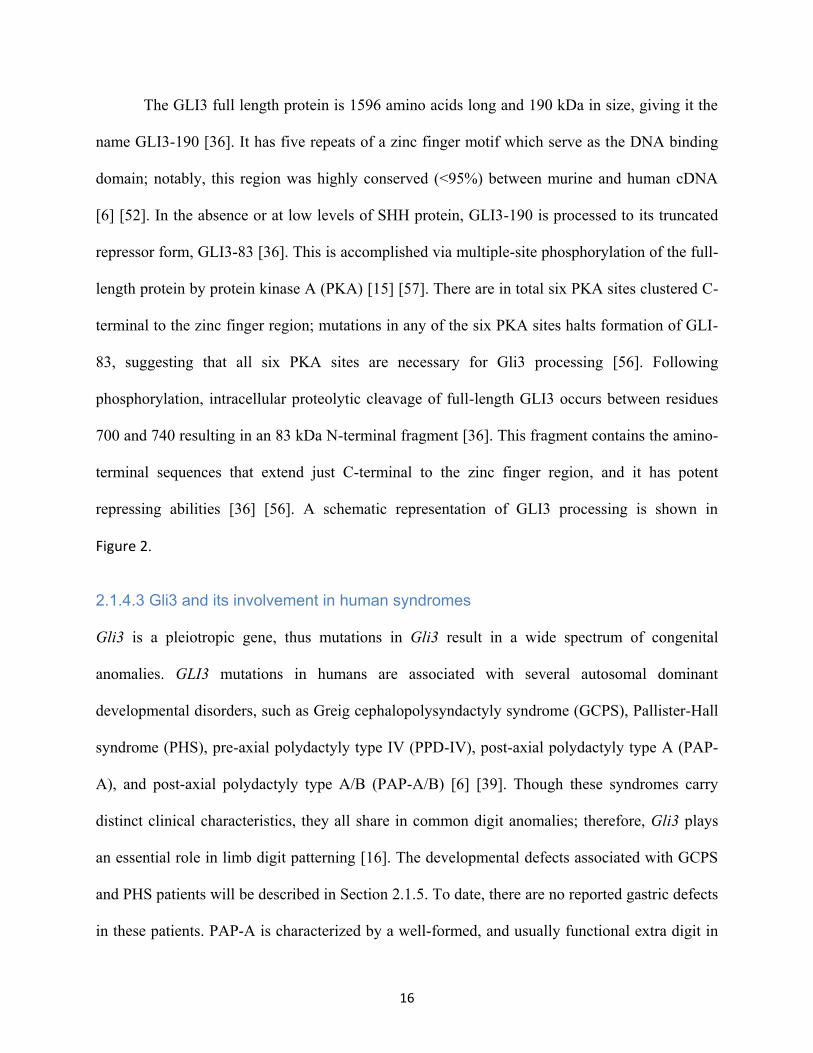
The GLI3 full length protein is 1596 amino acids long and 190 kDa in size, giving it the
name GLI3-190 [36]. It has five repeats of a zinc finger motif which serve as the DNA binding
domain; notably, this region was highly conserved (<95%) between murine and human cDNA
[6] [52]. In the absence or at low levels of SHH protein, GLI3-190 is processed to its truncated
repressor form, GLI3-83 [36]. This is accomplished via multiple-site phosphorylation of the full-
length protein by protein kinase A (PKA) [15] [57]. There are in total six PKA sites clustered C-
terminal to the zinc finger region; mutations in any of the six PKA sites halts formation of GLI-
83, suggesting that all six PKA sites are necessary for Gli3 processing [56]. Following
phosphorylation, intracellular proteolytic cleavage of full-length GLI3 occurs between residues
700 and 740 resulting in an 83 kDa N-terminal fragment [36]. This fragment contains the amino-
terminal sequences that extend just C-terminal to the zinc finger region, and it has potent
repressing abilities [36] [56]. A schematic representation of GLI3 processing is shown in
Figure 2.
2.1.4.3 Gli3 and its involvement in human syndromes
Gli3 is a pleiotropic gene, thus mutations in Gli3 result in a wide spectrum of congenital
anomalies. GLI3 mutations in humans are associated with several autosomal dominant
developmental disorders, such as Greig cephalopolysyndactyly syndrome (GCPS), Pallister-Hall
syndrome (PHS), pre-axial polydactyly type IV (PPD-IV), post-axial polydactyly type A (PAP-
A), and post-axial polydactyly type A/B (PAP-A/B) [6] [39]. Though these syndromes carry
distinct clinical characteristics, they all share in common digit anomalies; therefore, Gli3 plays
an essential role in limb digit patterning [16]. The developmental defects associated with GCPS
and PHS patients will be described in Section 2.1.5. To date, there are no reported gastric defects
in these patients. PAP-A is characterized by a well-formed, and usually functional extra digit in

17
the post-axial and/or pre-axial side of the upper and/or lower extremities [39]. PPD-IV patients
display extra digits in other positions in the hands or feet, with a pattern similar to, though milder
than that of GCPS [39].
The site of mutation on the GLI3 gene may be correlated to the resulting digit phenotypes
observed in the different human disorders [6]. Mice that lack a functional GLI3 zinc finger
domain serve as an animal model for GCPS; these mouse models include Pdn/Pdn (Polydactyly
Nagoya) and Xtj/Xt
j (Extra toes Jackson, described more in Section 2.1.5.3) [39]. The Gli3
Δ699
mouse, which possesses a mutation just C-terminal to the zinc finger domain of GLI3, is a model
for PHS in human patients. Mutations upstream of or in the zinc finger region of the GLI3 gene
cause GCPS, mutations in the post-zinc finger region cause PHS, and mutations downstream of
the GLI3 gene result in PAP-A [39]. These mouse homologs of human diseases facilitate my
understanding of how genetic mutations manifest themselves physically and physiologically, as
well as allow us to investigate the fine-tuned ability of Gli3 to effect different cell fates.

18
Figure 2: Processing of GLI3 full-length protein to its truncated form
Unprocessed GLI3 protein contains a zinc finger domain and six PKA phosphorylation sites C-
terminal to the zinc finger domain. In the absence or at low levels of the HH ligand, GLI3 full-
length is phosphorylated at those phosphorylation sites; this event induces intracellular
proteolytic cleavage of the full-length protein somewhere between residues 700 and 740. The
resultant processed protein is cleaved just C-terminal to the zinc finger domain, and is
approximately 700 to 740 amino acids long. Truncated GLI3 functions as a potent repressor of
Hh pathway activity.

19
2.1.5 Genetics and Hedgehog pathway mouse models
Recent genetic technologies have enabled biomedical researchers to closely examine the function
of specific genes in mice via gene targeting. ”Knock-out” and ”knock-in” genes, involving
replacing existing genes with altered versions, or altering a mouse gene in its natural location,
respectively, can be introduced in mice through embryonic stem cells. Genes are knocked-out
and -in by homologous recombination in these stem cells, in which nucleotide sequences are
exchanged between two similar or identical molecules of DNA. For this study, I utilized mice
with Hh pathway mutations. The Hh signaling pathway is essential in many aspects of
organogenesis in all vertebrates, and it is a highly conserved pathway between man and mouse.
Furthermore, the mouse has close genetic and physiological similarities to humans [38]. Its
genome can be manipulated and analyzed with ease, and it can reproduce relatively quickly in as
little as nine weeks. Thus, the mouse model is suitable for my purposes of understanding gastric
development in humans.
In order to evaluate Hh pathway function in gastric morphogenesis, I used six mouse
lines: Shh, Gli2, Gli3, Gli3P1−4
, Gli3Δ699
, and Kif7. The first three have previously been assessed
for their gastric phenotypes, and E14.5 whole embryos of each are shown in Figure 3. The last
three have not yet been analyzed for their gastric phenotypes, and their E14.5 whole embryos are
shown in Figure 4. A general description of these mouse models is provided below. A more
detailed review pertaining to their gastric development and phenotypes is written in a later
portion of the thesis, Section 2.3.
20
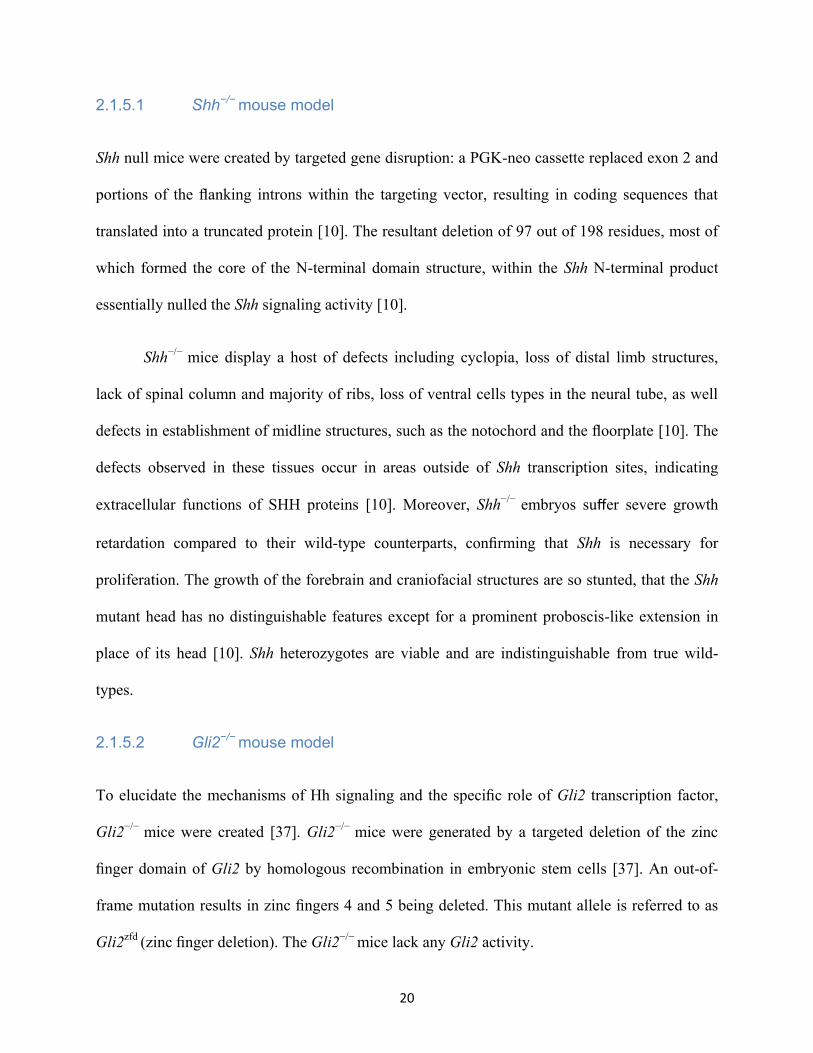
2.1.5.1 Shh−/− mouse model
Shh null mice were created by targeted gene disruption: a PGK-neo cassette replaced exon 2 and
portions of the flanking introns within the targeting vector, resulting in coding sequences that
translated into a truncated protein [10]. The resultant deletion of 97 out of 198 residues, most of
which formed the core of the N-terminal domain structure, within the Shh N-terminal product
essentially nulled the Shh signaling activity [10].
Shh−/−
mice display a host of defects including cyclopia, loss of distal limb structures,
lack of spinal column and majority of ribs, loss of ventral cells types in the neural tube, as well
defects in establishment of midline structures, such as the notochord and the floorplate [10]. The
defects observed in these tissues occur in areas outside of Shh transcription sites, indicating
extracellular functions of SHH proteins [10]. Moreover, Shh−/−
embryos suffer severe growth
retardation compared to their wild-type counterparts, confirming that Shh is necessary for
proliferation. The growth of the forebrain and craniofacial structures are so stunted, that the Shh
mutant head has no distinguishable features except for a prominent proboscis-like extension in
place of its head [10]. Shh heterozygotes are viable and are indistinguishable from true wild-
types.
2.1.5.2 Gli2−/− mouse model
To elucidate the mechanisms of Hh signaling and the specific role of Gli2 transcription factor,
Gli2−/−
mice were created [37]. Gli2−/−
mice were generated by a targeted deletion of the zinc
finger domain of Gli2 by homologous recombination in embryonic stem cells [37]. An out-of-
frame mutation results in zinc fingers 4 and 5 being deleted. This mutant allele is referred to as
Gli2zfd
(zinc finger deletion). The Gli2−/−
mice lack any Gli2 activity.

21
Gli2zfd
heterozygotes are viable and do not have any apparent defects. Gli2zfd
ho-
mozygosity is embryonic lethal. Gli2-deficient mice display similar defects to the Shh−/−
mice,
they are smaller in size compared to wild-type, have craniofacial defects of varying penetrance.
They show a drastic reduction in vertebral discs, sometimes being completely absent, and
showed a bend in the vertebral column, frequently in the thoracic-lumbar region [37]. This can
be seen as a deeper curvature of the spine in Gli2−/−
mutants. Gli2-null mice do not develop a
floor plate, though motor neurons can still develop [12].
2.1.5.3 Gli3−/− mouse model
In mice, a spontaneous deletion of one allele of Gli3 at the Jackson laboratories resulted in an
extra toe, giving these mice the Xt name. The original Xt allele has a 5' deletion in Gli3. Hui et.
al [16] developed the XtJ mouse model, which contains a 3' non-overlapping deletion in Gli3, to
confirm that the missing allele was indeed localized to the Gli3 locus. This mutation renders the
bi-functional GLI3 transcription factor null.
Mutations in Gli3 in humans have been found in a number of autosomal dominant
disorders including Greig cephalopolysyndactyly syndrome (GCPS) [37]. The Gli3−/−
mutation in
mice, also known as the extra − toesJ (Xt
J) mutation, is a mouse model for GCPS in humans [16]
[39]. In GCPS, loss of one copy of the Gli3 gene leads to craniofacial defects, preaxial and
postaxial polysyndactyly of the hands, and preaxial polysyndactyly of the feet with complete
penetrance, though with variable expressivity [16]. These defects are similar to those seen in Xt
heterozygous mice [16].
(XtJ) homozygous mice die in utero or within two days after birth. The most obvious
defects are severe craniofacial abnormalities, exencephaly (at high penetrance), polydactyly, and
22
syndactyly. Homozygous mutants have severe polydactyly of the fore limbs, and varying
polydactyly of the hind limbs. Heterozygotes for Gli3 have an extra toe, as mentioned above, and
are viable, with no other apparent defects.
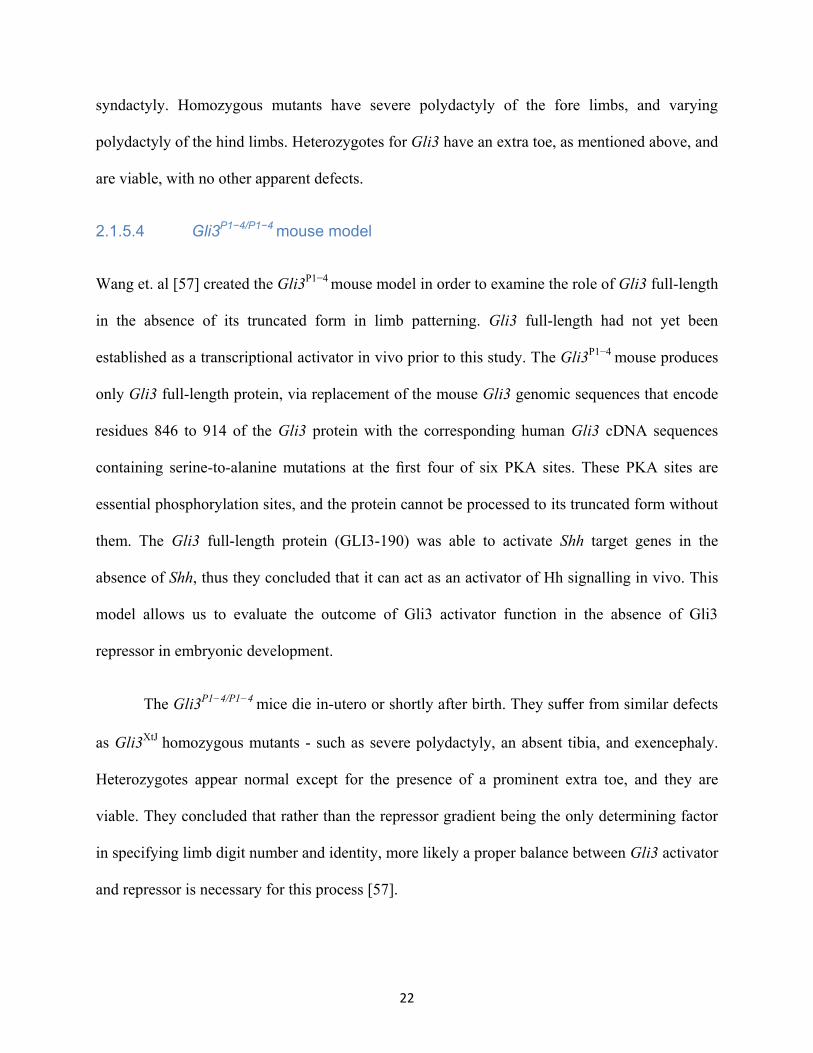
2.1.5.4 Gli3P1−4/P1−4 mouse model
Wang et. al [57] created the Gli3P1−4
mouse model in order to examine the role of Gli3 full-length
in the absence of its truncated form in limb patterning. Gli3 full-length had not yet been
established as a transcriptional activator in vivo prior to this study. The Gli3P1−4
mouse produces
only Gli3 full-length protein, via replacement of the mouse Gli3 genomic sequences that encode
residues 846 to 914 of the Gli3 protein with the corresponding human Gli3 cDNA sequences
containing serine-to-alanine mutations at the first four of six PKA sites. These PKA sites are
essential phosphorylation sites, and the protein cannot be processed to its truncated form without
them. The Gli3 full-length protein (GLI3-190) was able to activate Shh target genes in the
absence of Shh, thus they concluded that it can act as an activator of Hh signalling in vivo. This
model allows us to evaluate the outcome of Gli3 activator function in the absence of Gli3
repressor in embryonic development.
The Gli3P1−4/P1−4
mice die in-utero or shortly after birth. They suffer from similar defects
as Gli3XtJ
homozygous mutants - such as severe polydactyly, an absent tibia, and exencephaly.
Heterozygotes appear normal except for the presence of a prominent extra toe, and they are
viable. They concluded that rather than the repressor gradient being the only determining factor
in specifying limb digit number and identity, more likely a proper balance between Gli3 activator
and repressor is necessary for this process [57].

23
2.1.5.5 Gli3Δ699/Δ699 mouse model
The Gli3Δ699/Δ699
mouse was generated to model the autosomal dominant developmental disorder
Pallister-Hall syndrome (PHS) observed in humans. In humans, this frameshift mutation in the
GLI3 gene is associated with tumour formation, common in PHS [32]. To create these mice, a
selection marker cassette was inserted by gene targeting in mouse embryonic stem cells into the
Gli3 locus. This resulted in a premature termination of translation C-terminally of the zinc finger
region (amino acid position 699); thus, the mutation in these Gli3Δ699/Δ699
mice predicts a
truncated GLI3 protein 720 amino acids long. Essentially, this mutation results in constitutive
GLI3 repressor activity in the absence of any GLI3 activator function.
PHS represents a pleiotropic disorder in human development. Heterozygotes are viable
and display no measurable defects. Homozygous mutant mice die shortly after birth, and they
display a wide range of abnormalities similar to PHS patients, such as central polydactyly,
imperforate anus, gastrointestinal defects, abnormal kidney development and absence of adrenal
glands [6]. In particular, Bose et. al observed visceral abnormalities in Gli3Δ699
homozygotes,
notably a distended and discoloured stomach, thought to be due to an accumulation of air [6].
2.1.5.6 Kif7−/− mouse model
In order to evaluate the requirement of Kif7 in mammalian Hh signaling, Hui et. al [9] generated
the Kif7 mutant allele via gene targeting, resulting in a targeted mutation that generated a Kif7−/−
mouse. Kif7 is involved in regulating the Gli transcription factors, thus they predicted a change
in Gli levels in this mouse model. Western blot analysis done on E10.5 wild type and Kif7−/−
embryos showed that full-length Gli2 was increased and the truncated form of Gli3 was reduced

24
in the knock-out [9]. Thus in the Kif7−/−
whole embryo, the balance of Gli activator and repressor
is shifted to a higher ratio of Gli activator to repressor.
Kif7 heterozygous mice are viable and appear indistinguishable from true wild-types.
Kif7−/−
mice die at birth, suffering from severe malformations, including exencephaly and pre-
axial polydactyly (Figure 4D), which are mutations that are also present in the Gli3 null embryo.
These results demonstrated that Kif7 is an important inhibitor of Hh signaling in multiple tissues
and that Kif7 may regulate the Hh pathway partly by controlling Gli3 function or abundance [9].
Figure 3: Hh pathway mutant mice at E14.5.
(A) Wild-type. (B) The Shh−/− embryo is much smaller in size relative to wild-type, and is
severely deformed. The most obvious mutations include missing all limb structures and
having a proboscis in place of the head. (C) The Gli2−/− embryo is similar in size to wild-type,
and has a spinal cord defect, as represented by the unusual curving of its spine. (D) The
Gli3−/− embryo is also similar in size to wild-type, and on immediate observation, has
exencephaly and polydactyly of all limb digits.
25
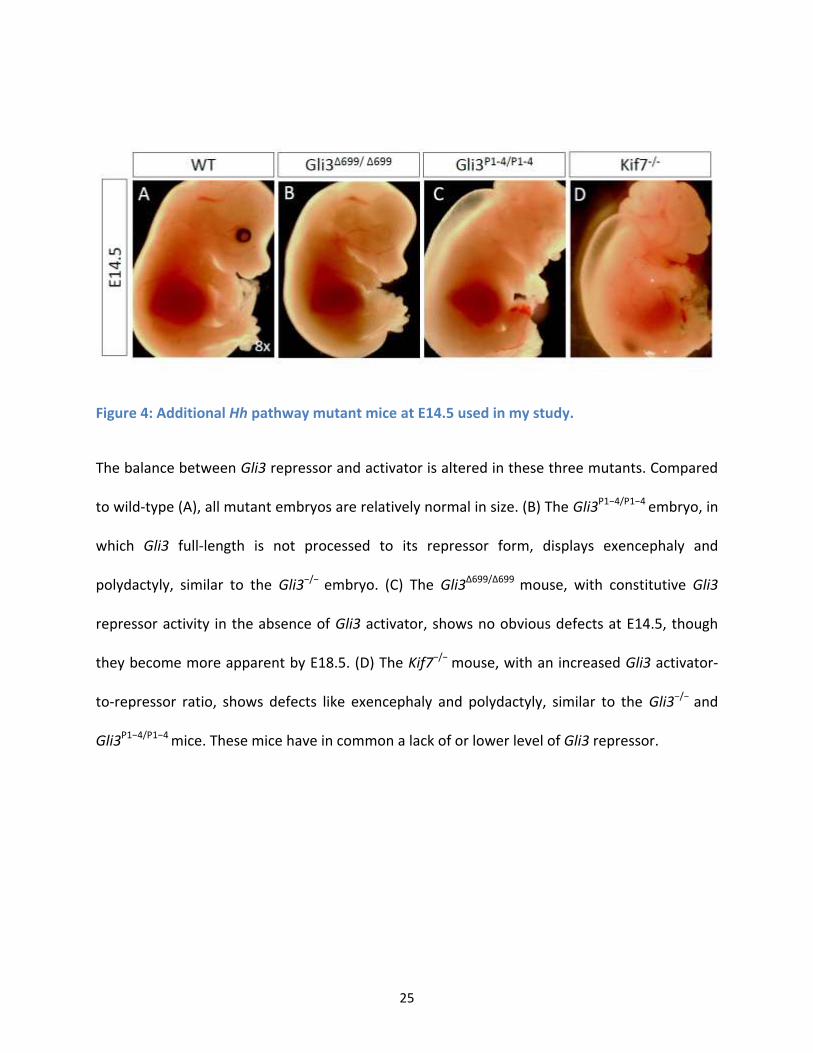
Figure 4: Additional Hh pathway mutant mice at E14.5 used in my study.
The balance between Gli3 repressor and activator is altered in these three mutants. Compared
to wild-type (A), all mutant embryos are relatively normal in size. (B) The Gli3P1−4/P1−4 embryo, in
which Gli3 full-length is not processed to its repressor form, displays exencephaly and
polydactyly, similar to the Gli3−/− embryo. (C) The Gli3Δ699/Δ699 mouse, with constitutive Gli3
repressor activity in the absence of Gli3 activator, shows no obvious defects at E14.5, though
they become more apparent by E18.5. (D) The Kif7−/− mouse, with an increased Gli3 activator-
to-repressor ratio, shows defects like exencephaly and polydactyly, similar to the Gli3−/− and
Gli3P1−4/P1−4 mice. These mice have in common a lack of or lower level of Gli3 repressor.

26
2.2 The murine stomach
2.2.1 The anatomy and function of the mouse stomach
The stomach is situated in the left side of the body below the heart and liver. Food and fluids
enter the stomach via the esophagus, and it expands or shrinks depending on the amount of fluids
and food it contains. The stomach provides the essential function of breaking down food by
secreting enzymes and chemicals. The contractile actions of the smooth muscle layers
surrounding it also aid in churning the food. This partially digested food, called chyme, exits the
stomach into the duodenum, the beginning of the small intestine. The pyloric sphincter at the
junction between the stomach and the duodenum regulates the rate of chyme exiting the stomach.
If a cross-section is taken of the stomach, the stomach layers from interior to exterior are
the gastric mucosa, the submucosa, the smooth muscle, and the outer serosa. The interior of the
stomach (Figure 5) is divided into four parts: the fundus, the body, the antrum, and the pylorus.
While stratified squamous epithelium is confined to the esophagus in humans, this epithelium
extends into the fundus and some of the body of the mouse stomach [35]. The rest of the body
and the antrum, are composed of a glandular and stratified epithelium. The pylorus, the “end of
the stomach”, has intestinal-like villi. The different epithelia of the E18.5 stomach are shown in
Figure 6. The squamous epithelium in mice is commonly referred to as the non-glandular
epithelium (NGE), while the columnar epithelium is called the glandular epithelium (GE). Since
in humans, squamous epithelium ends at the gastro-esophageal junction, my study focuses on
only the glandular epithelial portion of the murine stomach.

27
Figure 5: The anatomy of the mouse and human stomach.
The stomach is divided into the fundus (F), body (B), antrum (A), and pylorus (P). The
esophagus empties into the fundus, and the pylorus empties into the duodenum.

28
The glandular epithelium of the stomach body and antrum consists of long, tubular
gastric pit-glands, as depicted in Figure 7 [20]. While the pit lies near the surface of the stomach
epithelium, the gland is found deep within, extending into the muscularis mucosa [11]. The gland
region is divided into three sections: the isthmus (right below the pit), the neck (below the
isthmus), and the base (bottom of the gland) [20] [35]. These gastric pit-glands are made up of
eleven different cell types, which are all derived from multi-potential stem cells.
The major cell types of the mature murine gastric glandular epithelium are the mucous-
producing cells, parietal cells, chief cells, and entero-endocrine cells. The mucous-producing
cells reside in the pit and neck of the entire stomach excluding the non-glandular portion. The
Figure 6: The gastric epithelia of the mouse E18.5 stomach.
(A) The fundus and some of the body have a stratified squamous epithelium. (B) The
transition between the stratified squamous and columnar epithelium is very abrupt, and is
indicated by the arrow. (C) The stratified glandular epithelium covers some of the body and
the antrum of the stomach. This glandular epithelium is composed of short buds lined with
columnar cells. (D) The pylorus has an epithelium with finger-like villi much like the small
intestine.
29
parietal cells are found throughout the glandular region of the pit-gland, and are mostly confined
to the body of the stomach. The chief or zymogenic cells reside at the base of the gland, and are
localized to the antral region of the stomach. Lastly, the enteroendocrine cells are at the base of
the gland, throughout the entire stomach except the non-glandular portion. These cell types will
be evaluated in this thesis, and their abundance and localization within the pit-gland in the adult
mouse stomach is shown in Figure 7. In the adult murine stomach, the chief cells are the most
abundant, followed by the mucous-producing cells, and then the parietal cells [21]. All four
glandular epithelial cell types have an integral function in the stomach.
Mucous-producing cells release mucus to protect the stomach epithelium from the acidic
environment. Parietal cells secrete hydrochloric acid in order to break down food. Chief cells
release pepsinogen, a precursor enzyme that digests proteins, and lipase enzymes that break
down fat, into the lumen of the stomach. Finally, the enteroendocrine cells, which include the
enterochromaffin-like (ECL) cells, somatostatin-secreting D-cells, gastrin-secreting G-cells, and
ghrelin-secreting X (or A-like), secrete hormones that help to maintain the structural and
functional integrity of the epithelium [11]. The other cell-types include the gastric stem cells,
which currently have no known reliable marker, caveolated cells (at relatively low abundance),
and four immature cell types located in the isthmus granule-free cells, pre-pit cells, pre-neck
cells, and pre-parietal cells. The last type is the pre-zymogenic cell, showing features between
those of the neck and zymogenic cells [21].
The gastric mucosa is self-renewing from embryonic development into adult life. When
cells reach terminal differentiation, they eventually undergo apoptosis or necrosis [20]. All
epithelial cell types of the gastric mucosa derive from a multi-potent stem cell which resides in
30
the isthmus and has a turnover time of about three days [22] [35]. As cells mature and undergo
differentiation, they move bidirectionally - either up towards the pit, or downwards towards the
gland [55]. The turnover rate varies for different cell lineages. For example, mucous-producing
pit cells migrate upwards and their turnover rate is 3 days [20]. Mucous-producing neck cells
differentiate from granule-free pre-neck cell precursors as they move into the neck just below the
isthmus. The neck cells move downwards to the upper part of the gastric unit base where they
become pre-chief cells; this process takes 14 days. As the chief cells terminally differentiate and
move into the lower portion of the base, they eventually undergo necrosis or apoptosis [20]. The
entire trip takes 190 days [22]. Pre-parietal cells differentiate into mature parietal cells in the
span of one day, completing their terminal differentiation in the isthmus. Approximately six
parietal cells are produced per month per isthmus, and three migrate up towards the pit, while
three migrate down towards the neck then base. The rate of parietal cell turnover is 54 days [22].
The submucosa is composed of fibrous connective tissue, and contains large blood
vessels and nerves that branch into the other layers of the stomach. Like the rest of the GI tract,
the muscularis externa of the stomach consists of an inner circular and an outer longitudinal
smooth muscle layer. The circular smooth muscle is concentric to the anterior-posterior (A-P)
axis, while the longitudinal smooth muscle is parallel. These two layers are responsible for
peristalsis, pushing food in waves down the GI tube. Only in the stomach, is there a third
innermost smooth muscle layer, the oblique muscle layer; this muscle layer is responsible for the
churning motion that results in physically breaking down food. The three smooth muscle layers
of the adult murine stomach are shown in Figure 8. The outermost layer of the stomach, the
serosa, consists of connective tissue.

31
The stomach is a very complex organ, composed of organized layers of different cell
types, which reside along specific regions of the A-P and radial axis. This intricate patterning of
the stomach requires a highly orchestrated series of molecular, genetic, and physical events, and
the following section will expand on this process.

32
Figure 7: Major cell types of the E18.5 mouse gastric glandular epithelium.
The pit-gland is divided into four region: pit, isthmus, neck, and base. The pit lies at the surface
of the stomach, while the base of the gland extends into the muscularis mucosa. (A) Periodic
Acid Schiff (PAS) stains for mucous-producing pit cells residing near the surface of the pit. (B)
The H + /K+ ATPase antibody stains for acid-producing parietal cells scattered throughout the

33
gland. (C) Pepsinogen II antibody stains pepsin-producing chief cells at the base of the glands.
(D) Chromagranin A antibody stains for hormone-producing entero-endocrine cells found in the
neck and base of the gland.
Figure 8: Smooth muscle layers in the adult mouse stomach.
From the interior of the stomach to the exterior, the smooth muscle layers are: oblique (O),
circular (C), and longitudinal (L).

34
2.2.2 Timeline of events in murine gastric development
Preceding the formation of the gut tube, gastrulation occurs, whereby early embryonic cells
differentiate into three different cell types: endodermal, mesodermal, and ectodermal cells [38].
The stomach, like the rest of the gastrointestinal tract, consists of an inner epithelial layer derived
from the endoderm. The liver and the pancreas also derive from the endoderm. The outer
connective tissue and smooth muscle are derived from the mesoderm. The neurons that form the
enteric nervous system originate from the ectoderm [3].
The gut tube begins as a flat sheet of cells, composed of two layers: the endoderm and the
mesoderm. In mice, this flat sheet of cells folds laterally and at the anterior and posterior ends of
the embryo, resulting in it sealing off ventrally to form a tube at about Embryonic day (E)8.0 to
E9.0 [38]. Recombination studies have demonstrated that the primary specification of the gastric
epithelium occurs prior to E11.5 [41]. The gastric mesoderm has been shown to be critical for the
survival of the endoderm in vitro, demonstrating that epithelial-mesenchymal interactions are
important in gastric development [41].
Next, regionalization of the primitive gut tube occurs, where distinct regions arise with
different structures and functions [44]. Prior to this stage, the endoderm of the early gut tube
along the A-P axis is highly uniform [45]. Extensive signalling between the inner epithelial layer
(that was the endoderm) and mesenchyme is necessary for regionalization of the gut tube [49]
[46]. This epithelial-mesenchymal cross-talk involves the endodermal recruitment of splanchnic
mesoderm; their interaction results in the acquisition of regional characteristics along the rostro-
caudal and radial gut axis [1] [49] [51].
35
The rostro-caudal axis of the gut tube divides into three different rudimentary zones
called the foregut, midgut, and hindgut - which specify the eventual location of individual organs
of the GI tract and the ones that bud off from it [3] [49]. The foregut goes on to become the
esophagus and stomach, the midgut goes on to form the small intestine, and the hindgut will
become the large intestine and anus [49]. The radial axis divides into the different layers
surrounding the gut tube, i.e. the mucosa, smooth muscle (SM) and serosa [49]. As the embryo
ages, the GI tract grows and elongates rapidly relative to the rest of the embryo [3]. Radial
patterning of the gut tube also occurs during this process, in which the different layers of the gut
tube - epithelium, connective tissue, muscle layers, and blood vessels are correctly positioned
[49].
While this radial and A-P regionalization is occurring, other important patterning events
are taking place. At E9.0 to E10.0, the portion of the foregut that is to become the stomach
rotates along its axis so that it is situated in the left side of the body. The stomach portion also
begins to dilate at this stage [1].
At E12.5, the gastric epithelium consists of undifferentiated cells, as shown in Figure 9.
At this point, the gastric epithelium is made up of progenitor and precursor cells. The circular
SM starts to develop as well, as labelled by the α-SM-actin positive cells [51].

36
Figure 9: Stomach development in mice: E12.5.
(A-B) At this stage, the gastric epithelium is still undifferentiated, and (C) the a rudimentary
circular smooth muscle begins to develop.
37
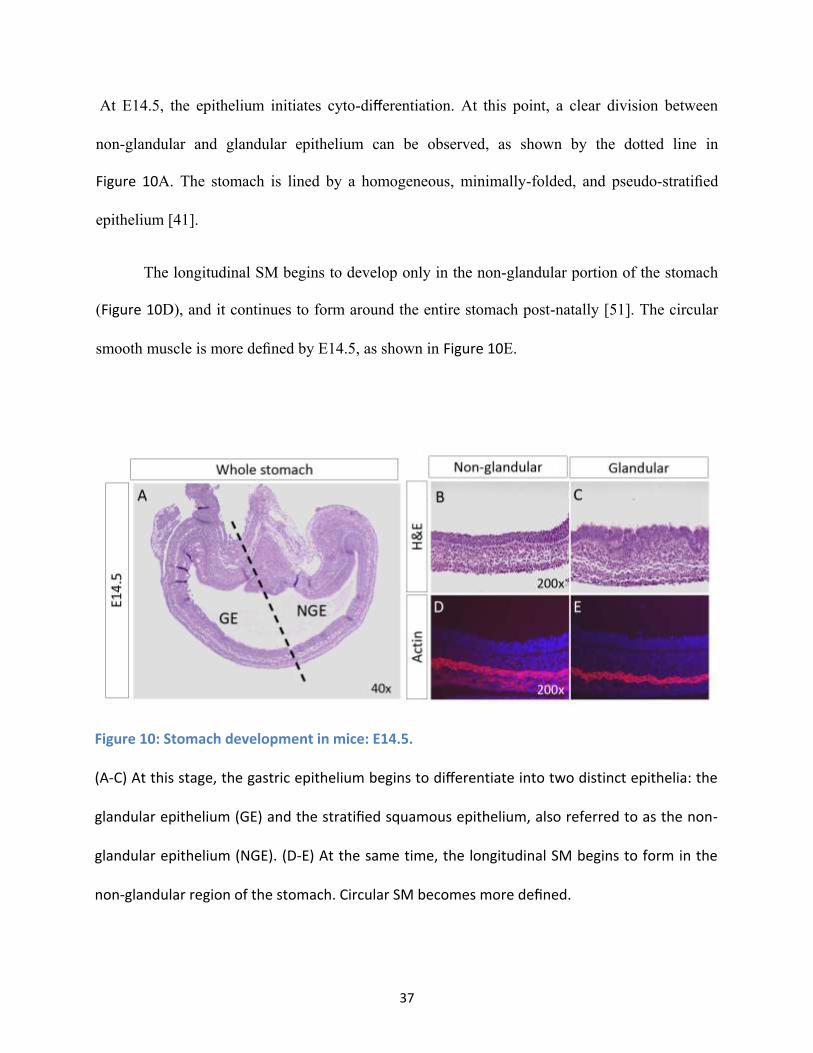
At E14.5, the epithelium initiates cyto-differentiation. At this point, a clear division between
non-glandular and glandular epithelium can be observed, as shown by the dotted line in
Figure 10A. The stomach is lined by a homogeneous, minimally-folded, and pseudo-stratified
epithelium [41].
The longitudinal SM begins to develop only in the non-glandular portion of the stomach
(Figure 10D), and it continues to form around the entire stomach post-natally [51]. The circular
smooth muscle is more defined by E14.5, as shown in Figure 10E.
Figure 10: Stomach development in mice: E14.5.
(A-C) At this stage, the gastric epithelium begins to differentiate into two distinct epithelia: the
glandular epithelium (GE) and the stratified squamous epithelium, also referred to as the non-
glandular epithelium (NGE). (D-E) At the same time, the longitudinal SM begins to form in the
non-glandular region of the stomach. Circular SM becomes more defined.

38
A secondary cell specification and glandular formation is required for the maturation of
the stomach, and this occurs at E15.5 to E16.5 [41]. The onset of terminal cell differentiation
begins at this secondary transitional stage; the different gastric epithelial cell lineages - parietal
cells, mucous-producing cells, chief cells, and enteroendocrine cells can be detected by
immunohistochemistry at this point [41]. By E18.5, the gastric mucosa is arranged into short
primordial buds with shallow invaginations into the submucosa (refer to Figure 11A&C); the
buds elongate to become the long pit-glands in the adult stomach [22]. Distribution of the
different cell lineages at this stage is region-specific: entero-endocrine cells are found throughout
the GE, chief cells reside at the base of the buds only in the antrum, and parietal cells are found
throughout the bud and contained within the body portion of the stomach only [41]. The circular
and longitudinal SM layers continue to mature at this stage, and the third oblique SM layer forms
after birth [51].
The gastric mucosa is not quite mature by birth, and in the first post-natal week,
immature cells decrease, as more differentiated cells appear, though total cell number per bud
remains the same. In the second week after birth, total cell numbers increase and buds begin to
elongate. In the third week, the gastric unit becomes compartmentalized into the anatomically
distinct pit, isthmus, neck, and base regions [22]. The isthmus is the proliferative zone where
multi-potent stem cells and their descendants reside [22]. By P28, the mucosa of the body of the
stomach is composed of mature gastric pit-glands that invaginate into the lamina propria [1].

39
Figure 11: Stomach development in mice: E18.5.
(A) & (C) At this stage, the simple columnar cells arrange themselves into short gastric buds
in the glandular portion of the stomach. (B) The non-glandular region becomes stratified and
the distinct squamous cells emerge. (D) & (E) The circular and longitudinal smooth muscle
continue to develop, though the longitudinal SM does not form around the glandular region
until after birth.

40
2.3 The Hedgehog pathway in murine gastric development:
current knowledge
2.3.1 Expression of Hh pathway components in gastric morphogenesis
Hh pathway components are expressed in the developing mouse stomach from E8.5 onwards,
indicating a potential role for this pathway in stomach development [5] [29]. Shh and Ihh are
expressed in the stomach beginning at the time of gut tube closure (E8.5) until E10.5 [5]. At
E10.5, Ptc1 and Gli1 can be detected in mesenchymal cells of the future antrum, as well as in the
midgut. Gli2 and Gli3 are expressed in overlapping and distinct regions of the mesenchyme [37].
From E11.5 to E14.5, Shh expression is down-regulated in the hindstomach epithelium,
though it can still be seen in the forestomach; meanwhile, Ihh is expressed in the hind-stomach
[5]. At E14.5, Shh is expressed highly in the forestomach epithelium, while Ihh is undetectable;
in the distal part of the stomach (the future body and antrum of the stomach), Ihh is expressed
strongly, while Shh expression is detectable, but weaker [25]. Ptc1, Gli1, and Gli2 are expressed
in the stomach mesenchyme at E14.5 [25].
At E16.5, when body/antral gland morphogenesis begins, both Shh and Ihh are expressed
throughout the gastric epithelium. Ptc1 is expressed between the invaginating epithelial folds, in
the submucosa, and in the innermost cells of the circular smooth muscle layer of the muscularis
externa (ME) [44]. Gli1 is expressed in a similar pattern to Ptc1, but also within the entire
circular muscle as well as some cells of the serosa [44]. Gli2 is expressed in the lamina propria
and in both layers of the ME [25]. A dramatic difference in Gli1 expression is observed between

41
the antrum and pyloric region and the adjacent duodenum, being more highly expressed in the
distal stomach than the duodenum.
By E18.5, both Shh and Ihh are expressed highly throughout the epithelium of the
stomach. Their downstream targets Ptc1 and Gli1 can be detected in the mesenchyme,
specifically the submucosa and the muscle layers. Ptc2 and Gli2 are expressed at very low levels,
but in a similar pattern to Ptc1 and Gli1 [44]. At P0, in the antral stomach, Ptc1, Gli1, and Gli2
are expressed in mesenchymal cells, while Gli3 activity is undectectable [25].
2.3.2 The role of the Hh pathway in stomach development
Since Hh pathway components are expressed in the GI tract, previous groups investigated the
role of the pathway in its development. The Shh pathway is of importance to the patterning along
both the longitudinal and radial axis of the GI tract [25] [55]. In the stomach, the Hh pathway is
thought to act in a paracrine manner, in that signal transduction is carried from Hh-producing
cells to Hh-responding cells [25]. Soluble signals pass bidirectionally between the endoderm and
mesoderm to form the gut tube [25]. While the Hh-producing cells are found in the gastric
epithelium, Hh-responding cells (those expressing Ptc1, and the Glis) reside in the mesoderm.
Epithelial-mesenchymal crosstalk between the two layers plays a role in patterning the entire GI
tract [29] [25].
Though Gli1−/−
mice are viable and show no gut abnormalities, the Gli1+/−
mouse is more
susceptible to chemically induced colitis, suggesting that Gli1 may be important in coping with
inflammatory distress [26]. Gli2−/−
exhibit esophageal and hindgut malformations.

42
In 2000, Ramalhos et. al [44] performed a phenotypic analysis of the Shh−/−
and Ihh−/−
GI
tract. Shh and Ihh null mutants exhibit a host of GI tract defects, including gut malrotation,
decreased muscularis propria, and enteric neuron abnormalities [44]. Shh mutants display defects
such as a smaller stomach, duodenal stenosis, and significantly, gastric glandular overgrowth was
observed too. Intestinal metaplasia of the stomach, often associated with gastric ulcers and
cancers in humans, was observed as positive staining for alkaline phosphatase (AP) and Wisteria
floribunda agglutinin (WFA) lectin in the stomach, both of which are markers of intestinal-type
cells [44].
Ihh−/−
mice demonstrated no detectable defects in the embryonic stomach [44]; though
Ihh is expressed in the embryonic stomach epithelium, it does not appear to be necessary for its
development [44]. However, concurrent loss of both Shh and Ihh, which are epithelially
expressed, results in substantial attrition of the mesenchymal layer in the developing stomach
[30]. The conditional double knock-out produces a more severe gastric phenotype than the single
knock-outs, demonstrating compensatory functions between the Shh and Ihh signals [30].
Moreover, mesenchymal cells appear to be the primary targets of Shh and Ihh, as mesenchymal
loss precedes the failure of the epithelium to differentiate in the ShhCre/F l
; Ihh−/F l
mouse [30].
To further elucidate the role of the Hh pathway in stomach development, Kim et. al [24]
performed a comparative analysis of the developing mouse stomach using the Gli2−/−
and Gli3−/−
models, in addition to the Shh−/−
mouse. They expected the Gli2−/−
stomach to phenocopy the
Shh−/−
stomach, as Gli2 is the dominant activator of Hh signalling [24]. Surprisingly, they
discovered instead, that the Gli3 mutant stomach phenocopied the Shh mutant stomach. Only
Shh−/−
and Gli3−/−
stomachs displayed glandular epithelial overgrowth. The increase in total
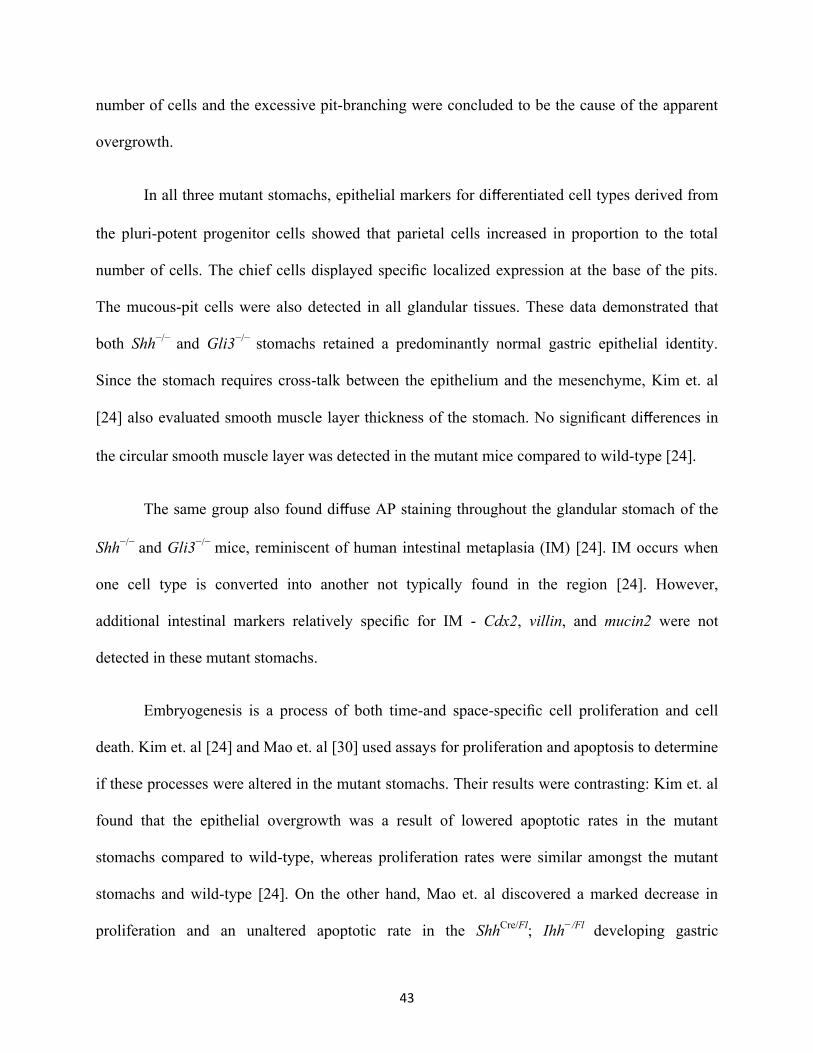
43
number of cells and the excessive pit-branching were concluded to be the cause of the apparent
overgrowth.
In all three mutant stomachs, epithelial markers for differentiated cell types derived from
the pluri-potent progenitor cells showed that parietal cells increased in proportion to the total
number of cells. The chief cells displayed specific localized expression at the base of the pits.
The mucous-pit cells were also detected in all glandular tissues. These data demonstrated that
both Shh−/−
and Gli3−/−
stomachs retained a predominantly normal gastric epithelial identity.
Since the stomach requires cross-talk between the epithelium and the mesenchyme, Kim et. al
[24] also evaluated smooth muscle layer thickness of the stomach. No significant differences in
the circular smooth muscle layer was detected in the mutant mice compared to wild-type [24].
The same group also found diffuse AP staining throughout the glandular stomach of the
Shh−/−
and Gli3−/−
mice, reminiscent of human intestinal metaplasia (IM) [24]. IM occurs when
one cell type is converted into another not typically found in the region [24]. However,
additional intestinal markers relatively specific for IM - Cdx2, villin, and mucin2 were not
detected in these mutant stomachs.
Embryogenesis is a process of both time-and space-specific cell proliferation and cell
death. Kim et. al [24] and Mao et. al [30] used assays for proliferation and apoptosis to determine
if these processes were altered in the mutant stomachs. Their results were contrasting: Kim et. al
found that the epithelial overgrowth was a result of lowered apoptotic rates in the mutant
stomachs compared to wild-type, whereas proliferation rates were similar amongst the mutant
stomachs and wild-type [24]. On the other hand, Mao et. al discovered a marked decrease in
proliferation and an unaltered apoptotic rate in the ShhCre/Fl
; Ihh−/Fl
developing gastric

44
mesenchyme [30]. The different results may be the outcome of measuring the endodermal
epithelium versus the mesoderm.
Kim et. al concluded that the Shh ligand normally restrains the growth of the developing
gastric glands by exerting a positive effect on epithelial apoptosis [24]. Gli3 normally acts as a
repressor, and in other instances of organogenesis, such as in the limbs, loss of one or two alleles
of Gli3 can rescue the limb phenotype observed in Shh knockout embryos [24]. However, Shh
null;Gli3XtJ+/−
double mutant mice (missing just one dose of Gli3) display a phenotype similar
to the Shh single knock-out stomach, in other words, no rescue. This finding led Kim et. al [24]
to conclude that Shh regulates glandular growth through the Gli3 activator, making the
developing stomach a unique model of Hh pathway function.
2.4 Gastric cancer and its relationship with the Hedgehog
pathway
The Hedgehog pathway clearly plays an essential role in gastric development, and not
surprisingly, it has also been linked to gastric cancer [23] [28] [48]. Understanding how the Hh
pathway functions in the context of stomach development can help us understand what is
happening when this pathway is de-regulated. Dys-regulation of the Hh pathway is associated
with gastric cancer, a disease that is of great relevance in the world today [23]. Much research
has been dedicated to finding the molecular mechanisms behind gastric cancer, and what can be
concluded is that gastric cancer is a multigenic disease that arises due to an accumulation of
genetic alterations, genetic predisposition, life style, and chronic mucosal damage associated
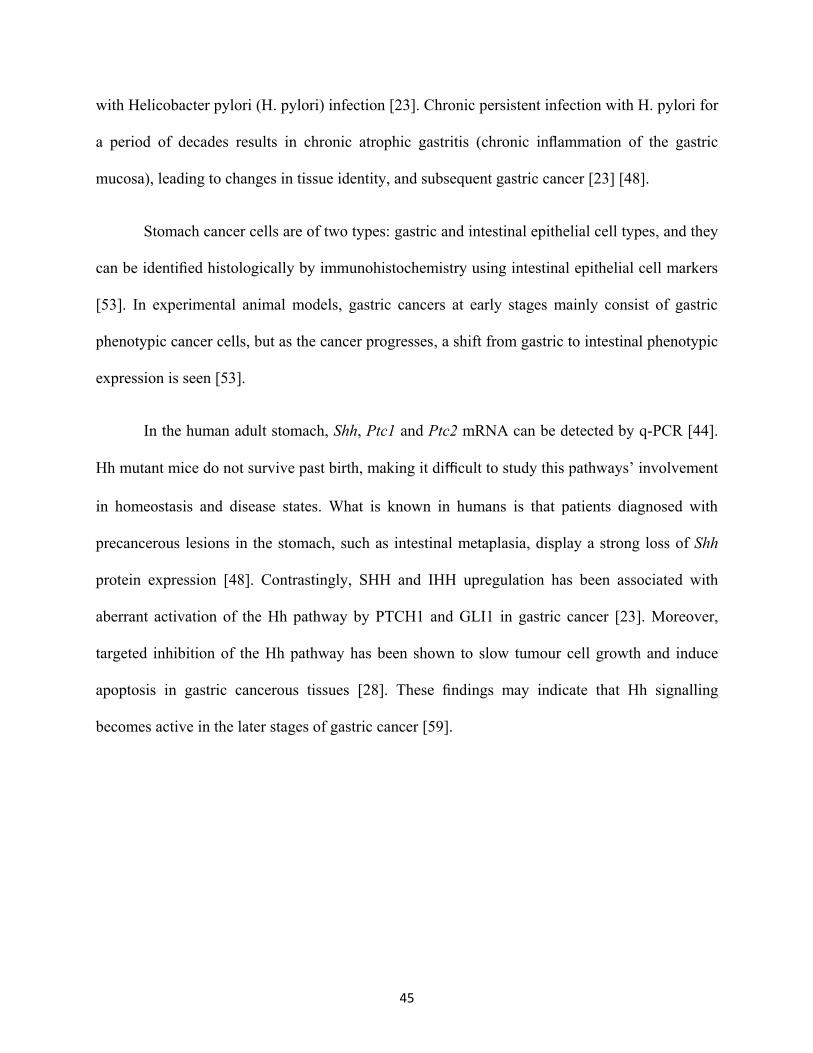
45
with Helicobacter pylori (H. pylori) infection [23]. Chronic persistent infection with H. pylori for
a period of decades results in chronic atrophic gastritis (chronic inflammation of the gastric
mucosa), leading to changes in tissue identity, and subsequent gastric cancer [23] [48].
Stomach cancer cells are of two types: gastric and intestinal epithelial cell types, and they
can be identified histologically by immunohistochemistry using intestinal epithelial cell markers
[53]. In experimental animal models, gastric cancers at early stages mainly consist of gastric
phenotypic cancer cells, but as the cancer progresses, a shift from gastric to intestinal phenotypic
expression is seen [53].
In the human adult stomach, Shh, Ptc1 and Ptc2 mRNA can be detected by q-PCR [44].
Hh mutant mice do not survive past birth, making it difficult to study this pathways‟ involvement
in homeostasis and disease states. What is known in humans is that patients diagnosed with
precancerous lesions in the stomach, such as intestinal metaplasia, display a strong loss of Shh
protein expression [48]. Contrastingly, SHH and IHH upregulation has been associated with
aberrant activation of the Hh pathway by PTCH1 and GLI1 in gastric cancer [23]. Moreover,
targeted inhibition of the Hh pathway has been shown to slow tumour cell growth and induce
apoptosis in gastric cancerous tissues [28]. These findings may indicate that Hh signalling
becomes active in the later stages of gastric cancer [59].
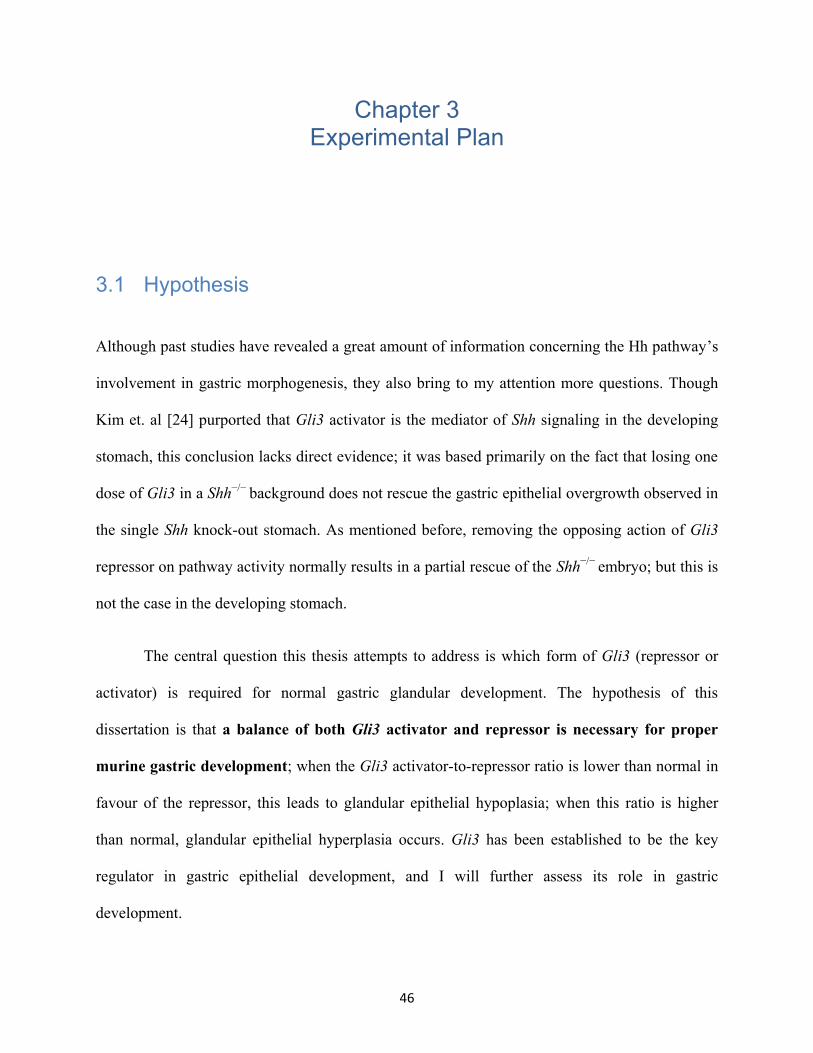
46
Chapter 3 Experimental Plan
3.1 Hypothesis
Although past studies have revealed a great amount of information concerning the Hh pathway‟s
involvement in gastric morphogenesis, they also bring to my attention more questions. Though
Kim et. al [24] purported that Gli3 activator is the mediator of Shh signaling in the developing
stomach, this conclusion lacks direct evidence; it was based primarily on the fact that losing one
dose of Gli3 in a Shh−/−
background does not rescue the gastric epithelial overgrowth observed in
the single Shh knock-out stomach. As mentioned before, removing the opposing action of Gli3
repressor on pathway activity normally results in a partial rescue of the Shh−/−
embryo; but this is
not the case in the developing stomach.
The central question this thesis attempts to address is which form of Gli3 (repressor or
activator) is required for normal gastric glandular development. The hypothesis of this
dissertation is that a balance of both Gli3 activator and repressor is necessary for proper
murine gastric development; when the Gli3 activator-to-repressor ratio is lower than normal in
favour of the repressor, this leads to glandular epithelial hypoplasia; when this ratio is higher
than normal, glandular epithelial hyperplasia occurs. Gli3 has been established to be the key
regulator in gastric epithelial development, and I will further assess its role in gastric
development.

47
3.2 General approach to addressing the hypothesis
In order to define the specific role of the two forms of Gli3 in the developing stomach, I first
examined the phenotypes of the Shh−/−
, Gli2−/−
, and Gli3−/−
mice at late embryonic stage (E18.5),
to obtain a background understanding of these previously characterized stomachs. Since GI tract
development involves cross-talk between the epithelium and mesenchyme, the glandular
epithelial phenotype and circular smooth muscle thickness were evaluated. The glandular
phenotype was assessed for broad changes via hematoxylin and eosin (H&E) staining, and the
circular smooth muscle thickness was measured by counting alpha-smooth muscle actin positive
cells.
As the Gli3−/−
mouse provides only limited insight into Gli3 function, I then shifted my
focus to the Gli3Δ699/Δ699
and Gli3P1−4/P1−4
mice, which allowed me to address the distinct
functions of Gli3 activator and repressor function in the developing stomach. Firstly, I
characterized the phenotypes of these two mutant stomachs, as this has not been done before.
Gastric glandular epithelial cell type staining was performed to determine if gastric identity was
altered. The cell-types examined were parietal cells, chief cells, mucous-producing cells, and
entero-endocrine cells. In addition, the circular smooth muscle layer was assessed by using the α-
smooth muscle actin marker, at E18.5, to determine if loss of either activator or repressor
resulted in defects related to smooth muscle layer formation. Moreover, I tested to see if the
abnormal phenotypes in these mutants were a result of changes in proliferation and/or apoptotic
rates, using the phospho-histone (H3) marker and the TUNEL assay, respectively.
In order to examine if alterations in Gli3 activator and repressor (or both) levels resulted
in changes in Shh pathway activity, in-situ and q-PCR for Ptc1 and Gli1 was performed. As

48
mentioned earlier, Ptc1 and Gli1 are upregulated in the presence of Hh signaling activity, and
hence, are useful markers for evaluating relative levels of Shh pathway activation.
Finally, to test the working hypothesis that the balance of Gli3 activator and repressor is
critical for gastric glandular epithelial growth, I utilized another mouse model: the Kif7−/−
mouse,
wherein the Gli3 activator-to-repressor ratio is increased. Epithelial cell types and circular
smooth muscle were examined using the same markers as before. Since the Kif7−/−
stomach
mimicked the Gli3P1−4/P1−4
stomach, though to a less severe extent, I confirmed that Kif7−/−
stomach had a higher Gli3 activator-to-repressor ratio compared to wild-type by western
blotting. Since Gli3 repressor is formed by post-translational processing, the only reliable
method to evaluate Gli3 activator and repressor levels is via western blotting.
3.3 Methods and Materials
3.3.1 Animal Models
The genetically engineered mice used in this study were provided or purchased from various labs
and companies, and housed in two locations: Toronto Centre for Phenogenomics (TCP) and the
Hospital for Sick Children Lab Animal Services (LAS). Procedures for breeding, maintaining
mouse colonies and sacrificing mice, were executed according to the animal handling protocols
of the respective animal facilities. Shh heterozygous mice were originally purchased from
Jackson laboratory (Bar Harbor, Maine). Gli3XtJ
heterozygous mice in a C3H background were
also obtained from Jackson laboratory and maintained in a (C3HxCD1)F2 background. A
Gli3P1−4
male in (C57BL/6) background was provided by the Wang lab at Cornell University

49
[57], and crossed with C57BL/6 wild-type mice at the HSC LAS to propagate the colony. The
genotypes of heterozygous and homozygous Gli3XtJ
and Gli3P1−4
mice were determined by their
characteristic limb phenotypes [16] [57]. Gli2 and Kif7 mice were provided by C. C. Hui‟s lab,
and their generation and genotyping is described in Mo et. al [37] and [9], respectively. Gli3Δ699
heterozygous adult mice in a (129xC57) background were provided by the Bose lab [6].
3.3.2 Dissections
For timed mating pregnancies, heterozygous males and females with the genotype(s) of interest
were placed together in the late afternoon. The following morning, if the female had a plug, that
day was counted as E0.5. Pregnant females were euthanized by cervical dislocation in the
afternoon, and embryos were harvested in 1X phosphate-buffered saline (PBS) at the following
stages: E12.5, E14.5 and E18.5. Embryos were sacrificed just prior to dissecting out the
stomachs. Stomachs for H&E, immuno-staining, and in-situ hybridization were transferred to a
fixing reagent (described below in Section 3.3.4), whereas stomachs for real time Q-PCR and
western blot were immediately transferred to liquid nitrogen, and then to the -80˚C freezer.
Yolk sacs or tail clips were taken from embryos and later, lysed and analysed by
polymerase chain reaction (PCR) to determine the genotype. Gli3 and Gli3P1−4
mice were
genotyped based on distinguishing phenotypes between wild-type, heterozygotes, and
homozygotes (see Section 2.1.5.3 and 2.1.5.4). Initially, genotyping was done on both these mice
to confirm that the suspected genotype was indeed correct. Shh, Gli2, Gli3Δ699
, and Kif7 mutant
embryos could be identified by phenotype, but PCR analysis was done to confirm their
genotypes, as well as to distinguish between heterozygotes and true wild-type (see Section
2.1.5).

50
3.3.3 Genotyping
To genotype mice, ear clippings and tail notches were taken for each mouse and embryo,
respectively, and lysed in 300 µL of 0.05M NaOH at 95◦C for 10 mins. Afterwards, 100 µL of
0.5M Tris-HCl, pH 8.0 was added, and this solution of lysed DNA was vortexed and then stored
in 4◦C until use. The PCR technique was used to determine the genotypes of my mice. The PCR
protocol for genotyping mice begins with mixing the DNA solutions of interest with PCR
primers for the gene of interest, magnesium chloride (MgCl2), PCR buffer, and autoclaved
deionized water (dH20). Deoxynucleotide triphosphates (dNTPs) and Taq (Thermus aquaticus)
polymerase are added at the very end to minimze the risk of degradation.
The PCR primers used to genotype Shh, Gli2, Gli3, Gli3P1-4
, Gli3Δ699
, and Kif7 mice, as
well as their sequences are described here. For genotyping of Shh mice, three primers were used:
wild-type, ATG CTG GCT CGC CTG GCT GTG GAA; common, GAA GAG ATC AAG GCA
AGC TCT GGC; and mutant, GGA CAC CAT TCT ATG CAG GG. For Gli2 genotyping, the
following primers were used: NeoPA, ATG CCT GCT CTT TAC TGA AGG C; Gli2 sense,
AAA CAA AGC TCC TGT ACA CG; Gli2 anti-sense, CAC CCC AAA GCA TGT GTT TT.
For Gli3 genotyping, the following primers were used: wild-type forward, GGC CCA AAC ATC
TAC CAA CAC ATA G; wild-type reverse, GTT GGC TGC TGC ATG AAG ACT GAC;
mutant forward, AAT GAT GCT CAC TAG TAC AGT G; and mutant reverse, AAA CCC GTG
GCT CAG GAC AAG C. For Gli3 Δ699
, the primers used were: wild-type forward, AGC AAC
TAT TCC AAC AGT GG; wild-type reverse, TGA GCA GAC AGA CAC ATG GTC TAG G;
mutant forward, GCC CAA ACA TCT ACC AAC ACA T; and mutant reverse, CTG CTA AAG
CGC ATG CTC CAG. For Gli3P1-4
genotyping, four primers were used: BW294, ATT GGG

51
AAG ACA ATA GCA GGC A; BW285, ACT AGA TTT GTG GCA CTA ACT ATA; BW325,
AAA AGG GTT TAA ACT AGG CCG C; and BW327, TTG GAC TGT GTG CCT GGA GGG
A. For genotyping of Kif7 mice, four primers were used: Kif7-P1, CAC CAC CAT GCC TGA
TAA AAC; Kif7-P2, CTA TCC CCA ATT CAA AGT AGA C; Kif7-P3, TTC TCA CCC AAG
CTC TTA TCC; and Kif7-P4, CCA AAT GTG TCA GTT TCA TAG C.
3.3.4 Fixation and Slide Preparation
Stomachs were dissected out of embryos in 1xPBS (diethylpyrocarbonate (DEPC)) and
immediately put into the fixing reagent, 4% Paraformaldehyde (PFA) treated with DEPC. The
following day, they were transferred to 70% Ethanol (DEPC) and left overnight at 4◦C.
They were then dehydrated in increasing concentrations of ethanol, up to 100%, and then
placed in xylene. After an appropriate length of time for xylene penetration, stomach tissues
were transferred to paraffin wax at 60◦C. They were then embedded in paraffin wax, and cut at 6
µm thickness. Sections were put onto coated microslides (Surgipath) and left overnight at 60◦C.
The following day, slides were taken out of the oven, and placed into slide boxes kept at room
temperature for storage, until Hematoxylin and Eosin (H&E) and immunofluorescence (IF)
staining, or they were put into the -80◦C fridge for in-situ hybridization (ISH).
3.3.5 Hematoxylin and Eosin (H&E) Staining
In order to evaluate tissue structure and histology, H&E staining was performed on stomach
sections of litter-mate pairs. Slides were treated with xylene for 10 minutes, and then with

52
decreasing concentrations of ethanol (from 100% to 30%) and finally deionized water.
Afterwards, slides were placed in 50% hematoxylin for 8-10 minutes depending on the
embryonic stage of the tissue, and then rinsed in water for 4 minutes. The slides were then
dipped in acid alcohol 3 times, then lithium chloride 4 times, and again rinsed in water for 8
minutes. Next, the slides were dehydrated in increasing concentrations of ethanol from 30% to
70% and then placed in eosin for 5-7 minutes depending on the embryonic stage of the tissue.
Finally, the slides were dehydrated to 100% ethanol, and then placed in xylene, and mounted
with permount.
3.3.6 Immunofluorescence (IF)
Litter-mate pairs were always stained concurrently, so as to minimize variability in staining
conditions. Slides were de-paraffinized in xylene and then hydrated in decreasing concentrations
of ethanol. Antigen retrieval was done using a citrate-based solution Antigen Unmasking
Solution (H-3300, Vector Labs) in a microwaveable pressure cooker. The solution was
microwaved for 6 minutes, and then another 6 minutes with the slides inside. The pressure
cooker was then left to cool in a cold water bath for 10 minutes.
Slides were incubated in a blocking solution (Cat. #1096176, Roche) for an hour at room
temperature, and then incubated in primary antibody overnight at 4◦C. The following morning,
secondary antibody was left to incubate on the slides for an hour at room temperature.
Afterwards, the slides were mounted with VECTASHIELD mounting medium with 4'-6-
Diamidino-2-phenylindole (DAPI) (Vector Labs, Burlingame, CA). 1xPBS was used to wash
slides in between steps. Mounted slides were visualized with a fluorescent microscope.
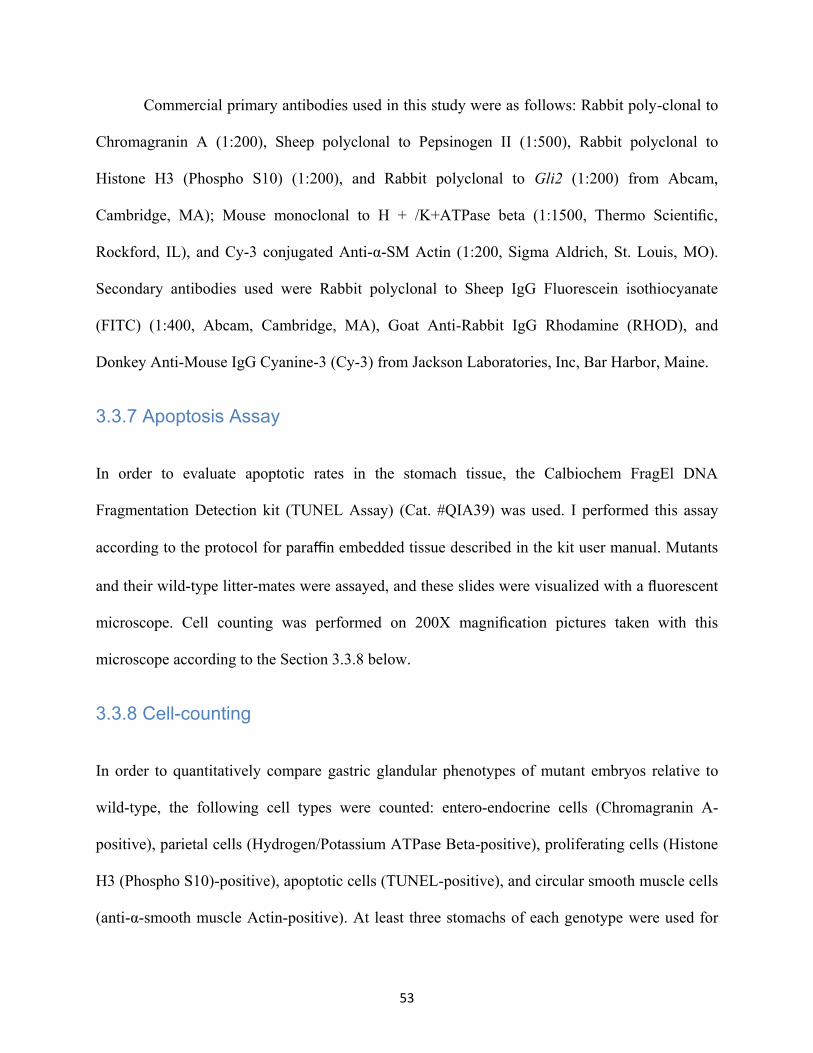
53
Commercial primary antibodies used in this study were as follows: Rabbit poly-clonal to
Chromagranin A (1:200), Sheep polyclonal to Pepsinogen II (1:500), Rabbit polyclonal to
Histone H3 (Phospho S10) (1:200), and Rabbit polyclonal to Gli2 (1:200) from Abcam,
Cambridge, MA); Mouse monoclonal to H + /K+ATPase beta (1:1500, Thermo Scientific,
Rockford, IL), and Cy-3 conjugated Anti-α-SM Actin (1:200, Sigma Aldrich, St. Louis, MO).
Secondary antibodies used were Rabbit polyclonal to Sheep IgG Fluorescein isothiocyanate
(FITC) (1:400, Abcam, Cambridge, MA), Goat Anti-Rabbit IgG Rhodamine (RHOD), and
Donkey Anti-Mouse IgG Cyanine-3 (Cy-3) from Jackson Laboratories, Inc, Bar Harbor, Maine.
3.3.7 Apoptosis Assay
In order to evaluate apoptotic rates in the stomach tissue, the Calbiochem FragEl DNA
Fragmentation Detection kit (TUNEL Assay) (Cat. #QIA39) was used. I performed this assay
according to the protocol for paraffin embedded tissue described in the kit user manual. Mutants
and their wild-type litter-mates were assayed, and these slides were visualized with a fluorescent
microscope. Cell counting was performed on 200X magnification pictures taken with this
microscope according to the Section 3.3.8 below.
3.3.8 Cell-counting
In order to quantitatively compare gastric glandular phenotypes of mutant embryos relative to
wild-type, the following cell types were counted: entero-endocrine cells (Chromagranin A-
positive), parietal cells (Hydrogen/Potassium ATPase Beta-positive), proliferating cells (Histone
H3 (Phospho S10)-positive), apoptotic cells (TUNEL-positive), and circular smooth muscle cells
(anti-α-smooth muscle Actin-positive). At least three stomachs of each genotype were used for

54
each measure. In order to control for variability resulting from experimental error, a mutant
stomach was always paired with a wild-type littermate stomach from the initial process of
fixation to the final process of staining and image-capturing.
3.3.8.1 Cell-counting for all cell types except circular smooth muscle
For each slide that was stained, three 200X magnification pictures were taken. In order to
quantify the ratio of positively-stained cells to total cells in an unbiased manner, four parallel
white panels were pasted over every image in exactly the same position. The remaining three
blocks of the un-covered image were counted for DAPI-stained cells and positively (FITC or
RHOD) stained cells.
3.3.8.2 Measuring the width of the circular smooth muscle
To evaluate whether circular smooth muscle width was altered in mutant stomachs, images of
E18.5 wild-type and mutant stomachs were captured at 200X magnification under a fluorescent
microscope, and smooth muscle width was measured by using a ruler against the image projected
on the computer screen. The values obtained were merely representations of the true widths of
the circular smooth muscle, and not the actual values. Therefore, only the widths relative to wild-
type, rather than the absolute widths, are presented in the results.
All mutants were compared against their wild-type litter-mate; at least three of each
genotype was measured for statistical significance. Six measurements of the circular smooth
muscle width for each stomach were taken, and this included two equally spaced (by eye)
regions in three different sections captured by the microscope. All these measurements were
made in only the glandular portion of the stomach.

55
3.3.9 Periodic Acid Schiff (PAS) Staining
To evaluate the mucous-producing cells of the gastric epithelium, PAS staining was performed
on late-stage embryonic stomachs. Slides were de-paraffinized in xylene, hydrated in decreasing
concentrations of ethanol, and then oxidized in Periodic Acid for 5 minutes. Slides were then
rinsed in distilled water, and then placed in Schiff reagent for 15 minutes. Afterwards, the slides
were placed in lukewarm running water for 5 minutes and then counter-stained with hematoxylin
for 1 minute. The slides were then mounted with permount.
3.3.10 In-situ Hybridization (ISH)
In-situ hybridization was performed to determine the localization of Ptc1 and Gli1 mRNA in
late-stage mutant stomachs. ISH on paraffin sections was carried out using the protocol described
by Mo et. al [37]. Briefly, slides were removed from storage at -80◦C and thawed at room
temperature for a few hours, before being placed in xylene, then decreasing concentrations of
ethanol. Next, slides were re-fixed in 4% PFA before antigen retrieval, which was achieved by
use of a 20 mg/mL Proteinase K in 1xPBS solution warmed to 37˚C. The slides were then treated
with 0.2M HCl, then with NaOH in 0.1M triethanolamine (TEA), and finally, with acetic
anhydride in 0.1M TEA. Between each step, 1xPBS was used to rinse the slides. All solutions
were treated with DEPC prior to experiment. The slides were dehydrated in ethanol and then left
to air-dry before being placed in a humidified chamber. Riboprobes denatured in hybridization
buffer were applied to stomach sections, and then they were covered with parafilm strips.
Riboprobes used in this study were Gli1 and Ptc1, and they were provided by C. C. Hui‟s lab
(Hospital for Sick Children). Each slide had one section with a riboprobe and another with
hybridization buffer only (negative control). The chamber was left overnight in the oven at 55◦C.
56
After 16 hours, the slides were placed into warmed 5x saline sodium citrate (SSC), then
into Tris NaCl EDTA (TNE), and then back into decreasing concentrations of SSC until being
placed into 1x Tris-buffered saline with Tween 20 (TBS-T). After, a 1x blocking reagent was
applied to the sections for an hour at room temperature. Next anti-Digoxigenin (DIG)-alkaline
phosphatase in 1x blocking solution (at 1 µL/1999 µL) was applied to the stomach sections for
an hour at room temperature. After a few washes in 1xTBST, the slides were placed in alkaline
phosphatase buffer (APB). All steps were done with non-DEPC water. Next, BM Purple colour
substrate was applied to the slides overnight at room temperature. The next day, the slides were
checked intermittently for colour development. Finally, slides were mounted with permount, and
visualized with a light microscope. In each batch, mutant stomachs were paired with their wild-
type littermate stomachs.
3.3.11 Western Blot
Protein from stomach samples was extracted with the following procedure. Frozen tissue was
transferred from the -80◦C fridge to solid nitrogen, and shredded and solubilized in
Radioimmunoprecipitation (RIPA) buffer (Sigma) and Protease inhibitor (Roche) using a mortar
and pestle. The tissue was left in RIPA buffer on a shaking platform for 2 hours at 4◦C.
Afterwards, the mixture was centrifuged for 20 minutes at 12 000 RPM at 4◦C. Supernatant was
transferred to a new Eppendorf tube, and measured for protein concentration by the Bradford
Assay, using the Coomassie Plus Protein Assay Reagent (Cat. #1856210, ThermoScientific). The
isolated protein was then stored in the -80˚C freezer until use.
Running of the protein through the gel was done according to a modified version of the
Abcam Western Blot protocol, which is described here. A day prior to starting the experiment, a
57
7% running gel was made and left to solidify overnight. The next morning, a 7% stacking gel
was layered over the running gel and left to solidify for an hour. Aliquots containing 50 µg of
isolated proteins from stomachs of interest were taken out of the freezer and topped up with dH20
to 20 µL. 5 µL of 5x loading dye was mixed into each sample, and the samples were heated to
95˚C for 5 minutes and then placed on ice for 5 minutes. Afterwards, the samples were left at
room temperature until loading onto the gel.
The stacking and running gel, after solidifying, were placed in a western blot BioRad gel
electrophoresis apparatus and then immersed in 1x running buffer. Samples were loaded into the
wells of the gel, and then the gel was left to run at 60 V through the stacking gel. The voltage
was increased to 100 V through the running gel until adequate separation of bands (based on
ladder) was observed, this ranged from 1.5 to 3 hours.
The next step entailed transferring the proteins from the running gel onto a nitrocellulose
membrane. This step was accomplished by use of a wet transfer apparatus. The gel was
sandwiched between a sponge and blot paper on one side, and a 0.45 µm nitrocellulose
membrane and blot paper, and sponge on the other side. This sandwich was placed in a transfer
buffer in the transfer apparatus, and transferring occurred at 100 V for two to three hours in a
cold water bath.
After transfer, the membrane containing the proteins was incubated in blocking solution
(5% milk powder in 1xTBS-T) for 2 hours, before primary antibody was added at a
concentration of 1:800. The antibody used here was rabbit polyclonal to GLI3 (Santa Cruz
Biotech). The membrane was left in the primary antibody solution overnight at 4˚C. The next
morning, the membrane was rinsed thoroughly before being incubated in anti-rabbit IgG horse
58
radish peroxidase (HRP) – conjugated secondary antibody (Santa Cruz Biotech) at a dilution of
1:3000 for an hour.
Finally, the membrane was treated to a chemiluminescent reagent (Immun-Star HRP
substrate, Biorad Cat. No. 170-5040), and then the protein bands of interest on the membrane
were visualized manually on x-ray film.
3.3.12 Real-time PCR
For real time or quantitative polyermase chain reaction (q-PCR), total RNA of E18.5 stomachs
was extracted using the RNeasy Mini Kit (Qiagen). Frozen stomach tissue was taken out of the -
80˚C freezer, and homogenized with a mortar and pestle in buffer RLT, while on solid nitrogen.
The rest of the RNA extraction protocol followed very closely the one described in the RNeasy
Mini Kit manual. A spectrophotometer was used to measure total RNA collected.
Afterwards, cDNA was synthesized from the RNA using the SuperScript II First-Strand
Synthesis Kit (Invitrogen), and then purified using a QIAquick PCR Purification Kit (Qiagen)
according to its protocol. cDNA was stored at -20˚C until q-PCR.
Quantitative polymerase chain reactions were performed using commercially available Ptc1 and
Gli1 primers. The primer sequences for Ptc1 were 5’-AAC AAA AAT TCA ACC AAA CCT C
– 3’ and 5’-TGT CTT CAT TCC AGT TGA TGT G-3’. The primer sequences for Gli1 were 5’–
GAA GGA ATT CGT GTG CCA TT-3' and 5’-GCA ACC TTC TTG CTC ACA CA-3’. The
relative expressions were analyzed according to Pfaffl‟s methods [43].

59
3.3.13 Statistics
As mentioned earlier, stomachs of litter-mates were paired together from the start of fixation
until the end of the staining process to reduce error arising from variability in experimental
procedures. Quantification of the different cell types and the width of the circular smooth muscle
were done according to Section 3.3.8 above. For all the cell types excluding the circular smooth
muscle, an assessment of the potential change in cell type number in the mutant compared to
wild-type was done in the following manner. First, for each stomach, the number of positively
stained cells and the number of total cells were counted. These obtained values were then
expressed as positive cell number/ total cell number for each stomach. This calculation allowed
us to identify any changes in cell type number relative to the total amount of cells present. Then,
for each genotype, the mean of all the stomachs of that genotype was calculated. In order to
standardize the results to be able to compare across the different mutants, the mean value for the
mutant was divided by the mean value for its wild-type counterpart. Thus, the wild-type for each
gene held a value of 1. The value of the ratio for each mutant in all quantifications represents a
relative-to-wild-type value, rather than an absolute quantity.
For the circular smooth muscle, the width was measured using a ruler against the
computer screen (see Section 3.3.8.2 above). The mean width was calculated for each genotype.
The final value represents the mean width of the mutant genotype divided by the mean width of
its wild-type counterpart – a relative quantity. This allowed for comparison of the circular
smooth muscle widths across genotypes, as the wild-type circular smooth muscle for all
genotypes always held the value of 1.
60
To determine the variability of the mean, standard deviation was calculated for these
results by taking the square root of the sum of the squared deviations from the mean, divided by
the sample size minus one. To determine the standard deviation of the sampling distribution of
the statistics, standard error was then calculated as the standard deviation divided by the square
root of the sample size for each genotype. To test for whether the difference between the wild-
type and mutant mean values were statistically significant, the student‟s t-test was performed.
The calculation for the student‟s t-test was done by dividing the difference between the two
means by the variability of groups (or the standard error of the difference). The standard error of
the difference was computed by first taking the variance of both groups and dividing each of
them by the number of samples in that group. These two values were added together and then
this sum was square rooted. Results were considered significant if the alpha level (P value) was
less than or equal to 0.05.

61
Chapter 4 Results and Interpretation
4.1 Phenotypic analysis of the Shh−/− stomach
Before evaluating the specific role of Gli3 in the developing murine stomach, I attempted to
confirm previous results pertaining to the phenotype of the Shh−/−
stomach from other studies
[24] [44]. My lab performed timed mating pregnancies between Shh heterozygous adults to
generate Shh−/−
embryos at E18.5. Upon dissecting the E18.5 embryos, it was noted that both the
embryo and the stomach were significantly smaller compared to wild-type. The Shh+/−
whole
embryo and stomach were indistinguishable from that of Shh+/+
; thus, in my experiments Shh+/−
was considered wild-type. The Shh−/−
embryo was identified by its smaller size, lack of digits,
and beak-like head.
When dissecting out the stomach of the mutant, it was noted that it oftentimes was rotated
unusually along the A-P axis. Moreover, blood was often pooled in the stomach, and it appeared
more rigid and less translucent compared to wild-type, indicating that the gastric epithelium was
most likely thicker in the mutant (shown in Figure 12A&B). H&E staining of cross-sections of
the E18.5 stomach revealed a significantly thicker glandular epithelium in the Shh−/−
stomach
compared to wild-type, displayed in Figure 12E&F, corroborating with previous labs‟ findings
[24] [44]. Four stomachs of mutants and their wild-type littermates were examined, and these
results were consistently observed.
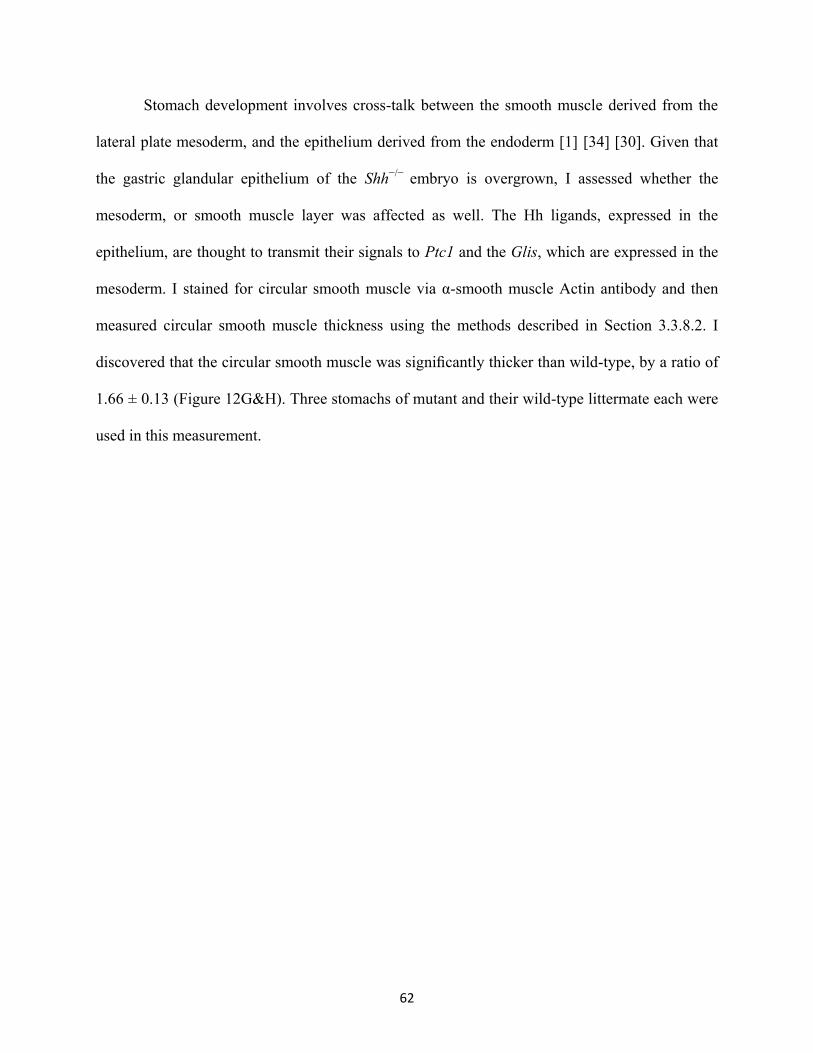
62
Stomach development involves cross-talk between the smooth muscle derived from the
lateral plate mesoderm, and the epithelium derived from the endoderm [1] [34] [30]. Given that
the gastric glandular epithelium of the Shh−/−
embryo is overgrown, I assessed whether the
mesoderm, or smooth muscle layer was affected as well. The Hh ligands, expressed in the
epithelium, are thought to transmit their signals to Ptc1 and the Glis, which are expressed in the
mesoderm. I stained for circular smooth muscle via α-smooth muscle Actin antibody and then
measured circular smooth muscle thickness using the methods described in Section 3.3.8.2. I
discovered that the circular smooth muscle was significantly thicker than wild-type, by a ratio of
1.66 ± 0.13 (Figure 12G&H). Three stomachs of mutant and their wild-type littermate each were
used in this measurement.
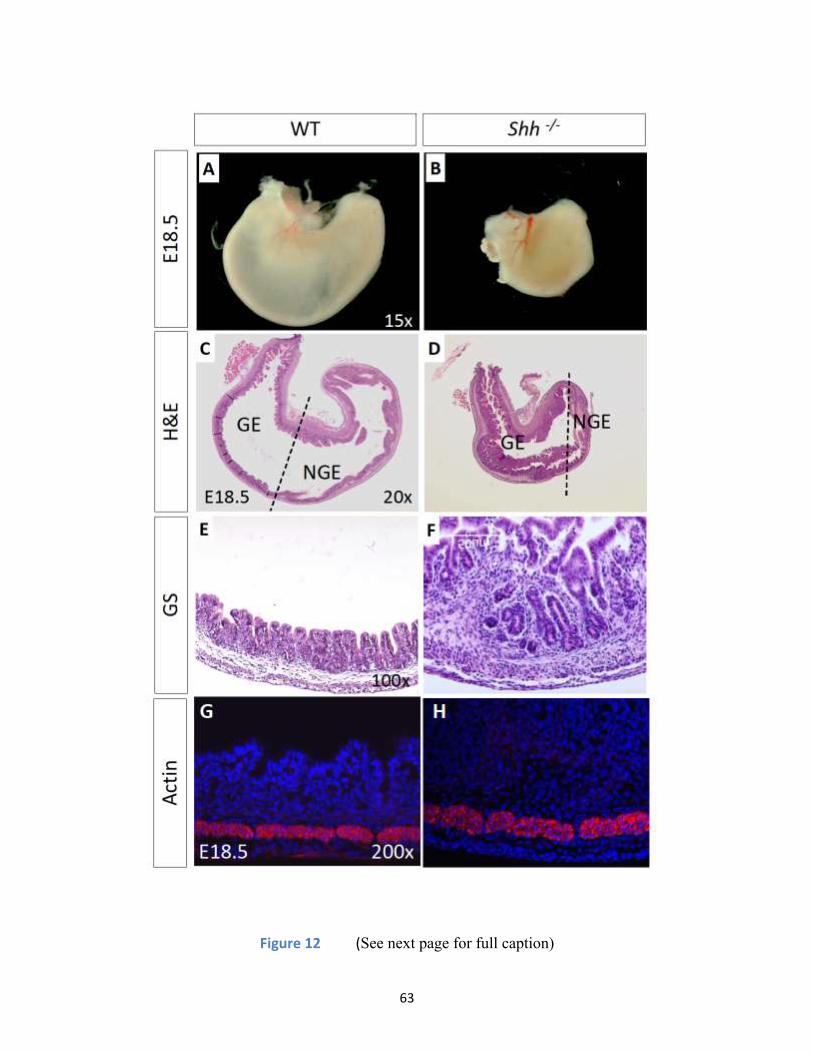
63
Figure 12 (See next page for full caption)
64
Figure 12: Shh−/− mice display gastric glandular epithelial overgrowth and increased circular
smooth muscle thickness.
(A) & (B) The E18.5 Shh−/−
stomach is smaller compared to wild-type. (C) & (D) H&E staining
of a cross-section reveals that the stomach is smaller in overall size, yet the epithelium
appears thicker in the Shh−/−
stomach, resulting in the lumen being much smaller in the
mutant compared to wild-type. (E) & (F) A higher magnification of the glandular epithelium
shows that it is overgrown in the Shh−/−
stomach relative to wild-type, as measured by the
width of the epithelium. (n = 4 stomachs) (G) & (H) The Shh−/−
stomach appears to have a
thicker circular smooth muscle layer (in pink) than wild-types. (I) The Shh−/−
circular smooth
muscle layer was significantly thicker than wild-type by a factor of 1.66 ± 0.13 (n=3
stomachs, P<0.05).
65
4.2 Phenotypic analysis of the Gli2−/− and Gli3
−/− murine stomachs
Given that the Shh null stomach displayed glandular overgrowth as previously established [44], I
next evaluated the Gli2−/−
and Gli3−/−
murine stomachs for glandular defects, as Kim et. al [24]
did before. The Gli2 and Gli3 transcription factors are the endpoint transducers of Shh signaling;
therefore, it is predicted that knocking either out would result in abnormal gastric development.
Both the Gli2−/−
and Gli3−/−
E18.5 embryos were comparable in size to wild-type. Gli2 null
embryos were identified by the abnormal curvature of their spine, making them more „C‟ shaped.
Gli3 null embryos were identified by their polydactyly and frequently, exencephaly; these results
were confirmed with PCR.
The Gli2−/−
stomach was slightly smaller compared to wild-type, but relatively normal in
outward appearance; while the Gli3−/−
stomach was noticeably smaller (refer to Figure 13A-C).
However, comparing pictures of the Gli3−/−
stomach to the Shh−/−
stomach at the same
magnification, the Gli3−/−
stomach was consistently larger. Upon H&E staining of these
stomachs, seen in Figure 13D-I, the Gli2−/−
stomach displayed a mildly overgrown glandular
epithelium, indicating minimal changes. Four stomachs of both Gli2 wild-type and mutant
embryos were examined with H&E staining. The Gli3−/−
stomach displayed a more severe
glandular epithelial overgrowth phenotype than the Gli2−/−
stomach; ten Gli3 wild-type and
twelve mutant stomachs were used for this study.
Given that the Gli3−/−
stomach, and not the Gli2−/−
stomach, displayed glandular epithelial
overgrowth similar to the Shh−/−
stomach, I concluded that Gli3 was the dominant transcription
factor mediating Shh pathway activity in the developing murine stomach.

66
The Gli3−/−
gastric glandular epithelial overgrowth displayed a high variability, from mild
to severe, though the overall size of the stomach was consistently the same. The Gli3−/−
gastric
GE was invariably thicker than wild-type, though in the twelve mutant stomachs examined
histologically, only two of them had a glandular mucosal overgrowth comparable to the Shh−/−
gastric glandular epithelium; the other 10 were not as severely overgrown as the Shh−/−
stomach.
This variable gastric glandular epithelial thickness is shown in Figure 14. It should be noted that
patients with GCPS and PHS, congenital pleiotropic disorders that arise from mutations in GLI3,
display variable expressivity of this disorder. The variability could be explained by variants in
GLI3 regulatory elements [4]. Variants in other genes could also contribute to the variability
observed in the phenotypic expression of both diseases, indicating that something more complex
than a simple single gene disorder is taking place [4]. In mice, a similar variable expressivity of
the Gli3 null mutation may account for the varied overgrowth in the Gli3−/−
gastric glandular
epithelium.
To evaluate whether the circular smooth muscle layer was affected in mutants lacking
Gli2 or Gli3 function, α-SM-actin staining was done on Gli2−/−
and Gli3−/−
stomachs; results are
shown in Figure 15(A-C). Relative to wild-type, the circular SM of the Gli2−/−
stomach was
significantly thicker by a factor of 1.50 ± 0.07 compared to its wild-type litter-mate (refer to
Figure 15D). Three mutants and three wild-types were used for this quantification.
The same analysis was performed on the Gli3−/−
stomach, and it was discovered that the
Gli3−/−
stomach‟s circular SM was significantly thicker by a factor of 1.61 ± 0.08 relative to
wild-type (shown to Figure 15D). Four wild-type and three mutant stomachs were used in this
measurement.
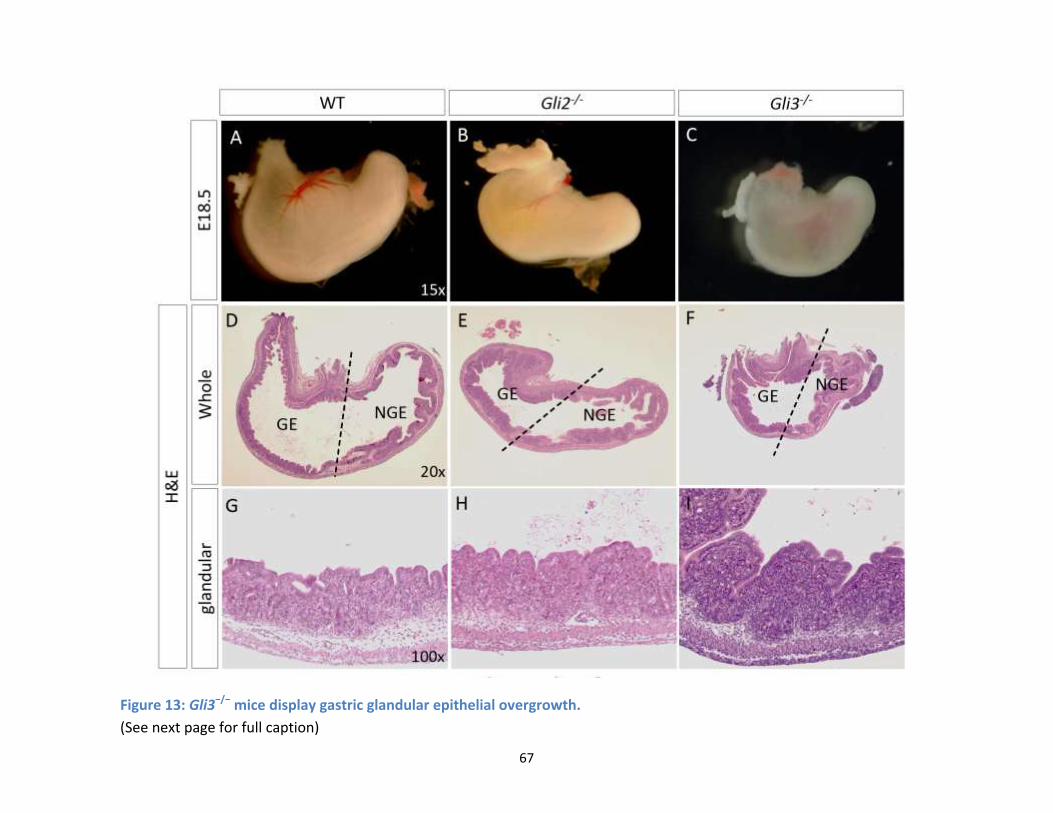
67
Figure 13: Gli3−/− mice display gastric glandular epithelial overgrowth.
(See next page for full caption)

68
Figure 13: Gli3−/− mice display gastric glandular epithelial overgrowth.
(A-C) The E18.5 Gli2−/−
mutant stomach is slightly smaller compared to that of a wild-type litter-
mate; however, the Gli3 mutant stomach is noticeably smaller. (E) & (H) H&E staining reveals
that the Gli2−/−
gastric glandular epithelium is slightly overgrown compared to wild-type shown
in (D) & (G). (n = 4 stomachs) (F) & (I) A cross-section of the Gli3−/−
stomach reveals that its
glandular epithelium is more overgrown than that of the Gli2−/−
stomach (n = 12 stomachs).

69
Figure 14: The Gli3 null stomach displays variable degrees of glandular overgrowth.
(A) Wild-type E18.5 gastric glandular epithelium. (B-D) Compared to wild-type, the three Gli3
null stomachs shown here display
glandular epithelial overgrowth to various degrees, from less overgrown in (C), to more overgrown in (B), and to even more
overgrown in (D).
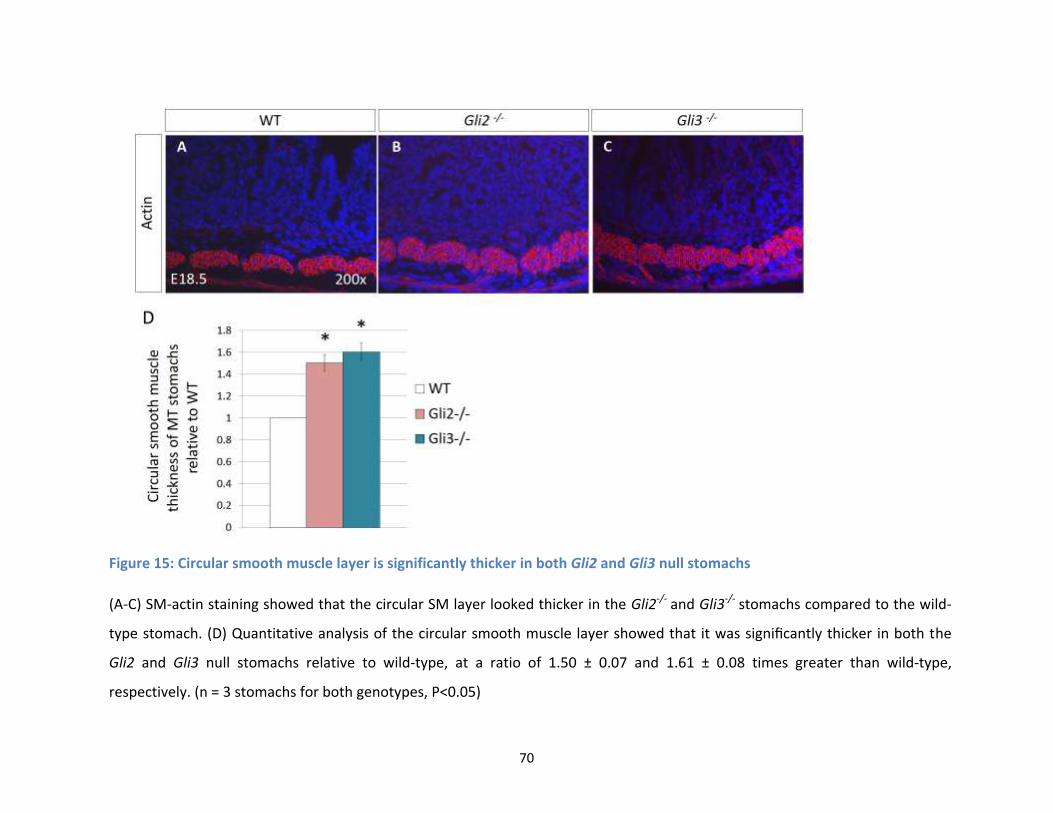
70
Figure 15: Circular smooth muscle layer is significantly thicker in both Gli2 and Gli3 null stomachs
(A-C) SM-actin staining showed that the circular SM layer looked thicker in the Gli2-/-
and Gli3-/-
stomachs compared to the wild-
type stomach. (D) Quantitative analysis of the circular smooth muscle layer showed that it was significantly thicker in both the
Gli2 and Gli3 null stomachs relative to wild-type, at a ratio of 1.50 ± 0.07 and 1.61 ± 0.08 times greater than wild-type,
respectively. (n = 3 stomachs for both genotypes, P<0.05)
71
4.3 The role of Gli3 activator and repressor in stomach
development: assessing the Gli3P1−4/P1−4 and Gli3
Δ699/Δ699 murine
stomachs
Previously, we and others [24] established the importance of Gli3 tramscription factor in the
developing murine stomach. In order to better understand its role, it was necessary to tease apart
how or whether its repressor and activator functions are involved in gastric development. We
obtained two mouse models to achieve this end. The first is the Gli3P1−4
mouse model, which has
constitutively active Gli3 transcriptional activator function, while lacking all Gli3 repressor
activity. The second is the Gli3Δ699
mouse model, which has only Gli3 repressor activity, while
lacking all Gli3 activator function. An in-depth explanation of these two mouse models is written
in Section 2.1.5. These two models allow us to isolate and study the effects of removing Gli3
activator or repressor in the stomach.
4.3.1 Phenotypic analysis of the Gli3P1−4/P1−4 and Gli3Δ699/Δ699 mouse
stomachs
At E18.5, both the Gli3P1−4
and Gli3Δ699
mutant embryos were relatively the same size as wild-
type embryos. The Gli3P1-4/P1-4
embryo, like the Gli3−/−
embryo, displayed polydactyly and
exencephaly and was easily recognizable by the blood in its embryonic sac. The Gli3Δ699/Δ699
embryo appeared relatively normal, except for being slightly more plump on the bottom half of
its torso; mutants were identified by PCR.
The stomach of the Gli3P1−4/P1−4
mouse was much smaller in size compared to wild-type
(Figure 16A&B). However, as with the Gli3−/−
stomach, the Gli3P1−4/P1−4
stomach was

72
consistently larger than that of the Shh−/−
mouse when compared at the same magnification.
Notably, the Gli3P1−4/P1−4
stomach usually contained blood, was more rigid and less translucent
than its wild-type counterpart. Contrastingly, the Gli3Δ699/Δ699
stomach was larger compared to
wild-type, appeared distended, and was yellow - a sign of lack of oxygen (Figure 16C). The
Gli3Δ699/Δ699
stomach sections were more susceptible to damage from chemicals and procedures
used for staining than stomachs of all other genotypes, suggesting that the structural integrity of
the Gli3Δ699/Δ699
stomach was compromised.
H&E staining revealed that the Gli3P1−4/P1−4
gastric glandular epithelium was overgrown
(refer to Figure 16E&H). Notably, the Gli3P1−4/P1−4
stomach glandular epithelium was
consistently greater than twice the thickness of that of wild-type, in all eight stomachs evaluated
histologically, unlike the Gli3−/−
stomach. Moreover, the gastric glandular overgrowth of the
Gli3P1−4/P1−4
is also consistently more severe than that of the Gli3−/−
stomach. The Gli3Δ699/Δ699
displayed a contrasting phenotype; its glandular epithelium was hypoplastic, as evidenced by the
shortened primordial buds (Figure 16F&I), and this phenotype was consistent amongst the ten
mutant stomachs assessed.
The major gsstric glandular epithelial cell types were stained for in both mutant stomachs
to characterize the glandular epithelial phenotypes further. Entero-endocrine cells, parietal cells,
chief cells, and mucous-producing cells were stained by Chromagranin A antibody, H+/K+-
ATPase Beta antibody, Pepsinogen C antibody, and PAS, respectively. Only entero-endocrine
and parietal cell numbers were quantitatively analyzed since the staining techniques for the other
two cells types yielded diffuse and sometimes extracellular staining, making it difficult to count
distinct positive cells. All of these results are shown in Figure 17.
73
Immunofluorescent staining done on the wild-type E18.5 stomach reveals that entero-
endocrine cells normally reside in the entire glandular portion of the stomach scattered
throughout the pit-gland. Parietal cells are located in the body region of the stomach, also
scattered throughout the pit-gland. Chief cells are localized to the antral region of the stomach,
and are found at the base of the glands. Mucous-producing cells line the surface of the pits of the
stomach, throughout the entire glandular epithelium.
Gastric glandular epithelial identity was retained in the Gli3P1−4/P1−4
stomach; all the cell
types were present in its glandular epithelium, and localized to the correct regions. Quantitation
of the ratio of entero-endocrine cells-to-total cells yielded a value of 1.28 ± 0.36 that of wild-
type. The ratio of parietal cells-to-total cells gave the value of 1.14 ± 0.25 relative to wild-type.
For analysis of entero-endocrine cell numbers, four mutants and wild-types were used; for
parietal cell numbers, four mutant and six wild-types were used. Therefore, the proportion of
these major glandular epithelial cell types was not altered significantly in the Gli3P1−4/P1−4
stomach compared to wild-type.
In the Gli3Δ699/Δ699
stomach, the glandular epithelium has an altered level of several of the
major epithelial cell types. The parietal cells, though correctly localized, showed a significant
decrease, as the ratio of parietal to total cells is reduced by 0.57 ± 0.21 compared to wild-type;
six mutants and six wild-types were used for this calculation. PAS stains mucous-producing cells
bright pink, as can be seen in
Figure 17J. The Gli3Δ699/Δ699
glandular epithelium appeared to lack any PAS-positive cells
(refer to Figure 17L); the dull purple colour originates from the Hematoxylin counter-staining.
To verify this result, four Gli3Δ699/Δ699
stomachs were stained for PAS, and all four lacked the
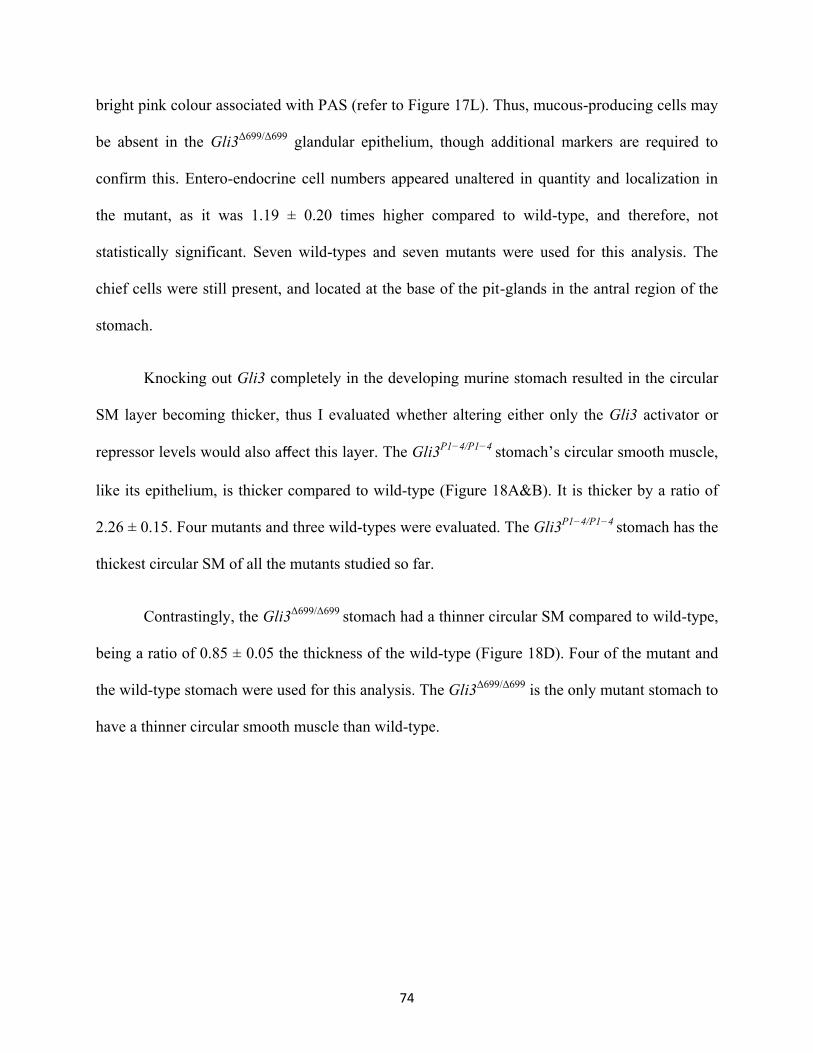
74
bright pink colour associated with PAS (refer to Figure 17L). Thus, mucous-producing cells may
be absent in the Gli3Δ699/Δ699
glandular epithelium, though additional markers are required to
confirm this. Entero-endocrine cell numbers appeared unaltered in quantity and localization in
the mutant, as it was 1.19 ± 0.20 times higher compared to wild-type, and therefore, not
statistically significant. Seven wild-types and seven mutants were used for this analysis. The
chief cells were still present, and located at the base of the pit-glands in the antral region of the
stomach.
Knocking out Gli3 completely in the developing murine stomach resulted in the circular
SM layer becoming thicker, thus I evaluated whether altering either only the Gli3 activator or
repressor levels would also affect this layer. The Gli3P1−4/P1−4
stomach‟s circular smooth muscle,
like its epithelium, is thicker compared to wild-type (Figure 18A&B). It is thicker by a ratio of
2.26 ± 0.15. Four mutants and three wild-types were evaluated. The Gli3P1−4/P1−4
stomach has the
thickest circular SM of all the mutants studied so far.
Contrastingly, the Gli3Δ699/Δ699
stomach had a thinner circular SM compared to wild-type,
being a ratio of 0.85 ± 0.05 the thickness of the wild-type (Figure 18D). Four of the mutant and
the wild-type stomach were used for this analysis. The Gli3Δ699/Δ699
is the only mutant stomach to
have a thinner circular smooth muscle than wild-type.
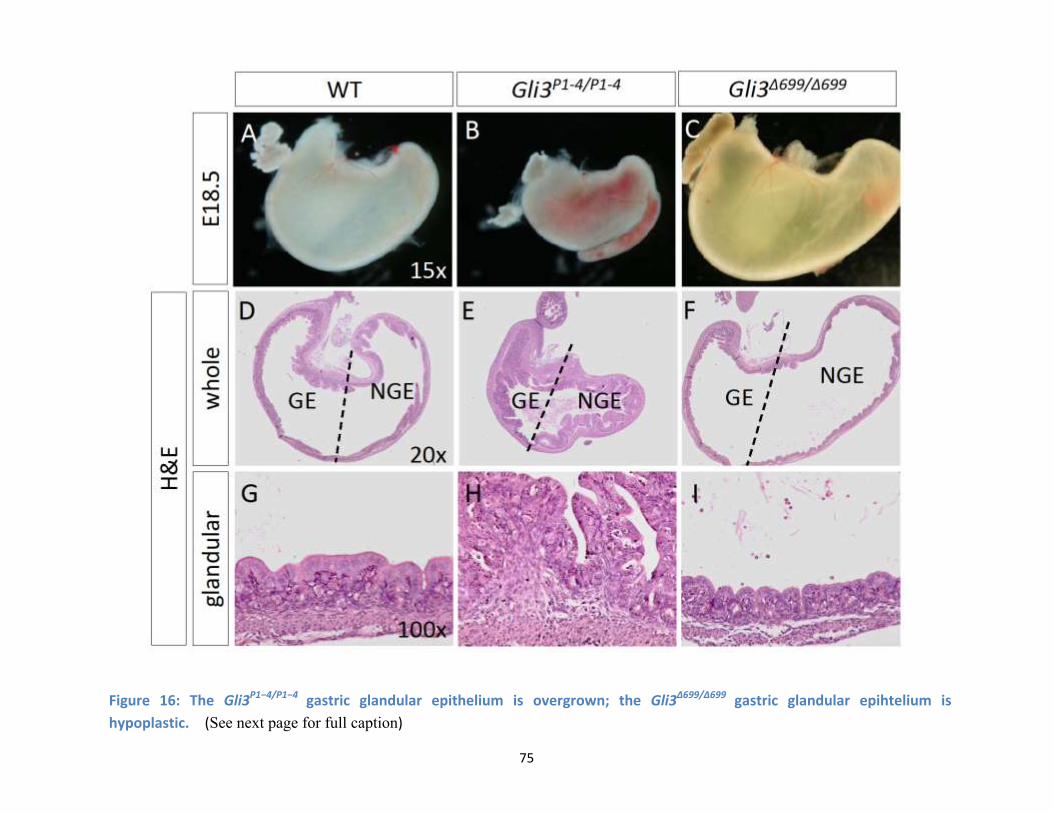
75
Figure 16: The Gli3P1−4/P1−4 gastric glandular epithelium is overgrown; the Gli3Δ699/Δ699 gastric glandular epihtelium is
hypoplastic. (See next page for full caption)
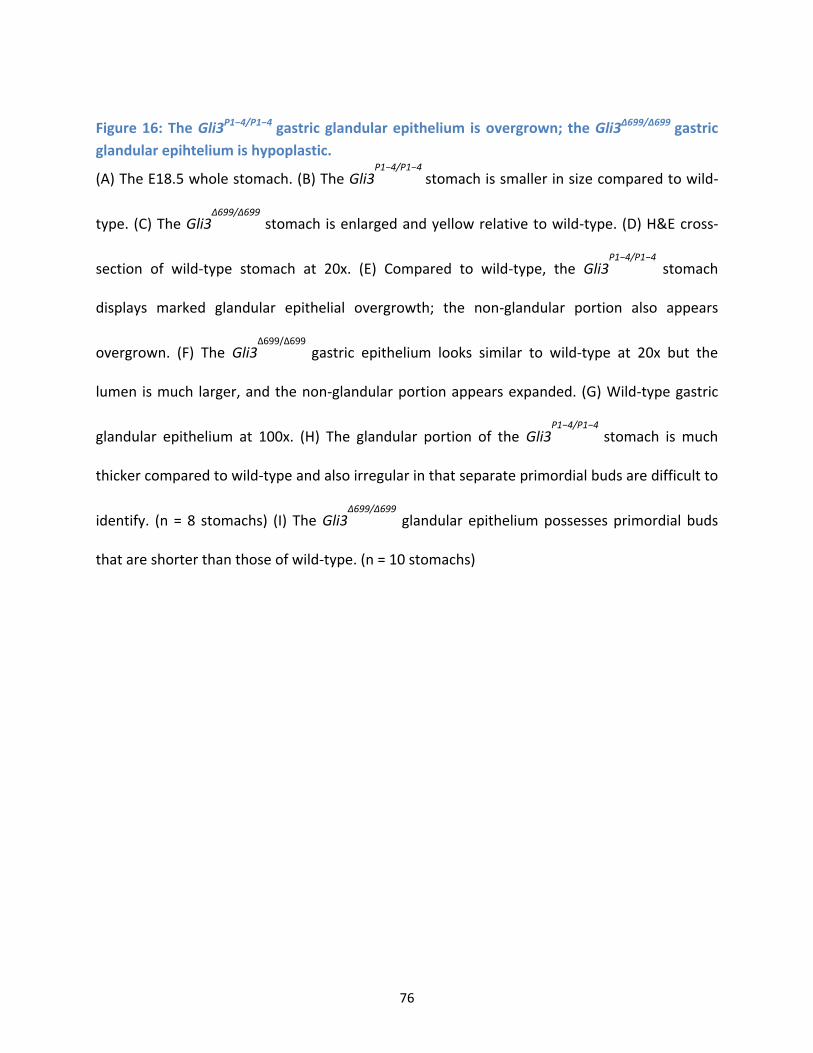
76
Figure 16: The Gli3P1−4/P1−4 gastric glandular epithelium is overgrown; the Gli3Δ699/Δ699 gastric
glandular epihtelium is hypoplastic.
(A) The E18.5 whole stomach. (B) The Gli3P1−4/P1−4
stomach is smaller in size compared to wild-
type. (C) The Gli3Δ699/Δ699
stomach is enlarged and yellow relative to wild-type. (D) H&E cross-
section of wild-type stomach at 20x. (E) Compared to wild-type, the Gli3P1−4/P1−4
stomach
displays marked glandular epithelial overgrowth; the non-glandular portion also appears
overgrown. (F) The Gli3Δ699/Δ699
gastric epithelium looks similar to wild-type at 20x but the
lumen is much larger, and the non-glandular portion appears expanded. (G) Wild-type gastric
glandular epithelium at 100x. (H) The glandular portion of the Gli3P1−4/P1−4
stomach is much
thicker compared to wild-type and also irregular in that separate primordial buds are difficult to
identify. (n = 8 stomachs) (I) The Gli3Δ699/Δ699
glandular epithelium possesses primordial buds
that are shorter than those of wild-type. (n = 10 stomachs)

77
Figure 17: The major epithelial cell types in the Gli3P1−4/P1−4 and Gli3Δ699/Δ699 stomachs.
(See next page for full caption)

78
Figure 17: The major epithelial cell types in the Gli3P1−4/P1−4 and Gli3Δ699/Δ699 stomachs.
(A) Expression of entero-endocrine cells (in pink) in the wild-type gastric glandular epithelium.
Entero-endocrine cells are normally found scattered throughout the pit-gland of the entire GE.
(B) The Gli3P1−4/P1−4 stomach and (C) the Gli3Δ699/Δ699 displayed what appears to be a regular
distribution of entero-endocrine cells. (D) Parietal cells (in pink) are scattered throughout the
pit-glands of the body region of the stomach. (E) Compared to wild-type, the parietal cell
distribution appears relatively normal in the Gli3P1−4/P1−4 stomach and (F) the Gli3Δ699/Δ699
stomach. (G) Chief cells (in green) can be found at the base of the glands in the antral region of
the wild-type stomach. (H-I) Compared to wild-type, the chief cell expression domain and
quantity relative to wild-type appears to be unaltered. (J) PAS stains mucous-producing pit cells
a deep pink, as seen on the pit surfaces of the wild-type gastric GE. (K) In the Gli3P1−4/P1−4 gastric
glandular epithelium, PAS-positive cells lined its pit surfaces. (L) In the Gli3Δ699/Δ699 glandular
epithelium, PAS-positive cells appeared to be completely absent. (M) The ratio of entero-
endocrine cells to total cells in the Gli3P1−4/P1−4and Gli3Δ699/Δ699 stomachs is not significantly
different compared to wild-type. (P1-4: n = 4 stomachs; Δ699: n = 7 stomachs, P<0.05 for both)
(N) The ratio of parietal cells to total cells is not significantly different in the Gli3P1−4/P1−4
stomach compared to wild-type; however, the ratio is significantly decreased by a factor of
0.57 in the Gli3Δ699/Δ699 stomach. (P1-4: n = 4 stomachs; Δ699: n = 6 stomachs, P<0.05 for both)

79
Figure 18: The Gli3P1−4/P1−4 gastric circular smooth muscle is thicker relative to wild-type, and that of the Gli3Δ699/Δ699 stomach is
thinner.
(A) Circular smooth muscle (in pink) in the wild-type glandular stomach. (B) Compared to wild-type, the Gli3P1−4/P1−4 stomach has
a thicker circular SM. (C) The Gli3Δ699/Δ699 has a thinner circular SM layer and looks irregular. (D) Quantitative analysis showed the
differences in circular SM thickness were statistically significant. The Gli3P1−4/P1−4 stomach had a circular SM 2.26 ± 0.15 thicker
than that of wild-type; the Gli3Δ699/Δ699 had a 0.85 ± 0.05 times thinner circular SM layer compared to wild-type. (n = 4 stomachs,
P<0.05 for both)

80
4.3.2 Molecular analysis of the Gli3P1−4/P1−4 and Gli3Δ699/Δ699 mouse
stomachs
The abnormal phenotypes of both the Gli3P1−4/P1−4
and Gli3Δ699/Δ699
stomachs demonstrate that
both the Gli3 repressor and activator have important, though distinct functions in the developing
murine stomach.
To better understand what their roles were, and the mechanisms underlying the glandular
hyperplasia and hypoplasia observed in the Gli3P1−4/P1−4
stomach and Gli3Δ699/Δ699
stomach,
respectively, I first examined whether proliferation and apoptosis rates were altered. For
proliferation, I analyzed for M-phase activity in the cell cycle, via the Histone-3-Phospho (S10)
antibody. For apoptosis, I used the TUNEL assay to label apoptotic cells. Cell-counting was also
performed, and the results are shown below in Figure 19.
The Gli3P1−4/P1−4
stomach displayed a 1.27 ± 0.38 times higher proportion of proliferative
cells compared to its wild-type littermate. Five mutant stomachs and five wild-type stomachs
were used, and this result was not significant. The TUNEL assay revealed that the apoptotic rate
was reduced in the mutant stomach by 0.74 ± 0.56 relative to wild-type. This result was also not
significant; three mutant and four wild-type stomachs were used for statistical analysis. However,
more stomachs need to be evaluated, as the sample size was too small to yield a reliable result.
The results for the Gli3Δ699/Δ699
stomach show that the proliferation rate was 0.93 ± 0.23
that of wild-type. Having evaluated six mutant and six wild-type stomachs, this result was
determined to not be statistically significant. The TUNEL assay results showed that the apoptotic

81
rate was 3.58 ± 1.41 times higher in the mutant stomach compared to wild-type. Stomachs of
both mutant and wild-type littermates were used, and this result was statistically significant.
The Gli3P1−4/P1−4
stomach did not display a marked change in both proliferation and
apoptotic rates. The proliferation rate in the Gli3Δ699/Δ699
stomach was unaltered, but the apoptotic
rate was significantly increased compared to wild-type. Even though this is the only significant
result, it should be noted that the proportion of proliferating cells-to-total cells is about five-to-
ten-fold greater than the proportion of apoptotic cells-to-total cells.
Next, I looked at the GLI3-190 and GLI3-83 levels by western blot in the E18.5
Gli3P1−4/P1−4
whole stomach, to confirm that only Gli3 full-length was present in the stomach.
The GLI3-190 is the full-length form of Gli3, and it functions as an activator; the GLI3-83 is the
truncated form of Gli3, and it is considered to carry out the repressor function of Gli3. The
western blot results are shown in Figure 20.
The wild-type stomach displayed expression of both full-length and truncated GLI3,
though the expression was much stronger for GLI3-190, demonstrating that more GLI3 activator
is present in the E18.5 wild-type stomach than GLI3 repressor. GLI3-83 protein was absent in
the mutant stomach, and the expression of GLI3-190 was stronger in the mutant compared to the
wild-type, indicating that more GLI3 activator was being made in the Gli3P1−4/P1−4
whole
stomach than wild-type.
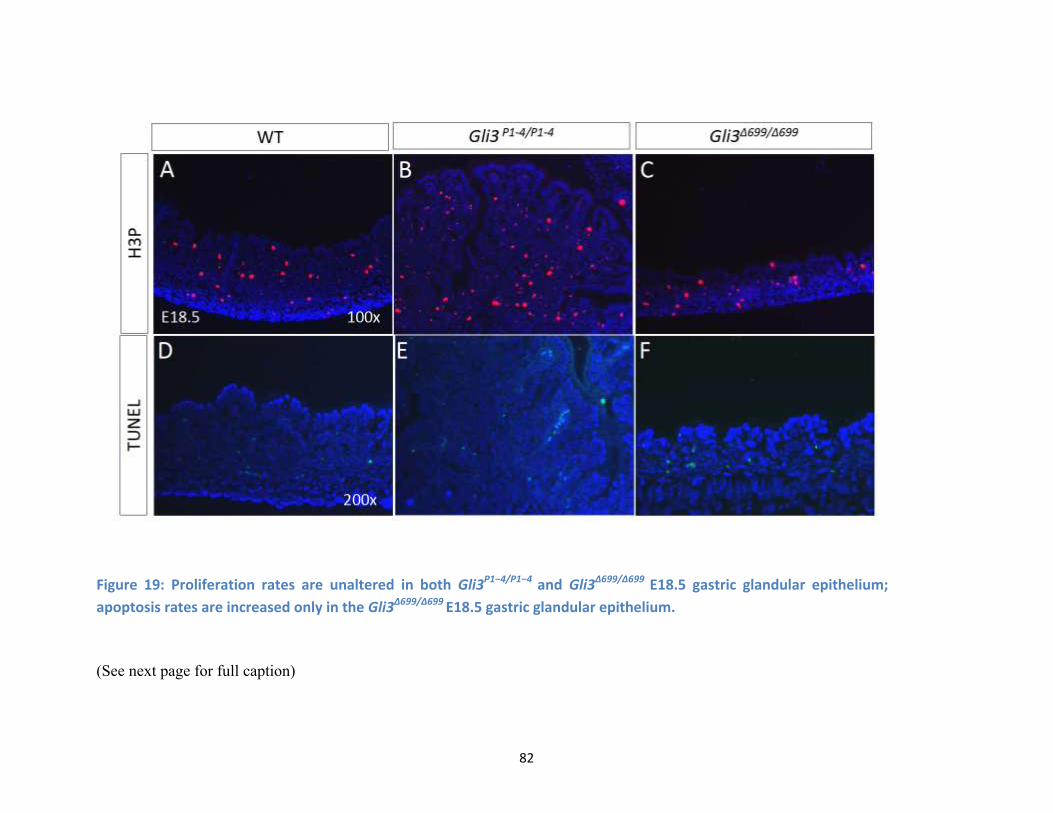
82
Figure 19: Proliferation rates are unaltered in both Gli3P1−4/P1−4 and Gli3Δ699/Δ699 E18.5 gastric glandular epithelium;
apoptosis rates are increased only in the Gli3Δ699/Δ699 E18.5 gastric glandular epithelium.
(See next page for full caption)

83
Figure 19: Proliferation rates are unaltered in both Gli3P1−4/P1−4 and Gli3Δ699/Δ699 E18.5 gastric
glandular epithelium; apoptosis rates are increased only in the Gli3Δ699/Δ699 E18.5 gastric
glandular epithelium.
(A) Expression of proliferating cells in the wild-type E18.5 gastric glandular epithelium. (B)
Expression of proliferating cells in the Gli3P1−4/P1−4 and (C) Gli3Δ699/Δ699 E18.5 gastric glandular
epithelium. (D) Expression of apoptotic cells (in green) in the wild-type glandular epithelium;
much less cells are positive for apoptosis than proliferation. (E) Expression of apoptotic cells in
the Gli3P1−4/P1−4 and (F) Gli3Δ699/Δ699 E18.5 gastric glandular epithelium. (G) Quantitation of
proliferating cells reveals that the Gli3P1−4/P1−4 glandular epithelium displays a non-significant
1.27 ± 0.38 factor increase in proliferating-to-total cells ratio compared to wild-type (n = 5
stomachs, P<0.05). The Gli3Δ699/Δ699 glandular epithelium shows a 0.93 ± 0.23 factor decrease in
proliferation rate, and this result is not significant. (n = 6 stomachs, P<0.05) (H)The apoptotic
rate in the Gli3P1−4/P1−4 glandular epithelium is slightly decreased by a factor of 0.74 ± 0.56,
though not enough to be significant (n = 3 stomachs, P<0.15); the apoptotic rate is significantly
increased in the Gli3Δ699/Δ699 stomach by a factor of 3.58 ± 1.41. (n = 4 stomachs, P<0.05)

84
Figure 20: The GLI3 full-length level is higher in the Gli3P1−4/P1−4 stomach than
wild-type.
A western blot of the Gli3P1−4/P1−4 stomach and its wild-type litter-mate shows that
not only is it confirmed that no GLI3-83 is present in the Gli3P1−4/P1−4 stomach, but it
also has an increase in the level of GLI3-190 relative to wild-type. (n = 3 stomachs)
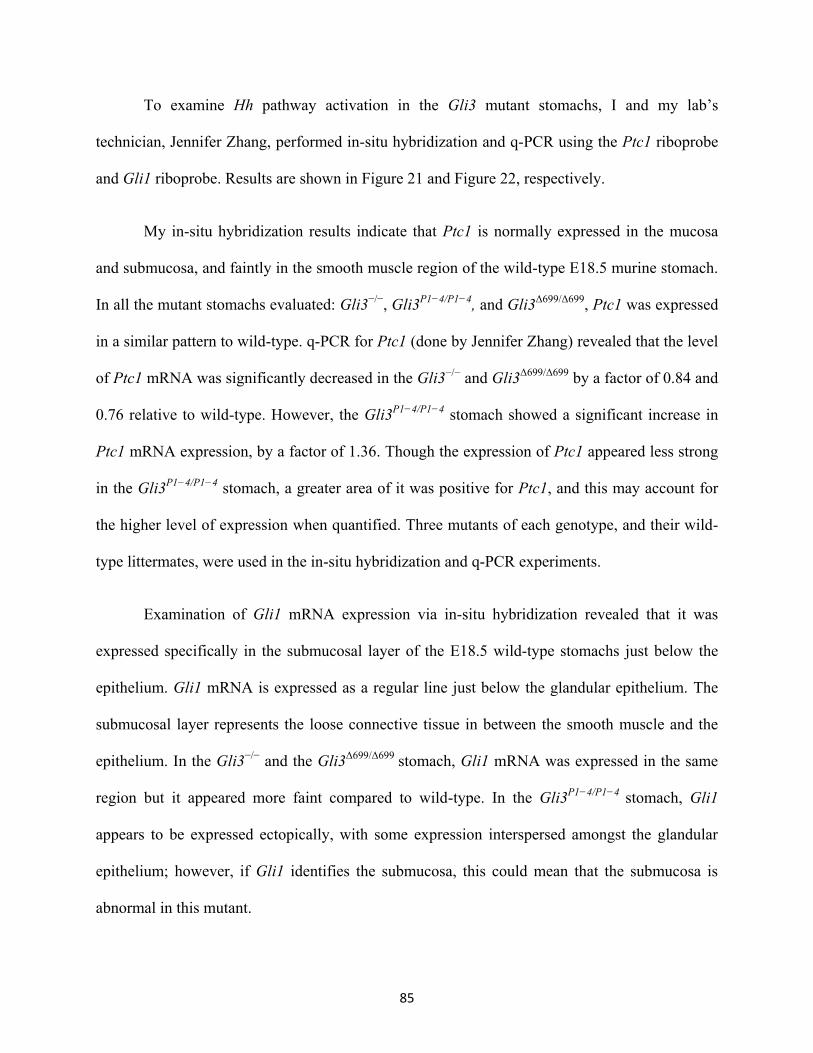
85
To examine Hh pathway activation in the Gli3 mutant stomachs, I and my lab‟s
technician, Jennifer Zhang, performed in-situ hybridization and q-PCR using the Ptc1 riboprobe
and Gli1 riboprobe. Results are shown in Figure 21 and Figure 22, respectively.
My in-situ hybridization results indicate that Ptc1 is normally expressed in the mucosa
and submucosa, and faintly in the smooth muscle region of the wild-type E18.5 murine stomach.
In all the mutant stomachs evaluated: Gli3−/−
, Gli3P1−4/P1−4
, and Gli3Δ699/Δ699
, Ptc1 was expressed
in a similar pattern to wild-type. q-PCR for Ptc1 (done by Jennifer Zhang) revealed that the level
of Ptc1 mRNA was significantly decreased in the Gli3−/−
and Gli3Δ699/Δ699
by a factor of 0.84 and
0.76 relative to wild-type. However, the Gli3P1−4/P1−4
stomach showed a significant increase in
Ptc1 mRNA expression, by a factor of 1.36. Though the expression of Ptc1 appeared less strong
in the Gli3P1−4/P1−4
stomach, a greater area of it was positive for Ptc1, and this may account for
the higher level of expression when quantified. Three mutants of each genotype, and their wild-
type littermates, were used in the in-situ hybridization and q-PCR experiments.
Examination of Gli1 mRNA expression via in-situ hybridization revealed that it was
expressed specifically in the submucosal layer of the E18.5 wild-type stomachs just below the
epithelium. Gli1 mRNA is expressed as a regular line just below the glandular epithelium. The
submucosal layer represents the loose connective tissue in between the smooth muscle and the
epithelium. In the Gli3−/−
and the Gli3Δ699/Δ699
stomach, Gli1 mRNA was expressed in the same
region but it appeared more faint compared to wild-type. In the Gli3P1−4/P1−4
stomach, Gli1
appears to be expressed ectopically, with some expression interspersed amongst the glandular
epithelium; however, if Gli1 identifies the submucosa, this could mean that the submucosa is
abnormal in this mutant.
86
Gli1 mRNA levels were measured by q-PCR (done by Jennifer Zhang). Compared to
wild-type, the level of Gli1 was significantly decreased in the Gli3−/−
and the Gli3Δ699/Δ699
stomach, by a factor of 0.55 and 0.31, respectively. Contrastingly, the Gli3P1−4/P1−4
stomach
showed a significant upregulation in the expression of Gli1 by a factor of 1.20. These q-PCR
results correspond to the in-situ hybridization results obtained. Three stomachs of both mutant
and their wild-type littermates were used for each experiment.
The Ptc1 and Gli1 in-situ and q-PCR results put together, support the conclusion that the
Shh pathway is less active in the Gli3−/−
and Gli3Δ699/Δ699
stomachs compared to wild-type,
though least activated in the Gli3Δ699/Δ699
stomach. At the same time, Shh pathway activity is up-
regulated in the Gli3P1−4/P1−4
stomach.
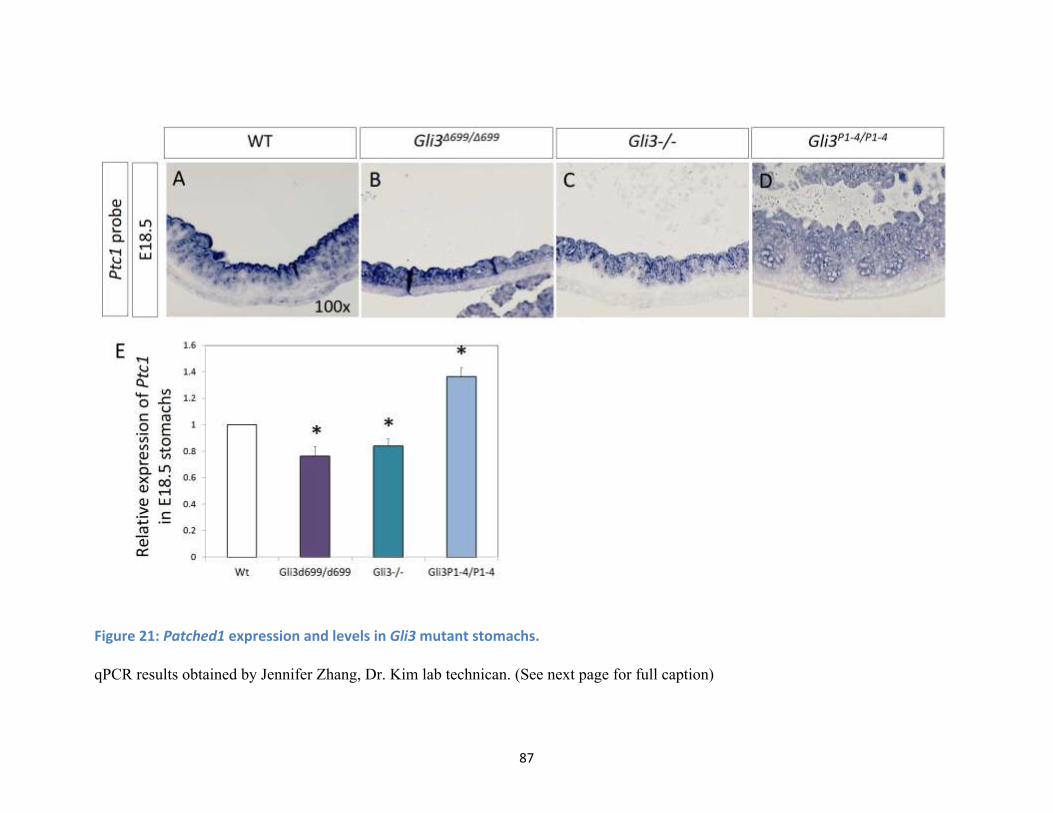
87
Figure 21: Patched1 expression and levels in Gli3 mutant stomachs.
qPCR results obtained by Jennifer Zhang, Dr. Kim lab technican. (See next page for full caption)
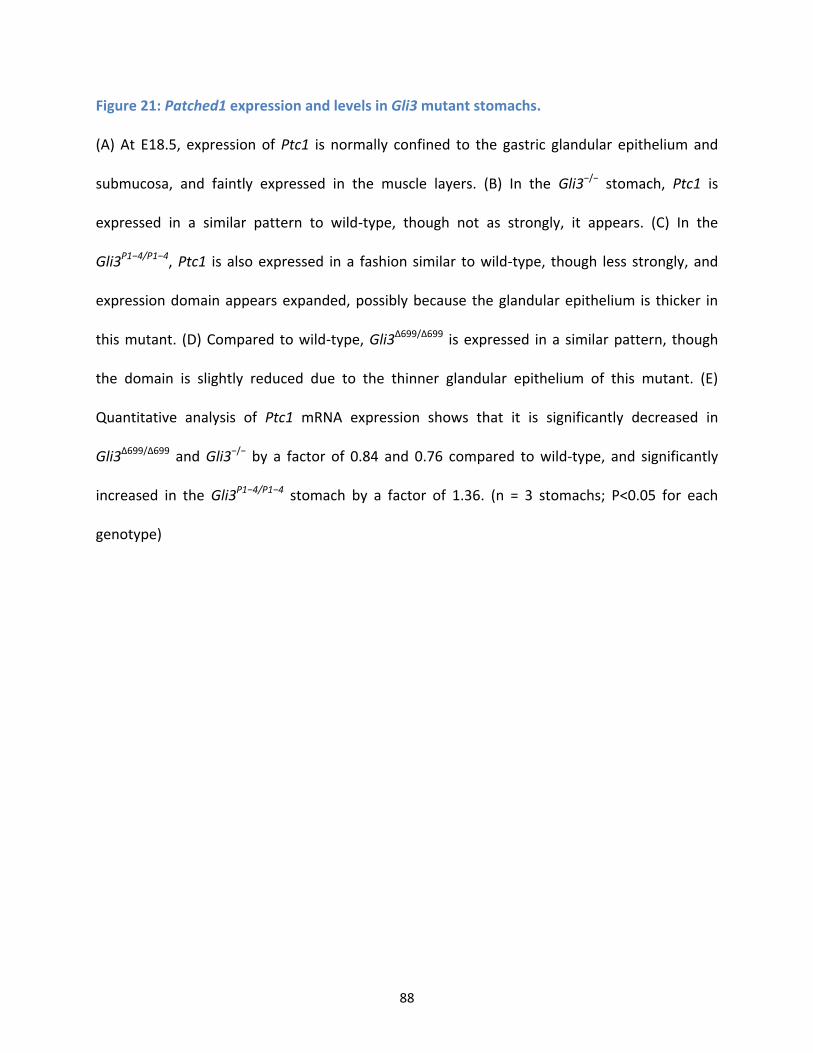
88
Figure 21: Patched1 expression and levels in Gli3 mutant stomachs.
(A) At E18.5, expression of Ptc1 is normally confined to the gastric glandular epithelium and
submucosa, and faintly expressed in the muscle layers. (B) In the Gli3−/− stomach, Ptc1 is
expressed in a similar pattern to wild-type, though not as strongly, it appears. (C) In the
Gli3P1−4/P1−4, Ptc1 is also expressed in a fashion similar to wild-type, though less strongly, and
expression domain appears expanded, possibly because the glandular epithelium is thicker in
this mutant. (D) Compared to wild-type, Gli3Δ699/Δ699 is expressed in a similar pattern, though
the domain is slightly reduced due to the thinner glandular epithelium of this mutant. (E)
Quantitative analysis of Ptc1 mRNA expression shows that it is significantly decreased in
Gli3Δ699/Δ699 and Gli3−/− by a factor of 0.84 and 0.76 compared to wild-type, and significantly
increased in the Gli3P1−4/P1−4 stomach by a factor of 1.36. (n = 3 stomachs; P<0.05 for each
genotype)
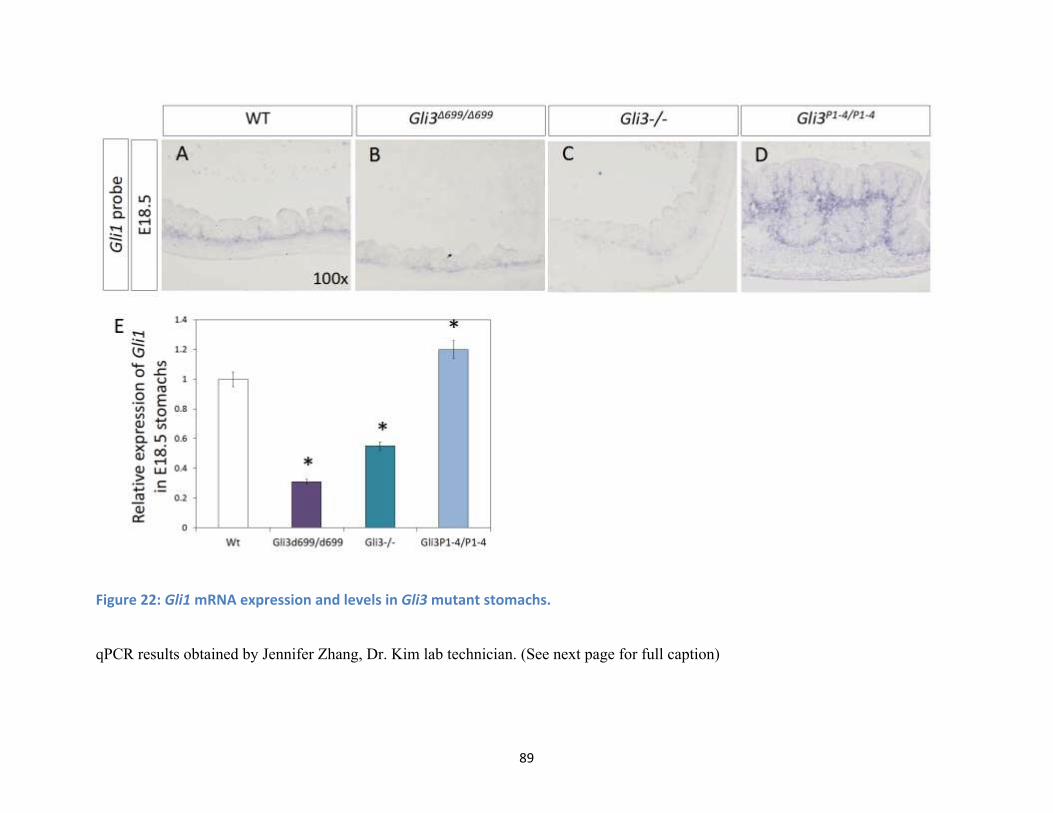
89
Figure 22: Gli1 mRNA expression and levels in Gli3 mutant stomachs.
qPCR results obtained by Jennifer Zhang, Dr. Kim lab technician. (See next page for full caption)
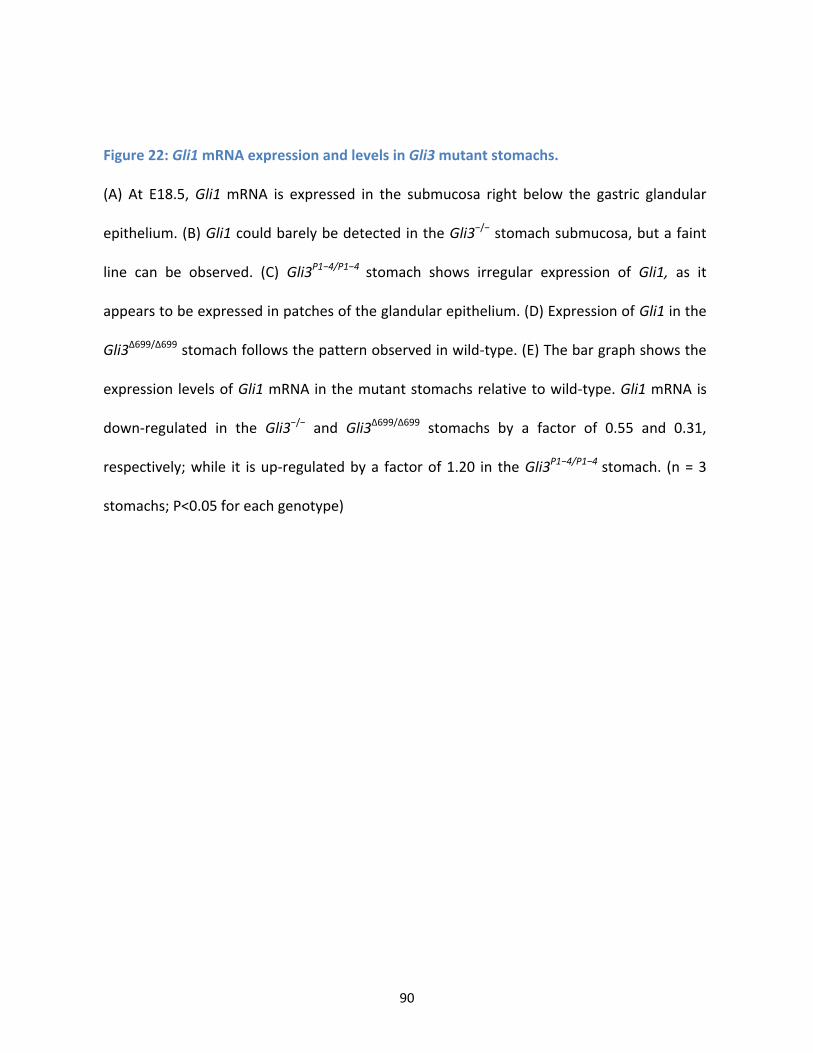
90
Figure 22: Gli1 mRNA expression and levels in Gli3 mutant stomachs.
(A) At E18.5, Gli1 mRNA is expressed in the submucosa right below the gastric glandular
epithelium. (B) Gli1 could barely be detected in the Gli3−/− stomach submucosa, but a faint
line can be observed. (C) Gli3P1−4/P1−4 stomach shows irregular expression of Gli1, as it
appears to be expressed in patches of the glandular epithelium. (D) Expression of Gli1 in the
Gli3Δ699/Δ699 stomach follows the pattern observed in wild-type. (E) The bar graph shows the
expression levels of Gli1 mRNA in the mutant stomachs relative to wild-type. Gli1 mRNA is
down-regulated in the Gli3−/− and Gli3Δ699/Δ699 stomachs by a factor of 0.55 and 0.31,
respectively; while it is up-regulated by a factor of 1.20 in the Gli3P1−4/P1−4 stomach. (n = 3
stomachs; P<0.05 for each genotype)

91
4.4 Analysis of the Kif7−/− stomach.
I established that in the Gli3P1−4/P1−4
stomach, where Gli3 activator, but not repressor is
expressed, glandular epithelial hyperplasia is observed; in the Gli3Δ699/Δ699
stomach, where Gli3
repressor, but not activator is expressed, glandular epithelial hypoplasia is observed. To test the
working hypothesis that glandular epithelial thickness varies depending on the balance between
Gli3 activator and repressor, we obtained a third mouse model. I utilized the Kif7−/−
mouse
model, where loss of Kif7 function in the whole embryo results in a de-regulation of the Gli
transcription factors, and ultimately, an altered balance that favours the Gli activators over the
repressors.
The Kif7−/−
E18.5 embryo was similar in size to wild-type, and was identified by its
exencephaly, polydactyly, and bloody embryonic sac. Upon dissecting out its stomach, it was
noted that the stomach was smaller relative to wild-type. In more than half of the eighteen
stomachs taken out, there was blood within the lumen, suggesting that internal bleeding was
occurring (Figure 23B). After the Kif7−/−
stomach cross-sections were stained with H&E, it was
observed that the Kif7−/−
gastric glandular epithelium was overgrown relative to wild-type, as
seen in (Figure 23D&F). This phenotype was consistent amongst the seven stomachs evaluated
histologically. However, this overgrowth was notably not as severe as in the Gli3P1−4/P1−4
stomach when compared at the same magnification.
Next, to evaluate if gastric identity of the Kif7−/−
stomach was altered since the glandular
epithelial thickness was, I stained for the four major glandular epithelial cell types as was done
earlier, and the results are shown in Figure 24.

92
Immunofluorescence staining revealed that all the cell types: entero-endocrine cells,
parietal cells, chief cells, and mucous-producing cells, are present and expressed in the correct
regions of the stomach. When the entero-endocrine and parietal cells were quantified, the
proportion of entero-endocrine-to-total cells was significantly decreased by a factor of 0.66 ±
0.14. Five mutant and six wild-type stomachs were used for this measurement. The ratio of
parietal-to-total cells was not significantly altered, being a ratio of 0.90 ± 0.28 that of wild-type;
four of both mutant and wild-type stomachs were used in this analysis.
Next, since all other Hh mutant stomachs displayed altered circular smooth muscle
thickness, I evaluated the circular SM of the Kif7−/−
stomach (refer to Figure 25). My results
indicated that the circular SM of the Kif7−/−
stomach was 1.63 ± 0.08 times greater thickness in
compared to its wild-type counterpart; five mutants and six wild-types were used for this
calculation.
Quantitation of the proliferation rate of epithelial cells (seen in Figure 26) revealed no
significant difference compared to wild-type; the ratio of proliferative cells to total cells in the
Kif7 null gastric epithelium was 0.94 ± 0.13 that of wild-type. Five mutant and wild-type
stomachs were used in this calculation. Therefore, I conclude that the overgrowth is not a result
of an increased number of proliferative cells.
Given that the Kif7−/−
stomach displays glandular overgrowth, Ihypothesized that the
GLI3 activator-to-repressor ratio was also higher in the mutant stomach. The Kif7−/−
E10.5 whole
embryo contains a higher GLI3 activator-to-repressor ratio compared to wild-type, with a higher
GLI2 full-length level, and a lower GLI3 level [9]. Stomach-specific protein expression of the
two GLI3 forms has not been previously evaluated in the Kif7−/−
stomach; thus, Iperformed

93
western blots on the Kif7 null stomachs and their wild-type litter-mates, and the result is shown
in Figure 27. Three wild-type and mutant stomachs were used. Idiscovered that relative to wild-
type, the GLI3-190 was over-expressed, moreover, GLI3-83 was down-regulated. This means
that in the Kif7−/−
stomach, more Gli3 activator and less Gli3 repressor was being produced
compared to wild-type; in essence, the balance between Gli3 activator and repressor was
favouring the activator in the Kif7−/−
stomach.

94
Figure 23: The Kif7−/− stomach displays glandular epithelial hyperplasia.
(A) A wild-type E18.5 stomach. (B) The Kif7−/−
stomach is significantly smaller compared to
wild-type; the brown colouring is blood in the gastric lumen. (C) & (D) The lumen within the
Kif7−/−
stomach is smaller relative to wild-type (left), and the entire gastric epithelium
appears overgrown. (E) & (F) The Kif7−/−
gastric glandular epithelium displays overgrowth
compared to wild-type. (n = 7 stomachs)
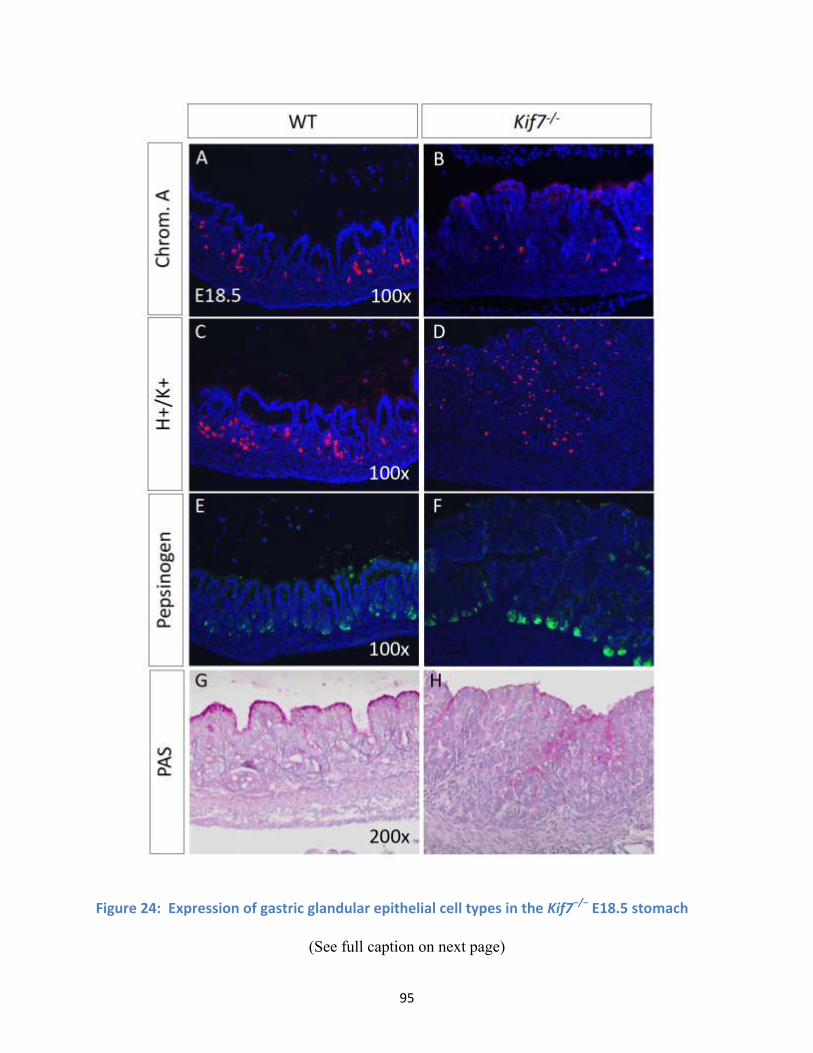
95
Figure 24: Expression of gastric glandular epithelial cell types in the Kif7−/− E18.5 stomach
(See full caption on next page)
96
Figure 24: Expression of gastric glandular epithelial cell types in the Kif7−/− E18.5 stomach
(A) & (B) Entero-endocrine cells are localized to the correct region in the Kif7−/− stomach
glandular epithelium, though they appear less abundant. (C) & (D) Parietal cells are
expressed in a similar pattern to that in the wild-type. (E) & (F) Chief cells are localized to the
base of the antral region of the Kif7−/− stomach, like in the wild-type. (G) & (H) The surfaces
of the pits of the Kif7−/− glandular stomach stained bright pink, indicating the presence of
mucous-producing cells. (I) Quantification of the proportion of entero-endocrine-to-total
cells shows that it is decreased in the Kif7−/− stomach, by a factor of 0.66. (n = 5 stomachs,
P<0.05) (J) Quantification of the proportion of parietal-to-total cells shows that it is not
significantly altered in the Kif7−/− stomach. (n = 4 stomachs, P<0.05)

97
Figure 25: The circular smooth muscle in the Kif7−/− E18.5 stomach is thicker relative to
wild-type.
(A) Circular smooth muscle layer labeled in pink (the thickest line) in the E18.5 wild-type
glandular portion of the stomach. (B) Compared to wild-type, the Kif7−/− stomach displays
what appears to be a slightly thicker circular smooth muscle layer. (C) Quantitation of the
width of the circular SM revealed that it is significantly thicker in the mutant stomach, by a
factor of 1.63 ± 0.08. (n = 5 stomachs, P<0.05)
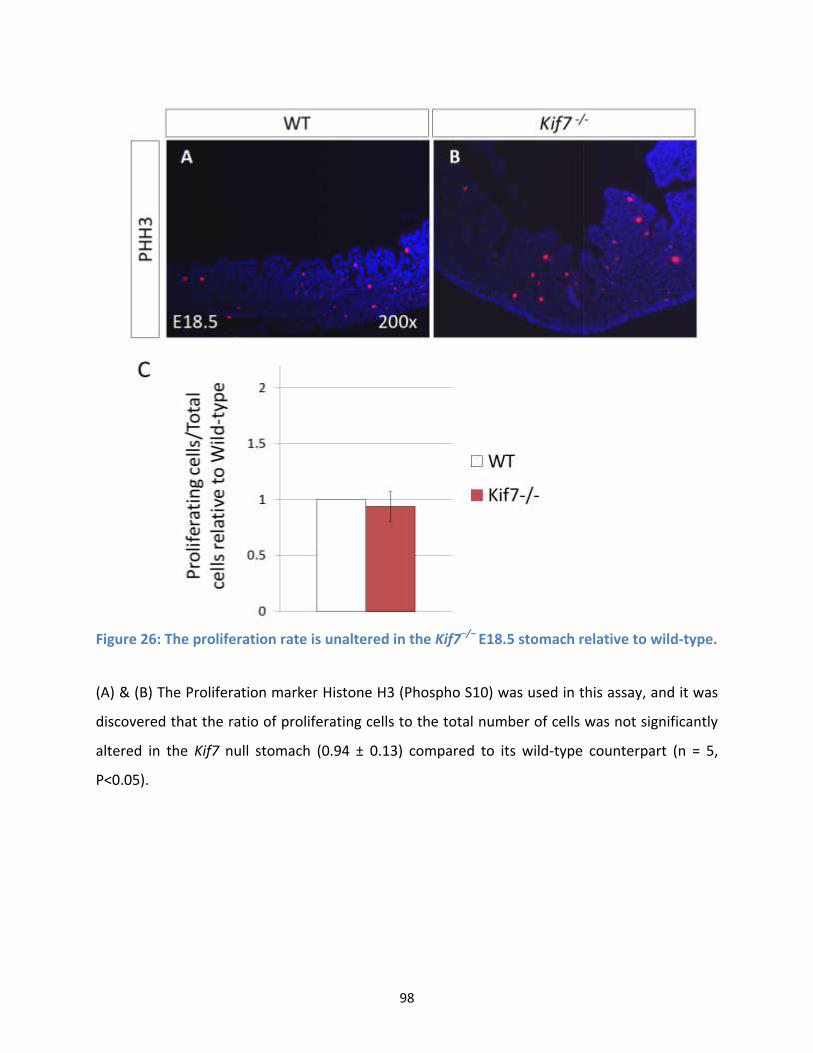
98
Figure 26: The proliferation rate is unaltered in the Kif7−/− E18.5 stomach relative to wild-type.
(A) & (B) The Proliferation marker Histone H3 (Phospho S10) was used in this assay, and it was
discovered that the ratio of proliferating cells to the total number of cells was not significantly
altered in the Kif7 null stomach (0.94 ± 0.13) compared to its wild-type counterpart (n = 5,
P<0.05).
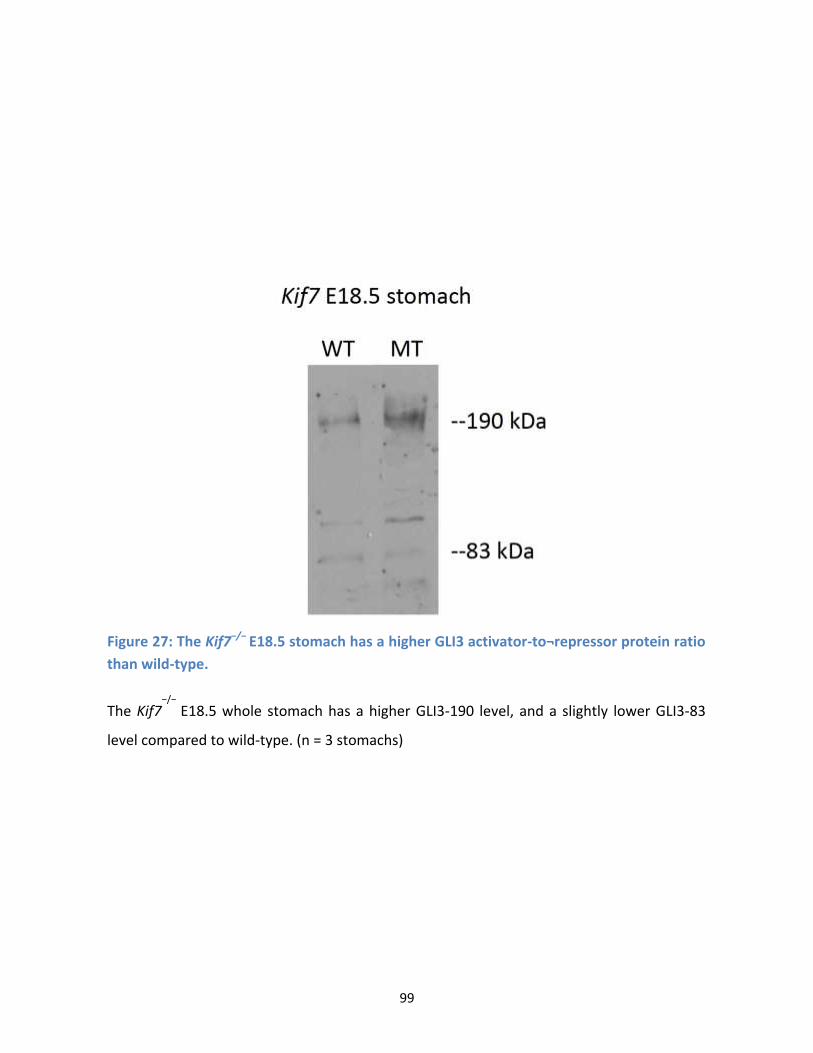
99
Figure 27: The Kif7−/− E18.5 stomach has a higher GLI3 activator-to¬repressor protein ratio
than wild-type.
The Kif7−/−
E18.5 whole stomach has a higher GLI3-190 level, and a slightly lower GLI3-83
level compared to wild-type. (n = 3 stomachs)

100
4.5 Discussion
4.5.1 Circular smooth muscle layer is affected in all mutants
I found that all the Hh mutants tested in this study had a significantly thicker circular smooth
muscle relative to wild-type, excluding Gli3Δ699/Δ699
, which had a thinner circular SM. Shh has
been shown to be responsible for patterning of the radial axis of the GI tract [49]. Epithelial
mesenchymal-interactions are crucial in gut morphogenesis; disruption of the Shh signal results
in the induction of smooth muscle differentiation, suggesting that the endodermal epithelium
normally serves to inhibit differentiation of smooth muscle [49]. All gut mesenchymal cells are
capable of differentiating into smooth muscle cells, and it is the Shh signal in the endoderm that
suppresses this differentiation [49]. Therefore, it is expected that knocking out Shh or altering the
expression of its downstream targets would result in an altered layer of circular smooth muscle.
Hh signals are carried between the epithelium and mesenchyme [30] [51]. Thus, though Shh is
expressed only in the gastric epithelium, while Gli3 is expressed only in the gastric mesenchyme,
it was observed that both the Shh and Gli3 null stomachs display defects in both the epithelial
and circular smooth muscle layer.
Though the glandular epithelial phenotype of the Gli3−/−
stomach was quite apparent and
that of the Gli2−/−
stomach was very mild, I observed that the circular smooth muscle thickness is
significantly increased in the Gli2−/−
stomach. This could indicate a differential expression of
Gli2 and Gli3 in the different layers of the stomach. Gli2 may not exert an important function in
the gastric GE because it is not expressed there, and instead may play a larger role in regulating

101
smooth muscle development, as it may be expressed in the mesenchyme. However, this requires
further examination.
4.5.2 Glandular epithelial thickness depends on the balance of Gli3
activator and repressor
The Gli2−/−
gastric glandular epithelium displayed minimal changes compared to wild-type,
while the Gli3−/−
stomach displayed marked overgrowth; this overgrowth is reminiscent of the
phenotype observed in the Shh−/−
stomach, though on average, to not as severe an extent. This
demonstrates that the Shh signal is mediated through the Gli3 transcription factor. However,
since the Gli3−/−
stomach phenotype is not as severe as that of the Shh−/−
, this would suggest that
other downstream effectors may be involved in mediating the Shh signal normally, or that Gli2 is
partially compensating for the action of Gli3 in the absence of Gli3 in the developing stomach.
The relative level of glandular epithelial thickness depends on a comparison amongst the
mutants and wild-type at the same magnification. Figure 28 shows pictures taken at the same
magnification of the glandular stomach of the Gli3 mutants and Kif7−/−
surveyed in my study.
The Gli3P1−4/P1−4
glandular epithelium is the most overgrown, followed by that of Kif7−/−
and
then Gli3−/−
. The Gli3Δ699/Δ699
stomach has the opposite phenotype - glandular hypoplasia. These
findings demonstrate that gastric glandular epithelial thickness hinges on the balance between
Gli3 activator and repressor. When only Gli3 activator is present, as in the Gli3P1−4/P1−4
stomach,
the greatest glandular overgrowth is observed. When there is more Gli3 activator and less Gli3
repressor than normal, as in the Kif7−/−
stomach, a milder overgrowth is seen. When there is no
Gli3 activator or repressor, Isee an even milder glandular overgrowth. This is the case for the
Gli3−/−
stomach. Furthermore, when only Gli3 repressor but not activator is being produced, as in

102
the Gli3Δ699/Δ699
stomach, I observe glandular hypoplasia. Figure 28 depicts my working model
of Gli3 action in the developing murine stomach.
4.5.3 How does Gli3 regulate gastric glandular epithelial thickness?
Ablation of the Shh signal results in the processiing of GLI3 to its truncated repressor form [36];
therefore, one would expect that the Shh−/−
stomach would have a similar phenotype to the
Gli3Δ699/Δ699
stomach. Surprisingly, I found that the two stomachs had opposite phenotypes: one
with hyperplasia, the other with hypoplasia. My q-PCR results using the Ptc1 and Gli1 mRNA
probes as markers for Hh pathway activation, revealed that in the Gli3Δ699/Δ699
stomachs, there
was decreased Hh pathway activity. Kim et. al [24] performed the same experiment on the Shh−/−
stomach, and their results indicated a decreased Hh pathway acitivity as well. Though both
stomachs had a similar Hh pathway expression profile, I see that their phenotypes do not
coincide with each other. Furthermore, the Gli3P1−4/P1−4
stomach, which had a similar phenotype
as the Shh−/−
stomach, showed an upregulated Hh pathway activation. The level of Hh pathway
activity does not appear to correlate to the degree of glandular overgrowth, however, the balance
between Gli3 activator and repressor does. This indicates that the Gli3 transcription factor may
be acting independent of the Shh signal, which is not altogether unexpected, as it has been shown
to act independently elsewhere [57]. This may also suggest that the Hh pathway mediators may
be exerting control on gastric morphogensis through interaction with other signaling networks.
Shh is normally a proliferative signal, and lack of this signal may account for the overall
smaller size of the stomach, however, lack of the Shh signal also appeared to result in glandular
epithelial hyperplasia [24]. Past studies have established that the proliferation rates in the Shh−/−
,
Gli2−/−
, and Gli3
−/− mouse stomachs are unaltered [24] [44]. My study has shown that the

103
proliferation rates for Gli3P1−4/P1−4
, Gli3Δ699/Δ699
, and Kif7−/−
stomachs are also unaltered relative
to wild-type. Put together, these results strongly suggest that the Hedgehog pathway does not
influence proliferation rates in the developing murine stomach. Therefore, it must utilize a
different mechanism to bring about the glandular hyperplastic and hypoplastic phenotypes
observed in Hh mutants.
Instead, Gli3 may be involved in controlling apoptotic rates and the level of pit-
branching. Kim et. al [24] concluded that the overgrowth observed in the Shh−/−
and Gli3−/−
stomachs was due to a reduction in apoptotic cells compared to wild-type. My study indicated no
significant difference in the apoptotic rate of the Gli3P1−4/P1−4
E18.5 stomach relative to wild-
type, while a significant increase in apoptotic rate was detected in the Gli3Δ699/Δ699
stomach.
However, more work, such as staining with additional markers, needs to be done to confirm
these results.
Excessive pit-branching can be observed in the Gli3P1−4/P1−4
and Kif7
−/− stomachs by
H&E (top) and α-smooth muscle Actin staining (bottom), in Figure 29. In the top panels, the
light purple staining between the epithelium and smooth muscle denotes the submucosal layer. In
the wild-type stomach, this layer is regular and flat. However, in the mutant stomachs, this layer
is jagged and in some parts of the glandular stomach, it extends upwards into the epithelium. The
branching of these pits can be described as though the submucosa was folded onto itself, and the
pit-glands extend outwards from these folds. The bottom panels show ectopic expression of α-
smooth muscle actin in the mutant stomachs, indicating the presence of muscle fibers in areas
where only glandular epithelia should exist. This leads me to conclude that a balance in favour of
the Gli3 activator results in a greater degree of pit-branching in the gastric glandular epithelium.
Increased pit-branching may be a consequence of the irregular folding of the connective tissue

104
layer lying just underneath. It should be noted that Gli1, a downstream target of Gli3, is localized
to the submucosa of the stomach, and therefore Gli3 could be acting on the submucosal layer to
increase its degree of folding.
A smaller overall size of the stomach is correlated to a thicker gastric epithelium.
Conversely, a larger overall size of the stomach correlates to a thinner gastric epithelium. I
surmise that the Gli3Δ699/Δ699
stomach is distended in part, due to a weakened or thinner layer of
connective tissue and circular smooth muscle. Contrastingly, the Gli3P1−4/P1−4
and Kif7−/−
stomachs appeared more rigid, and this may be because of a thicker connective tissue and
smooth muscle layer.
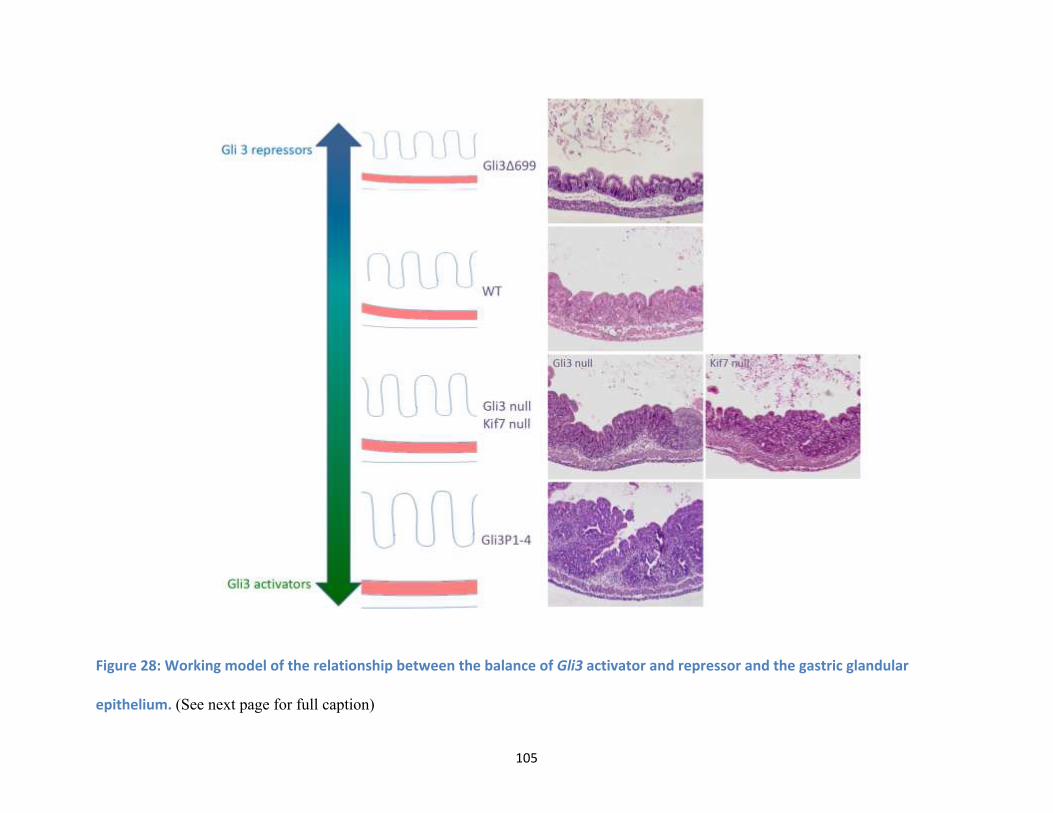
105
Figure 28: Working model of the relationship between the balance of Gli3 activator and repressor and the gastric glandular
epithelium. (See next page for full caption)
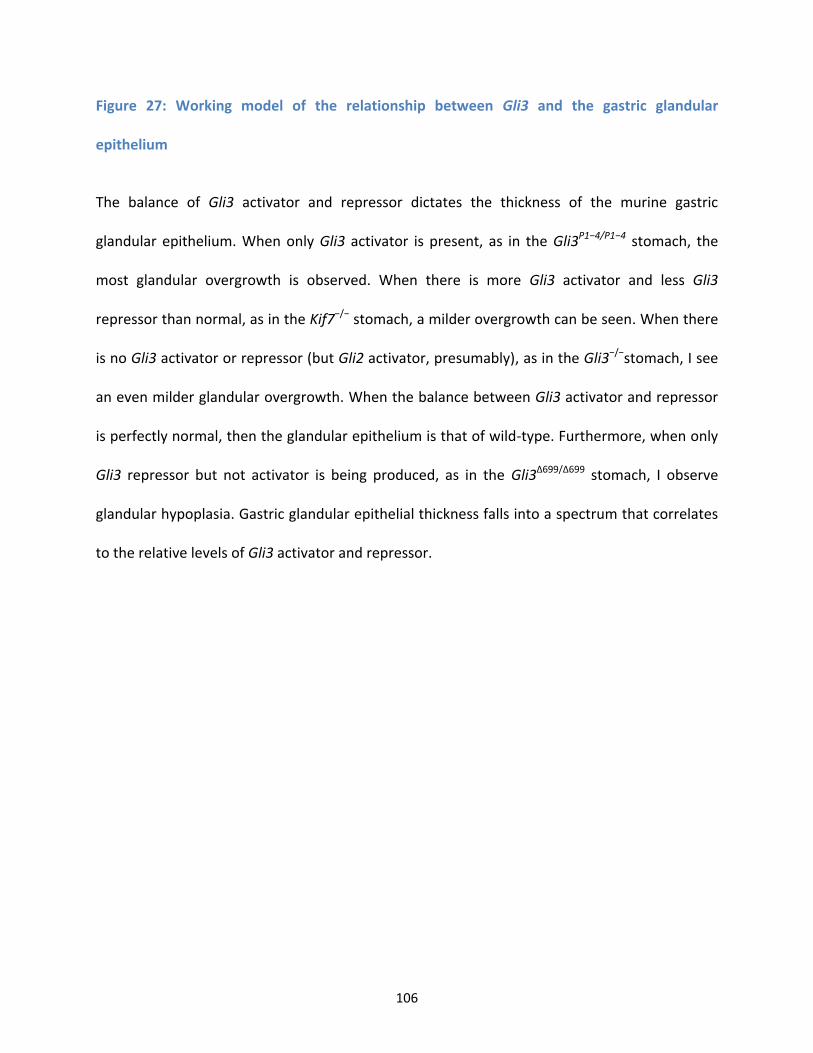
106
Figure 27: Working model of the relationship between Gli3 and the gastric glandular
epithelium
The balance of Gli3 activator and repressor dictates the thickness of the murine gastric
glandular epithelium. When only Gli3 activator is present, as in the Gli3P1−4/P1−4 stomach, the
most glandular overgrowth is observed. When there is more Gli3 activator and less Gli3
repressor than normal, as in the Kif7−/− stomach, a milder overgrowth can be seen. When there
is no Gli3 activator or repressor (but Gli2 activator, presumably), as in the Gli3−/−stomach, I see
an even milder glandular overgrowth. When the balance between Gli3 activator and repressor
is perfectly normal, then the glandular epithelium is that of wild-type. Furthermore, when only
Gli3 repressor but not activator is being produced, as in the Gli3Δ699/Δ699 stomach, I observe
glandular hypoplasia. Gastric glandular epithelial thickness falls into a spectrum that correlates
to the relative levels of Gli3 activator and repressor.

107
Figure 29: Excessive pit-branching appears to contribute to glandular epithelial overgrowth
(A-C) H&E staining reveals that the submucosa of the Gli3P1−4/P1−4 and Kif7−/− stomachs appears folded upon itself. The outcome of
this is that there are pits branching out of these folds, and this pit-branching may contribute to the appearance of a thicker glandular
epithelium. (D-F) α-SM-Actin staining of the stomachs revealed ectopic expression of this marker in regions that should only contain
glandular epithelium, supporting the observation that the submucosa is folded irregularly in the Gli3P1−4/P1−4 and Kif7−/− stomachs.
108
Chapter 5 Conclusions and Future Work
5.1 Conclusion
I propose that Gli3 is the key mediator of Hedgehog signalling in the developing murine
stomach. The balance between the relative levels of Gli3 activator and repressor dictates the
extent of gastric glandular epithelial and circular smooth muscle growth. If the balance is skewed
towards Gli3 activator, then the glandular epithelium and circular smooth muscle become thicker
than normal; if the balance favours Gli3 repressor, then the glandular epithelium and circular
smooth muscle become thinner than normal.
Previously, Gli3 activator was considered to be of little importance in Hh signalling; we
are only recently beginning to discover the essential role of Gli3 activator in the development of
different aspects of the mouse embryo [57]. Like in the study done looking at mouse limbs by
Wang et. al [57], we determined that the full length GLI3 protein acts as an activator of
Hedgehog signalling in the developing murine stomach. My qPCR results measuring the levels
of Ptc1 and Gli1 mRNA in the Gli3P1−4/P1−4
stomach show an upregulation of both mRNAs,
demonstrating that the Hedgehog pathway is overactive in the mutant stomach possessing only
Gli3 activator. Furthermore, the Gli3−/−
stomach shows a reduction in Ptc1 and Gli1 mRNA
expression, and therefore decreased Hh pathway activation relative to wild-type. This indicates
that lack of Gli3 activator results in reduced Hh pathway activation.
109
Although I have established the important role of Gli3 in the developing murine stomach,
I am still unclear as to the mechanisms behind how the two forms of Gli3 execute their function.
What I can conclude thus far is that a balance in favour of Gli3 repressor in the embryonic mouse
stomach results in decreased Hedgehog pathway activation, as determined by the lower
expression of Gli1 and Ptc1 mRNA [25]. Conversely, a balance in favour of Gli3 activator
results in increased Hh pathway activation. However, altering the balance of Gli3 activator and
repressor and consequently the level of Hh pathway activation does not result in changes in
proliferation rate. Changing this balance to favour the Gli3 activator does however, increase the
level of pit-branching. A fully defined mechanism by which the balance between Gli3 activator
and repressor controls the degree of glandular epithelial and circular smooth muscle thickness
remains to be discovered, and it should be the focus of future studies to establish what this
mechanism is.
If gastric epithelial growth depends on the balance between the Gli3 activator and
repressor, then the dys-regulation of this balance could be important in the context of gastric
homeostatsis and disease states as well. This newfound knowledge may have implications in
future studies evaluating dys-regulation of the Hh pathway in stomach diseases.
5.2 Future work
Additional experiments done on the Sufu−/−
mouse stomach can help us shed more light on how
the Hedgehog pathway functions in the developing stomach. Sufu is a potent negative regulator
of mammalian Hedgehog signaling [8], and I expect that in its absence, the balance between Gli3
activator and repressor will be skewed towards the activator. Therefore, I predict that the Sufu
110
mutant stomach will display glandular hyperplasia. Western blots of GLI2 and GLI3 need to be
done in the Sufu−/−
stomach. This will help us determine if Sufu acts in the stomach as a negative
regulator of Hh signalling since protein function is often context-dependent.
As mentioned in the discussion, I concluded that though all Hedgehog mutant stomachs
except that of Gli2−/−
displayed a hyperplastic or hypoplastic phenotype, this was not due to
changes in their proliferation rates. Instead, changes in apoptosis rates or the extent of pit-
branching may be responsible for the changes in thickness. Additional markers for apoptosis, e.g.
Caspase-3, Cytochrome c, and poly (ADP-ribose) polymerase (PARP), should be used to more
accurately assess the rate of cell death in the mutant stomachs at different embryonic stages. To
evaluate pit-branching and the degree it contributes to the overgrowth phenotype, the
ultrastructure of mutant stomachs needs to be observed under a scanning electron microscope.
Furthermore, I previously documented a correlation between stomach size and glandular
epithelial thickness amongst the mutant stomachs studied. I hypothesize that this is in part, due to
an altered submucosa and circular smooth muscle layer. I was able to assess the smooth muscle
layer in this thesis. In order to evaluate if the connective tissue layer (submucosa) is
compromised in the Hh mutant stomachs, I must stain for collagen.
Though the Gli2−/−
stomach did not display a glandular epithelial phenotype, I did observe
that its smooth muscle layer was thicker. This may indicate a differential expression of Gli2 in
the glandular epithelium versus the smooth muscle. Therefore, immunohistochemistry using a
Gli2 antibody must be done to determine where Gli2 protein is localized.
It is also necessary to look at the level of GLI2 activator and repressor in the Gli3 null
stomach, as it has a milder glandular overgrowth phenotype than both the Gli3P1−4/P1−4
and

111
Kif7−/−
stomachs. This suggests that Gli2 may have a compensatory function in the total absence
of Gli3 in the developing murine stomach.
The Hedgehog pathway may be interacting with other signaling pathways to regulate
gastric development. Therefore, it would be useful to quantitatively measure the levels of
markers of other major genetic pathways thought to be involved in stomach morphogenesis in
the different Hh mutants. These markers could include Fgf10, Hes 1, Bmp4, Wnt5a, and Sox2
[41].

112
Bibliography
[1] J. Aubin, U. Dery, M. Lemieux, P. Chailler, and L. Jeannotte. Stomach regional specification
requires Hoxa5-driven mesenchymal-epithelial signaling. Development, 129:4075–4087, 2002.
[2] C. B. Bai, D. Stephen, A. L. Joyner. All mouse ventral spinal cord patterning by Hedgehog is
Gli dependent and involves an activator function of Gli3. Dev. Cell, 6:103-115, 2004.
[3] M. D. Bates and G. H. Deutsch. Molecular insights into congenital disorders of the digestive
system. Pediatric and Developmental Pathology, 6:284–298, 2003.
[4] L. G. Biesecker. What you can learn from one gene: GLI3. J. Med. Genet., 43:465-469, 2006.
[5] M. J. Bitgood and A. P. McMahon. Hedgehog and Bmp genes are coexpressed at many
diverse sites of cell-cell interaction in the mouse embryo. Developmental Biology, 172:126–138,
1995.
[6] J. Bose, L. Grotewold, and U. Ruther. Pallister-Hall syndrome phenotype in mice mutant for
Gli3. Human Molecular Genetics, 11(9):1129–1135, 2002.
[7] M. Chang Hu, R. Mo, S. Bhella, C. W. Wilson, P-T. Chuang, C-c. Hui, and N. D.
Rosenblum. GLI3-dependent transcriptional repression of Gli1, Gli2 and kidney patterning genes
disrupts renal morphogenesis. Development, 133:569–578, 2005.

113
[8] M-H. Chen, C. W. Wilson, Y-J. Li, K. K. L. Law, C-S. Lu, R. Gacayan, X. Zhang, C-c. Hui,
and P-T. Chuang. Cilium-independent regulation of Gli protein function by Sufu in Hedgehog
signaling is evolutionarily conserved. Genes Dev., 23:1910–1928, 2009.
[9] H. O-L. Cheung, X. Zhang, A. Ribeiro, R. Mo, S. Makino, V. Puviindran, K. K. L. Law, J.
Briscose, and C-c. Hui. The Kinesin Protein Kif7 is a critical regulator of Gli transcription factors
in mammalian Hedgehog signaling. Science Signaling, 2(76):1–7, 2009.
[10] C. Chiang, Y. Litingtung, E. Lee, K. E. Young, J. L. Corden, H. Westphal, and P. A.
Beachy. Cyclopia and defective axial patterning in mice lacking Sonic hedgehog gene function.
Nature, 383:407–413, 1996.
[11] R. Dimaline and A. Varro. Attack and defence in the gastric epithelium -a delicate balance.
Exp. Physiol., 92:591–601, 2007.
[12] Q. Ding, J. Motoyama, S. Gasca, R. Mo, H. Sasaki, J. Rossant, and C.-c. Hui. Diminished
Sonic hedgehog signaling and lack of floor plate differentiation in Gli2 mutant mice.
Development, 125:2533–2543, 1998.
[13] Y. Echelard, D. J. Epstein, B St-Jacques, L. Shen, J. Mohler, J. A. McMahon, and A. P.
McMahon. Sonic hedgehog, a member of a family of putative signaling molecules, is implicated
in the regulation of CNS polarity. Cell, 75:1417–1430, 1993.
[14] M. Hernanz-Schulman, L. H. Lowe, J. Johnson, W. W. Neblett, D. B. Polk, R. Perez Jr, L.
E. Scheker, S. M. Stein, R. M. Heller, and R. Cywes. In vivo visualization of pyloric mucosal
hypertrophy in infants with hypertrophic pyloric stenosis: is there an etiologic role? AJR Am J
Roentgenol, 177:843–848, 2001.

114
[15] D. Huangfu and K. V. Anderson. Signaling from Smo to Ci/Gli: conservation and
divergence of Hedgehog pathways from Drosophila to vertebrates. Development, 133:3-14,
2006.
[16] C-c. Hui and A. L. Joyner. A mouse model of Greig cephalo-polysyndactyly syndrome: the
extra-toes mutation contains an intragenic deletion of the Gli3 gene. Nature Genetics, 3:241–246,
1993.
[17] P. W. Ingham and A. P. McMahon. Hedgehog signaling in animal development: paradigms
and principles. Genes Dev., 15:3059–3087, 2001.
[18] P. W. Ingham and A. P. McMahon. Hedgehog signaling: Kif7 is not that fishy after all.
Current Bio., 19:R729-730, 2009.
[19] J. Jiang and C-c. Hui. Hedgehog signaling in development and cancer. Developmental Cell,
15: 801-812, 2008.
[20] S. M. Karam. Lineage commitment and maturation of epithelial cells in the gut. Frontiers in
Bioscience, 4:d286–298, 1999.
[21] S. M. Karam and C. P. LeBlond. Identifying and counting epithelial cell types in the
‟corpus” of the mouse stomach. The Anatomical Record, 232:231–246, 1992.
[22] S. M. Karam, Q. Li, and J. I. Gordon. Gastric epithelial morphogenesis in normal and
transgenic mice. American Journal of Physiology; Gastrointestinal Liver Physiology,
272:G1209–G1220, 1997.
[23] Y. Katoh and M. Katoh. Hedgehog signaling pathway and gastric cancer. Cancer Biology &
Therapy, 4:1050–1054, 2005.
115
[24] J. H. Kim, Z. Huang, and R. Mo. Gli3 null mice display glandular overgrowth of the
developing stomach. Developmental Dynamics, 234:984–991, 2005.
[25] A. Kolterud, A. S. Grosse, W. J. Zacharias, K. D. Walton, K. E. Kretovich, B. E. Madison,
M. Waghray, J. E. Ferris, C. Hu, J. L. Merchant, A. A. Dlugosz, A. H. Kottmann, and D. L.
Gumucio. Paracrine Hedgehog signaling in stomach and intestine: new roles for Hedgehog in
gastrointestinal patterning. Gastroenterology, 137:618–628, 2008.
[26] C. Lees, W. J. Zacharias, M. Tremelling, C. L. Noble, E. R. Nimmo, A. Tenesa, J.
Cornelius, L. Torkvist, J. Kao, S. Farriington, H. E. Drummond, G-T. Ho, I. D. R. Arnott, H. D.
Appelman, L. Diehl, H. Campbell, M. G. Dunlop, M. Parkes, S. E. M. Howie, D. L. Gumucio,
and J. Satsangi. Analysis of germline GLI1 variation implicates hedgehog signalling in the
regulation of intestinal inflammatory pathway. PLoS Medicine, 5:1761–1775, 2008.
[27] K. F. Liem, Jr., M. He, P. J. R. Ocbina, and K. V. Anderson. Mouse Kif7/Costal2 is a cilia-
associated protein that regulates sonic hedgehog signaling. PNAS, 106:13377– 13382, 2009.
[28] X. Ma, K. Chen, S. Huang, X. Zhang, P. A. Adegboyega, B. M. Evers, H. Zhang, and J. Zie.
Frequent activation of the Hedgehog pathway in advanced gastric adenocarcinomas.
Carcinogenesis, 26(10):1698–1705, 2005.
[29] B.B. Madison, L. B. McKenna, D. Dolson, D. J. Epstein, and K. H. Kaestner. FoxF1 and
FoxL1 link Hedgehog signaling and the control of epithelial proliferation in the developing
stomach and intestine. The Journal of Biological Chemistry, 284(9):5936– 5944, 2009.
116
[30] J. Mao, B-M. Kim, M. Rajurkar, R. A. Shivdasani, and A. P. McMahon. Hedgehog
signaling controls mesenchymal growth in the developing mammalian digestive tract.
Development, 137:1721–1729, 2010.
[31] J. Martin, J. M. Donnelly, JM. Houghton, and Y. Zavros. The role of Sonic hedgehog
reemergence during gastric cancer. Dig Dis Science, 55:1516–1524, 2010.
[32] M. P. Matise and A. L. Joyner. Gli genes in development and cancer. Oncogene, 18:7852–
7859, 1999.
[33] E. Mau, H. Whetstone, C. Yu, S. Hopyan, J. S. Wunder, and B. A. Alman. PTHrP regulates
growth plate chondrocyte differentiation and proliferation in a Gli3 dependent manner utilizing
hedgehog ligant dependent and independent mechanisms. Developmental Biology, 305:28–39,
2007.
[34] K. M. McHugh. Molecular analysis of smooth muscle development in the mouse.
Developmental Dynamics, 204:278–290, 1995.
[35] J. C. Mills and R. A. Shivdasani. Reviews in basic and clinical gastroenterology and
hepatology: gastric epithelial stem cells. Gastroenterology, 140:412-424, 2011.
[36] M. Mimeault and S. K. Batra. Frequent deregulations in the hedgehog signaling network
and cross-talks with the epidermal growth factor receptor pathway invovled in cancer
progression and targeted therapies. Pharmacological Reviews, 62: 498-517, 2010.
[37] R. Mo, A. M. Freer, D. L. Zinyk, M. A. Crackower, J. Michaud, H. H.-Q. Heng, K. W.
Chik, X-M. shi, L-C. Tsui, S. H. Cheng, A. L. Joyner, and C-c. Hui. Specific and redundant

117
functions of Gli2 and Gli3 zinc finger genes in skeletal patterning and development.
Development, 124:113–123, 1997.
[38] R. K. Montgomery, A. E. Mulber, and R. J. Grand. Development of the human
gastrointestinal tract:twenty years of progress. Gastroenterology, 116:702–731, 1999.
[39] I. Naruse, E. Ueta, Y. Sumino, M. Ogawa, and S. Ishikiriyama. Birth defects caused by
mutations in human GLI3 and mouse Gli3 genes. Congenital Anomalies, 50:1–7, 2010.
[40] C. Nusslein-Volhard and E. Wieschaus. Mutations affecting segment number and polarity in
Drosophila. Nature, 287:795–801, 1980.
[41] P. Nyeng, G. A. Norgaard, S. Kobberup, and J. Jensen. FGF10 signaling controls stomach
morphogenesis. Developmental Biology, 303:295–310, 2007.
[42] M. Persson, D. Stamataki, P. te Welscher, E. Andersson, J. Bose, U. Ruther, J. Ericson, and
J. Briscoe. Dorsal-ventral patterning of the spinal cord requires Gli3 transcriptional repressor
activity. Genes & Dev., 16:2865-2878, 2002.
[43] M. W. Pfaffl. A new mathematical model for relative quantification in real time RT-PCR.
Nucleic Acids Res., 29:e45, 2001.
[44] M. Ramalho-Santos, D. A. Melton, and A. P. McMahon. Hedgehog signals regulate
multiple aspects of gastrointestinal development. Development, 127:2763–2772, 2000.
[45] D. Roberts. Molecular mechanisms of development of the gastrointestinal tract. Dev. Dyn.,
219:109–120, 2000.

118
[46] D. J. Roberts, D. M. Smith, D. J. Goff, and C. J. Tabin. Epithelial-mesenchymal signaling
during the regionalization of the chick gut. Development, 125:2791–2801, 1998.
[47] A. Ruiz i Altaba, C. Mas, and B. Stecca. The Gli code: an information nexus regulating cell
fate, stemness and cancer. TRENDS in Cell Biology, 17, 2007.
[48] A. Shiotani, H. Iishi, N. Uedo, S. Ishiguro, M. Tatsuta, Y. Nakae, M. Kumamoto, and J. L.
Merchant. Evidence that loss of sonic hedgehog is an indicator of Helicobacter pylori-induced
atrophic gastritis progressing to gastric cancer. Am. J. Gastroenterol., 100:581–587, 2005.
[49] A. Sukegawa, T. Narita, T. Kameda, K. Saitoh, T. Nohno, H. Iba, S. Yasugi, and K. Fukuda.
The concentric structure of the developing gut is regulated by Sonic hedgehog derived from
endodermal epithelium. Development, 127:1971–1980, 2000.
[50] J. Svard, K. H. Henricson, M. Persson-Lek, B. Rozell, M. Lauth, A. Bergstrom, J. Ericson,
R. Toftgard, and S. Teglund. Genetic elimination of Suppressor of Fused reals an essential
repressor function in the mammalian Hedgehog signaling pathway. Developmental Cell, 10:187–
197, 2006.
[51] Y. Takahashi, T. Imanaka, and T. Takano. Spatial pattern of smooth muscle differentiation
is specified by the epithelium in the stomach of mouse embryo. Developmental Dynamics,
212:448–460, 1998.
[52] H. Thien, D. Buscher, and U. Ruther. Cloning and sequence analysis of the murine Gli3
cDNA. Biochimica et Biophysica Acta, 1307:267-269, 1996.
[53] T. Tsukamoto, T. Mizoshita, M. Mihara, H. Tanaka, Y. Takenaka, Y. Yamamura, S.
Nakamura, T. Ushijima, and M. Tatematsu. Sox2 expression in human stomach
119
adenocarcinomas with gastric and gastric-and-intestinal-mixed phenotypes. Histopathology,
46:649–658, 2005.
[54] G. R. van den Brink. Hedgehog signaling in development and homeostasis of the
gastrointestinal tract. Physiology Review, 87:1343–1375, 2007.
[55] G. R. van den Brink, J. C. Hardwick, G. N. Tytgat, M. A. Brink, F. J. ten kate, S. J. van
Deventer, and M. P. Peppelenbosch. Sonic hedgehog regulates gastric gland morphogenesis in
man and mouse. Gastroenterology, 121:317–328, 2001.
[56] B. Wang, J. F. Fallon, and P. A. Beachy. Hedgehog-regulated processing of Gli3 produces
an anterior/posterior repressor gradient in the developing vertebrate limb. Cell, 100:423–434,
2000.
[57] C. Wang, U. Ruther, and B. Wang. The Shh-indepedent activator function of the full-length
Gli3 protein and its role in vertebrate limb digit patterning. Developmental Biology, 305:460–
469, 2007.
[58] C. Wang, Y. Pan, and B. Wang. Suppressor of fused and Spop regulate the stability,
processing and funcction of Gli2 and Gli3 full-length activators but not their repressors.
Development, 137:2001-2009, 2010.
[59] Y Zavros. The adventures of Sonic hedgehog in development and repair. IV. Sonic
hedgehog processing, secretion, and function in the stomach. American Journal of Physiology;
Gastrointestinal Liver Physiology, 294:G1105–G1108, 2008.