1 the Structural Characteristics of Farmer Cooperatives and Their Behavioral Consequences

Academic year 2014-2015
The Role of Farmer Cooperatives in the Development ofCoffee Value Chain in East Nusa Tenggara Indonesia
Yuniarti Pratiwi, Sisilia Ita
Promotor : Prof. Dr. Wolfgang Bokelmann
Thesis submitted in partial fulfilment of the requirementsfor the joint academic degree of International Master of Science in Rural Development from Ghent
University (Belgium), Agrocampus Ouest (France), Humboldt University of Berlin (Germany),Slovak University of Agriculture in Nitra (Slovakia) and University of Pisa (Italy) in collaboration with
Wageningen University (The Netherlands),
i
ACKNOWLEDGEMENT
First of all, I would like to express my sincere gratitude to my supervisor, Prof.
Wolfgang Bokelmann, for his kind support and guidance throughout the process. Further, I
am also grateful to IMRD secretariat, all the professors and coordinators in Ghent
University, University of Pisa, and Humboldt University of Berlin for their continuous
support during the study period.
I also extend my thanks to Lembaga Penyaluran Dana Pendidikan (LPDP) Indonesia
for providing me an opportunity to study in the IMRD program with financial support. My
sincere thanks also go to my group of fellow students of IMRD, I have been blessed with
such friendly and cheerful fellow students.
In Manggarai, Indonesia, I would like to offer my gratitude to all respondents, the
officials of Department of Estate Crops and Horticulture Manggarai Regency, Asnikom,
and UD. Indokom Flores for providing me a valuable information during my data
collection. A special thanks to my new family and friends in Manggarai for sharing a
sincere help, encouragement and guidance during my field work.
And most of all, many thanks to my beloved parents for their loving support,
encouragement and attention for me to achieve my dreams. I attribute all my success in life
to the moral, intellectual and physical education I received from them. I would also like to
thank my beloved brother, my partner, and all of my friends. Thank you for always being
there cheering me up and stood by me during good and bad times.
Yuniarti Pratiwi, Sisilia Ita
Berlin, July 2015
ii
ABSTRACT
Coffee sector has been contributing a substantial value to the livelihood of the rural
people. However, smallholder farmer in the coffee sector often finds barriers and
challenges to elevate their situation in the worldwide marketplace. This thesis is a study of
the role of farmer cooperatives in the development of value chain in Manggarai, East Nusa
Tenggara, Indonesia. It specifically uses the value chain analysis as the comprehensive
method to see the existing coffee value chain in the study area.
Several actors accounted to be the key player of the coffee value chain in the study
area, such as trader and exporter. Referable to the market liberalization, the
trader/middleman has an enormous advantages, to reap the benefits of smallholder farmers.
This unfavorable situation for smallholder farmers, therefore, became the driving force on
the involvement of farmer cooperatives in the coffee value chain.
Following this, the theoretical, conceptual and analytical background used in the
study try to illustrate and portray the role of farmer cooperatives in the coffee value chain.
Farmer cooperatives are found out to be the actor which enables the farmer to develop their
production and processing system via certain functions offered by the cooperative in the
context of value chain development, such as: access to financial resources; provision of
farm input, knowledge, and market information; and networking access. Farmer
cooperatives are also able to improve the value chain through process and product
upgrading. Along with the involvement of farmers in the cooperatives, they also engaged
in the value chain development. Nevertheless, an extensive coordination between players
in the value chain is important to reinforce the learning procedure. Therefore, farmer
cooperatives can be a central player in order to maintain the coordination system in the
coffee value chain.
iii
TABLE OF CONTENTS
ACKNOWLEDGEMENT.......................................................................................................... i
ABSTRACT............................................................................................................................... ii
LIST OF FIGURES ....................................................................................................................v
LIST OF TABLES.....................................................................................................................vi
ABBREVIATIONS ..................................................................................................................vii
1. INTRODUCTION ................................................................................................................1
1.1. Overview of Coffee Sector in Indonesia ......................................................................2
1.2. The Development of Coffee Sector in Indonesia, Government Policy and State
Institutions ................................................................................................................... 4
1.3. Problem Statement........................................................................................................5
Objectives and Research Questions..............................................................................6
1.4.Outline of the Study Report ............................................................................................7
2. REVIEW OF LITERATURE ...............................................................................................8
2.1. Theoretical Framework.................................................................................................8
2.1.1. The Concept of Value chain ...............................................................................8
2.1.2. Governance of Value Chain..............................................................................10
Governance and Coordination of Value Chain.................................................12
2.1.3. Upgrading the Value Chain ..............................................................................13
2.1.4. Smallholders and Farmers Cooperatives ..........................................................14
2.2. Empirical Evidences ...................................................................................................18
2.3. Remarks from Literature Review ...............................................................................20
3. METHODOLOGY .............................................................................................................21
3.1. Conceptual Framework...............................................................................................21
3.2. Research Methods.......................................................................................................22
3.2.1. Sampling Procedure..........................................................................................24
3.2.2. Description of Data Analysis ............................................................................25
3.3. Limitations of the Study ............................................................................................26
4. RESULTS ...........................................................................................................................27
4.1. Size and Structure of Smallholder Coffee Farms .......................................................27
4.2. Mapping of the Coffee Value Chain...........................................................................29
4.3. Price Spread and Value Addition of Coffee ...............................................................36

iv
4.4. Governance and Coordination in the Coffee Value Chain .........................................39
4.5. SWOT Analysis of the Coffee Value Chain...............................................................40
5. DISCUSSION.....................................................................................................................43
5.1. The Role of Farmer Cooperatives in the Development of Coffee Value Chain.........43
5.2. Determinants of the Farmer’s Inclusion and Participation in Cooperative ................47
5.3. Opportunities for Upgrading the Coffee Value Chain................................................50
6. SUMMARY AND CONCLUSIONS .................................................................................53
6.1. Summary.....................................................................................................................54
6.2. Conclusions.................................................................................................................55
6.3. Recommendations for Future Research ......................................................................55
REFERENCES .........................................................................................................................57
ANNEXES................................................................................................................................61

v
List of Figures
Figure 1. Total Coffee Production by Top 10 Producing Countries...........................................1
Figure 2. Coffee Production in Different Region in 2013 ..........................................................3
Figure 3. Conceptual Framework in the Coffee Value Chain ..................................................22
Figure 4. Map of the Study Region in Manggarai, East Nusa Tenggara, Indonesia ................23
Figure 5. Mapping of Coffee Value Chain in Manggarai ........................................................29
Figure 6. Schematic View of Arabica Coffee Processing ........................................................31
Figure 7. Major Problems Encountered by Farmers.................................................................32
Figure 8. The Number of Coffee Traded to Another Island (outside Flores) ...........................35
Figure 9. Governance Structure of Coffee Sector in Manggarai ..............................................39
vi
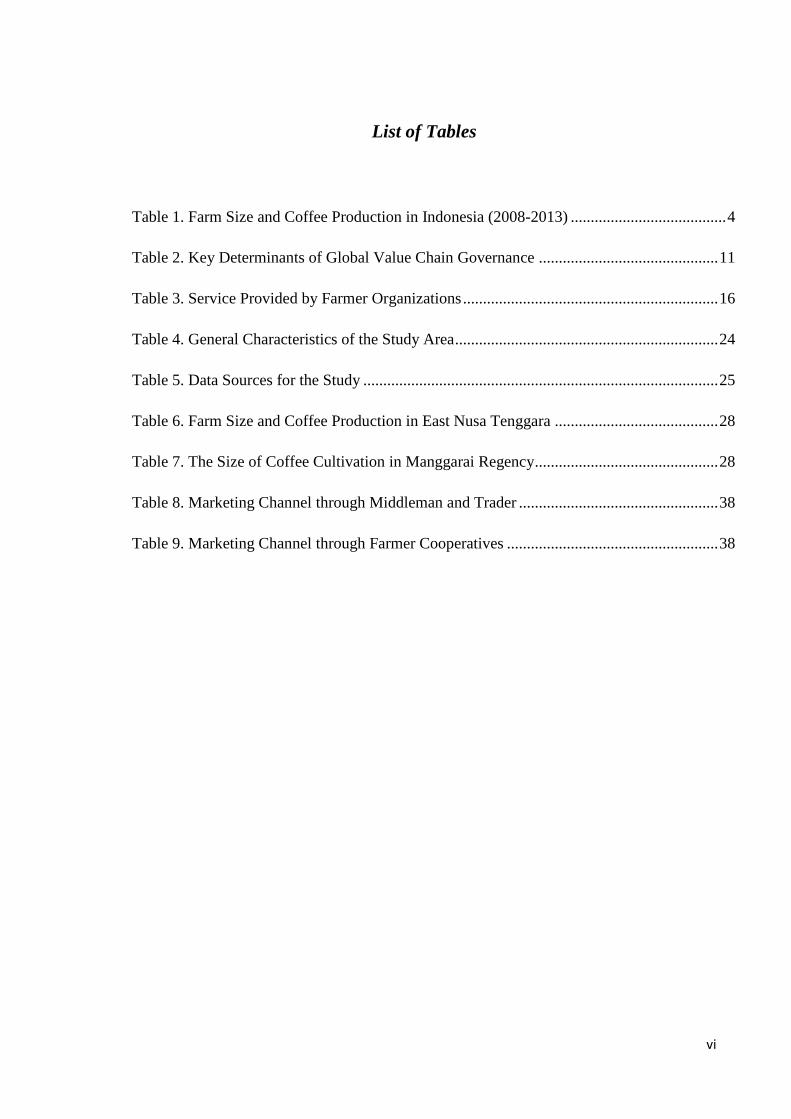
List of Tables
Table 1. Farm Size and Coffee Production in Indonesia (2008-2013) .......................................4
Table 2. Key Determinants of Global Value Chain Governance .............................................11
Table 3. Service Provided by Farmer Organizations................................................................16
Table 4. General Characteristics of the Study Area..................................................................24
Table 5. Data Sources for the Study .........................................................................................25
Table 6. Farm Size and Coffee Production in East Nusa Tenggara .........................................28
Table 7. The Size of Coffee Cultivation in Manggarai Regency..............................................28
Table 8. Marketing Channel through Middleman and Trader ..................................................38
Table 9. Marketing Channel through Farmer Cooperatives .....................................................38
vii
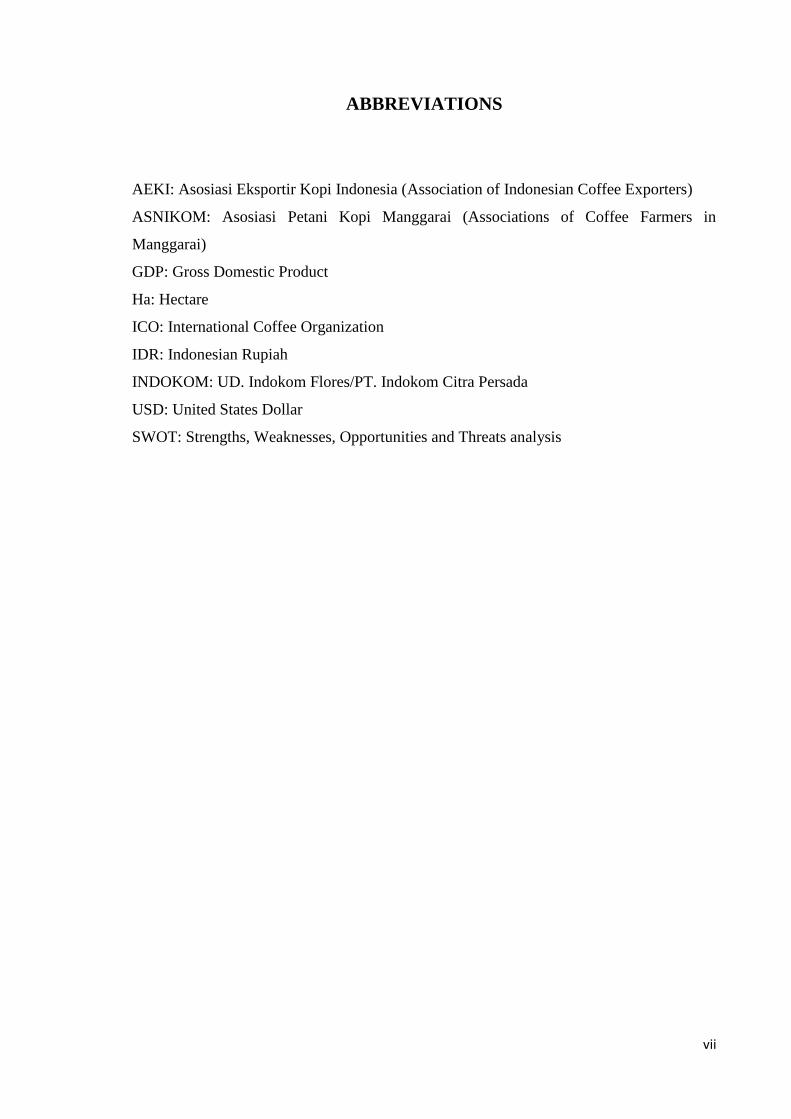
ABBREVIATIONS
AEKI: Asosiasi Eksportir Kopi Indonesia (Association of Indonesian Coffee Exporters)
ASNIKOM: Asosiasi Petani Kopi Manggarai (Associations of Coffee Farmers in
Manggarai)
GDP: Gross Domestic Product
Ha: Hectare
ICO: International Coffee Organization
IDR: Indonesian Rupiah
INDOKOM: UD. Indokom Flores/PT. Indokom Citra Persada
USD: United States Dollar
SWOT: Strengths, Weaknesses, Opportunities and Threats analysis

1
CHAPTER 1. INTRODUCTION
According to World Bank (2004), coffee is one amongst the world’s most important
commodities traded in nearly 60 countries. Coffee is considered as “the top cash crop in
developing countries”. Therefore, it emphasizes the value of coffee in economic sector in
the developing countries (Wahyudi and Jati, 2012: 6). Coffee also plays an important role
in the livelihood of smallholder farmers. International Coffee Organization noted that
coffee supports millions of smallholder farmers and generate immense employment
opportunities in rural areas (Kodigehalli, 2011:1). As depicted by (Rice, 2003),
smallholder still predominate the global coffee world, frequently supplying the volume of a
producing country’s coffee harvest, along with the massive percentage of any rural farm
labor. Smallholder coffee growers spread across the rural landscapes in Asia, Latin
America and Africa with less than 10 hectares of land (Rice, 2003:230).
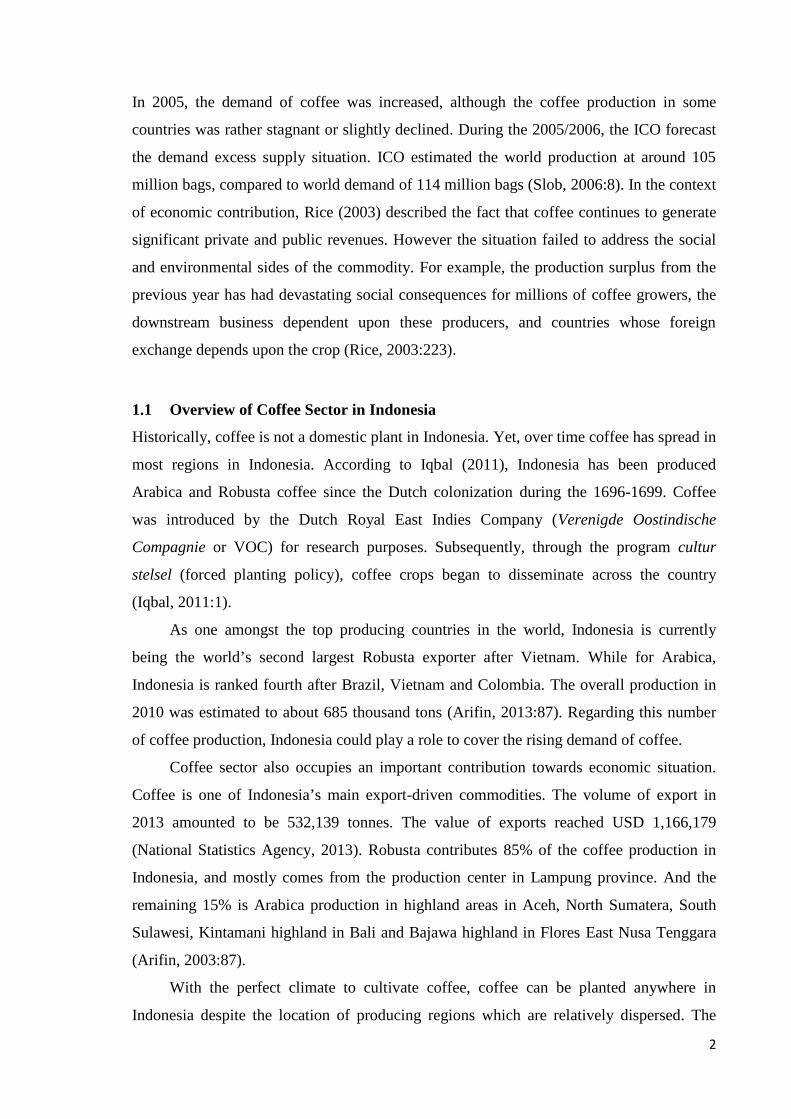
The fact that the major quantity of world coffee production is directed towards the
export market indicates the importance of coffee as an export commodity (Kodigehalli,
2011:1). In international market, the global top 10 producing countries are Brazil, Vietnam,
Indonesia, Colombia, Ethiopia, India, Honduras, Mexico, Uganda, and Guatemala. In that
sense, developing countries carry out over than 90% of the world’s coffee production.
Meanwhile, the majority of the coffee consumers are in the developed and industrialized
countries.
Figure 1. Total Coffee Production by Top 10 Producing Countries (in thousand 60 kg bags)
Source: International Coffee Organization (2014)
45,342
9,00012,500
6,6253,500 5,400 5,517 3,900 3,800
27,500
05,000
10,00015,00020,00025,00030,00035,00040,00045,00050,000
2
In 2005, the demand of coffee was increased, although the coffee production in some
countries was rather stagnant or slightly declined. During the 2005/2006, the ICO forecast
the demand excess supply situation. ICO estimated the world production at around 105
million bags, compared to world demand of 114 million bags (Slob, 2006:8). In the context
of economic contribution, Rice (2003) described the fact that coffee continues to generate
significant private and public revenues. However the situation failed to address the social
and environmental sides of the commodity. For example, the production surplus from the
previous year has had devastating social consequences for millions of coffee growers, the
downstream business dependent upon these producers, and countries whose foreign
exchange depends upon the crop (Rice, 2003:223).
1.1 Overview of Coffee Sector in Indonesia
Historically, coffee is not a domestic plant in Indonesia. Yet, over time coffee has spread in
most regions in Indonesia. According to Iqbal (2011), Indonesia has been produced
Arabica and Robusta coffee since the Dutch colonization during the 1696-1699. Coffee
was introduced by the Dutch Royal East Indies Company (Verenigde Oostindische
Compagnie or VOC) for research purposes. Subsequently, through the program cultur
stelsel (forced planting policy), coffee crops began to disseminate across the country
(Iqbal, 2011:1).
As one amongst the top producing countries in the world, Indonesia is currently
being the world’s second largest Robusta exporter after Vietnam. While for Arabica,
Indonesia is ranked fourth after Brazil, Vietnam and Colombia. The overall production in
2010 was estimated to about 685 thousand tons (Arifin, 2013:87). Regarding this number
of coffee production, Indonesia could play a role to cover the rising demand of coffee.
Coffee sector also occupies an important contribution towards economic situation.
Coffee is one of Indonesia’s main export-driven commodities. The volume of export in
2013 amounted to be 532,139 tonnes. The value of exports reached USD 1,166,179
(National Statistics Agency, 2013). Robusta contributes 85% of the coffee production in
Indonesia, and mostly comes from the production center in Lampung province. And the
remaining 15% is Arabica production in highland areas in Aceh, North Sumatera, South
Sulawesi, Kintamani highland in Bali and Bajawa highland in Flores East Nusa Tenggara
(Arifin, 2003:87).
With the perfect climate to cultivate coffee, coffee can be planted anywhere in
Indonesia despite the location of producing regions which are relatively dispersed. The

3
primary coffee producing provinces in Indonesia are South Sumatra, Lampung, Bengkulu
and Aceh. East Nusa Tenggara ranked seventh after East Java and South Sulawesi (Iqbal,
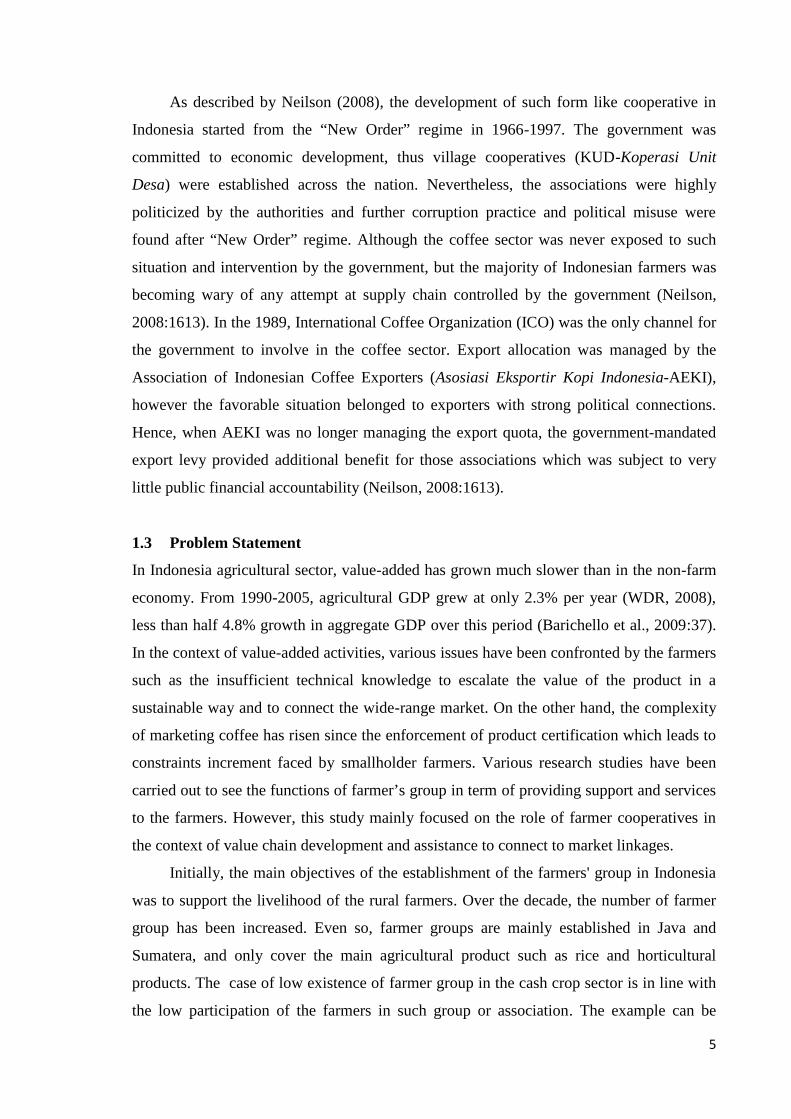
2011:2). Sumatra dominates the coffee production with 74.2%, then followed by Sulawesi
9.0%, Java 8.3%, Nusa Tenggara 5.8%, Kalimantan 2.0%, and Maluku and Papua 0.6%. In
general, the taste of coffee depends on various factors, this includes: climate condition; soil
condition; cultivation techniques; and post harvest handling. Therefore, each region may
produce a variety of specialty coffees such as Java, Mandheling, Gayo, Flores, Lintong,
Kintamani, Toraja, etc. (Wahyudi and Jati, 2012:3). Flores coffee is renowned as best-taste
coffee among other Indonesian coffee. The characteristics of Flores coffee are chocolaty,
sweet, fruity, and has slightly citrus aftertaste. Flores coffee grows at altitudes between
1200-1800 meters above sea level (Wahyudi and Jati, 2012:6).
Figure 2. Coffee Production in Different Region in 2013 (000 tonnes)
Source: National Statistics Agency (BPS) Indonesia (2013)
The coffee plantation in Indonesia is still dominated by smallholder plantation.
Smallholders accounted 90.1% of coffee production in Indonesia while the rest
respectively developed by government (6%) and private sectors (3.9%) (Iqbal, 2011:2).
Coffee production by smallholder farmers is mostly located in rural areas, especially in the
dry and mountainous area. The number of coffee farmers in Indonesia is 1.97 million with
an average of 0.6 Ha of land ownership. Furthermore, assuming family member of coffee
Aceh9%
Sumatera Utara10%
Sumatera Barat5%
SumateraSelatan
24%Bengkulu
10%
Lampung23%
Jawa Timur9%
Nusa TenggaraTimur
4%
Sulawesi Selatan6%
4
farmers as 4 members, at least 7.9 million people in Indonesia depend on coffee price
fluctuation (Wahyudi and Jati, 2012:3).
Price of coffee is remarked as the main concern of the smallholder farmers. Wahyudi
and Jati (2012) disclosed that the farm gate price tends to fall since the 1970s. In general,
farmers gain around 19-22% of the total price of a cup of coffee. For the consuming
countries, this number is inversely proportional to the value added to coffee. In result, the
management of the field and post-harvest processing will not solely secure the position of
the smallholder farmers in the coffee chain as well as their bargaining power (Wahyudi and
Jati, 2012:3). Therefore, in order to escalate the position of smallholder farmers,
empowerment should be in line with agricultural chains in which it entirely encompasses
the on-farm and off-farm activities. The substance of empowerment would be achieved if
equal perception, commitment network, collective decision, and synergic activity were set
up holistically in line with participatory approach (Iqbal, 2011:3).
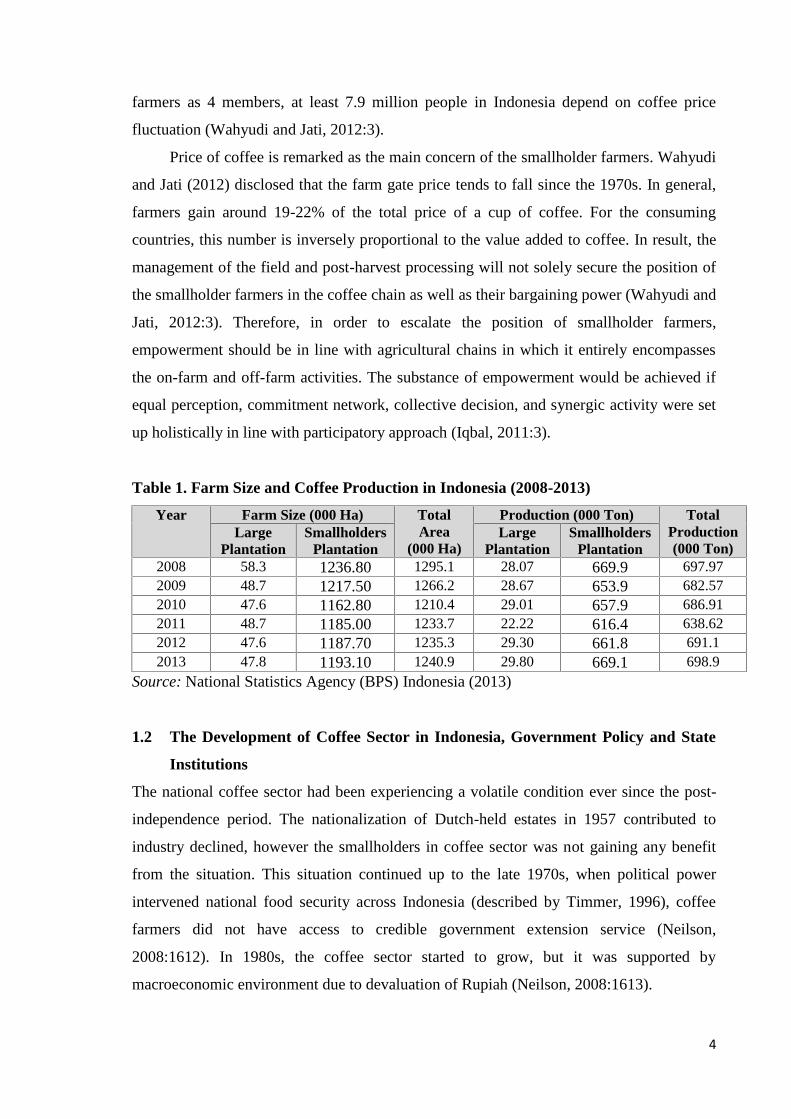
Table 1. Farm Size and Coffee Production in Indonesia (2008-2013)
Year Farm Size (000 Ha) TotalArea
(000 Ha)
Production (000 Ton) TotalProduction(000 Ton)
LargePlantation
SmallholdersPlantation
LargePlantation
SmallholdersPlantation
2008 58.3 1236.80 1295.1 28.07 669.9 697.972009 48.7 1217.50 1266.2 28.67 653.9 682.572010 47.6 1162.80 1210.4 29.01 657.9 686.912011 48.7 1185.00 1233.7 22.22 616.4 638.622012 47.6 1187.70 1235.3 29.30 661.8 691.12013 47.8 1193.10 1240.9 29.80 669.1 698.9
Source: National Statistics Agency (BPS) Indonesia (2013)
1.2 The Development of Coffee Sector in Indonesia, Government Policy and State
Institutions
The national coffee sector had been experiencing a volatile condition ever since the post-
independence period. The nationalization of Dutch-held estates in 1957 contributed to
industry declined, however the smallholders in coffee sector was not gaining any benefit
from the situation. This situation continued up to the late 1970s, when political power
intervened national food security across Indonesia (described by Timmer, 1996), coffee
farmers did not have access to credible government extension service (Neilson,
2008:1612). In 1980s, the coffee sector started to grow, but it was supported by
macroeconomic environment due to devaluation of Rupiah (Neilson, 2008:1613).
5
As described by Neilson (2008), the development of such form like cooperative in
Indonesia started from the “New Order” regime in 1966-1997. The government was
committed to economic development, thus village cooperatives (KUD-Koperasi Unit
Desa) were established across the nation. Nevertheless, the associations were highly
politicized by the authorities and further corruption practice and political misuse were
found after “New Order” regime. Although the coffee sector was never exposed to such
situation and intervention by the government, but the majority of Indonesian farmers was
becoming wary of any attempt at supply chain controlled by the government (Neilson,
2008:1613). In the 1989, International Coffee Organization (ICO) was the only channel for
the government to involve in the coffee sector. Export allocation was managed by the
Association of Indonesian Coffee Exporters (Asosiasi Eksportir Kopi Indonesia-AEKI),
however the favorable situation belonged to exporters with strong political connections.
Hence, when AEKI was no longer managing the export quota, the government-mandated
export levy provided additional benefit for those associations which was subject to very
little public financial accountability (Neilson, 2008:1613).
1.3 Problem Statement
In Indonesia agricultural sector, value-added has grown much slower than in the non-farm
economy. From 1990-2005, agricultural GDP grew at only 2.3% per year (WDR, 2008),
less than half 4.8% growth in aggregate GDP over this period (Barichello et al., 2009:37).
In the context of value-added activities, various issues have been confronted by the farmers
such as the insufficient technical knowledge to escalate the value of the product in a
sustainable way and to connect the wide-range market. On the other hand, the complexity
of marketing coffee has risen since the enforcement of product certification which leads to
constraints increment faced by smallholder farmers. Various research studies have been
carried out to see the functions of farmer’s group in term of providing support and services
to the farmers. However, this study mainly focused on the role of farmer cooperatives in
the context of value chain development and assistance to connect to market linkages.
Initially, the main objectives of the establishment of the farmers' group in Indonesia
was to support the livelihood of the rural farmers. Over the decade, the number of farmer
group has been increased. Even so, farmer groups are mainly established in Java and
Sumatera, and only cover the main agricultural product such as rice and horticultural
products. The case of low existence of farmer group in the cash crop sector is in line with
the low participation of the farmers in such group or association. The example can be
6
drawn from the study done by Hartatri and de Rosari (2011) who tried to see the Arabica
coffee industry in Manggarai and East Manggarai. Based on the research, less than 50% of
the coffee farmers join the farmers’ group (Hartatri and de Rosari, 2011:56). Therefore, it
is important to investigate the hindering force for farmers to involve in the collective action
organizations.
It is also important to point out the governance system of farmer cooperatives in
order to improve the value chain coordination. In many instances, the existing farmer
cooperatives are being challenged by the involvement of many actors along the value
chain. On one hand, many farmer cooperatives have been successfully delivered the role of
intermediaries. And on the other hand, some perform a minor role in the value chain
coordination. Further attention needs to be drawn on what are the determinants for the
farmer to involve in farmer cooperatives.
The study was carried out in Manggarai regency, part of the East Nusa Tenggara
province in Indonesia. The previous background will be used to carry out a research study
entitled “The role of farmer cooperatives in the development of coffee value chain in East
Nusa Tenggara Indonesia”. And the following key research question will be carried out
during the research study using in depth analysis of coffee value chain:
Research Questions:
How does the establishment of farmer cooperatives improve the coordination and
performance in the development of coffee value chain?
Therefore, with this background the research study aims to achieve the following
objectives:
To describe the coffee value chain in Manggarai East Nusa Tenggara and actors
involved in the chain (mapping)
To analyze the governance and coordination mechanism in the coffee value chain
To analyze the coffee value chain through SWOT analysis
To discuss the role of farmer cooperatives towards inclusion of smallholder coffee
farmers in the development of coffee value chain
7
1.4 Outline of the Study Report
The following study report is organized into seven main chapters. The first chapter consists
of a brief introduction of the coffee sector in the world and in Indonesia. It also provides
the description of the existing problem and the objectives of the study. The second chapter
provides the review of literature associated with the study objectives. Third chapter gives
an overview of the conceptual framework, feature of the study area, sampling and analysis
procedure of the data. The fourth chapter presents the empirical results, and based on the
literature review as well as data gained from study, discussion part is shown in chapter
five. Chapter six summarizes the entire research study and then followed by the
conclusions drawn in response to research findings. And the final chapter lists the sources
of research material, including papers, journals and books used in the research study.
8
CHAPTER 2. REVIEW OF LITERATURE
The following chapter has made an attempt to elaborate several theories and concepts used
in the study. A critical review of the previous research work is carried out in order to gain
better understanding of the subject. The theoretical evidences are drawn from the value
chain theory in conjunction with the theory of cooperative.
2.1 Theoretical Framework
2.1.1 The Concept of Value Chain
As described by Kaplinsky and Morris (2001), a value chain can be defined as “the full
range of activities which are required to bring a product or service from conception,
through the different phases of production, delivery to the final consumer and final
disposal after use”. The study in the value chain sector will improve the attempt to
understand the distribution of power and value in the chain and to be able to address the
agency of workers and small producers (Mitchell and Coles, 2011:11).
According to Kaplinsky (2004), the following key elements are important in value
chain which need to be recognized and which transform a heuristic into an analytical tool:
“Value chains are repositories for rent, and these rents are dynamic
Governance plays an important role to utilize the value chain
Effective value chains arise from systemic as opposed to point-efficiency” (Kaplinsky,
2004:9)
Given that coffee is one amongst the most important export commodity in most
developing countries, the concept of global value chain (GVC) is applicable to this
situation. Albeit the concept is relatively similar, global value chain distinct because its
activities that spread over international borders and not constrained within one country
(Mitchell and Coles, 2011:11). However, producers in developing country often face
important barriers in order to fulfil quality, standards and regulations in international
market. Several authors, notably, De Janvry and Sadoulet (2005), Daviron and Gibbon
(2002) and Reardon and Barret (2000) have described that lack of institutional and
infrastructural support, availability of resources and efficient and effective coordination in
value chain often hinders producers and smallholder farmers to increase their bargaining
position in the value chain (Trienekens, 2011:52).
9
Trienekens (2011:53) accounted several constraints for developing country producers
to upgrade the value chain. The constraints are associated with market access (local,
regional and international) and market orientation (described by Grunert et al., 2005),
available resources and physical infrastructures (described by Porter 1990) and institutions
(regulative, cognitive and normative; described by Scott 1995).
Market access and market orientation
According to Trienekens (2011), several factors such as technological capabilities of
producers, available infrastructures, bargaining power and market knowledge and
orientation determine the market access. Meanwhile, Grunert et al. (2005) characterized
the market orientation of the actors in the chain includes these key points: intelligence
generation referring to current and future end-user needs; dissemination of this
intelligence among the actors; and the responsiveness of the actors towards the needs of
the end-user (Grunert et al., 2005:430). The characteristics of the end-market will
likewise bear upon the activities carry out by the actors along the value chain.
Knowledge and willingness to comply with the demands in the value chain’s end-
market, thus will be conditional to participation in high value adding value chains
(referred to Grunert et al., 2006). For this cause, the key condition for the inclusion of
producers in the value chain is access to market information and the power to translate it
to market intelligence (Trienekens, 2011:55).
Resources and physical infrastructures
Access to market is not the one and only factor for producers in order to sell their
products in the broader market. According to Trienekens (2011), supporting
infrastructures, resources, including knowledge and capabilities are substantial to
generate a successful value chain. Furthermore, this determined by three different
aspects such as low level of available physical resources (e.g. Input materials and
supplies), the geographical location of the producers, availability of educated labor and
the availability of knowledge, and the level and availability of technology that can be
used for production and distribution activities in the value chain (Trienekens, 2011:55).
Institutional voids
Mair and Marti (2008) defined the institutional voids as the failure of the institutional
arrangements to support the market mechanism (Trienekens, 2011:56). Moreover,
Trienekens (2011) made a distinction between regulative, normative and cognitive
institutions, according to the terminology used by Scott (1995). These sets of
institutions (e.g. Government legislations, rules and policies, business practices as well

10
as the cognitive institutions) can prevent the value chain upgrading by setting trade
barriers, limiting the information flow, imposing taxes as well as limiting value adding
practices (Trienekens, 2011:56).
Correspondingly, Mitchell and Coles (2011) also defined the changes in the value
chain which is the inclusion of new participants in the chain, continued participation under
new terms, expulsion of members and non-participation. And this is adhered to the
upgrading strategies for small producers that grouped into three types: improve process,
product or volume; change and/or add functions; improve value chain coordination
(Mitchell and Coles, 2011:29 ff). However, doing a significant change and upgrading
strategies is particularly challenging for smallholder farmer who wants to step into the
global value chain. Therefore, the following literature will develop the theory of collective
action and farmer cooperatives to correlate the farmer’s inclusion in the coffee value chain.
2.1.2 Governance of Value Chain
According to Humphrey and Schmitz (2004), governance in term of value chain can be
determined as the process of specifying, communicating and enforcing compliance with
key product and process parameters along the value chain (Neilson, 2008:1609). The
governance analysis provides a better understanding of how a chain is controlled and
coordinated when asymmetry of power emerges (Gereffi and Fernandez-Stark, 2011:8).
Moreover, Fromm (2007) explained the role of ‘governance’ can be undertaken by buyers
(buyer-driver chains) or producers (producer-driven chains). In a producer-driven chain,
the main transnational manufacturers play the central role in coordinating production
networks. While in buyer-driven chain, production networks is decentralized in a number
of exporting countries, typically in developing nations (Fromm, 2007:7).
Furthermore, according to Gereffi et al. (2005) there are five governance types which
have several key determinants. Several variables as follows affect the shape of global value
chain structure:
The complexity of information and knowledge transfer required to sustain a particular
transaction in respect to product and process specifications
Codification of the information and knowledge, whether it is easy to codified,
efficiently transmitted and without transaction-specific investment between the parties
The capabilities of the actual and potential suppliers in relation to the requirements of
the transaction (Gereffi et al., 2005:85)

11
Table 2. Key Determinants of Global Value Chain Governance
GovernanceType
InformationComplexity
Ability toCodify
Information
SupplierCapabilities
Degree of ExplicitCoordination andPower Asymmetry
Market Low High High Low
High
Modular High High HighRelational High Low HighCaptive High High Low
Hierarchy High Low LowSource: Gereffi et al. (2005:87)
The five different types of governance structures have different characteristics, which are
explained in the following sections.
Market
The specific characteristic of the market governance relies on the simplicity of the
information. Information on product specifications amongst the actors is easily
transmitted, and exchanges within the chain require little or no formal cooperation. The
cost of switching to new partners is low for both producers and buyers. Instead of
powerful lead firm, the price determines the central governance mechanism (Gereffi and
Fernandez-Stark, 2011:9).
Modular
In this chain, complex transactions are relatively easy to codify. Suppliers aim to
conclude consumers’ satisfaction which result in extensive consumer base investment.
Relationship between actors later becomes significant because of the high information
flow across the inter-link firm. In order to maintain the function of modular governance,
information technology and standards for exchanging information are required (Gereffi
and Fernandez-Stark, 2011:9).
Relational
The frequent interactions and knowledge sharing between players in the chain has a
high influence in the relational value chain. The linkage between actors requires trust
and generates mutual reliance, which is regulated through reputation, social and spatial
proximity, family and ethnic affiliations. Under those conditions, it takes time to make
the linkage which lead to high cost and difficulties to switch to a new collaborator in the
chain (Gereffi and Fernandez-Stark, 2011:9).

12
Captive
In these chains, respective supplier posses low competence to produce complex
products and specifications. For this reason, it requires intervention and restraint from
the lead firm. The lead firm encourages the build-up of transactional dependence in
order to prevent others in benefiting the efforts of the lead firm. So the suppliers face
significant switching costs and are ‘captive’. The opportunism arises through the control
of lead firms, while at the same time the linkages could provide resources and market
access to the subordinate firms to progress to exit an unattractive option (Gereffi et al.,
2005:87).
Hierarchy
Hierarchy governance occurs when product specifications cannot be codified, products
are complex, or highly competent suppliers are rare to be found. Consequently, vertical
integration and managerial control within lead firms that produce and manufacture
products in-house are required. (Gereffi and Fernandez-Stark, 2011:10).
2.1.2.1 Governance and Coordination of Value Chain
In the context of governance mechanism, coordination between actors in the chain is
substantial. Different activities and different transactions in the value chain imply the
mutual dependencies or (independencies). Malone and Crowston (1994) defined co-
ordination as managing dependencies between activities. Meanwhile, Thompson (1967)
noted three different types of interdependencies-pooled, sequential, and reciprocal
interdependency (Bijman et al., 2011:84).
In a system of pooled interdependency, each part of an organization renders a discrete
contribution to the whole and each is supported by the whole. The whole system is
threatened if the actors perform inadequately. The main coordination mechanisms in
collaborations of a pooled interdependency type are the development and implementation
of standards for production, distribution and product quality (Bijman et al., 2011:84).
Sequential interdependency is relatively relevant in the context of value chains. In this
arrangement, the output of one function is the input to another part. The typical main
coordination mechanism is managerial discretion, i.e. coordination by plan or command.
Thus, it requires lead firm or coordinating agent who plans the flow of the products and
information and directs adaptation to changing internal and external conditions (Bijman et
al., 2011:84 ff).
13
The third form is reciprocal interdependency where the output of each part is an input
for every other part, so each part posses contingency for the other parts. The coordination
mechanism is the mutual adjustment amongst part of the chain, thus implies joint decision
making and problem solving to coordinate individual activities. In this mechanism,
information exchange and feedback from past transactions and partners’ past conduct is
crucial in order to foster learning and reinforce social norms and informal sanctioning
mechanisms (Bijman et al., 2011:85).
Muradian and Pelupessy (2005) described a term “inter-segment coordination” in the
context of coordination between suppliers in developing countries and buyers in
industrialized countries into several types as follows:
Market transactions: typical characteristics are low or missing coordination between
actors, low information exchange, prices and standard attributes are the main control
mechanism
Weak coordination: it represents complex but not-so-specific (easy to codify)
information exchange. The monitoring cost is relatively low (for buyers) as well as the
cost of switching partners (both for suppliers and buyers)
Strong coordination: typically complex and specific information exchange between
parties. The cost for monitoring and switching partners is considerably high. Mutual
dependence between parties is likely to happen.
Vertical integration: it requires complex and very specific information. Standards,
processes, and logistics are controlled through ownership (Muradian and Pelupessy,
2005:2031).
2.1.3 Upgrading the Value Chain
According to Gereffi et al. (2011), the ‘governance’ of the value chains is the key concept
for the top down view. Governance focuses mainly on lead firms and the organization of
the international industries. Meanwhile, ‘upgrading’ is the main concept for the bottom up
perspective which focuses on the strategies used by countries, regions and other economic
stakeholders to maintain or improve their positions in the global economy (Gereffi et al.,
2011:12).
Stamm (2004) has defined upgrading as “the process that enables firms to hold on
more value-intensive functions in the chain, make it harder to replace, and thus
appropriate a larger part of the generated profits” (Stamm, 2004:27). Furthermore, there
are various elements associated with the possibilities for upgrading. The main components
14
are the basic character of the marketplace, the substitutability of the partners, the level of
competency of corporate management, the desegregation of the firm in clusters that
promote collective learning process, and the efficiency of the institutional corporate
management, which enables the firm to tap assets that it cannot itself produces (Stamm,
2004:27).
Additionally, Kaplinsky (2000) characterized four forms of upgrading as process
improvement, product improvement, changing functional positions (adjusting activities or
shifting to new activities) and moving out of the value chain into a new value chain
(Kaplinsky et al., 2000:76).
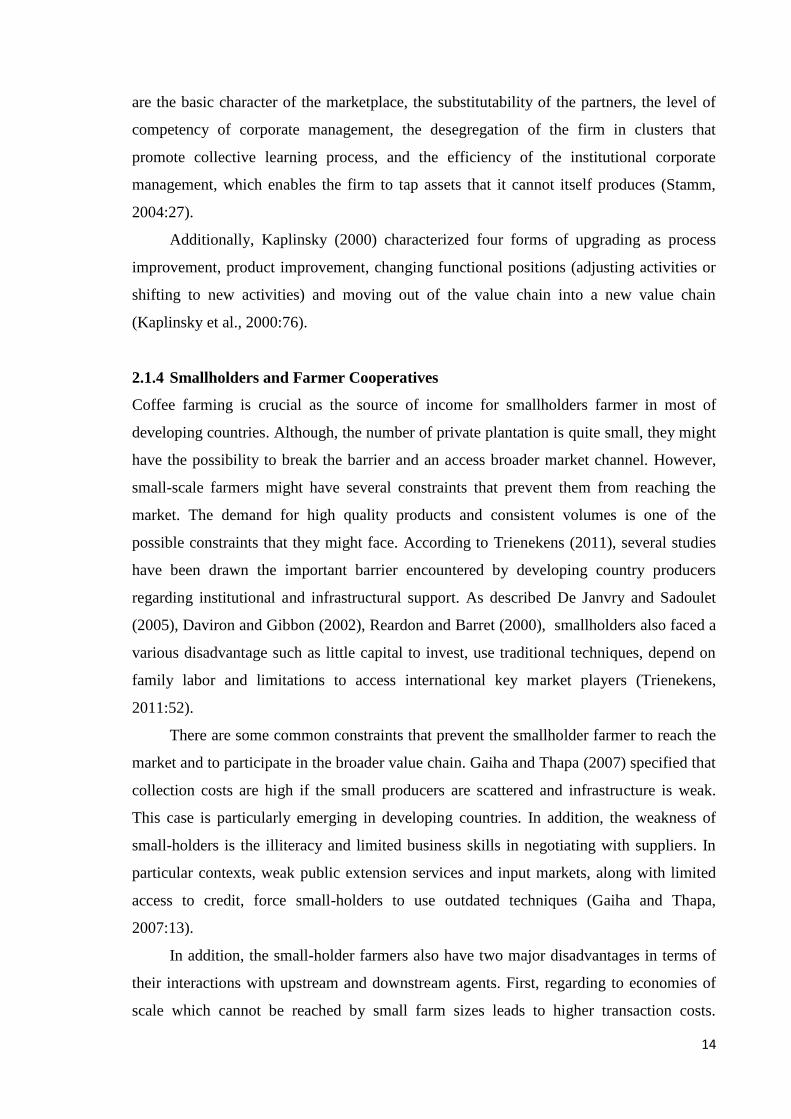
2.1.4 Smallholders and Farmer Cooperatives
Coffee farming is crucial as the source of income for smallholders farmer in most of
developing countries. Although, the number of private plantation is quite small, they might
have the possibility to break the barrier and an access broader market channel. However,
small-scale farmers might have several constraints that prevent them from reaching the
market. The demand for high quality products and consistent volumes is one of the
possible constraints that they might face. According to Trienekens (2011), several studies
have been drawn the important barrier encountered by developing country producers
regarding institutional and infrastructural support. As described De Janvry and Sadoulet
(2005), Daviron and Gibbon (2002), Reardon and Barret (2000), smallholders also faced a
various disadvantage such as little capital to invest, use traditional techniques, depend on
family labor and limitations to access international key market players (Trienekens,
2011:52).
There are some common constraints that prevent the smallholder farmer to reach the
market and to participate in the broader value chain. Gaiha and Thapa (2007) specified that
collection costs are high if the small producers are scattered and infrastructure is weak.
This case is particularly emerging in developing countries. In addition, the weakness of
small-holders is the illiteracy and limited business skills in negotiating with suppliers. In
particular contexts, weak public extension services and input markets, along with limited
access to credit, force small-holders to use outdated techniques (Gaiha and Thapa,
2007:13).
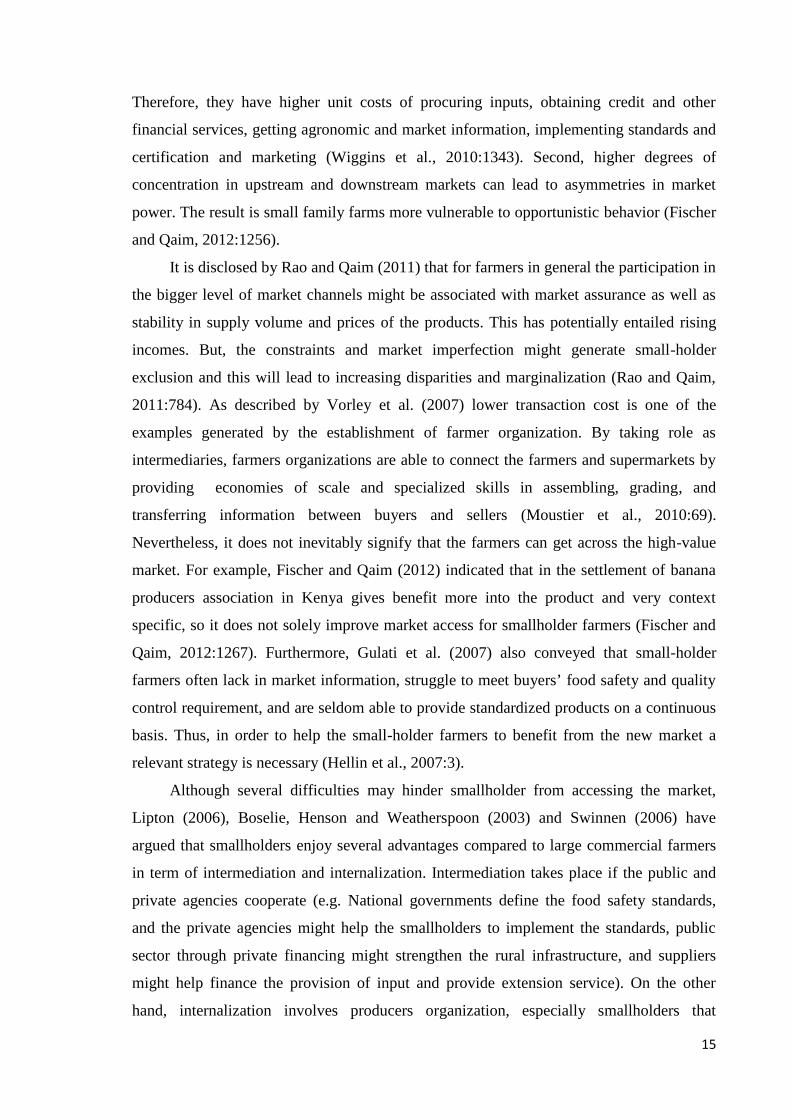
In addition, the small-holder farmers also have two major disadvantages in terms of
their interactions with upstream and downstream agents. First, regarding to economies of
scale which cannot be reached by small farm sizes leads to higher transaction costs.
15
Therefore, they have higher unit costs of procuring inputs, obtaining credit and other
financial services, getting agronomic and market information, implementing standards and
certification and marketing (Wiggins et al., 2010:1343). Second, higher degrees of
concentration in upstream and downstream markets can lead to asymmetries in market
power. The result is small family farms more vulnerable to opportunistic behavior (Fischer
and Qaim, 2012:1256).
It is disclosed by Rao and Qaim (2011) that for farmers in general the participation in
the bigger level of market channels might be associated with market assurance as well as
stability in supply volume and prices of the products. This has potentially entailed rising
incomes. But, the constraints and market imperfection might generate small-holder
exclusion and this will lead to increasing disparities and marginalization (Rao and Qaim,
2011:784). As described by Vorley et al. (2007) lower transaction cost is one of the
examples generated by the establishment of farmer organization. By taking role as
intermediaries, farmers organizations are able to connect the farmers and supermarkets by
providing economies of scale and specialized skills in assembling, grading, and
transferring information between buyers and sellers (Moustier et al., 2010:69).
Nevertheless, it does not inevitably signify that the farmers can get across the high-value
market. For example, Fischer and Qaim (2012) indicated that in the settlement of banana
producers association in Kenya gives benefit more into the product and very context
specific, so it does not solely improve market access for smallholder farmers (Fischer and
Qaim, 2012:1267). Furthermore, Gulati et al. (2007) also conveyed that small-holder
farmers often lack in market information, struggle to meet buyers’ food safety and quality
control requirement, and are seldom able to provide standardized products on a continuous
basis. Thus, in order to help the small-holder farmers to benefit from the new market a
relevant strategy is necessary (Hellin et al., 2007:3).
Although several difficulties may hinder smallholder from accessing the market,
Lipton (2006), Boselie, Henson and Weatherspoon (2003) and Swinnen (2006) have
argued that smallholders enjoy several advantages compared to large commercial farmers
in term of intermediation and internalization. Intermediation takes place if the public and
private agencies cooperate (e.g. National governments define the food safety standards,
and the private agencies might help the smallholders to implement the standards, public
sector through private financing might strengthen the rural infrastructure, and suppliers
might help finance the provision of input and provide extension service). On the other
hand, internalization involves producers organization, especially smallholders that
16
negotiate production and marketing arrangements with the suppliers (Gaiha and Thapa,
2007:13).
Several researches show the example of how small - holder farmers can access the
retail market and one of those is through collective action. Hellin et al. (2007) used the
term of collective action as voluntary action taken by a group to achieve common interests.
Collective action can exist even in the absence of farmer organization, which is commonly
seen as the formal expression of collective action (Hellin et al., 2007:5).
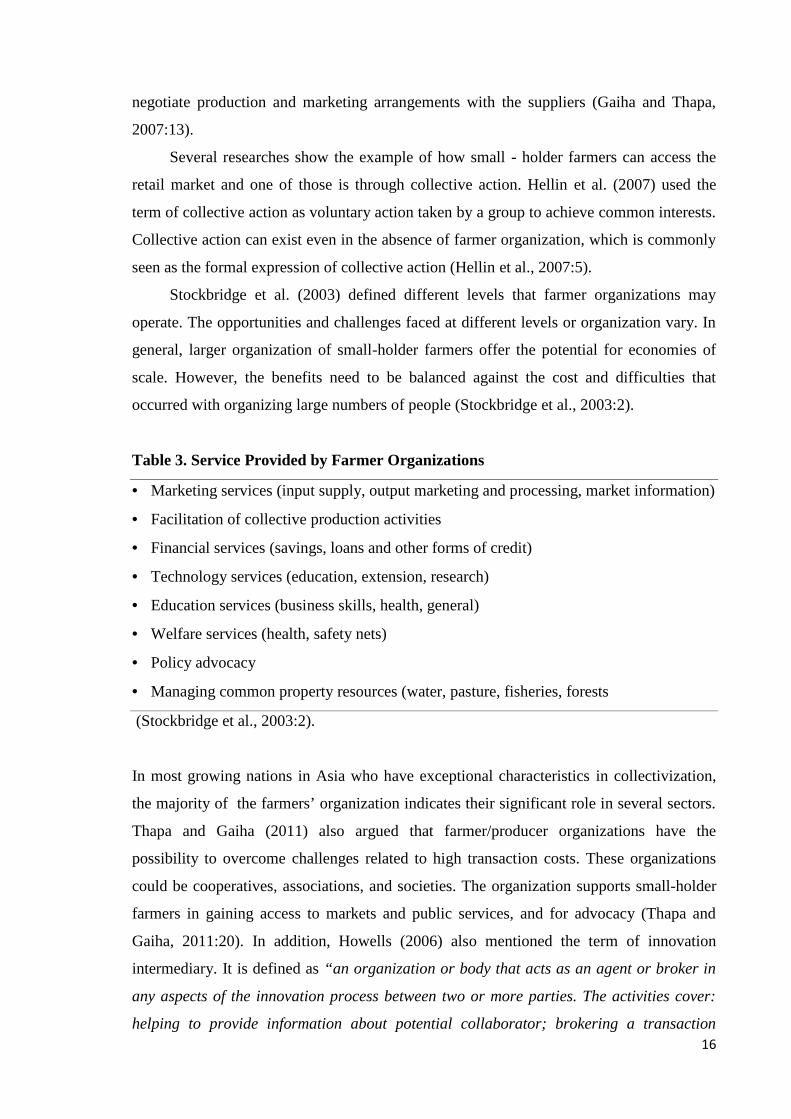
Stockbridge et al. (2003) defined different levels that farmer organizations may
operate. The opportunities and challenges faced at different levels or organization vary. In
general, larger organization of small-holder farmers offer the potential for economies of
scale. However, the benefits need to be balanced against the cost and difficulties that
occurred with organizing large numbers of people (Stockbridge et al., 2003:2).
Table 3. Service Provided by Farmer Organizations
Marketing services (input supply, output marketing and processing, market information)
Facilitation of collective production activities
Financial services (savings, loans and other forms of credit)
Technology services (education, extension, research)
Education services (business skills, health, general)
Welfare services (health, safety nets)
Policy advocacy
Managing common property resources (water, pasture, fisheries, forests
(Stockbridge et al., 2003:2).
In most growing nations in Asia who have exceptional characteristics in collectivization,
the majority of the farmers’ organization indicates their significant role in several sectors.
Thapa and Gaiha (2011) also argued that farmer/producer organizations have the
possibility to overcome challenges related to high transaction costs. These organizations
could be cooperatives, associations, and societies. The organization supports small-holder
farmers in gaining access to markets and public services, and for advocacy (Thapa and
Gaiha, 2011:20). In addition, Howells (2006) also mentioned the term of innovation
intermediary. It is defined as “an organization or body that acts as an agent or broker in
any aspects of the innovation process between two or more parties. The activities cover:
helping to provide information about potential collaborator; brokering a transaction
17
between actors; acting as a mediator, or go-between, for bodies or organizations that are
already collaborating; and helping find advice, funding and support for the innovation
outcomes of such collaborations” (Yang et al., 2014:115).
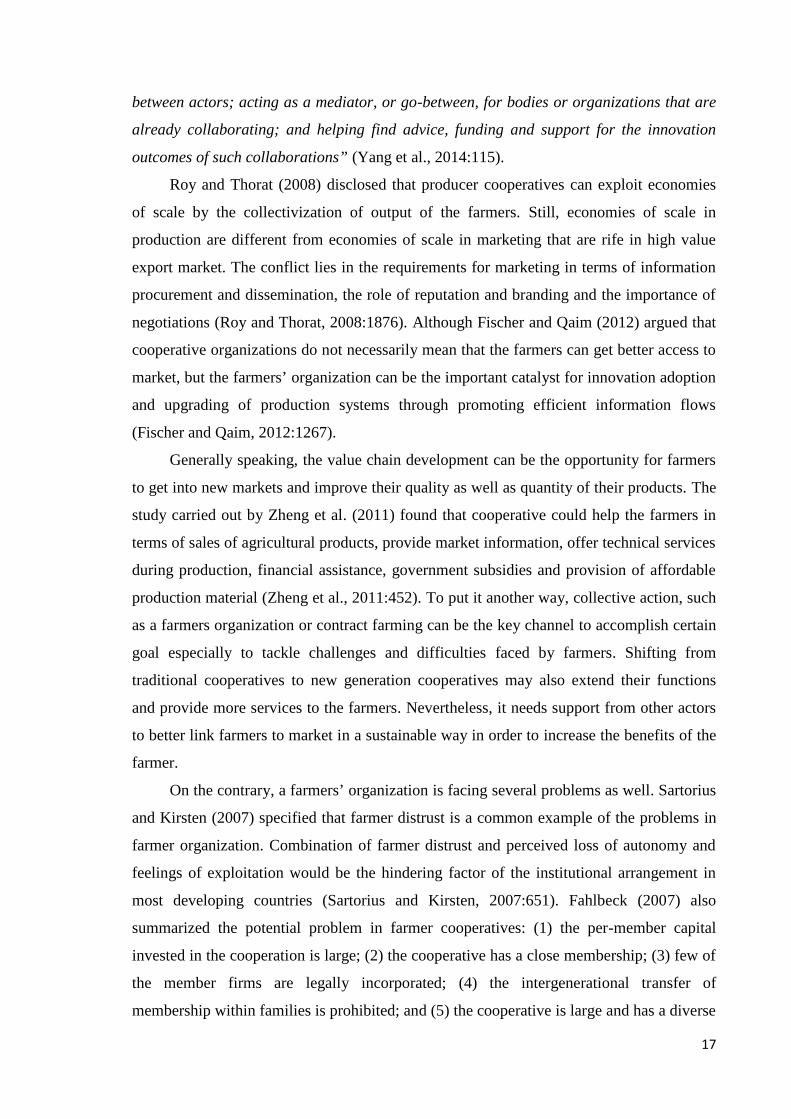
Roy and Thorat (2008) disclosed that producer cooperatives can exploit economies
of scale by the collectivization of output of the farmers. Still, economies of scale in
production are different from economies of scale in marketing that are rife in high value
export market. The conflict lies in the requirements for marketing in terms of information
procurement and dissemination, the role of reputation and branding and the importance of
negotiations (Roy and Thorat, 2008:1876). Although Fischer and Qaim (2012) argued that
cooperative organizations do not necessarily mean that the farmers can get better access to
market, but the farmers’ organization can be the important catalyst for innovation adoption
and upgrading of production systems through promoting efficient information flows
(Fischer and Qaim, 2012:1267).
Generally speaking, the value chain development can be the opportunity for farmers
to get into new markets and improve their quality as well as quantity of their products. The
study carried out by Zheng et al. (2011) found that cooperative could help the farmers in
terms of sales of agricultural products, provide market information, offer technical services
during production, financial assistance, government subsidies and provision of affordable
production material (Zheng et al., 2011:452). To put it another way, collective action, such
as a farmers organization or contract farming can be the key channel to accomplish certain
goal especially to tackle challenges and difficulties faced by farmers. Shifting from
traditional cooperatives to new generation cooperatives may also extend their functions
and provide more services to the farmers. Nevertheless, it needs support from other actors
to better link farmers to market in a sustainable way in order to increase the benefits of the
farmer.
On the contrary, a farmers’ organization is facing several problems as well. Sartorius
and Kirsten (2007) specified that farmer distrust is a common example of the problems in
farmer organization. Combination of farmer distrust and perceived loss of autonomy and
feelings of exploitation would be the hindering factor of the institutional arrangement in
most developing countries (Sartorius and Kirsten, 2007:651). Fahlbeck (2007) also
summarized the potential problem in farmer cooperatives: (1) the per-member capital
invested in the cooperation is large; (2) the cooperative has a close membership; (3) few of
the member firms are legally incorporated; (4) the intergenerational transfer of
membership within families is prohibited; and (5) the cooperative is large and has a diverse

18
membership (Fahlbeck, 2007:257). In addition, Mujawamariya (2013) has been listed
internal and external problems from several studies. Free riding, noncompliance,
underinvestment, poor management, membership desertion and heterogeneity among
members will affect cooperatives’ efficiency and effectiveness (Mujamariya et al.,
2013:73).
For this reason, several assistances are needed to strengthen the role or the power of
farmer organization in the higher market either for upstream or downstream level. Thus, it
is sometimes important to include the outsiders to the farmer cooperatives. The facilitator
plays a crucial role by catalyzing the collective action, provide information and technical
assistance, and builds the capacity of a group to be effectively engaged in marketing
activities (Markelova et al., 2009:5). The government role is also important to flourish the
cooperatives, as stated by Birchall (2003, 2004), government support in form of small
grants, policy frameworks and regulation have the ability to empower cooperatives
member and support cooperatives enterprises (Borda-Rodriguez and Vicari, 2014:45).
Additionally, Borda-Rodriguez and Vicari (2014) studied the factors of the resiliency
of the cooperatives; (1) membership that further explained by the characteristics of the
membership in the cooperatives (homogenous/heterogeneous, benefits and members’
loyalty, women’s inclusion; (2) collective skills: cooperatives as a collective space of
learning; (3) networks as access to knowledge and resources; (4) innovation that will
reduce donor dependency, increase members’ loyalty, improve the expertise, upgrade the
production process, as well as enable them to participate in national and international
markets; (5) role of government (Borda-Rodriguez and Vicari, 2014:47 ff).
2.2 Empirical Evidences
A global coffee crisis situation since the early 1990s has been noted by Linton (2005). The
coffee crisis resulting a rising number in poverty case, especially for farmers. The majority
of the coffee farmers is suffering while Northern consumers continue to pay premium
prices for the coffee they consume. In response to ensure that coffee production is
sustainable in term of farmers’ socio-economic condition as well as the environment, new
standards do emerge via self-regulation (Linton, 2005:600 ff).
In terms of regulation systems, Muradian and Pelupessy (2005) showed the effect of
voluntary regulation systems towards the position of the farmers in the coffee chain. The
application of the voluntary regulation systems in the chain generates two potential
benefits: (i) it increases the ability to reap economic rent (upgrading) and (ii) it improves
19
the chances of gaining access to, or remaining in, a particular market (Muradian and
Pelupessy, 2005:2036).
Saarelainen and Sievers (2011) expanded the purpose of collective action
organization depending on the activities it carries on. The potential action is through
vertical coordination (buyer-seller relationship) and horizontal coordination (inter-firm
coordination, linkages to service providers and to policy makers). However, it frequently
occurs that there is a combination of horizontal and vertical coordination in the chain. The
organizations are taking on more proactive roles, higher-up or further-down the chain and
engaging in value chain integration (Saarelainen and Sievers, 2011:4).
Furthermore, Saarelainen and Sievers (2011) have drawn the example of engagement
between farmer cooperatives, international organization, and local government in soybean
production and value chain addition in Kenya. The cooperative is able to improve the value
chain by providing training, high-quality input (seeds, fertilizer) as well as soft loans for
participating farmers. In addition, the cooperative encourages the farmer to adopt the value
added processing in three different levels; household level, cottage level, and industry
level. The cooperative also facilitated the market linkages and identified a potential market
both for domestic and export market (Saarelainen and Sievers, 2011:5).
Fromm (2007) disclosed the case of upgrading the value chain done by smallholder
producers in Honduras. In the context of the product upgrading, the driving factors for the
small producers to change and improve the product are competitiveness among producers,
consumer demand, new market opportunities, and “tools” to survive in the business. While
in the process upgrading, small producers implemented changes through field practices and
post-harvest management. Functional upgrading defined as the value addition practice by
changing the mix of activities carried out within the firm or moving the locus of activities
to different links in the value chain. And the research indicated that competitiveness is the
primary concern for most firms to implement improvements toward functional upgrading
(Fromm, 2007:18 ff).
Wollni and Zeller (2007) showed empirical evidence in coffee marketing in Costa
Rica. Membership in cooperatives has an adequate effect to the inclusion of the coffee
farmer in specialized markets. In addition, smallholder farmers are more likely to market
their coffee through cooperative channels as opposed to private channels (Wollni and
Zeller, 2007:10 ff).
In the context of membership in cooperative, Borda-Rodriguez and Vicari (2014)
further elaborated the membership as the factor of cooperative’s resilience based on the

20
type of diversity (heterogeneous or homogeneous), benefits and members’ loyalty, and
women’s inclusion. Although the problem generated by the diversity of the member is rare,
‘diverse’ membership can be a cause of concern because it has the potency to weaken
cooperative governance. Members may have different interests and expectations and
therefore governance can be a subject of conflict process. In the context of members’
loyalty, it depends on the level of members’ satisfaction towards services and benefits
gained by the members. In addition, low levels of literacy and lack of understanding of the
mechanism of cooperative work also affect the members’ loyalty (Borda-Rodriguez and
Vicari, 2014:47 ff).
Training and extension programs also mentioned as the factor that affect the
participation of smallholder farmers in the specialty market. According to Wollni and
Zeller (2007), the probability of farmer’s participation will increase if farmers received
training and extension program in quality enhancing practiced. Nevertheless, education and
experience have a significant and positive effect on farmer’s participation (Wollni and
Zeller, 2007:10).
Meanwhile, Barham and Chitemi (2009) have investigated the collective action
initiatives to improve marketing performance. In the context of infrastructure, the
commodities and the source of input are the driving forces to improve the marketing
performance. And variables in the social structure (group maturity, number of group
activities, a higher proportion of male leaders, and better educated groups) can play an
enabling role in a group’s ability to take advantage of market opportunities (Barham and
Chitemi, 2009:59).
2.3 Remarks from Literature Review
Based on the research studies, the value chain approach creates a comprehensive figure of
the various activities involved in the coffee sector, the role of each actor along the chain
and the coordination mechanism between actors. Saarelainen and Sievers (2011) have
made a clear picture of the role of cooperative to improve the value chain by providing
various input factors as well as market linkages for domestic and international market
(Saarelainen and Sievers, 2011:5). Therefore, the study makes an attempt to use the value
chain analysis, the concept of governance as well as the theory of cooperative to see the
engagement of cooperative in the coffee value chain in the study area.
21
CHAPTER 3. METHODOLOGY
This chapter covers the outline of the research methodology used in the study. The first
part aims at elaborating the conceptual framework used to see the coffee value chain in
Manggarai and the coordination amongst actors. And the following part accounts the
general characteristics of the study area, sampling procedures and description of the
analysis.
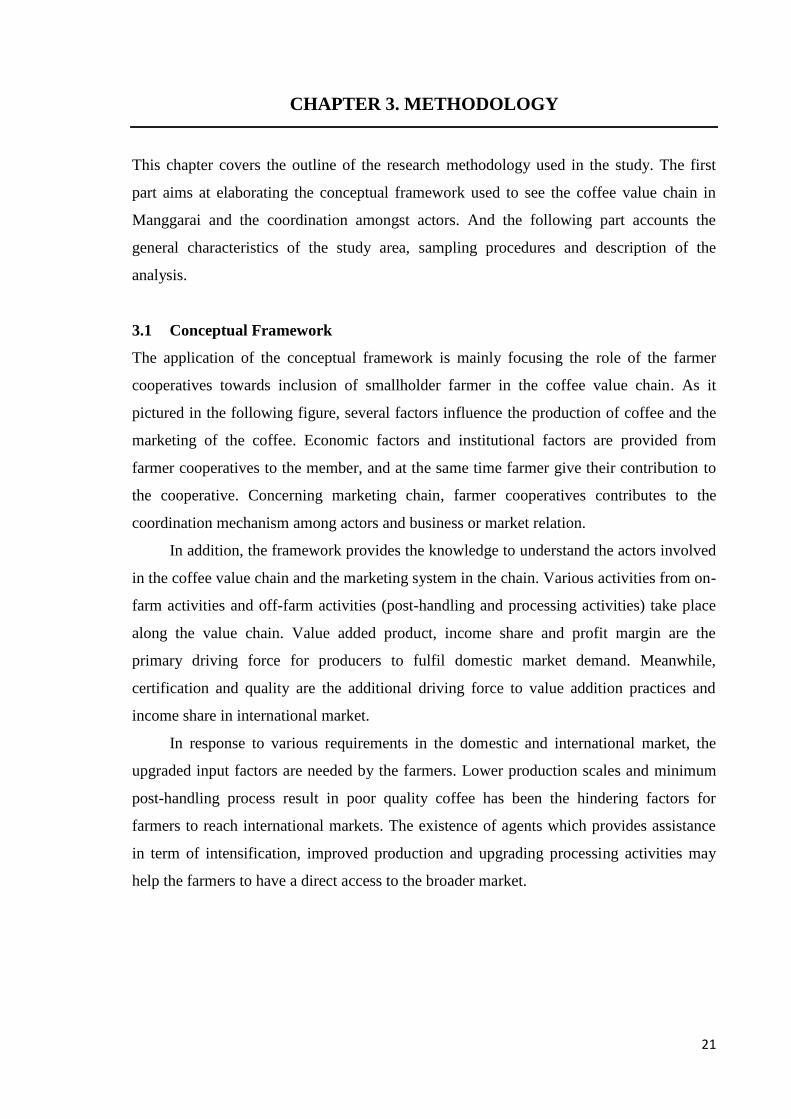
3.1 Conceptual Framework
The application of the conceptual framework is mainly focusing the role of the farmer
cooperatives towards inclusion of smallholder farmer in the coffee value chain. As it
pictured in the following figure, several factors influence the production of coffee and the
marketing of the coffee. Economic factors and institutional factors are provided from
farmer cooperatives to the member, and at the same time farmer give their contribution to
the cooperative. Concerning marketing chain, farmer cooperatives contributes to the
coordination mechanism among actors and business or market relation.
In addition, the framework provides the knowledge to understand the actors involved
in the coffee value chain and the marketing system in the chain. Various activities from on-
farm activities and off-farm activities (post-handling and processing activities) take place
along the value chain. Value added product, income share and profit margin are the
primary driving force for producers to fulfil domestic market demand. Meanwhile,
certification and quality are the additional driving force to value addition practices and
income share in international market.
In response to various requirements in the domestic and international market, the
upgraded input factors are needed by the farmers. Lower production scales and minimum
post-handling process result in poor quality coffee has been the hindering factors for
farmers to reach international markets. The existence of agents which provides assistance
in term of intensification, improved production and upgrading processing activities may
help the farmers to have a direct access to the broader market.
22
Figure 3. Conceptual Framework in the Coffee Value Chain
3.2 Research Methods
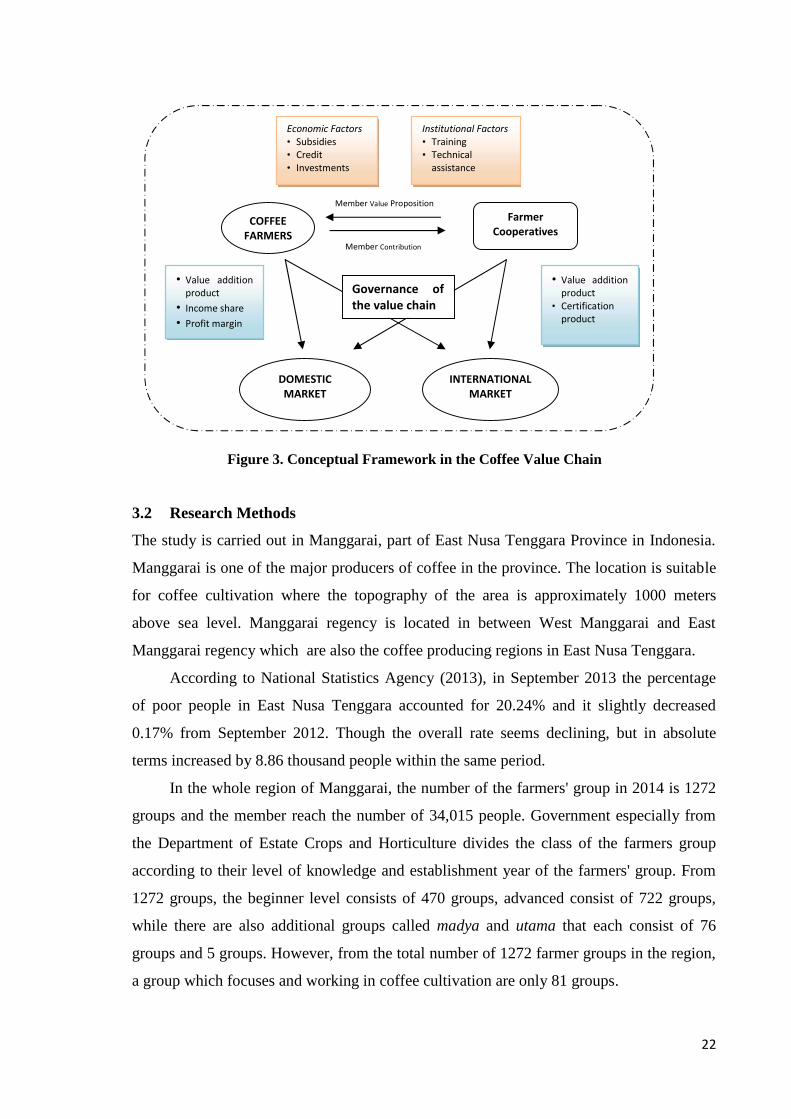
The study is carried out in Manggarai, part of East Nusa Tenggara Province in Indonesia.
Manggarai is one of the major producers of coffee in the province. The location is suitable
for coffee cultivation where the topography of the area is approximately 1000 meters
above sea level. Manggarai regency is located in between West Manggarai and East
Manggarai regency which are also the coffee producing regions in East Nusa Tenggara.
According to National Statistics Agency (2013), in September 2013 the percentage
of poor people in East Nusa Tenggara accounted for 20.24% and it slightly decreased
0.17% from September 2012. Though the overall rate seems declining, but in absolute
terms increased by 8.86 thousand people within the same period.
In the whole region of Manggarai, the number of the farmers' group in 2014 is 1272
groups and the member reach the number of 34,015 people. Government especially from
the Department of Estate Crops and Horticulture divides the class of the farmers group
according to their level of knowledge and establishment year of the farmers' group. From
1272 groups, the beginner level consists of 470 groups, advanced consist of 722 groups,
while there are also additional groups called madya and utama that each consist of 76
groups and 5 groups. However, from the total number of 1272 farmer groups in the region,
a group which focuses and working in coffee cultivation are only 81 groups.
Institutional Factors• Training• Technical
assistance
• Value additionproduct
• Income share• Profit margin
COFFEEFARMERS
FarmerCooperatives
DOMESTICMARKET
INTERNATIONALMARKET
• Value additionproduct
• Certificationproduct
Economic Factors• Subsidies• Credit• Investments
Member Value Proposition
Member Contribution
Governance ofthe value chain

23
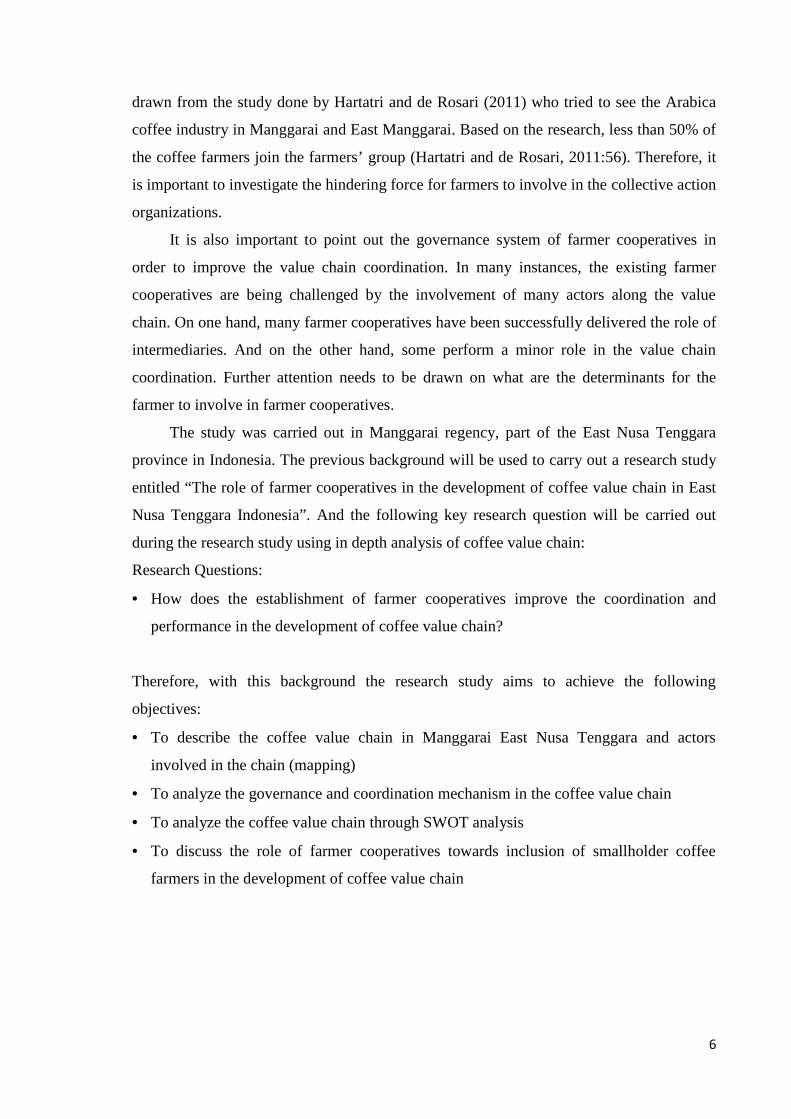
Map showing the Two Major Coffee-growing Regions in Flores
Source: Marsh et al. (2007:9)
Figure 4. Map of the Study Region in Manggarai, East Nusa Tenggara, Indonesia
Source: National Statistics Agency (BPS) Manggarai Regency, 2014
24
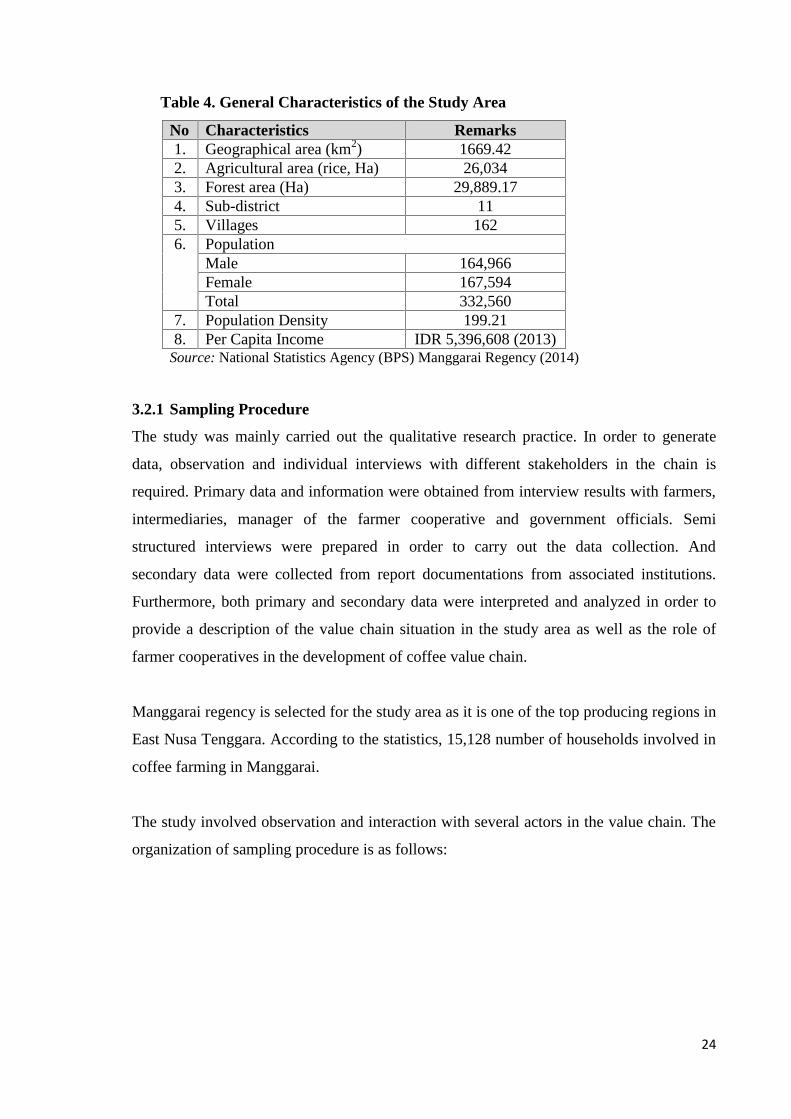
Table 4. General Characteristics of the Study Area
No Characteristics Remarks1. Geographical area (km2) 1669.422. Agricultural area (rice, Ha) 26,0343. Forest area (Ha) 29,889.174. Sub-district 115. Villages 1626. Population
Male 164,966Female 167,594Total 332,560
7. Population Density 199.218. Per Capita Income IDR 5,396,608 (2013)
Source: National Statistics Agency (BPS) Manggarai Regency (2014)
3.2.1 Sampling Procedure
The study was mainly carried out the qualitative research practice. In order to generate
data, observation and individual interviews with different stakeholders in the chain is
required. Primary data and information were obtained from interview results with farmers,
intermediaries, manager of the farmer cooperative and government officials. Semi
structured interviews were prepared in order to carry out the data collection. And
secondary data were collected from report documentations from associated institutions.
Furthermore, both primary and secondary data were interpreted and analyzed in order to
provide a description of the value chain situation in the study area as well as the role of
farmer cooperatives in the development of coffee value chain.
Manggarai regency is selected for the study area as it is one of the top producing regions in
East Nusa Tenggara. According to the statistics, 15,128 number of households involved in
coffee farming in Manggarai.
The study involved observation and interaction with several actors in the value chain. The
organization of sampling procedure is as follows:
25
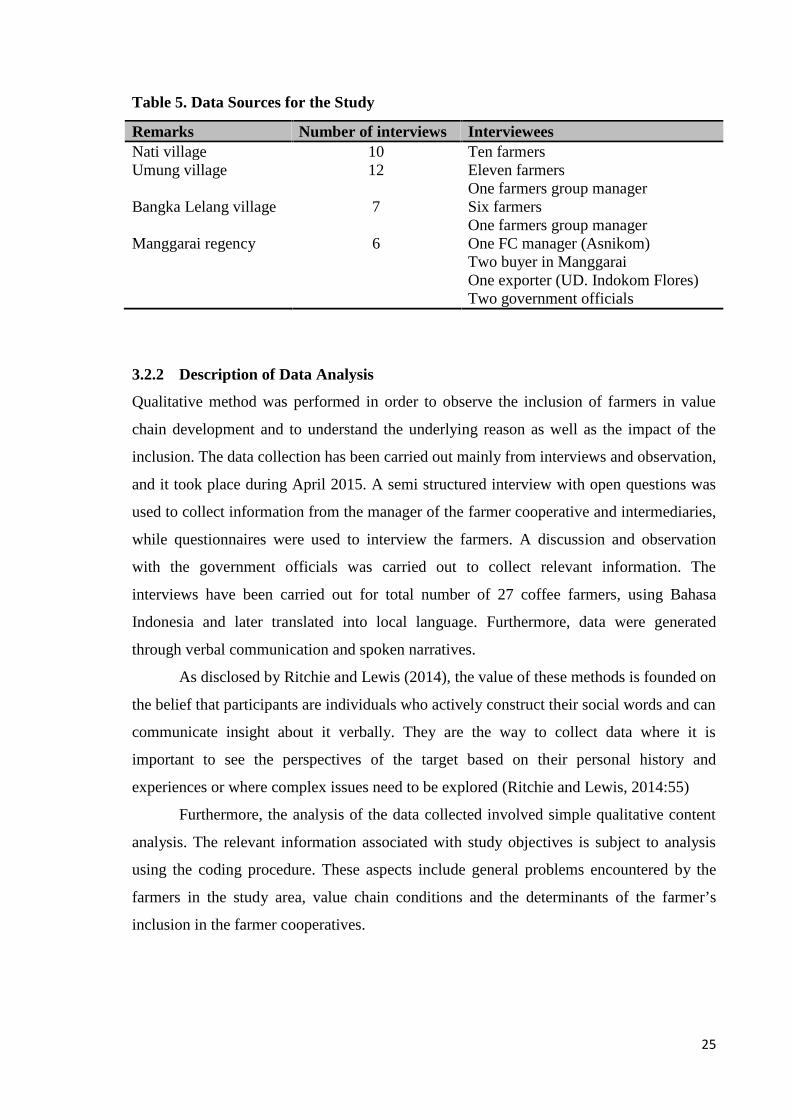
Table 5. Data Sources for the Study
Remarks Number of interviews IntervieweesNati village 10 Ten farmersUmung village 12 Eleven farmers
One farmers group managerBangka Lelang village 7 Six farmers
One farmers group managerManggarai regency 6 One FC manager (Asnikom)
Two buyer in ManggaraiOne exporter (UD. Indokom Flores)Two government officials
3.2.2 Description of Data Analysis
Qualitative method was performed in order to observe the inclusion of farmers in value
chain development and to understand the underlying reason as well as the impact of the
inclusion. The data collection has been carried out mainly from interviews and observation,
and it took place during April 2015. A semi structured interview with open questions was
used to collect information from the manager of the farmer cooperative and intermediaries,
while questionnaires were used to interview the farmers. A discussion and observation
with the government officials was carried out to collect relevant information. The
interviews have been carried out for total number of 27 coffee farmers, using Bahasa
Indonesia and later translated into local language. Furthermore, data were generated
through verbal communication and spoken narratives.
As disclosed by Ritchie and Lewis (2014), the value of these methods is founded on
the belief that participants are individuals who actively construct their social words and can
communicate insight about it verbally. They are the way to collect data where it is
important to see the perspectives of the target based on their personal history and
experiences or where complex issues need to be explored (Ritchie and Lewis, 2014:55)
Furthermore, the analysis of the data collected involved simple qualitative content
analysis. The relevant information associated with study objectives is subject to analysis
using the coding procedure. These aspects include general problems encountered by the
farmers in the study area, value chain conditions and the determinants of the farmer’s
inclusion in the farmer cooperatives.

26
3.3 Limitations of The Study
The research undertaken to perform the study encompasses some limitations. Time was the
primary constraint in order to collect a large sample of data. As this is also individual
project, therefore the sample size was limited to 27 farmers and few key informants. The
research method mainly used qualitative tools. Another factor hindering the in-depth
analysis of the study was the location of the farmers which were isolated and scattered. The
information taken from the farmers and also from the key informants consist of some
approximations, especially for the size, production and income issues, which lead to bias.
Given that the study was only carried out in 3 farmers group in the whole regency, it may
not represent the factual case of the regency.
Seasonal bias: conducting field work during off season takes away the advantages to
observe the harvesting activity, collecting and selling process of coffee as well as to
observe the market and the price mechanism in the coffee sector in the study area.
Hierarchical bias: as most of the interviews was arranged by the government officials
(Department of Estate Crops and Horticulture), thus the selected location for the study
were predominantly chosen by the officials. Although the selection was based on the
appropriateness to the objectives, nevertheless it might lead to bias.
Interpretative bias: due to the fact that most farmers only speak the local language,
therefore translations were done by the government official. However, although there
was an attempt to confirm the answer by asking in different ways, there can be bias
related to translations and interpretations from local language to Bahasa Indonesia.
27
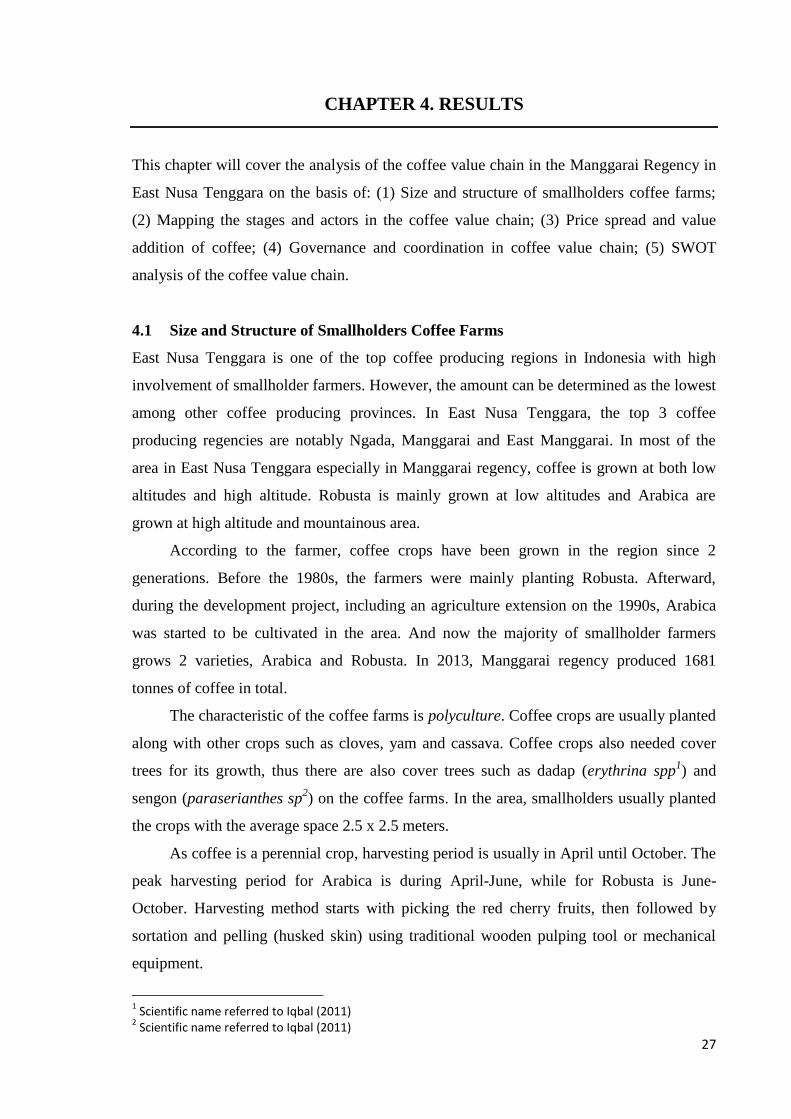
CHAPTER 4. RESULTS
This chapter will cover the analysis of the coffee value chain in the Manggarai Regency in
East Nusa Tenggara on the basis of: (1) Size and structure of smallholders coffee farms;
(2) Mapping the stages and actors in the coffee value chain; (3) Price spread and value
addition of coffee; (4) Governance and coordination in coffee value chain; (5) SWOT
analysis of the coffee value chain.
4.1 Size and Structure of Smallholders Coffee Farms
East Nusa Tenggara is one of the top coffee producing regions in Indonesia with high
involvement of smallholder farmers. However, the amount can be determined as the lowest
among other coffee producing provinces. In East Nusa Tenggara, the top 3 coffee
producing regencies are notably Ngada, Manggarai and East Manggarai. In most of the
area in East Nusa Tenggara especially in Manggarai regency, coffee is grown at both low
altitudes and high altitude. Robusta is mainly grown at low altitudes and Arabica are
grown at high altitude and mountainous area.
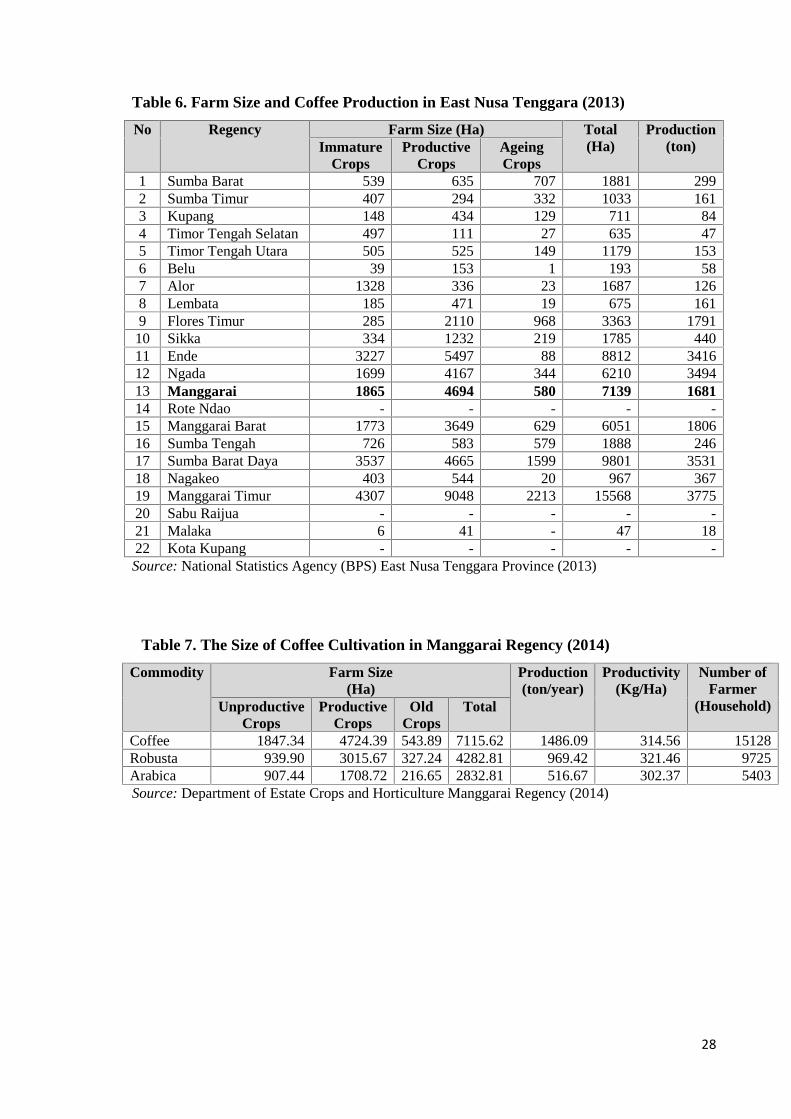
According to the farmer, coffee crops have been grown in the region since 2
generations. Before the 1980s, the farmers were mainly planting Robusta. Afterward,
during the development project, including an agriculture extension on the 1990s, Arabica
was started to be cultivated in the area. And now the majority of smallholder farmers
grows 2 varieties, Arabica and Robusta. In 2013, Manggarai regency produced 1681
tonnes of coffee in total.
The characteristic of the coffee farms is polyculture. Coffee crops are usually planted
along with other crops such as cloves, yam and cassava. Coffee crops also needed cover
trees for its growth, thus there are also cover trees such as dadap (erythrina spp1) and
sengon (paraserianthes sp2) on the coffee farms. In the area, smallholders usually planted
the crops with the average space 2.5 x 2.5 meters.
As coffee is a perennial crop, harvesting period is usually in April until October. The
peak harvesting period for Arabica is during April-June, while for Robusta is June-
October. Harvesting method starts with picking the red cherry fruits, then followed by
sortation and pelling (husked skin) using traditional wooden pulping tool or mechanical
equipment.
1 Scientific name referred to Iqbal (2011)2 Scientific name referred to Iqbal (2011)
28
Table 6. Farm Size and Coffee Production in East Nusa Tenggara (2013)
No Regency Farm Size (Ha) Total(Ha)
Production(ton)Immature
CropsProductive
CropsAgeingCrops
1 Sumba Barat 539 635 707 1881 2992 Sumba Timur 407 294 332 1033 1613 Kupang 148 434 129 711 844 Timor Tengah Selatan 497 111 27 635 475 Timor Tengah Utara 505 525 149 1179 1536 Belu 39 153 1 193 587 Alor 1328 336 23 1687 1268 Lembata 185 471 19 675 1619 Flores Timur 285 2110 968 3363 179110 Sikka 334 1232 219 1785 44011 Ende 3227 5497 88 8812 341612 Ngada 1699 4167 344 6210 349413 Manggarai 1865 4694 580 7139 168114 Rote Ndao - - - - -15 Manggarai Barat 1773 3649 629 6051 180616 Sumba Tengah 726 583 579 1888 24617 Sumba Barat Daya 3537 4665 1599 9801 353118 Nagakeo 403 544 20 967 36719 Manggarai Timur 4307 9048 2213 15568 377520 Sabu Raijua - - - - -21 Malaka 6 41 - 47 1822 Kota Kupang - - - - -Source: National Statistics Agency (BPS) East Nusa Tenggara Province (2013)
Table 7. The Size of Coffee Cultivation in Manggarai Regency (2014)
Commodity Farm Size(Ha)
Production(ton/year)
Productivity(Kg/Ha)
Number ofFarmer
(Household)UnproductiveCrops
ProductiveCrops
OldCrops
Total
Coffee 1847.34 4724.39 543.89 7115.62 1486.09 314.56 15128Robusta 939.90 3015.67 327.24 4282.81 969.42 321.46 9725Arabica 907.44 1708.72 216.65 2832.81 516.67 302.37 5403Source: Department of Estate Crops and Horticulture Manggarai Regency (2014)

29
4.2 Mapping of the Coffee Value Chain
Neilson (2008) described that it is common for coffee to change hands three or four times
along traditional trade networks before reaching exporter agents or processing mills. Since
the nationalization of Dutch-held estates in 1957 (described by Neilson, 2008), coffee
sector in Indonesia is liberalized and market situation thus becomes independent despite
the limited intervention from the government regarding export quota (Neilson, 2008:1613).
The following map of the coffee value chain reflects the sequence of stages involved in
distribution of coffee from smallholders to consumers in domestic and international
markets.
Figure 5. Mapping of Coffee Value Chain in Manggarai
Source: own compilation and adapted from Neilson (2014)
Dry Parchment
Farmer
AsnikomCollector
Farmer Farmer
Dry Parchment
Sorted Parchment
ExporterPT. Indokom Citra
Persada UD. Nugi Indah UD. AnekaUD. Monas
USA, Germany, Australia,Middle East
Inter Island Trade
Sorted & Roasted CoffeeGraded Coffee
Domestic Consumers
Local Trader & Distributor
c.a 20% of production is consumed bydomestic consumers (mostly Robusta)
c.a 75% of production is exported as greenbeans, and 5% is exported as processedcoffee
Processed Coffee
30
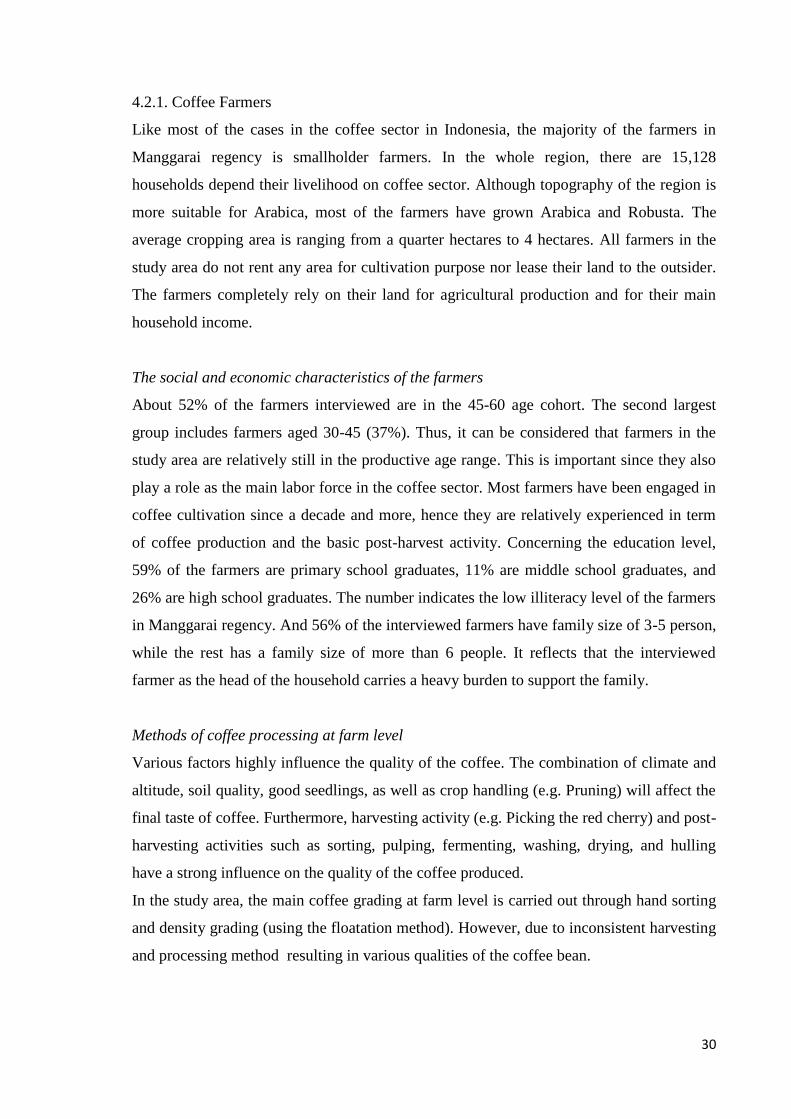
4.2.1. Coffee Farmers
Like most of the cases in the coffee sector in Indonesia, the majority of the farmers in
Manggarai regency is smallholder farmers. In the whole region, there are 15,128
households depend their livelihood on coffee sector. Although topography of the region is
more suitable for Arabica, most of the farmers have grown Arabica and Robusta. The
average cropping area is ranging from a quarter hectares to 4 hectares. All farmers in the
study area do not rent any area for cultivation purpose nor lease their land to the outsider.
The farmers completely rely on their land for agricultural production and for their main
household income.
The social and economic characteristics of the farmers
About 52% of the farmers interviewed are in the 45-60 age cohort. The second largest
group includes farmers aged 30-45 (37%). Thus, it can be considered that farmers in the
study area are relatively still in the productive age range. This is important since they also
play a role as the main labor force in the coffee sector. Most farmers have been engaged in
coffee cultivation since a decade and more, hence they are relatively experienced in term
of coffee production and the basic post-harvest activity. Concerning the education level,
59% of the farmers are primary school graduates, 11% are middle school graduates, and
26% are high school graduates. The number indicates the low illiteracy level of the farmers
in Manggarai regency. And 56% of the interviewed farmers have family size of 3-5 person,
while the rest has a family size of more than 6 people. It reflects that the interviewed
farmer as the head of the household carries a heavy burden to support the family.
Methods of coffee processing at farm level
Various factors highly influence the quality of the coffee. The combination of climate and
altitude, soil quality, good seedlings, as well as crop handling (e.g. Pruning) will affect the
final taste of coffee. Furthermore, harvesting activity (e.g. Picking the red cherry) and post-
harvesting activities such as sorting, pulping, fermenting, washing, drying, and hulling
have a strong influence on the quality of the coffee produced.
In the study area, the main coffee grading at farm level is carried out through hand sorting
and density grading (using the floatation method). However, due to inconsistent harvesting
and processing method resulting in various qualities of the coffee bean.

31
In Manggarai regency, the majority of the farmer applied the basic method of coffee
processing namely wet and dry process. The standard method of coffee processing is as
follows:
Figure 6. Schematic View of Arabica Coffee Processing (Wet Process) in Manggarai
regency
Harvesting (Red Cherry)(95% Moisture Content)
Sortation
Floatation-wet feed
Pulping
Fermentation (18-36hours)
Washing
Drying (sun/mechanicaldrying)
(12% moisture content)
Sortation
Hulling
Sortation
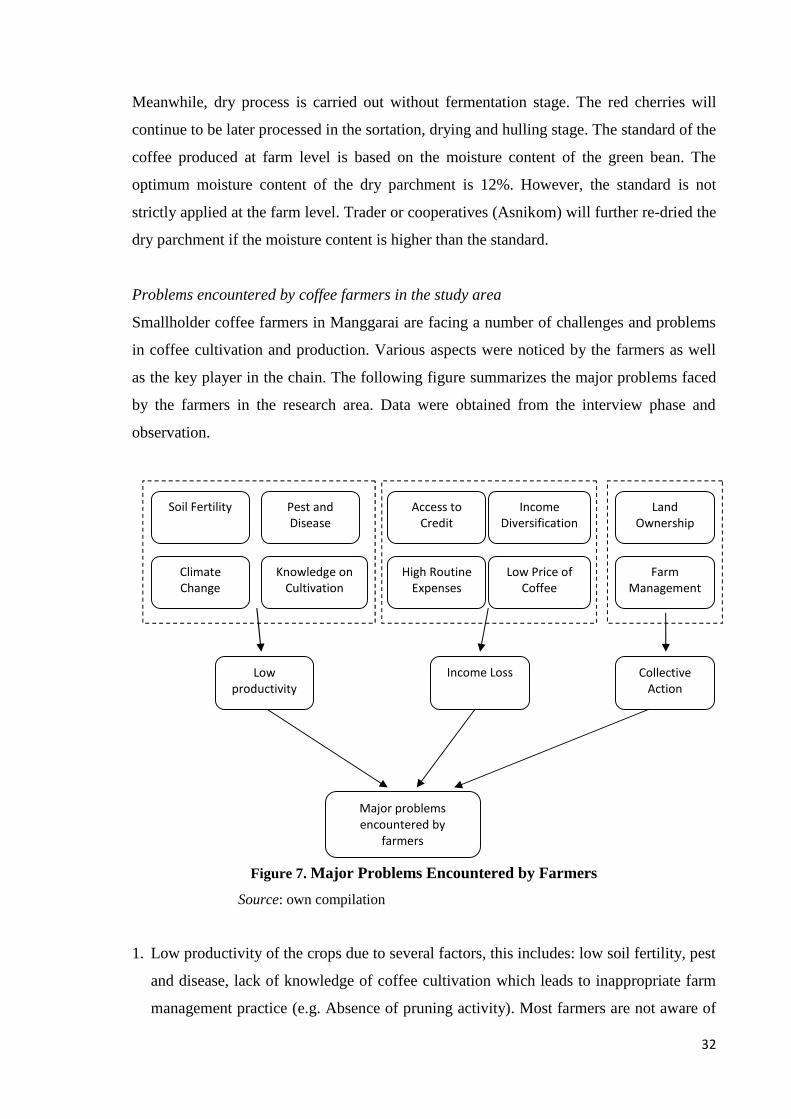
32
Meanwhile, dry process is carried out without fermentation stage. The red cherries will
continue to be later processed in the sortation, drying and hulling stage. The standard of the
coffee produced at farm level is based on the moisture content of the green bean. The
optimum moisture content of the dry parchment is 12%. However, the standard is not
strictly applied at the farm level. Trader or cooperatives (Asnikom) will further re-dried the
dry parchment if the moisture content is higher than the standard.
Problems encountered by coffee farmers in the study area
Smallholder coffee farmers in Manggarai are facing a number of challenges and problems
in coffee cultivation and production. Various aspects were noticed by the farmers as well
as the key player in the chain. The following figure summarizes the major problems faced
by the farmers in the research area. Data were obtained from the interview phase and
observation.
Figure 7. Major Problems Encountered by Farmers
Source: own compilation
1. Low productivity of the crops due to several factors, this includes: low soil fertility, pest
and disease, lack of knowledge of coffee cultivation which leads to inappropriate farm
management practice (e.g. Absence of pruning activity). Most farmers are not aware of
Major problemsencountered by
farmers
Lowproductivity
Pest andDisease
Soil Fertility
Knowledge onCultivation
ClimateChange
Income Loss
High RoutineExpenses
Low Price ofCoffee
Access toCredit
CollectiveAction
FarmManagement
LandOwnership
IncomeDiversification
33
the quality of coffee bean produced since there are few agents to certify the quality of
coffee. In addition, the issue of climate change was mentioned by one farmer in Bangka
Lelang related to the issue of low productivity.
“This year I am quite pessimistic of the coffee production. This year, we are probably
experiencing production decrease, climate influences this condition. I felt that the dry
season is longer than last year.” (Stanislaus Nadur, Bangka Lelang)
2. Income loss due to several factors such as high daily expenses, low price of coffee in
addition to the lack of income diversification, and access to financial resources. In the
context of coffee farming in general, the high cost of farm management reduces the
willingness of farmers to improve the production activity. This resulting in low quality
of the coffee produced, and at the end farmers will bear low price of coffee at the farm-
gate level. Correspondingly, this situation becomes more vulnerable because the
farmers expose their risk on coffee farming as their main source of income. This
resulting in income loss since farmers could not compensate their high routine expenses
from their income from farm activity. Most farmers are willing to improve their
situation, however, they need access to obtain financial resources (credit). In the study
area, many informal credit activities are present. Most farmers depend on informal
credit from relatives or agents (trader) to afford their needs. Thus, the establishment of
institutions or farmer cooperatives, which are able to provide a hassle-free access to
credit with low interest rate, are seen to be relevant.
3. Collective action activity. This problem was specifically mentioned by the farmers in
Umung village due to the recent attacks from hordes of monkeys causing crop damage.
Due to the nature of land ownership in the area, the sort of collective action activities
(e.g. Farm management) often failed to be implemented. Land ownership is varied and
the location is also scattered, the majority of land is owned by farmers in the village
area, and other land belongs to the outsiders. When it comes to collective action
organizations, particularly for farm management purpose (e.g. Pruning, weeding,
monitoring activity), farmers often find it hard to oversee the land which belongs to the
outsiders. However, if they simply neglect it, it will affect the farm condition in general.
In addition to the problems encountered by farmers, key experts also addressed several
challenges that prevent farmers to integrate to the international market. The main reason is
a low quantity of supply and quality inconsistency of the coffee produced at the farm level.
In term of quantity, the production of coffee in Manggarai regency is notably low, most
34
farmers are unable to fulfil the standard quantity required by the exporter. Therefore,
exporter prefers to purchase coffee bean from cooperatives or other form of collective
action to secure the quantity of supply. On the other hand, farmers are also facing a number
of challenges to deliver proper on-farm and off-farm activities to ensure the quality of the
final products. This situation thus leads to farmer exclusion on the international market
and prevent them in benefiting higher coffee prices.
4.2.2. Middleman (collector)/trader
Based on the interview results, local collector/trader, which is mainly located in the capital
city, plays an important role in the coffee sector in Manggarai. There are two types of
collector, collector at village level that has a role as intermediaries, and later sell the
products to the trader in the city, and collector which is the trader itself who provides pick-
up and transportation service to the farmers. Out of 27 farmers interviewed, 70% of the
farmers sell their coffee bean to local collector and trader. In general, the relation between
farmers and local collector and trader is based on trust and repetitive purchasing.
Basically, the coffee bean transferred to a collector and trader will not go through the
further treatment process. The quality parameter applied to the bean is only the moisture
content. Although farmers usually carried out secondary processing (drying process), but
sometimes the standard in moisture content is not fulfilled. Hence, the additional drying
process will be then carried out to produce dry parchment. Furthermore, coffee will be
further distributed for inter-island trade purpose (as presented in the figure 8).
The study has found that the collector and trader (later determined as intermediaries)
have a significant power in the chain. They have better market information as well as
financial capital to reap the benefits from other actors particularly from smallholder
farmers. The trader is also able to determine the price of the coffee. The price of coffee at
the local market is relatively similar, for Robusta the price is circa Rp 23,000-25,000 per
kilogram and Arabica is Rp 8,000-10,000 per litre.
In the context of financial resources, some farmers mentioned that “ijon” was still
implemented to secure the trade between farmers and trader. “Ijon” is a kind paying system
to purchase commodity from farmer long before the harvesting period. This case of
informal lending system has roots of the economic situation of the farmers. Some farmers
would rather choose this “informal” contract in order to get immediate cash. Afterwards
the farmers have to sell their coffee to the trader, although they would bear a lower price.

35
This case emphasizes the financial power hold by the intermediaries, and later also
influences the coffee value chain in general.
Figure 8. The Number of Coffee Traded to Another Island (outside Flores) (kg)
Source: Department of Estate Crops and Horticulture Manggarai Regency (2014)
4.2.3. Farmer Cooperatives (Asnikom) and Association of Farmers
Historically, the establishment of the farmer association was being driven by the
government initiative through the Department of Estate Crops and Horticulture. In
Manggarai regency, there are 81 farmers group established by the government. Therefore,
the nature of the organization is based on top-down approach. The study found that the
association of farmers does not have a significant role in the chain due to the nature of the
market system. The liberalized market system enabled farmer to access the marketing
channel independently. In many instances, the association is only the mean for the
government to provide training and technical assistance in coffee cultivation as well as
contributing in the form of machinery or financial grant. In Manggarai regency, as many
parts of Indonesia, UPH (Unit Pengolahan Hasil/Processing Unit) is a single entity with
the association. However, not all the association is equipped with the processing unit
which is granted from the government.
Meanwhile, the study found the opposite evidence in Asnikom as the example of the
farmer cooperatives. The establishment of the association was initiated by the non-
governmental organization that focuses on the cocoa and coffee sector in the region.
Asnikom officially started the organizational activity since 2010 with VECO Indonesia as
12,00034,000 28,000 18,000
42,000
118,500
221,000
386,000
276,000
67,00044,000 52,000
0
50,000
100,000
150,000
200,000
250,000
300,000
350,000
400,000
450,000
36
their primary external support. Over the year, Asnikom has received support from several
stakeholders and made marketing agreements with coffee exporter. With the aim to carry
out many functions as an organization, Asnikom merges the concept of association and
cooperatives with over than 230 members at present. Asnikom applied the membership fee
system to the member. The membership fee is divided into 2 parts, the initial membership
fee is IDR 200,000 (paid at once) and the monthly fee is IDR 10,000 (can be paid after the
harvesting period). At the end of the sales period, each member will get profit shares from
Asnikom.
There are three marketing channel carried out by Asnikom after receiving coffee
bean from the member. This includes:
Direct selling to UD. Indokom Flores as an exporter
Selling through auction
Selling to the individual purchaser (café e.g. Anomali coffee, individual exporter)
4.2.4. Exporter
In Manggarai, UD. Indokom Flores is the key player in term of coffee export. Most export-
driven smallholder farmers in the 3 producing regions from Manggarai to Bajawa sell their
coffee through Indokom. Indokom is basically the sub-company of the exporter, PT.
Indokom Citra Persada which located in Surabaya, East Java. Indokom Flores does not
process coffee in advance, the green bean will be further processed to fulfil the export
requirement in Surabaya. The sort of processing carried out in Indokom Flores is only the
re-drying process, since farmers often failed to fulfil the minimum standard of 12%.
Although Indokom is a large company who has a tendency to control the value chain,
Indokom always try to favor and concern about the livelihood of the smallholders. Based
on the interview, the key person of Indokom mentioned that price of coffee will be decided
through a mutual agreement between Indokom and farmers.
“During the harvesting period, a group of farmers who intend to sell their coffee to
Indokom will then hold a meeting to decide the farm gate price for the farmers.
Furthermore, the settled price will be further discussed with Indokom, and then both
parties will decide the market price of the coffee bean.” (Soeharman, Indokom)
4.3 Price Spread and Value Addition of Coffee
In Manggarai regency, price is highly determined by the trader, yet the difference between
each trader is not significantly high. Nevertheless, several farmers and farmers group
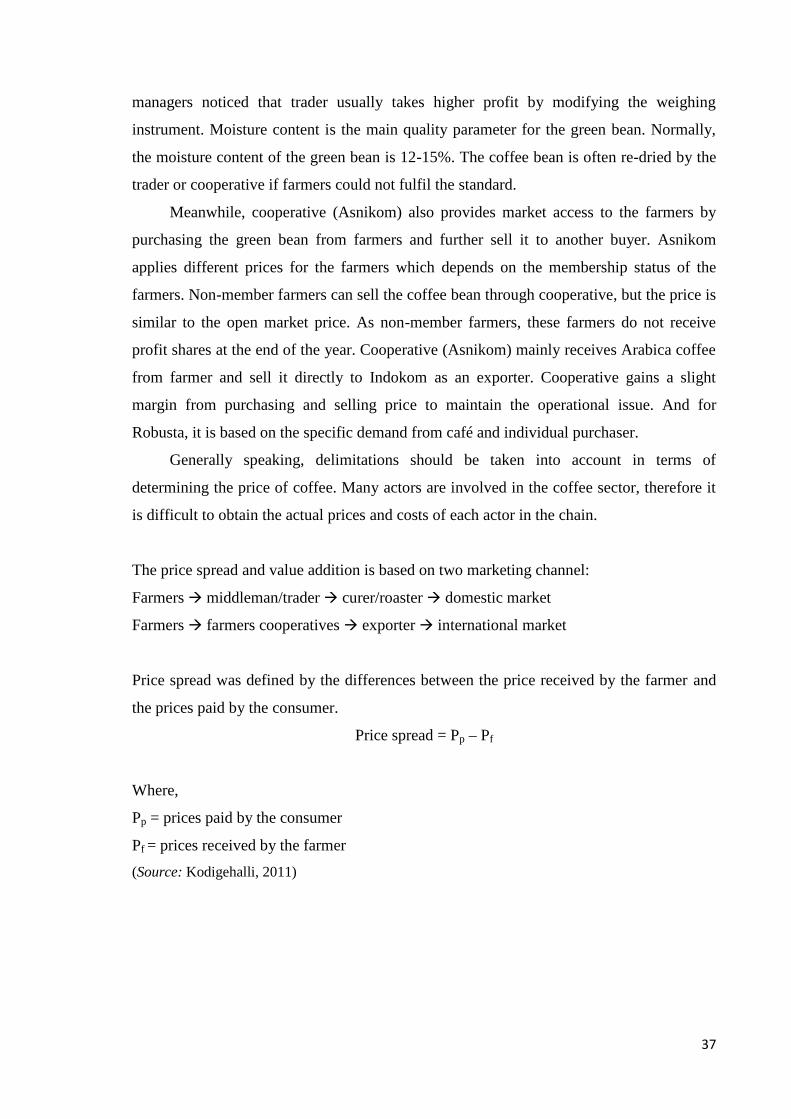
37
managers noticed that trader usually takes higher profit by modifying the weighing
instrument. Moisture content is the main quality parameter for the green bean. Normally,
the moisture content of the green bean is 12-15%. The coffee bean is often re-dried by the
trader or cooperative if farmers could not fulfil the standard.
Meanwhile, cooperative (Asnikom) also provides market access to the farmers by
purchasing the green bean from farmers and further sell it to another buyer. Asnikom
applies different prices for the farmers which depends on the membership status of the
farmers. Non-member farmers can sell the coffee bean through cooperative, but the price is
similar to the open market price. As non-member farmers, these farmers do not receive
profit shares at the end of the year. Cooperative (Asnikom) mainly receives Arabica coffee
from farmer and sell it directly to Indokom as an exporter. Cooperative gains a slight
margin from purchasing and selling price to maintain the operational issue. And for
Robusta, it is based on the specific demand from café and individual purchaser.
Generally speaking, delimitations should be taken into account in terms of
determining the price of coffee. Many actors are involved in the coffee sector, therefore it
is difficult to obtain the actual prices and costs of each actor in the chain.
The price spread and value addition is based on two marketing channel:
Farmers middleman/trader curer/roaster domestic market
Farmers farmers cooperatives exporter international market
Price spread was defined by the differences between the price received by the farmer and
the prices paid by the consumer.
Price spread = Pp – Pf
Where,
Pp = prices paid by the consumer
Pf = prices received by the farmer
(Source: Kodigehalli, 2011)
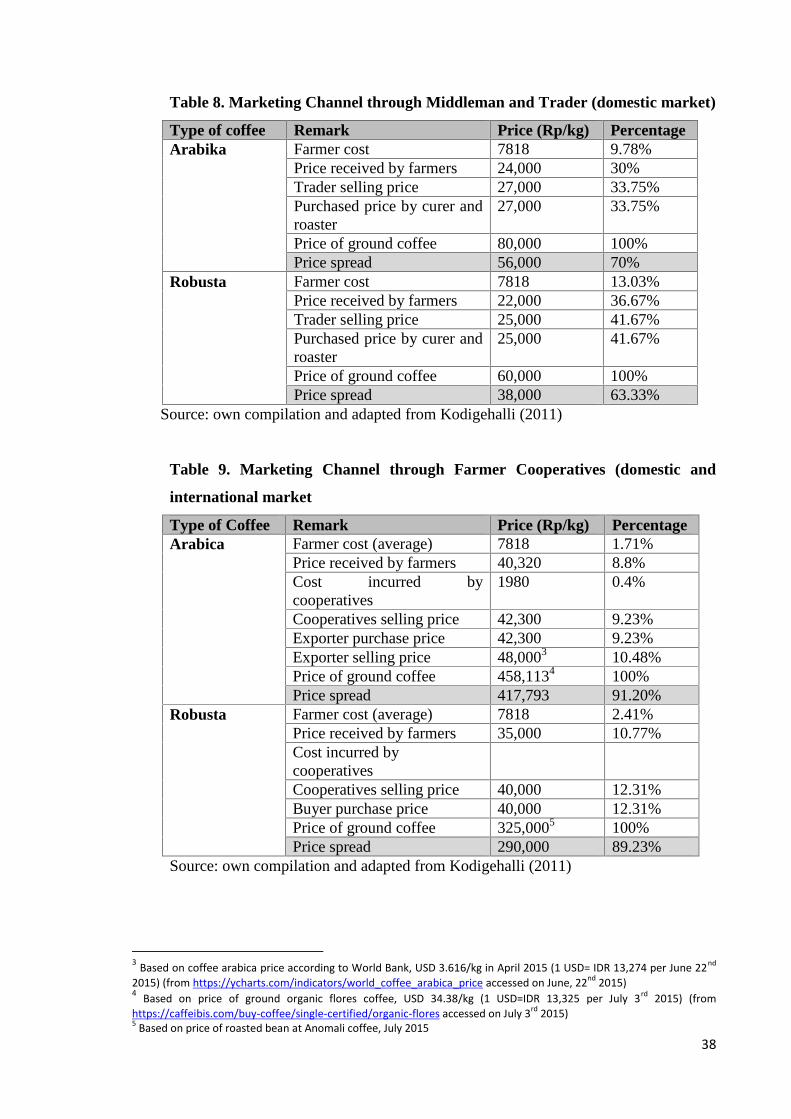
38
Table 8. Marketing Channel through Middleman and Trader (domestic market)
Type of coffee Remark Price (Rp/kg) PercentageArabika Farmer cost 7818 9.78%
Price received by farmers 24,000 30%Trader selling price 27,000 33.75%Purchased price by curer androaster
27,000 33.75%
Price of ground coffee 80,000 100%Price spread 56,000 70%
Robusta Farmer cost 7818 13.03%Price received by farmers 22,000 36.67%Trader selling price 25,000 41.67%Purchased price by curer androaster
25,000 41.67%
Price of ground coffee 60,000 100%Price spread 38,000 63.33%
Source: own compilation and adapted from Kodigehalli (2011)
Table 9. Marketing Channel through Farmer Cooperatives (domestic and
international market
Type of Coffee Remark Price (Rp/kg) PercentageArabica Farmer cost (average) 7818 1.71%
Price received by farmers 40,320 8.8%Cost incurred bycooperatives
1980 0.4%
Cooperatives selling price 42,300 9.23%Exporter purchase price 42,300 9.23%Exporter selling price 48,0003 10.48%Price of ground coffee 458,1134 100%Price spread 417,793 91.20%
Robusta Farmer cost (average) 7818 2.41%Price received by farmers 35,000 10.77%Cost incurred bycooperativesCooperatives selling price 40,000 12.31%Buyer purchase price 40,000 12.31%Price of ground coffee 325,0005 100%Price spread 290,000 89.23%
Source: own compilation and adapted from Kodigehalli (2011)
3 Based on coffee arabica price according to World Bank, USD 3.616/kg in April 2015 (1 USD= IDR 13,274 per June 22nd
2015) (from https://ycharts.com/indicators/world_coffee_arabica_price accessed on June, 22nd 2015)4 Based on price of ground organic flores coffee, USD 34.38/kg (1 USD=IDR 13,325 per July 3rd 2015) (fromhttps://caffeibis.com/buy-coffee/single-certified/organic-flores accessed on July 3rd 2015)5 Based on price of roasted bean at Anomali coffee, July 2015
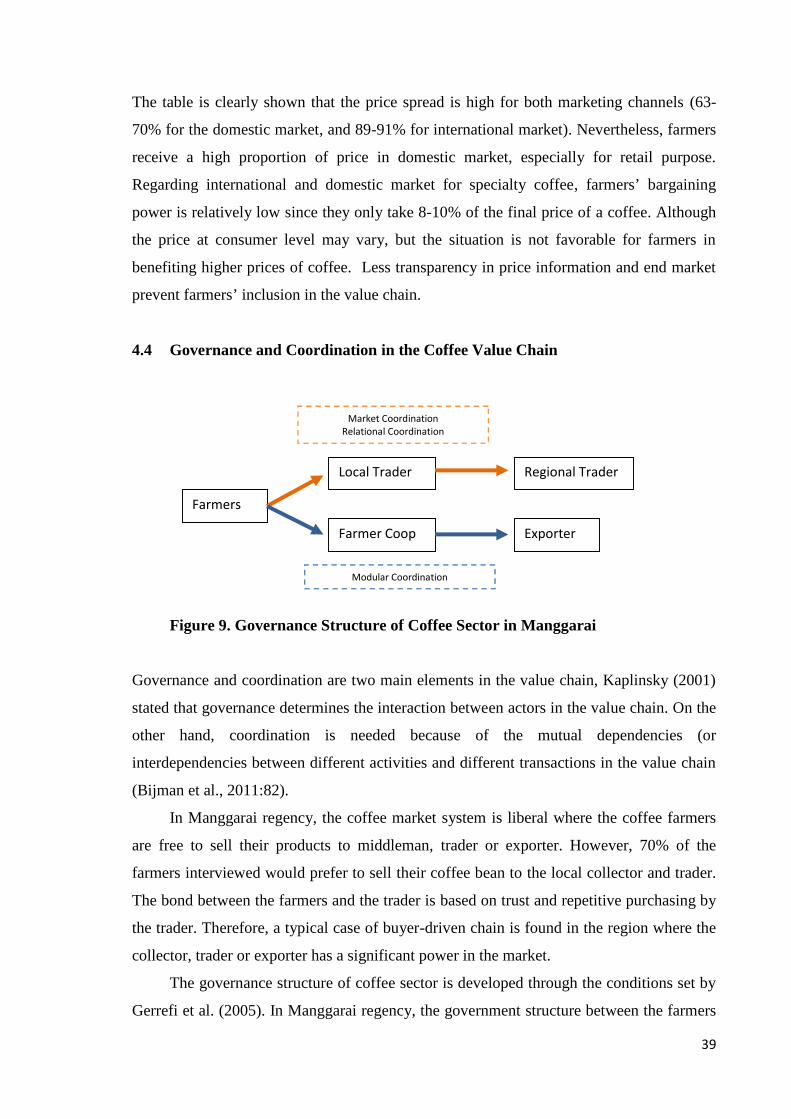
39
The table is clearly shown that the price spread is high for both marketing channels (63-
70% for the domestic market, and 89-91% for international market). Nevertheless, farmers
receive a high proportion of price in domestic market, especially for retail purpose.
Regarding international and domestic market for specialty coffee, farmers’ bargaining
power is relatively low since they only take 8-10% of the final price of a coffee. Although
the price at consumer level may vary, but the situation is not favorable for farmers in
benefiting higher prices of coffee. Less transparency in price information and end market
prevent farmers’ inclusion in the value chain.
4.4 Governance and Coordination in the Coffee Value Chain
Figure 9. Governance Structure of Coffee Sector in Manggarai
Governance and coordination are two main elements in the value chain, Kaplinsky (2001)
stated that governance determines the interaction between actors in the value chain. On the
other hand, coordination is needed because of the mutual dependencies (or
interdependencies between different activities and different transactions in the value chain
(Bijman et al., 2011:82).
In Manggarai regency, the coffee market system is liberal where the coffee farmers
are free to sell their products to middleman, trader or exporter. However, 70% of the
farmers interviewed would prefer to sell their coffee bean to the local collector and trader.
The bond between the farmers and the trader is based on trust and repetitive purchasing by
the trader. Therefore, a typical case of buyer-driven chain is found in the region where the
collector, trader or exporter has a significant power in the market.
The governance structure of coffee sector is developed through the conditions set by
Gerrefi et al. (2005). In Manggarai regency, the government structure between the farmers
Local Trader
Farmers
Regional Trader
Farmer Coop Exporter
Market CoordinationRelational Coordination
Modular Coordination

40
and local trader as well as regional trader was market coordination and relational
coordination. Meanwhile, the government structure in the context of the value chain
through cooperatives was found to be based on modular coordination.
In the chain structure from farmers to local and regional trader, the complexity of the
information is low, thus the information exchange between the actors are relatively easy.
Price is the main coordination mechanism; therefore marketing arrangement is based on
the mutual benefit received by both parties. Informal cooperation is common in this case,
where the mutual dependence is built by trust, good relationships, and reputation of the
respective farmers and trader. In some cases, such cooperation exists due to the preference
of the farmer to sell their coffee to well-known agents. The evidence showed that agents
who offer transportation cost and retribution fee are more favorable to farmers.
While for governance structure between farmers, farmer cooperatives and exporter
was found to be modular coordination. In this chain, the general transaction within the
chain is easy to codify. Nevertheless, the farmer cooperatives aim to fulfil the quality
standard required by the exporter. Likewise, the exporter aims to fulfil the consumers’
demand and satisfaction. The relationship between parties is substantial, thus it leads to the
possibility of acquiring improved production, processing and marketing skills of the farmer
cooperatives as the supplier.
4.5 SWOT Analysis of the Coffee Value Chain
SWOT analysis derives from simple framework to generate critical strategies and
alternatives based on the tangible situation. It consists of strengths, weaknesses,
opportunities as well as threats as the basis of analysis. The strengths and weaknesses are
the internal factor in the context of coffee value chain in the study area. Meanwhile,
opportunities and threats are the external factor that might affect the performance of the
value chain. All the factors are important in order to achieve the objectives of the analysis.
The following section will present the SWOT analysis for the coffee value chain in
Manggarai regency. The SWOT analysis is derived from the farmers’ interview, key expert
interview as well as observation.
Strengths
Availability of favorable climatic and natural conditions for coffee production, the
region is suitable to cultivate both Arabica and Robusta coffee

41
Availability of young and productive coffee farmers, in addition to low-cost workforce
in the region
The basic level of knowledge of coffee cultivation, and the application of ‘organic’
farming system and intercropping with other cash crops
Coffee as an important sector in the rural area by providing employment and generating
income, therefore it assists the purpose of alleviating poverty in Manggarai regency
The existence of a regional institution associated with coffee sector, e.g. Department of
Estate Crops and Horticulture, as well as the emerging non-governmental organization
and cooperatives.
Weaknesses
Low production volume due to soil degradation and most of coffee trees is relatively old
Low high-quality input supply, for example, seedlings and organic fertilizers
Minimum availability of credit access for farmers in order to increase the standard
cultivation practice and post-handling method
Lack of awareness at farmers level to adopt and apply the standard cultivation practice
as well as processing method
Lack of commitment and trust among farmers in response to establishment producer
association or farmer cooperatives
Asymmetry of information associated with coffee marketing and price of the
commodity
An inadequate number of government officials to support the standard cultivation
practice in general
Insufficient coordination among the actors in the value chain, e.g. government and
private agencies
Opportunities
Growing number of demands in domestic and international market for Robusta and
Arabica (specialty) coffee
Growing interest and activity of non-governmental organizations, farmer cooperatives,
and private sector in coffee production
Liberalized market, which creates opportunities for coffee farmers to enter a niche
market (domestic and international) with organic and specialty coffee

42
The willingness of the related stakeholders to promote and elevate the coffee production
and inclusion of the smallholder farmers in the coffee value chain
Emergence of research and development on coffee cultivation carried by several
institutions, e.g. Indonesian Coffee and Cocoa Research Institute (ICCRI)
Threats
Climate and habitat change that affects the coffee production in the region
The potency of shifting occupation, migration to urban areas and overseas might
decrease the number of workforce in the coffee sector
Significant growth of coffee production in neighbor regency, East Manggarai and
Ngada with the help of strong government intervention and support. The evidence
showed that it may affect the competitiveness of the coffee farmers
Increasing concern and consciousness of the consumer regarding to the quality of the
coffee
Growing number of private sectors involved in coffee sector that may particularly
increase the bargaining power of the smallholder farmers
43
CHAPTER 5. DISCUSSION
The previous chapter has summarized the value chain analysis and provides evidence from
the study. Hence, this chapter aims to accomplish in-depth analysis of the result based
from the literature review. The discussion will cover the following topics: (1) The role of
farmer cooperatives in the value chain; (2) Determinants of the farmer’s inclusion in the
farmer cooperatives; and (3) Opportunities for upgrading the value chain.
5.1 The Role of Farmer Cooperatives in the Value Chain
The study found that during the interview most farmers could point out several problems
associated with coffee cultivation and the post-harvesting activity. The financial and
individual resource constraints (e.g. Limitations in knowledge and market information) are
some hindering factors for farmers to engage in the value chain. In addition, environmental
aspects and physical infrastructure are also substantial for value chain development to be
successful. Farmers also require adequate support from the government and related
institutions in order to improve the present situation. Clearly, there is a need to ensure the
existence of actors who provide appropriate supports.
In the study area, trader and cooperative (Asnikom) play a role as the intermediaries
in the value chain who perform several functions. The trader has a significant power in
term of financial resources and market information. The asymmetry in the information and
bargaining power thus limits the farmers to improve their livelihoods through better
income. Collective action organizations such as farmers’ group and farmer cooperatives
are able to fill the gap between farmers and other actors in the value chain, and helping
them to address the challenges arise from the value chain requirement.
During the research study, 27 interviews have been carried out, all the farmers are
part of the farmers' group. However, generalization should not be applied to the selected
farmers' groups. Two groups are originally the governmental initiation groups. Meanwhile
the other group is a self-initiation group which then embedded in the coffee farmers
association in Manggarai (Asnikom).
Neilson (2008) has drawn an evidence that the experience of Indonesian farmers in
term of agricultural cooperatives has been particularly contradictory in the past. Therefore,
in most coffee producing regions in Indonesia, smallholder farmers are reluctant to
voluntarily establish or becoming a member of the cooperatives. In particular cooperatives,
which initially established by the government, the cooperatives have a limited role and the
44
ability to secure farmer support. In comparison with traditional market mechanisms, the
cooperatives are unable to provide hassle-free access to credit and simple marketing
procedures, and to the perceived high costs of dealing with bureaucracy and corrupt
cooperative structures that has been historically embedded in the bureaucratic structure
(Neilson, 2008:1615).
However, although farmers' group exists in the area, it does not improve the farmers’
situation rapidly. As the characteristics of the coffee value chain is relatively liberal, the
market could operate freely and local trader and exporter could access both supply and
demand side. In such condition, the bargaining power of smallholder farmers is low. And
this aggravated by the fact that the role of farmer association is weak.
It is also important to draw a line between producers group and cooperative. As
described by Bijman and Wollni (2008), “a cooperative is an autonomous association of
persons united voluntarily to meet their common economic, social and cultural needs and
aspirations through a jointly-owned and democratically-controlled enterprise”. Although
cooperatives can be formed by any group of actors or stakeholders, producers group is not
necessarily equal to cooperative. Following this, the study also emphasized that
cooperative has a dual nature of being both an association and an enterprise at the same
time (Bijman and Wollni, 2008:4). Therefore, the existing farmers’ group in the study area
is merely an association since it cannot perform the function of the enterprise.
Concerning the role of the collective action form in the value chain, it depends on the
conducted activities of the organization. In the case of government initiated farmers' group,
the function of the farmers group is limited to take responsibilities on accessing input
provision and technical assistance from the government official. Although the government
has made an attempt to support the farmers’ inclusion in the chain, but the study found that
the top-down approach has been practicing to deal with the challenges. Therefore, the
government initiated groups often failed to grow and maintain its business due to high
dependency on external actors.
Meanwhile, in the case of Asnikom, the cooperative receives a number of supports
from related stakeholders. Initially, the cooperative is established by the non-governmental
organization and further independently organized by the internal officials. Asnikom has
been successfully made an agreement with various stakeholders such as a local credit
union, exporter and government institutions. Given these points, the cooperative has made
a successful attempt in the context of vertical coordination among actors in the coffee
value chain. Equally important, Asnikom also provides complementary services to the
45
farmers. Asnikom gives several training and assistance to the farmers, particularly in
cultivation technique, post-harvest processing and the application of internal control
system (ICS) in order to increase the quality and quantity of coffee.
Concerning the concept of vertical and horizontal activities conducted by the
cooperative, Asnikom has been applied the vertical and horizontal integration in the value
chain. Vertical activities include the provision of market information and help the member
to comply with the requirements. In addition, Asnikom also provides training and
assistance to improve farmers’ skills. These forms of support can help the farmers to
increase their human-related resources as well as their bargaining position in the value
chain.
Horizontal coordination involves organization of individual farmers in order to
increase their bargaining power, reduce transaction cost, and help farmers to have secure
relationship with other actors in the value chain. Farmer cooperatives also provide access
to financial resources by linking them to other financial institutions.
Despite the role of farmer cooperatives in the value chain development, the
cooperative in the study area also faced different problems. The problem of trust, free-
riding member, and control and management cost may cause failures in the cooperative
system. In the study area, the foremost problem in the context of farmer cooperatives is a
problem of trust. Most farmer organizations failed to be well-developed due to lack of
internal and external relationship of trust. As stated below:
“The farmers' group often failed to deliver its goal and purpose due to problem of
togetherness and low contribution of each member. Initially, the problem of trust comes
from the lack of transparency between the administrator and the member. In some cases,
administrator or the manager have better information and knowledge (asymmetry
information) compare to the member.” (Vardiman, Asnikom manager)
This condition will influence the group’s performance in general. A collective action
organization needs transparency in order to secure members’ commitment. This is
supported by a statement of Stockbridge et al. (2003), that trust is required to secure
credible commitments from diffuse parties to cooperate on mutually beneficial actions and
investments (Stockbridge et al., 2003:16). Hence, farmer cooperatives need to ensure
members’ commitment and trust by maintaining transparency of the overall system and
business.

46
The equal contribution of each member in the cooperative scheme can be the key
solution to address the free-riding problem. In the traditional farmer’s group, the
implementation of the formal agreement is limited due to the absence of monitoring agents.
Therefore, the free-riding problem might emerge in such situation and affect the
organization’s system. The study found that the cohesion of the group is highly affected by
the free-riding problems. Unequal contribution by some members will decrease the
commitment from another group member. Meanwhile, in Asnikom, each member has to
contribute an equal amount to get benefits as a member. However, the contribution is
limited to monetary issue (initial payment, monthly fee). In terms of marketing, there is no
formal contract and agreement between Asnikom and member. Nevertheless, farmers
(member of Asnikom) will gain higher profits by selling their coffee through Asnikom.
The strategy towards the value chain development in Manggarai regency
The SWOT analysis is carried out to see the internal and external aspects influencing the
coffee sector in the study area. The necessary strategies can be developed based on this
analysis. Hence, the following remarks might be further considered to develop a better
value chain.
Engage various responsible actors in the value chain. Local government, private
sectors, farmers, as well as self-initiated group need to collaborate to improve the
performance of the chain. A collaboration between actors may result in further
research in farm management and post-handling activities, the inclusion of farmers in
rural lending institutions (cooperatives, banks, credit union), or contract farming with
the exporter.
Improve farmer’s access to obtain knowledge in farm management and coffee
processing as well as market information. Farm management practices should cover
the following components: (1) management of farm inputs; (2) crops rejuvenation,
pruning and grafting; (3) nutrient, pest and disease management; (4) principles of
sustainable agriculture and environmental protection; (5) improved post-harvest
activity; (6) farm planning and budgeting (Adapted from Iqbal, 2011).
Along with the improved on-farm and off-farm activities, encourage smallholders
farmers for to carry out sustainable farm practices to have an access to the certification
scheme. This is to respond the growing demand of certified coffee in the international
market.

47
Empower the role of farmer organization as the manifestation of collective action
organization. This is important to reduce the farmers’ burden in providing high quality
input as well as in benefiting higher prices of coffee.
5.2 Determinants of the Farmer’s Inclusion in the Farmer CooperativesSeveral literatures have pointed out that the commitment of the member to the cooperatives
can affect the performance of the cooperatives. However, members’ commitment depends
on how members perceive and experience the benefits of being a cooperative member
(Borda-Rodriguez and Vicari, 2014:47). Barton (2000) has drawn a conclusion that
farmers have significant economic incentives to unite and form cooperatives that enabled
them to enjoy greater profits (1) by providing inputs and services at lower cost or that were
not available and (2) by marketing outputs at better prices or into markets that previously
were not accessible (Barton, 2000:6). To draw an example, a research study in China
showed several functions served by the farmer cooperatives in term of innovation
intermediation. Knowledge intermediation is ranging from voicing demand of farmers’
needs, supplying information for problem solving and responding to farmers’ needs, and
generating knowledge applicable in production. Meanwhile, for innovation intermediation,
farmer cooperatives can play a role in building a vision on new technology, building and
managing network with actors from different domains, facilitating and participating in the
learning process, and providing necessary resources and services (Yang et al., 2014:119).
Given that wide-ranging services provided by cooperatives would increase the
interest of farmers, cooperatives need to expand their main functions in order to bring
together all the stakeholders and resources. The study found that the most common
benefits identified by the farmers are access to credit, provision of farming input, provision
of training and technical assistance and networks between actors in the value chain.
1. Members’ BenefitAccess to financial resources
As proposed by most farmers in the study area (26 farmers out of 27 farmers
interviewed), access to financial resources is the major determinant for farmers to join
the cooperative. Thus, it implies that material benefit is important for farmers rather
than another form of supports. However, high perception of economic benefit can be
justified from the farmers’ situation in the area. Most of the farmers in the study area
can be classified as marginal farmers. According to Lele (1981), marginal farmers
48
occupy inadequate land in order to make an acceptable living from cultivation, either
because of the small size of the holding or the poor resource base (Lele, 1981:57). In
Manggarai regency, the situation is more vulnerable to the farmers because of
production and transaction cost as well as expenses on cultural requisite purpose. A
yearly income from coffee cultivation is not sufficient to compensate the daily expenses
especially for cultural tradition. In addition, due to high transaction cost, farmers bear
the low price offered by the trader. Under those circumstances, access to obtain
financial resources becomes the main motive for farmers to join the cooperative.
A strong financial resource is also required to improve the production system at
farm level. The study noticed that cost arises from additional activities discourages
farmers to adopt innovation in cultivation and post-harvest technology. Thus, the decent
farming practice is applied in the coffee sector, resulting in low productivity of the
crops. The main proportion of farm expenses goes towards labor force during the
harvesting period. In fact, most farmers are reluctant to do activities to increase
productivity as well as the quality of the coffee bean.
Several authors, notably Elliot (2008), Haggblade, Reardon & Hyman (2007)
defined that in the cooperative context, the availability of and access to credit can
support the innovation process (Borda-Rodriguez and Vicari, 2014:45). Therefore,
farmer cooperatives may also engage in rural financial activities. As described by Huppi
and Feder (1990), two main categories of cooperatives in the context of rural lending
can be distinguished. Financial cooperatives with funds intermediation as their primary
objective, and agricultural cooperatives who are engaged in the provision of agricultural
services and joint production, and also offer credit as an additional function (Huppi and
Feder, 1990:8). In many instances, farmer cooperatives who also provide an access to
credit for its member are likely to be more favorable on farmers’ inclusion.
Provision of training and technical assistance
In order to improve quality and quantity of coffee, preconditions such as knowledge and
technical skills are required. As described by Fischer and Qaim (2012), a farmers’
organization might be an important catalyst for innovation adoption and upgrading the
production systems through promoting efficient information flows (Fischer and Qaim,
2012:1267). Thus, provision of training and technical assistance might be highly
successful through farmer cooperatives.
49
Although most farmers mentioned these forms of support as their concern, but the
details of training and technical assistance needed are generally addressed by Asnikom
member. Farmers who participate in cooperative receive significant benefits concerning
training and technical assistance. Continued and extended workshop will increase the
farmer’s knowledge not only in term of cultivation and marketing, but also regarding
the cooperative system. Therefore, consistent with the findings from Yang et al. (2014),
the farmer cooperative is actively engaged in generating contextual and integrated
knowledge and information. Given these points, knowledge and information provision
is beneficial before access to financial resources. Upgraded knowledge and information
will increase the probability of farmer’s participation in wide-ranging market.
Provision of farming input and processing tools
Barham and Chitemi (2009) defined that commodities and the source of input are one of
the driving forces to improve the marketing performance. Therefore, the role of farmer
cooperatives is not solely specializing in integration or mediation activity. Farmer
cooperatives can embrace other functions like input supply to its member. A form of
collective action is not only to address the marketing purpose, but also to make a joint
action to obtain high quality input. Several studies show evidence that collective action
is effective to reduce transaction cost in input provision. The utilization of high quality
input would increase the farm productivity as well as improve the quality of the yield.
Such input provision service can align with the farm management services
provided also by the cooperatives. The study carried out by Yang et al. (2014) showed a
number of cooperatives in China that provides field visit to farmers and delivering
necessary inputs to deal with various in-farm problems (Yang et al., 2014:118).
During the interviews, farmers noticed that farmer organization would increase
farmer’s position in benefiting the utilization of machinery and processing tools support
from the government. The government, respectively, Department of Estate Crops and
Horticulture collaborated with other related stakeholders established UPH (Unit
Pengolahan Hasil/Processing Unit). Although the optimum utilization of the processing
unit has not been reached, but farmers were trying to improve the quality of the coffee
by using it. Processing units are varied, from pulping machine, drying rack, and hulling
machine.
50
2. Networks
Although the characteristic of the market in the study area is liberal, where the trader
and the buyer are able to make a direct connection to the farmers, farmers have been
experiencing a better situation by joining the cooperative. The term “network” is highly
associated with the coordination services provide by Asnikom. As described by
Simatupang et al. (2002), a mutual agreement and relationship is important to facilitate
networking among actors in the marketing chain (Simatupang et al., 2002:291). In the
context of networking, Asnikom as the form of cooperatives has been actively involved
in the output marketing activity. Asnikom has attended several auctions and from that
are able to make a direct connection to several buyers and exporters. Consequently,
farmers can get higher farm-gate prices in the case of marketing through cooperatives.
They also developed networks in order to obtain financial support. This evidence
shows that farmer cooperatives have a close connection to different actors in the value
chain. The farmers that engaged in such a wide-ranging network through cooperatives
will have the possibility to address some challenges and constraints. They are more
capable to confront the asymmetry of information and increase their bargaining power.
Given that various attempts in networking carried out by the cooperative, the symbiotic
relationship between the coffee farmers and cooperative will be more solid.
5.3 Opportunities for Upgrading the Coffee Value Chain
The study found that the coffee value chain in Manggarai regency is notably a buyer-
driven chain where the buyer (trader and exporter) has a significant role and power. Thus,
the situation tends to hinder the smallholder coffee farmers to involve into higher value-
added activities.
Neilson (2008) explained the manifestations of restructuring the coffee value chain
through several points; prioritization of farmer cooperatives over traditional trade
structures, exporter consolidation and up-stream involvement of international traders, and
the “capture” of farmers within the enclosed value chain (Neilson, 2008:1615). Thus, the
role of farmer cooperatives is emerging for the development and restructuring the value
chain.
Upgrading the value chain is one of the means for smallholder farmers to regain their
power and role in the chain. With the concept of upgrading, smallholder farmers can
improve their competitiveness in the global market and improve their livelihood.
According to Humphrey and Schmitz (2002), upgrading the value chain consist of 3
51
primary modes. Downstream processing can be further improved by taking new functions
in the value chain (e.g. To process coffee instead export the green bean). Improve the
quality by moving into new (higher-level) product lines such as organic coffee or coffee
with certification. And enhance productivity by producing coffee in more efficient and
profitable way (Neilson, 2014).
The following activities could address the challenges to upgrade the coffee value chain:
Process improvement
Improvement in processing system is substantial to upgrade the coffee value chain in
the study region. Many smallholder farmers in the region only applied the simple and
basic methods to produce coffee bean. The final product at the farm level is
predominantly ‘kopi asalan6’, the unsorted and ungraded coffee bean. Government
official and other stakeholders (NGO and cooperatives) encourage the farmers to further
process the dry cherry. Trainings and technical assistance is properly held by these
stakeholders, however the practical evidence in the farm level is not visible during the
study. Economic motives are one of the factors that restraints the farmer to upgrade
their processing system. Nevertheless, the farmer’s willingness to adopt the advanced
method can be expected if the access to credit and training is given from the related
stakeholders.
Product improvement
The evidence from the study shows that the final product of coffee is mostly the
unsorted and ungraded coffee bean. The problem of product upgrading is relatively
similar to process upgrading. Due to economic constraints, farmers are unwilling to
process the coffee bean in advanced and standard method. This results in low quality
coffee bean and low profits gained by the farmers. The role of government officials and
associated stakeholders is important to deal with this problem. Although training is
regularly given to the farmers, continuous assistance is needed in order to monitor the
whole process of coffee production. Source of advisory in regular basis indeed makes a
distinct effect. In the case of Asnikom, since the trained agent is from the village, thus
the farmers can access more information and knowledge in regular and daily basis. The
obstacles and problems encountered by the farmers can be further discussed with the
village coordinator who has been previously trained by Asnikom.
Product improvement practice can also be as an extended process of coffee beans.
As stated from the previous chapter, farmers and cooperatives only receive 9-36% of
6 Kopi asalan = unsorted and ungraded coffee, green
52
the final price of the commodity. The highest margin possessed by the actors who
carried out extended process (roasting, grinding and packaging). However, Asnikom
encourages farmers to improve the product quality up to export level. In addition, this
year Asnikom makes an attempt to expand the line of coffee processing. Eventually,
various supports, in addition to farmers’ effort will upgrade the farmers’ position in the
value chain.
However, in order to carry out the process and product upgrading, several preconditions
needs to be taken into account. As described by Kodigehalli (2011), there is a need to
ensure that learning processes are available to the involving in the value chain. While on
the other hand, the learning process is highly influenced by the governance structure of the
chain. Therefore, the coordination between actors in the value chain is important to
maintain the information and knowledge flow in order to support the learning process.
Improving learning process along with the aim of process and product upgrading will be
the key success towards value chain development.
53
CHAPTER 6. SUMMARY AND CONCLUSIONS
The study was carried out with the main objective to analyze the role of farmer
cooperatives in coffee value chain development in Manggarai regency, East Nusa
Tenggara, Indonesia. In order to generate better understanding of the development of
coffee value chain, various actors within the chain was involved in the study using the
value chain analysis framework.
Coffee sector has been contributing a significant value to the livelihood of the rural
people. As one of the top cash crops, coffee possess a major proportion of the economy of
rural poor. Manggarai regency was accounted as one of the top coffee producing region in
the East Nusa Tenggara province. Most farmers in the study area owned a small area of
farm with coffee as the main crop. Thus, coffee played an important role as the main
source of income for the majority of farmers.
Concerning marketing system, intermediaries played an important role in the value
chain. The market liberalization offered enormous advantages for trader/middleman to reap
the benefits of smallholder farmers. This unfavorable situation for smallholder farmers,
thus became the driving force on the involvement of farmer cooperatives in the coffee
value chain. Therefore, the study was carried out to investigate the role of farmer
cooperatives in value chain development focussing mainly on the following objectives: (1)
to describe the coffee value chain in Manggarai East Nusa Tenggara and actors involved
(mapping), (2) to analyze the governance and coordination mechanism in the coffee value
chain , (3) to analyze the coffee value chain through SWOT analysis, (4) to discuss the role
of farmer cooperatives towards inclusion of smallholder coffee farmers in the development
of coffee value chain.
The existing coffee value chain in Manggarai regency was a subject of the study.
Various actors associate with the coffee value chain was involved in the study. In total, 27
farmers were randomly selected for interview purpose using a semi-structured
questionnaires. In addition, two representatives from local trader and one exporting
company were interviewed with semi-structured and informal interviews. Expert
interviews were also carried out from the manager of local cooperative (Asnikom) and
government officials from Department of Estate Crops and Horticulture of Manggarai.
54
6.1 Summary
Based on the literature review, limited studies have been carried out to point out the form
of collective action in the coffee sector in Indonesia. Therefore, a conceptual framework in
the role of farmer cooperatives in the value chain development was developed to achieve
several objectives in the study. The framework was mainly focused on the holistic concept
of coffee value chain, actors involved in the value chain as well as several factors affecting
the value chain performance. The main focus on the study was to answer how did the
establishment of farmer cooperatives would improve the coordination and performance in
the development of coffee value chain.
The first objective intended to describe the coffee value chain in the study area. This
included participating actors, marketing channels, and the output from each actor. The
study showed different actors involved in the coffee value chain in Manggarai. This
included coffee farmer, trader and middleman, farmer’s group, farmer cooperative
(Asnikom) and exporter. The marketing channel was divided into two channels, domestic
and international market. Intermediaries had a significant role in the value chain. Trader
play a role to set the farm-gate price, while cooperative made various attempts to improve
the position of the farmer in the value chain. Most of the farmers sold the coffee bean to
the market through intermediaries. Liberalized market enabled the trader to make a direct
purchase from farmers at farm - gate prices. Generally, the domestic market was the main
focus of the trader. While international market was managed by cooperatives and exporter.
Main quality parameter attributed to the final product was the moisture content.
The second objective was mainly focused on the analysis of the governance and
coordination mechanism in the coffee value chain. The coordination mechanism was
divided into two marketing channels. The coordination between farmers and traders was
based on market and relational coordination. Meanwhile, the coordination through
cooperative as the marketing channel to international markets was modular in nature. The
intermediaries and buyers played an important role in the chain, therefore the governance
structure was buyer-driven chain. In addition, the price was the main determinant of
coordination system, and farmers had less bargaining power in the value chain.
The third objective made an attempt to analyze the coffee value chain through
SWOT analysis. The internal and external aspects were important to support the
development of coffee value chain and address several challenges within the coffee sector.
Following this, several strategies emerged in order to upgrade the existing coffee value

55
chain. A collaboration between actors considered as the key point to implement the
relevant strategies.
Furthermore, the study was also focused on the role of farmer cooperatives towards
inclusion of smallholder coffee farmers in the development of coffee value chain. And
based on the results generated from the study, cooperatives performed vertical
coordination, horizontal coordination and complementary coordination. As has been noted,
the cooperative has made an attempt to coordinate different actors in the coffee marketing
chain. Meanwhile, in terms of complementary coordination, cooperatives offered various
support for farmers to be more engaged in the value chain such as: helping to provide
training, assistance and market information; acting as a mediator with other stakeholders;
and helping to find funding supports. The study also found that farmers’ willingness to
involve in the cooperative scheme was significantly influenced by the benefits they
received from the cooperatives. Along with the involvement of farmers in the cooperatives,
they also engaged in the value chain development. The value chain development can be
further achieved by implementing process and product upgrading. However, an extensive
coordination between actors in the value chain is needed in order to reinforce the learning
process. Therefore, farmer cooperatives can be a key player in order to maintain the
coordination system in the coffee value chain.
6.2 Conclusions
The value chain analysis carried out in this study has made an attempt to gain a better
understanding of the coffee sector in the area. The holistic approach towards each actor
and stages in the chain has been successfully described the existing situation as well as the
major problems in the value chain. Following this, the existence of supporting actor was
important to address some of these challenges. Farmer cooperatives as the manifestation of
collective action organization can be a key player to develop the coffee value chain in the
study area. By offering various functions to the farmers and acting as a brokerage to link
different actors and stakeholders within the chain, it would improve the coffee sector in
Manggarai. However, the holistic approach was also important for the value chain to be
successful. The empowerment of smallholder farmers was also important to increase their
participation in the collective action activities as well as the coffee value chain. A specific
strategy to empower smallholder farmers should be integrated with the policy and
regulation from the government. Meanwhile, intervention from other stakeholder such as
56
non-governmental organization could support at the implementation level of the coffee
value chain development.
6.3 Recommendations for Future Research
The study covered the overview of the value chain development concept and the actors
involved in the value chain. In addition, the role of farmer cooperatives also being
investigated to see the implication towards farmers’ inclusion in the value chain. The major
focus of the study was the smallholder farmers, farmers’ group and farmer cooperatives.
Some limitations were present to carry in-depth analysis of each actor in the chain.
The study was carried out with limited sample size and confined to only three districts in
Manggarai regency. Therefore, similar study can be carried out using a large sample size
and involving more actors in the coffee value chain.
A suggestion was made for further research to cope with the household income and
expenditure in order to reduce farmers’ dependence on coffee sector. In addition, further
research that deals with environmental sustainability and certification scheme may help
farmers in a long-term trajectory of sustainable coffee production.

57
REFERENCES
Arifin, B. (2013). On the Competitiveness and Sustainability of the IndonesianAgricultural Export Commodities. ASEAN Journal of Economics, Management andAccounting, 1(1), 81-100.
Barham, J., & Chitemi, C. (2009). Collective action initiatives to improve marketingperformance: Lessons from farmer groups in Tanzania. Food policy,34(1), 53-59.
Barichello, R., Patunru, A., & Henneberry, S. (2009). Agriculture in Indonesia: laggingperformance and difficult choices. Choices. The Magazine of Food, Farm, and ResourcesIssues, 24(2), 37-41.
Barton, D. (1989). What is a cooperative. Cooperatives in agriculture, 1-20.
Bijman, J., Muradian, R., & Cechin, A. (2011). Agricultural cooperatives and value chaincoordination. Value Chains, Social Inclusion and Economic Development: ContrastingTheories and Realities, 82-101.
Borda-Rodriguez, A., & Vicari, S. (2014). Rural co-operative resilience: the case ofMalawi. Journal of Co-operative Organization and Management, 2(1), 43-52.
Fahlbeck, E. (2007). The horizon problem in agricultural cooperatives–only in theory?.In Vertical markets and cooperative hierarchies (pp. 255-274). Springer Netherlands.
Fischer, E., & Qaim, M. (2012). Linking smallholders to markets: determinants andimpacts of farmer collective action in Kenya. World Development, 40(6), 1255-1268.
Fromm, I. (2007). Upgrading in agricultural value chains: The case of small producers inHonduras.
Gaiha, R., & Thapa, G. (2007). Supermarkets, smallholders and livelihood prospects inselected Asian countries. Occasional Papers: Knowledge for development effectiveness, 4.
Gereffi, G., Humphrey, J., & Sturgeon, T. (2005). The governance of global valuechains. Review of international political economy, 12(1), 78-104.
Gereffi, G., & Fernandez-Stark, K. (2011). Global value chain analysis: a primer. Centeron Globalization, Governance & Competitiveness (CGGC), Duke University, NorthCarolina, USA.
Grunert, K. G., Fruensgaard Jeppesen, L., Risom Jespersen, K., Sonne, A. M., Hansen, K.,Trondsen, T., & Young, J. A. (2005). Market orientation of value chains: A conceptualframework based on four case studies from the food industry. European Journal ofMarketing, 39(5/6), 428-455.
58
Hartatri, D. F. S., & de Rosari, B. (2011). Arabica Coffee Farming and Marketing ChainAnalysis in Manggarai and EastManggarai Regencys. Pelita Perkebunan (Coffee andCocoa Research Journal), 27(1).
Hellin, J., Lundy, M., & Meijer, M. (2007). Farmer Organization, Collective Action andMarket Access in Meso-America.
Humphrey, J., & Schmitz, H. (2000). Governance and upgrading: linking industrialcluster and global value chain research (Vol. 120). Brighton: Institute of DevelopmentStudies.
Huppi, M., & Feder, G. (1990). The role of groups and credit cooperatives in rurallending. The World Bank Research Observer, 5(2), 187-204.
Iqbal, M. (2011). Towards the Empowerment of Smallholder Coffee Farmers in Manggarairegency, East Nusa Tenggara Province. ICASEPS Working Paper No. 104
Kaplinsky, R., & Morris, M. (2001). A handbook for value chain research (Vol. 113).Ottawa: IDRC.
Kaplinsky, R. (2004). Spreading the gains from globalization: What can be learned fromvalue-chain analysis?. Problems of economic transition, 47(2), 74-115.
Kodigehalli, B. (2011). Value Chain Analysis for Coffee in Karnataka, India.
Lele, U. (1981). Co-operatives and the poor: A comparative perspective. WorldDevelopment, 9(1), 55-72.
Linton, A. (2005). Partnering for sustainability: business–NGO alliances in the coffeeindustry. Development in Practice, 15(3-4), 600-614.
Markelova, H., Meinzen-Dick, R., Hellin, J., & Dohrn, S. (2009). Collective action forsmallholder market access. Food policy, 34(1), 1-7.
Marsh, T., Neilson, J., Mawardi, S. (2007). Securing the profitability of the Flores coffeeindustry. SADI-ACIAR research report.
Mitchell, J., & Coles, C. (Eds.). (2011). Markets and rural poverty: Upgrading in valuechains. IDRC.
Moustier, P., Tam, P. T. G., Anh, D. T., Binh, V. T., & Loc, N. T. T. (2010). The role offarmer organizations in supplying supermarkets with quality food in Vietnam. FoodPolicy, 35(1), 69-78.
Mujawamariya, G., D’Haese, M., & Speelman, S. (2013). Exploring double side-selling incooperatives, case study of four coffee cooperatives in Rwanda. Food Policy, 39, 72-83.
Muradian, R., & Pelupessy, W. (2005). Governing the coffee chain: The role of voluntaryregulatory systems. World Development, 33(12), 2029-2044.
59
Neilson, J. (2008). Global private regulation and value-chain restructuring in Indonesiansmallholder coffee systems. World Development, 36(9), 1607-1622.
Neilson, J. (2014). Value chain profile for Robusta and Arabica coffee in Indonesia and itsimpact on farmer livelihoods (PowerPoint slide). Retrieved from presentation notes onIndonesian International Coffee Symposium 2014.
Rao, E. J., & Qaim, M. (2011). Supermarkets, farm household income, and poverty:insights from Kenya. World Development, 39(5), 784-796.
Rice, R. (2003). Coffee production in a time of crisis: social and environmentalconnections. SAIS Review, 23(1), 221-245.
Ritchie, J., Lewis, J., McNaughton Nicholls, C., & Ormston, R. (2014). Qualitativeresearch practice: a guide for social science students and researchers.
Roy, D., & Thorat, A. (2008). Success in high value horticultural export markets for thesmall farmers: The case of Mahagrapes in India. World Development,36(10), 1874-1890.
Sheck, R., Donovan, J., & Stoian, D. (2013). Assessing Impact of Value ChainDevelopment on Poverty (No. 396). Technical Report.
Saarelainen, E., & Sievers, M. (2011). Value Chain Development. ILO Value ChainDevelopment Briefing Paper 2: The Role of Cooperatives and Business Associations inValue Chain Development.
Sartorius, K., & Kirsten, J. (2007). A framework to facilitate institutional arrangements forsmallholder supply in developing countries: an agribusiness perspective. FoodPolicy, 32(5), 640-655.
Simatupang, T. M., Wright, A. C., & Sridharan, R. (2002). The knowledge of coordinationfor supply chain integration. Business process management journal, 8(3), 289-308.
Slob, B. (2006). A fair share for smallholders: A value chain analysis of the coffee sector.SOMO.
Stamm, A. (2004). Value Chains for Development Policy: Challenges for Trade Policy andthe Promotion of Economic Development: Concept Study. Deutsche Gesellschaft fürtechnische Zusammenarbeit (GTZ).
Stockbridge, M., Dorward, A., Kydd, J., Morrison, J., & Poole, N. (2003). Farmerorganization for market access: International review. Briefing paper.
Thapa, G., & Gaiha, R. (2011). Smallholder farming in Asia and the Pacific: Challengesand opportunities. IFAD con ference on New Directions for Smallholder Agri culture, 24,25.
Trienekens①, J. H. (2011). Agricultural value chains in developing countries a frameworkfor analysis. International Food and Agribusiness Management Review, 14(2).

60
Trumbull, M. (2005). Qualitative research methods. Integrating quantitative andqualitative methods in research, 101-126.
Wahyudi, T., & Jati, M. (2012). Challenges of Sustainable Coffee Certification inIndonesia. Seminar on the Economic, Social and Environmental Impact of Certification onthe Coffee Supply Chain
Wiggins, S., Kirsten, J., & Llambí, L. (2010). The future of small farms. WorldDevelopment, 38(10), 1341-1348.
Wollni, M., & Zeller, M. (2007). Do farmers benefit from participating in specialtymarkets and cooperatives? The case of coffee marketing in Costa Rica1. AgriculturalEconomics, 37(2‐3), 243-248
Yang, H., Klerkx, L., & Leeuwis, C. (2014). Functions and limitations of farmercooperatives as innovation intermediaries: Findings from China. Agricultural Systems, 127,115-125.
Zheng, S., Wang, Z., & Song, S. (2011). Farmers’ behaviors and performance incooperatives in Jilin Province of China: A case study. The social science journal, 48(3),449-457.
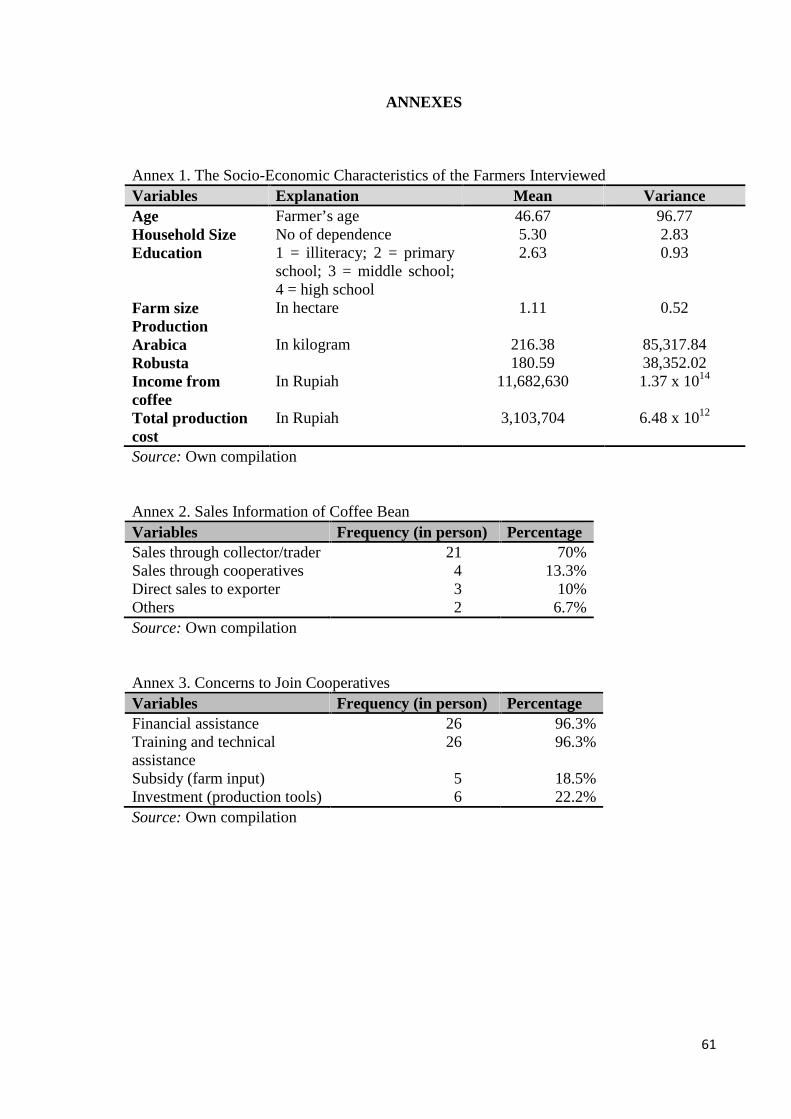
61
ANNEXES
Annex 1. The Socio-Economic Characteristics of the Farmers InterviewedVariables Explanation Mean VarianceAge Farmer’s age 46.67 96.77Household Size No of dependence 5.30 2.83Education 1 = illiteracy; 2 = primary
school; 3 = middle school;4 = high school
2.63 0.93
Farm size In hectare 1.11 0.52Production
In kilogramArabica 216.38 85,317.84Robusta 180.59 38,352.02Income fromcoffee
In Rupiah 11,682,630 1.37 x 10¹⁴
Total productioncost
In Rupiah 3,103,704 6.48 x 10¹²
Source: Own compilation
Annex 2. Sales Information of Coffee BeanVariables Frequency (in person) PercentageSales through collector/trader 21 70%Sales through cooperatives 4 13.3%Direct sales to exporter 3 10%Others 2 6.7%Source: Own compilation
Annex 3. Concerns to Join CooperativesVariables Frequency (in person) PercentageFinancial assistance 26 96.3%Training and technicalassistance
26 96.3%
Subsidy (farm input) 5 18.5%Investment (production tools) 6 22.2%Source: Own compilation
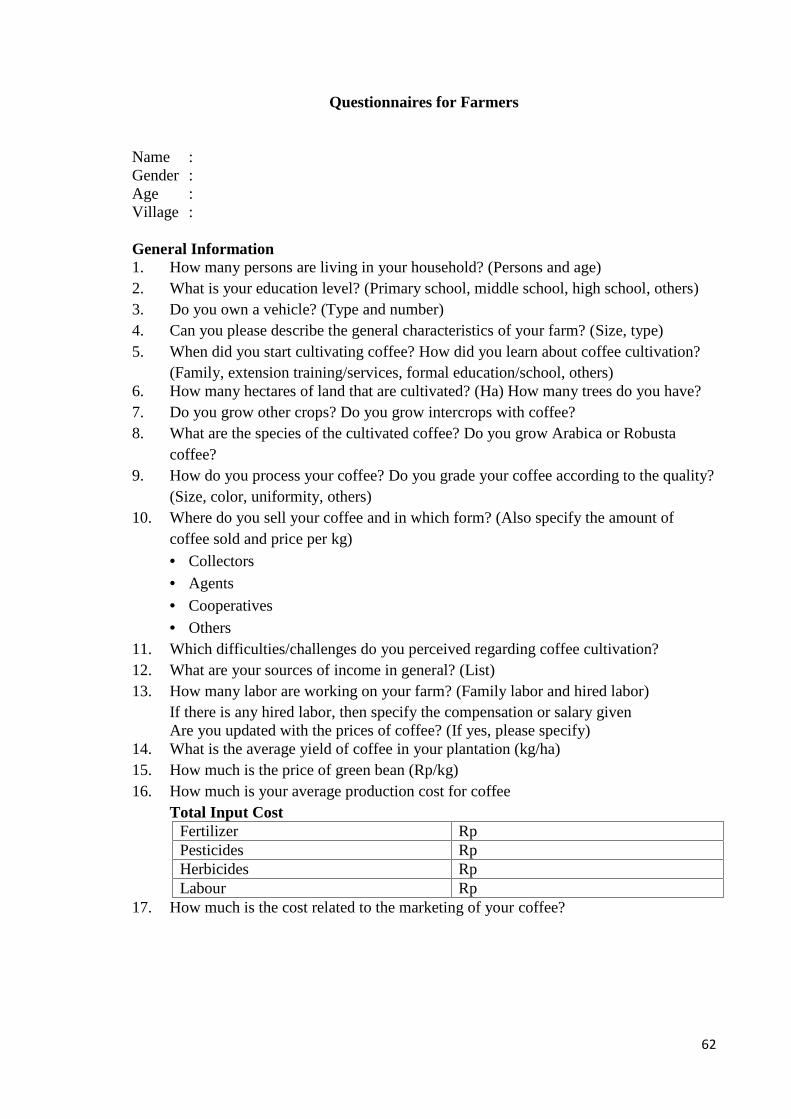
62
Questionnaires for Farmers
Name :Gender :Age :Village :
General Information1. How many persons are living in your household? (Persons and age)2. What is your education level? (Primary school, middle school, high school, others)3. Do you own a vehicle? (Type and number)4. Can you please describe the general characteristics of your farm? (Size, type)5. When did you start cultivating coffee? How did you learn about coffee cultivation?
(Family, extension training/services, formal education/school, others)6. How many hectares of land that are cultivated? (Ha) How many trees do you have?7. Do you grow other crops? Do you grow intercrops with coffee?8. What are the species of the cultivated coffee? Do you grow Arabica or Robusta
coffee?9. How do you process your coffee? Do you grade your coffee according to the quality?
(Size, color, uniformity, others)10. Where do you sell your coffee and in which form? (Also specify the amount of
coffee sold and price per kg) Collectors Agents
Cooperatives Others
11. Which difficulties/challenges do you perceived regarding coffee cultivation?12. What are your sources of income in general? (List)13. How many labor are working on your farm? (Family labor and hired labor)
If there is any hired labor, then specify the compensation or salary givenAre you updated with the prices of coffee? (If yes, please specify)
14. What is the average yield of coffee in your plantation (kg/ha)15. How much is the price of green bean (Rp/kg)16. How much is your average production cost for coffee
Total Input CostFertilizer RpPesticides RpHerbicides RpLabour Rp
17. How much is the cost related to the marketing of your coffee?
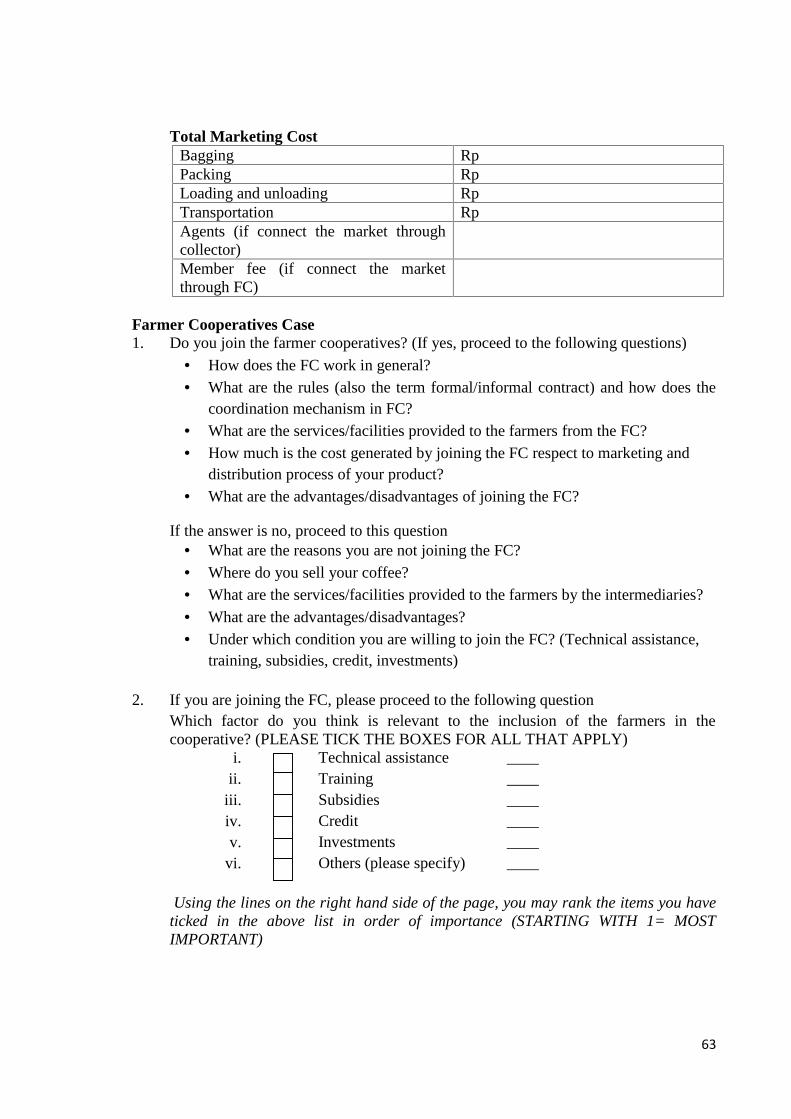
63
Total Marketing CostBagging RpPacking RpLoading and unloading RpTransportation RpAgents (if connect the market throughcollector)Member fee (if connect the marketthrough FC)
Farmer Cooperatives Case1. Do you join the farmer cooperatives? (If yes, proceed to the following questions)
How does the FC work in general? What are the rules (also the term formal/informal contract) and how does the
coordination mechanism in FC? What are the services/facilities provided to the farmers from the FC? How much is the cost generated by joining the FC respect to marketing and
distribution process of your product? What are the advantages/disadvantages of joining the FC?
If the answer is no, proceed to this question What are the reasons you are not joining the FC? Where do you sell your coffee? What are the services/facilities provided to the farmers by the intermediaries?
What are the advantages/disadvantages? Under which condition you are willing to join the FC? (Technical assistance,
training, subsidies, credit, investments)
2. If you are joining the FC, please proceed to the following questionWhich factor do you think is relevant to the inclusion of the farmers in thecooperative? (PLEASE TICK THE BOXES FOR ALL THAT APPLY)
i. Technical assistance ____ii. Training ____
iii. Subsidies ____iv. Credit ____v. Investments ____
vi. Others (please specify) ____
Using the lines on the right hand side of the page, you may rank the items you haveticked in the above list in order of importance (STARTING WITH 1= MOSTIMPORTANT)
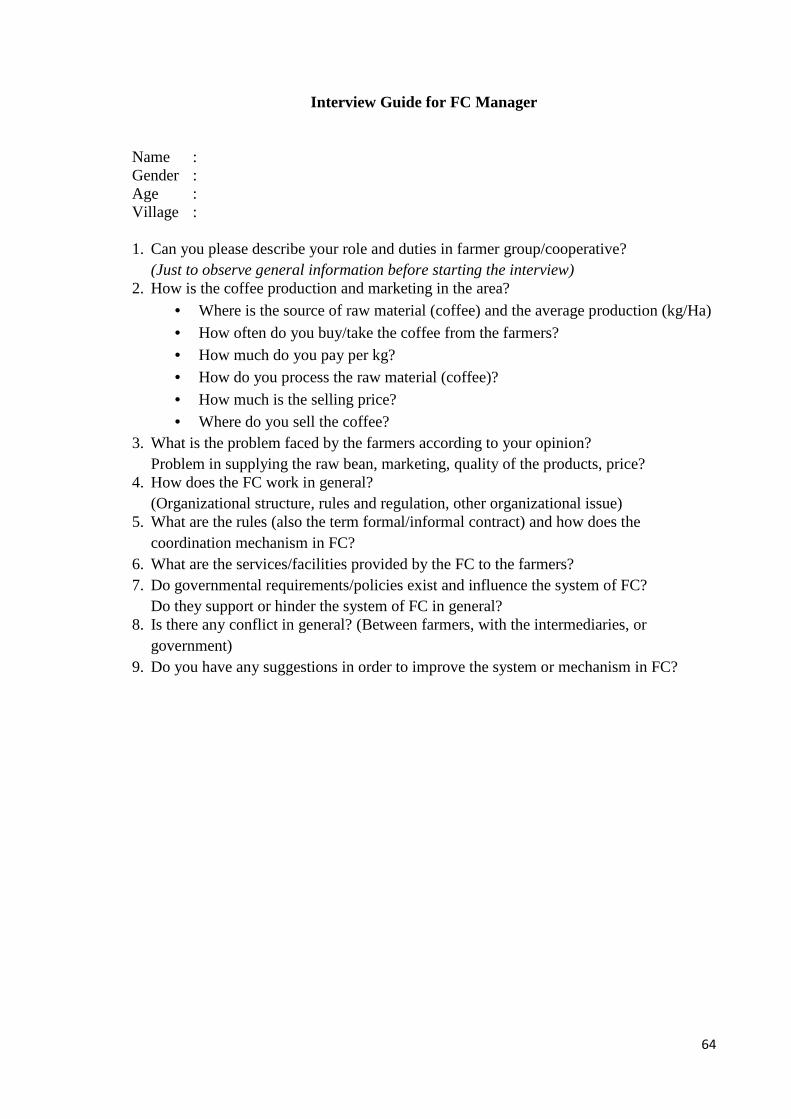
64
Interview Guide for FC Manager
Name :Gender :Age :Village :
1. Can you please describe your role and duties in farmer group/cooperative?(Just to observe general information before starting the interview)
2. How is the coffee production and marketing in the area? Where is the source of raw material (coffee) and the average production (kg/Ha)
How often do you buy/take the coffee from the farmers? How much do you pay per kg? How do you process the raw material (coffee)?
How much is the selling price? Where do you sell the coffee?
3. What is the problem faced by the farmers according to your opinion?Problem in supplying the raw bean, marketing, quality of the products, price?
4. How does the FC work in general?(Organizational structure, rules and regulation, other organizational issue)
5. What are the rules (also the term formal/informal contract) and how does thecoordination mechanism in FC?
6. What are the services/facilities provided by the FC to the farmers?7. Do governmental requirements/policies exist and influence the system of FC?
Do they support or hinder the system of FC in general?8. Is there any conflict in general? (Between farmers, with the intermediaries, or
government)9. Do you have any suggestions in order to improve the system or mechanism in FC?
65
Interview Guide for Intermediaries
Name :Gender :Age :Village :
1. Can you please describe your role and duties in coffee production and marketing in thisarea?(Just to observe general information before starting the interview)
2. How is the coffee production and marketing in the area? Where is the source of raw material (coffee) and the average production (kg/Ha)
How often do you buy/take the coffee from the farmers? How much do you pay per kg?
What is the activity involved after you receive the raw bean (coffee)? How much is the selling price?
Where do you sell the coffee? To whom?3. What is the problem faced by the farmers according to your opinion?4. What are the services/facilities provided to the farmers? Such as pre-finance service?5. How does the marketing channel work?