STUDY REPORT - daln.gov.vn · PDF file3.3.1 The role of agricultural cooperatives and farmer...
70
Mekong Delta Agricultural Cooperatives’ and Farmer Groups’ Capacity Assessment – The Cases Of Ca Mau, Bac Lieu, Soc Trang and An Giang Province STUDY REPORT Implemented by
Transcript of STUDY REPORT - daln.gov.vn · PDF file3.3.1 The role of agricultural cooperatives and farmer...

Mekong Delta Agricultural Cooperatives’ and Farmer Groups’ Capacity Assessment – The Cases Of Ca Mau, Bac Lieu,Soc Trang and An Giang Province
STUDY REPORT
Implemented by

STUDY REPORT / INTEGRATED COASTAL MANAGEMENT PROGRAMME
32
Table Of Contents1. Introduction1.1 Study context
1.2 Study objectives
1.3 Study method
1.3.1 Method of information collection
1.3.2 Survey sample
2. Policy Overview2.1 Overview of policies encouraging production-trade linkage associated with the
LSRF concept
2.1.1 The approach of preferential and supportive policies
2.1.2 Preference and support for enterprises in cooperation and production-trade-linkage associated with LSRF establishment
2.1.3 Preferential policies for organisations representing farmers in the linkage
2.1.4 Preferential support for farmers participating in linkage and LSRF production
2.2 Overview of policies encouraging agricultural cooperative development
2.2.1 Policies for preferential access to credit
2.2.2 Policies for preferential land allocation and leases
2.2.3 Policies for preferential tax treatment
2.2.4 Policies encouraging new establishment and agricultural cooperative re-registration
2.2.5 Policies supporting retraining and training
2.2.6 Policies supporting trade promotion and market expansion
2.2.7 Policies supporting the application of science and technology, new technology
2.2.8 Policies supporting infrastructure investment and participating in target programme and socio–economic development programme
2.2.9 Several additional support policies for agricultural cooperatives
2.3 Policies encouraging the development of farmer groups
2.3.1 Tax preference
2.3.2 Credit preference
2.3.3 Additional types of support
2.4 Provincial policies in support of the development of ACs/FGs and production-trade linkage associated with the LSRF approach
2.4.1 Ca Mau province
2.4.2 Bac Lieu province
2.4.3 Soc Trang province
2.4.4 An Giang province
3. The Current Situation of Production–Trade Linkages Associated with Large Scale Rice Fields
3.1 Implementation in recent years in the 4 provinces surveyed
3.2 AC and FG implementation of the LSRF approach
3.3 Linkage between agricultural cooperatives / farmer groups and enterprises / traders
3.3.1 The role of agricultural cooperatives and farmer groups in trade linkage
3.3.2 Investment support by partners for agricultural cooperatives and farmer groups in trade linkage
3.3.4 Benefits gained from the rice trading linkage
3.3.5 Difficulties encountered by ACs/FGs in trade linkage
3.3.6 Support needs when implementing linkage and LSRF
3.4 ACs and FGs which do not implement the LSRF approach
3.4.1 Reasons why ACs and FGs do not implement the LSRF approach
3.4.2 AC/FG needs for implementing the LSRF approach
3.5 ACs and FGs which do not engage in trade linkage
3.5.1 Reasons why ACs and FGs do not engage in rice trading linkage
3.5.2 AC/FG needs for trade linkage
4. Current Capacity and Operation of Agricultural Cooperatives in The Four Provinces Surveyed
4.1 Current development of ACs in the provinces surveyed
4.2 Current capacity of AC managers
4.2.1 Education level
4.2.2 Capacity and work experience of key managers in agricultural cooperatives
4.2.3 Capacity-building for cooperative personnel
4.3 The participation of members in agricultural cooperatives
4.3.1 The number and scale of production of members
4.3.2 Capital contribution from members of agricultural cooperatives
4.3.3 Use by members of AC services
4.3.4 Involvement in AC management
1414
15
15
15
15
1616
16
17
17
18
18
19
20
21
23
23
24
24
25
25
25
26
26
26
26
26
27
28
28
29
29
30
32
32
33
37
40
41
43
43
44
46
46
47
48
48
49
49
50
52
55
55
55
56
56

STUDY REPORT / INTEGRATED COASTAL MANAGEMENT PROGRAMME
54
4.4 Current situation of governance capacity of ACs
4.5 Current capital and assets situation of agricultural cooperatives
4.5.1 Land
4.5.2 Assets
4.5.3 Capital
4.6 Production and business operation of agricultural cooperatives
4.6.1 Goals and strategies
4.6.2 Business operations that ACs are implementing and will implement
4.6.3 Linkage and association with other stakeholders
4.6.4 Application of good agricultural practices and building the brand name
4.7 Performance of agricultural cooperatives
4.7.1 Turnover and profit
4.7.2 Price of services that ACs provide to members
4.8 Government support for ACs
4.9 Strengths and difficulties of agricultural cooperatives
4.9.1 Strengths
4.9.2 Difficulties of ACs
4.10 Agricultural cooperatives’ support requirements
4.10.1 Issues on which ACs need support
4.10.2 Contents and methods of building capacity for cooperative managers
5. Current Capacity and Operation of Farmer Groups in The Four Provinces Surveyed
5.1 Numbers of farmer groups in the four provinces surveyed
5.2 Capacity of FG managers
5.2.1 Education level
5.2.2 Capacity and work experience of key personnel
5.2.3 Capacity-building for personnel
5.3 Membership of farmer groups
5.3.1 The number and scale of production of members
5.3.2 Capital contribution
5.3.3 The use of services
5.3.4 Involvement in FG management
5.4 Farmer group governance
5.4.1 Executive administration
5.4.2 Partnership agreement/collaborative regulations
5.4.3 Task assignments among members of management personnel
5.4.4 Operational management
5.5 Capital and assets
5.5.1 Land
5.5.2 Assets
5.5.3 Capital
5.6 Operation of farmer groups
5.6.1 Goals and strategies
5.6.2 Ongoing production and business operations
5.6.3 Services rendered for non-members of farmer groups
5.6.4 Services provided in 2014-2015 that will no longer be provided in the coming period
5.6.5 New services in the coming period
5.7 Performance of farmer groups
5.7.1 Turnover and profit
5.7.2 Performance
5.7.3 Price of services that FGs provide to members
5.8 Government support for FGs
5.9 Strengths and difficulties of farmer groups
5.9.1 Strengths
5.9.2 Difficulties of FGs
5.10 Farmer groups’ support requirements
5.10.1 Issues on which FGs need support
5.10.2 Contents and methods of building capacity for management personnel
6. Current Shortcomings and Challenges for The Development of Acs, Fgs, Linkage and Lsrf
6.1 Current shortcomings and challenges in production-trade linkage and LSRF
6.1.1 Policies not strong enough to encourage enterprises to engage in linkage between the production and trade of rice
57
59
59
60
61
64
64
66
72
73
73
73
74
75
78
78
78
80
80
80
82
82
82
82
83
85
87
87
88
88
89
89
89
90
91
92
92
92
93
94
94
94
96
97
98
98
100
100
101
102
103
105
105
106
107
107
108
109
109
110

STUDY REPORT / INTEGRATED COASTAL MANAGEMENT PROGRAMME
76
6.1.2 Low number of enterprises having sufficient potential for linkage
6.1.3 Weakness in capacity of agricultural cooperatives/farmer groups
6.1.4 Other shortcomings
6.2 Shortcomings and challenges for cooperative development
6.2.1 The relatively high proportion of nominal and weak cooperatives
6.2.2 Operations of agricultural cooperatives failing to satisfy the needs of their members
6.2.3 Weak capacity of agricultural cooperatives
6.2.4 Inadequate awareness of the nature and role of agricultural cooperatives
6.2.5 Drawbacks of preferential policies on agricultural cooperatives
6.2.6 Public services failing to support agricultural cooperatives
6.2.7 Unsuitable cooperative model
7. Some Typical Linkage Models7.1 Model of linkage between enterprises/agencies supplying materials and ACs/FGs
7.2 Model of commercial enterprise in production-trade linkage and support for agricultural cooperatives
7.3 Model of AC organising LSRF for members, buying paddy of members and reselling to trading partner
7.4 Factors ensuring the success of agricultural cooperatives
7.4.1 Participation of members
7.4.2 Capacity of AC managers
7.4.3 Public and transparent governance
7.4.4 Operations matching the needs of members
7.4.5 Suitable scale of agricultural cooperatives
8. Solutions for Development of Acs And Fgs And Promotion Of Linkage Between Rice Production And Trade
8.1 Approach to the development of ACs/FGs and linkage between production and trade
8.1.1 Finding a scale of linkage that matches the local conditions
8.1.2 Deciding on whether development as AC or FG better fits capacity and operational management
8.1.3 Linkage between production and trade as a basis to promote the development of ACs/FGs
8.1.4 Support to build capacity for the strategic success of ACs/FGs
8.2 Proposed AC model
8.3 Solutions for promoting rice production under the large scale rice field and production-trade linkage models
8.4 Solutions to build AC capacity and operations
8.4.1 Raising awareness among local government, AC managers and membership
8.4.2 Training the state management staff on ACs
8.4.3 Training and using network of consultants
8.4.4 Training on governance and operation for managers
8.4.5 Assistance to implement production and business plans and establish necessary regulations
8.4.6 Assistance to implement common technical processes and have quality certification
8.4.7 Strengthening the role of public authorities
8.5 Solutions to support FGs
9. Conclusions9.1 Current situation of linkage between rice production and trade
9.2 Current situation of the development of agricultural cooperatives and farmer groups
9.3 Policies and solutions for local implementation
10. References11. Appendix
111
111
111
111
111
111
111
112
113
113
114
114114
115
117
118
118
119
119
119
119
120
120
120
120
121
121
121
122
122
122
123
123
124
127
127
127
127
128128
129
130
131132

STUDY REPORT / INTEGRATED COASTAL MANAGEMENT PROGRAMME
98
Tables CategoryTable 3.1: Rice sowing area in LSRF in 4 provinces surveyed (ha)
Table 3.2: Percentage of ACs and FGs implementing the LSRF approach
Table 3.3: Percentage of ACs and FGs applying collective rice production process
Table 3.4: Percentage of ACs and FGs experiencing difficulties in LSRF implementation
Table 3.5: Percentage of ACs and FGs surveyed with an agreement with trading partners
Table 3.6: Types of partners with which ACs and FGs have trading agreements
Table 3.7: Roles of ACs and FGs in linkage for trading paddy produce
Table 3.8: Percentage of ACs and FGs with agreements and investment by trading partners
Table 3.9: Forms of partner investment in ACs in rice trading linkage
Table 3.10: Additional costs for enterprises in linkage with ACs and FGs
Table 3.11: Requirements of trading partners upon ACs and FGs and role in linkage
Table 3.12: Percentage of ACs and FGs receiving support when engaging in linkage
Table 3.13: Benefits gained through linkage in paddy trading
Table 3.14: Profit increase (in %) though linkage compared to situation without linkage
Table 3.15: Forms of determining paddy price
Table 3.16: Percentage of ACs and FGs which sold their paddy at a price higher than the market price
Table 3.17: Benefits gained by ACs and FGs from linkage with trading partners
Table 3.18: Difficulties encountered by ACs and FGs in linkage
Table 3.19: Percentage of members of ACs and FGs fulfilling commitments to trading partners
Table 3.20: Types of support needed by ACs in rice trading linkage and in LSRF
Table 3.21: Types of support needed by FGs in rice trading linkage and in LSRF
Table 3.22: Reasons why ACs and FGs did not apply LSRF (% of ACs and FGs)
Table 3.23: Percentage of ACs and FGs expecting to implement the LSRF approach
Table 3.24: Types of support needed by ACs to engage in the LSRF approach
Table 3.25: Types of support needed by FGs to engage in the LSRF approach
Table 3.26: Reasons for ACs and FGs not linking to trading partners
Table 3.27: Percentage of ACs and FGs wanting to engage in linkage for paddy sale
Table 3.28: Types of support needed by ACs and FGs to have linkage with paddy trading partners
Table 4.1: Current situation in the 4 provinces surveyed
Table 4.2: Percentage of ACs at various performance levels
Table 4.3: Education level of AC managers
Table 4.4: Age of key managers of ACs
Table 4.5: Percentage of AC key managers that can use the computer
Table 4.6: Percentage of AC key managers that can use the internet
Table 4.7: Number of years of involvement in AC management of ACs’ main managers
Table 4.8: Percentage of ACs trained, by training issue
Table 4.9: Percentage of AC staff trained, by training issue
Table 4.10: Members and sizes of ACs
Table 4.11: Contribution of chartered capital by AC members
Table 4.12: Percentage of members using AC services
Table 4.13: Percentage of AC members that has letter of participation and participated in AC’s congress
Table 4.14: Percentage of ACs having management regulations
Table 4.15: Percentage of ACs assigning specific tasks to individual managers and recording the minutes of meetings (% of ACs)
Table 4.16: Operating activities of ACs (% of ACs)
Table 4.17: Percentage of ACs that expels members if they do not use the AC’s services
Table 4.18: Percentage of ACs producing financial reports and audits
Table 4.19: Percentage of ACs having collective land
Table 4.20: Percentage of ACs having machines and equipment for business activities
Table 4.21: Value of assets and machinery of ACs for business activities (million VND)
Table 4.22: Register and implementation of chartered capital contribution of ACs
Table 4.23: Real chartered capital contribution of AC members, by AC size
Table 4.24: Current debt of ACs
Table 4.25: Partners in debt to ACs
Table 4.26: Reasons why ACs experience difficulty in gaining loans from commercial banks
Table 4.27: Operational objectives of ACs at present and in the near future
Table 4.28: Strategies of ACs
Table 4.29: Percentage of ACs engaging in group business activity
Table 4.30: Services rendered by ACs to members
Table 4.31: Services rendered by ACs to non-members
Table 4.32: Percentage of ACs that provided the services in 2014-2015 but no longer provides them in 2016
29
30
30
31
32
32
33
34
34
35
36
37
38
38
39
39
40
40
41
41
42
43
44
44
45
46
47
47
48
49
49
50
50
50
50
53
54
55
55
56
56
57
57
58
58
59
59
60
60
61
62
62
63
63
64
65
66
66
67
68

STUDY REPORT / INTEGRATED COASTAL MANAGEMENT PROGRAMME
1110
Table 4.33: Percentage of ACs having new service to provide in near future
Table 4.34: Reasons why ACs provide new services (% of ACs)
Table 4.35: Difficulties of ACs when providing new services (% of ACs)
Table 4.36: Activities that ACs want to do, but are unable to
Table 4.37: Percentage of ACs that want to, but can not do a given new activity
Table 4.38: Reasons why ACs do not implement desirable activities
Table 4.39: Percentage of ACs with linkage to other stakeholders to serve their members
Table 4.40: Types of stakeholders with which ACs have linkage contract to serve their members
Table 4.41: Percentage of ACs applying good production practice process
Table 4.42: Turnover and profit of ACs
Table 4.43: Operational performance of ACs in 4 provinces surveyed
Table 4.44: Operational performance of ACs by AC size
Table 4.45: Evaluation of prices of inputs and production services provided by ACs
Table 4.46: Support by state to ACs in 4 provinces surveyed
Table 4.47: Percentage of ACs receiving state support, by type of support
Table 4.48: Percentage of ACs seeking guidance from stakeholders when necessary
Table 4.49: Strong points of ACs in 4 provinces surveyed (Unit: % of ACs)
Table 4.50: Difficulties of ACs in 4 provinces surveyed
Table 4.51: The greatest difficulties of ACs at present (% of ACs)
Table 4.52: Percentage of ACs requiring support, by issue
Table 4.53: Training needs of ACs (% of ACs)
Table 4.54: Training methods that ACs want (% of ACs)
Table 5.1: Number of FG in provinces surveyed
Table 5.2: Education level of FG managers
Table 5.3: Age of key managers of FGs
Table 5.4: Percentage of FG key managers that can use the computer
Table 5.5: Percentage of FG key managers that can use the internet
Table 5.6: Number of years of involvement in FG management of FGs’ main managers
Table 5.7: Percentage of FGs trained, by training issue
Table 5.8 Percentage of FG staff trained, by training issue
Table 5.9: Members and sizes of FGs
Table 5.10: Contribution of chartered capital by FG members
Table 5.11: Percentage of members using FG services
Table 5.12: Managerial organisation of FGs
Table 5.13: % of FGs having assigned tasks for managers
Table 5.14: Percentage of FGs having regulations stipulated in cooperation contract
Table 5.15: Percentage of FGs having managerial regulations
Table 5.16: Percentage of FGs whose cooperation contracts are certified by PPC
Table 5.17: Percentage of FGs that has assigned tasks to members of their managerial committee
Table 5.18: Operational management of FGs (unit: % of FGs)
Table 5.19: Percentage of FGs having common land
Table 5.20: Percentage of FGs having machines and equipment for business activities
Table 5.21: Value of assets and machinery of FGs for business activities (million VND)
Table 5.22: Chartered capital, debt and working capital of FGs (million VND)
Table 5.23: Operational objectives of FGs at present and in the near future
Table 5.24: Business strategy of FGs
Table 5.25: Percentage of FGs wanting to develop into AC
Table 5.26: Services rendered by FGs to members
Table 5.27: Services rendered by FGs to non-members
Table 5.28: Percentage of FGs that provided services in 2014-2015 but no longer provides them in 2016
Table 5.29: Percentage of FGs expecting to provide new service in near future
Table 5.30: Reasons why FGs provide new services (% of FGs)
Table 5.31: Difficulties of FGs when providing new services (% of FGs)
Table 5.32: Turnover and profit of FGs (Unit: million VND)
Table 5.33: Operational performance of FGs in 4 provinces surveyed
Table 5.34: Operational performance of FGs by FG size
Table 5.35: Evaluation of prices of inputs and production services provided by FGs
Table 5.36: Support by state to FGs in 4 provinces surveyed
Table 5.37: Percentage of FGs receiving state support, by type of support
Table 5.38: Percentage of FGs seeking guidance from stakeholders when necessary
Table 5.39: Strong points of FGs in 4 provinces surveyed (Unit: % of FGs)
Table 5.40: Difficulties of FGs in 4 provinces surveyed
Table 5.41: The greatest difficulties of FGs at present (% of FGs)
69
69
70
71
71
72
72
72
73
73
74
74
75
75
76
77
78
78
79
80
81
82
82
83
84
84
84
85
85
86
87
88
88
89
90
90
91
91
92
92
92
93
93
94
95
95
96
97
98
98
98
99
100
100
101
102
102
103
103
105
105
106
107

STUDY REPORT / INTEGRATED COASTAL MANAGEMENT PROGRAMME
1312
Table 5.42: Issues on which FGs need support (% of FGs)
Table 5.43: Training needs of FGs (% of FGs)
Table 5.44: Training methods that FGs want (% of FGs)
Table 11.1: Types of AC staff trained in Ca Mau, by training issue (% of ACs)
Table 11.2: Types of AC staff trained in Bac Lieu, by training issue (% of ACs)
Table 11.3: Types of AC staff trained in Soc Trang, by training issue (% of ACs)
Table 11.4: Types of AC staff trained in An Giang, by training issue (% of ACs)
Figure CategoryFigure 4.1: Structure of ACs in the provinces surveyed
Figure 4.2: Client strategy of ACs
Figure 4.3: Ways that ACs provide new services
Figure 5.1: Proportion of members that participated in last meeting of FG
Figure 5.2: Client categories served by FGs
List Of Abbreviations
Abbreviation Meaning
1M5R 1 must 5 reduction
3R3G 3 reduction 3 gain
AC Agricultural cooperative
DARD Department of Agriculture and Rural Development
FG Farmer group
ICMP Integrated Coastal Management Programme
LSRF Large scale rice field
MB Member
PPC Provincial People’s Committee
VND Viet Nam Dong
107
108
109
132
133
134
135
48
65
70
89
96
STUDY REPORT / INTEGRATED COASTAL MANAGEMENT PROGRAMME
1514
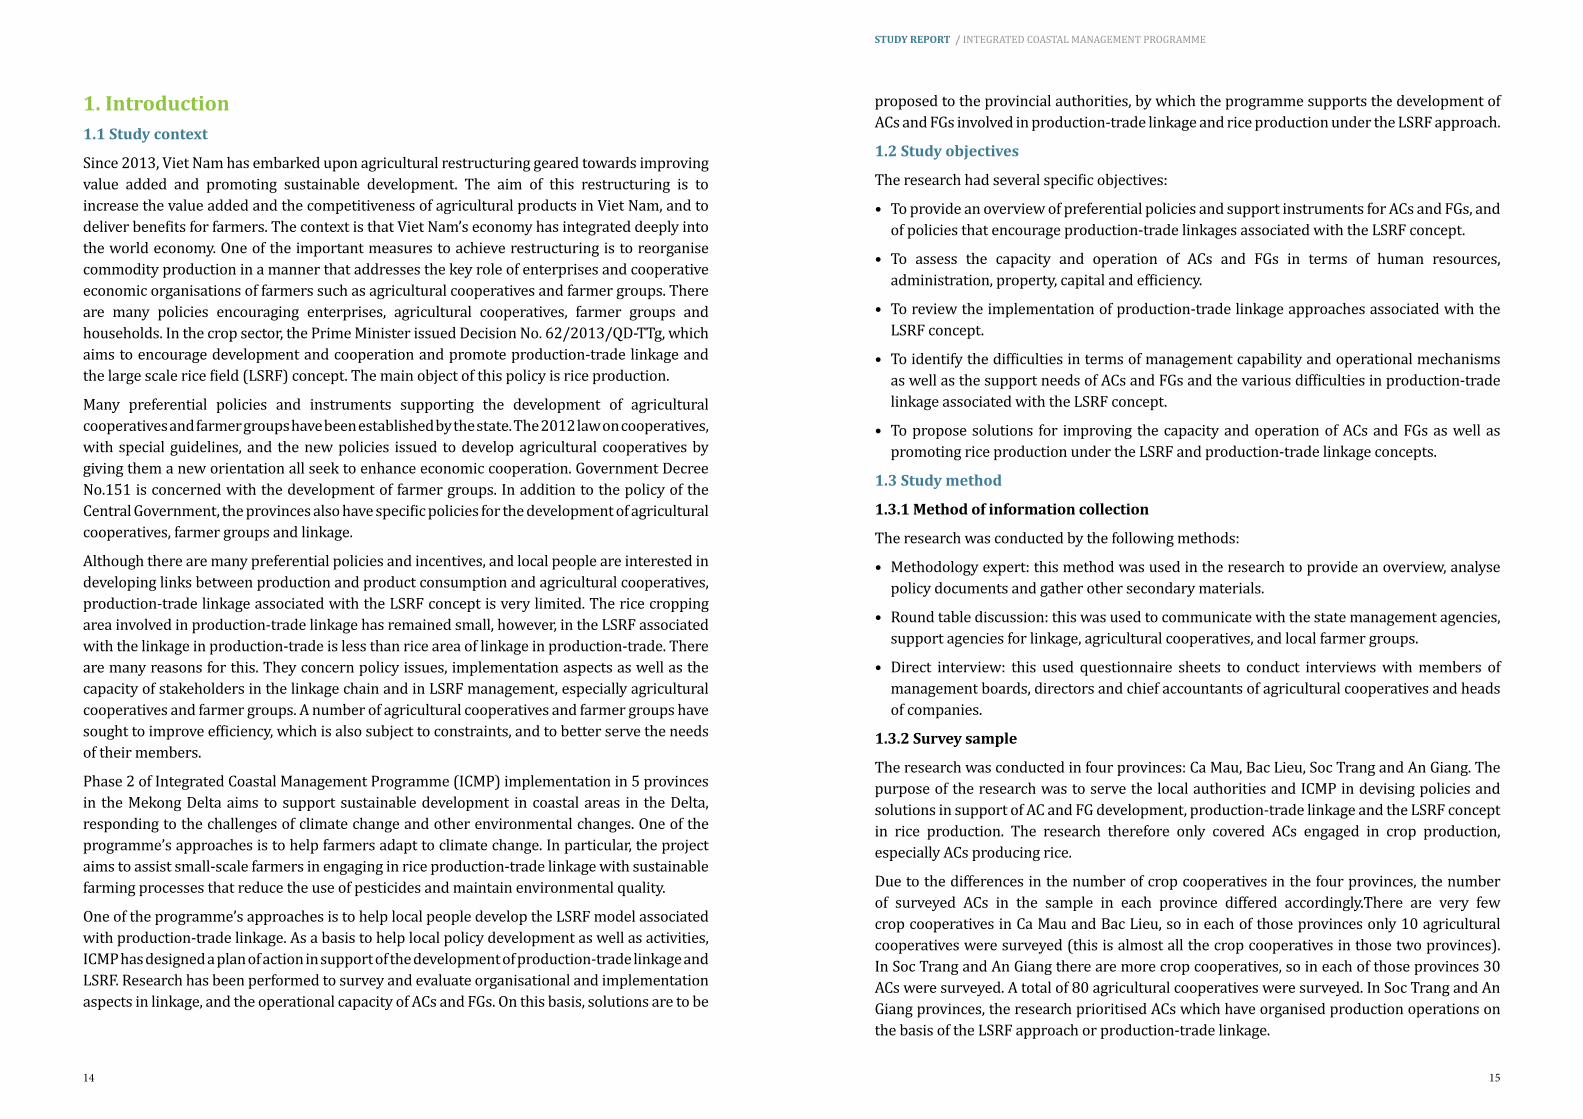
1. Introduction1.1 Study context
Since 2013, Viet Nam has embarked upon agricultural restructuring geared towards improving value added and promoting sustainable development. The aim of this restructuring is to increase the value added and the competitiveness of agricultural products in Viet Nam, and to deliver benefits for farmers. The context is that Viet Nam’s economy has integrated deeply into the world economy. One of the important measures to achieve restructuring is to reorganise commodity production in a manner that addresses the key role of enterprises and cooperative economic organisations of farmers such as agricultural cooperatives and farmer groups. There are many policies encouraging enterprises, agricultural cooperatives, farmer groups and households. In the crop sector, the Prime Minister issued Decision No. 62/2013/QD-TTg, which aims to encourage development and cooperation and promote production-trade linkage and the large scale rice field (LSRF) concept. The main object of this policy is rice production.
Many preferential policies and instruments supporting the development of agricultural cooperatives and farmer groups have been established by the state. The 2012 law on cooperatives, with special guidelines, and the new policies issued to develop agricultural cooperatives by giving them a new orientation all seek to enhance economic cooperation. Government Decree No.151 is concerned with the development of farmer groups. In addition to the policy of the Central Government, the provinces also have specific policies for the development of agricultural cooperatives, farmer groups and linkage.
Although there are many preferential policies and incentives, and local people are interested in developing links between production and product consumption and agricultural cooperatives, production-trade linkage associated with the LSRF concept is very limited. The rice cropping area involved in production-trade linkage has remained small, however, in the LSRF associated with the linkage in production-trade is less than rice area of linkage in production-trade. There are many reasons for this. They concern policy issues, implementation aspects as well as the capacity of stakeholders in the linkage chain and in LSRF management, especially agricultural cooperatives and farmer groups. A number of agricultural cooperatives and farmer groups have sought to improve efficiency, which is also subject to constraints, and to better serve the needs of their members.
Phase 2 of Integrated Coastal Management Programme (ICMP) implementation in 5 provinces in the Mekong Delta aims to support sustainable development in coastal areas in the Delta, responding to the challenges of climate change and other environmental changes. One of the programme’s approaches is to help farmers adapt to climate change. In particular, the project aims to assist small-scale farmers in engaging in rice production-trade linkage with sustainable farming processes that reduce the use of pesticides and maintain environmental quality.
One of the programme’s approaches is to help local people develop the LSRF model associated with production-trade linkage. As a basis to help local policy development as well as activities, ICMP has designed a plan of action in support of the development of production-trade linkage and LSRF. Research has been performed to survey and evaluate organisational and implementation aspects in linkage, and the operational capacity of ACs and FGs. On this basis, solutions are to be
proposed to the provincial authorities, by which the programme supports the development of ACs and FGs involved in production-trade linkage and rice production under the LSRF approach.
1.2 Study objectives
The research had several specific objectives:
• To provide an overview of preferential policies and support instruments for ACs and FGs, and of policies that encourage production-trade linkages associated with the LSRF concept.
• To assess the capacity and operation of ACs and FGs in terms of human resources, administration, property, capital and efficiency.
• To review the implementation of production-trade linkage approaches associated with the LSRF concept.
• To identify the difficulties in terms of management capability and operational mechanisms as well as the support needs of ACs and FGs and the various difficulties in production-trade linkage associated with the LSRF concept.
• To propose solutions for improving the capacity and operation of ACs and FGs as well as promoting rice production under the LSRF and production-trade linkage concepts.
1.3 Study method
1.3.1 Method of information collection
The research was conducted by the following methods:
• Methodology expert: this method was used in the research to provide an overview, analyse policy documents and gather other secondary materials.
• Round table discussion: this was used to communicate with the state management agencies, support agencies for linkage, agricultural cooperatives, and local farmer groups.
• Direct interview: this used questionnaire sheets to conduct interviews with members of management boards, directors and chief accountants of agricultural cooperatives and heads of companies.
1.3.2 Survey sample
The research was conducted in four provinces: Ca Mau, Bac Lieu, Soc Trang and An Giang. The purpose of the research was to serve the local authorities and ICMP in devising policies and solutions in support of AC and FG development, production-trade linkage and the LSRF concept in rice production. The research therefore only covered ACs engaged in crop production, especially ACs producing rice.
Due to the differences in the number of crop cooperatives in the four provinces, the number of surveyed ACs in the sample in each province differed accordingly.There are very few crop cooperatives in Ca Mau and Bac Lieu, so in each of those provinces only 10 agricultural cooperatives were surveyed (this is almost all the crop cooperatives in those two provinces). In Soc Trang and An Giang there are more crop cooperatives, so in each of those provinces 30 ACs were surveyed. A total of 80 agricultural cooperatives were surveyed. In Soc Trang and An Giang provinces, the research prioritised ACs which have organised production operations on the basis of the LSRF approach or production-trade linkage.

STUDY REPORT / INTEGRATED COASTAL MANAGEMENT PROGRAMME
1716
2. Policy OverviewThis part focused on reviewing the policies issued by the Government, including: i) policies for encouraging production-trade linkage and LSRF; ii) policies for agricultural cooperative development; iii) policies for farmer group development. Finally, support policies in the four provinces surveyed were also reviewed.
2.1 Overview of policies encouraging production-trade linkage associated with the LSRF concept
There are many preferential policies and support instruments for stakeholders involved in rice production-trade linkage and LSRF establishment. These policies and instruments encourage enterprises in the value chain and the organisations (ACs, FCs), representing farmers. However, to receive these state preferences and support, enterprises, farmer organisations and farmers must meet a number of specific conditions.
2.1.1 The approach of preferential and supportive policies
The general approach in the development of policies to encourage cooperation, production-trade linkage and LSRF production is as follows:
1. This policy of encouragement means that participation is not mandatory for enterprises in the value chain, farmer organisations and farmers. Participation in cooperation, production-trade linkage and LSRF production is voluntary on the part of the stakeholders in the value chain.
2. The approach proceeds on a project basis. To receive preference and support, stakeholders involved in production-trade cooperation and linkage must have a project or plan to establish an LSRF which is approved by the competent authority at the PPC (Article 5, Circular 15/2014). Thus, enterprises representing farmer organisations must develop the project or plan of establishing an LSRF and submit it to the competent authority for evaluation and approval. Only when approval is given, will the implementation of the project linkage associated with the LSRF receive support.
3. The LSRF project or plan must be located in the LSRF planning area of the province. Thus, if enterprises and representing farmer organisations would like to engage in an LSRF project, the first step is that the provincial authority determines the LSRF planning area.
4. There is a contract which is signed by stakeholders involved in cooperation and linkage.
5. The minimum duration of the project or planning is five years for annual crops and seven years for perennial crops.
6. The project must include both production under LSRF and consumption of products. If only buying output products or buying products without production under LSRF, the project is not eligible for receiving preferences or support from the state under Decision 62.
7. Enterprises must have strong potential in terms of both financial and human resources. Enterprises must ensure that they have the material area, drying capabilities, warehouses, processing facilities and investment capacities for farmers to produce.
8. The Government only regulated the principles and conditions for preferences and support and not the specific content of preferences and support. The specific level of support is stipulated by the individual province based on its resources. The provincial budget needs to make provision for such support.
2.1.2 Preference and support for enterprises in cooperation and production-trade linkage associated with LSRF establishment
Enterprises involved in cooperation, production-trade linkage and LSRF establishment receive preferences and support relating to land, export, temporary storage, infrastructure planning for production, and access to preferential credit from the Government. The specific preferences and support for enterprises are as follows:
Preference and support under Decision 62/2012:
• Exemption from land use and land lease when the state allocates or leases land for the project to build processing plants, warehouses, worker housing, and public buildings serving the LSRF project;
• Priority to participate in the Government’s export contract or temporary storage programme for agricultural products;
• Partial contribution of funds for implementing planning, improving fields, completing transport systems and field irrigation, upgrading electrical systems;
• Support up to 50% of funding for the organisation of training and technical guidance to farmers.
Preferential access to credit
Implementing Resolution 14/NQ - CP, the state bank issued Decision 1050/ QD-NHNN dated 28 May 2014 guiding the implementation of a pilot loan programme under Resolution 14 with a number of specific credit mechanisms. For instance, the preferential lending interest rate is lower than the conventional interest rate by 1 to 1.5% per year. The level of loan can be up to 70% of the project value. In the event that customers do not have enough collateral, the bank can lend without the collateral on the basis of cash flow control. If a chain link loans over 12 months, but not more than 18 months, every stage of production, processing and consumption is less than 12 months, and customers commit to pay a part of the debt after each stage, the commercial banks may consider applying short-term interest rates for customers.
Decree No. 55/2015/ND-CP on credit policies in service of agricultural development allowed commercial banks to provide ACs and FCs with credit without collateral, to a maximum of 70% of the project value, and loans for planning under the model of production-trade linkage and LSRF establishment (Article 14, Decree 55/2015).
2.1.3 Preferential policies for organisations representing farmers in the linkage
According to Decision 62/2013, organisations representing farmers consist of ACs, FCs without FGs. The ACs and FCs participating in cooperation, rice production-trade linkage and LSRF projects receive preference and support as follows:
• Exemption from land use and land lease when the state allocates or leases land for a project to build processing plants, warehouses, worker housing, and public buildings serving the LSRF project;
• Priority to participate in the Government’s export contract or temporary storage programme for agricultural products;
• Support up to 30% in the first year and 20% in the second year of the actual cost of pesticides, labour force, machine hire to perform general services for members;

STUDY REPORT / INTEGRATED COASTAL MANAGEMENT PROGRAMME
1918
• Support up to 50% of funding for staff training of ACs, FCs towards management, economic contracts and production techniques;
• Support up to 100% of funding for training courses and technical guidance to farmers to produce agricultural products under contract.
Preferential access to credit
• In implementation of Resolution 14/NQ - CP, the state bank issued Decision 1050/ QD-NHNN dated 28 May 2014 guiding the implementation of a pilot loan programme under Resolution 14. This involves a number of specific credit mechanisms, such as a preferential lending interest rate lower than the conventional lending interest rate by 1 to 1.5% per year. The level of loan can be up to 70% of the project value. In the event that customers do not have enough collateral, the bank can lend without collateral on the basis of cash flow control. If a link chain loans over 12 months, but not more than 18 months, every stage of production, processing, consumption is less than 12 months, and customers commit to pay a part of the debt after each stage, the commercial banks may consider applying short-term interest rates for customers.
• Decree No.55/2015/ND-CP on credit policies in service of agricultural development allowed commercial banks to provide ACs and FCs loans without collateral, to a maximum of 70% of the project value, and loans for planning under the model of production-trade linkage and LSRF establishment (Article 14, Decree 55/2015).
2.1.4 Preferential support for farmers participating in linkage and LSRF production
Under Decision 62/2013, farmers who participate in cooperation, production-trade linkage and LSRF establishment receive the following support:
• One-of support for up to 30% of the cost of purchasing seeds getting the quality inspector certification and the same quality certified, or reaching higher to do crop in the first season in the LSRF project.
• Support for 100% funding of training and technical guidance for farmers.
• Support for 100% funding of warehousing in enterprises, whereby the maximum duration is 3 months for government-implemented temporary storage of agricultural products.
2.2 Overview of policies encouraging agricultural cooperative development
Since it was founded in 1954, and up to the present, the institution of the agricultural cooperative (AC) has always been a component of the collective economy. However, there have been some changes in the nature of ACs that reflect the historical situation of the country. The first law on cooperatives was enacted in 1996, and revised in 2003 and 2012. From 2013 to now, ACs in Viet Nam have operated under the law on cooperatives enacted in 2012. There are many ACs, especially in the north, where they were established before the first AC law was promulgated. Since then, they have experienced many changes in AC law, notably the amendments of 2003 and 2012. Therefore, the operation of ACs in Viet Nam has been strongly influenced by historical factors.
According to the AC law which was passed in 2012, an AC is a collective economic organisation with co-owners and legal entity status, which can be established voluntarily by at least 7 members (individuals, households, organisations) who cooperate with and assist one another mutually in production, business and job creation. Moreover, it aims to meet the common needs
of members, in a manner based on autonomy, self-responsibility, equality and democracy in AC management. Some principles of AC organisation and operation are as follows:
• Legal entity status: an AC is a collective economic organisation with legal entity status.
• Number of members: there are at least seven members, who are individuals, households or organisations.
• Organisational structure: there must be a Board, Supervisory Board (or control officers), director and accountant.
• Operation: an AC is implemented by members for the main purpose of service operation or job creation for members.
• Capital contribution: all members must contribute to the authorised capital of ACs or FCs, no later than 6 months from the date of registering the AC. A member is entitled to contribute the highest authorised capital, which must not exceed 20% of the authorised capital of the AC.
• Responsibility for membership: to ensure the proper role of the ACs, which is to support their members, the Government has set the rule that AC service provision for members must make up at least 68% of the total value of AC service operation.
• Profit distribution mechanism: the 2012 law on cooperatives required ACs to spend most of the profit after tax for distribution to members, apportioned according to the value of the services rendered by them, with the remainder of the profit being distributed according to the capital contributed. This principle is completely contrary to the provisions of the 2003 law on cooperatives, under which most of the profits are divided according to capital contributions. However, a problem with the 2012 law was that the documents providing guidance on how to implement the law did not clearly explain how income was to be determined.
• Undivided assets: an AC’s assets are not divided when it is disbanded, bankrupted or membership ends.
The 2012 law on cooperatives provided that ACs had to apply to re-register by 31 June 2016 at the latest. Only those ACs meeting the new requirements could re-register under the provisions of the 2012 law.
ACs are viewed as performing an important role in the collective economy, and therefore receive preferential policies and support from the state.
2.2.1 Policies for preferential access to credit
Under the 2012 law on cooperatives, ACs receive: (i) Support for accessing capital and funding for cooperative development (Section D, Clause 1, Article 6); and (ii) support for preferential credit for ACs operating in agriculture, forestry, fisheries and salt production (Section C, Clause 3, Article 6). ACs can receive preferences and support as follows:
Decree 193/2013 regulates policy on access to capital and cooperative development funding (paragraph 4, Article 24) and on preferential credit for ACs operating in agriculture, forestry, fisheries and salt production (Clause 3, Article 25) as follows:
(1) Support for preferential interest rates and loan guarantees for funding to support the development of ACs (Decree 193/2013). ACs receive preferential loans for up to 5 years from

STUDY REPORT / INTEGRATED COASTAL MANAGEMENT PROGRAMME
2120
investment funds, and are supported with a maximum refund of 80% of nominal capital expenditure that may not exceed 3 years.
(2) When ACs have a project to invest in production, business and export, this has access to preferential investment in accordance with the law on investment.
(3) Preferential loans are supported by the Government under Decree No. 41/2010, whereby ACs operating in agriculture and rural areas can borrow capital without collateral if they have assets of up to 500 million. Decree 55/2015 replaced ND41 with many amendments and supplements to create more favourable conditions for providing credit to ACs. ACs can be mortgaged for loans up to the amount of 3 billion.
(4) Support for preferential credits is targetted to operations reducing post-harvest losses1: (a) ACs are supported with 100% of the commodity value and 100% of the interest in the first two years and 50% of the interest in the third year; (b) ACs are also supported in the interest rate and receive subsidies covering the interest rate gap of the loan, to a maximum of 70% of the loan for the project and a maximum duration of 12 years for ACs investing in production lines, machines and equipment to reduce losses in agriculture, or in projects for manufacturing machines and equipment for agricultural production.
(5) In addition, ACs receive support for loan interest when loans are granted to enter into contracts for production-consumption linkage with value-chain enterprises as mentioned above.
2.2.2 Policies for preferential land allocation and leases
Decree 193 (Paragraph 2, Article 25) regulates land allocation policy and land leases serving AC or FC operation in agriculture, forestry, aquaculture and salt production. Land support for ACs and FCs is implemented under the provisions of the land law. Currently, there are no specific guidelines for land policy implementation under Decree 193 by the ministries or departments. Land policies applicable to the 2003 law on agricultural cooperatives, set forth in Decree No. 88/2005 / ND-CP (Article 5) and some other documents, are as follows:
Content of land support policies: ACs are allocated land with/without payment (for ACs); moreover, they are assigned land lease to develop production and business establishments and render services directly for their members.
Duration of the assigned land allocation or land lease: (i) duration is not more than 50 years under the review, the decision on the basis of investment projects; or the application for land allocation, land lease; (Ii) duration is not more than 70 years for projects involving large-scale investment but slow capital recovery; investment projects in geographical areas with difficult socio-economic conditions or extremely difficult ones. ACs are allocated land by the state and are granted land-use right certificates under the provisions of Article 53 of Decree No. 181/2004 / ND-CP guiding implementation of the 2003 law on land.
Exemption from and reduction of leases of land and water surfaces2: ACs lease land and water surfaces to engage in agriculture, forestry, aquaculture, salt production and some other forms of production. In particular: (1) Decision No 68/2013/QD-TTg replaced Decision No 63/2010/QD-TTg and Decision No 65/2010/QD-TTg on the policies for support to reduce post-harvest losses in agricultural products and fisheries.(2) Decree No. 142/2005/ND-CP dated 14 November 2005 on cost collection of land lease and water surface lease; Circular No. 120/2005/TT-BTC of the Minister of Finance dated 30 December 2005 guiding the implementation of Decree No. 142/2005/ND-CP; Circular No. 141/2007/TT-BTC dated 30 November 2007 of the Minister of Finance on guidelines and amendment to Circular No. 120/2005/TT-BTC.
+ Duration of and preferential exemption from lease of land and water surfaces for ACs: (1) Exemption from land lease for three years applies if the project is on the list of areas to encourage investment, or if the project at the new business establishment of an economic organisation is implemented as planned relocation because of environmental pollution; (2) Exemption from land lease for five years applies if the project invests in areas with difficult socio-economic conditions, which are on the list of particular areas in order to encourage investment; (3) Exemption from land lease for seven years applies if the project has invested in areas with extremely difficult socio-economic conditions, which are on the list of particular areas to encourage investment; (4) Exemption from land lease for fifteen years applies if the project has invested in areas with extremely difficult socio-economic conditions, which are on the list of particular areas to encourage investment; (5) Exemption from land lease for the entire duration of the project applies if the project has invested in areas with extremely difficult socio-economic conditions, which are on the list of particular areas to encourage investment.
* The preferential exemption from AC land lease:
(1) Members of ACs lease land to use for agricultural production purposes (for perennial crops) under a project approved by competent authorities. The period of setting up an orchard is exempted from land lease, depending upon the type of tree and in accordance with planting techniques and perennial management, by the Ministry of Agriculture and under rural development provisions.
(2) Currently, under Decision No. 62/2013/QD-TTg ACs are exempted from land-use fees or land lease when the state allocates or leases land for the construction of drying yards, processing facilities or warehouses designed to serve an LSRF project.
+ Duration of and preferential exemption from lease of land and water surfaces for ACs: (1) ACs are exempted from 50% of the cost of land lease if they must pay for the entire duration of land lease as a basis for their business; (2) ACs lease land to use for agriculture, forestry, aquaculture or salt production and are affected by damage caused by natural disasters or fires: (a) If the damage is below 40% of output, the price of land lease is cut by a proportion corresponding to the percentage of damage; (b) if the damage is more than 40% of output, the AC is exempted for the year of loss.
2.2.3 Policies for preferential tax treatment
The 2012 law on cooperatives regulated that the state offer preferential income tax treatment for enterprises and preferential terms for some other taxes.
Policies for preferential corporate income tax
The income of ACs is exempted including (Clause 1, Article 4, Decree No. 218/2013/ND-CP): (i) income from cultivation, livestock, aquaculture and salt production; (ii) income from the agricultural cooperative in agriculture, forestry, fisheries and salt production carried out in areas with difficult socio-economic conditions or with extremely difficult ones; (iii) income from the provision of direct technical services to serve agriculture, such as irrigation, drainage, ploughing and harrowing the soil, dredging canals, controlling pests, treating diseases of crops and livestock, rendering services for harvesting agricultural products; (iv) income from the implementation of contracts for scientific research and technological development, or from the sale of products produced from tests or from new technology applied for the first time in Viet Nam; (v) income from undivided assets of ACs

STUDY REPORT / INTEGRATED COASTAL MANAGEMENT PROGRAMME
2322
established and operated under the provisions of the law on cooperatives (Section 10, Article 4, Decree 218); (vi) income from the transfer of technology under the priority areas transferred to organisations and individuals in areas with extremely difficult socio-economic conditions (Clause 11, Article 4, Decree 218).
There are several conditions for the operation of ACs in agriculture, forestry, aquaculture and salt production which are exempted from corporate income tax if the proportion of supplies and services provided for members of an AC is over 68% of the total value of products and services of that cooperative (Decree 218 and Decree 193).
Tax rate of corporate income tax: (1) To be eligible for the 20%3 tax rate the AC’s total sales and service provision of the preceding year must not exceed 20 billion; (2) To be eligible for the 10%4 tax rate, income from the AC’s operations in agriculture, forestry, aquaculture and salt production which is not in areas of difficult socio-economic conditions or extremely difficult ones (except the income of ACs regulated in Clause 1, Article 4, Decree 218 as mentioned above).
Duration of tax exemption and tax cut: The duration of tax exemption and tax cut is calculated continuously from the first year in which the AC gained income, and its taxable income from the investment project receiving tax preference. In particular: (i) Tax exemption for four years and 50% tax cut for the next nine years: For newly established ACs investing in areas with extremely difficult socio-economic conditions. Such newly established ACs in the socialisation carried out on the list of areas with difficult socio-economic conditions or extremely difficult ones. (ii) Tax exemption for four years and 50% tax cut for the next five years: For newly established ACs in the socialisation carried out that there are not on the list of areas with difficult socio-economic conditions or extremely difficult ones. (iii) Tax exemption for two years and 50% tax cut for the next four years: For newly established ACs investing in areas with difficult socio-economic conditions.
Policies for other types of preferential tax treatment
License tax5: (i) License tax exemption for: service teams and stores, stores operating under ACs to provide directly the technical services needed for agricultural production; (ii) 50% license tax cut for central people’s credit fund of commune, ACs specialised in business services serving agricultural production, stores, stalls, shops etc. in mountain areas. Four levels of license tax apply to ACs (Circular No. 28/2011/TT-BTC): 3 million/year if the registered capital is more than 10 billion, 2 million/year if the registered capital is 5-10 billion, 1.5 million/year if the registered capital is between 2 and 5 billion and 1 million/year if the registered capital is less than 2 billion.
Value-added tax: (i) The 2008 law on value-added tax6: ACs are not subject to VAT on products and services such as cultivation, livestock, aquaculture and fishing; plant varieties and domestic animals; agricultural services (irrigation, drainage, ploughing, dredging canals,...); credit services, stock trading; medical services, veterinaries, health care for people and pets;
(3) Clause 2, Article 10, Decree 218/2013/ND-CP dated 26 December 2013 of the Government guiding the implemention of the 2013 law on corporate income tax.(4) Section e, Clause 2, Article 15, Decree 218/2013ND-CP guiding the implemention of the 2013 law on corporate income tax.(5) Circular No. 42/2003/TT-BTC dated 7 May 2003 of the Ministry of Finance guiding the implementation of Decree No. 75/2002/ND-CP dated 30 August 2002 of the Government on revising license tax.(6) Article 5, Law on value-added tax No. 13/2008/QH dated 3 June 2008 of the National Assembly.
public services for sanitation; teaching and vocational training; (ii) ACs and their members are not subject to value-added tax for aquaculture products which are exploited and sold7.
Personal income tax: tax exemption for households and individuals directly employed in aquaculture and fisheries8.
Import tax: import tax exemption for machinery, equipment, raw materials and components imported to the country that are not produced in the country, upgrading ships with a total main engine capacity of 400 CV or more9.
2.2.4 Policies encouraging new establishment and agricultural cooperative re-registration
Under Decree 193 ACs are supported in new establishment and re-registration by the state.
Specifically the following apply to new ACs: (i) Cooperative founders are assisted with free information, consulting, training on cooperative laws before establishing. (ii) ACs are supported with regulation consultancy, guidance and implementation of procedures for the establishment, registration and operation of cooperative organisations (Paragraph 6, Article 24). ACs preparing to establish anew receive financial support for founders (car payment, documents, food...)10.
ACs are re-registered and operate under the 2012 law on cooperatives, thereby receiving support for the establishment of new cooperatives.
2.2.5 Policies supporting retraining and training
Decree 193 (Clause 1, Article 24) stipulates that training for cooperative managers and members of cooperatives is funded by the state as follows:
• The objects of support for retraining and training consist of (a) the Management Board, Supervisory Board and the Chief Accountant, and (b) members doing work involving technical and professional expertise at the AC.
• The form and level of support is regulated by the provincial people’s committee and the city people’s committee. The funds are from local budgets or project development programmes.
+ These items in ACs are supported: (a) fares for using public transport (except airplane) from head offices of AC to on-site training; (b) costs of buying curriculum materials; (c) costs of organisation, classroom management, hall hire, faculty remuneration, visiting, surveying. Moreover, ACs engaged in agriculture, forestry, aquaculture and salt production are also supported with 50% of the cost of food and accommodation in accordance with the provisions of the training facilities.
+ The people in ACs and members of ACs sent for training (formal or in-service) at universities, colleges, secondary vocational schools and vocational schools are supported with at least 50% of tuition fees. They must meet the following conditions: (a) no more than 40 years old; (b) eligible for enrolment in training facilities; (c) sent to study by decision of the Management Board; (d) written commitment to work for the agricultural cooperative for at least 5 years after graduation.
(7) Decree No. 67/2014/ND-CP dated 7 July 2014 on some aquaculture development (valid until 31 December 2016).(8) Decree No. 67/2014/ND-CP dated 7 July 2014 on some aquaculture development (valid until 31 December 2016).(9) Decree No. 67/2014/ND-CP dated 7 July 2014 on some aquaculture development (valid until 31 December 2016).(10) Circular No. 173/2012/TT-BTC guiding the financial mechanism supporting cooperative founders, training objects and retraining of agricultural cooperatives.

STUDY REPORT / INTEGRATED COASTAL MANAGEMENT PROGRAMME
2524
• Content of retraining and training: (i) To provide knowledge about policies and laws related to establishment and development of ACs; (ii) To provide knowledge about consultancy, support, updated economic information and planning; methods of organising production, management, product marketing of ACs; (iii) To train some majors of intermediate level, colleges and inter-university programme; (iv) To upgrade vocational training and capacity-building skills. Further support for ACs for retraining and training takes the following form:
+ ACs are supported with 100% of material costs and 50% of travel expenses for participating in training courses on agricultural expansion for ACs11.
+ Cooperative founders are reimbursed the costs of formal training and retraining in professional and technical expertise12.
+ ACs are supported in developing linkage and LSRF projects in accordance with Decision No. 62/2013 / QD-TTg as mentioned above.
2.2.6 Policies supporting trade promotion and market expansion
Under Decree 193/2013 (Paragraph 2, Article 24), ACs are supported by the state: (i) participation in exhibitions in Viet Nam and abroad; (iii) development of brand name, trademark, origin of goods; (iv) development and implementation of electronic portals, e-commerce exchanges for ACs and FCs.
In addition, ACs are “prioritised in the contracts for agricultural export or temporary storage of agricultural programmes of the Government”, according to Decision No. 62/2013 / QD-TTg on participating in linkage to build the LSRF approach.
2.2.7 Policies supporting the application of science and technology, new technology
Policies to support the application of science and technology and new technology for ACs are regulated in Decree 19313: (i) The annually endowed Fund for the national and provincial level of Science and Technology Development has a budget item supporting ACs and FCs in innovation and technology applications. This involves grants, partly for scientific research. Assistance is provided with funding of 60-100% for capital projects of production testing. Interest-free loans are available for projects applying the results of research and development in the country; loans are available at preferential interest rates for technology innovation projects. (ii) The state supports scientific and technological research in parallel with business funding of scientific and technological research for ACs and FCs. Research projects and the application of advanced science and technology and new technology are approved by competent authorities.
Policies are in place to support the application of innovation and improved technology in agricultural and fishery expansion. (i) If an AC has a project applying innovation and improving technology, this is eligible for medium and long term loans from the Fund for development of science and technology14. (ii) If an AC has organised training courses for members to acquire new technologies under the programme for applying and transferring models of science
(11) Decree 02/2010/ND-TTg dated 8 January 2010 of the Government on agricultural expansion.(12) Circular No. 173/2012/TT-BTC guiding the financial support mechanism for cooperative founders, objects of training and retraining of ACs.(13) Clause 3, Article 24, Decree 193/2013/ND-CP dated 21 November 2013 of the Government on regulation detailed a number of articles of the 2012 law on cooperatives.(14) The fund was establised under Decree No. 122/2003/ND-CP aiming to support lending to perform the tasks of science and technology by organisations and individuals (including agricultural cooperatives).
and technology for the socio-economic development of rural and mountain areas, those are supported with 100% funding: (iii) The ACs are the beneficiaries of agricultural expansion policies and fisheries policies in accordance with regulation on policies for agricultural extension and encouraging rural industrial development15.
In addition, to develop linkage and pursue the LSRF approach16, ACs are supported with up to 30% in the first year and 20% in the second year of the actual cost of pesticides, labour and machinery hire to perform collective crop protection services for members.
2.2.8 Policies supporting infrastructure investment and participating in target programme and socio–economic development programme
Policies to support investment and development of infrastructure for ACs in agriculture, forestry, fisheries and salt production include (Item a, Clause 1, Article 25, Decree 193) headquarters, drying yards, warehouses, primary processing factories, processing factories, electricity, water, markets, irrigation works, infrastructure, aquaculture areas, agricultural supplies stores, inland transportation for production, business for community members of ACs and FCs. The basis for such projects is approval by the competent authorities.
2.2.9 Several additional support policies for agricultural cooperatives
ACs facing difficulties caused by natural disasters and pest infestation are supported with capital and seeds (Paragraph 4, Article 25, Decree 193). This depends on the extent of damage, the danger of pests and the specific need presented by the actual situation that the ACs, FCs have operated in agriculture, forestry, fisheries and salt production, they would be received support policies, preferential for capital, seeds as provision mentioned17.
ACs are exempted from land-use fees or land lease when they construct drying factories, processing factories and warehouses to serve an LSRF project18.
In addition to preferential policies and types of support for each specific AC, there are a number of regulations as well as guidelines for provinces concerning investment in and development of ACs; these are issued by the government. The latest news is that the Government has issued Decision 445/2016, which requires the provinces of the Mekong Delta to establish a new type of AC model. Decision 593/2016 on the pilot regional linkage for a number of major agricultural products in the Mekong Delta makes mention of AC development.
2.3 Policies encouraging the development of farmer groups
Until now, Decree 151/2007/ ND-CP is the highest legislative framework addressing FGs. Decree 151 regulates issues including FG establishment, cooperation contracts and the content of the cooperation contracts, organisational structures, executive management, and the roles
(15) Decree No. 02/2010/ND-CP dated 8 January 2010 on agricultural extension; Decree No. 56/2005/ND-CP dated 26 April 2005 of the Government on agricultural extension, fishery extension; Decree No. 134/2004/ND-CP dated 9 June 2004 on encouraging the development of rural industries.(16) Clause c, Section 1, Article 5 of Decision No. 62/2013/QD-TTg dated 25 October 2013 of the Prime Minister on policy to encourage development cooperation, production-trade linkage and LSRF development.(17) Decision 142/2009/QD-TTg of the Prime Minister dated 31 December 2009 on mechanisms and policies to support planting seeds, livestock, aquaculture to restore production in areas damaged by natural disasters and pests; and Decision No. 49/2012/QD-TTg of the Prime Minister dated 8 November 2012 amending and supplementing Article 3 of Decision 142/2009/QD-TTg of the Prime Minister dated 31 December 2009 on mechanisms and policies to support planting seeds, livestock, aquaculture to restore production in areas damaged by natural disasters and pests;(18) Clause a, Section 1, Article 5 of Decision No. 62/2013/QD-TTg dated 25 October 2013 of the Prime Minister on policy to encourage development cooperation, production-trade linkage and LSRF development.

STUDY REPORT / INTEGRATED COASTAL MANAGEMENT PROGRAMME
2726
and responsibilities of the head and members of FGs. Decree 151 only sets out the principles governing state support for FGs, without stipulating specific support policies. Support and preferences for FGs are set out in a number of other documents. In particular, state support policies for FGs are as follows:
2.3.1 Tax preference
Income tax: FGs are exempted from income tax on the performance of direct technical services to serve agriculture such as irrigation, drainage, ploughing and harrowing the soil, dredging canals, services for pest control, managing diseases of crops and livestock, rendering services for harvesting agricultural products (Paragraph 2, Article 4 Decree 218/2013).
Value-added tax: FGs are not subject to VAT for i) products of cultivation, livestock, aquaculture and fisheries fishing unprocessed or preliminary processing by FGs itself produced, catching sold out; ii) operation of irrigation and drainage, ploughing, infield canal dredging serving agricultural production, services for harvesting agricultural products; iii) credit services, medical services, veterinarians, health care for people and domestic animals (Article 5, 2008 law on value-added tax).
2.3.2 Credit preference
Under Decree 55/2015, credit institutions provide loans to FGs in the form of unsecured loans to 300 million. However, neither Decree 55/2015 nor Decision 62/2013 contain any regulations on preferential credit for FGs participating in linkage in LSRF establishment.
2.3.3 Additional types of support
Decree 151/2007 states that FGs receive support for participating in the design and implementation of plans, projects and programmes promoting the development of the collective economy, plans, projects and programmes of socio-economic development, job creation and the alleviation of poverty in the locality. Thus, FGs may receive other assistance depending on the specific projects and programmes as well as local capacity. This provision offers local flexibility in supporting farmer groups. Therefore, many localities have specific provisions on FG support. These involve training to improve capability, agricultural extension, brand name development, participation in trade fairs to introduce products, etc.
2.4 Provincial policies in support of the development of ACs/FGs and production-trade linkage associated with the LSRF approach
This section presents a number of specific policies of four provinces in support of ACs and FGs as well as supporting production-trade linkage and LSRF production.
2.4.1 Ca Mau province
Ca Mau province has planned 40,000 ha for LSRF rice production. Of this area, 60% is in Tran Van Thoi district and 40% in the Thoi Binh and U Minh districts and Ca Mau city. Among them, 29,510 ha of LSRF area produces high-quality rice with 2 crops/year; 10,040 ha produce both rice and shrimps, and 450 ha winter rice.
Implementing Decision 62/2013/QD-TTG, Ca Mau provincial people’s committee issued Decision No.30/2015/QD-UBND regulating the level of support for collaboration development and production-trade linkage associated with LSRF establishment in Ca Mau province. In particular:
• Support for farmers to take part in training and retraining courses, covering 50% of costs for enterprises and 100% for ACs;
• 50% support for the costs of organising training classes for AC officials;
• 30% support for the costs in the first year and 20% in the second year for the actual cost of pesticides, labour force and machine hire to perform general services for members involved in LSRF linkage;
• 30% support for seed costs for farmers in the first cropping year associated with LSRF establishment.
The total cost of supporting farmers is equivalent to about 1 million/ha. However, Ca Mau province does not regulate the support level for farmers for paddy storage during 3 months.
In addition, Ca Mau province has issued various documents to direct the development of collective economy (ACs, FGs) in the province. Currently, Ca Mau province only implements the LSRF policies (not its own policies) regulated by the central government. According to the provincial report about the results of policy implementation to support the development of economic cooperation in 3 years (2013, 2014, 2015):
• Loan capital comes mainly from the Cooperative Development Support Fund managed by the Cooperative Alliance. 32 ACs borrowed 4,860 million in 2013, 6 ACs borrowed 1,350 million in 2014 and 13 ACs borrowed 1,905 million in 2015.
• Training classes are organised to train the key staff of ACs and FGs. Funding for assisting with training content, retraining for business setup and production planning, services and negotiation skills to sign agreements amounted to 474.58 million for 1,605 people (in 2013, 2014 and 2015).
2.4.2 Bac Lieu province
Bac Lieu province, instead of promulgating a policy to implement Decision 62/2013/QD-TTg on production-trade linkage associated with LSRF establishment, promulgated Plan No. 38/KH-UBND dated 22 August 2013 on LSRF establishment model and guidance to apply a production handbook in accordance with VietGap direction of 2013-2014. This means that the provincial support policies only implement LSRF establishment and apply the VietGAP model, but do not require production-trade linkage.
Farmers participating in building the LSRF model and applying a production handbook in accordance with VietGAP direction receive:
• Investment in irrigation, irrigation infield (preferably from irrigation capital and programme 132);
• 100% of loan interest for borrowing to buy the machines for production;
• 50% of the cost of buying original seeds;
• 100% of the cost of buying row seeding tools, motorised sprayers, foliar fertilisers, microorganic fertilisers for seed treatment, microorganic pesticides for pest treatment, costs of technical training.
As part of provincial support for AC and FG development, the province has issued documents and plans to direct the development of collective economy in the period from 2016 to 2020. The

STUDY REPORT / INTEGRATED COASTAL MANAGEMENT PROGRAMME
2928
province issued Decision No. 37/QD-UBND dated 5 August 2014 to regulate assistance with establishing new ACs and training as well as retraining to improve capacity for ACs.
2.4.3 Soc Trang province
In early 2012, Soc Trang Provincial People’s Council adopted Resolution No. 12 on a Development Scheme for specialty rice production until 2015. The province focuses on investment, on supporting the development of regional production of high-quality aromatic rice and making a brand name for rice of Soc Trang province. The province’s approach is to pursue LSRF establishment, with concentrated production areas linked to enterprises on the product demand side. ACs and FGs play an important role in organising production in LSRFs with high-quality products. To implement this strategy, the province supports the planning and production of quality seed, capacity-building training for staff of ACs, FGs and farmers, establishing agricultural extension, investing in improved irrigation and providing market information.
After Decision 62/2013/QD-TTg was issued, Soc Trang provincial people’s committee issued Plan No. 23/KH-UBND dated 17 March 2015 on the Development of LSRF in the period from 2014 to 2025. The Plan’s target is that LSRF area will reach 29,010 ha in 2025 and that 90% of the LSRF area and output will be subject to contracts for material supplies and product trade with enterprises. The minimum LSRF area for ACs and FGs is 300 ha. Measures promote production-trade linkage and the application of uniform technical process, and encourage the application of sustainable farming techniques (GAP, 1 must 5 reduction, …).
In addition to policies in support of implementation of LSRF and linkage, Soc Trang province has issued plans to support the development of ACs and FGs. Beyond the establishment of the cooperative development support fund with capital of 5 billion, the province does not have its own policies supporting ACs and FGs.
One of the specific features in Soc Trang’s policy is to support the LSRF concept and encourage linkage in production-trade. 90% of LSRF area is involved in production-trade linkage till 2025. The projects producing under LSRF without linkage in production-trade are also supported by the province. The approach is positive because the organisation of production under LSRF can help to cut production costs and ensure more even product quality. It positively facilitates AC and FG development and delivers benefits for production-trade linkage.
2.4.4 An Giang province
An Giang province has implemented the LSRF model in such a manner that the minimum area is 50 ha between 2015 and 2017 and 300 ha until 202019. In addition, An Giang province issued Decision No. 12/2016/QD-UBND dated 2 March 2016 on assistance in development cooperation and production-trade linkage associated with LSRF to support ACs and FGs, enterprises and farmers involved in the linkage.
Support for ACs and FGs: One of the specific features of An Giang is that the province supports both FGs involved in production-trade linkage and those involved in LSRF establishment. ACs and FGs receive the following forms of support: i) Funding to organise training and technical guidance for crop farmers producing under contracts, including all costs of materials, food and accommodation, travel, trainer hire, etc. ii) Pesticides, labour, machine hire to apply common pesticides for members. The maximum support does not exceed 3,250,000 VND/ha in the first
(19) Decision No. 1966/QD-UBND dated 21 September 2015 An Giang provincial people’s committee.
year and 2,160,000 VND/ha in the second year. iii) One-off funding to organise training courses for cooperative staff on management, economic contracts and production techniques, including all costs of materials, food, accommodation and tuition.
Support for farmers: i) One-off support up to 30% of the cost to buy certified seeds for the first crop implementing the LSRF concept; ii) support for 100% of funding to build warehouses at enterprises in cases in which the Government implements the policy for temporary storage of agricultural products.
Support for enterprises: Support for funding to organise training and technical guidance for crop farmers producing under contracts, including all costs of food, accommodation, travel, materials, trainer hire and stationery.
In addition, An Giang province has set up a Cooperative Development Assistance Fund. The Fund supports 70% of credit with an interest rate of 0% for the cooperative project. The province also issued action plans implementing the scheme on “Pilot completion and replication of the model of new style agricultural cooperatives in Mekong Delta An Giang in the period 2016-2020”.
3. The Current Situation of Production–Trade Linkages Associated with Large Scale Rice Fields
3.1 Implementation in recent years in the 4 provinces surveyed
Following Decision 62/2013, the Mekong Delta in general and the four provinces surveyed in particular are implementing the LSRF approach. However, there are differences in the degree of implementation in each province. Among the four provinces surveyed, An Giang and Soc Trang provinces host the largest LSRF area.
Table 3.1: Rice sowing area in LSRF in 4 provinces surveyed (ha)
Year Ca Mau Bac Lieu Soc Trang An Giang
2011 1525 13150
2012 834 4862 22950
2013 726 11591 34000
2014 12168 17996 32781
2015 8567 6164 23723 40615
LSRF area / total rice sowing area ratio in 2015 (%) 6.6 3.4 16.0 6.5
Source: Synthesis from DARD reports, 2016
There is a few area both rice area of the LSRF and rice area of the LSRF associating with linkage in production-trade, even rice area of the LSRF associating with linkage in production-trade is fewer. The survey findings in four provinces show that very few enterprises are involved in linkage with traders.
From September 2012 to March 2015, Ca Mau province has implemented the LSRF model on 8,567 ha (compared to the overall rice planting area in the province, which is 129,766 ha, the LSRF area is very small). 7,390 households are involved in the model in 39 villages in 18 communes in U Minh, Tran Van Thoi, Cai Nuoc districts and Ca Mau city. Each LSRF project received 1-2 varieties of rice seed from provincial assistance. Rice varieties include OM 6976,

STUDY REPORT / INTEGRATED COASTAL MANAGEMENT PROGRAMME
3130
OM 6162, OM 4218, OM 5451, OM 8017 and ST 20. Rice seed certification is assisted, with over 80% being certifiied. Local people bought in 70% of rice seeds, the other 30% coming from their own planting or from exchange with other households. In recent years, only two enterprises participated in buying LSRF-produced rice. These are Ca Mau agricultural products & Foodstuff Import – Export JSC which has purchased about 10,000 tons, and Can Tho GFC Co. Ltd, which has purchased about 300 tons of ST20 rice.
3.2 AC and FG implementation of the LSRF approach
Among the total surveyed, 43% of ACs implement the LSRF approach with an average area of 165 ha. The An Giang ACs implementing LSRF manage smaller areas (112 ha) than the Ca Mau ACs (330 ha). Many Ca Mau ACs implementing LSRF manage not only the area of the ACs’ members, but also that of households not involved in ACs.
Table 3.2: Percentage of ACs and FGs implementing the LSRF approach
Province% of ACs
implementing LSRF
Average area of LSRF per AC
(ha)
% of FGs implementing
LSRF
Average area of LSRF per FG
(ha)
Ca Mau 50.0 330.4 51.9 48.3
Bac Lieu 40.0 189.3 8.0 357.5
Soc Trang 58.6 133.1 76.0 66.5
An Giang 26.7 112.0 44.0 72.2
Total 43.0 164.7 45.1 75.1
Source: Survey 2016.
Table 3.3: Percentage of ACs and FGs applying collective rice production process
Indicator Total Ca Mau
Bac Lieu
Soc Trang
An Giang
AC
Using same variety 79.4 60.0 75.0 88.2 75.0
Applying same technique 85.3 100.0 100.0 76.5 87.5
Applying collective sowing plan 91.2 80.0 100.0 94.1 87.5
Having harvest plan 94.1 80.0 100.0 94.1 100.0
Having regulation on use of fertilisers and chemical substances
29.4 20.0 25.0 29.4 37.5
FG
Using same variety 95.7 92.9 100.0 94.7 100.0
Applying same technique 93.5 92.9 100.0 100.0 81.8
Applying collective sowing plan 82.6 100.0 50.0 94.7 45.5
Having harvest plan 84.8 92.9 50.0 94.7 63.6
Having regulation on use of fertilisers and chemical substances
34.8 14.3 50.0 36.8 54.5
Source: Survey 2016.
Note: Figures only based on ACs and FGs implementing LSRF concept
45% of FGs implement the LSRF concept, with an average area of 75 ha per group across the four provinces. Only 8% of the FGs surveyed implement the LSRF concept in Bac Lieu, but the area of their LSRFs is up to 376 ha.
Table 3.4: Percentage of ACs and FGs experiencing difficulties in LSRF implementation
Type of difficulty Total Ca Mau
Bac Lieu
Soc Trang
An Giang
AC
Poor productive infrastructure (irrigation canal, road) 44.1 2.9 75.0 23.5 87.5
Commune authority does not plan LSRF 8.8 0.0 0.0 11.8 12.5
Production process in LSRF is complicated 11.8 0.0 25.0 11.8 12.5
Difficult to change producers’ habits in applying rice production practices 14.7 0.0 50.0 11.8 12.5
Unable to identify a buying enterprise 29.4 2.9 25.0 41.2 12.5
Lack of support 8.8 2.9 0.0 5.9 12.5
Other 23.5 5.7 25.0 17.6 25.0
FG
Poor productive infrastructure (irrigation canal, road) 8.7 0.0 50.0 15.8 0.0
Commune authority does not plan LSRF 10.9 0.0 50.0 21.1 0.0
Production process in LSRF is complicated 8.7 0.0 50.0 15.8 0.0
Difficult to change producer’s habits in applying rice production practices 4.3 0.0 50.0 5.3 0.0
Unable to identify a buying enterprise 2.2 0.0 50.0 0.0 0.0
Lack of support 0.0 0.0 0.0 0.0 0.0
Other 2.2 0.0 50.0 0.0 0.0
Source: Survey 2016.
Households farm in LSRFs, whereby they have to use the same seed varieties and farming process criteria: technical process, planning, sowing and harvesting, fertilisers, pesticides. However, none of the ACs and FGs sufficiently apply those five criteria. There are many LSRFs with different varieties of rice seed. The rate of fertiliser, pesticide and chemicals use on LSRFs by ACs and FGs is quite low. It seems that FGs are better able to implement the farming process than ACs (the rates of FGs are higher than the rates of ACs).
In implementing the LSRF concept, several ACs and FGs have faced many difficulties, but the rate is quite low. In particular, canals and inland transportation are the most difficult issues because of their shortcomings. The next problem is that it is not easy to find trading partners. Other issues mentioned by ACs and FGs is that the Government does not plan production areas,

STUDY REPORT / INTEGRATED COASTAL MANAGEMENT PROGRAMME
3332
and that it is difficult to change the habits of households when asking them to apply the same rice seed and farming process on the LSRF. The An Giang and Ca Mau FGs do not state any problems in implementing the LSRF concept.
3.3 Linkage between agricultural cooperatives / farmer groups and enterprises / traders
3.3.1 The role of agricultural cooperatives and farmer groups in trade linkage
Some 60.8% of ACs and 52.0% of FGs negotiate with an enterprise to trade the products of members. Many ACs and FGs in Soc Trang and An Giang negotiate to trade products. ACs and FGs have negotiated to trade both rice seed and rice, especially rice. Most ACs and FGs have negotiated to trade products with enterprises. There are very few cases of negotiation with agents and traders. In such cases these are often the traders who supply materials for the ACs and FGs and have committed to buy the products of the ACs and FGs. The majority of cases have to register a contract between ACs and FGs and trading partners.
Table 3.5: Percentage of ACs and FGs surveyed with an agreement with trading partners
Province % of ACs with an agreement with trading partners
% of FGs with an agreement with trading partners
Ca Mau 50.0 11.1
Bac Lieu 30.0 32.0
Soc Trang 62.1 100.0
An Giang 73.3 68.0
Total 60.8 52.0
Source: Survey 2016.
In the linkage between production and trade, the ACs and FGs play an intermediary role between enterprises and household members. This is what these enterprises need the help of ACs in order to support for enterprises and members of households linking together. The ACs and FGs perform a number of functions. They include: negotiating contracts on behalf of membership and signing contracts with partners; receiving investment from rice buying partners and making payments back to household members; guiding and supervising household members in implementing farming processes (technical process, seasonal calendar).
Table 3.6: Types of partners with which ACs and FGs have trading agreements
ProvinceAgreement
with enterprise
Agreement with agents/
collectors
Agreement with other ACs
and FGs
AC
Ca Mau 80.0 20.0 0.0
Bac Lieu 100.0 0.0 0.0
Soc Trang 94.4 5.6 0.0
An Giang 100.0 0.0 0.0
Total 95.7 4.3 0.0
FG
Ca Mau 66.7 0.0 33.3
Bac Lieu 100.0 0.0 0.0
Soc Trang 84.0 16.0 0.0
An Giang 100.0 0.0 0.0
Total 90.6 7.6 1.9
Source: Survey 2016.
Table 3.7: Roles of ACs and FGs in linkage for trading paddy produce
(Unit: % of ACs and FGs)
ROLES AND RESPONSIBILITIES AC FG
On behalf of members, negotiate with partner 27.0 38.0
On behalf of members, sign contract with partner 29.0 32.0
Receive advance from partner and redistribute to members 16.0 19.0
Source appropriate inputs for supply to members 8.0 11.0
Instruct and guide members about production process 17.0 25.0
Supervise members in applying collective production process 20.0 17.0
Establish plan for harvest 24.0 24.0
Ask members to apply production process 23.0 25.0
Supervise production practices of members 16.0 19.0
Transport paddy produce from field to silo of enterprise 3.0 1.0
Other 1.0 1.0
Source: Survey 2016.
3.3.2 Investment support by partners for agricultural cooperatives and farmer groups in trade linkage
Partners often invest in ACs and FGs when they undertake to trade produce, in order to forge closer links between the two parties. This investment ensuring ACs and FGs have to buy products of ACs and FGs. On the other hand, the investment in ACs and FGs is also a way for partners to ensure that the ACs and FGs use the right varieties of seed, fertilisers and pesticides. Moreover, traders can sell agricultural supplies to ACs and FGs. Indeed, many traders associate with the ACs and FGs for the sole purpose of selling agricultural supplies and earning profit from that branch of business.

STUDY REPORT / INTEGRATED COASTAL MANAGEMENT PROGRAMME
3534
Table 3.8: Percentage of ACs and FGs with agreements and investment by trading partners
Province AC FG
Ca Mau 40.0 50.0
Bac Lieu 66.7 100.0
Soc Trang 64.7 87.5
An Giang 71.4 78.6
Total 65.2 85.4Source: Survey 2016.
Partners invest in ACs and FGs in many forms, as follows:
• Partners make a deposit for ACs and FGs, ACs and FGs use the money to invest for members to buy seeds and inputs. 10% of ACs and 5% of FGs associate with enterprises to invest some money in advance. Normally, if the enterprises invest money in advance, they will not provide fertilisers and pesticides any more. The enterprises usually advance sums ranging from 3 to 12 million/hectare to ACs (an average of 6.7 million/hectare), and from 1.8 to 3 million/hectare to FGs (an average of 2.2 million/hectare). It is possible that the degree of confidence in ACs is higher than that in FGs, so ACs are advanced larger amounts of money. Moreover, ACs have legal status. The above analysis showed that there are no differences in the rate of enterprises associating with ACs or FGs.
• Partners buying products provide rice seed for ACs and FGs. This is a popular form of investment in the linkage to ensure good seeds. In addition, ACs and FGs sow the right varieties of rice at the request of the buyers; this is especially the case for ACs and FGs involved in linkages requiring the production of rice seed or specialty rice with high quality. Partners also supply fertilisers and materials for ACs and FGs.
• Enterprises also dispatch staff to participate in AC operations, such as An Loc Troi company in An Giang.
Table 3.9: Forms of partner investment in ACs in rice trading linkage
(Unit: % of ACs having linkage)
Form of investment Total Ca Mau Bac Lieu
Soc Trang An Giang
AC
Advance in cash for members 10.0 0.0 0.0 0.0 20.0
Seed supply for members 73.3 100.0 100.0 81.8 60.0
Fertiliser supply for members 43.3 100.0 50.0 54.5 26.7
Plant protection chemical supply for members 43.3 100.0 100.0 36.4 33.3
Payment to AC of fee for support of AC in linkage with its members 26.7 50.0 100.0 18.2 20.0
Payment of commission to AC for amount of fertiliser and plant protection chemicals that AC buys from enterprise
6.7 0.0 0.0 0.0 13.3
Other investment 3.3 0.0 0.0 0.0 6.7
FG
Advance in cash for members 7.3 0.0 12.5 0.0 18.2
Seed supply for members 95.1 100.0 100.0 95.2 90.9
Fertiliser supply for members 41.5 0.0 37.5 57.1 18.2
Plant protection chemical supply for members 43.9 0.0 37.5 52.4 36.4
Payment to FG of fee for support of FG in linkage with its members 24.4 0.0 75.0 0.0 36.4
Other investment 2.4 0.0 0.0 0.0 9.1
Source: Survey 2016.
In addition to the above investments, a number of partners associated with ACs and FGs have to bear other expenses. In particular, the buyers must pay the ACs and FGs small amounts of money to help them associate with their membership. This amount is calculated according to the volume of rice that ACs or FGs sell to enterprises and traders. The fee ranges from 10 to 200 VND/kg rice. There is no difference in the fee between the ACs and FGs. Some enterprises and traders have to pay a commission to ACs for the materials (fertilisers, pesticides) used that are suppled by those enterprises and traders, measured as a percentage of turnover. This rate is from 3% to 5%. Thus, ACs receive both fees and commissions in the production-trade linkage. This means that enterprises and traders have additional expenses when they associate with ACs and FGs compared to situations in which they do not engage in such linkage.
Table 3.10: Additional costs for enterprises in linkage with ACs and FGs
Type of costAC FG
mean min max mean min max
Fee for supporting linkage (VND/kg paddy) 70.6 10 200 62 10 200
Commission for input use (% of total turnover) 4.0 3.0 5.0 - - -
Source: Survey 2016.
In implementing linkage, buyers often play a decisive role in defining the type of rice seed sowed and seed quality used. As this is a main factor determining the quality of the rice produced, most buyers require ACs and FGs to use certain types. In addition, buyers require ACs and FGs to implement the right schedule of sowing and harvesting. This involves the buyers arranging the infrastructure for transporting, drying and selling the rice, because nearly 50% of ACs and FGs sell fresh rice at the rice field. The requirements imposed by buyers seek to ensure an even quality of rice, which is particularly important for ACs and FGs engaged in linkages designed to produce rice seed and high-quality rice. Currently, very few ACs and FGs receive support for rice storage and drying because for this buyers (enterprises, traders) need to engage in major investment and maintain large infrastructure. The enterprises seldom invest in the infrastructure because of its ineffectiveness.

STUDY REPORT / INTEGRATED COASTAL MANAGEMENT PROGRAMME
3736
Table 3.11: Requirements of trading partners upon ACs and FGs and role in linkage
(Unit: % of ACs and FGs concerned)
Total Ca Mau Bac Lieu Soc Trang An Giang
Require rice variety 62.4 87.5 27.3 48.8 82.1
Require rice seed quality (with or without certified quality) 55.4 62.5 72.7 46.5 59.0
Require harvest calendar 49.5 37.5 63.6 60.5 35.9
Buy paddy at rice field 49.5 62.5 54.5 65.1 28.2
Ask AC members to apply same production process 41.6 50.0 72.7 37.2 35.9
Supervise production practices of AC members 33.7 12.5 45.5 37.2 30.8
Ask about sowing calendar 30.7 25.0 45.5 41.9 15.4
Provide guidance on production practices for AC members 30.7 25.0 54.5 34.9 20.5
Require type of plant protection chemicals to be used 29.7 25.0 36.4 25.6 33.3
Transport paddy from field to silo of enterprise 27.7 62.5 27.3 27.9 20.5
Require specific product quality after harvesting 18.8 50.0 18.2 20.9 10.3
Require type of fertiliser to be used 16.8 12.5 27.3 23.3 7.7
Support AC members to stock in silo of enterprise 4.0 0.0 0.0 9.3 0.0
Support to dry paddy 3.0 0.0 0.0 7.0 0.0
Others 3.0 0.0 0.0 7.0 0.0
Source: Survey 2016.
Support by the state for production under the large scale rice field approach and for production-trade linkage
When participating in linkage, LSRF producers not only receive investment (ACs, FGs return) from the buyers, but also various types of assistances (ACs, FGs unreturn) such as materials, technical training and maintenance. In addition, most ACs and FGs are assisted by the state in training on technology transfer in rice farming, and in the application of sustainable farming processes. Some ACs and FGs are also assisted by enterprises in farming techniques and disease control techniques .
Table 3.12: Percentage of ACs and FGs receiving support when engaging in linkage
Kind of support % of ACs
% of ACs receiving support
from public agency
% of ACs receiving support
from enterprise
% of FGs
% of FGs receiving support
from public agency
% of FGs receiving support
from enterprise
Rice seed 17.5 14 3.5 25.4 17.9 7.5
Fertilisers 8.8 5.3 3.5 9 4.5 4.5
Plant protection chemicals 5.3 1.8 3.5 7.5 4.5 3.0
Training on techniques and practices 64.9 52.6 15.8 85.1 77.6 19.4
Applying sustainable rice production process (1M5R, 3R3I, VietGAP, …)
52.6 47.4 8.8 44.8 40.3 7.5
Insect and disease control 54.4 49.1 10.5 58.2 50.7 16.4
Guidance on measures to prevent and control pests and diseases
61.4 49.1 10.5 61.2 56.7 13.4
Transport paddy from field to storehouse 21.1 1.8 19.3 16.4 0.0 16.4
Keep paddy in storehouse 12.3 1.8 10.5 3.0 0.0 3.0
Support when risk events occur (natural disasters, diseases)
17.5 15.8 3.5 49.3 47.8 1.5
Others 7.0 3.5 0.0 1.5 0.0 1.5
Source: Survey 2016.
3.3.4 Benefits gained from the rice trading linkage
3.3.4.1 Benefits for AC/FG members from trade linkage
The ACs and FGs engaged in production-trade linkage with enterprises and traders give diverse evaluations of the benefits of linkage. First of all, product trade is stable. This factor is mentioned by most ACs and FGs. Further benefits mentioned are that the members of ACs and FGs are trained in farming techniques; they can trade their products at a higher price; they receive advance investment in fertilisers and pesticides, or gain access to money to buy inputs; the quality of material supplies is assured; and higher profits are achieved in the linkage.

STUDY REPORT / INTEGRATED COASTAL MANAGEMENT PROGRAMME
3938
Table 3.13: Benefits gained through linkage in paddy trading
(Unit: % of ACs and FGs benefitting)
Type of benefit Total Ca Mau Bac Lieu Soc Trang An Giang
Sustained sale of paddy 84.9 66.7 87.5 92 76.5
Rice price is higher than without linkage 41.5 33.3 50 40 41.2
Higher profit 34.0 33.3 62.5 20 41.2
Access to fertiliser, seed, plant protection chemicals 28.3 33.3 0 40 23.5
Provision of guidance 52.8 33.3 50 68 35.3
Advance cash without interest 32.1 0 50 48 5.9
Provision of inputs with assured quality 49.1 66.7 75 52 29.4
Source: Survey 2016.
Note: Figures based on ACs and FGs overall
Table 3.14: Profit increase (in %) though linkage compared to situation without linkage
Province AC FG Total
Ca Mau 9.3 10.0 9.4
Bac Lieu 17.5 17.2 17.3
Soc Trang 7.3 4.0 5.4
An Giang 7.0 6.9 6.9
Total 9.4 9.1 9.2
Source: Survey 2016.
In general, linkage with rice trade delivers an increase in profit compared to a situation without linkage that averages about 9.2%, although that figure does vary substantially between ACs and FGs and among provinces. This average profit increase is also suitable for other assessments.
One of the factors allowing households to make a higher profit is that they can sell rice at a price above the market price. To ensure sustainable linkage, buyers, ACs and FGs often negotiate and unify the method of buying rice as well as the price at sale. There are 3 forms to fix a price of rice:
1. The parties negotiate a fixed price at the beginning of sowing. This form is used by a small number of ACs and a large number of FGs in production-trade linkage. Normally, when buying rice under the fixed price, when the market price falls below the fixed price stated in the contract, the buyers (enterprises, traders) have to buy products at the fixed price nonetheless. Conversely, if the market price is higher than the fixed price in the contract, the buyer usually negotiates with the ACs and FGs to buy at a price higher than the one stated in the contract but lower than the market price. According to the buyers (enterprises, traders) they have to negotiate prices with the ACs and FGs because they also negotiated the fixed price with their partners.
2. Most of the buyers and of the ACs and FGs set the price of rice at harvest time or at some point before harvesting. This is a method that buyers often expect.
Table 3.15: Forms of determining paddy price
(Unit: % ACs and FGs having linkage and using that form)
Form of price determination Total Ca Mau Bac Lieu
Soc Trang
An Giang
AC
Price is fixed at sowing time (indicated in contract) 14.0 25.0 0.0 23.5 5.3
Price is agreed before harvest time and is not changed at buying time (fixed price)
14.0 75.0 0.0 11.8 5.3
Market price at harvest time 72.1 0.0 100.0 64.7 89.5
FG
Price is fixed at sowing time (indicated in contract) 32.7 66.7 12.5 45.8 17.7
Price is agreed before harvest time and is not changed at buying time (fixed price)
5.8 0.0 12.5 0.0 11.8
Market price at harvest time 61.5 33.3 75.0 54.2 70.6
Source: Survey 2016.
Regarding the price of rice, 46% of ACs and 42% of FGs said that the selling price of the rice of ACs and FGs is often higher than the market price by 50 to 200 VND/kg of rice. For some special types of rice, ACs and FGs trade products at prices higher by 500 to 800 VND/kg compared to varieties of ordinary rice. However, some ACs/FGs did also state that the buying price of enterprises is lower than the market price. This case occurs when enterprises and ACs/FGs negotiate the fixed price of rice at the beginning of planting; the situation can then arise that the price of rice in the market is higher than the initial fixed price. To avoid major losses because the enterprises buying the rice of ACs/FGs have signed a contract to sell rice at a fixed price to other enterprises, enterprises often negotiate with ACs and FGs to buy at a price higher than the fixed one stated in the contract at the beginning of the planting period but lower than the market price.
Table 3.16: Percentage of ACs and FGs which sold their paddy at a price higher than the market price
Province
AC sells paddy at higher price FG sells paddy at higher price
% of ACs Amount higher(VND/kg) % of FGs Amount higher
(VND/kg)
Ca Mau 60.0 150.0 0.0
Bac Lieu 50.0 100.0 62.5 152.5
Soc Trang 46.7 175.0 40.0 166.7
An Giang 40.9 83.3 41.2 100.0
Total 45.5 121.4 41.5 140.7
Source: Survey 2016.

STUDY REPORT / INTEGRATED COASTAL MANAGEMENT PROGRAMME
4140
3.3.4.2 Benefits for ACs/FGs from trade linkage
The ACs/FGs associating with trade enterprises also gain many benefits, such as additional revenue from payments made by enterprises (fees for linkage support, commissions for using material inputs). This is an important source of funding for AC/FG operation and expansion. Moreover, the role and capacity of ACs/FGs can be enhanced.
Table 3.17: Benefits gained by ACs and FGs from linkage with trading partners
(Unit: % of ACs and FGs benefitting)
Type of benefit Total Ca Mau Bac Lieu Soc Trang An Giang
Additional income paid by trading partners to support ACs and FGs in linkage
26.6 27.3 42.1 17.6 32.1
Additional income from commission paid by input agents 20.1 27.3 42.1 10.3 23.2
Expanded activities of AC/FG 12.3 9.1 15.8 19.1 3.6
Improved role of AC/FG vis-a-vis members 48.7 63.6 68.4 54.4 32.1
Capacity of AC/FG managers is improved 43.5 63.6 63.2 38.2 39.3
Other 2.6 0.0 0.0 4.4 1.8
Source: Survey 2016.
3.3.5 Difficulties encountered by ACs/FGs in trade linkage
ACs/FGs have also encountered some difficulties in linkage. The main reason mentioned is that enterprises do not buy products at a higher price than the market price. Other reasons are that farmers do not comply with contracts; ACs/FGs are unsupported; and farming processes become overly complex when implementing the linkage.
Table 3.18: Difficulties encountered by ACs and FGs in linkage
(Unit: % of ACs and FGs experiencing difficulties)
Type of difficulty Total Ca Mau Bac Lieu Soc Trang An Giang
Technical process is complicated 9.7 0.0 5.3 11.8 10.7
Members do not respect signed contract (sell their paddy to non-contracted buyers) 18.8 18.2 15.8 14.7 25.0
Enterprise does not buy paddy at price higher than market price 29.9 18.2 26.3 27.9 35.7
Lack of support 16.2 36.4 26.3 10.3 16.1
Other 7.1 9.1 10.5 5.9 7.1
Source: Survey 2016.
The survey results showed that more than 10% of members do not fulfil their commitment to trade products with enterprises, and several households do not repay the advance investment made by enterprises in production inputs.
Table 3.19: Percentage of members of ACs and FGs fulfilling commitments to trading partners
Province % members sold paddy to contracted enterprise
% members repaid advance investments to partners
Ca Mau 100 100
Bac Lieu 73.3 100
Soc Trang 96.8 96.8
An Giang 81.9 73.5
Total 88.7 89.2
Source: Survey 2016.
3.3.6 Support needs when implementing linkage and LSRF
Table 3.20: Types of support needed by ACs in rice trading linkage and in LSRF
(Unit: % of ACs needing the type)
Type of support needed Total Ca Mau Bac Lieu Soc Trang An Giang
Finding partner to buy paddy of AC 62.5 60.0 66.7 61.1 63.6
Training for AC members on production practices 58.3 80.0 66.7 72.2 40.9
Capacity-building for AC 43.8 80.0 100.0 44.4 27.3
Access to credit 43.8 40.0 100.0 66.7 18.2
Support for AC in negotiations with trading partners 41.7 60.0 66.7 50.0 27.3
Access to high-quality rice seed 37.5 20.0 33.3 66.7 18.2
Advance of quality seed for AC 35.4 0.0 66.7 50.0 27.3
Support for AC in following up the rice growth 31.3 20.0 33.3 50.0 18.2
Support for AC in controlling pests and diseases 29.2 20.0 33.3 50.0 13.6
Support for AC concerning machines serving rice production 29.2 40.0 100.0 38.9 9.1
Support in improvement of irrigation system 29.2 40.0 33.3 33.3 22.7
Advance of fertilisers and other inputs to AC 25.0 0.0 66.7 33.3 18.2
Support for AC to apply sustainable production process 22.9 60.0 0.0 27.8 13.6
Support for AC to apply fertilisers 20.8 0.0 0.0 44.4 9.1

STUDY REPORT / INTEGRATED COASTAL MANAGEMENT PROGRAMME
4342
Planning LSRF area 18.8 0.0 100.0 11.1 18.2
Improving transport system 10.4 20.0 0.0 11.1 9.1
Other 8.3 0.0 0.0 5.6 13.6
Source: Survey 2016.
The ACs/FGs need various kinds of support. Such assistance concerns finding partners to trade products, running training courses for members on farming processes, building the capacity of AC/FG managers, facilitating access to credit for ACs/FGs, and negotiating contracts with partners of trading products.
The ACs/FGs also need assistance with rice seeds, inputs, machinery and irrigation. However, the proportion of ACs/FGs needing those types of assistance is quite low.
Table 3.21: Types of support needed by FGs in rice trading linkage and in LSRF
(Unit: % of FGs needing the type)
Type of support needed Total Ca Mau Bac Lieu Soc Trang An Giang
Capacity-building for FG 69.8 100.0 87.5 76.0 47.1
Finding partner to buy paddy of FG 64.2 100.0 25.0 64.0 76.5
Training for FG members on production practices 64.2 100.0 100.0 76.0 23.5
Support for FG in negotiations with trading partners 60.4 66.7 62.5 64.0 52.9
Access to credit 50.9 33.3 87.5 48.0 41.2
Advance of quality seed for FG 47.2 0.0 37.5 72.0 23.5
Advance of fertilisers and other inputs to FG 43.4 0.0 37.5 68.0 17.6
Access to high-quality rice seed 41.5 66.7 37.5 40.0 41.2
Support for FG concerning machines serving rice production 39.6 33.3 62.5 52.0 11.8
Planning LSRF area 35.8 33.3 62.5 32.0 29.4
Support for FG in following up the rice growth 32.1 66.7 50.0 32.0 17.6
Support for FG in controlling pests and diseases 32.1 66.7 25.0 32.0 29.4
Support for FG to apply sustainable production process 30.2 33.3 37.5 36.0 17.6
Support for FG to apply fertilisers 24.5 0.0 12.5 32.0 23.5
Improving transport system 5.7 0.0 12.5 0.0 11.8
Support in improvement of irrigation system 1.9 0.0 0.0 4.0 0.0
Source: Survey 2016.
3.4 ACs and FGs which do not implement the LSRF approach
3.4.1 Reasons why ACs and FGs do not implement the LSRF approach
ACs and FGs stated many explanations for why they do not implement the LSRF approach. Many ACs/FGs stated as main reasons: the area of land of members is interspersed with non-member households; ACs/FGs are unable to find partners to trade products; it is very difficult to implement the LSRF approach because production on the LSRF is quite complex and there is a lack of unity among members.
Table 3.22: Reasons why ACs and FGs did not apply LSRF (% of ACs and FGs)
Reason Total Ca Mau Bac Lieu Soc Trang An Giang
ACs
Production process is complicated and members are not unanimous
31.1 40.0 16.7 25.0 36.4
Members’ ricefields are interspersed with ricefields of non-members
55.6 80.0 33.3 66.7 50.0
Do not know how to implement LSRF 15.6 40.0 66.7 8.3 0.0
Can not find enterprise signing contract to buy paddy 37.8 40.0 33.3 33.3 40.9
Do not have support from state 20.0 60.0 50.0 8.3 9.1
Do not acknowledge the benefits of LSRF 11.1 0.0 0.0 0.0 22.7
Other 15.6 60.0 16.7 0.0 13.6
FGs
Production process is complicated and members are not unanimous
21.4 15.4 26.1 16.7 21.4
Members’ ricefields are interspersed with ricefields of non-members
17.9 7.7 21.7 16.7 21.4
Do not know how to implement LSRF 53.6 38.5 60.9 16.7 71.4
Can not find enterprise signing contract to buy paddy 46.4 38.5 69.6 0.0 35.7
Do not have support from state 30.4 38.5 39.1 0.0 21.4
Do not acknowledge the benefits of LSRF 37.5 38.5 65.2 0.0 7.1
Other 14.3 23.1 8.7 50.0 0.0
Source: Survey 2016.
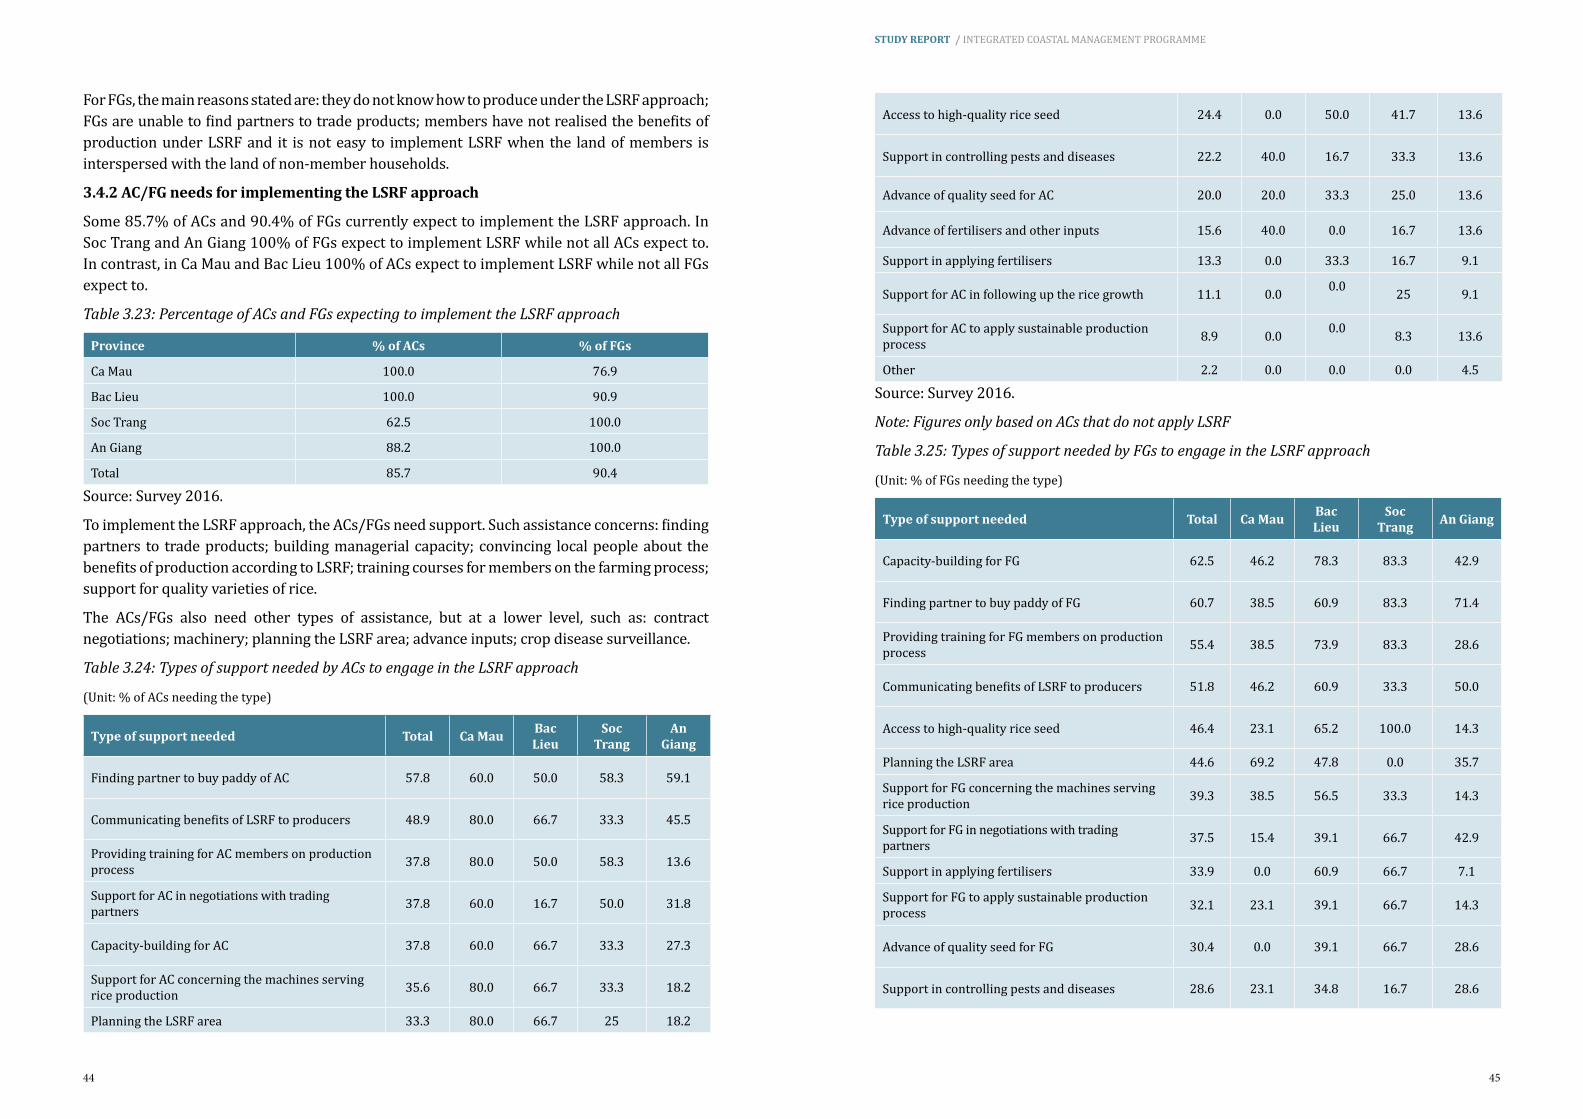
STUDY REPORT / INTEGRATED COASTAL MANAGEMENT PROGRAMME
4544
For FGs, the main reasons stated are: they do not know how to produce under the LSRF approach; FGs are unable to find partners to trade products; members have not realised the benefits of production under LSRF and it is not easy to implement LSRF when the land of members is interspersed with the land of non-member households.
3.4.2 AC/FG needs for implementing the LSRF approach
Some 85.7% of ACs and 90.4% of FGs currently expect to implement the LSRF approach. In Soc Trang and An Giang 100% of FGs expect to implement LSRF while not all ACs expect to. In contrast, in Ca Mau and Bac Lieu 100% of ACs expect to implement LSRF while not all FGs expect to.
Table 3.23: Percentage of ACs and FGs expecting to implement the LSRF approach
Province % of ACs % of FGs
Ca Mau 100.0 76.9
Bac Lieu 100.0 90.9
Soc Trang 62.5 100.0
An Giang 88.2 100.0
Total 85.7 90.4
Source: Survey 2016.
To implement the LSRF approach, the ACs/FGs need support. Such assistance concerns: finding partners to trade products; building managerial capacity; convincing local people about the benefits of production according to LSRF; training courses for members on the farming process; support for quality varieties of rice.
The ACs/FGs also need other types of assistance, but at a lower level, such as: contract negotiations; machinery; planning the LSRF area; advance inputs; crop disease surveillance.
Table 3.24: Types of support needed by ACs to engage in the LSRF approach
(Unit: % of ACs needing the type)
Type of support needed Total Ca Mau Bac Lieu
Soc Trang
An Giang
Finding partner to buy paddy of AC 57.8 60.0 50.0 58.3 59.1
Communicating benefits of LSRF to producers 48.9 80.0 66.7 33.3 45.5
Providing training for AC members on production process 37.8 80.0 50.0 58.3 13.6
Support for AC in negotiations with trading partners 37.8 60.0 16.7 50.0 31.8
Capacity-building for AC 37.8 60.0 66.7 33.3 27.3
Support for AC concerning the machines serving rice production 35.6 80.0 66.7 33.3 18.2
Planning the LSRF area 33.3 80.0 66.7 25 18.2
Access to high-quality rice seed 24.4 0.0 50.0 41.7 13.6
Support in controlling pests and diseases 22.2 40.0 16.7 33.3 13.6
Advance of quality seed for AC 20.0 20.0 33.3 25.0 13.6
Advance of fertilisers and other inputs 15.6 40.0 0.0 16.7 13.6
Support in applying fertilisers 13.3 0.0 33.3 16.7 9.1
Support for AC in following up the rice growth 11.1 0.0 0.0 25 9.1
Support for AC to apply sustainable production process 8.9 0.0 0.0 8.3 13.6
Other 2.2 0.0 0.0 0.0 4.5
Source: Survey 2016.
Note: Figures only based on ACs that do not apply LSRF
Table 3.25: Types of support needed by FGs to engage in the LSRF approach
(Unit: % of FGs needing the type)
Type of support needed Total Ca Mau Bac Lieu
Soc Trang An Giang
Capacity-building for FG 62.5 46.2 78.3 83.3 42.9
Finding partner to buy paddy of FG 60.7 38.5 60.9 83.3 71.4
Providing training for FG members on production process 55.4 38.5 73.9 83.3 28.6
Communicating benefits of LSRF to producers 51.8 46.2 60.9 33.3 50.0
Access to high-quality rice seed 46.4 23.1 65.2 100.0 14.3
Planning the LSRF area 44.6 69.2 47.8 0.0 35.7
Support for FG concerning the machines serving rice production 39.3 38.5 56.5 33.3 14.3
Support for FG in negotiations with trading partners 37.5 15.4 39.1 66.7 42.9
Support in applying fertilisers 33.9 0.0 60.9 66.7 7.1
Support for FG to apply sustainable production process 32.1 23.1 39.1 66.7 14.3
Advance of quality seed for FG 30.4 0.0 39.1 66.7 28.6
Support in controlling pests and diseases 28.6 23.1 34.8 16.7 28.6

STUDY REPORT / INTEGRATED COASTAL MANAGEMENT PROGRAMME
4746
Advance of fertilisers and other inputs 25.0 0.0 34.8 50.0 21.4
Support for FG in following up the rice growth 21.4 15.4 21.7 33.3 21.4
Other 7.1 15.4 4.3 0.0 7.1
Source: Survey 2016.
Note: Figures only based on FGs that do not apply LSRF
3.5 ACs and FGs which do not engage in trade linkage
3.5.1 Reasons why ACs and FGs do not engage in rice trading linkage
Table 3.26: Reasons for ACs and FGs not linking to trading partners
Reason Total Ca Mau
Bac Lieu
Soc Trang
An Giang
ACs
Unable to find trading partner to sign contract 77.4 60.0 85.7 72.7 87.5
Low LSRF area, so trading partner does not sign contract 12.9 40.0 0.0 9.1 12.5
Trading enterprises do not buy paddy at price higher than market price 25.8 0.0 14.3 18.2 62.5
Rice quality does not meet the requirements of the trading enterprises 12.9 60.0 0.0 9.1 0.0
Do not have means to transport paddy to storehouse of trading enterprise 9.7 0.0 0.0 18.2 12.5
Requirements of trading partners are too difficult and complicated 16.1 20.0 14.3 9.1 25.0
Other 12.9 20.0 28.6 9.1 0.0
FGs
Unable to find trading partner to sign contract 79.6 83.3 100.0 - 25.0
Low LSRF area, so trading partner does not sign contract 14.3 0.0 29.4 - 25.0
Trading enterprises do not buy paddy at price higher than market price 14.3 8.3 11.8 - 37.5
Rice quality does not meet the requirements of the trading enterprises 6.1 12.5 0.0 - 0.0
Do not have means to transport paddy to storehouse of trading enterprise 16.3 4.2 41.2 - 0.0
Requirements of trading partners are too difficult and complicated 22.4 0.0 52.9 - 25.0
Other 10.2 16.7 0.0 - 12.5
Source: Survey 2016.
The ACs/FGs stated many reasons to explain why they do not engage in trade linkage, such as:
• They are unable to find partners who buy the rice produce
• Their LSRF area is considered too small by partners to sign a contract
• They can trade rice with other partners at a higher price than the market price
• They do not meet the buyers’ requirements upon rice quality
• They do not meet the complex requirements of partners upon ACs/FGs
• They lack transportation for bringing rice to the partners’ warehouses
The most important of the above reasons is inability to find partners to buy rice. Most of the partners buying the rice of ACs/FGs are not involved in trade linkage. This is also an important reason for ACs/FGs not to implement production under the LSRF approach.
3.5.2 AC/FG needs for trade linkage
Most of the ACs/FGs expect to engage in trade linkage. However, they need support in order to implement such linkage, specifically in the following fields: i) finding partners to trade products; ii) building the capacity of staff managers; iii) engaging in production under the LSRF approach.
Table 3.27: Percentage of ACs and FGs wanting to engage in linkage for paddy sale
Province % of ACs % of FGs
Ca Mau 100.0 95.2
Bac Lieu 100.0 93.8
Soc Trang 81.8 -
An Giang 85.7 100.0
Total 89.7 95.5
Source: Survey 2016.
Note: Figures only based on ACs and FGs that do not have linkage
Table 3.28: Types of support needed by ACs and FGs to have linkage with paddy trading partners
(Unit: % of ACs and FGs needing the type)
Type of support needed Total Ca Mau Bac Lieu Soc Trang An Giang
Finding trading enterprise to contract with ACs and FGs 85.3 88.0 95.2 100.0 53.8
Support for ACs and FGs to apply LSRF 58.8 56.0 76.2 55.6 38.5
Capacity-building for ACs and FGs 63.2 48.0 90.5 66.7 46.2
Other 5.9 4.0 4.8 0.0 15.4
Source: Survey 2016.

STUDY REPORT / INTEGRATED COASTAL MANAGEMENT PROGRAMME
4948
4. Current Capacity and Operation of Agricultural Cooperatives in The Four Provinces Surveyed
4.1 Current development of ACs in the provinces surveyed
Among the four provinces surveyed, the number of ACs/FGs in Ca Mau, Soc Trang and An Giang increased from 2011 to 2016, while the number of ACs/FGs in Bac Lieu fell over that period.
The proportion of crop and livestock ACs is low in Ca Mau and Bac Lieu, and high in Soc Trang and An Giang.
Figure 4.1: Structure of ACs in the provinces surveyed
Source: Synthesis from DARD reports, 2016.
Overall, ACs are small-scale in the four provinces surveyed. The small numbers of members mean low capital contribution. On average, ACs have fewer than 100 members each. The proportion of ACs involved in production-trade linkage is very low.
Table 4.1: Current situation in the 4 provinces surveyed
Indicator Ca Mau Bac Lieu Soc Trang An Giang
Total number of ACs in 2016 166 58 92 106
Average members per AC 25 72 73 88
Average capital per AC (million VND) - 468 142 260
% of ACs involved in LSRF 13,3 5,2 14,1 17,0
Source: Synthesis from DARD reports, 2016.
According to an evaluation of provinces, most ACs have operational performance at a medium or low level.
Table 4.2: Percentage of ACs at various performance levels
Level of performance Ca Mau Bac Lieu Soc Trang An Giang
Year 2015 2015 2016
Good 0
Data not available
16 18
Relatively good 34 32 41
Medium 51 39 30
Low 14 13 11
Source: Synthesis from DARD reports, 2016.
4.2 Current capacity of AC managers
4.2.1 Education level
Most cooperative managers (including the management board and directors) finished high school and lower. Across all survey samples, an average of 7.3% of the management staff of ACs completed higher education at college and university level. Notably 53% of managers completed secondary school. Only 27.5% of ACs’ management board staff attained intermediate level or higher.
The education level of supervisory board staff is even lower. 1.3% of control officers have college and university degrees and 7% have completed intermediate level training. Some 82% of control officers have high school or lower-level education, including 73.5% of control officers attaining secondary school level.
Positions as accountant and treasurer require professional expertise. Among accountants, 32.6% of those of ACs/FGs attained intermediate level and higher. Most accountants and treasurers in ACs/FGs attained secondary school and high school levels.
On average, 35% of ACs/FGs have technical staff with an average of 2.2 staff/AC. Most of the technical staff of ACs also attained secondary school and high school levels. Officers at intermediate level and higher accounted for 30%.
Table 4.3: Education level of AC managers
(Unit: % of managers of all ACs surveyed)
Type of manager Level Ca Mau Bac Lieu Soc
Trang An Giang Total
Member of management board and director
University 6.3 2.8 2.5 9.5 5.3
College 0.0 5.6 0.0 1.7 1.8
Professional school 6.3 11.1 5.9 9.5 8.2
High school 37.5 19.4 38.1 31.0 31.5
Secondary 50.0 61.1 50.0 50.0 52.8
Primary 0.0 0.0 3.4 0.9 1.1
100%
80%
60%
40%
20%
0%Ca Mau
Agricultural coop
Salt coop
69%
31.0% 23.2%
76.8%
6.9%
24.1%
37.9%
1.8%
31.3%
Bac Lieu Soc Trang
Forestry coop
General service coop
Aquaculture coop

STUDY REPORT / INTEGRATED COASTAL MANAGEMENT PROGRAMME
5150
ControllerUniversity 0.0 0.0 2.0 1.6 0.9
College 0.0 0.0 0.0 1.6 0.4
Professional school 11.8 9.5 0.0 6.6 7.0
High school 5.9 0.0 34.0 24.6 16.1
Secondary 82.4 90.5 54.0 67.2 73.5
Primary 0.0 0.0 10.0 3.3 3.3
Accountant and treasurer
University 11.1 18.8 2.0 18.2 12.5
College 0.0 6.3 2.0 7.3 3.9
Professional school 0.0 12.5 17.6 34.5 16.2
High school 66.7 25.0 39.2 12.7 35.9
Secondary 22.2 31.3 39.2 25.5 29.5
Primary 0.0 6.3 0.0 1.8 2.0
Technical staffUniversity 15.4 0.0 8.6 1.7 6.4
College 0.0 0.0 0.0 0.6 0.1
Professional school 0.0 0.0 88.6 6.3 23.7
High school 23.1 50.0 2.9 6.3 20.6
Secondary 61.5 50.0 0.0 63.4 43.7
Primary 0.0 0.0 0.0 21.7 5.4
Source: Survey 2016.
4.2.2 Capacity and work experience of key managers in agricultural cooperatives
In this report, key managers (personnel) of ACs are the chairman of the management board, the director, the chief of the supervisory board and the chief accountant.
4.2.2.1 Age of cooperative managers
The average age of the chairman of the management board is 52, that of the chief supervisor is 50. Notably, the average age of chief accountant is 36. This is because the chief accountant requires professional expertise, so most of them are younger people trained by the schools. A current development in many ACs is that cooperative leaders worry about finding personnel in the locality because, although participatory management in ACs makes a major contribution to the community, it does not bring high earnings for AC staff. The salary is very low, but young people need to earn income.
Table 4.4: Age of key managers of ACs
Position Total Ca Mau Bac Lieu Soc Trang An Giang
President of management board or director (if not president) 51.5 47.2 54.3 49.4 54.1
Controller in chief 52.0 50.9 51.4 48.7 55.7
Chief accountant 36.2 48.0 34.9 34 35.9
Source: Survey 2016.
4.2.2.2 The use of computers and the internet
The survey findings on the use of computers and the internet by chairman, chief supervisor and chief accountant is presented in the two following tables. Some key points are as follows:
• Less than 50% of management board chairmen of ACs know how to use computers and the internet.
• Less than 30% of chief supervisors know how to use computers and the internet.
• 60% of chief accountants know how to use computers and the internet.
• The ability to use computers and the internet of AC staff in Soc Trang Province is lower than in the other three provinces.
• 47.5% of management board chairmen know how to use computers.
Table 4.5: Percentage of AC key managers that can use the computer
Position Total Ca Mau Bac Lieu Soc Trang An Giang
President of management board/director 47.5 60.0 60.0 26.7 60.0
Controller in chief 27.5 30.0 40.0 10.0 40.0
Chief accountant 61.3 40.0 70.0 33.3 93.3
Source: Survey 2016.
Table 4.6: Percentage of AC key managers that can use the internet
Position Total Ca Mau Bac Lieu Soc Trang An Giang
President of management board/director 42.5 50.0 50.0 20.0 60.0
Controller in chief 23.8 30.0 30.0 3.3 40.0
Chief accountant 60.0 40.0 70.0 30.0 93.3
Source: Survey 2016.
4.2.2.3 Management experience of agricultural cooperatives
Table 4.7: Number of years of involvement in AC management of ACs’ main managers
Position Total Ca Mau Bac Lieu Soc Trang An Giang
President of management board/director 6.6 2.3 5.1 4.4 10.7
Controller in chief 7.0 3.2 5.5 4.0 10.8
Chief accountant 5.0 2.6 1.8 3.3 7.8
Source: Survey 2016.
Overall, key personnel are experienced in cooperative management, generally having over five years of involvement in such management. This is advantageous in the management and administration of cooperative operations.

STUDY REPORT / INTEGRATED COASTAL MANAGEMENT PROGRAMME
5352
4.2.3 Capacity-building for cooperative personnel
Cooperative management personnel are instructed and trained in many different matters. The survey results showed that AC personnel are instructed and trained in areas such as the 2012 law on cooperatives, cooperative governance, trade and product marketing, financial management, agricultural production techniques and other matters. The training content and the proportion of ACs trained in each issue in each domain are listed in the table below.
Several conclusions can be drawn from the results presented in that table:
• There are many new points in the current law on cooperatives compared to the 1996 law (as mentioned above) and ACs must adjust to the 2012 law on cooperatives. Under the regulation adopted on 30/06/2016, ACs must register again under the 2012 law. Therefore, it is essential to instruct ACs about the 2012 law on cooperatives, as this helps ACs understand the new regulations and implement the transformation process. The provinces are responsible for providing training for ACs under the 2012 law on cooperatives. Therefore, the proportion of ACs in the four provinces surveyed that have been trained on the content of the 2012 law on cooperatives is very high. However, there are two important issues – financial management of ACs and re-registering under the 2012 law on cooperatives – on which ACs must act to comply with the new law, yet a large proportion of the ACs has not been trained or instructed in these matters. For example, 29% of ACs have not been trained on financial management and assets under the provisions of the 2012 law on cooperatives (capital contribution, profit distribution and assets, ...).
• Not many ACs have received training in the important domains and issues relating to governance, financial management, production and business organisations (trade, product marketing, technique, ...).
• In the four provinces surveyed, the proportion of ACs trained in Ca Mau province on the 2012 law on cooperatives was lowest.
• Most training and instruction courses are for members of the management board and directors.
• Only 33% of supervising officers of ACs have been trained in the monitoring and control of AC operations.
• A very low proportion of accountant staff has been instructed or trained in professional accounting for cooperatives.
Table 4.8: Percentage of ACs trained, by training issue
Domain Issue Total Ca Mau Bac Lieu
Soc Trang
An Giang
2012 law on ACs
Nature of ACs and new points in 2012 law on cooperatives 90.0 70.0 100.0 96.7 86.7
Regulation on organisation of ACs under 2012 law on cooperatives
86.3 60.0 100.0 83.3 93.3
Asset and financial management (capital contribution, distribution of profit, of assets, …)
71.3 50.0 80.0 70.0 76.7
Re-registration in accordance with the 2012 law on cooperatives
63.8 30.0 90.0 70.0 60.0
AC management
Project development, business planning of ACs 70.0 60.0 100.0 60.0 73.3
Organisation, management, operation of business activities of ACs
61.3 40.0 80.0 70.0 53.3
Supervision, control of business activities of ACs 53.8 20.0 70.0 53.3 60.0
Methods to mobilise participation and capital contribution of members in/to AC activities
28.8 20.0 80.0 23.3 20.0
Other 1.3 0.0 0.0 3.3 0.0
Trade, marketing
Brand building 23.8 10.0 20.0 36.7 16.7
Methods of market evaluation and analysis 30.0 10.0 30.0 40.0 26.7
Methods of product marketing 27.5 20.0 40.0 33.3 20.0
Contract negotiation 48.8 20.0 30.0 60.0 53.3
Financial management and accounting
Preparation of financial reports, tax reporting 47.5 20.0 80.0 30.0 63.3
Use of accounting software 27.5 0.0 20.0 6.7 60.0
AC bookkeeping 43.8 10.0 60.0 40.0 53.3
Techniques of agricultural production
Sustainable production process (VietGAP, organic, …) 26.3 30.0 70.0 33.3 3.3
1M5R, 3R3I 72.5 70.0 100.0 70.0 66.7
Other production process 57.5 70.0 80.0 66.7 36.7
Other 8.8 0.0 10.0 10.0 10.0
Source: Survey 2016.

STUDY REPORT / INTEGRATED COASTAL MANAGEMENT PROGRAMME
5554
Table 4.9: Percentage of AC staff trained, by training issue
Domain IssueManage-
ment board
Super-visory board
Accoun-tant,
treasur-er
Techni-cian
2012 law on ACs
Nature of ACs and new points in 2012 law on cooperatives 90.0 42.5 28.8 5.0
Regulation on organisation of ACs under 2012 law on cooperatives 83.8 35.0 16.3 1.3
Asset and financial management (capital contribution, distribution of profit, of assets, …)
62.5 23.8 27.5 0.0
Re-registration in accordance with the 2012 law on cooperatives 61.3 15.0 7.5 0.0
AC Management
Project development, business planning of ACs 67.5 16.3 17.5 0.0
Organisation, management, operation of business activities of ACs 57.5 8.8 10.0 0.0
Supervision, control of business activities of ACs 22.5 32.5 6.3 0.0
Methods to mobilise participation and capital contribution of members in/to AC activities
26.3 5.0 3.8 0.0
Other 2.5 0.0 0.0 0.0
Trade, marketing
Brand building 25.0 3.8 1.3 0.0
Methods of market evaluation and analysis 27.5 2.5 1.3 0.0
Methods of product marketing 25.0 2.5 0.0 1.3
Contract negotiation 47.5 10.0 5.0 0.0
Financial management and accounting
Preparation of financial reports, tax reporting 18.8 3.8 36.3 0.0
Use of accounting software 10.0 3.8 25.0 0.0
AC bookkeeping 15.0 0.0 32.5 1.3
Techniques of agricultural production
Sustainable production process (VietGAP, organic, …) 27.5 8.8 10.0 2.5
1M5R, 3R3I 62.5 33.8 25.0 22.5
Other production process 52.5 25.0 17.5 11.3
Other 6.3 2.5 2.5 2.5
Source: Survey 2016.
Detailed information on capacity-building for the various types of AC staff in each province is presented in Annex 1.
4.3 The participation of members in agricultural cooperatives
4.3.1 The number and scale of production of members
The numbers of AC members in the four provinces surveyed are relatively low. The average number of members per AC is 77. In Ca Mau, Bac Lieu and Soc Trang the average number is less than 50 members/CA. All ACs in Ca Mau and Bac Lieu have less than 120 members20 and the land area with annual crops of all members is less than 100 ha. In An Giang, 40% of the ACs surveyed have more than 120 members, and 10% have more than 300 members. In Soc Trang 3.5% of ACs have more than 300 members while all the rest in that province have less than 120 members.
Table 4.10: Members and sizes of ACs
Indicator Total Ca Mau Bac Lieu Soc Trang An Giang
Number of members per AC 76.6 44.2 32.5 46.9 130.7
% AC has up to 20 members 20.3 30.0 20.0 31.0 6.7
% AC has from 21 to 120 members 63.3 70.0 80.0 65.5 53.3
% AC has from 121 to 300 members 11.4 0.0 0.0 0.0 30.0
% AC has more 300 members 5.1 0.0 0.0 3.5 10.0
Arable annual land area per AC member (ha) 2.5 2.0 1.4 1.3 4.3
Total arable annual land area of all members per AC (ha) 157.8 73.3 41.9 57.7 318.1
Source: Survey 2016.
4.3.2 Capital contribution from members of agricultural cooperatives
Under regulation, members of ACs have to contribute to the chartered capital. However, the survey results showed that on average 76% of members of ACs contribute to capital. The proportion of members contributing to chartered capital is extremely low among the ACs in Ca Mau. Lack of capital contribution not only affects the production and business operations of ACs but also shows that members in such an AC do not have a positive outlook on the cooperative.
Most CAs surveyed have contributed in the capital under provisions of law, there was 8.8% of ACs surveyed that members of these ACs have contributed more than 20% of the authorised capital. However, the number of members accounted for 39% of the authorised capital. CAs recorded members, who are the largest contribution in the authorised capital, accounted for 51%. Obviously, the ACs need be converted to the contribution of the authorised capital under the provisions mentioned.
Table 4.11: Contribution of chartered capital by AC members
Indicator Total Ca Mau Bac Lieu Soc Trang An Giang
% ACs has chartered capital contribution 76.4 15.5 66.3 77.0 98.0
% AC has members that contributes chartered capital more than 20% of total chartered capital of AC
8.8 10.0 0.0 6.7 13.3
(20) The division of the cooperative group under the number of members based on the shift on the graph

STUDY REPORT / INTEGRATED COASTAL MANAGEMENT PROGRAMME
5756
% AC members has chartered capital contribution more than 20% of total chartered capital of AC
4.8 1.0 0.0 13.6 1.3
Total chartered capital of AC’s members that contributes chartered capital more than 20% of total chartered capital of AC (%)
39.3 28.6 - 46.0 38.0
Chartered capital that member contributed the highest (%) 51.0 28.6 40.0 25.0 51.0
Source: Survey 2016.
4.3.3 Use by members of AC services
On average, only 66% of members use AC input services such as farming inputs and production services. About 45% of members trade their products through ACs. This is a major limitation of the current ACs.
Moreover, use of AC services by members contributes only 41.7% of AC annual turnover, with the figure for many ACs in Ca Mau being very low. The majority of revenue comes from non-members.
Table 4.12: Percentage of members using AC services
Total Ca Mau Bac Lieu Soc Trang An Giang
% of AC members using input services of AC 65.9 53.9 94.0 62.7 65.7
% of AC members trading their products through AC 45.1 38.8 59.8 50.7 38.5
% of turnover of AC coming from members 41.7 28.0 75.5 29.9 46.6
Source: Survey 2016.
4.3.4 Involvement in AC management
The surveyed ACs reported that there is a positive involvement of members at the membership congress of ACs. This is evidence of the active participation in ACs and interest in AC operation by members.
Table 4.13: Percentage of AC members that has letter of participation and participated in AC’s congress
Total Ca Mau Bac Lieu Soc Trang An Giang
% of members that has letter to AC for their member status 67.0 80.9 100 66.8 51.7
% of members that participated in the latest congress 79.4 84.0 90.5 86.4 67.2
Source: Survey 2016.
4.4 Current situation of governance capacity of ACs
The legal provisions require that cooperative operations are managed in a favourable, public and transparent manner. These provisions demand that regulations specifically define the administrative management and the financial and operational mechanisms of the management board and the board of supervisors. However, many ACs still lack such regulations. The percentage of ACs with regulations on administrative management and on the financial and
operational mechanisms of the management board and supervisory board is presented in the following table. Some conclusions are:
• The lowest proportion of ACs has regulations on the supervisory board (50%) and financial mechanisms (57.5%).
• ACs in Ca Mau have the least regulations, while most ACs in An Giang have all necessary regulations in place.
• ACs must have a register of cooperative members under regulation, but only 62.5% of ACs surveyed have such registers.
Most ACs have assigned specific tasks to each member of the management board and record the minutes of the meetings. However, very few ACs notify the resolutions of the management board after each meeting, and very few ACs record the minutes of the meetings of the supervisory board.
Table 4.14: Percentage of ACs having management regulations
Total Ca Mau Bac Lieu Soc Trang An Giang
AC has management regulation on collective activities 75.0 30.0 60.0 76.7 93.3
AC has financial management regulation 57.5 20.0 30.0 46.7 90.0
AC has regulation on operation of management board or management committee
67.5 40.0 40.0 70.0 83.3
AC has regulation on operation of supervisory board 50.0 10.0 60.0 56.7 53.3
AC has member register book 62.5 40.0 60.0 56.7 76.7
Source: Survey 2016.
Table 4.15: Percentage of ACs assigning specific tasks to individual managers and recording the minutes of meetings
(Unit: % of ACs)
Total Ca Mau Bac Lieu Soc Trang An Giang
AC has assigned tasks to every member of management board 86.3 80.0 90.0 76.7 96.7
AC records minutes of meetings 78.8 80.0 70.0 63.3 96.7
After meeting, management board issues a resolution 30.0 30.0 50.0 23.3 30.0
AC records minutes of meetings of supervisory board 35.0 30.0 30.0 16.7 56.7
Source: Survey 2016.
Although the majority of ACs have an annual meeting with the management board, only 30% of the ACs notify the resolutions of the board to their members. 78.8% of ACs have production

STUDY REPORT / INTEGRATED COASTAL MANAGEMENT PROGRAMME
5958
business plans. 82.5% of ACs hold cooperative congresses of members within 12 months. 10% of ACs hold such a congress within 24 months.
Table 4.16: Operating activities of ACs
(Unit: % of ACs)
Total Ca Mau Bac Lieu Soc Trang An Giang
AC reports management board’s resolutions to members 30.0 0.0 60.0 26.7 33.3
From January to June 2016, management board had at least one meeting
91.3 80.0 100.0 83.3 100.0
AC has annual business plan 78.8 80.0 90.0 70.0 83.3
Source: Survey 2016.
Members are required to use the services of the ACs under regulation; if they do not use the cooperative’s services for 3 consecutive years, they will be excluded. The majority (83.5%) of ACs have provisions on expulsion criteria, but in fact only 14.7% of ACs expel members if they do not use the AC’s services.
Table 4.17: Percentage of ACs that expels members if they do not use the AC’s services
Total Ca Mau Bac Lieu Soc Trang An Giang
AC has regulation on conditions under which AC member status is lost
83.5 70.0 80.0 82.8 90.0
% AC expels members if they do not use AC services in 3 consecutive years
14.7 0.0 28.6 30.0 0.0
Source: Survey 2016.
The survey results found limitations and weaknesses in the financial accounting governance of ACs. In particular:
• Only 52.5% of ACs issue the capital contribution certificate to members.
• 75% of ACs produce financial reports to inform management and supervisory board members.
• 33.8% of ACs produce annual tax reports. Notably, the 10 ACs in Bac Lieu do not produce tax reports.
• 48.8% of ACs have implemented an internal audit operation.
• 17.5% of ACs were audited by state agencies during the past 3 years. However, all those ACs are in An Giang. There is no auditing yet in the three other provinces. While financial accounting management of ACs is still limited, the external auditor is not restricted to the ACs identifying weaknesses. Those need to be tackled to complete the financial accounting system. The lack of external audits also reduces transparency for members.
• In the four provinces surveyed, only the financial accounting governance of ACs in An Giang is implemented very well.
Table 4.18: Percentage of ACs producing financial reports and audits
Total Ca Mau Bac Lieu Soc Trang An Giang
ACs issue the certificate of chartered capital contribution to members
52.5 10.0 40.0 36.7 86.7
ACs produce financial report to inform members of management board and of supervisory board
75.0 30.0 90.0 70.0 90.0
Every year, ACs produce tax report 33.8 20.0 0.0 3.3 80.0
ACs produce internal audit annually 48.8 40.0 80.0 10.0 80.0
In last 3 years, AC is audited/checked by public competent agency
17.5 0.0 0.0 0.0 46.7
Source: Survey 2016.
In summary: Currently, financial accounting management is the weakest stage in cooperative governance. The cause of the problem is that personnel capacity of ACs is restricted, regulations, especially financial regulations, are lacking, and there is a lack of checks and supervision by the authorities. In some provinces almost all ACs do not produce annual tax reports, but this has not been checked and sanctioned.
4.5 Current capital and assets situation of agricultural cooperatives
4.5.1 Land
Very few ACs in Ca Mau, Bac Lieu and Soc Trang have their own headquarters. The largest proportion of ACs with its own headquarters is in An Giang, accounting for 62% of ACs. In all four provinces surveyed, only 31.7% of ACs have their own headquarters to work from. Where ACs do not have their own headquarters they often have to use members’ houses or offices of the commune.
Very few ACs have land for common production: only 5% of ACs have common farming land, covering 0.3 ha of the average area. Due to the lack of common land, the ACs are unable to organise production operations as such; they mainly provide services to members and non-member households.
Table 4.19: Percentage of ACs having collective land
Indicator Total Ca Mau Bac Lieu Soc Trang An Giang
% AC has own head office 31.7 10.0 30.0 10.0 62.1
% AC has collective land 5.0 10.0 0.0 6.7 3.3
Collective land size per AC (ha) 0.3 2.0 0.0 0.0 0.0
Source: Survey 2016.

STUDY REPORT / INTEGRATED COASTAL MANAGEMENT PROGRAMME
6160
4.5.2 Assets
The ACs surveyed specialise in arable farming (especially rice), so their machinery and equipment ACs mainly serves rice farming.
The ACs mainly perform irrigation services, so the highest proportion of ACs has water pumps and irrigation systems. The lowest proportion of ACs has machinery serving production operations, harvesting and storage. The service capacity of ACs for members is restricted by the lack of machinery.
The ACs in An Giang have a variety of machinery serving rice production and have the highest proportion of machinery. In contrast, ACs in Ca Mau have very little machinery for rice production and have the lowest proportion of machinery.
Table 4.20: Percentage of ACs having machines and equipment for business activities
Type of asset Total Ca Mau Bac Lieu Soc Trang An Giang
Sowing machine 10.0 0.0 20.0 10.0 10.0
Tillage machine 10.0 0.0 10.0 6.7 16.7
Pumps 46.3 10.0 40.0 16.7 90.0
Sprayer 10.0 10.0 20.0 10.0 6.7
Harvester 7.5 0.0 0.0 16.7 3.3
Boat 3.8 0.0 0.0 6.7 3.3
Storehouse 13.8 10.0 10.0 13.3 16.7
Dryer 10.0 0.0 10.0 13.3 10.0
Decorticator 0.0 0.0 0.0 0.0 0.0
Irrigation system 25.0 10.0 60.0 3.3 40.0
Other machines 13.8 10.0 10.0 20.0 10.0
Other factory, equipment 1.3 0.0 0.0 0.0 3.3
Source: Survey 2016.
The total asset value of machinery and land of ACs is relatively low. The average total asset value of ACs in machinery and facilities for business production and land is 794 million. In particular, the asset value of ACs in Ca Mau and Bac Lieu is very low at only about 400 million.
Table 4.21: Value of assets and machinery of ACs for business activities (million VND)
Type of asset Total Ca Mau Bac Lieu Soc Trang An Giang
Sowing machine 11.6 0.0 71.5 0.1 7.0
Tillage machine 15.6 0.0 8.0 1.2 37.7
Pumps 202.3 3.0 210.2 38.8 429.7
Sprayer 2.4 0.9 6.3 2.7 1.3
Harvester 18.5 0.0 0.0 39.4 10.0
Boat 2.5 0.0 0.0 2.7 4.0
Storehouse 106.1 1.0 8.0 185.8 94.0
Dryer 66.7 0.0 0.0 133.3 44.6
Decorticator 122.9 400.0 73.3 2.3 167.7
Irrigation system 171.0 26.7 0.2 430.6 16.3
Other machines 1.6 0.0 0.0 0.0 4.2
Office land (for which AC has land-use right certificate) 41.9 0.0 0.0 93.3 18.4
Head office 23.8 15.0 16.8 0.7 52.1
Office equipment (computer, printer, filing cabinet, table, chairs, …) 6.0 0.0 0.0 0.4 15.6
Total asset value 794.6 446.6 394.3 936.1 902.6
Source: Survey 2016.
4.5.3 Capital
4.5.3.1 Chartered capital
ACs must have chartered capital to register under legal provisions. Therefore, most ACs have registered chartered capital with an average of more than 400 million/AC. However, only 72% of the ACs surveyed in four provinces actually have the capital in hand. In particular, only 2% of ACs in Ca Mau actually have the chartered capital. Many ACs said that they only have registered the capital but could not collect it from members. The highest proportion of ACs that really has the chartered capital is in An Giang, at nearly 97% of ACs.
The amount actually collected compared to the volume of registered capital is low. Except for An Giang, with a high proportion of collected capital, many ACs actually have less than half of the chartered capital in hand. In Ca Mau, ACs have 32.5% of the registered capital in hand. In Bac Lieu and Soc Trang, the proportion of the actual capital contribution is around 70%. Because the registered capital was low, the actual chartered capital of ACs was also very low with less than 100 million/AC.
Table 4.22: Register and implementation of chartered capital contribution of ACs
Province
Regis-tered
chartered capital of AC (mil-
lion VND)
Regis-tered
chartered capital /member (million
VND)
% AC really has chartered
capital con-tribution
chartered capital that
AC really has in hand
(million VND)
% chartered
capital really
contributed in
comparison to
registered one
chartered capital that
AC really has in hand
/member (million VND)
Ca Mau 303.9 16.9 22.2 32.2 32.5 1.8
Bac Lieu 151.0 5.2 77.8 64.4 60.8 1.9
Soc Trang 173.4 6.2 62.1 55.4 67.7 2.5
An Giang 741.9 8.7 96.7 781.7 101.8 8.7
Total 407.5 8.3 72.7 336.7 83.3 4.8
Source: Survey 2016.

STUDY REPORT / INTEGRATED COASTAL MANAGEMENT PROGRAMME
6362
On average, each member of ACs contributes 4.8 million to chartered capital. However, the contribution is less than 2.5 million/member of ACs in Ca Mau, Bac Lieu and Soc Trang. In general, if an AC has fewer members, the chartered capital of each member is greater. For ACs with 20 members, the average of the chartered capital is 6.5 million/member, while for ACs with more than 300 members the contribution per member to chartered capital is only 3.5 million.
Table 4.23: Real chartered capital contribution of AC members, by AC size
Scale of ACs Total Ca Mau Bac Lieu Soc Trang An Giang
AC has up to 20 members 6.5 5.0 1.5 4.9 20.7
AC has from 20 to 120 members 4.2 0.2 2.1 1.5 9.8
AC has more 120 to 300 members 5.6 5.6
AC has more 300 members 3.5 0.1 4.6
Source: Survey 2016.
4.5.3.2 Debts
26.6% of the ACs surveyed in the four provinces are currently in debt, with 104 million on average. ACs in An Giang currently in debt have the largest overall debt (57%) and the largest amount of debt per AC (242 million). The proportion of ACs in debt in the three other provinces is very low, as is the amount of debt. The cause of problem is that many ACs are formed to have a name, what does not work. One reason for the lower level of debt is that ACs have not lent capital from commercial banks, and instead receive loans from the cooperative development fund. Much of the debt of An Giang’s ACs is from enterprises, other ACs and partners supplying materials for the ACs.
Table 4.24: Current debt of ACs
Province % of ACs in debt
Total amount of
debt per AC(mill VND)
Amount of debt of ACs to commer-cial banks (mill VND)
Amount of debt of ACs to coop de-velopment fund (mill
VND)
Amount of debt of ACs
to enter-prises, oth-
er coops, individuals (mill VND)
Amount of debt of ACs
to other organisa-
tions(mill VND)
Ca Mau 20.0 73.0 23.0 50.0 0.0 0.0
Bac Lieu 10.0 14.0 0.0 14.0 0.0 0.0
Soc Trang 3.5 2.3 0.0 0.0 2.3 0.0
An Giang 56.7 242.4 50.9 13.3 139.2 191.5
Total 26.6 103.9 22.2 13.2 53.7 72.7
Source: Survey 2016.
4.5.3.3 Partners’ debt
32% of ACs lend money to other partners, the average loan per AC being 78.4 million. ACs in An Giang lend 160 million/AC to partners. The proportion of ACs lending money to partners in the other three provinces (Ca Mau, Bac Lieu, Soc Trang) is less and the amounts owed very small.
In terms of the balance between the amount owed to and the debt of ACs, most ACs (78%) have a positive net debt balance (the amount owed by partners to the AC is greater than the amount owed by the AC for its debt).
Table 4.25: Partners in debt to ACs
Total average Ca Mau Bac Lieu Soc Trang An Giang
% of ACs that are creditors 31.7 10.0 10.0 10.3 66.7
Total amount by which partners are in debt to AC (mill VND) 78.4 23.0 4.0 38.9 160.0
Source: Survey 2016.
4.5.3.4 Difficulties in accessing capital
71% of ACs said that they experience difficulties in accessing commercial bank loans. The main reason stated is that ACs are without collateral. Some reasons stated by the banks is that ACs are less efficient in operation and production business plans are not feasible. These are not only problems in the four provinces surveyed. They are common and explain the difficulties in accessing capital although the credit policy mechanism has allowed banks to provide unsecured credit to 1 billion and, in the event of a linkage, loans up to 70% of the project value under the linkage model21. Financial and accounting mismanagement, with a lack of transparency, tax reports and audits, is a further reason why ACs find it difficult to access capital.
Table 4.26: Reasons why ACs experience difficulty in gaining loans from commercial banks
Reason Total Ca Mau Bac Lieu Soc Trang An Giang
% of ACs stating they have difficulty to access loans 71.2 88.9 83.3 65.2 67.9
Reasons for difficulty (% of ACs)
ACs lacking assets for mortgage 73.4 66.7 55.6 76.2 95.2
Project documents of AC are not accepted 12.7 0.0 22.2 14.3 14.3
AC does not have business plan 11.9 11.1 22.2 14.3 0.0
Financial management is not transparent 4.0 11.1 0.0 4.8 0.0
AC operates with bad performance (no profit/loss, …) 7.9 11.1 11.1 9.5 0.0
AC is in great debt 0.0 0.0 0.0 0.0 0.0
Other reasons 12.7 22.2 0.0 23.8 4.8
Source: Survey 2016.
(21) Decree 55/2015/ND-CP.

STUDY REPORT / INTEGRATED COASTAL MANAGEMENT PROGRAMME
6564
In summary: the assets and capital of ACs in the four provinces surveyed are very low. A lack of assets and capital, and lack of transparency in financial management and operations with low efficiency are the reasons why ACs experience major difficulties in accessing capital and expanding their production and business.
4.6 Production and business operation of agricultural cooperatives
4.6.1 Goals and strategies
For most of the ACs, their prime objective is to serve their members. In particular, 46.3% of ACs established the first goal to bring benefits to members. 12.5% of ACs seek to trade products for their membership. 23.8% of ACs seek to supply input materials and services for the production of members. Only 17.5% of ACs seek to gain the highest profit for themselves.
However, 42% of ACs intend to change their key operational goal in the coming period. About 60% of ACs in Ca Mau, Bac Lieu and An Giang expect a change in their operational goal. In contrast, in Soc Trang only about 15% of ACs expect such a change. Overall, ACs in all four provinces surveyed have moved strongly towards the goal to help members trade products and supply input materials and services serving the production and business operations of their members. ACs have moved particularly to assist members in trading their products, which is experienced currently by farmers as the most difficult stage.
Table 4.27: Operational objectives of ACs at present and in the near future
(Unit: % of ACs)
Province Timing
Gain highest
profit for AC
Provide inputs and services for
business activities of
members
Facilitate sale of
produce for
members
Gain profit for members
Total
Ca MauPresent 10.0 30.0 30.0 30.0 100.0
Near future 40.0 20.0 40.0 0.0 100.0
Bac LieuPresent 10.0 60.0 10.0 20.0 100.0
Near future 0.0 40.0 30.0 30.0 100.0
Soc TrangPresent 3.3 10.0 16.7 70.0 100.0
Near future 3.3 23.3 10.0 63.3 100.0
An GiangPresent 36.7 23.3 3.3 36.7 100.0
Near future 20.0 30.0 26.7 23.3 100.0
TotalPresent 17.5 23.8 12.5 46.3 100.0
Near future 13.8 27.5 22.5 36.3 100.0
Source: Survey 2016.
There are different activities undertaken by ACs to achieve their operational goals. The operational strategy of ACs is presented in the following table. Most of the ACs focus on providing supplies and services for agricultural production and trading produce for members. 28% of ACs have strategies to increase the scale of ACs through increasing the number of members.
Table 4.28: Strategies of ACs
Strategy Total Ca Mau Bac Lieu Soc Trang An Giang
Focus on providing inputs for agricultural production 70.8 90.0 60.0 56.7 76.7
Focus on providing services for agricultural production 65.8 60.0 70.0 56.7 76.7
Focus on trading members’ produce 77.5 90.0 70.0 66.7 83.3
Expand AC’s activities into non-agricultural activities 4.2 10.0 0.0 0.0 6.7
Increase AC size (increase members, area, ...) 28.3 30.0 20.0 23.3 40.0
Improve product quality (application of production process with product certificate, label,…)
11.7 0.0 20.0 26.7 0.0
Reduce AC size 0.0 0.0 0.0 0.0 0.0
Not change anything 5.0 10.0 0.0 10.0 0.0
Others 2.5 0.0 0.0 6.7 3.3
Source: Survey 2016.
For 84% of ACs the primary strategy is to serve their members as customers. However, for 30% of ACs serving non-member households is also a primary objective.
Figure 4.2: Client strategy of ACs
Source: Survey 2016.
Ca Mau
Service to members120
100
80
60
40
20
3010 17 13 16
8487839070
0Bac Lieu Soc Trang An Giang Chung
Service to non members

STUDY REPORT / INTEGRATED COASTAL MANAGEMENT PROGRAMME
6766
Table 4.29: Percentage of ACs engaging in group business activity
Activity Total Ca Mau Bac Lieu Soc Trang An Giang
Services relating to agricultural production inputs 48.3 70.0 40.0 43.3 40.0
Services relating to agricultural production practices (irrigation, plant protection, tillage, harvest,…)
64.2 30.0 90.0 50.0 86.7
Services relating to produce trade 47.5 50.0 50.0 50.0 40.0
Services for non-agricultural business 2.5 10.0 0.0 0.0 0.0
Internal credit services 16.7 0.0 10.0 26.7 30.0
Technology transfer (supported by state) 18.3 20.0 10.0 36.7 6.7
Technology transfer (by AC itself) 4.2 0.0 10.0 6.7 0.0
Concentrated production (production of AC in whole, but not of every member)
4.2 10.0 0.0 6.7 0.0
Source: Survey 2016.
Most of the ACs surveyed largely undertake activities for agricultural production. Only 2.5% of ACs undertake activities relating to non-agricultural production.
4.6.2 Business operations that ACs are implementing and will implement
Table 4.30: Services rendered by ACs to members
(Unit: % of ACs)
Activity Total Ca Mau Bac Lieu Soc Trang An Giang
Irrigation (watering, drainage) 51.9 10.0 80.0 17.2 90.0
Sign contract to trade produce for members 46.8 50.0 30.0 58.6 40.0
Provide crop seeds 40.5 60.0 30.0 44.8 33.3
Provide kinds of fertiliser 40.5 60.0 40.0 34.5 40.0
Provide plant protection chemicals 29.1 40.0 30.0 24.1 30.0
Tillage service 22.8 20.0 10.0 20.7 30.0
Internal credit service 20.3 0.0 0.0 20.7 33.3
Harvesting service 19.0 10.0 0.0 34.5 13.3
Provide plant protection service 10.1 0.0 20.0 13.8 6.7
Supervise the application of production process 8.9 10.0 20.0 13.8 0.0
Sowing service 7.6 0.0 10.0 6.9 10.0
Product transport service 7.6 20.0 0.0 6.9 6.7
Buy products of members 7.6 20.0 20.0 3.4 3.3
Drying service 3.8 0.0 0.0 10.3 0.0
Preservation, storehouse 3.8 10.0 0.0 3.4 3.3
Loading and unloading service 2.5 0.0 0.0 6.9 0.0
Provide breeding stock 2.5 0.0 0.0 3.4 3.3
Other services 2.5 0.0 0.0 0.0 6.7
Collective production 2.5 10.0 0.0 0.0 3.3
Preliminary processing, processing 1.3 10.0 0.0 0.0 0.0
Electricity services 1.3 0.0 0.0 0.0 3.3
Source: Survey 2016.
Overall, despite small differences between the four provinces, the main services provided to members of ACs are quite similar. For all surveyed ACs, the ACs mainly render services to members such as irrigation services (51.9%), supporting members in trading their produce (46.8%), providing varieties of seed (40.5%), fertilisers (40.5%), pesticides (29.1%), tillage (22.8%).
A small proportion of ACs provides services for product transportation (7.6%), drying (3.8%), warehousing (3.8%). Very few ACs provide machinery and equipment, due to a lack of finance to buy machinery.
4.6.2.1 Services rendered for non-members of agricultural cooperatives
ACs provide some services for non-members. Beyond business purposes for some ACs, providing services for non-members of ACs ensures the scale of AC operation. However, the proportion of ACs rendering services for non-members is smaller than that rendering services for members. Services often provided by ACs include irrigation and inputs (seeds, fertilisers, pesticides). These are also the main services provided to members of ACs.
Table 4.31: Services rendered by ACs to non-members
(Unit: % of ACs)
Activity Total Ca Mau Bac Lieu Soc Trang An Giang
Irrigation (watering, drainage) 25.3 10.0 30.0 6.9 46.7
Provide crop seeds 19.0 40.0 0.0 13.8 23.3
Provide kinds of fertiliser 16.5 40.0 10.0 10.3 16.7
Sign contract to trade produce for members 15.2 30.0 0.0 10.3 20.0
Provide plant protection chemicals 13.9 20.0 10.0 10.3 16.7
Tillage service 7.6 0.0 10.0 6.9 10.0
Harvesting service 7.6 0.0 0.0 13.8 6.7
Sowing service 5.1 0.0 0.0 6.9 6.7
Provide plant protection service 5.1 0.0 0.0 6.9 6.7
Product transport service 5.1 10.0 0.0 6.9 3.3
Supervise the application of production process 5.1 10.0 0.0 10.3 0.0
Preservation, storehouse 2.5 10.0 0.0 0.0 3.3
Buy products of members 2.5 20.0 0.0 0.0 0.0

STUDY REPORT / INTEGRATED COASTAL MANAGEMENT PROGRAMME
6968
Loading and unloading service 1.3 0.0 0.0 3.4 0.0
Preliminary processing, processing 1.3 10.0 0.0 0.0 0.0
Electricity services 1.3 0.0 0.0 0.0 3.3
Internal credit service 1.3 0.0 0.0 0.0 3.3
Source: Survey 2016.
4.6.2.2 Services that ACs no longer provide
ACs have changed their service operations. Some ACs would not provide a number of the services that they previously provided, but their number is small. The survey results showed that 6.3% of ACs have stopped signing contracts to trade products for members in 2016. For other services, the proportion of ACs that has stopped providing those services is less than 5%.
Table 4.32: Percentage of ACs that provided the services in 2014-2015 but no longer provides them in 2016
Activity Total Ca Mau Bac Lieu Soc Trang
An Giang
Sign contract to trade produce for members 6.3 0.0 10.0 0.0 13.3
Drying service 3.8 0.0 10.0 3.5 3.3
Provide crop seeds 2.5 0.0 0.0 3.5 3.3
Provide kinds of fertiliser 2.5 0.0 0.0 0.0 6.7
Provide plant protection chemicals 2.5 0.0 0.0 0.0 6.7
Buy products of members 2.5 10.0 0.0 0.0 3.3
Harvesting service 1.3 0.0 0.0 3.5 0.0
Preliminary processing, processing 1.3 0.0 10.0 0.0 0.0
Collective production 1.3 0.0 0.0 3.5 0.0
Source: Survey 2016.
Of the 79 ACs surveyed, only 13 (16.5% of ACs) stopped providing certain services to members in 2016. Among the reasons stated by the ACs is that partners do not continue collaborating to provide services for the ACs, so they can not continue to provide services to customers (61.5% of ACs). These partners no longer sign contracts to trade products or no longer deliver input materials for rice production. Other reasons stated are: ACs do not wish to compete with other service providers (30.8% of ACs); ACs lack the capital to continue providing services (7.7% of ACs); ACs lack equipment and machinery (7.7% of ACs); customers no longer need services (7.7% of ACs); other reasons (7.7% of ACs) concern poor management, lack of transparency of the key leaders of ACs, and members no longer trusting ACs.
Only 3 out of 79 responded to the question of which services that ACs currently provide to members would no longer be provided in the coming period. One AC said it would stop acting as intermediary to trade products for membership with enterprises. One said that it would stop tillage services, and one said it would stop providing animal feed services. The reasons given are a lack of capital, a need to focus capital on other services or a lack of profitability for ACs.
New services of agricultural cooperatives in the coming period
68.4% of ACs stated that they intend to provide at least one new service in the near future; this percentage is fairly homogeneous across the four provinces. These new services mainly concern supporting members to trade products, providing inputs and services for production and providing rice harvesting services.
Table 4.33: Percentage of ACs having new service to provide in near future
Activity Total Ca Mau Bac Lieu Soc Trang An Giang
% of ACs having at least 1 new service to provide in near future 68.4 60.0 70.0 65.5 73.3
New service
Sign contract to trade produce for members 25.3 10.0 10.0 17.2 43.3
Tillage service 24.1 30.0 30.0 27.6 16.7
Provide kinds of fertiliser 21.5 0.0 30.0 20.7 26.7
Provide plant protection chemicals 21.5 0.0 20.0 27.6 23.3
Harvesting service 17.7 30.0 0.0 27.6 10.0
Irrigation (watering, drainage) 12.7 10.0 0.0 24.1 6.7
Provide crop seeds 10.1 0.0 10.0 6.9 16.7
Buy products of members 10.1 0.0 10.0 13.8 10.0
Sowing service 8.9 0.0 0.0 13.8 10.0
Provide plant protection service 8.9 10.0 0.0 10.3 10.0
Other services 6.3 10.0 10.0 0.0 10.0
Preservation, storehouse 3.8 10.0 0.0 6.9 0.0
Product transport service 2.5 0.0 0.0 3.4 3.3
Drying service 2.5 0.0 0.0 6.9 0.0
Internal credit service 2.5 0.0 10.0 3.4 0.0
Loading and unloading service 1.3 0.0 0.0 3.4 0.0
Source: Survey 2016.
Most new services of ACs are prompted by the needs of members and the proposals of partners. This result is consistent with the above analysis. 68.4% of ACs will provide new services supporting product trade for members.
Table 4.34: Reasons why ACs provide new services
(Unit: % of ACs)
Reason Total Ca Mau Bac Lieu Soc Trang An Giang
Need of members or non-members 79.6 33.3 85.7 89.5 81.8
Partner proposes the cooperation with AC to provide new service 18.5 16.7 0.0 10.5 31.8

STUDY REPORT / INTEGRATED COASTAL MANAGEMENT PROGRAMME
7170
Requirement of partner in linkage 11.1 0.0 14.3 15.8 9.1
AC is supported, receives the euiqpment with which it can provide new services 5.6 0.0 0.0 15.8 0.0
Other reasons 13.0 0.0 14.3 10.5 18.2
Source: Survey 2016.
When providing new services, the ACs face various difficulties. These include: lack of capital; competition with other stakeholders; difficulty in finding cooperation partners, markets and customers; lack of human resources to meet requests for new services; cooperative lacks experience in operation and management in providing new services; lack of machinery.
Table 4.35: Difficulties of ACs when providing new services
(Unit: % of ACs)
Type of difficulty Total Ca Mau Bac Lieu Soc Trang
An Giang
Lack of capital 75.9 16.7 71.4 84.2 86.4
Competition with other stakeholders 31.5 33.3 57.1 31.6 22.7
Difficulty in finding partners for cooperating in providing new services 27.8 16.7 0.0 31.6 36.4
Human resources do not meet requirement to provide new services 25.9 16.7 14.3 15.8 40.9
AC lacks experience in operation and management of services 16.7 0.0 28.6 10.5 22.7
Other difficulty 20.4 0.0 57.1 21.1 13.6
Source: Survey 2016.
In order to provide new services, the ACs themselves can render the service (52.9%) or they can associate with other partners (47.1%).
Figure 4.3: Ways that ACs provide new services(Unit: % of ACs that will provide new services)
Source: Survey 2016.
4.6.2.4 Activities that ACs wish to implement but are unable to
In the four provinces, 76.3% of ACs had at least one production or business activity that they wished to conduct but were unable to. Many ACs had up to five such activities.
Table 4.36: Activities that ACs want to do, but are unable to
Province% of ACs want to do
new business activity but are unable to
Average number of new activities that 1
AC wants, but can not do
Max number of new activities that 1 AC
wants, but can not do
Ca Mau 100.0 1.3 5
Bac Lieu 90.0 1.3 4
Soc Trang 70.4 0.6 1
An Giang 70.0 0.8 2
Total 76.3 0.8 5
Source: Survey 2016.
These activities mainly concern the provision of inputs (seeds, fertilisers, pesticides), trade in products, and services for rice production (tillage, irrigation, harvesting).
Table 4.37: Percentage of ACs that want to, but can not do a given new activity
Activity Total Ca Mau Bac Lieu Soc Trang An Giang
Tillage service 21.4 33.3 22.2 15.8 14.3
Provide kinds of fertiliser 17.7 22.2 33.3 10.5 4.8
Provide plant protection chemicals 13.6 11.1 33.3 5.3 4.8
Sign contract to trade produce for members 10.5 11.1 0.0 26.3 4.8
Provide crop seeds 10.3 0.0 22.2 0.0 19.0
Irrigation (watering, drainage) 10.2 11.1 0.0 10.5 19.0
Harvesting service 6.7 0.0 11.1 15.8 0.0
Sowing service 5.3 11.1 0.0 5.3 4.8
Buy products of members 4.1 0.0 11.1 5.3 0.0
Preservation, storehouse 4.0 11.1 0.0 0.0 4.8
Internal credit service 3.6 0.0 0.0 0.0 14.3
Provide plant protection service 2.8 11.1 0.0 0.0 0.0
Loading and unloading service 2.8 11.1 0.0 0.0 0.0
Provide breeding stock 2.4 0.0 0.0 0.0 9.5
Other 7.9 11.1 11.1 0.0 9.5
Source: Survey 2016.
There are many reasons why ACs are unable to conduct their desired operations. The most important reason is a lack of capital (91.4% of ACs). The other reasons are a lack of professional personnel or a lack of training.
Ca Mau
100 %
80 %
60 %
40 %
20 %
66.7 71.4
36.8 45.5 47.1
52.954.663.2
28.633.3
0 %Bac Lieu Soc Trang An Giang Chung
ACs do it themselves ACs cooperate with other partners

STUDY REPORT / INTEGRATED COASTAL MANAGEMENT PROGRAMME
7372
Table 4.38: Reasons why ACs do not implement desirable activities
(Unit: % of ACs; figures only include ACs that wish to engage in new activities but are unable to do so)
Reason Total Ca Mau Bac Lieu Soc Trang An Giang
Lack of capital 91.4 77.8 100.0 84.2 100.0
Poor capacity of managers 31.0 55.6 11.1 26.3 33.3
AC lacks training in the techniques for providing the service 20.7 33.3 11.1 21.1 19.0
Other reason 19.0 11.1 33.3 26.3 9.5
Source: Survey 2016.
4.6.3 Linkage and association with other stakeholders
It is important to associate with other stakeholders. This serves members by underpinning the role of ACs in facilitating production as well as participating in the value chain. However, the survey results show that only 34.2% of ACs have signed linkage contracts with other stakeholders to provide inputs for their members. 35.4% of ACs have signed a contract to sell the produce of members. The majority of cases involve signing contracts and associating with enterprises.
Table 4.39: Percentage of ACs with linkage to other stakeholders to serve their members
Mode of linkage Total Ca Mau Bac Lieu Soc Trang An Giang
Sign contract with other stakeholder to provide inputs to members
34.2 50.0 40.0 34.5 26.7
Sign contract with other stakeholder to sell the produce of members
35.4 20.0 20.0 41.4 40.0
Source: Survey 2016.
Table 4.40: Types of stakeholders with which ACs have linkage contract to serve their members
(Unit: % of ACs)
Mode of linkage Enterprise AC FG Agent Other
Sign contract with other stakeholder to provide inputs to members 73.1 3.8 3.8 19.2 0.0
Sign contract with other stakeholder to sell the produce of members 92.3 0.0 0.0 3.8 3.8
Source: Survey 2016.
Note: Figures are only based on ACs having linkage.
There are many reasons why ACs can have no contracts or production-trade linkage for members: unable to find partners (68.6% of ACs); partner requirements are too high and complicated in terms of product quality or production process application for ACs to meet (31.4% of ACs); ACs lack infrastructure and means to transport rice to the warehouses of enterprises (25.7%); the
buying price of the enterprises is not higher than the market price (14.3%); other reasons such as lack of capital or inability to supply rice when the enterprises request it.
4.6.4 Application of good agricultural practices and building the brand name
Most ACs surveyed apply good agricultural process practices such as VietGAP, 3R3I, 1M5R or processes proposed by enterprises. 3R3I and 1M5R are the most important. This is the outcome of local advocacy, guidance and training for people over the years.
However, only 5 out of 79 ACs have gained trademark certification for their products. One AC uses a trademark of geographical indication, one AC uses collective trademarks, two ACs are trademark certified and one AC uses the trademark of ordinary goods.
Table 4.41: Percentage of ACs applying good production practice process
Process Total Ca Mau Bac Lieu Soc Trang An Giang
VietGAP 11.4 10.0 30.0 13.8 3.3
GlobalGAP 0.0 0.0 0.0 0.0 0.0
Organic 2.5 0.0 10.0 0.0 3.3
3R3I 59.5 90.0 70.0 62.1 43.3
1M5R 60.8 30.0 80.0 65.5 60.0
Other process 8.9 0.0 20.0 0.0 16.7
% of ACs applying at least one of the above processes 78.5 90.0 80.0 72.4 80.0
Source: Survey 2016.
4.7 Performance of agricultural cooperatives
4.7.1 Turnover and profit
Table 4.42: Turnover and profit of ACs
(Unit: million VND)
Indicator Total Ca Mau Bac Lieu Soc Trang An Giang
Total turnover per AC 685.6 91.7 54.4 80 1679.3
Total tax amount paid by ACs 2.1 0 0 0 5.6
Net profit (profit after tax) 80.1 26.5 11.4 11.4 187.3
Amount of profit allocated in funds of AC 29.1 22 4 4.9 63.2
Total profit of AC distributed to members 49.6 3.8 4.2 4.4 123.6
In which:
Amount of profit distributed on basis of percentage of chartered capital of each member
43.6 3.8 1.8 2.3 110.6
Amount of profit distributed on basis of working days of members in AC activities 2.2 0 3 0.5 4.3
Amount of profit distributed on basis of level of service use of members 2.8 0 0 0.5 6.8
Source: Survey 2016.

STUDY REPORT / INTEGRATED COASTAL MANAGEMENT PROGRAMME
7574
Many ACs have no turnover and profit. These are either i) ACs whose key operations are for the benefit of members in rural areas, with few members and acting as intermediaries to support members or ii) ACs without any operations, which were established to maintain the criteria of new rural.
On average, ACs have a turnover of around 700 million/year, with a higher figure in An Giang. Profit after tax of ACs is approximately 11.7% of turnover. The majority of AC profit (80%) is divided among members, mostly in proportion to the capital contributed by members. Under current regulations, the method of profit apportionment is incompatible with the 2012 law on cooperatives.
The average turnover per cooperative member is 8.6 million/year with a pretax profit of 1.1 million/member. Compared with working capital of ACs, turnover generated is 2.7 million and 0.1 million profit with the average of one million in working capital.
Table 4.43: Operational performance of ACs in 4 provinces surveyed
Province Turnover/MB(million VND)
Pretax profit /MB
(million VND)
Turnover/floating capital
Pretax profit/ floating capital
Ca Mau 9.2 3.0 0.6 0.1
Bac Lieu 2.3 0.4 1.2 0.5
Soc Trang 2.7 0.5 0.8 0.3
An Giang 16.1 1.3 4.7 0.5
Total 8.6 1.1 2.7 0.4
Source: Survey 2016.
If the scale of ACs is compared to their working capital, it emerges that small membership is more effective than large membership. Conversely, if it is compared to the number of members of the ACs, the fewer members are higher than the more members in performance index.
Table 4.44: Operational performance of ACs by AC size
AC size Turnover/MB
Pretax profit /MB
Turnover/floating capital
Pretax profit/ floating capital
AC has up to 20 members 12.9 2.4 0.8 0.1
AC has from 20 to 120 members 6.4 0.6 2.6 0.3
AC has from 120 to 300 members 15.3 1.9 5.8 1.2
AC has more than 300 members 3.8 0.7 1.8 0.7
Total 8.6 1.1 2.7 0.4
Source: Survey 2016.
4.7.2 Price of services that ACs provide to members
75% of ACs estimated that the price of providing their input and production services was lower than the market price by 9% on average. 23.4% of ACs said that their price is equivalent to the market price. Only some ACs in An Giang (3.7%) considered their price to be higher than the market price.
56.8% of ACs supporting members in trading products stated that the selling price of products sold through ACs is higher than the market price, by 3.5% on average. However, up to 9.1% of ACs said that it was lower than the market price.
The ACs have the goal of serving their members through the provision of supplies and input services at a lower price than that charged to non-member households; that price is reported to be lower by 5.6%. Moreover, ACs buy products of members at a price higher than that paid to non-members; the price level is higher by 2%.
Table 4.45: Evaluation of prices of inputs and production services provided by ACs
Remark Indicator Total Ca Mau Bac Lieu
Soc Trang
An Giang
Price of inputs and production services of AC is lower than market price
% of ACs have remark 75.0 71.4 75.0 81.8 70.4
Percentage by which price is lower (%) 9.0 4.3 21.7 4.3 10.3
Product price sold through AC is higher than market price
% of ACs have remark 56.8 80.0 60.0 63.2 40.0
Percentage by which price is higher (%) 3.5 2.3 7.7 3.1 2.8
Prices of inputs and production services to members are lower than prices of AC to non-members
% of ACs have remark 59.1 50.0 66.7 57.1 61.9
Percentage by which price is lower (%) 5.6 2.0 13.5 3.5 6.0
AC buys products of members at a price higher than that paid to non-members
% of ACs have remark 40.7 - - 66.7 21.4
Percentage by which price is higher (%) 2.0 - - 2.6 0.8
Source: Survey 2016.
4.8 Government support for ACs
Table 4.46: Support by state to ACs in 4 provinces surveyed
Province % of ACs receiving at least 1 type of support from state
Average number of types of support 1 AC receives from state
Ca Mau 100.0 6.5
Bac Lieu 100.0 8.9
Soc Trang 89.7 5.8
An Giang 93.3 5.9
Total 93.7 6.3
Source: Survey 2016.
There are many preferential policies and support mechanisms by the state for agriculture, forestry and aquaculture ACs. The survey results showed that more than 90% of crop ACs receive support from the state with an average of 6.3 types of support per AC. The focus of

STUDY REPORT / INTEGRATED COASTAL MANAGEMENT PROGRAMME
7776
support from the state is very diverse, including transformation and new establishment under the 2012 law on cooperatives, training to improve capacity of managers, transfer of advanced technology, trade promotion, building infrastructure, access to credit, etc.
Table 4.47: Percentage of ACs receiving state support, by type of support
Group of support Content of support Total Ca Mau Bac
LieuSoc
TrangAn
Giang
Support for re-registering and setting up new AC
Guide the establishment of new AC 46.8 70.0 70.0 48.3 30.0
Guide the procedure to re-register AC in accordance with 2012 law on cooperatives
73.4 80.0 100.0 55.2 80.0
Training
Guidance on the 2012 law on cooperatives 83.5 90.0 100.0 89.7 70.0
Training on coop governance 73.4 50.0 100.0 79.3 66.7
Training on financial and accounting management 55.7 20.0 80.0 51.7 63.3
Training on building business plan 59.5 40.0 90.0 51.7 63.3
Training on marketing 26.6 0.0 10.0 34.5 33.3
Training on agricultural production techniques, processing for AC managers
45.6 30.0 90.0 51.7 30.0
Training for AC members 31.7 50.0 70.0 20.7 23.3
Other trainings 8.9 30.0 0.0 10.3 3.3
Access to capital
AC receives preferential credit 8.9 20.0 10.0 0.0 13.3
Transfer of techniques and technology
AC is supported to register brand name 0.0 0.0 0.0 0.0 0.0
AC is supported to apply sustainable production process (GAP, organic, 1M5R, 3R3I,..)
45.6 70.0 60.0 51.7 26.7
AC is supported with crop seed and breeding stock 10.1 20.0 20.0 10.3 3.3
AC is supported with processing technology 1.3 0.0 0.0 3.4 0.0
Other technology transfer to AC 3.8 0.0 30.0 0.0 0.0
Infrastructure AC is supported to develop infrastructure 2.5 0.0 10.0 0.0 3.3
Trading promotion
AC is supported to participate in agricultural fair, exposition
2.5 0.0 10.0 0.0 3.3
AC is supported to promote its products in media
3.8 10.0 0.0 0.0 6.7
AC is supported concerning packaging, label, logo, website to promote its products
0.0 0.0 0.0 0.0 0.0
AC is supported in other ways to promote its products
1.3 0.0 0.0 0.0 3.3
Land
AC is supported with the land for head office 13.9 10.0 10.0 6.9 23.3
AC is supported with arable land or land serving business activities of AC
0.0 0.0 0.0 0.0 0.0
Others 0.0 0.0 0.0 0.0 0.0
Source: Survey 2016.
Nearly all ACs do not pay income tax because many ACs have not implemented tax reporting while the state authorities do not check.
From whom do ACs seek guidance? The survey showed that communal personnel and district managers as well as provincial managers are consulted when ACs need help, especially district managers. Extension officers are consulted but at a very low rate. Viet Nam Provincial FCs and Farmers’ Union are available for guidance but are very rarely consulted by ACs. Only 2.5% of ACs do not ask anybody for guidance.
Table 4.48: Percentage of ACs seeking guidance from stakeholders when necessary
Stakeholders Total Ca Mau Bac Lieu Soc Trang An Giang
Communal staff 46.8 50.0 50.0 65.5 26.7
Managerial staff at district level 55.7 20.0 90.0 41.4 70.0
Managerial staff at provincial level 49.4 50.0 40.0 31.0 70.0
Extension staff 13.9 10.0 0.0 20.7 13.3
Other sources 2.5 10.0 0.0 0.0 3.3
Nobody 2.5 0.0 0.0 6.9 0.0Source: Survey 2016.

STUDY REPORT / INTEGRATED COASTAL MANAGEMENT PROGRAMME
7978
4.9 Strengths and difficulties of agricultural cooperatives
4.9.1 Strengths
In the self-assessment of the ACs, the majority of ACs stated that the strongest points are solidarity among managers (83.5%), and open and transparent management (59.5%). Another important factor affecting the good production of the ACs was the participation of members in management. Only 13.9% of ACs considered the formulation of production and business plans to be a strong point at present, and only 25.3% of ACs considered the capacity of managers to be a strong point.
Table 4.49: Strong points of ACs in 4 provinces surveyed
(Unit: % of ACs)
Strong point Total Ca Mau Bac Lieu
Soc Trang An Giang
AC managers are solidary 83.5 80.0 100.0 86.2 76.7
Open and transparent management 59.5 50.0 70.0 62.1 56.7
AC has clear business plan 43.0 30.0 40.0 34.5 56.7
Service prices of AC are appropriate 43.0 40.0 50.0 17.2 66.7
Supported by state agencies 30.4 30.0 40.0 24.1 33.3
AC managers are competent 25.3 10.0 10.0 27.6 33.3
Ensured service quality 24.1 30.0 40.0 6.9 33.3
AC has many services meeting the needs of members and non-members 15.2 20.0 20.0 6.9 20.0
Active participation of members 13.9 40.0 10.0 13.8 6.7
Other factors 3.8 0.0 20.0 3.4 0.0
Source: Survey 2016.
4.9.2 Difficulties of ACs
Table 4.50: Difficulties of ACs in 4 provinces surveyed
(Unit: % of ACs)
Difficulty Total Ca Mau Bac Lieu Soc Trang An Giang
Lack of capital 92.9 90.0 90.0 82.8 76.7
Limited capacity of AC managers 74.3 90.0 90.0 58.6 56.7
Difficult access to credit 70.0 70.0 80.0 72.4 43.3
Difficult mobilisation of capital 60.0 80.0 40.0 58.6 43.3
AC does not clearly know public policies on ACs 54.3 100.0 60.0 37.9 36.7
AC has few services meeting the needs of members and non-members 52.9 60.0 70.0 51.7 30.0
Does not receive efficient support from public agencies 34.3 70.0 30.0 34.5 13.3
AC does not have clear business project 25.7 50.0 40.0 31.0 0.0
Members are rarely involved in management, development of business project
25.7 20.0 40.0 20.7 20.0
Difficulty in transformation and re-registration in accordance with 2012 law on cooperatives
7.1 10.0 0.0 10.3 3.3
Service prices of AC are not appropriate 4.3 20.0 0.0 3.4 0.0
ACs do not know where they can seek guidance when in need 4.3 20.0 0.0 3.4 0.0
Service quality of AC is not assured 2.9 0.0 10.0 3.4 0.0
AC’s management is not open and transparent 1.4 0.0 0.0 3.4 0.0
Other factors 10.0 0.0 10.0 3.4 16.7
Source: Survey 2016.
The crop ACs of four provinces surveyed stated that there are many difficulties at present such as capital, capital mobilisation from members and capital loans. In particular, the most difficult issue at present is access to capital loans. The second difficulty is the capacity limitation of managers. The next difficulty is lack of knowledge of state policies, a too small number of services to meet customer demand, and lack of a clear production and business plan.
When ACs were asked what the most difficult elements now are, 44.7% of ACs stated that undercapitalisation is the most difficult factor. Capacity limitation of managers and difficulties in accessing credit were the next difficulties.
Table 4.51: The greatest difficulties of ACs at present
(Unit: % of ACs)
Type of difficulty Total Ca Mau Bac Lieu Soc Trang An Giang
Lack of capital 44.7 33.3 33.3 58.6 37.9
Limited capacity of AC managers 21.1 22.2 22.2 10.3 31.0
Difficult access to credit 9.2 22.2 11.1 3.4 10.3
AC has few services meeting the needs of members and non-members 5.3 0.0 0.0 13.8 0.0
Difficult mobilisation of capital 5.3 11.1 11.1 3.4 3.4
AC does not clearly know public policies on ACs 5.3 11.1 11.1 3.4 3.4
AC does not have clear business project 2.6 0.0 11.1 3.4 0.0
Source: Survey 2016.

STUDY REPORT / INTEGRATED COASTAL MANAGEMENT PROGRAMME
8180
4.10 Agricultural cooperatives’ support requirements
4.10.1 Issues on which ACs need support
When asked which types of support they expect to receive in the current period, 97.5% of ACs stated that they expect to receive at least one type of support from the state. The largest proportion of ACs expects access to capital (83.5%), followed by capacity-building for managers (68.4% of ACs), support to sell their products (67.1%), assistance in engaging in the LSRF approach and production-trade linkage (57%), and guidance to understand the regulations and policies of the state.
Table 4.52: Percentage of ACs requiring support, by issue
Issue on which there is a need for support Total Ca Mau Bac Lieu Soc Trang An Giang
Access to credit 83.5 90.0 100.0 79.3 80.0
Training for capacity-building of AC managers 68.4 100.0 90.0 58.6 60.0
Support for AC to sell its products 67.1 80.0 40.0 55.2 83.3
Support for AC to engage in production-trade linkage and LSRF 57.0 50.0 80.0 44.8 63.3
Guidance for AC to know public polices on ACs 48.1 100.0 70.0 44.8 26.7
Support for AC to re-register in accordance with 2012 law on cooperatives 19.0 10.0 0.0 37.9 10.0
Support for AC to implement certified production process 10.1 30.0 10.0 10.3 3.3
Support for AC to register brand name 10.1 20.0 0.0 10.3 10.0
Support for AC to rent productive land 5.1 10.0 0.0 3.4 6.7
Other types of support 8.9 0.0 10.0 13.8 6.7
Sources: Survey 2016.
4.10.2 Contents and methods of building capacity for cooperative managers
In terms of content, the first point is that the ACs wish training and retraining on cooperative governance. The content of this relates to the development of production and business plans, organisational management and administration of cooperative business operations, monitoring the organisation of cooperative operations, and how to mobilise the participation and capital contribution of members for cooperative operations. The second point is that most ACs wish training and retraining related to financial and accounting management of ACs. In particular, ACs wish to be trained and retrained on tax reports, bookkeeping skills and using accounting software. The fact is that almost all ACs do not yet produce annual tax reports. Other types of content that more than 50% of ACs desire are: to be trained and retrained on policies, on the 2012 law on cooperatives, and on contract negotiation. ACs wish training and retraining for all cooperative managers, including members of the management board, directors, supervisory board and the chief accountant22.
(22) ACs were asked to state which members of staff should be trained for each type of content. However, most ACs wished training for all cooperative managers. Therefore, the proportion of staff positions needing training is the proportion of ACs needing training for each type of content. Thus, the analysis result of staff positions needing training is not presented here.
Table 4.53: Training needs of ACs
(Unit: % of ACs)
Domain Issue Total Ca Mau
Bac Lieu
Soc Trang
An Giang
2012 law on cooperatives
Nature of ACs and new points in 2012 law on cooperatives 55.7 90.0 40.0 62.1 43.3
Regulation on organisation of ACs according to 2012 law on cooperatives
50.6 70.0 30.0 62.1 40.0
Asset and financial management (capital contribution, distribution of profit, of assets, …)
65.8 80.0 60.0 65.5 63.3
Re-registration in accordance with 2012 law on cooperatives 26.6 10.0 30.0 44.8 13.3
AC management
Project development, business planning of AC 74.7 70.0 90.0 82.8 63.3
Organisation, management, operation of business activities of AC 77.2 70.0 80.0 86.2 70.0
Supervision, control of business activities of AC 74.7 70.0 70.0 82.8 70.0
Methods to mobilise the participation and capital contribution of members in/to AC activities
50.6 80.0 80.0 48.3 33.3
Trade, marketing
Brand building 21.5 20.0 10.0 27.6 20.0
Methods of market evaluation and analysis 35.4 60.0 30.0 37.9 26.7
Methods of product marketing 26.6 30.0 10.0 41.4 16.7
Contract negotiation 68.4 60.0 50.0 79.3 66.7
Financial management and accounting
Preparation of financial reports, tax reporting 70.9 90.0 100.0 69.0 56.7
Use of accounting software 55.7 70.0 80.0 34.5 63.3
AC bookkeeping 68.4 90.0 100.0 72.4 46.7
Techniques of agricultural production
Sustainable production process (VietGAP, organic,…) 40.5 40.0 40.0 69.0 13.3
1M5R, 3R3I 46.8 50.0 30.0 69.0 30.0
Other production process 39.2 40.0 10.0 72.4 16.7
Other Other issues 1.3 0.0 10.0 0.0 0.0
Source: Survey 2016.
In terms of instruction methods, most ACs expect to be trained and retrained in the same period and that cooperative personnel are visited to learn about successful cooperative models.

STUDY REPORT / INTEGRATED COASTAL MANAGEMENT PROGRAMME
8382
Table 4.54: Training methods that ACs want
(Unit: % of ACs)
Method Total Ca Mau Bac Lieu Soc Trang An Giang
Theoretical lecture in classroom 30.4 30.0 10.0 41.4 26.7
Experienced staff works together and guides AC over several months or years
64.6 70.0 100.0 37.9 76.7
Study visit by AC to best-practice models 72.2 60.0 60.0 75.9 76.7
Provision of guidance documents about ACs 48.1 50.0 50.0 51.7 43.3
Other methods 1.3 0.0 0.0 3.4 0.0
Source: Survey 2016.
5. Current Capacity and Operation of Farmer Groups in The Four Provinces Surveyed
5.1 Numbers of farmer groups in the four provinces surveyed
The number of FGs is larger than the number of ACs in the four provinces surveyed, especially in Ca Mau. The number of members per FG is below 30 households. However, as there are many FGs a larger number of households participates in FGs overall. The average capital contribution per FG is under 10 million.
Table 5.1: Number of FG in provinces surveyed
Indicator Ca Mau Bac Lieu Soc Trang An Giang
Number of FGs 3,478 613 1,137 856
In which: FGs have a contract of cooperation testified by PPC 1,734 1,137
Number of member of FGs 23 26 21 23
Average capital per FG (million VND) 3.3 9.9
Source: Synthesis from DARD reports, 2016.
5.2 Capacity of FG managers
5.2.1 Education level
97% of FG leaders are qualified to high school level and below. High school level accounts for 43.1%, secondary school 50% and primary school 4%. In Bac Lieu province 4% of the group leaders of FGs have a university degree and 4% a college degree.
The level of education of vice group leaders and executive board members (if any) is lower than that of group leaders. Most of them (68%) reach secondary school level. This proportion is very even in the provinces, ranging from 61% to 72%. Among the FGs surveyed, no vice group
leaders or executive board members are educated to intermediate level or college level. In Bac Lieu 4.0% of vice group leaders have a university degree.
Accountants and treasurers of FGs are mainly qualified to secondary school and high school levels. 28.5% of accountants and treasurers in the An Giang FGs surveyed, but none in the other provinces, are educated to intermediate level.
Table 5.2: Education level of FG managers
(Unit: % of managers of all FGs surveyed)
Type of manager Level Total Ca Mau Bạc Lieu Soc Trang An Giang
Group leader
University 2.0 0.0 4.0 0.0 4.0
College 1.0 0.0 4.0 0.0 0.0
Professional school 0.0 0.0 0.0 0.0 0.0
High school 43.1 33.3 36.0 64.0 40.0
Secondary 50.0 55.6 56.0 36.0 52.0
Primary 3.9 11.1 0.0 0.0 4.0
Group vice leader and other members of management committee
University 1.0 0.0 4.0 0.0 0.0
College 0.0 0.0 0.0 0.0 0.0
Professional school 0.0 0.0 0.0 0.0 0.0
High school 22.8 28.0 24.0 23.5 15.4
Secondary 68.0 68.0 72.0 70.6 61.5
Primary 8.2 4.0 0.0 5.9 23.1
Accountant and treasurer
University 0.0 0.0 0.0 0.0 0.0
College 0.0 0.0 0.0 0.0 0.0
Professional school 7.0 0.0 0.0 0.0 28.5
High school 41.0 46.2 42.9 45.8 28.6
Secondary 50.0 46.2 57.1 54.2 42.9
Primary 2.0 7.7 0.0 0.0 0.0
Source: Survey 2016.
5.2.2 Capacity and work experience of key personnel
5.2.2.1 Age
The average age of group leaders is 51 years and that of vice group leaders is 44. It can be seen that FG managers are middle-aged on average. Accountants are younger because they often take part in training courses. Notably, the average age of accountants in Bac Lieu province is very young at about 25 years.
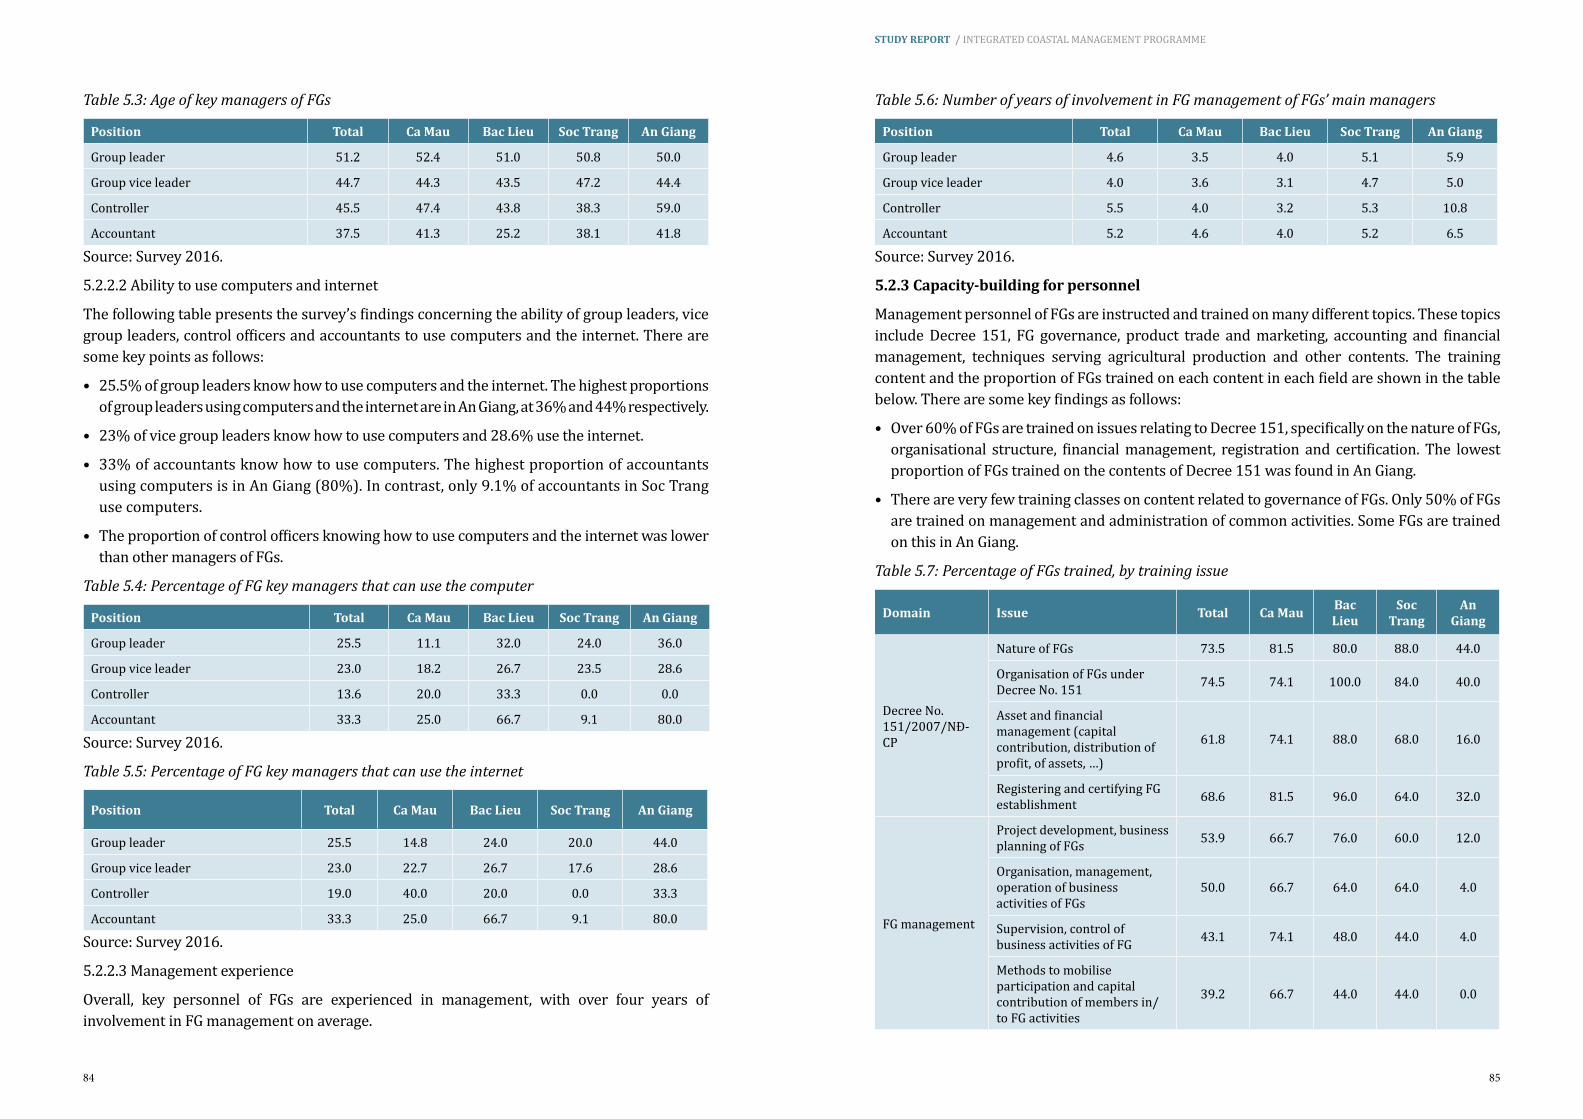
STUDY REPORT / INTEGRATED COASTAL MANAGEMENT PROGRAMME
8584
Table 5.3: Age of key managers of FGs
Position Total Ca Mau Bac Lieu Soc Trang An Giang
Group leader 51.2 52.4 51.0 50.8 50.0
Group vice leader 44.7 44.3 43.5 47.2 44.4
Controller 45.5 47.4 43.8 38.3 59.0
Accountant 37.5 41.3 25.2 38.1 41.8
Source: Survey 2016.
5.2.2.2 Ability to use computers and internet
The following table presents the survey’s findings concerning the ability of group leaders, vice group leaders, control officers and accountants to use computers and the internet. There are some key points as follows:
• 25.5% of group leaders know how to use computers and the internet. The highest proportions of group leaders using computers and the internet are in An Giang, at 36% and 44% respectively.
• 23% of vice group leaders know how to use computers and 28.6% use the internet.
• 33% of accountants know how to use computers. The highest proportion of accountants using computers is in An Giang (80%). In contrast, only 9.1% of accountants in Soc Trang use computers.
• The proportion of control officers knowing how to use computers and the internet was lower than other managers of FGs.
Table 5.4: Percentage of FG key managers that can use the computer
Position Total Ca Mau Bac Lieu Soc Trang An Giang
Group leader 25.5 11.1 32.0 24.0 36.0
Group vice leader 23.0 18.2 26.7 23.5 28.6
Controller 13.6 20.0 33.3 0.0 0.0
Accountant 33.3 25.0 66.7 9.1 80.0
Source: Survey 2016.
Table 5.5: Percentage of FG key managers that can use the internet
Position Total Ca Mau Bac Lieu Soc Trang An Giang
Group leader 25.5 14.8 24.0 20.0 44.0
Group vice leader 23.0 22.7 26.7 17.6 28.6
Controller 19.0 40.0 20.0 0.0 33.3
Accountant 33.3 25.0 66.7 9.1 80.0
Source: Survey 2016.
5.2.2.3 Management experience
Overall, key personnel of FGs are experienced in management, with over four years of involvement in FG management on average.
Table 5.6: Number of years of involvement in FG management of FGs’ main managers
Position Total Ca Mau Bac Lieu Soc Trang An Giang
Group leader 4.6 3.5 4.0 5.1 5.9
Group vice leader 4.0 3.6 3.1 4.7 5.0
Controller 5.5 4.0 3.2 5.3 10.8
Accountant 5.2 4.6 4.0 5.2 6.5
Source: Survey 2016.
5.2.3 Capacity-building for personnel
Management personnel of FGs are instructed and trained on many different topics. These topics include Decree 151, FG governance, product trade and marketing, accounting and financial management, techniques serving agricultural production and other contents. The training content and the proportion of FGs trained on each content in each field are shown in the table below. There are some key findings as follows:
• Over 60% of FGs are trained on issues relating to Decree 151, specifically on the nature of FGs, organisational structure, financial management, registration and certification. The lowest proportion of FGs trained on the contents of Decree 151 was found in An Giang.
• There are very few training classes on content related to governance of FGs. Only 50% of FGs are trained on management and administration of common activities. Some FGs are trained on this in An Giang.
Table 5.7: Percentage of FGs trained, by training issue
Domain Issue Total Ca Mau Bac Lieu
Soc Trang
An Giang
Decree No. 151/2007/NĐ-CP
Nature of FGs 73.5 81.5 80.0 88.0 44.0
Organisation of FGs under Decree No. 151 74.5 74.1 100.0 84.0 40.0
Asset and financial management (capital contribution, distribution of profit, of assets, …)
61.8 74.1 88.0 68.0 16.0
Registering and certifying FG establishment 68.6 81.5 96.0 64.0 32.0
FG management
Project development, business planning of FGs 53.9 66.7 76.0 60.0 12.0
Organisation, management, operation of business activities of FGs
50.0 66.7 64.0 64.0 4.0
Supervision, control of business activities of FG 43.1 74.1 48.0 44.0 4.0
Methods to mobilise participation and capital contribution of members in/to FG activities
39.2 66.7 44.0 44.0 0.0

STUDY REPORT / INTEGRATED COASTAL MANAGEMENT PROGRAMME
8786
Trade, marketing
Brand building 5.9 11.1 4.0 8.0 0.0
Methods of market evaluation and analysis 4.9 11.1 4.0 4.0 0.0
Methods of product marketing 3.9 7.4 4.0 4.0 0.0
Contract negotiation 17.7 22.2 4.0 32.0 12.0
Financial management and accounting
Preparation of financial reports, tax reporting 7.8 0.0 8.0 16.0 8.0
Use of accounting software 1.0 0.0 4.0 0.0 0.0
FG bookkeeping 17.7 37.0 12.0 12.0 8.0
Techniques of agricultural production
Sustainable production process (VietGAP, organic,…) 25.5 40.7 16.0 36.0 8.0
1M5R, 3R3I 73.5 85.2 56.0 84.0 68.0
Other production process 53.9 74.1 60.0 68.0 12.0
Others 6.9 3.7 0.0 20.0 4.0
Source: Survey 2016.
• A low proportion of FGs is trained on contract negotiations. Among the FGs surveyed, only 17.6% of FGs are trained on this.
• There is little training content on financial management and bookkeeping skills. Only 7.8% of FGs are trained on financial statements and tax reports, and 17% on bookkeeping skills.
• Most of the training content for FGs prioritises the leaders. Personnel in finance and accounting seldom participate in training courses.
Table 5.8 Percentage of FG staff trained, by training issue
Domain Issue Group leader
Member of man-
agement commit-
tee
Accoun-tant, trea-
surer
Techni-cian
Decree No. 151/2007/NĐ-CP
Nature of FGs 72.5 33.3 12.7 6.9
Organisation of FGs under Decree No. 151 73.5 40.2 12.7 4.9
Asset and financial management (capital contribution, distribution of profit, of asset, …)
58.8 28.4 14.7 4.9
Registering and certifying FG establishment 66.7 32.4 9.8 5.9
FG management
Project development, business planning of FG 52.0 22.5 6.9 1.0
Organisation, management, operation of business activities of FG
48.0 20.6 5.9 0.0
Supervision, control of business activities of FG 35.3 19.6 4.9 2.9
Methods to mobilise the participation and capital contribution of members in/to FG activities
37.3 17.6 4.9 0.0
Trade, marketing
Brand building 5.9 1.0 0.0 0.0
Methods of market evaluation and analysis 4.9 2.0 1.0 0.0
Methods of product marketing 3.9 1.0 1.0 0.0
Contract negotiation 17.6 9.8 2.9 0.0
Financial management and accounting
Preparation of financial reports, tax reporting 3.9 1.0 5.9 0.0
Use of accounting software 0.0 0.0 1.0 0.0
FG bookkeeping 13.7 4.9 5.9 0.0
Techniques of agricultural production
Sustainable production process (VietGAP, organic,…) 23.5 15.7 5.9 4.9
1M5R, 3R3I 68.6 47.1 19.6 19.6
Other production process 51.0 35.3 17.6 10.8
Others 5.9 2.0 2.0 2.0
Source: Survey 2016.
5.3 Membership of farmer groups
5.3.1 The number and scale of production of members
The average number of FG members in the four provinces is around 31 members/group. The majority of FGs (62.4% on average overall) have less than 30 members; that proportion is highest (74%) in Ca Mau province. Only 6.9% of FGs have more than 70 members. In particular, none of the FGs surveyed in An Giang has more than 70 members.
The total area of farming land of each FG is relatively small. The average land area of each FG from all members is about 62 ha. In An Giang, the total farming area per FG and the average farming area per member is larger than in the other three provinces.
Table 5.9: Members and sizes of FGs
Indicator Total Ca Mau Bac Lieu Soc Trang An Giang
Number of members per FG 31.2 26.7 38.6 37.7 22.2
% of FGs with less than 30 members 62.4 74.1 58.3 48.0 68.0
% of FGs with 30 to 70 members 30.7 22.2 25.0 44.0 32.0

STUDY REPORT / INTEGRATED COASTAL MANAGEMENT PROGRAMME
8988
% of FGs with more than 70 members 6.9 3.7 16.7 8.0 0.0
Arable annual land area per FG member (ha) 2.1 1.5 1.7 1.3 4.6
Total arable annual land area of all members per FG (ha) 62.7 38.7 74.1 51.0 90.2
Source: Survey 2016.
5.3.2 Capital contribution
The capital contribution of FGs is defined in the cooperation contract. Members can contribute capital in cash, in kind and land depending on the provisions of the FG. In fact, it emerged that only about 25% of FGs have capital contributions for their operations. Not all members make capital contributions to FGs. On average, ¾ of members make capital contributions under the provisions of the contract. In An Giang, the proportion of members that contribute capital is highest (98%) across the four provinces. In contrast, in Ca Mau that proportion is lowest (15.5%).
Table 5.10: Contribution of chartered capital by FG members
Indicator Total Ca Mau Bac Lieu Soc Trang An Giang
% of FGs having chartered capital contribution 25.5 25.9 32.0 24.0 20.0
% of members of FG that have contributed chartered capital (figures based only FGs with capital contribution)
76.4 15.5 66.3 77.0 98.0
Source: Survey 2016.
5.3.3 The use of services
On average, 36% of members use the input services of FGs such as water pumping, seeds, fertilisers and pesticides. The lowest proportion among the four provinces of members using input services is found in An Giang, at 10.2%.
Table 5.11: Percentage of members using FG services
Indicator Total Ca Mau Bac Lieu Soc Trang An Giang
% of FG members using input services of FG
35.8 40.0 62.2 30.4 10.2
% of FG members trading their products through FG
32.2 10.0 15.0 34.4 71.2
% of turnover of FG coming from members
29.2 7.0 55.2 30.4 25.8
Source: Survey 2016.
FGs generate almost 30% of their revenue from members. The proportion of revenue of FGs from membership in Ca Mau is relatively low at 7%, whereas it accounts for 55% of FG revenue in Bac Lieu.
5.3.4 Involvement in FG management
Most FGs surveyed stated that there is positive participation in meetings of members. The average proportion of FG members involved in recent meetings was 84%.
Figure 5.1: Proportion of members that participated in last meeting of FG
Source: Survey 2016.
5.4 Farmer group governance
5.4.1 Executive administration
FGs can establish the executive board or the group leader under contract provisions. An average of 39.2% of FGs has a group leader. The majority of FGs in An Giang have only a group leader, whereas the majority of FGs in Ca Mau and Soc Trang have an executive board. On average, an executive board has three to five members.
Table 5.12: Managerial organisation of FGs
Province% of FGs
having only group leader
FG has managerial committee
% of FGs
Average number of
members in managerial committee
Min number of members
in managerial committee
Max number of members
in managerial committee
Ca Mau 18.5 81.5 2.6 2 4
Bac Lieu 48.0 52.0 3.2 2 4
Soc Trang 16.0 84.0 3.5 2 5
An Giang 76.0 24.0 2.5 2 3
Total 39.2 60.8 3.0 2 5
Source: Survey 2016.
Total Ca Mau Bac Lieu Soc Trang An Giang
10084.2
92.9
81.8 76.884.8
80
60
40
20
0

STUDY REPORT / INTEGRATED COASTAL MANAGEMENT PROGRAMME
9190
Many FGs have assigned various tasks to group members such as control officers (24.5%), accounting officers (35.5%) and treasurers (29.4%). In 45.1% of FGs the group leaders also hold the role of both accountant and treasurer.
Table 5.13: Percentage of FGs having assigned tasks for managers
Province% of FGs having
controller
% of FGs having
accountant
% of FGs having
treasurer
% of FGs in which group leader also
holds role of accountant
and treasurer
% of FGs having
secretary
Ca Mau 7.4 25.9 22.2 59.3 14.8
Bac Lieu 36.0 28.0 20.0 64.0 0.0
Soc Trang 40.0 68.0 56.0 24.0 0.0
An Giang 16.0 20.0 20.0 32.0 8.0
Total 24.5 35.3 29.4 45.1 5.9
Source: Survey 2016.
5.4.2 Partnership agreement/collaborative regulations
Agreements or regulations (cooperation agreements) are required for FGs under Decree 151/2007/ND-CP (Decree 151). Cooperation agreements help to make the operation of FGs favourable, public and transparent. The principal contents of such agreements include cooperation, regulation on assets, capital contribution, commissions and time for collaboration, and the roles and responsibilities of group leader, vice group leader and executive board. Most FGs do have cooperation agreements, but their content does not comply completely with Decree 151. The stipulations of such agreements are presented in the table below:
• The lowest proportion of FGs with cooperation agreements is found in An Giang at 69.6% and the highest in Bac Lieu at 95.7%.
• The proportion of FGs with stipulations on asset contribution is relatively low (29.4%). None of the FGs surveyed in Ca Mau have regulations stipulating asset contribution, whereas this proportion in Soc Trang was very high (81.8%).
• Overall, FGs in Bac Lieu and Soc Trang have adequately implemented the requirements upon the content of cooperation agreements under Decree 151.
Table 5.14: Percentage of FGs having regulations stipulated in cooperation contract
Indicator Total Ca Mau Bac Lieu Soc Trang An Giang
% of FGs has regulations, cooperation contract 86.7 92.6 95.7 88.0 69.6
Regulations stipulated in cooperation contract:
Asset contribution 29.4 0.0 13.6 81.8 25.0
Content of cooperation 88.2 76.0 90.9 100.0 87.5
Time of cooperation 75.3 76.0 90.9 72.7 56.3
Rights and duties of group leader 82.4 68.0 90.9 90.9 81.3
Rights and duties of members and of managerial committee 72.9 68.0 77.3 86.4 56.3
Conditions for admission and termination of member status 64.7 68.0 90.9 63.6 25.0
Redistribution of profit 40.0 28.0 45.5 63.6 18.8
Treatment of FG’s loss 22.4 4.0 27.3 50.0 6.3
Source: Survey 2016.
In addition to the issues regulated in the cooperation agreement, FGs can add other regulations on operational and financial management in order to make FG operations more transparent and efficient.
Table 5.15: Percentage of FGs having managerial regulations
Indicator Total Ca Mau Bac Lieu Soc Trang An Giang
Has operational regulation 35.1 18.5 41.7 60.0 19.0
Has financial regulation 30.6 18.5 41.7 36.0 27.3
Has annual business plan 54.1 46.2 64.0 68.0 36.4
Has meetings with members 90.8 96.3 92.0 92.0 81.0
Produces annual financial report 20.8 3.8 16.0 40.0 24.0
Source: Survey 2016.
On request, FGs must have their contracts certified by the PPC when FGs are established. Most FGs have indeed completed certification procedures (83.5%) or are undergoing them (3.1%). The proportion of FGs certified in An Giang was the lowest in the four provinces (62.5%).
Table 5.16: Percentage of FGs whose cooperation contracts are certified by PPC
Indicator Total Ca Mau Bac Lieu Soc Trang An Giang
Certified 83.5 84.6 95.7 91.7 62.5
Certification under way 3.1 7.7 0.0 0.0 4.2
Certification not applied for 13.4 7.7 4.4 8.3 33.3
Total 100.0 100.0 100.0 100.0 100.0
Source: Survey 2016.
5.4.3 Task assignments among members of management personnel
FGs need to assign specific tasks to specific members in charge of controlling, accounting and treasurer functions in order to be public, transparent and favourable. The survey found that in 45% of FGs group leaders do all the work of FG accounting, including controlling, accounting and treasurer functions. It found that while management is streamlined in terms of personnel, this

STUDY REPORT / INTEGRATED COASTAL MANAGEMENT PROGRAMME
9392
also reduces transparency in the operation of FGs. Soc Trang Province performs best in terms of assigning management and administration tasks among members. Here the proportion of FGs with control officers, accountants and treasurers is the highest among the four provinces.
Table 5.17: Percentage of FGs that has assigned tasks to members of their managerial committee
Has assigned tasks to Total Ca Mau Bac Lieu Soc Trang An Giang
Controller 24.5 7.4 36.0 40.0 16.0
Accountant 35.3 25.9 28.0 68.0 20.0
Treasurer 29.4 22.2 20.0 56.0 20.0
Only FG leader 45.1 59.3 64.0 24.0 32.0
Source: Survey 2016.
5.4.4 Operational management
The majority of FGs holds meetings with members (90%), but only 57.8% of FGs record the minutes of the meetings. The survey results also showed that the proportion of FGs producing financial statements to inform members is relatively low (20.8%). In Ca Mau Province, only 3.8% of FGs make annual financial statements.
Table 5.18: Operational management of FGs
(Unit: % of FGs)
Indicator Total Ca Mau Bac Lieu Soc Trang An Giang
Holds meetings with members 90.8 96.3 92.0 92.0 81.0
Number of meetings of FG in last 12 months 5.6 5.3 4.3 7.1 5.7
Records meeting minutes 57.8 74.1 56.0 76.0 24.0
Has annual business plan 54.1 46.2 64.0 68.0 36.4
Produces annual financial report 20.8 3.8 16.0 40.0 24.0
Source: Survey 2016.
5.5 Capital and assets
5.5.1 Land
Most FGs in all four provinces have no head office or common production land. FGs mainly use members’ houses as head office. In An Giang province, 12% of FGs surveyed have their own head office. Because they do not have common land, they do not organise common production operations.
Table 5.19: Percentage of FGs having common land
Indicator Total Ca Mau Bac Lieu Soc Trang An Giang
% of FGs having own head office 2.9 0.0 0.0 0.0 12.0
% of FGs having collective land 1.0 0.0 0.0 0.0 4.0
Collective land size per FG (m2) 0.0 0.0 0.0 0.0 161.0
Source: Survey 2016.
5.5.2 Assets
Most FGs have few common assets. Especially in Ca Mau, FGs have no common assets. The reason is that the majority of FGs in Ca Mau was established under movements, indicators of building new rural (indicator 13) in order to receive support from the state. As a result, there are no capital contributions to buy common assets for common services.
Table 5.20: Percentage of FGs having machines and equipment for business activities
Type of asset Total Ca Mau Bac Lieu Soc Trang An Giang
Pumps 21.6 0.0 60.0 12.0 16.0
Irrigation system 14.7 0.0 36.0 20.0 4.0
Sowing machine 8.8 0.0 12.0 24.0 0.0
Sprayer 6.9 0.0 4.0 24.0 0.0
Head office land (for which FG has land-use right certificate) 2.0 0.0 0.0 0.0 8.0
Office equipment (computer, printer, table, chair…) 2.0 0.0 0.0 0.0 8.0
Tillage machine 1.0 0.0 4.0 0.0 0.0
Harvester 1.0 0.0 4.0 0.0 0.0
Other land 1.0 0.0 0.0 0.0 4.0
Source: Survey 2016.
Most of the FGs surveyed operate mainly in arable farming (mainly rice), so their assets are often machinery and equipment serving cropping activities such as water pumps, irrigation systems, sowing machines, sprayers. The above table shows that the assets of FGs mainly consist of equipment serving irrigation/watering. Very few FGs have machinery for tillage or rice harvesting. This is because these are capital-intensive assets which FGs can not afford, as they have no capital and access to credit is difficult. The proportion of FGs in Bac Lieu having common assets is highest among the four provinces.
The total value of assets, machinery and land of FGs is relatively low. On average, the total asset value per FG of machinery, equipment for production and business operations and land is 68 million. FGs in Ca Mau have no assets, whereas the average asset value of FGs in Bac Lieu and An Giang is over 100 million.
Table 5.21: Value of assets and machinery of FGs for business activities
(Unit: million VND)
Type of asset Total Ca Mau Bac Lieu Soc Trang An Giang
Sowing machine 3.9 0.0 2.8 5.0 0.0
Tillage machine 120.0 0.0 120.0 0.0 0.0
Pumps 199.0 0.0 92.2 415.7 410.0
Sprayer 20.7 0.0 90.0 6.8 0.0
Harvester 900.0 0.0 900.0 0.0 0.0

STUDY REPORT / INTEGRATED COASTAL MANAGEMENT PROGRAMME
9594
Irrigation system 66.9 0.0 19.3 77.4 300.0
Head office land (for which FG has land-use right certificate) 257.5 0.0 0.0 0.0 257.5
Other land 240.0 0.0 0.0 0.0 240.0
Office equipment (computer, printer, table, chair…) 45.0 0.0 0.0 0.0 45.0
Total 68.6 0.0 101.0 67.3 111.4
Source: Survey 2016.
5.5.3 Capital
On average, the total capital contribution per FG from members is 75 million. FGs in An Giang and Bac Lieu have a capital contribution around 130 million. In contrast, FGs in Ca Mau and Soc Trang have a very low level of capital contribution, especially in Ca Mau, where the total capital contributed by members is only 6.3 million per FG. Through operational processes, most FGs achieve a good level of capital accumulation. As a result, the current capital of FGs averages 120 million; compared to the total capital contributed by members, this is higher by 60%. Another positive point is that the amount owed by FGs is very low at about 7.6 million/FG.
In general, when FGs have low capital and no assets, their ability to organise services in order to provide these directly to members is curtailed.
Table 5.22: Chartered capital, debt and working capital of FGs
(Unit: million VND)
Indicator Total Ca Mau Bac Lieu Soc Trang An Giang
Total capital contributed by members per FG 75.4 6.3 137.2 35.1 128.4
Current capital per FG 120.5 18.3 311.0 17.5 143.4
Total debt per FG 7.6 0.0 0.2 0.0 30.8
Total amount owed by partners to FG 28.3 0.0 100.6 5.0 10.1
Total working capital per FG 48.5 16.7 124.1 7.5 48.2
Source: Survey 2016.
5.6 Operation of farmer groups
5.6.1 Goals and strategies
The goal of most FGs is to provide services for their members. 33.3% of FGs aim to gain the highest profit for their members, which makes this the most important goal. 26.5% of them aim to facilitate trade in members’ products. The proportion of FGs in An Giang which have set themselves the goal of facilitating trade is 44%; this is the largest proportion in the four provinces. The proportion of FGs with the goal of providing inputs is relatively small; this is because of resource limitations and difficulties in accessing credit. The proportion of FGs established to assist to each other in production and share experience is also relatively high (25%). In Ca Mau province, the majority of FGs has established this goal.
41.5% of FGs state that they will change their goals in the near future. The largest proportion of FGs intending to make such changes is in Ca Mau Province (82%). Most FGs in Ca Mau province will switch from the goal of sharing experience and supporting each other in production to facilitating product trade, and also to providing input supplies and services to their members. Overall, the trend of changing goals in all four provinces is towards product trade facilitation and production input provision for members. The express objective of this is to support the economic operations of households; it will contribute to enhancing the role of FGs. Trading products is one of the most difficult stages in the value chain for rice growers today.
Table 5.23: Operational objectives of FGs at present and in the near future
(Unit: % of FGs)
Province Timing
Gain highest profit for
FG and members
Provide inputs and services for
business activities of
members
Facilitate sale of produce for
members
Share experience,
help each other in
agricultural production
Total
Ca MauPresent 3.7 11.1 22.2 63.0 100.0
Near future 11.5 23.1 46.2 19.2 100.0
Bac LieuPresent 40.0 24.0 8.0 28.0 100.0
Near future 43.5 26.1 4.4 26.1 100.0
Soc TrangPresent 52.0 12.0 32.0 4.0 100.0
Near future 50.0 4.2 41.7 4.2 100.0
An GiangPresent 40.0 8.0 44.0 8.0 100.0
Near future 39.1 13.0 34.8 13.0 100.0
TotalPresent 33.3 13.7 26.5 26.5 100.0
Near future 35.4 16.7 32.3 15.6 100.0
Source: Survey 2016.
Table 5.24: Business strategy of FGs
(Unit: Number of FGs)
Strategy Average Ca Mau Bac Lieu Soc Trang An Giang
Focus on trading products for members 77.5 90.0 70.0 66.7 83.3
Focus on providing inputs for agricultural production 70.8 90.0 60.0 56.7 76.7
Focus on providing services for agricultural production 65.8 60.0 70.0 56.7 76.7
Expand FG’s activities into non-agricultural activities 4.2 10.0 0.0 0.0 6.7
Others 2.5 0.0 0.0 6.7 3.3
Source: Survey 2016.

STUDY REPORT / INTEGRATED COASTAL MANAGEMENT PROGRAMME
9796
There are many different activities of FGs to achieve the operational goals mentioned above. Most FGs focus on trading products for members, providing input materials and production services. Very few FGs seek to expand activities into non-agricultural sectors.
87% of FGs primarily serve their own members. In An Giang 20% of FGs serve clients outside the FG, rendering services such as water pumps and irrigation. The number of these clients served is larger than the number of FG members. Therefore, outside clients are also important to FGs.
Figure 5.2: Client categories served by FGs
Source: Survey 2016.
Development of FGs into ACs is a major change of FGs. As ACs have legal status and closer apparatus structure, this organisational form is more conducive to the expansion of production and business operations. On average, 46.8% of FGs in the four provinces expect to develop into ACs. However, there are major differences among the provinces. 26.1% of FGs in An Giang expect to upgrade to ACs, while this proportion is 77.3% of FGs in Ca Mau.
Table 5.25: Percentage of FGs wanting to develop into AC
Indicator Average Ca Mau Bac Lieu Soc Trang An Giang
Development into AC 46.8 77.3 45.8 40.0 26.1
No development into AC 53.2 22.7 54.2 60.0 73.9
Source: Survey 2016.
5.6.2 Ongoing production and business operations
FGs provide a wide range of inputs for production. The key services are to trade products for members, and provide water pumps, irrigation, input materials and pesticides. Tillage services are provided by a relatively small proportion (2.9%), as are harvesting services (2.9%),
storage services (1%) and transportation of agricultural products (1%). There are substantial differences among provinces in the proportions of FGs providing the various kinds of services. In Ca Mau Province the various proportions are all relatively low (mostly under 10%). Farmer groups in An Giang focus primarily on trading products (80%) and irrigation services (16%). Services provided in Soc Trang are diverse because during the survey the implementation of linkage was prioritised. Basically, the services of FGs are minor. One of the causes is the lack of capital and assets of FGs.
Table 5.26: Services rendered by FGs to members
(Unit: % of FGs)
Activity Average Ca Mau Bac Lieu Soc Trang An Giang
Sign contract to trade produce for members 51.0 7.4 20.0 100.0 80.0
Irrigation (watering, drainage) 20.6 0.0 60.0 8.0 16.0
Provide crop seeds 14.7 7.4 24.0 28.0 0.0
Provide kinds of fertiliser 13.7 7.4 24.0 24.0 0.0
Provide plant protection chemicals 12.7 7.4 24.0 20.0 0.0
Internal credit service 6.9 11.1 0.0 16.0 0.0
Produce rice seed 5.9 0.0 8.0 12.0 4.0
Other production (livestock, aquaculture,…) 3.9 7.4 0.0 8.0 0.0
Supervise the application of production process 3.9 0.0 0.0 16.0 0.0
Produce other crop seed 2.9 0.0 0.0 4.0 8.0
Sowing service 2.9 0.0 12.0 0.0 0.0
Provide plant protection service 2.9 0.0 8.0 4.0 0.0
Tillage service 2.9 0.0 4.0 8.0 0.0
Harvesting service 2.9 0.0 4.0 8.0 0.0
Product transport service 1.0 0.0 0.0 4.0 0.0
Preservation, storehouse 1.0 0.0 4.0 0.0 0.0
Other services 1.0 3.7 0.0 0.0 0.0
Source: Survey 2016.
5.6.3 Services rendered for non-members of farmer groups
Some services are provided to non-members in order to increase profits for FGs. Such services include irrigation, inputs and trade facilitation. The services provided to non-members in the four provinces are diverse. However, the proportion of FGs providing such services is small (under 6%); this is because individual FGs offer a narrow range of services and have limited capacity to deliver them.
Serve FG’s members
Ca Mau Bac Lieu Soc Trang An Giang Total
Serve client outside FG
120.0
100.0
80.0
60.0
40.0
20.0
0.0
85.2 92.0
8.0
92.0
8.020.0 12.8
87.380.0
14.8

STUDY REPORT / INTEGRATED COASTAL MANAGEMENT PROGRAMME
9998
Table 5.27: Services rendered by FGs to non-members
(Unit: % of FGs)
Activity Average Ca Mau Bac Lieu Soc Trang An Giang
Provide crop seeds 5.9 7.4 8.0 8.0 0.0
Sign contract to trade produce 5.9 3.7 0.0 16.0 4.0
Provide kinds of fertiliser 4.9 7.4 8.0 4.0 0.0
Irrigation (watering, drainage) 4.9 0.0 16.0 0.0 4.0
Provide plant protection chemicals 3.9 7.4 8.0 0.0 0.0
Sowing service 2.9 0.0 12.0 0.0 0.0
Produce rice seed 1.0 0.0 4.0 0.0 0.0
Tillage service 1.0 0.0 4.0 0.0 0.0
Source: Survey 2016.
5.6.4 Services provided in 2014-2015 that will no longer be provided in the coming period
Some services provided from 2014 to 2015 will no longer be provided in the future; these include produce trade, seed supply and irrigation services. However the proportion of FGs stopping services is very small because FG partnership stopped trade products and seed for FGs.
Table 5.28: Percentage of FGs that provided services in 2014-2015 but no longer provides them in 2016
Activity Average Ca Mau Bac Lieu Soc Trang An Giang
Sign contract to trade produce 2.0 0.0 0.0 0.0 8.0
Provide crop seeds 1.0 0.0 4.0 0.0 0.0
Irrigation (watering, drainage) 1.0 0.0 4.0 0.0 0.0
Source: Survey 2016.
5.6.5 New services in the coming period
58.8% of the FGs surveyed stated that they will additionally provide at least one new service in the near future. 96% of FGs in Ca Mau province expect to provide new services; this is the highest proportion in the four provinces surveyed.
The new services expected to be provided in the future include tillage, fertilisers, pesticides, harvesting, produce trade, seed varieties and irrigation. These are essential services for production by members and non-members. Tillage service and supplying production inputs are prioritised by FGs. Most FGs in the four provinces overall expect to provide some new kind of service. However, the proportion is relatively low in An Giang.
Table 5.29: Percentage of FGs expecting to provide new service in near future
Activity Average Ca Mau Bac Lieu
Soc Trang An Giang
% of FGs expecting to provide at least 1 new service in near future 58.8 96.3 56.0 48.0 32.0
New service
Tillage service 23.5 44.4 28.0 16.0 4.0
Provide kinds of fertiliser 21.6 37.0 8.0 32.0 8.0
Provide plant protection chemicals 17.6 25.9 8.0 28.0 8.0
Harvesting service 17.6 25.9 16.0 12.0 16.0
Sign contract to trade produce for members 15.7 37.0 24.0 0.0 0.0
Provide crop seeds 13.7 25.9 8.0 20.0 0.0
Irrigation (watering, drainage) 6.9 0.0 4.0 24.0 0.0
Buy products of members 5.9 3.7 0.0 20.0 0.0
Provide plant protection service 4.9 11.1 0.0 4.0 4.0
Product transport service 4.9 3.7 0.0 0.0 16.0
Drying service 3.9 0.0 16.0 0.0 0.0
Provide breeding stock 3.9 11.1 4.0 0.0 0.0
Provide animal feed 2.9 11.1 0.0 0.0 0.0
Produce rice seed 2.0 0.0 4.0 0.0 4.0
Sowing service 2.0 0.0 0.0 4.0 4.0
Internal credit service 2.0 0.0 0.0 8.0 0.0
Produce paddy 1.0 0.0 0.0 0.0 4.0
Produce other crop 1.0 3.7 0.0 0.0 0.0
Supervise the application of production process 1.0 0.0 4.0 0.0 0.0
Provide veterinary drugs 1.0 3.7 0.0 0.0 0.0
Provide veterinary service 1.0 3.7 0.0 0.0 0.0
Source: Survey 2016.
Most new services are prompted by the needs of members and by the aim to expand the production and business operations of FGs. In addition, FGs receive proposals from service providers or other partners, or take advantage of production facilities offered or mobilised by membership. This is an encouraging sign for FGs when they are seeking to expand operations to assist members in production. This result is consistent with the above analysis, which shows that 58.8% of FGs aim to provide new services in the near future.
Table 5.30: Reasons why FGs provide new services
(Unit: % of FGs)
Reason Average Ca Mau Bac Lieu Soc Trang An Giang
Need of members or non-members 80.0 84.6 57.1 91.7 87.5
Expand activities of FG 31.7 23.1 14.3 66.7 37.5
Receive external support to provide service 18.3 15.4 0.0 58.3 0.0

STUDY REPORT / INTEGRATED COASTAL MANAGEMENT PROGRAMME
101100
Partner proposes to FG that it provides new service 16.7 19.2 14.3 8.3 25.0
Better use of available assets and equipment of FG or members 10.0 0.0 0.0 41.7 12.5
Source: Survey 2016.
FGs encounter some difficulties in providing new services, such as lack of capital and manpower or incompetent manpower; difficulty in finding partners; competition; lack of experience in service operations and management. Among them, the main difficulty is lack of the capital needed to provide services; this is a very major barrier and applies to 85% of FGs.
Table 5.31: Difficulties of FGs when providing new services
(Unit: % of FGs)
Type of difficulty Average Ca Mau Bac Lieu Soc Trang An Giang
Lack of capital 85.0 92.3 64.3 100 75
Human resources do not meet requirement to provide new services
36.7 38.5 42.9 33.3 25
Difficulty in finding partners for cooperating in providing new services
36.7 42.3 28.6 33.3 37.5
Competition with other stakeholders 26.7 30.8 14.3 41.7 12.5
FG lacks experience in operation and management of services 21.7 23.1 21.4 16.7 25
Other difficulty 11.7 3.8 21.4 25.0 0.0
Source: Survey 2016.
5.7 Performance of farmer groups
5.7.1 Turnover and profit
More than 70% of FGs have no turnover or profit because they do not have their own assets (except for irrigation service). Many FGs were formed to engage in production-trade linkage and receive support from the state. There are many FGs receiving cost assistance from enterprises, they usually move to households. For example, enterprises assist 20/kg of rice procurement, this will move on selling rice households. The management personnel of FGs often work without payment. They accept this because they also produce rice and expect to sell their harvest.
Table 5.32: Turnover and profit of FGs
(Unit: million VND)
Indicator Average Ca Mau Bac Lieu Soc Trang An Giang
Total turnover 54.4 0.6 107.0 10.7 103.6
Pretax profit 11.1 0.5 22.8 3.8 18.1
Total tax amount paid by FGs 0.0 0.0 0.0 0.0 0.0
Net profit (profit after tax) 11.1 0.5 22.8 3.8 18.1
Amount of profit allocated in funds of FG 1.8 0.1 1.7 0.2 5.2
Total profit of FG distributed to members 10.1 0.5 21.2 3.6 16.0
In which:
Amount of profit distributed on basis of percentage of chartered capital of each member
4.6 0.0 2.8 3.6 12.3
Amount of profit distributed on basis of working days of members in FG activities
0.3 0.5 9.3 0.0 3.7
Amount of profit distributed on basis of level of service use of members
2.3 0.0 9.2 0.0 0.0
Source: Survey 2016.
On average, annual turnover per FG is about 54 million, whereby FGs in An Giang and Bac Lieu reach over 100 million/year. In contrast, the turnover of FGs in Soc Trang and Bac Lieu is very low. Average after-tax profit per FG is about 11 million, which is equivalent to 20.4% of average turnover. FGs with large turnover achieve large profit. Most of FG profit is distributed according to the capital contributed by membership. The distribution of profits is determined by the provisions of Decree 151/2007, which allows FGs to decide themselves the method of sharing profit. No FGs pay taxes to the state because they do not submit tax reports and are not inspected.
5.7.2 Performance
The average annual turnover of FGs is 2.2 million/member with pre-tax profit of 0.6 million/member. Concerning the working capital of FGs, average turnover generated per 1 million working capital is 1.64 million and profit is 0.3 million. In the four provinces surveyed, FGs in Ca Mau have the less effective operations in financial terms.
Viewed in terms of the number of members, FGs with fewer members achieve better indexes measuring economic efficiency such as turnover/member and profit/member.
Table 5.33: Operational performance of FGs in 4 provinces surveyed
(Unit: million VND)
Province Turnover/MB(mill VND)
Pretax profit /MB
(mill VND)
Turnover/floating capital
Pretax profit/ floating capital
Ca Mau 0.12 0.12 0.03 0.02
Bac Lieu 3.33 1.37 3.51 0.29
Soc Trang 0.42 0.15 0.54 0.34
An Giang 5.12 0.84 2.75 0.47
Average 2.2 0.6 1.64 0.30
Source: Survey 2016.

STUDY REPORT / INTEGRATED COASTAL MANAGEMENT PROGRAMME
103102
Table 5.34: Operational performance of FGs by FG size
(Unit: million VND)
FG size Turnover/MB(mill VND)
Pretax profit /MB(mill VND)
% of FGs having less than 30 members 3.10 0.86
% of FGs having from 30 to 70 members 0.59 0.16
% of FGs having more than 70 members 1.17 0.20
Average 2.20 0.60
Source: Survey 2016.
5.7.3 Price of services that FGs provide to members
56.3% of the FGs surveyed stated that the price of input materials and production services is lower than the market price, by about 9% on average. 39.6% of FGs said that the price of these items is equal to the market price. In An Giang province, 10% of FGs stated that the price of these items is higher than the market price.
53.2% of FGs which facilitate produce trade for members stated that the selling price of products through FGs is higher than the market price, by about 5.2% on average. However, 17% of FGs stated that the price of products sold by FGs is lower than the market price.
Table 5.35: Evaluation of prices of inputs and production services provided by FGs
(Unit: % of FGs)
Remark Indicator Average Ca Mau Bac Lieu
Soc Trang
An Giang
Price of inputs and production services of FG is lower than market price
% FG have remark 56.3 75.0 86.7 47.4 20.0
Percent by which price is lower (%) 9.0 4.3 11.4 6.3 12.5
Product price sold through FG is higher than market price
% FG have remark 53.2 50.0 55.6 56.0 45.5
Percent by which price is higher (%) 5.2 8.0 7.6 4.4 4.2
Prices of inputs and production services to members are lower than prices of FG to non-members
% FG have remark 34.6 75.0 66.7 44.4 0.0
Percent by which price is lower (%) 9.0 4.7 14.5 1.8 -
FG buys products of members at a price higher than that paid to non-members
% FG have remark 52.2 50.0 50.0 45.5 62.5
Percent by which price is higher (%) 3.3 3.0 4.7 1.2 7.3
Source: Survey 2016.
Around one in three FGs stated that they seek to serve members at a lower price than the market, by about 9%. However, the price of inputs in An Giang Province for members is not lower than the price for non-members.
Over half of the FGs stated that they buy products from members at a price higher than that paid to non-members, at a level about 3.3% higher. There are no significant differences in the proportion of FGs among provinces stating that they pay higher prices to members. However, the FGs in An Giang have the highest differential between the price paid for traded products to members and that paid to non-members, at about 7.3%.
5.8 Government support for FGs
There are no specific policies on support for FGs. Support policies are often an element of the policies to support the cooperative economy. However, FGs have received a lot of support from the state. On average, 93.1% of FGs received at least one type of support from the state over the last three years. FGs received 4.5 types of support on average.
Table 5.36: Support by state to FGs in 4 provinces surveyed
(Unit: % of FGs)
Province % of FGs receiving at least 1 type of support from state
Average number of types of support 1 FG receives from state
Ca Mau 96.3 5.5
Bac Lieu 96.0 5.4
Soc Trang 100.0 4.8
An Giang 80.0 2.4
Average 93.1 4.5
Source: Survey 2016.
The issues covered by the support received by FGs concern: establishment guidance; training for capacity-building; governance; and implementation of farming processes such as 1M5R, 3R3I. However, trade promotion and market access have not been the subject of any support.
Table 5.37: Percentage of FGs receiving state support, by type of support
Group of support Content of support Average Ca Mau
Bac Lieu
Soc Trang
An Giang
Establish new FG
Guidance for the establishment of new FG 66.7 70.4 92.0 64.0 40.0
Physical support (money, in kind) 14.7 18.5 28.0 4.0 8.0
Guidance on the policies concerning FGs 41.2 33.3 60.0 52.0 20.0

STUDY REPORT / INTEGRATED COASTAL MANAGEMENT PROGRAMME
105104
Training
Training on governance 54.9 66.7 84.0 52.0 16.0
Training on financial and accounting management 32.4 55.6 28.0 28.0 16.0
Training on building business plan 49.0 59.3 56.0 64.0 16.0
Training on marketing 9.8 7.4 8.0 12.0 12.0
Training on agricultural production techniques, processing for FG managers
46.1 70.4 48.0 48.0 16.0
Training for FG members 41.2 59.3 44.0 28.0 32.0
Other trainings 5.9 0.0 0.0 24.0 0.0
Access to capital Preferential credit for FG 2.9 0.0 4.0 4.0 4.0
Transfer of techniques and technology
FG is supported to apply sustainable production process (GAP, organic, 1M5R, 3R3I,..)
70.6 74.1 64.0 92.0 52.0
FG is supported with crop seed and breeding stock 5.9 11.1 8.0 4.0 0.0
FG is supported with processing technology 1.0 3.7 0.0 0.0 0.0
Other technology transfer to FG - 0.0 0.0 0.0 0.0
Infrastructure FG is supported to develop infrastructure 4.9 3.7 16.0 0.0 0.0
Trade promotion
FG is supported to participate in agricultural fair, exposition - 0.0 0.0 0.0 0.0
FG is supported to promote its products in media - 0.0 0.0 0.0 0.0
FG is supported concerning packaging, label, logo, website to promote its products
- 0.0 0.0 0.0 0.0
FG is supported in other ways to promote its products - 0.0 0.0 0.0 0.0
Source: Survey 2016.
The survey results show that FGs mainly ask communal officers (83.3%), district officers and agricultural extension officers when they need instruction. It can be seen that communal staff play an important role in supporting FGs. Therefore, building capacity for communal officers, especially agricultural officers, and for agricultural extension officers on the related contents, is very necessary.
Table 5.38: Percentage of FGs seeking guidance from stakeholders when necessary
Stakeholders Average Ca Mau Bac Lieu Soc Trang An Giang
Communal staff 83.3 74.1 88.0 76.0 96.0
Managerial staff at district level 39.2 18.5 60.0 48.0 32.0
Managerial staff at provincial level 7.8 11.1 4.0 8.0 8.0
Extension staff 31.4 37.0 52.0 16.0 20.0
Other sources 0 0.0 0.0 0.0 0.0
Nobody 2.9 3.7 0.0 8.0 0.0
Source: Survey 2016.
5.9 Strengths and difficulties of farmer groups
5.9.1 Strengths
According to the self-assessment of FGs, the greatest strength is solidarity of management personnel (84.3%), management transparency and publicity (46.1%). The existence of transparent production and business plans (34.3%) and support by the state (31.4%) are also noted. The solidarity of managers is a strong point because most FGs are at village level, with members in the same village sharing common values. This is advantageous to organise collective action.
An important factor affecting the good operations of FGs is participation of members in management and in the design of production and business plans, as well as capacity of managers. Only 12.8% and 11.8%, respectively, of FGs consider these aspects to be strong points in the current period.
Table 5.39: Strong points of FGs in 4 provinces surveyed
(Unit: % of FGs)
Strong point Average Ca Mau Bac Lieu Soc Trang An Giang
FG managers are solidary 84.3 100.0 68.0 96.0 72.0
Open and transparent management 46.1 44.4 56.0 60.0 24.0
FG has clear business plan 34.3 29.6 36.0 56.0 16.0
Supported by state agencies 31.4 25.9 40.0 44.0 16.0
Ensured service quality 16.7 7.4 40.0 4.0 16.0
Active participation of members 12.8 3.7 24.0 20.0 4.0
Service prices of FG are appropriate 12.8 7.4 24.0 4.0 16.0
FG managers are competent 11.8 11.1 12.0 16.0 8.0
FG offers many services meeting the needs of members and non-members 4.9 0.0 8.0 4.0 8.0
Other factors 7.8 0.0 20.0 0.0 12.0
Source: Survey 2016.

STUDY REPORT / INTEGRATED COASTAL MANAGEMENT PROGRAMME
107106
5.9.2 Difficulties of FGs
The crop FGs surveyed stated that they encounter many difficulties, as presented in the table below. The difficulties most frequently mentioned are: limitation of management personnel capacity; lacking capital; difficulties in capital mobilisation; misunderstanding the policy of the state; small range of services provided to group members; lack of transparency in production and business plans. These problems are entirely consistent with the results of the analysis mentioned above in relation to the capacity of managers, lack of capital and assets as well as production and business operations.
Table 5.40: Difficulties of FGs in 4 provinces surveyed
(Unit: % of FGs)
Difficulty Average Ca Mau Bac Lieu Soc Trang An Giang
Limited capacity of FG managers 78.4 81.5 80.0 84.0 68.0
Lack of capital 75.5 88.9 80.0 84.0 48.0
FG does not clearly know public policies on FGs 67.7 81.5 92.0 44.0 52.0
Difficult mobilisation of capital 62.8 77.8 92.0 60.0 20.0
FG has few services meeting the needs of members and non-members 52.9 66.7 48.0 72.0 24.0
Does not receive efficient support from public agencies 43.1 51.9 44.0 28.0 48.0
FG does not have clear business project 41.2 63.0 60.0 24.0 16.0
Difficult access to credit 36.3 18.5 60.0 48.0 20.0
Members are rarely involved in management, development of business project
31.4 66.7 28.0 20.0 8.0
FGs do not know where they can seek guidance when in need 11.8 11.1 12.0 4.0 20.0
FG manager is not solidary 4.9 0.0 8.0 4.0 8.0
Service quality of FG is not assured 4.9 14.8 4.0 0.0 0.0
Service prices of FG are not appropriate 2.9 7.4 0.0 4.0 0.0
FG’s management is not open and transparent 1.0 0.0 4.0 0.0 0.0
Other factors 4.9 0.0 4.0 4.0 12.0
Source: Survey 2016.
The survey results illustrate that the greatest difficulties are the limitation of management personnel capacity and lack of capital.
Table 5.41: The greatest difficulties of FGs at present
(Unit: % of FGs)
Type of difficulty Average Ca Mau Bac Lieu Soc Trang An Giang
Limited capacity of FG managers 40.4 40.7 36.0 45.8 39.1
Lack of capital 30.3 37.0 36.0 29.2 17.4
Difficult access to credit 6.1 3.7 0.0 20.8 0.0
FG has few services meeting the needs of members and non-members
5.1 3.7 0.0 0.0 17.4
FG manager is not solidary 4.0 0.0 8.0 4.2 4.4
Does not receive efficient support from public agencies 4.0 11.1 0.0 0.0 4.4
FG does not clearly know public policies on FGs 4.0 0.0 4.0 0.0 13.0
Difficult mobilisation of capital 3.0 0.0 12.0 0.0 0.0
Members are rarely involved in management, development of business project
2.0 3.7 0.0 0.0 4.4
FG does not have clear business project 1.0 0.0 4.0 0.0 0.0
Source: Survey 2016.
5.10 Farmer groups’ support requirements
5.10.1 Issues on which FGs need support
When asked which types of support FGs wish to receive at present, they stated: access to capital (76.5%), trade facilitation (72.6%), training for capacity-building of management personnel (63.7%), linkage under LSRF model (62.8%), instruction to understand the regulations and policies of the state (56.9%).
Table 5.42: Issues on which FGs need support
(Unit: % of FGs)
Type of support Average Ca Mau Bac Lieu Soc Trang An Giang
Access to credit 76.5 81.5 80.0 84.0 60.0
Support for FG to sell its products 72.6 88.9 52.0 68.0 80.0
Training for capacity-building of FG managers 63.7 63.0 88.0 76.0 28.0
Support for FG to engage in production-trade linkage and LSRF 62.8 63.0 60.0 72.0 56.0
Guidance for FG to know public polices on FGs 56.9 59.3 84.0 64.0 20.0

STUDY REPORT / INTEGRATED COASTAL MANAGEMENT PROGRAMME
109108
Support for FG to implement certified production process 24.5 22.2 32.0 28.0 16.0
Support for FG to transform into AC 18.6 11.1 24.0 32.0 8.0
Support for FG to gain legal status 11.8 0.0 4.0 44.0 0.0
Support for FG to rent productive land 6.9 3.7 20.0 0.0 4.0
Support for FG to register brand name 2.9 11.1 0.0 0.0 0.0
Other types of support 5.9 3.7 0.0 16.0 4.0
No support needed 2.9 0.0 4.0 0.0 8.0
Source: Survey 2016.
5.10.2 Contents and methods of building capacity for management personnel
In terms of content, the first requirement of FGs is training and retraining on governance in particular. This concerns the development of production and business plans, organisational management and administration of business operations, monitoring FG operations, and mobilising the participation and capital contribution of members for FG operations. The second priority of most FGs is training and retraining related to financial and accounting management. In particular, the FGs wish to be trained and retrained in bookkeeping skills and accounting. Other issues on which more than 50% of FGs responded are support policies, contract negotiation, and the application of farming processes such as 1M5R.
Table 5.43: Training needs of FGs
(Unit: % of FGs)
Domain Issue Average Ca Mau Bac Lieu Soc
Trang An Giang
Decree No. 151/2007/NĐ-CP
Nature of FGs 45.1 51.9 44.0 44.0 40.0
Organisation of FGs under Decree No. 151 49.0 51.9 68.0 48.0 28.0
Asset and financial management (capital contribution, distribution of profit, of asset, …)
58.8 51.9 88.0 68.0 28.0
Registering and certifying FG establishment 38.2 37.0 56.0 36.0 24.0
FG management
Project development, business plan of FG 81.4 77.8 100.0 88.0 60.0
Organisation, management, operation of business activities of FG
67.7 63.0 92.0 84.0 32.0
Supervision, control of business activities of FG 55.9 51.9 68.0 80.0 24.0
Methods to mobilise the participation and capital contribution of members in/to FG activities
56.9 59.3 76.0 72.0 20.0
Domain Issue Average Ca Mau Bac Lieu Soc
Trang An Giang
Trade, marketing
Brand building 18.6 14.8 4.0 44.0 12.0
Methods of market evaluation and analysis 18.6 0.0 8.0 64.0 4.0
Methods of product marketing 15.7 3.7 12.0 44.0 4.0
Contract negotiation 61.8 66.7 28.0 92.0 60.0
Financial management and accounting
Preparation of financial reports, tax reporting 34.3 18.5 24.0 84.0 12.0
Use of accounting software 12.8 3.7 8.0 28.0 12.0
FG bookkeeping 61.8 81.5 48.0 96.0 20.0
Techniques of agricultural production
Sustainable production process (VietGAP, organic,…) 39.2 59.3 24.0 52.0 20.0
1M5R, 3R3I 69.6 77.8 76.0 88.0 36.0
Other 2.9 3.7 0.0 4.0 4.0
Source: Survey 2016.
In terms of methods, most FGs expect to be trained or retrained in the same period, and wish to visit cases of cooperative good practice in order to learn successful cooperative models.
Table 5.44: Training methods that FGs want
(Unit: % of FGs)
Method Average Ca Mau Bac Lieu Soc Trang An Giang
Theoretical lecture in classroom 77.5 81.5 88.0 92.0 48.0
Experienced staff works together and guides FG over several months or years 67.7 74.1 80.0 68.0 48.0
Study visit by FG to best-practice models 45.1 29.6 56.0 64.0 32.0
Provision of guidance documents about FGs 19.6 7.4 12.0 40.0 20.0
Other methods 0.0 0.0 0.0 0.0 0.0
Source: Survey 2016.
6. Current Shortcomings and Challenges for The Development of Acs, Fgs, Linkage and Lsrf
6.1 Current shortcomings and challenges in production-trade linkage and LSRF
Linkage in production-trade value chains is based on the principle of voluntariness. Therefore, linkage is successful and sustainable only when it delivers advantages to companies and farmers. A great number of enterprises has signed contracts to trade products with farmers aiming to achieve the main purpose under Circular 15/2015/TT-BNNPTNT on rice export enterprises. These enterprises must respond to an area of raw materials in which at least 10% of rice is

STUDY REPORT / INTEGRATED COASTAL MANAGEMENT PROGRAMME
111110
exported in the first year and 50% in the next five years. Most enterprises have signed contracts to trade only a very small volume of products. Many others have only paid attention to whether or not there is such a contract, without requiring standardised quality of rice. What are the reasons?
6.1.1 Policies not strong enough to encourage enterprises to engage in linkage between the production and trade of rice
Some enterprises have signed contract to trade products that stipulate high-quality varieties (Japanese rice and Jasmine rice), the application of certified farming processes (organic rice, GlobalGap) or the production of seed rice of certified quality.
In rice trade linkage, enterprises play a key role, as borne out by the findings of the survey; ACs and FGs have no linkage in rice trade without enterprises that trade the products. Many ACs and FGs do not set up rice production under LSRF for the same reason.
In order to have linkage with ACs/FGs, enterprises must have signed a contract to trade rice with ACs/FGs under which they must buy rice. In the linkage, enterprises must buy rice at the market price or higher. Moreover, enterprises have to pay a contribution of 50 to 200 VND/kg for ACs/FGs as monetary support to produce rice as required. In addition, enterprises have to invest in advance for households. They buy fresh rice from the ACs/FGs, so they need to invest in the infrastructure for drying and storing. They also pay for negotiating and monitoring the farming process of ACs/FGs. In short, in order to have linkage, enterprises are required to invest a great deal of capital and incur greater costs than without linkage. Therefore, if enterprises only export rice varieties of ordinary quality, which they can easily buy in the market, they have no incentive to engage in linkage because current policies are not strong enough to encourage them to join linkage. Accordingly, most enterprises in linkage are the ones which stipulate rice quality standards, or achieve an internationally certified high quality of rice allowing them to sell it at profitable prices. These products can be sold at high prices, which helps them make up for their expense on linkage. Nonetheless, the scale of these products is limited.
In order to have linkage with ACs/FGs, first of all enterprises have to succeed in signing contracts for sale of rice. However, Viet Nam’s rice export enterprises only win contracts for sale of high-quality rice in very small number. This is a huge challenge for rice production-trade linkage in the current period.
The current policies encouraging linkage under Decree 62 are not strong enough to bring about linkage. In particular: i) Enterprises can be exempted from the expense for land use or land lease, but localities do not have land available for enterprises to lease. ii) Enterprises are prioritised to take part in the government’s export contracts. In order to do so, enterprises must meet many requirements and normally they do not need high-quality rice. iii) These are supported with a part of the cost of planning production, improving fields, enhancing the transport system, infield irrigation as well as electricity supply. These policies bring direct benefits to farmers without enterprises. In addition, the application and approval mechanism is also universal in encouragement policies for enterprises.
Current policies fail to encourage rice export enterprises to export rice of high quality with a brand name and at high prices in order for them to make up for the linkage expense. When policies still fail to encourage enterprises in linkage in production-trade, they are far from successful. The policies under Decision 26 are not strong enough to motivate enterprises to engage in linkage in rice production and trade associated with the LSRF approach.
6.1.2 Low number of enterprises having sufficient potential for linkage
Based on the current linkage model, enterprises need to have large capital and good infrastructure for product transportation, desiccation and preservation, and need to provide advance investment for farmers. Only few enterprises currently meet these criteria.
6.1.3 Weakness in capacity of agricultural cooperatives/farmer groups
ACs/FGs often lack capital and assets, have intransparent management and are subject to limitations concerning capable management personnel. This leads to a lack of ability to organise production and provide services and act as an intermediary to serve their members.
ACs lack capacity to determine some stages in the linkage chain. This leads to reduced linkage ability because they do not share responsibilities with enterprises in organising the chain. If capable, ACs/FGs can provide services including rice transportation, desiccation and preservation beside giving support to their members in LSRF production. At present, these services are rendered by enterprises while their capacity is also limited.
6.1.4 Other shortcomings
• Local authorities lack human resources to support enterprises, ACs and FGs and farmers setting up linkage in LSRF production. Although local authorities do deliver some support to set up the LSRF model, the scale is modest.
• There is a lack of mechanisms to tackle cases of contract violation. Handling such cases wastes time and money, which enterprises do not favour.
• Decision 62 only regulates support for ACs, but not for FGs.
6.2 Shortcomings and challenges for cooperative development
6.2.1 The relatively high proportion of nominal and weak cooperatives
Reports from the provinces show that the proportion of true ACs is rather low. The survey found that there is a great number of nominal cooperatives; neither do they contribute any authorised capital nor do they participate in any collective activities. Moreover, they do not have any turnover, accounts and financial statements. These ACs are established or maintained for other reasons than serving their members. One of the reasons why such nominal cooperatives still exist is to meet the criteria of the National Targeted Programme on New Rural Development.
6.2.2 Operations of agricultural cooperatives failing to satisfy the needs of their members
The majority of ACs supply production inputs (seeds, fertilisers, pesticides) and render production services, mainly irrigation ones. Just a few ACs are able to perform the post-production services such as harvesting, transportation, drying and storage of rice which are essential for linkage in the product chain to make it easy for members to associate with enterprises.
6.2.3 Weak capacity of agricultural cooperatives
The above analysis points out the limited capacity of ACs in the four provinces surveyed. In particular:
• A great number of ACs lack the regulations needed for the governance and operational management of ACs, which undermines the trust of their new members in these cooperatives.

STUDY REPORT / INTEGRATED COASTAL MANAGEMENT PROGRAMME
113112
• The majority of managerial staff is at a low educational level, mainly secondary school and high school. The position of secretary requires professional competence in accounting; however, most accountants of ACs have just finished secondary school or high school and have no professional training in accounting.
• In spite of being trained and retrained, basically the personnel capacity of ACs is limited. This is shown by their inability to draw up production plans, to organise activities for members of ACs and to make annual financial statements and tax reports.
• ACs have almost no common land, instead mainly cultivating the land of members, and in general the scale of ACs is small. The assets and capital of ACs are very low while debts are enormous. Therefore, they face many difficulties to access credit capital and expand innovative activities.
• A great number of ACs have no capital contributions and no revenue. They exist for the sole purpose of meeting the criteria of the National Targeted Programme on New Rural Development. As a whole, the revenue and profit of ACs are low. Many are so low that the managerial personnel have had no salary for years; they have worked with a spirit of responsibility for the households in the hamlet.
• However, the fact is that most ACs, if they operate, provide services for their members quite well, including production services (especially irrigation), supply of input materials and production-trade linkage services for members. Many ACs take the intermediary role in connecting members with enterprises and agencies while financial transactions are done directly between enterprises and members. In such arrangements, the revenue and profit of ACs are little if they collect nothing from members.
• The capacity of managerial personnel of ACs is limited, assets and capital are small, and revenue and profit are low while ACs are a collective economic organisation operating under the law. Therefore, nowadays many ACs find it very difficult to be qualified. Moreover, neither do many ACs have clear accounts nor do they produce tax reports. They also make no profit to pay for staff members.
6.2.4 Inadequate awareness of the nature and role of agricultural cooperatives
Since the first law on cooperatives was adopted, the nature of ACs has undergone basic changes in comparison with that during the period of the centrally planned economy. One of the changes is independence, self-control and self-responsibility of ACs as collective economic organisations of voluntary members. Since adoption of the law on cooperatives in 1996, the propagation of the law via the media and training programmes has increased the awareness of AC staff and farmers. However, misunderstandings are still common, and some individuals do not act in a manner compliant with the nature of ACs and the law on cooperatives.
The law states that ACs are collective economic organisations established on the principle of voluntariness of individuals, households and organisations; further principles are independence, self-control and self-responsibility. Nonetheless, many authorities at the basic level (commune, hamlet) in fact still have the same mentality as in the period of the centrally planned economy. ACs are organisations directly under their authority as well as its extending tool. Therefore, they have direct influence upon the structure and operation of ACs. The most clear example is
that they intervene in appointments of managerial personnel and supply concrete guidance on operations. Some local authorities use ACs to take decisions about production plans.
Studies and experts in the field have pointed out the importance of authorities helping with the operation of ACs. However, helping is different from interfering which gives rise to the loss of independence and self-control of ACs.
Households were strongly influenced by the operation of ACs in the time of the centrally planned economy, and many farmers still think that today’s ACs are similar to those of the past, i.e. that they are established by the local authority and are organisations directly under the authority with the same manner of operation as years ago. Therefore, these farmers have no belief in the operation of ACs. This mindset is apparent when members and even managerial personnel of ACs state the thought that ACs are to serve the authority which should be the recipient of support from the state in order to operate them.
6.2.5 Drawbacks of preferential policies on agricultural cooperatives
The current policies on ACs have many drawbacks.
• ACs must supply at least 68% of their overall service value to their members and in this case they are exempted from corporate income tax. In reality, a great number of ACs fail to meet this criterion; they mainly supply non-members without being monitored or fined. They are nonetheless exempted from income tax since they neither submit their tax reports nor pay their corporate income taxes. The regulation mentioned above poses difficulties in providing services by ACs. When an AC is operating on the currently frequent small scale (according to the law, it is allowed to establish a cooperative of 7 members or 7 households), supplying its members is quite difficult. For example, if ACs consisting of 50 members gather funds to buy a combine harvester with the purpose of providing services, then there is a waste of machine capacity, thereby leading to inefficiency. Likewise, ACs of that size cannot find institutions providing agricultural materials for their members, which is inefficient.
• Many policies introduced by the government are lacking in terms of their feasibility and the human resources to implement them. Policies such as assistance with the land for the head office of ACs and helping them with the land lease are impractical because most localities do not have land available for this. Policies helping ACs implement the LSRF approach lack feasibility when local authorities lack the human resources and regulations by which to deliver assistance.
6.2.6 Public services failing to support agricultural cooperatives
• A particular characteristic of ACs is that their managers are producers with limited education. According to the law, they are authorised to hire a director and technical staff. However, given the small scale of production which brings little profit, ACs cannot hire a chief executive director. They need assistance from the government. There are currently no specific regulations under which agencies give help to ACs. Therefore, the responsibilities of agricultural extension officers at the basic level for helping ACs draw up production plans and address other issues should be expanded.
• The government has the responsibility for inspecting and auditing the operation of ACs to make sure that they function well and financial management is transparent. However,

STUDY REPORT / INTEGRATED COASTAL MANAGEMENT PROGRAMME
115114
in reality, the government scarcely monitors ACs. Consequently, no audits are carried out. Furthermore, the ACs that do not submit their tax reports are neither inspected nor fined.
• The capacity of governmental management staff is limited. The majority of localities have a small number of staff responsible for governmental management of ACs. Many staff members have inadequate knowledge of collective as well as collaborative economy; they are also lacking in hands-on experience of helping ACs to develop. As a result, assistance is very limited.
6.2.7 Unsuitable cooperative model
ACs are independent, self-controlled and self-responsible economic organisations. In order for them to function well, there should be a group of qualified and professional managers who get paid in accordance with their education level. ACs can hire these professional managers. However, small-scale ACs consist of less than 100 members and manage an area of less than 100 ha. For such ACs to provide services for their members and conform to the 2012 law on cooperatives, their revenue is not enough to hire and pay professional managers. Moreover, these ACs cannot offer the many services that are profitable only when the scale is sufficient. A great number of ACs are operating in their own name but it is more appropriate to register as farmer groups. FGs can still help their members buy common materials and services, and apply common production processes, while nowadays ACs take the intermediary role of connecting members with enterprises and agencies.
It would seem that large-scale cooperatives need to be established. The problem is, however, that if large-scale cooperatives comprise thousands of farmers, each being a member with a small scale of production, managing them is quite difficult. It is vital to define a suitable model for ACs.
7. Some Typical Linkage Models7.1 Model of linkage between enterprises/agencies supplying materials and ACs/FGs
This is a linkage model pursued between Thanh Liem enterprise and Thanh Tri co-operative, and between Lan Pho enterprise and a farmer group in Soc Trang.
These enterprises, formerly supply agencies (seeds, fertilisers, pesticides), have now registered to turn into enterprises; they mainly sell agricultural supplies for farmers. The enterprises both sell retail articles to individual farmers and link to ACs to deliver supplies to members of the ACs.
Enterprises’ responsibilities: i) providing fertilisers and pesticides for members of ACs and FGs, in some cases providing seeds; ii) buying rice of members of ACs and FGs under agreements; iii) buying fresh rice in the fields.
Cooperatives’ responsibilities: ensuring members’ production practices are in accordance with agreements with enterprises from seed sowing time to harvest.
In this connection, enterprises must pay a fee to ACs/FGs to implement the linkage in production. Depending on the specific situation, enterprises can deduct a commission for ACs/FGs of 3% to 5% of the total value of fertilisers and plant protection chemicals that ACs/FGs purchased from that enterprise. The material-supplying enterprise must find commercial enterprises to resell rice that they purchased from the ACs/FGs. The material-supplying enterprises can ensure their profits from their agricultural supplies and rice trading activities. In some cases, the material-
supplying enterprises are at risk when they committed to buy rice at a fixed price early on in the crop season and the rice prices go down at the end of the crop season. The enterprises engaging in this model are limited as they only participate in this model when they have drying systems and rice storage facilities or have partners for drying and reselling the rice. Typically, these enterprises only sign an agreement for a small area with rice output of less than 300 tons/crop season.
The advantage of this model: Rice trading enterprises are not concerned with investing in inputs for ACs/FGs; material-supplying enterprises have hands-on experience and close relationships with farmers so they can limit risks; material-supplying enterprises can ensure their supplies. For ACs/FGs, this linkage model ensures supplies to members and the ACs/FGs receive a fee. It follows that this model should be expanded. In this model, commercial enterprises search markets and set the standards for material-supplying enterprises to associate with ACs/FGs in production-trade linkage.
7.2 Model of commercial enterprise in production-trade linkage and support for agri-cultural cooperatives
A typical model in trade linkage is followed between Loc Troi enterprise and Vinh Binh agricultural cooperative in Chau Thanh district, An Giang province. This model has the following characteristics: i) the members of the AC observe the required production process, but not the LSRF approach; ii) the enterprises trade rice; iii) the enterprise is a member of the AC and supports the AC in management and operation.
Vinh Binh Cooperative was established in 2015 by the farmers who previously had linked with Loc Troi Group and who had a need to cooperate. Loc Troi Group is a member of the AC with capital accounting for 20% of the authorised capital of the AC. All the members of the AC conduct investments under the agreement. The administrative board of the AC includes the board members, the directors, accountants, technicians. The administrative board of the AC consists of 11 members including 5 members of the board, 3 officers in the supervisory board, 1 accountant-treasurer and 2 technical staff. At present, the AC has 73 members managing a total area of 142 ha. The administrative board of Vinh Binh Cooperative has some members who are technical staff of Loc Troi Group.
Role of enterprise (Loc Troi Group) in linkage
• Deciding which rice seed to cultivate: Loc Troi Group suggests 3 – 5 varieties of rice seed and a group of members of the AC selects varieties to sow from those suggested by the Group.
• Developing technical procedures for each of the varieties to be uniformly implemented in the AC.
• Nominating the technical staff of the company to contact and consult households regularly, providing assistance with the techniques as well as supervising them to implement technical procedures properly. These staff members are also the ones joining the management of the AC as its technical staff.
• Providing seeds, pesticides, and deferred fertiliser in the last season for those households taking part in the association.
• Free-of-charge drying of rice for those households which sell rice for the Group.
• Nominating staff to join the management department of the AC as director, chief accountant or technicians. Most of the activities of the AC are undertaken by the staff of the company.

STUDY REPORT / INTEGRATED COASTAL MANAGEMENT PROGRAMME
117116
Role of Vinh Binh agricultural cooperative
The AC represents the member households when signing the linkage contract on rice production with the enterprise. The AC receives seeds, pesticides and fertiliser from Loc Troi and distributes them to households taking part in the cooperative and to non-members. The AC receives a commission corresponding to 5% of the total revenue from goods that are distributed by the enterprise through the AC. The AC and technicians of the enterprise supervise and help households during production.
Role of households participating in linkage
It is obligatory for households to use rice provided by the enterprise and to obey the technical process with the technicians’ direction as well as to be supervised by the technicians of the enterprise. Households must use the pesticides provided by the enterprise. Households were helped to transport rice to the warehouse by the enterprise in the last season and households have free rice drying. Households are also supplied seeds, pesticides and fertiliser in deferring ways.
Results of linkage
In 2015, the AC signed a linkage contract on rice production with the enterprise, concerning 372 ha including 172 ha of members and 200 ha of households who are not AC members. About 75% of the households implemented the contract successfully. The AC organised a broad range of service activities, including supplying seeds, pesticides and fertilisers, tillage, sowing, spraying pesticides, harvesting and transporting rice to the warehouse. In the near future, the AC will provide rolling straw service to households in the AC and to non-members. Despite having just been established, the AC’s total revenue reached nearly VND 85 million with VND 82.6 million profit in 2015 by associating with Loc Troi Group and organising many service activities. Most of the profit of the AC is distributed based on the extent of service use by members (68%) under the provisions of the 2012 law on cooperatives.
The advantages of the model
• The quality of rice is uniform and stable because households apply the same technical process and seeds based on the enterprise’s requirements.
• The association among the enterprise, the AC and households is relatively close because of the enterprise’s investment in the AC and the assurance that the produce will be bought.
• The AC and households received a great amount of assistance from the enterprise.
• AC households all have large-scale production. Those households joined together to trade products before establishing ACs.
• The capacity of the AC is gradually improved due to the Group’s support that contributes directly to the AC’s management and administration. This can be considered as a model of best practice for enterprises supporting capacity development for ACs.
• For Loc Troi Group, the method of cooperation with ACs like Vinh Binh cooperative has helped reduce the number of “3 Coops” technicians that were previously needed when associating with each household. As a result, the enterprise’s costs are reduced greatly.
The disadvantages of the model
• No rotational production system has yet been established to follow the LSRF approach.
• Major financial capacity and human resources is a requirement for enterprises to implement the model. No other enterprises have enough potential to implement the approach in the manner of Loc Troi Group. Therefore, it is very difficult to replicate the model.
• Most of the activities of the AC are undertaken by management staff who are nominated to join the AC’s management department. The role of management staff in ACs is still weak. In an early stage, this approach is suitable, but unless the staff are trained and instructed and roles are transferred to them it is hard for ACs to have independence and sovereignty, and they will then always depend on the enterprise. There are difficulties in organising any activities without the enterprise or in the event that the enterprise does not associate with the AC any more.
7.3 Model of AC organising LSRF for members, buying paddy of members and reselling to trading partner
This model is performed by General Agricultural Cooperative Dac Luc in Ho Dac Kien commune, Chau Thanh District, Soc Trang Province. This AC was established in 2012, but until May 2016 it had not performed re-registration under the 2012 law on cooperatives. There are 11 members, with a land area of rice production of households totalling about 80 ha. The AC’s authorised capital is VND 270 million, which comes from all members. The AC organises the production of RVT and ST20 rice, all of best quality, by applying the LSRF approach, and then buys the rice from the members and sells it to partners. In other association models, ACs play a role as an intermediary between an enterprise and households. The purchase of the product is decided by the enterprise and the households. In this model, ACs decide to buy rice from members and sell it to their partners.
Role of agricultural cooperatives
• ACs produce rice in accordance with the LSRF method, so households use the same seeds and management procedures, and comply with a seasonal calendar and harvest calendar.
• ACs provide seeds, pesticides and fertilisers in last season for those households taking part in linkage.
• The supervision of and advice for households to implement management procedures properly is standardised in accordance with requirements of associated partners.
• ACs purchase fresh rice at the households’ fields and sell it to partners.
• ACs buy rice at market price with a negotiated floor price. If the market price is lower than the floor price that ACs negotiated, ACs still buy at the floor price.
• ACs find the partners to purchase the produce.
Roles of households participating in linkage
• Rice production to a unified standard set by the ACs.
• Compliance with the technical process required by the ACs.
• Sale of rice to ACs at the market price at the time of sale.

STUDY REPORT / INTEGRATED COASTAL MANAGEMENT PROGRAMME
119118
Results of linkage
For the winter-spring crop in 2015-2016, ACs contracted to trade products for an area of 120 ha, with 80 ha managed by AC members. The partners purchasing the products included Vinacam Enterprise and ADC Enterprise. The partners are unstable and change depending on the ACs’ commercial situation.
The advantages of the model
• ACs guarantee the purchase of households’ output.
• It makes ACs more active, regularly keeping abreast of market information and finding partners to purchase the products of AC members.
• Households can buy materials in last season by deferring ways from Coops.
The disadvantages of the model
• The position of ACs is unstable as it depends on the ACs’ commercial situation in each season. If ACs are unable to find partners to buy products, this will lead to difficulty in purchasing products from members.
This model requires the ACs to have an active, capable staff. ACs need to have large capital and facilities to purchase from households and sell to partners. Most ACs lack such capital, have limited assets and are unable to access capital. Thus it is very difficult to replicate the model.
7.4 Factors ensuring the success of agricultural cooperatives
From the research results as well as from a review of experience in the country and the world, we derive a number of factors determining the success and efficiency of ACs. These are: i) The active participation of members; ii) The capacity of the management team of the cooperative; iii) Public transparency in the management of cooperatives; iv) Business activities match the needs of members; v) A large scale.
7.4.1 Participation of members
ACs are voluntary organisations, whose primary function is to serve the members. Participation of members is a decisive factor determining the success of ACs. The participation of members becomes evident in the following aspects: participation in management decisions on the AC’s issues; using the services of the ACs; capital contribution to the ACs.
To obtain the active participation of members: ACs must have public and transparent governance; members must be informed about the activities and finances of ACs; members must view ACs as their own organisation that serves them, and not as an organisation of the state that serves state agencies. There must be a team of good managers, with an experienced management selected by the members. The quality of service provided by cooperatives must be stable and at a competitive price.
Which farmers will participate in ACs?
Vietnamese farmers are characterised by small-scale producers. 88% of farmers have less than 1 ha of land (GSO, 2012). For many farmers, income from agricultural production accounts for only a small part of household income. In this position, joining ACs is less attractive unless the new ones provide services facilitating production (e.g. irrigation services). Therefore, ACs of
small-scale producers are less suitable. Larger-scale farmers are aware that ACs can operate effectively to serve them.
7.4.2 Capacity of AC managers
The capacity of staff, especially of the head of ACs, is key to the success of ACs. Many domestic and foreign research findings have confirmed this. AC management must have management skills, professional experience and enthusiasm. This management team should be trained and should be paid according to the market price of labour.
7.4.3 Public and transparent governance
Public and transparent governance are essential to attract the participation of members since ACs are voluntary economic organisations. Transparency means that the necessary regulations are in place, members are informed about the operational processes and financial expenditure of ACs, and are involved in decision-making on key issues. Another important factor to ensure the publicity and transparency of ACs is that ACs must be independently audited and the independent audit results made available to members.
7.4.4 Operations matching the needs of members
ACs function as providers of inputs and outputs serving members. The services that ACs can provide to households members include: supplying agricultural inputs (seeds, fertilisers, chemicals); crop production services (irrigation, tillage, pesticides, animal health, harvest; product output services (purchasing produce in trade linkage arrangements, product storage). When ACs develop, they can provide post-harvest services such as storage, processing and trade services.
These services can be provided by other stakeholders such as supply agencies, enterprises, traders and individuals. So AC services must compete with other stakeholders, especially in the field of inputs and crop production services. Most households need to be assisted to trade products. ACs apply sustainable farming practices (GAP, organic, 3R3I, 1M5R, ...), and build a brand name for products, which is very important but very difficult for market stakeholders to do. ACs are considered a success when they render good support for members when trading products.
7.4.5 Suitable scale of agricultural cooperatives
If ACs have only a few dozen household members, each household’s production scale will be difficult to develop. With such scale, if working properly under the 2012 law on cooperatives, ACs are able to provide households some crop production services that require major capital, but not on a huge scale (e.g. investment in combine harvesters, tillage machinery and so on), nor do they have enough income to pay a suitable salary to be able to hire a professional administrator. The small-scale ACs in the four provinces surveyed usually operate based on the enthusiasm of managers. As members of households have limited experience, so the ability of ACs to develop is limited.

STUDY REPORT / INTEGRATED COASTAL MANAGEMENT PROGRAMME
121120
8. Solutions for Development of Acs And Fgs And Promotion Of Linkage Between Rice Production And Trade
8.1 Approach to the development of ACs/FGs and linkage between production and trade
Viet Nam has been integrated deeply into the international economy, and competition is increasingly intense. As a result, enterprises have a crucial role in the success of the agricultural sector and international competition. Enterprises need to have high-quality products. These products must have assured food hygiene, be produced with sustainable farming methods, and meet certified standards. The volume of uniform products must be steady, and supplies for trade reliable. However, the scale of Vietnamese farmers is very small. This makes large-scale agricultural development difficult. In this situation, ACs/FGs play an important role as a bridge between enterprises and individual farmers to help farmers compete better in the market economy. Associating with the enterprises is also an opportunity for ACs/FGs to better fulfil their role of supporting households, demonstrate the value of ACs/FGs and promote their development. Therefore, the general approach is to combine the development of ACs/FGs with the LSRF approach and production-trade linkage. The following sections provide some specific views about the promotion of ACs/FGs, and the linkage between production and trade.
8.1.1 Finding a scale of linkage that matches the local conditions
The above analysis has shown that linkage between production and trade is best achieved with high-quality and high-selling-price rice, or rice varieties. Therefore, the government should only focus on supporting production-trade linkage in two cases: i) high-quality production on a large scale; ii) rice production that has a particular quality and brand name, but on a smaller production scale. In areas where it is hard to develop high-quality rice production on a large scale support should only be given to ACs/FGs producing in large fields. Enterprises do not have so much need for linkage for producing average-quality rice.
8.1.2 Deciding on whether development as AC or FG better fits capacity and operational management
At the small scale that many ACs currently have (small number of members, small area per member), with modest staff capacity, few operations generating added value and ACs playing only an intermediary role for member assistance without handling financial transactions, it will be more favourable if ACs convert into FGs. These ACs need to expand their scale. However, if they seek to expand scale, they will face many difficulties such as capacity limitation, lack of member activities, and lack of confidence of households in large-scale ACs beyond the scale of a village or hamlet.
In the current conditions, compared to enterprises, agencies and households, ACs have advantages. In relation to agricultural production, they perform a number of activities: i) providing inputs, ii) providing agricultural production services (irrigation, tillage, harvesting), iii) post-harvest services (transport, drying, primary processing) iv) applying general technical processes, v) building brand name (certified trademark) vi) trading products.
It is clear that ACs have more advantages in applying general technical processes and building a brand name. These are what agencies, enterprises and households can not do, or only at major cost. When applying general technical processes or building a brand name, ACs can help members produce more easily. The intermediary service of input supply is not too difficult for
ACs, because ACs can represent their members when negotiating with agencies and enterprises to provide members with a more preferential price. Performing production services requires ACs to have capital and transparent financial management. These are hard requirements but ACs can meet them if they manage finances publicly and transparently. The most difficult requirement is to organise services after harvest because this requires enormous capital and is only effective if the service is available to additional members.
If the organisation only applies general technical processes (LSRF), builds a brand name and signs product trading contracts, FGs can do this and establishing an AC is not necessary.
Therefore, the first step in assisting ACs is to help them determine their strategy so that they decide on whether they continue developing as an AC or FG.
8.1.3 Linkage between production and trade as a basis to promote the development of ACs/FGs
As the above analysis shows, ACs have advantages in applying general technical processes (LSRF) and building a brand name. These activities are hard or impossible for other actors to implement. ACs also have more benefits in organising consumption for members if there is a uniform production process or certified quality. Households can access from other actors other services such as input services which require capital on a large scale. It will be more favourable if ACs can organise these services by themselves. These operations require the consensus of all members. Therefore, our proposal is to support those ACs that engage in the LSRF process and production-trade linkage. Beside this support, it is necessary to help ACs upgrade their capacity and services.
In other words, the project supports only those ACs that have an LSRF process. Producing by this method can help them reduce production cost, create products of uniform quality and link with consumers conveniently. It can also reduce the effort of households because they believe in ACs.
8.1.4 Support to build capacity for the strategic success of ACs/FGs
Before supporting a specific AC, that AC must formulate its own development strategy that has the consensus of all members. If ACs can determine production and business operations, as well as the strategies to implement them, the government and ICMP may support those ACs. These supporting operations ensure that ACs have capacity and opportunities to implement the strategies proposed. Therefore, the support for each AC should be based on its current need and capacity.
8.2 Proposed AC model
The above analysis has shown that it is hard for the small-scale ACs to operate effectively and organise production support services. However, if the ACs have too many members that have small-scale production, it is harder to work and create confidence among members than in small-scale ACs. Therefore, we propose that ACs are developed with the following points in mind:
• ACs consist of members with large-scale production, who can be households or FGs. Each FG can be a member of an AC. The FG represent its members. The AC will be large-scale if it has many FGs.
• Beside production-focused FGs, ACs may have service-focused FGs as members. These FGs ensure that ACs can support both their producing and serving members.

STUDY REPORT / INTEGRATED COASTAL MANAGEMENT PROGRAMME
123122
• The most difficult problem of this model is the mechanism that apportions the functions, duties and economic benefits between the members who have different role in ACs.
• In this model, ACs play an intermediary role between the members if ACs can not organise public services. It is possible to have separate economic contracts among members in ACs (Loc Troi Group and Vinh Binh Cooperative model).
• The producing FGs are responsible for organising production according to the LSRF concept. ACs conduct negotiations, search for partners, provide supplies, and render drying and storage services.
8.3 Solutions for promoting rice production under the large scale rice field and production-trade linkage models
a. Policies on support for LSRF production, policies on support for production-trade linkage.
It is necessary to adopt policies to support LSRF production as in Bac Lieu. It is a fact that LSRF production helps reduce the cost of production and create products of reliable quality. It is more favourable for enterprises if there are many LSRFs. Experience from ACs in Duc Hue, Dong Thap has shown that after some production on LSRFs, enterprises were found to trade the rice of ACs.
The policies should provide more support to the enterprises.
b. Planning rice production area to assure high quality in connection with LSRF and trade linkage
Priority should be given to support for high-quality production and overall planning of means of transport and irrigation in order to create production-trade linkage with enterprises.
c. PPP implementation in trade rice linkage associated with LSRF production.
Implementing PPP in production-trade linkage to build large-scale and high-quality rice production. This increases the commitment and liability of the government and ensures that enterprises can invest in the linkage. In PPP, the local authority can commit to provide land to build factories and warehouses, with incentive levels under government agreement, to implement the general technical process.
Some local authorities, as in An Giang, can link with other provinces to develop regional rice production.
d. Development support for ACs/FGs
8.4 Solutions to build AC capacity and operations
This part presents solutions which provincial authorities and the ICMP project can implement to upgrade the capacity and operations of ACs.
8.4.1 Raising awareness among local government, AC managers and membership
Raising awareness about the position of ACs and the supporting role of government in AC development helps local authorities, managers and members to have a deeper understanding of the nature of ACs as an independent economic organisation, which serves the interests of members.
The methods:
• Local management agency should have not only managers but also have awareness-raising programmes.
• ICMP project communicates for ACs in order to implement linkage in production.
• It is suitable to link the communication with other educational programmes, but this content needs to be presented separately, with the attendance of local government, agricultural officers, managers and members.
• The content of discussion is the nature and position of ACs today, the role of government in relation to ACs, and the duties of members in AC development .
8.4.2 Training the state management staff on ACs
The state management staff are trained and retrained on management and assistance. In fact, in many places, the state management staff have not understood the nature of ACs under the 2012 law on cooperatives, with the result that they many experience difficulties in managing and supporting ACs.
Staff to be trained:
• The management staff in provinces, districts and offices that belong to the Department of planning and investment, the Department of agriculture and rural development; professional staff at district level at the Department of agriculture, Department of economy, Department of finance and planning.
• Staff who support ACs at province and district level: provincial federation cooperative staff, agricultural extension staff, plant protection, farmers’ union.
• Communal staff such as agricultural staff, agricultural extension staff. The goal is to help the staff understand the content and nature of ACs according to the 2012 law on cooperatives, in order to have suitable support and avoid excessive intervention of local government that may hinder the development of ACs.
Training content:
• For provincial and district staff: intensive training on: i) the process and procedure of new establishment and dissolution of ACs; ii) the policies of the state toward ACs; iii) counselling and supporting ACs.
• For communal staff: raising awareness about ACs, helping them understand the content and nature of ACs according to the 2012 law on cooperatives; the position of the Party and state on the development of ACs; the role of ACs in the following period. These activities help the staff support ACs better.
8.4.3 Training and using network of consultants
Many experiments and experience in Viet Nam have shown that it is necessary to have the support of consultants outside the ACs frequently in order to operate ACs effectively, especially in the first period of establishment. However, nowadays, there are few local experts who have knowledge, skills and experience. Therefore, the local authorities need to train a network of counselling staff who have enough knowledge and skills to support ACs. These consultants

STUDY REPORT / INTEGRATED COASTAL MANAGEMENT PROGRAMME
125124
must be able to train agricultural extension staff and the managers of ACs.
After that, the local authorities need to arrange the funding for these experts when they are called upon to support the development of ACs.
8.4.4 Training on governance and operation for managers
The following content needs to be trained: i) Knowledge about the necessary skills and tools to build the production and business plans that harness the advantages of ACs and foster project development; ii) Financial management needs to be public, transparent and efficient; iii) Governing operations transparently under necessary regulations and ensuring the mobilisation of member participation; iv) Market and commercial skills such as contract formulation and product promotion; v) Management and operational skills.
It is also useful to provide training on the methods to build a brand name for ACs.
The contents and methods are presented in the following table:
No. Content Detailed contents Methods
1 Drawing up production and business plans
• Must-have contents of a production plan
• Identifying the strengths and weaknesses of ACs
• Determining the opportunities for production and challenges faced by ACs
• Specifying strategies and production goals of ACs
• Drawing up a plan for production operations
• Steps to make sure members take part in and support the production plan
• Organise the class as follows: members of the board of directors, manager, the control board and secretary of ACs. There are members of some ACs in one class.
• Training course divided into 3 stages:
+ Stage 1: In-class (3 days)
• Give theoretical instruction but simultaneously emphasise members’ participation.
• Practice. In the course, members of each AC discuss together to draw up a production plan for their AC. For each content, participants themselves come up with ways to apply it in their cooperative.
+ Stage 2: implement the plan at partici-pant’s cooperative
• Participants discuss with their peers at their cooperative to make sure the proposed production plan is feasible.
+ Stage 3: In class
• Discuss and contribute ideas: The representative of ACs present their plan in front of their classmates and supervisor for constructive comments.
• After the training course: Cooperatives undertake to enhance their production plan and execute it.
No. Content Detailed contents Methods
2 Drawing up a production investment project
• Must-have contents of a production investment project
• Processes, steps to draw up a production investment project of cooperatives
• Skills to analyse the product market in terms of competitiveness and dominance over the product market
• Analysing the financing of the project and deciding to invest in it
• Skills, methods to organise, execute and manage the project
• Organise the class as follows: members of the board of directors, manager, the control board and secretary of cooperatives. There are members of some cooperatives in one class.
• Give theoretical instruction.
• Practice. In the course, members of each cooperative discuss together to draw up a production project for their cooperative.
• Discuss and contribute ideas: The representative of cooperatives present their project in front of their classmates and supervisor for constructive comments.
• After the training course: Cooperatives undertake to enhance their production project and execute it.
3 Financial and accounting management of ACs
• Regulations on finance and accounting in cooperatives
• Ways to take notes on accounts
• Ways to do tax reports
In class:• Give theoretical instruction.
• The contents are applicable to the financial and accounting operations of ACs.
• Discuss and contribute ideas: The representatives of cooperatives present their plan in front of their classmates and supervisor for constructive comments.
After the training course:• Cooperatives undertake to enhance their
production plan and execute it.
• The supervisor gives help and observes the execution of the project.
4 Cooperative governance
• Must-have regulations of cooperatives
• Content of these regulations
• Methods to mobilise members’ participation
Participants: chairman of the board of directors, managers; manager of the control board, head secretary
In class (3 days):• Give theoretical instruction.
• Participants have specific discussions with their cooperatives.
After class:• Supporting staff members help cooperatives
formulate regulations.

STUDY REPORT / INTEGRATED COASTAL MANAGEMENT PROGRAMME
127126
No. Content Detailed contents Methods
5 Management and operational skills
• Cooperative-management skill sets: teamwork skills, leadership skills, meeting-organising skills
• Skills to operate, manage and organise the activities in production projects of cooperatives
• Risk-management skills and methods to handle risks in the production activities of cooperatives
• Skills for internal control of cooperatives: control processes; control contents; ways to organise and deploy the control of cooperatives
• Organise the class as follows: members of the board of directors, manager, the control board and secretary of cooperatives.
• There are members of some cooperatives in one class; one training course lasts two days.
• In-class practice: participants form groups, each of which is a cooperative utilising tools and skills to manage their association and find suggestions applicable to the reality of their cooperative.
• Cooperatives present their results in class to discuss and share ideas with their classmates as well as training coach.
6 Knowledge of the market and product marketing
• Analysing product supply and demand; identifying the market segmentation of cooperatives
• Skills and tools to analyse the product market of projects
• Drawing up marketing strategies for products: pricing, product and distribution strategies
• Skills to negotiate and draw up the contents of contracts in product trading linkage
• Organise the class as follows: members of the board of directors, manager, the control board and secretary of cooperatives.
• There are members of some cooperatives in one class; one course lasts two days.
• In-class practice: participants form groups, each of which is a cooperative utilising tools and skills to analyse the product market and find suggestions applicable to their products or services.
• ACs present their results in class to discuss and share ideas with their classmates as well as training coach.
7 Building brand name and managing product quality
• Brand names, certificates of quality and brand-building methods
• Contents and processes to build a brand name and manage the product quality of cooperatives
• Ways to draw up a project to develop the brand name and certified quality for the products of cooperatives
• Skills to manage the brand name and maintain certified quality for the products of cooperatives
• Organise the class as follows: members of the board of directors, manager, the control board and secretary of cooperatives.
• There are members of some cooperatives in one class; one course lasts two days.
• In class:
+ Give theoretical instruction.
+ In-class practice: participants form groups, each of which is a cooperative identifying a brand name to build for their product; con-tents related to building their brand name and managing quality.
• Cooperatives present their results in class to discuss and share ideas with their classmates as well as training coach.
8.4.5 Assistance to implement production and business plans and establish necessary regulations
Experience has shown that most ACs need to be guided not only in theory but also in operation and management. In particular, it is necessary to have staff who have the knowledge and experience to support the operation of ACs regularly. The support period is from 12 to 24 months, but it can change depending on the capacity and need of each AC. In general, the supporting staff will cooperate with the management staff of ACs. They will help ACs in the following ways:
• Building production and business plan, production and business projects; organising to implement these projects.
• Formulating regulations for ACs.
• Guiding and helping ACs implement financial management and financial reporting.
8.4.6 Assistance to implement common technical processes and have quality certification
Assisting ACs to apply technical processes of sustainable farming (GAP, organic, etc.). Organising for all members to apply the same seeds and same farming process and techniques in order to assure uniform quality of products.
Supporting a part of capital for ACs to invest in facilities and service organisation. Some common services such as sowing, chemical spraying, harvesting, irrigation, etc.
8.4.7 Strengthening the role of public authorities
Local authorities need capacity-building to be able to monitor ACs in order to discover any illegal problems and find solutions. In particular, it is necessary to examine financial management and financial reporting to ensure that ACs operate legally. Moreover, local government should have a yearly audit programme that helps ACs manage their finances better.
The provinces should supplement the responsibilities of agricultural staff and agricultural extension staff in communes.
8.5 Solutions to support FGs
For FGs, some solutions are:
• Upgrading the capacity of the management staff of FGs, especially the chief. Some necessary skills concern developing production and business options, project development, regulations, financial management.
• Helping FGs develop into ACs. Guiding FGs to link together or develop into ACs. Selecting the staff who participate in supporting FGs to ensure that FGs are really in need and have the right strategy for developing into ACs.
• Assisting FGs to implement the collective farming process and sustainable farming practices and build a brand name.
• The public service systems have responsibility to support FGs operating and supervising this operation.

STUDY REPORT / INTEGRATED COASTAL MANAGEMENT PROGRAMME
129128
9. Conclusions9.1 Current situation of linkage between rice production and trade
Linkage between production and trade associated with the LSRF concept has been implemented since 2013. Provinces in the Mekong Delta have actively implemented it, but so far the total LSRF area associated with such linkage is limited.
There are some provinces with separate policies to support LSRF production associated with the application of sustainable farming processes but with the condition that there is linkage with trade. This approach makes it easy to develop the collective operation of ACs/FGs producing with common farming processes and using common services.
LSRF production has brought more economic benefits for members who set up this model than those who do not. The reason is that this model, in spite of being associated with sustainable farming practices and a reduction in fertilisers, pesticides and seeds, does not reduce yield. The uniform quality of the rice produced in this way makes it easy for ACs/FGs to find partners to trade products.
In the linkage with enterprises, ACs/FGs play an active role in negotiating with these enterprises and their production groups according to the agreed process with enterprises and monitoring the implementation. Many ACs/FGs organise LSRF production with a common process not only for their members, but also for non-members.
65% of ACs and 85% of FGs surveyed and having linkage received investment from these enterprises. They often advance money or seed rice, fertilisers and pesticides for farmers through ACs/FGs. Enterprises decide the seeds sowed. They have to pay to ACs/FGs a commission ranging from 20 to 200 VND/kg of rice in order that ACs/FGs implement the linkage in production using a common process. There is also a commission of 2% - 5% for the amount of fertilisers and pesticides used by ACs/FGs.
ACs/FGs implementing linkage receive support from the state, mainly in the form of training on applying sustainable farming techniques. However, the rate of ACs/FGs receiving seed rice, fertilisers and pesticides is very low.
Implementing LSRF production associated with linkage brings a profit higher by about 9% on average compared to that without linkage because of the application of sustainable farming processes that helps reduce production costs and increase selling prices. In addition to higher profits, 90% of ACs/FGs appreciate the stabilisation of rice consumption for their members.
ACs/FGs involved in favourable linkage enhance their relations to members as well as their capacity.
The linkage has brought benefits for both enterprises and households, but there are many difficulties in the linkage between production and trade because very few enterprises can afford to engage in such linkage. Therefore, ACs/FGs find it difficult to find partners with which to trade products. Where there is no production-trade linkage the incentive to produce rice under the LSRF concept is reduced.
Enterprises do not really expect to engage in linkage in production. This is because they lack sufficient financial resources for investment, the hard-earned stable market for high-quality
rice and especially current policies fail to encourage enterprises to participate in such linkage. Many enterprises exporting ordinary quality rice normally only have linkage covering a very small area that meets export conditions.
There is still a small number of farmers who break linkage contracts. However, breach of contracts tends to decrease when farmers are influenced by the spread of the concept. They have recognised the role of production-trade linkage with enterprises.
9.2 Current situation of the development of agricultural cooperatives and farmer groups
On average, there are only 77 members in one cooperative. 83% of ACs have less than 100 members. The average annual farming land area of a cooperative is only 160 ha. FGs have fewer members per group; 62.4% of FGs have less than 30 members. The total area of arable land of a member in an FG is 62 ha.
On average, 76% of members of a cooperative contribute authorised capital. Approximately 8.8% of members can still contribute more than the regulated 20% of capital. 25% of FGs have capital contributions, with about 76% of their members making contributions.
Most managerial staff of ACs/FGs are farmers whose education level is limited (nearly 90% of managerial staff of ACs finished high school level and below; this rate is 97% in FGs). Their participation in cooperative management is mainly based on their experience. Most managerial staff of ACs are not professional managers, so they fail to meet the requirements of governance as an autonomous independent economic organisation.
Many ACs also lack the necessary regulations for cooperative management in terms of operational regulations, financial regulations and control regulations. 33.8% of ACs have done annual tax reports. The ACs are not inspected and fined when they do not make annual tax reports, particularly in Bac Lieu. The best province in terms of auditing cooperative operation is An Giang, where only 47% of ACs have been audited in the past 3 years. Lack of management regulations, lack of financial statements and tax reports, and absence of audits have reduced the transparency of ACs, leading to a loss of trust among members.
Of the FGs surveyed 87% have a cooperation contract, but only 35% of them have operating regulations, 31% have regulations on financial expense accounting, and only 21% of them make financial statements. There are 13% of ACs whose contract has not been certified by the commune People’s Committees. The highest percentage is in An Giang.
The new ACs found out where to trade products for 45% of their members although the ACs surveyed are well evaluated.
The capital and assets of the ACs/FGs are small. On average, a cooperative has a total value of machines worth about 794 million VND while a farmer group has 69 million VND. Only 72% of the ACs surveyed have authorised capital contributions. On average, a cooperative has 337 million VND as its capital while a farmer group has 75 million VND. Because of low capital and low asset values, ACs/FGs have no property to mortgage in order to ask for loans. These ACs are deeply in debt.
Many ACs are established without authorised capital, and have neither operations nor revenue. They are established in response to the new rural criteria or to receive support from the state.

STUDY REPORT / INTEGRATED COASTAL MANAGEMENT PROGRAMME
131130
The new ACs mainly render services for production inputs. Services for the production and trade of products is limited due to lack of assets and investment capital, and by difficulty in finding enterprises with which to trade products. Many ACs/FGs play an intermediary role to support their members to buy supplies from agencies and enterprises, rather than undertaking direct supply of agricultural materials.
Most ACs are small-scale (fewer members, small areas of land managed by members, and low revenue). This scale is suitable only for the existing staff capacity and it is hard to expand the capacity of staff or resources in the current period.
The greatest difficulties encountered by the ACs/FGs are the limitation of management capacity, lack of capital, and narrow range of activities to serve members. Therefore, building capacity for staff of ACs/FGs helps ACs/FGs gain access to capital and find enterprises with which to trade products; this aspect was mentioned a lot in the survey.
9.3 Policies and solutions for local implementation
Linkage in production under the common LSRF process, while associating with enterprises to trade produce, is an opportunity for ACs/FGs to perform their role for their members. Trade is the stage most difficult for enterprises and households to implement. Therefore, implementation of linkage in production-trade products associated with supporting on development of ACs/FGs is united.
Development assistance for ACs/FGs should focus on the following: i) Organising production under a common technical process or LSRF or production-trade linkage; ii) Establishing a clear strategy and clear production and business plan; iii) Substantive support to ensure that ACs/FGs successfully implement development strategies; iv) Supporting large-scale cooperatives.
Localities need to be supported in production under the large-scale cooperative model with the participation of a variety of stakeholders such as large-scale households, FGs, agencies and enterprises. The enterprise model applied in the case of Loc Troi Group is a vivid example of how to plan collaboration with a cooperative.
Training to improve the capacity of ACs/FGs must include topics such as setting up production and business plans and production and business projects, establishing regulations, and financial and accounting governance. The training courses must be accompanied by direct support for staff of ACs/FGs in the same period in order to achieve successes.
The local authorities need to build capacity for commune staff (agricultural officers, agricultural extension officers) with regard to the content and methods to support ACs/FGs as well as regulations on responsibilities of commune support staff. Moreover, the local authority should have a programme to support audits of cooperatives.
There is a need to separate policies supporting LSRF production from linkage policies. Production-trade linkage should focus on regions producing high-quality rice or branded products. Support can promote unified planning of transport infrastructure and irrigation for such regions. PPP with enterprises can concentrate on production-trade linkage for those regions. When there is no linkage, the focus should be on application of the LSRF concept, whereby the number of rice varieties used should be limited in order to product rice of uniform quality and thus make it easier for enterprises to trade products.
10. ReferencesGSO, 2012. The survey of rural, agriculture and aquaculture in 2011. Statistical Publishing House, 2012.
State Bank, 2014. Decision on the pilot lending programme for agricultural development under resolution 14/2014 / NQ-CP of March 5, 2014 of the Government.
Prime Minister, 2013. Decision 62/2013 / QD-TTg dated October 25, 2013 of the Prime Minister on policies to encourage development of cooperation, linkage in production associated with the trade in agricultural products and building the large scale rice field.
Prime Minister, 2002. Decision 80/2002 / QD-TTg dated 24 June, 2002 of the Prime Minister on policies to encourage to trade agricultural goods through contracts.
Government, 2015. Decree 55/2015/ND-CP dated June 9, 2015 on the credit policy to serve the development of agriculture and rural areas.
An Giang Provincial People’s Committee, 2016, Decision No. 12/2016/QD-Committee dated February 2, 2016 on the provisions for expenditure supports policies to encourage the development, cooperation and linkage in production-trade of agricultural products, building the large scale rice field under decision No. 62/2013/QD-TTg of the Prime Minister for An Giang province.
Soc Trang Provincial People’s Council, 2012, Resolution No. 12/2012/NQ-HDND dated July 6, 2012 on the adoption of the development project of specialty rice production until 2015.
Soc Trang Provincial People’s Committee, 2015, Plan No. 23/KH-UBND dated March 17, 2015 of the Committee on Development of the large scale field in rice production period 2014-2025.
Ca Mau Provincial People’s Committee, 2015, Decision No. 30/2015/QD-UBND dated 17 May 2015 on provisions for expenditure supports policies to encourage the development, cooperation and linkage in production-trade of agricultural products, building the large scale rice field in Ca Mau province.

STUDY REPORT / INTEGRATED COASTAL MANAGEMENT PROGRAMME
133132
11. AppendixTable 11.1: Types of AC staff trained in Ca Mau, by training issue
(Unit: % of ACs)
Domain Issue
Man-age-
ment board
Super-visory board
Accoun-tant,
treasur-er
Techni-cian
2012 law on ACs
Nature of ACs and new points in the 2012 law on cooperatives 70.0 20.0 0.0 10.0
Regulation on organisation of ACs in accordance with the 2012 law on cooperatives 60.0 30.0 0.0 0.0
Asset and financial management (capital contribution, distribution of profit, of assets, …) 40.0 10.0 10.0 0.0
Re-registration in accordance with the 2012 law on cooperatives 30.0 0.0 0.0 0.0
AC management
Project development, business plan of ACs 60.0 10.0 0.0 0.0
Organisation, management, operation of business activities of ACs 40.0 0.0 0.0 0.0
Supervision, control of business activities of ACs 10.0 10.0 0.0 0.0
Methods to mobilise the participation and capital contribution of members in/to AC activities
20.0 0.0 0.0 0.0
Other 0.0 0.0 0.0 0.0
Trade, marketing
Brand building 10.0 0.0 0.0 0.0
Methods of market evaluation and analysis 10.0 0.0 0.0 0.0
Methods of product marketing 20.0 0.0 0.0 0.0
Contract negotiation 20.0 0.0 0.0 0.0
Financial management and accounting
Preparation of financial reports, tax reporting 10.0 0.0 10.0 0.0
Use of accounting software 0.0 0.0 0.0 0.0
AC bookkeeping 10.0 0.0 0.0 0.0
Techniques of agricultural production
Sustainable production process (VietGAP, organic,…) 30.0 0.0 10.0 0.0
1M5R, 3R3I 60.0 20.0 20.0 30.0
Other production process 60.0 30.0 10.0 20.0
Other 0.0 0.0 0.0 0.0
Source: Survey 2016.
Table 11.2: Types of AC staff trained in Bac Lieu, by training issue
(Unit: % of ACs)
Domain IssueManage-
ment board
Super-visory board
Accoun-tant,
treasur-er
Techni-cian
2012 law on ACs
Nature of ACs and new points in the 2012 law on cooperatives 100.0 60.0 50.0 0.0
Regulation on organisation of ACs in accordance with the 2012 law on cooperatives
100.0 60.0 40.0 0.0
Asset and financial management (capital contribution, distribution of profit, of assets, …)
80.0 30.0 40.0 0.0
Re-registration in accordance with the 2012 law on cooperatives 90.0 40.0 30.0 0.0
AC management
Project development, business plan of ACs 100.0 40.0 40.0 0.0
Organisation, management, operation of business activities of ACs 70.0 10.0 30.0 0.0
Supervision, control of business activities of ACs 40.0 50.0 10.0 0.0
Methods to mobilise the participation and capital contribution of members in/to AC activities
70.0 10.0 30.0 0.0
Other 0.0 0.0 0.0 0.0
Trade, marketing
Brand building 20.0 0.0 0.0 0.0
Methods of market evaluation and analysis 30.0 0.0 0.0 0.0
Methods of product marketing 30.0 10.0 0.0 0.0
Contract negotiation 30.0 0.0 10.0 0.0
Financial management and accounting
Preparation of financial reports, tax reporting 30.0 10.0 50.0 0.0
Use of accounting software 0.0 10.0 10.0 0.0
AC bookkeeping 20.0 0.0 40.0 0.0
Techniques of agricultural production
Sustainable production process (VietGAP, organic,…) 70.0 50.0 50.0 10.0
1M5R, 3R3I 90.0 80.0 70.0 10.0
Other production process 70.0 50.0 50.0 10.0
Other 10.0 10.0 10.0 0.0
Source: Survey 2016.

STUDY REPORT / INTEGRATED COASTAL MANAGEMENT PROGRAMME
135134
Table 11.3: Types of AC staff trained in Soc Trang, by training issue
(Unit: % of ACs)
Domain IssueManage-
ment board
Super-visory board
Accoun-tant,
treasur-er
Techni-cian
2012 law on ACs
Nature of ACs and new points in the 2012 law on cooperatives 96.7 16.7 10.0 0.0
Regulation on organisation of ACs in accordance with the 2012 law on cooperatives
80.0 10.0 6.7 0.0
Asset and financial management (capital contribution, distribution of profit, of assets, …)
63.3 3.3 13.3 0.0
Re-registration in accordance with the 2012 law on cooperatives 66.7 0.0 0.0 0.0
AC management
Project development, business plan of ACs 60.0 3.3 3.3 0.0
Organisation, management, operation of business activities of ACs 70.0 3.3 0.0 0.0
Supervision, control of business activities of ACs 30.0 20.0 0.0 0.0
Methods to mobilise the participation and capital contribution of members in/to AC activities
23.3 0.0 0.0 0.0
Other 6.7 0.0 0.0 0.0
Trade, marketing
Brand building 36.7 3.3 3.3 0.0
Methods of market evaluation and analysis 40.0 3.3 0.0 0.0
Methods of product marketing 33.3 3.3 0.0 3.3
Contract negotiation 60.0 13.3 6.7 0.0
Financial management and accounting
Preparation of financial reports, tax reporting 6.7 3.3 20.0 0.0
Use of accounting software 0.0 0.0 6.7 0.0
AC bookkeeping 10.0 0.0 26.7 3.3
Techniques of agricultural production
Sustainable production process (VietGAP, organic,…) 36.7 6.7 6.7 3.3
1M5R, 3R3I 66.7 20.0 20.0 6.7
Other production process 66.7 20.0 16.7 6.7
Other 6.7 3.3 3.3 0.0
Source: Survey 2016.
Table 11.4: Types of AC staff trained in An Giang, by training issue
(Unit: % of ACs)
Domain IssueManage-
ment board
Super-visory board
Accoun-tant,
treasur-er
Techni-cian
2012 law on ACs
Nature of ACs and new points in the 2012 law on cooperatives 11.0 86.7 70.0 50.0
Regulation on organisation of ACs in accordance with the 2012 law on cooperatives
12.0 90.0 53.3 23.3
Asset and financial management (capital contribution, distribution of profit, of assets, …)
13.0 63.3 46.7 43.3
Re-registration in accordance with the 2012 law on cooperatives 14.0 56.7 26.7 10.0
AC management
Project development, business plan of ACs 21.0 66.7 23.3 30.0
Organisation, management, operation of business activities of ACs 22.0 46.7 16.7 16.7
Supervision, control of business activities of ACs 23.0 13.3 46.7 13.3
Methods to mobilise the participation and capital contribution of members in/to AC activities
24.0 16.7 10.0 0.0
Other 25.0 0.0 0.0 0.0
Trade, marketing
Brand building 31.0 20.0 6.7 0.0
Methods of market evaluation and analysis 32.0 20.0 3.3 3.3
Methods of product marketing 33.0 16.7 0.0 0.0
Contract negotiation 34.0 50.0 13.3 3.3
Financial management and accounting
Preparation of financial reports, tax reporting 41.0 30.0 3.3 56.7
Use of accounting software 42.0 26.7 6.7 56.7
AC bookkeeping 43.0 20.0 0.0 46.7
Techniques of agricultural production
Sustainable production process (VietGAP, organic,…) 51.0 3.3 0.0 0.0
1M5R, 3R3I 52.0 50.0 36.7 16.7
Other production process 53.0 30.0 20.0 10.0
Other 61.0 6.7 0.0 0.0
Source: Survey 2016.

136

Imprint
Published byDeutsche Gesellschaft für Internationale Zusammenarbeit (GIZ) GmbH
Registered officesBonn and Eschborn, GermanyIntegrated Coastal Management Programme (ICMP)Room K1A, No. 14 Thuy Khue, Tay HoHa Noi, Viet Namwww.giz.de/en/worldwide/[email protected]
As atJune 2017
Design and LayoutIntegrated Coastal Management Programme (ICMP)
Photo creditsGIZ
EditorHoang Vu Quang
TextDr. Hoang Vu Quang; Nguyen Tien Đinh; Ngo Sy Đat;Hoang Minh Huy; Nguyen Van Ba.
GIZ is responsible for the content of this publication
On behalf ofAustralian Department of Foreign Affairs and Trade (DFAT)German Federal Ministry for Economic Cooperationand Development (BMZ)