
The role of f0 alignment in distinguishing intonation ...
65
Journal of Speech Sciences 3(1):3-67.2013 Available at: hhtp://www.journalofspeechsciences.org *Corresponding author: Dr. Laura C. Dilley, 116 Oyer Center, 1026 Red Cedar Rd, East Lansing, MI 48824-1220; [email protected]; 517-884-2255 (phone); 517-353-3176 (fax) The role of f0 alignment in distinguishing intonation categories: evidence from American English DILLEY, L. C.* HEFFNER, C. C. Michigan State University Abstract Under the autosegmental-metrical (AM) theory of intonation, the temporal alignment of fundamental frequency (F0) patterns with respect to syllables has been claimed to distinguish pitch accent categories. Several experiments test whether differences in F0 peak or valley alignment in American English phrases would produce evidence consistent with a change from (1) a H* to a H+L* pitch accent, and (2) a L* to a L+H* pitch accent. Four stimulus series were constructed in which F0 peak or valley alignment was shifted across portions of short phrases with varying stress. In Experiment 1, participants discriminated pairs of stimuli in an AX task. In Experiment 2, participants classified stimuli as category exemplars using an AXB task. In Experiment 3, participants imitated stimuli; the alignment of F0 peaks and valleys in their productions was measured. Finally, in Experiment 4, participants judged the relative prominence of initial and final syllables in stimuli to determine whether alignment differences generated a stress shift. The results support the distinctions between H* and H+L* and between L+H* and L*. Moreover, evidence consistent with an additional category not currently predicted by most AM theories was obtained, which is proposed here to be H*+H. The results have implications for understanding phonological contrasts, phonetic interpolation in English intonation, and the transcription of prosodic contrasts in corpus-based analysis. Keywords: intonation; fundamental frequency; autosegmental-metrical theory; tonal alignment; pitch accents __________________________________________________________________________________
Transcript of The role of f0 alignment in distinguishing intonation ...

Journal of Speech Sciences 3(1):3-67.2013
Available at: hhtp://www.journalofspeechsciences.org
*Corresponding author: Dr. Laura C. Dilley, 116 Oyer Center, 1026 Red Cedar Rd, East Lansing, MI 48824-1220;
[email protected]; 517-884-2255 (phone); 517-353-3176 (fax)
The role of f0 alignment in distinguishing intonation categories: evidence from
American English
DILLEY, L. C.* HEFFNER, C. C. Michigan State University
Abstract
Under the autosegmental-metrical (AM) theory of intonation, the temporal alignment of fundamental
frequency (F0) patterns with respect to syllables has been claimed to distinguish pitch accent categories.
Several experiments test whether differences in F0 peak or valley alignment in American English phrases
would produce evidence consistent with a change from (1) a H* to a H+L* pitch accent, and (2) a L* to a
L+H* pitch accent. Four stimulus series were constructed in which F0 peak or valley alignment was
shifted across portions of short phrases with varying stress. In Experiment 1, participants discriminated
pairs of stimuli in an AX task. In Experiment 2, participants classified stimuli as category exemplars using
an AXB task. In Experiment 3, participants imitated stimuli; the alignment of F0 peaks and valleys in their
productions was measured. Finally, in Experiment 4, participants judged the relative prominence of initial
and final syllables in stimuli to determine whether alignment differences generated a stress shift. The
results support the distinctions between H* and H+L* and between L+H* and L*. Moreover, evidence
consistent with an additional category not currently predicted by most AM theories was obtained, which is
proposed here to be H*+H. The results have implications for understanding phonological contrasts,
phonetic interpolation in English intonation, and the transcription of prosodic contrasts in corpus-based
analysis.
Keywords: intonation; fundamental frequency; autosegmental-metrical theory; tonal alignment; pitch
accents
__________________________________________________________________________________

DILLEY, L.C. & HEFFENER, C.C.
JoSS 3(1):3-67.
1. Introduction
A number of studies of speech prosody—that is, variations in fundamental frequency (cf. pitch),
intensity, and timing in speech—have attempted to explain the ways that prosody can be used to signal
differences in meaning, paralleling early studies in segmental phonology. One body of research over three
decades now shows that the timing, or alignment, of fundamental frequency (F0) peaks and valleys (i.e.,
maxima and minima) with respect to segments cues semantic distinctions in a number of languages (1-7).
While a number of research studies have shown consistent alignment of F0 turning points with respect to
the segmental string (7-12), these studies nevertheless demonstrate variability in F0 turning point
alignment to varying degrees. Overall, an examination of the literature reveals that gross differences in F0
turning point alignment of approximately a syllable in size or more are generally associated with
differences which most researchers would agree are clearly phonological, e.g., differences in focus (13,
14), in lexical accent (3, 5), and/or in semantic inference (4). In contrast, smaller differences in F0
alignment have often been shown to be associated with various kinds of phonetic or contextual factors,
including differences in vowel duration, speech rate, location of word boundaries, stress clash, syllable
affiliation, dialect, and others (7-9, 13, 15-19). These fine-grained, gradient F0 alignment differences have
generally not been shown to affect meaning or representation and are instead considered to arise from
differences of phonetic implementation, rather than phonological representation (17-19).
The present paper investigates how differences in F0 peak and valley alignment distinguish
categories of intonational prominence or “pitch accents” in American English, taking as a starting point
the framework of autosegmental-metrical (AM) theory (20-22). This paper also addresses the issue of
methodologies for studying intonation, such as the ToBI (Tones and Break Indices) transcription system
(23, 24) often used in transcribing prosody. It additionally presents new perspectives on the issue of which
differences in F0 alignment can be considered categorical and phonological versus gradient and phonetic.
AM theory has played a prominent role in empirical and theoretical work in language science for
more than 25 years. This theory is one of a class of discrete tone theories which crucially hold that the
phonological primitives of intonation contours are discrete tonal elements, that is, tones and/or tone levels
which are static in time, rather than dynamically changing. (See also 25, 26.) In contrast, rise/fall theories
hold that phonological distinctions are dynamic rises or falls conveying prominence or boundary
information; examples include the IPO approach (27), and the British school (e.g., 28, 29). Finally, hybrid
theories assume the existence of both dynamic as well as static tonal targets; a notable example is the
work of Xu and colleagues (16, 30-32). Note that the principles of intonational phonology used for
contrast depart from the principles traditionally used in segmental phonology regarding distinctions (33).
Rather, the intonational phonological approach is more informed by theories with their origins in the
cognitive psychology literature, such as exemplar-based theories of phonetic perception (34) and

The role of f0 alignment in distinguishing intonation categories: evidence from American English
JoSS 3(1):3-67
articulatory phonology (35, 36), wherein “fine phonetic detail” is seen as being of paramount importance
in determining mental representations of speech. These and allied approaches have been employed
effectively in understanding consonantal voicing (e.g., 37) and the perception of vowels (e.g., 38).
A significant body of phonetic evidence now shows that the alignment of F0 peaks and valleys
with respect to segmental landmarks is quite consistent, even under changes in speech rate (9-12, 30, 39,
40). Differences in F0 peak and valley alignment are frequently perceptually salient to listeners and often
cue meaningful distinctions (1-5). This evidence has led to consensus among researchers that F0
alignment data is best accounted for by theories which assume the existence of discrete tonal elements,
i.e., discrete tone and hybrid theories. (See, e.g., 11 for arguments and reviews., 31) Much of this phonetic
evidence has been interpreted as direct support for AM theory, which is widely held to afford a number of
advantages over many other discrete tone theories (9, 41), and which is based on mainstream work in
theoretical phonology (see especially 26, 42).
Given the prominent role that AM theory has played in theoretical and empirical work, including
research on corpora, it is perhaps surprising that many of the theory’s claims have not been carefully
evaluated. The present paper investigates some of AM theory’s assumptions about the relationship
between F0 alignment and intonational categories, focusing on the language and dialect for which the
theory was originally developed: American English. In the following, an overview of AM theory’s
assumptions is presented regarding the relationship between F0 alignment and pitch accents in American
English. Next, recent work is reviewed aimed at understanding factors which affect F0 alignment
consistency. Finally, methodological issues concerning the design of experiments testing AM theories’
predictions are considered.
1.1. The Role of F0 Alignment in Distinguishing Pitch Accents in AM Theory
According to AM theory, pitch accents are based on phonological high (H) and low (L) tones
which may occur singly or in bitonal combinations. Each type of pitch accent minimally consists of a
single “starred tone,” indicating that the H or L tone phonologically affiliates with a stressed syllable;
starred tones are notated with an asterisk next to the tone (e.g., H*, L*). There are two single-toned
accents: H* and L*. Other pitch accents are bitonal, meaning that an unstarred tone temporally leads or
trails the starred tone; for example, in bitonal L+H*, the H* tone is associated with the stressed syllable,
while the L+ temporally leads the H* and occurs on a weak metrical position. (See 43, 44 for alternative
proposals about phonological affiliation of tones.) The unstarred tones in pitch accents were originally
proposed to be realized at a fixed temporal interval around the starred tone due to phonological affiliation
with the starred tone of the accent (20). However, phonetic studies investigating the alignment of F0

DILLEY, L.C. & HEFFENER, C.C.
JoSS 3(1):3-67.
turning points reviewed above have suggested instead that unstarred tones affiliate with unstressed
syllables or with segments (12, 44).
Once the phonological string of pitch accents has been determined based on the speaker’s
intended message and the rules of phonological association of tones with respect to metrical and/or
segmental positions, AM theory assumes that the tones are turned into F0 contours via two kinds of
phonetic mechanisms. First, F0 scaling rules determine the absolute F0 level of each tone (20, 22, 45).
Second, continuous interpolation functions connect up the discrete tones in sequence. These interpolation
functions have been assumed to be either monotonic (i.e., strictly rising or strictly falling), or
nonmonotonic (e.g., falling-rising), depending on the sequence of tones in the local environment (20). In
this way, each single-toned or bitonal pitch accent is assumed to give rise to a characteristic set of F0
shapes, where categories are assumed to be critically distinguished based on the patterns of timing and
alignment of F0 peak and valleys with respect to stressed syllables. Because these patterns of timing and
alignment of F0 peaks and valleys are critical for distinguishing pitch accent categories, which are the
main topic of this paper, they are described in more detail in Section 1.1.1.
Assumptions within AM theory about the number and type of bitonal pitch accents underlying
English prominence-lending F0 shapes have changed over time. In the most recent version of the theory,
that associated with the ToBI intonation transcription system for (mainstream) American English (23, 24),
there are three bitonal pitch accents—L+H*, L*+H, and H+!H*—each with distinctive patterns of turning
point alignment with respect to stressed syllables. Note that H+!H* is actually a notational variant of the
H+L* accent proposed by Pierrehumbert (20); throughout this paper, H+L* will be the preferred notation
for this accent type. The so-called “downstepping” variants of pitch accent types, e.g., !H*, L+!H* and
L*+!H, are assumed to have identical F0 alignment characteristics compared with the respective non-
downstepping variant (24), so they are not considered here to constitute different “accent types”.
The current standard AM inventory thus consists of five pitch accents: the single-toned accents H*
and L*, together with bitonal L+H*, L*+H and H+L*. Originally, seven pitch accents had been proposed
in the inventory set forth for English by Pierrehumbert (20); the additional two accent types posited there
were H*+L and H*+H. One reduction in the inventory was the result of the merging of H*+L with H* in
the ToBI system, although the local F0 characteristics of these accents are assumed to be identical
anyway. In all versions of the theory, the L tone in H*+L is assumed to be “floating”, meaning that it has
no phonetic interpretation in terms of a low F0 valley or fall. Instead, the +L tone was assumed to trigger
downstep (i.e., lowering) of a following high accent in Pierrehumbert (20) and subsequent work. Another
reduction in the inventory was due to Beckman and Pierrehumbert (21), who eliminated the H*+H accent
from the English inventory in a footnote. Little empirical evidence exists about how many accents truly
underlie English intonation; for the most part, claimed distinctions have been based on descriptive
The role of f0 alignment in distinguishing intonation categories: evidence from American English
JoSS 3(1):3-67
evidence and theoretical arguments (but see 46, 47). The present paper aims to fill existing gaps by
providing empirical data bearing on how F0 turning point alignment distinguishes English intonational
categories. (The timing of high plateaus, which represent another possible manifestation of H tones (48),
will not be dealt with in this paper.)
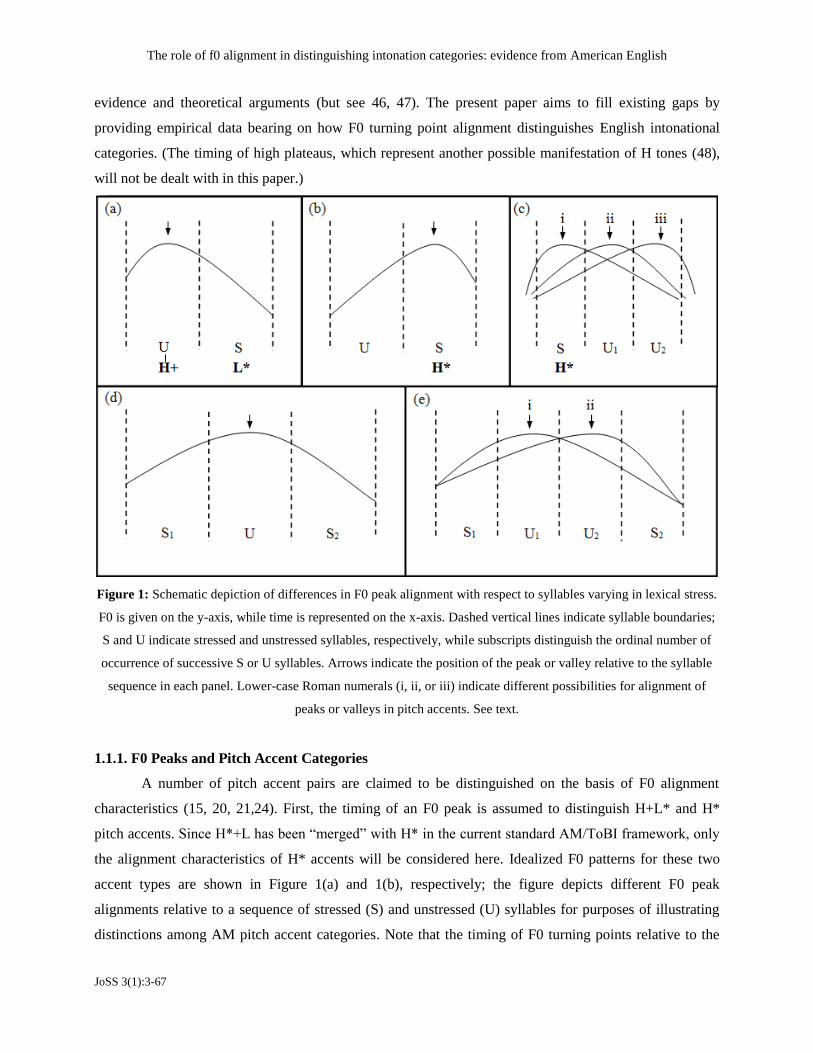
Figure 1: Schematic depiction of differences in F0 peak alignment with respect to syllables varying in lexical stress.
F0 is given on the y-axis, while time is represented on the x-axis. Dashed vertical lines indicate syllable boundaries;
S and U indicate stressed and unstressed syllables, respectively, while subscripts distinguish the ordinal number of
occurrence of successive S or U syllables. Arrows indicate the position of the peak or valley relative to the syllable
sequence in each panel. Lower-case Roman numerals (i, ii, or iii) indicate different possibilities for alignment of
peaks or valleys in pitch accents. See text.
1.1.1. F0 Peaks and Pitch Accent Categories
A number of pitch accent pairs are claimed to be distinguished on the basis of F0 alignment
characteristics (15, 20, 21,24). First, the timing of an F0 peak is assumed to distinguish H+L* and H*
pitch accents. Since H*+L has been “merged” with H* in the current standard AM/ToBI framework, only
the alignment characteristics of H* accents will be considered here. Idealized F0 patterns for these two
accent types are shown in Figure 1(a) and 1(b), respectively; the figure depicts different F0 peak
alignments relative to a sequence of stressed (S) and unstressed (U) syllables for purposes of illustrating
distinctions among AM pitch accent categories. Note that the timing of F0 turning points relative to the

DILLEY, L.C. & HEFFENER, C.C.
JoSS 3(1):3-67.
sequence of S and U syllables is the critical feature distinguishing pitch accent types, regardless of word
boundary locations; thus, a given string of stressed and unstressed syllables can consist of a variable
number of words and variable locations of word boundaries. Examples used in illustrating the distinction
between H+L* and H* typically have assumed the unstressed-stressed (US) syllable context shown in
Figures 1(a) and 1(b). For H+L*, a typical realization is a high F0 peak during a prestress syllable,
combined with a falling F0 during the following stressed syllable, as shown in Figure 1(a) (21, 24). In
contrast, H* typically involves a small rise across the prestress syllable or syllables to an F0 peak which
can occur either on the stressed syllable itself or during a poststress syllable (15, 24). For example, the
ToBI guidelines (11) state (p. 15): “…the actual timing of the F0 peak that realizes the high tone [for H*
as well as L+H*] can vary… the peak for the high tone can be quite late, sometimes after the actual
acoustic end of the syllable.” Moreover, Silverman and Pierrehumbert (15) conducted a production study
that examined variation in the timing of the F0 peak in high, rising accents (which they interpreted to all
be instances of H*) under different numbers of poststress, unstressed syllables. They documented that the
presence of unstressed syllables following a prenuclear high accent usually resulted in the peak’s
occurring well after the end of the stressed, accented syllable. The distinct alignment patterns illustrated
for this stress context have been described as “very salient perceptually” and as corresponding to “a clear
difference in interpretation” (21, p. 259). The phonological representations of these two accent types are
shown below the F0 contours in Figures 1 and 2. As we will see, the distinction between these two accents
is not so clear cut.
Distinguishing instances of H+L* and H* becomes complicated when one considers a wider
variety of stress contexts due to insufficient diagnostic criteria for discriminating between the two accents
afforded by existing AM descriptions. Recall that H* involves a rise to an F0 peak which may occur either
on the stressed syllable itself or trail on a poststress syllable. An illustration of the different possible
alignment patterns for H* is shown in Figure 1(c). Figure 1(c)-i depicts a “canonical” H* contour, in
which the F0 peak is aligned with the S syllable. In contrast, Figures 1(c)-ii and 1(c)-iii depict what are
assumed to be possible “variant” realizations of H*, in which the F0 peak trails the S syllable and is
temporally aligned with a post-stress, unstressed syllable. (Here, two unstressed syllables, U1 and U2, are
shown in sequence; throughout examples in Figures 1 and 2, subscripts distinguish the ordinal number of
occurrence of S or U syllables in sequence in cases where multiple stressed or unstressed syllables are
depicted.) Whether all the contours in Figure 1(c) are perceived as instances of the same accent type, H*,
has not been conclusively tested.
The ambiguity inherent to distinguishing instances of “variant” H* from instances of H+L*
becomes clear when considering stress contexts like those in Figure 1(d) and 1(e) in which there are two
stressed syllables, S1 and S2, occurring close to each other. In such cases, AM theoretic criteria for

The role of f0 alignment in distinguishing intonation categories: evidence from American English
JoSS 3(1):3-67
distinguishing the accent types are unclear, in contrast to situations in which the F0 peak falls on either S1
or S2, which would unambiguously be considered an instance of H* on the syllable with the peak.
Consider first the contour in Figure 1(d), in which an F0 peak is aligned with a U syllable between S1 and
S2. Is this contour an instance of H* (where the F0 peak arises from the starred H* tone on S1), or is it an
instance of H+L* (where the F0 peak arises from an unstarred H+ tone leading the L* on S2)? Cases
where a peak occurs on an unstressed syllable between two stressed, accentable syllables represent a well-
known point of criterial ambiguity for deciding between accent types within AM theory (49). An equally
challenging diagnostic context is depicted in Figure 1(e). Here, two unstressed syllables, U1 and U2, occur
in sequence between stressed syllables S1 and S2. Two distinct contours are also shown: Figure 1(e)-i
shows a contour with a peak aligned with U1, while Figure 1(e)-ii shows a contour with a peak aligned
with U2. Based on current AM and ToBI assumptions, there are three logical possibilities about
phonological category membership of these two contours, given a situation in which only one syllable
may be stressed: (a) both are instances of H*, (b) both are instances of H+L*, or else (c) the contour in
Figure 1(e)-i an instance of H* and the contour in Figure 1(e)-ii is an instance of H+L*. Though ToBI
labelers are given limited guidelines in such situations (based, for example, on impressionistic
determination of how delayed F0 peaks are with respect to syllables), the empirical basis for this guideline
has never been experimentally tested. Disentangling the various cases of H* from cases of H+L* and
attempting to validate the underlying categories is a goal of the present paper.
Note that the basic distinction between H+L* and H* has been supported by previous work. Redi
(47) created a continuum of F0 peak alignments ranging across a US sequence in the phrase To Monrovia.
In an imitation task, participants produced peaks which clustered according to two distinct alignment
patterns, consistent with the basic distinction between H+L* and H*. (See also 44.) Redi also found
preliminary evidence that speakers produced bimodal alignment patterns when imitating a continuum of
F0 peak alignment ranging across a SU syllable sequence in the nonsense phrase Too minglingly. In the
present work, that work is extended by examining perception and production of F0 peak timing for
additional stress contexts using more natural speech phrases.
One point which is implicit in the above discussion is that AM theory does not uniformly treat all
F0 peaks as direct surface realizations of underlying phonological H tones. This can be seen by contrasting
the contours associated with the categories of H+L* and H*. Recall that starred tones are phonologically
associated with stressed syllables under AM theory. Then in the case of H+L* (cf. Fig. 1(a)), the
correspondence between the phonetic F0 peak and the underlying phonological H+ tone is relatively
transparent, since the F0 peak is aligned with the same (unstressed) syllable on which the H tone is
assumed to occur temporally. In particular, for H+L* the unstarred tone (H+) occurs on a prestress, U
syllable, while the L* is phonologically associated with the S syllable (cf. Figure 1(a)). In contrast, in the

DILLEY, L.C. & HEFFENER, C.C.
JoSS 3(1):3-67.
case of H*, the correspondence between the phonetic F0 peak and the underlying phonological H* tone is
relatively less transparent and more abstract. This is most clearly illustrated in Figure 1(c), which depicts
different F0 contours that are typically treated as instances of H*. Evidence that such rising contours are
treated as H* in ToBI comes from the ToBI guidelines (11). Such rising contours are in theory candidates
to be analyzed either as L+H* or H*. The guidelines state the following:
“…the essential difference [between L+H* and H*] is what happens before the high tone. The
leading L tone in L+H* is meant to transcribe a rise from a fundamental frequency value low in
the pitch range that cannot be attributed to a L* pitch accent on the preceding syllable or to a L-
phrase accent or to a L% boundary tone at a preceding intermediate-phrase or intonation-phrase
boundary. For H*, by contrast, there is at most a small rise from the middle of the speaker’s voice
range…The distinction [between L+H* and H*] is difficult to make when the accented syllable is
the first in the utterance… In cases such as this, where the evidence for L+H* comes from
(theory-dependent) intuitions about meaning rather than from any clear low pitched region in the
fundamental frequency contour, the ToBI Annotation conventions prescribe H* instead…Even
when there is a long enough stretch between the beginning of the utterance and the accent, L+H*
can be difficult to distinguish from H* because the categorical distinction in meaning is not
always matched by a categorical distinction in the F0 level of the low tone…It is possible for even
intonational experts to be confused… (pp. 15-16)”
Evidence that contours such as those in Figures 1(c) are usually treated as H* is also consistent with
corpus data from Dainora (50) that H* is the most common accent in English (and thus by extension the
most common type of rising accent).
For all these variants of H* accents - including the three contours in Figures 1(c)-i, 1(c)-ii, and
1(c)-iii - the underlying H* tone is assumed to be phonologically associated with, and thus to temporally
co-occur with, the S syllable, so that the F0 peak may (cf. Figure 1(c)-i) or may not (cf. Figures 1(c)-ii and
1(c)-iii) be aligned with the same syllable as the H* tone is assumed to occur temporally. Distinctive
patterns of F0 transition (i.e., phonetic interpolation) are thus implied from the H*-tone-bearing, S syllable
to a following (accentual or boundary-related) tone for the three contours in Figures 1(c)-i, 1(c)-ii, and
1(c)-iii. (Note that for purposes of illustration, it is assumed that the following tone has a lower absolute
F0 and that it occurs temporally later than the window shown.) On the one hand, AM theory assumes that
for the contour in Figure 1(c)-i the H* tone on the S syllable gives rise to an F0 peak on the same syllable,
such that the F0 contour connecting the H* on the S syllable to the subsequent tone uniformly falls; the
interpolation in this case is thus monotonic. On the other hand, it is assumed that for the contours in
Figures 1(c)-ii and 1(c)-iii, the H* tone on the S syllable is followed by a transition which first rises to a
subsequent F0 peak on U1 or U2, respectively, and then falls to connect to the subsequent tone; in these
The role of f0 alignment in distinguishing intonation categories: evidence from American English
JoSS 3(1):3-67
cases, the interpolation from the H* on the S syllable to the following tone is thus nonmonotonic. One
goal of the present paper was to determine whether this nonuniform treatment of interpolation functions
for contours involving a high F0 peak is supported. If listeners perceive all peak positions depicted in
Figure 1(c) as instances of the same phonological category, it will support the current AM analysis of
different types of interpolation functions (as variably monotonic or nonmonotonic) following H starred
tones. On the other hand, if listeners perceive different peak positions in Figure 1(c) as instances of
different categories, it will suggest the need to reevaluate the nonuniform treatment of interpolation
functions.
1.1.2. F0 Valleys and Pitch Accent Categories
Next, consider that the F0 alignment of valleys is another source of potential ambiguity, as it is
assumed to distinguish several accentual categories. Three AM accents—L*, L+H*, and L*+H—
paradigmatically involve F0 valleys, although each of these accents can also give rise to other shapes. For
example, the L in L+H* or in L*+H may correspond to an “elbow”, i.e., a point of transition between a
level F0 plateau and a rise (24, 46). L* can also correspond to a low F0 plateau, e.g. in the context of a
string of L*’s (20). For variants of these accents with an F0 valley, the timing of the valley with respect to
stressed syllables distinguishes L+H* from the two other accent types. L+H* typically involves a
relatively sharp rise from an F0 valley on a prestress syllable in the lowest part of the speaker's pitch range
(20, 24). An example of canonical L+H* is shown in Figure 2(a); note the presence of the F0 valley on the
prestress unstressed syllable, U1. By contrast, both L* and L*+H correspond to contours with F0 valleys
on a stressed syllable. L*+H and L* can readily be distinguished from each other in the context of a
following low tone; in such a context, L*+H corresponds to a rise to an F0 peak, followed by a fall, while
L* corresponds to a fall or a plateau and thus has no F0 valley (20, 24). In the context of a following high
tonal element, however, as shown in Figure 2(b), it is generally not possible to distinguish L* from L*+H,
and the typical analysis is L*. Once more, this analysis is not presently experimentally grounded.

DILLEY, L.C. & HEFFENER, C.C.
JoSS 3(1):3-67.
Figure 2: Differences in F0 valley alignment with respect to syllables varying in lexical stress. F0 is given on the y-
axis, while time is represented on the x-axis. Dashed vertical lines indicate syllable boundaries; S and U indicate
stressed and unstressed syllables, respectively, while subscripts distinguish the ordinal number of occurrence of
successive S or U syllables.
Based on these descriptions, it should be possible to distinguish L+H* from L* through the timing
of an F0 valley relative to stressed syllables. Specifically, the valley should occur on a prestress syllable
for L+H*, but it should fall on a S syllable for either L* or L*+H. An F0 valley on a given U syllable thus
should signal an accent on an immediately following S syllable. Thus, in a S1US2 context as shown in
Figure 2(c), if an F0 valley is shifted from a stressed syllable (here, S1; cf. Figure 2(c)-i) to a post-stress U
syllable (cf. Figure 2(c)-ii), the category membership should likewise change from L* associated with S1,
to L+H* associated with S2. AM theory therefore predicts that the location of the pitch accent should shift
from S1 to S2. If an F0 valley is shifted from a U syllable (cf. Figure 2(c)-ii) to the following S syllable
(here, S2; cf. Figure 2(c)-iii), however, the category membership should range from L+H* associated with
S2, to L* associated with this same S2 syllable; in other words, there should be no change in the location of
the pitch accent for such a context, just its category. One goal of the present experiments was to test this
prediction of AM theory concerning shifts in the locations of pitch accents under shifts in F0 turning point
alignment.

The role of f0 alignment in distinguishing intonation categories: evidence from American English
JoSS 3(1):3-67
Little work has investigated distinctions among low accents. Pierrehumbert and Steele (46)
investigated the distinction L+H* and L*+H; in their stimuli, the L tone for each accent was realized as an
elbow, rather than a valley, while the H tone corresponded to a peak. The timing of the elbow-peak
sequence was shifted through a portion of the phrase Only a millionaire; the dependent measure in their
imitation study was the timing of the F0 peak. The results showed that participants were unable to
reproduce the continuum of alignments for the high peak; instead, most participants produced a discrete,
bimodal timing pattern of F0 peaks in their imitations. This was interpreted as supporting the distinction
between L+H* and L*+H categories. However, the study did not investigate the timing of the low portion
of these accents, leading to the question of whether categorical timing differences obtain for low tones as
well as high tones. Further, Pierrehumbert and Steele (46) had little to say about the origins of their
sentences or the speakers used in their study, and the various recordings of the critical phrase differed in
several other respects besides the intended variables of interest.
Redi (47) investigated this issue with respect to L* vs. L+H* accents in which an F0 valley was
shifted through two carrier phrases with final question intonation: To Monrovia? and They’re
nonlinguistic?. In an imitation task, participants failed to produce bimodal timing in F0 valleys in response
to the two stimulus series. This could either be taken as counterevidence to the distinction between L+H*
and L*, or it may have reflected a limitation of the specific stimuli used. A more recent study by Dilley
and Brown (51) demonstrated categorical differences in F0 valley alignment, but these categorical
differences were elicited in response to a pitch range continuum, not an F0 valley alignment continuum. In
sum, it is unclear whether listeners perceive differences in F0 valley timing as different pitch accent
categories, as claimed under AM theory.
1.1.3. Issues Addressed in the Present Paper
The above considerations lead to questions about which kinds of changes in F0 turning point
alignment are phonological (i.e., between-category and associated with changes in representation) and
which are phonetic (i.e., within-category and not associated with such changes). Given the evidence cited
at the beginning of this paper, F0 alignment differences of at least a syllable in size seem to consistently
give rise to categorical, phonological distinctions and/or meaning differences. However, the evidence has
not always been so clear. One study which addressed variability in F0 peak alignment in English was
Silverman and Pierrehumbert (15). This study investigated the effects of various contextual and phonetic
factors on the alignment of F0 peaks associated with prenuclear high (H*) accents, working from the
assumption that such effects arise solely from differences in phonetic implementation. Consistent with this
assumption, they found systematic shifts in F0 peak alignment as a function of vowel length, speech rate,
(see e.g., 34) and other factors. A regression model calculated from their F0 peak data suggested that the

DILLEY, L.C. & HEFFENER, C.C.
JoSS 3(1):3-67.
peak was preferentially aligned “past the end of the rhyme”, that is, into the following unaccented syllable
(p. 87). However, it was not clear from their data exactly how late the peak could be. Critically, the study
did not address how differences in degree of “peak delay” might affect the representation, and whether all
degrees of peak delay consistently arose from the same category. The study has sometimes been
interpreted as indicating that English permits substantial variability in F0 peak timing for H*, such that the
peak can occur even after a postaccentual vowel onset (24). This interpretation is questioned in the present
paper, where the hypothesis is put forward that differences of F0 turning point alignment timing on the
order of a syllable or more would be consistent with categorical, phonological differences of
representation.
Next, how should the distinction between phonological changes and phonetic changes be assessed
for intonation? In intonational phonology, it is well-recognized that meaning differences provide
incomplete or problematic criteria for diagnosing phonological category distinctions (52, 53). This has led
to the application of a number of alternative methods for the investigation of representational categories in
intonation, building upon theories that have differed from some of the approaches of classic segmental
phonology (see e.g., 34, 35, 54). One method which has been especially successful is an imitation task
(reviewed in 52), in which participants attempt to reproduce the continuous acoustic variation in stimuli
(44, 46, 47, 51, 55). Using prominence judgments (56-58) and semantic judgments (59-61) to study
intonational categories has met with mixed success (see 52 for a review).
Discrimination and identification tasks have frequently been used to study categories and
categorical perception in segmental phonology (cf. 62). The hallmark of categorical perception is a
discrimination maximum together with a crossover in identification at the same location along an acoustic
continuum (63). Discrimination and identification tasks may be especially useful in investigating
intonation categories, where the type and number of underlying contrasts is often unclear. (However, see
64., 65) A number of intonation studies previously have used discrimination and identification tasks to
help understand phonological representations (4, 66-71). However, such tasks have usually been used with
the express goal of determining whether classically-defined categorical perception can be obtained, rather
than to investigate the number of categories along a continuum per se.
The present experiments investigated the conditions under which variations in F0 peak and valley
timing give rise to categorical distinctions in American English. F0 peak and valley timing are studied
separately in the present paper, and no attempts to directly compare the two types of F0 contour are made,
though parallels are drawn where illustrative. Multiple methodologies were used in four experiments to
assess converging evidence for categories, as well as to determine the viability of discrimination and
identification tasks for studying the type and number of intonation contrasts. It was hoped that the results
would provide perspective regarding when F0 alignment differences are associated with distinct

The role of f0 alignment in distinguishing intonation categories: evidence from American English
JoSS 3(1):3-67
representations, as opposed to simply fine-grained, within-category phonetic variation. Experiment 1
utilized an AX (same/different) discrimination task to assess differential sensitivity to F0 alignment
differences, since the location of category boundaries can be illuminated by profiles of perceptual
sensitivity (63). Experiment 2 utilized a variation on a categorization task (i.e., an AXB identification
task) to assess how listeners assigned individual stimuli to categories. Experiment 3 involved an imitation
task in which participants attempted to reproduce F0 alignment differences as closely as possible. Finally,
Experiment 4 involved a relative prominence judgment task which provided an initial test of the
hypotheses that (1) a productive capacity of alignment differences in American English is to cue changes
in phrase-level relative prominence, and (2) that pitch accents in AM theory are associated with different
syllables, depending on F0 peak and valley alignment. In all these experiments, phonological categories
were examined within a single word, to eliminate the possibility that F0 alignment differences could be
attributed to factors other than the type of pitch accent (e.g., different boundary tone or phrase accent
configurations).
2. Experiment 1
Experiment 1 tested AM theory’s claims regarding the number and phonetic basis of phonological
categories when F0 peak and valley alignment was varied along a timing continuum through syllables
with different stress patterns. Each continuum of F0 turning points was created across a single word to
ensure that the distinct alignment patterns could be ascribed to different accent configurations, rather than
to other factors assumed within AM theory to affect alignment (e.g., different boundary tone or phrase
accent configurations). An AX discrimination task was used in which listeners responded whether pairs of
stimuli differing in F0 peak or valley timing sounded the same or different. By examining differential
patterns of discrimination accuracy, it was possible to identify locations of perceptual category
boundaries.
2.1. Methods
2.1.1. Design
A 4 × 3 within-subjects design was used. The first factor was stimulus series, with four levels
(millionaire, Lannameraine, lemonade, nonrenewable). Each stimulus series was based on distinct words
with specific stress patterns suited to testing either peak-related or valley-related accent categories, based

DILLEY, L.C. & HEFFENER, C.C.
JoSS 3(1):3-67.
on stress patterns outlined in Section 1.1 and represented in idealized form in Figure 1 which may be
ambiguous according to current AM theories of tonal phonology (e.g., stress patterns in which F0 peaks
may be variably interpreted as an H+L* tone or a ‘variant’ H* tone; stress patterns in which F0 valleys
may be interpreted as an L* tone or an L+H* tone). The varied lexical materials additionally were
expected to foster greater participant attention to the task. The second factor was the step size, which
referred to how many steps apart a given pair of stimuli were on a given trial; there were three levels (3-
away, 5-away, or 7-away) for stimulus pairs involving different stimuli (“different” pairs). For example, in
the 3-away condition, participants heard stimulus 1 in a given series paired with stimulus 4, stimulus 2
with 5, 3 with 6, etc. Step size was varied to ensure that for every block of stimuli, some pairs would be
clearly discriminable to all listeners. The 3-away stimulus series was expected to be the most informative
with respect to perceptual categories, since results from Dilley (44) had revealed that the 3-away step size
showed the most average variation in discriminability. The factors of stimulus series and step size were
thus fully crossed. Note that each level of stimulus series reflected a particular pairing of lexical material
with contour types (reflecting either F0 peak or F0 valley alignment differences); it was not the case that
all possible contour types were paired with all lexical sequences. This was because each lexical sequence
was suitable for testing only a subset of possible accent categories. Moreover, pairing each lexical
sequence with each type of F0 manipulation would have made the experiment prohibitively long.
The dependent measure was d’, the perceptual sensitivity index, which is a measure derived from
signal detection theory (72). This measure was selected because it provides a standardized, unbiased index
of perceptual sensitivity calculated from a hit rate and a false alarm rate. d' is obtained by transforming
participant hit rates (H) and false alarm rates (F) to z-scores and then calculating the difference, such that
d’ = z(H) – z(F). Of primary interest for testing accent categories was the number of local d’ minima and
maxima which were present in each stimulus series. A d’ maximum or minimum reflects stimulus pairs
which are heard as maximally or minimally discriminable, respectively, relative to surrounding stimulus
pairs; thus, a stimulus pair which incurs a d’ maximum or minimum likely traverses an individual stimulus
that corresponds to a category boundary or a category exemplar, respectively. d’ minima and maxima are
thus defined locally (as opposed to globally) as stimulus pairs representing locally low discriminability or
locally high discriminability, respectively, relative to the d’ levels of surrounding stimulus pairs. That is, a
local d’ maximum was a stimulus pair with a larger d’ score than either of its neighbors; a local d’
minimum was a stimulus pair with a smaller d’ score than either its neighbors. These were expected to
reflect stimulus pairs which were heard as maximally alike (and thus representative of the same
phonological category), in the case of d’ minima, or maximally different (and thus representative of
distinct phonological categories), in the case of d’ maxima.
The role of f0 alignment in distinguishing intonation categories: evidence from American English
JoSS 3(1):3-67
2.1.2. Participants
Participants were 20 students and staff (18 females, 2 males) at colleges in the Boston area. All
were 18 years of age or older and had self-reported native American English speaking abilities, normal
hearing, and a range of musical experience. Participants received a nominal sum for their participation.
2.1.3. Stimuli
Four stimulus series were constructed based on short phrases containing a target polysyllabic word
or pseudoword with a specific stress pattern. Each word or pseudoword was selected to investigate
accentual categories which were critically ambiguous under current formulations of AM theory, and all
contained a SUS or SUUS syllable sequence. To manifest the ambiguity in accentual categories (outlined
in Sections 1.1.2, 1.1.3, and Figures 1 and 2), it was necessary to find single words with ambiguous stress
patterns that would sound natural under multiple realizations of pitch-accent-to-syllable alignment in just
the situations predicted to be ambiguous in AM theory. The use of fixed lexical stress conditions, which
are more common in English than variable lexical stress conditions for individual lexical items, would
have undercut our attempts to test AM theoretic predictions by making lexically implausible some of the
predicted shifts in syllable-level affiliation of pitch accents, as fixed lexical stress items lack the critical
ambiguities under current AM theory that typify words with multiple possible strong syllables. Whether
changes in syllable-level affiliation of pitch accents was responsible for some or all evidence of distinct
categories was tested in Experiment 4.
It was of utmost importance that the ambiguous stress patterns be contained in a single word, such
that no target sequence contained or abutted a word boundary. This ensured that a F0 peak or valley could
not be attributed to word edge tones (phrase accents or boundary tones), which occur at the right edge of a
word (24). The predominant AM theories of intonational phonology are all be able to explain the presence
of shifts between intonational categories in continuum-spanning boundaries stronger than syllable
boundaries in terms of edge tones (phrase accents or boundary tones), which also can manifest as F0 peaks
or valleys (7, 8, 11); however, confining pitch accent ambiguities to within a single word in these stimuli
precluded a phonological interpretation that the F0 peaks or valleys arose from such edge tones. In
addition, the phrases used contained exclusively sonorant segments across the critical syllable sequence
over which an F0 peak or valley was shifted (i.e., the target sequence). Using only sonorant segments
ensured that F0 contours could be consistently measured and manipulated within the word, as sonorants
are reliably voiced throughout the duration of the consonant. In addition, a different phrase was used for
each stimulus series in order to reduce boredom and fatigue of subjects, as well as to reduce carryover
effects across blocks. Finally, the second series (the Lannameraine series, described below) alone
contained a SUUS syllable sequence, while the other three contained or consisted entirely of a SUS

DILLEY, L.C. & HEFFENER, C.C.
JoSS 3(1):3-67.
syllable sequence. The selection of a SUUS sequence for the lexical material for that series, paired with
the described manipulation to F0 peak timing, was made due to the greater ambiguity in phonological
interpretation afforded in AM theory for F0 peak alignment relative to pitch accent categories, compared
with F0 valley alignment. Each phrase was spoken by the first author and recorded in a sound-attenuated
room using a high-quality omnidirectional microphone. Phrases were low-pass filtered at 8 kHz and
digitized at 16 kHz direct to computer hard disk using in-house software (MARSHA v. 2.0, written by
Mark Tiede).
The first stimulus series (the millionaire series) was based on the phrase For a millionaire, spoken
with a H* pitch accent followed by a final low boundary tone (L-L%); the F0 peak was aligned with the
first syllable of mil-, and main stress was on the initial syllable. The stress pattern for millionaire is S1US2;
underlining indicates the critical syllable sequence for which the timing of the F0 peak was varied. This
word can have its main phrasal stress on either S1 or S2 in mainstream American English.
The second series (the Lannameraine series) was based on the phrase In Lannameraine, also
spoken with a H* pitch accent followed by a final low boundary tone (L-L%); the F0 peak was aligned
with Lan-, and main stress was on the initial syllable. Here, Lannameraine is a pseudoword pronounced
/lɑnəmɚreɪn/ which has a S1U1U2S2 stress pattern; the orthographic spelling of Lannameraine was chosen
so that either the first or last syllable could carry the main stress. A pseudoword was selected because no
familiar words in English consisted entirely of sonorant phonemes and had a S1UUS2 stress pattern where
either S1 or S2 could have main stress (and thus a pitch accent). Three graduate students in linguistics at
MIT verified that, on the basis of the orthography and pronunciation of the item as given in an IPA
transcription, either S1 or S2 could be the main stress syllable. Each graduate student was provided with a
survey that described Lannameraine as “an unfamiliar proper name” which was “a made-up word”. The
students were asked to indicate which syllable was likely to carry “the main (i.e., primary) stress, based on
your best guess of how the word would be pronounced.” The phonetic transcription /la nəmə reɪn/ was
provided. Four choices were then provided: (1) Lan- is the only possible main stress; (2) –raine is the only
possible main stress; (3) either Lan- or –raine might possibly be the main stress syllable; or (4) other, with
a blank provided for a response. All three students selected response (3). Note that both the millionaire
and Lannameraine stimulus series had F0 contours on prestress syllables which were high in the pitch
range and evidenced a rising contour. This precluded the possibility that any of the F0 contours in these
manipulations corresponded to a L+H* accent, which involves an F0 contour on prestress syllables that is
low in the speaker’s pitch range and/or remains flat or shows an F0 valley (11).
The third series (the lemonade series) was based on the phrase Some lemonade, spoken with a L*
pitch accent followed by a final high boundary tone (H-H%); the F0 valley was aligned with the end of

The role of f0 alignment in distinguishing intonation categories: evidence from American English
JoSS 3(1):3-67
lem-, and main stress was on the initial syllable. The stress pattern of lemonade is S1US2; in mainstream
American English this word can have primary stress (and thus a pitch accent) on either S1 or S2.
Finally, the fourth series (the nonrenewable series) was based on the phrase They’re
nonrenewable, spoken with a L* pitch accent and associated F0 valley on new-, followed by a final high
boundary tone (H-H%); the main stress was on the third syllable. The stress pattern of nonrenewable is
S1U1S2U2U3; S2 (new-) is the default main stress syllable in American English and S1 can carry primary
stress under contrastive emphasis. Unlike the other three series, the nonrenewable series included speech
material after the critical SUS/SUUS sequence; however, it is critical to note that in this experiment, and
in all subsequent experiments, the F0 contour across the last two syllables of this word was constant.
Manipulations only took place across the first SUS syllable sequence of this word, as for the other target
words. For this series, AM theory predicted no shift in syllable-level affiliation of the pitch accent.
To create each stimulus, the F0 contour for each phase was stylized using straight line
interpolation in Praat (73). These sequences correspond to an idealized version of typical intonation
patterns found in naturally-produced sentences. However, it is thought that they still represent sentences in
the scope of normal variation for prosodic contours. The F0 peak or valley for the stimulus, along with the
other F0 transition points in the critical syllable sequence (i.e., intersections of line segments), were then
shifted in 30 ms increments through the critical syllables, leading to a different number of steps for each
series. For the millionaire series, an F0 peak was shifted through /mɪljən/, creating 13 stimuli (Figure
3(a)). For the Lannameraine series, an F0 peak was shifted through /lɑnəmɚ/, creating 18 stimuli (Figure
3(b)). For the lemonade series, an F0 valley was shifted through /lɛmən/, creating 10 stimuli (Figure 3(c)).
Finally, for the nonrenewable series, an F0 valley was shifted through /rənu/, creating 13 stimuli (Figure
3(d)). F0 values associated with numbered time points shown in Figure 3 are given in Table 1; these
numbered points also indicate F0 values which were connected by straight line segments to stylize
contours for each series. These points were selected in order to capture in stylized fashion the natural F0
variation present in the original stimuli, while giving rise to a series of time points for which the F0 values
of key portions of the contour could be systematically manipulated. Stimuli in the lemonade and
nonrenewable series were preceded by level F0 in prenuclear position, since it was judged by the author
that the result sounded more natural than the falling prenuclear contour used in Redi (47); it was
hypothesized that this change would increase the likelihood that listeners would interpret stimuli in a
categorical way. The PSOLA algorithm (74) was used for resynthesis using default options as
implemented in Praat.

DILLEY, L.C. & HEFFENER, C.C.
JoSS 3(1):3-67.
Figure 3: Stimuli used in the present experiments. The phrases for each series are as follows: (a) For a millionaire
(millionaire series), (b) In Lannameraine (Lannanameraine series), (c) Some lemonade? (lemonade series), and (d)
They’re nonrenewable? (nonrenewable series). Numbered points indicate F0 values which were connected by
straight line segments to stylize contours for each series (cf. Table 1), generally selected based on segmental
properties of the stimulus. A time-aligned IPA transcription of each phrase is shown below each series, along with
designation of the stressed (S) and unstressed (U) syllables in each phrase. Underlined segments and syllables
indicate the critical portions of each phrase over which F0 points were shifted in time. Subscripts enumerate ordinal
numbers of S or U syllables in the target word of each phrase.
The role of f0 alignment in distinguishing intonation categories: evidence from American English
JoSS 3(1):3-67
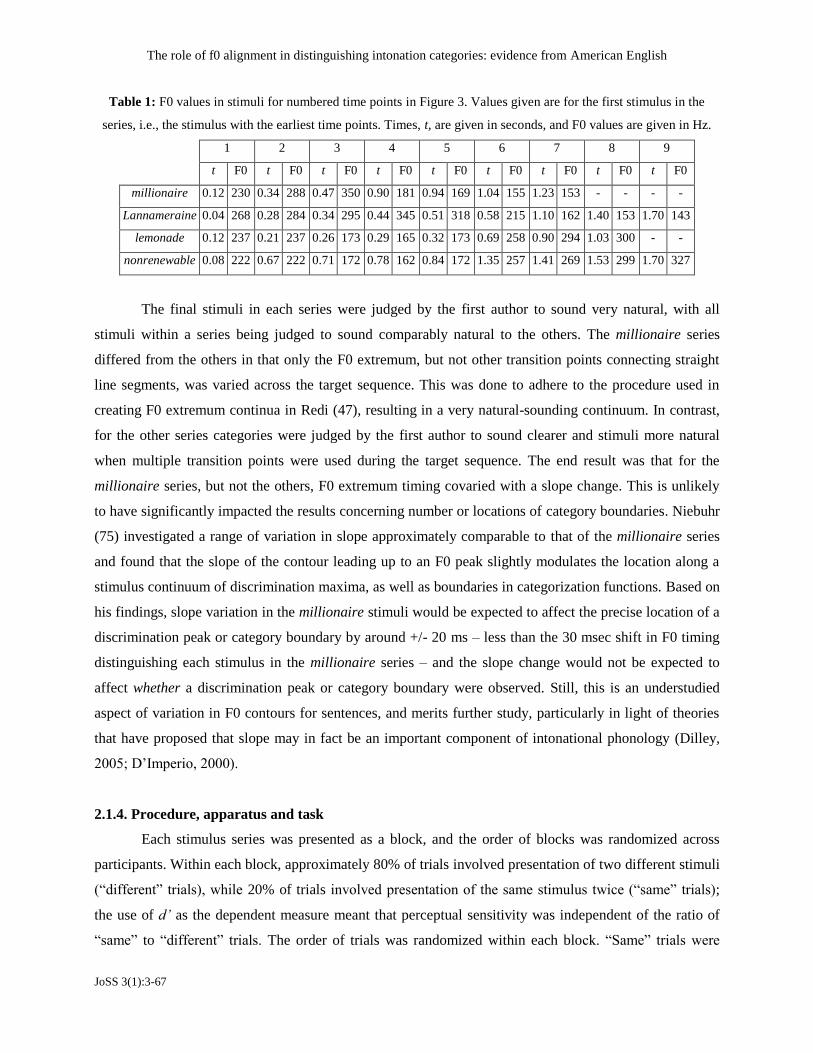
Table 1: F0 values in stimuli for numbered time points in Figure 3. Values given are for the first stimulus in the
series, i.e., the stimulus with the earliest time points. Times, t, are given in seconds, and F0 values are given in Hz.
1 2 3 4 5 6 7 8 9
t F0 t F0 t F0 t F0 t F0 t F0 t F0 t F0 t F0
millionaire 0.12 230 0.34 288 0.47 350 0.90 181 0.94 169 1.04 155 1.23 153 - - - -
Lannameraine 0.04 268 0.28 284 0.34 295 0.44 345 0.51 318 0.58 215 1.10 162 1.40 153 1.70 143
lemonade 0.12 237 0.21 237 0.26 173 0.29 165 0.32 173 0.69 258 0.90 294 1.03 300 - -
nonrenewable 0.08 222 0.67 222 0.71 172 0.78 162 0.84 172 1.35 257 1.41 269 1.53 299 1.70 327
The final stimuli in each series were judged by the first author to sound very natural, with all
stimuli within a series being judged to sound comparably natural to the others. The millionaire series
differed from the others in that only the F0 extremum, but not other transition points connecting straight
line segments, was varied across the target sequence. This was done to adhere to the procedure used in
creating F0 extremum continua in Redi (47), resulting in a very natural-sounding continuum. In contrast,
for the other series categories were judged by the first author to sound clearer and stimuli more natural
when multiple transition points were used during the target sequence. The end result was that for the
millionaire series, but not the others, F0 extremum timing covaried with a slope change. This is unlikely
to have significantly impacted the results concerning number or locations of category boundaries. Niebuhr
(75) investigated a range of variation in slope approximately comparable to that of the millionaire series
and found that the slope of the contour leading up to an F0 peak slightly modulates the location along a
stimulus continuum of discrimination maxima, as well as boundaries in categorization functions. Based on
his findings, slope variation in the millionaire stimuli would be expected to affect the precise location of a
discrimination peak or category boundary by around +/- 20 ms – less than the 30 msec shift in F0 timing
distinguishing each stimulus in the millionaire series – and the slope change would not be expected to
affect whether a discrimination peak or category boundary were observed. Still, this is an understudied
aspect of variation in F0 contours for sentences, and merits further study, particularly in light of theories
that have proposed that slope may in fact be an important component of intonational phonology (Dilley,
2005; D’Imperio, 2000).
2.1.4. Procedure, apparatus and task
Each stimulus series was presented as a block, and the order of blocks was randomized across
participants. Within each block, approximately 80% of trials involved presentation of two different stimuli
(“different” trials), while 20% of trials involved presentation of the same stimulus twice (“same” trials);
the use of d’ as the dependent measure meant that perceptual sensitivity was independent of the ratio of
“same” to “different” trials. The order of trials was randomized within each block. “Same” trials were

DILLEY, L.C. & HEFFENER, C.C.
JoSS 3(1):3-67.
drawn from the entire stimulus series for a given block. The identity of stimuli in “same” trials was
determined by random selection from all stimuli in a given stimulus series, with the number of “same”
trials determined by the 4:1 ratio of “different” to “same” trials for each stimulus block. Using a ratio of
4:1 for “different” vs. “same” trials was done to keep the experiment to around an hour in length. In
particular, each stimulus was presented as part of a “same” trial between 0 and 3 times across the whole
experiment, with a mean of 1.9 times per stimulus. For “different” trials, step size and the distinct identity
of stimulus pairs was randomized from trial to trial. Each “different” stimulus pair was presented four
times during a block; this was done to obtain a more accurate representation of the perceptions of each
subject for each level of step size, thereby reducing between-subjects variability and increasing the power
of the experiment to detect effects of the manipulation. The order of presentation of the two stimuli for
each “different” pair was counterbalanced across presentations. For example, stimulus 1 was followed by
stimulus 4 on two presentations within each block, while the reverse was true on the other two
presentations. The notation (x,y) will refer to either ordering of stimuli x and y in a given trial. The inter-
stimulus-interval between the two members of a pair of “same” or “different” stimuli was 250 ms.
An AX (same-different) task was used. Stimuli were presented over studio-quality headphones in
a sound-attenuated booth via a computer running MATLAB software (The MathWorks, Inc.). On each
trial, participants heard a pair of stimuli and were instructed to decide whether the two sound files were
the same or different. They responded by using the computer mouse to click the appropriate box labeled
“same” or “different” on the computer screen and then clicked a box to proceed to the next trial. Ten
practice trials preceded each block of experimental trials. The number of trials in the millionaire,
Lannameraine, lemonade, and nonrenewable blocks was 120, 195, 75, and 120, respectively. The order of
the four blocks was randomized for each participant. Participants were given short breaks between each of
the four blocks. The entire experiment lasted about an hour. Due to a computer error, the data for only the
nonrenewable series from one participant were lost. For each subject, a hit rate, described as correctly
responding “different” to a “different” trial, and an average false alarm rate, described as incorrectly
responding “different” to a “same” trial, were calculated. These measures were then used to calculate d’
for each condition (i.e., the pairing of each level of stimulus series with each level of step size).
2.2. Results and Discussion
2.2.1. Effects of step size and stimulus series on discrimination

The role of f0 alignment in distinguishing intonation categories: evidence from American English
JoSS 3(1):3-67
Figure 4: Perceptual sensitivity, d’, as a function of stimulus series and step size (3-away, 5-away, or 7-away) for
Experiment 1.
Figure 4 shows average d’ values for all 3-away, 5-away and 7-away stimulus pairs for each
stimulus series. As expected, d’ increased with larger step sizes. Moreover, there were differences in
discriminability across series. A two-way repeated measures ANOVA on d’ values, with stimulus series
and step size as factors, confirmed a main effect of step size, F(2,38) = 79.360, p < .001, a main effect of
stimulus series, F(3,57) = 35.881, p < .001, and a significant interaction between step size and stimulus
series, F(6,114) = 8.658, p < .001. To further explore differences in d’ across series, a one-way ANOVA
with stimulus series as the factor was carried out on d’ values averaged across all step sizes. The ANOVA
showed a significant effect of stimulus series, F(3,57) = 38.459, p < .001. Follow-up two-tailed, paired-
samples t-tests with Bonferroni correction to control familywise Type I error rate showed significant
differences between each pair of stimulus series, t(19) ≥ 3.525, p < .005 for all, except for millionaire vs.
lemonade, t(19) = 1.749, p = .096. Differences in discriminability across series may reflect physical
differences in the speech, including duration, F0 slope, and so on, all of which have been shown to affect
perception of F0 in speech (5, 76-78). Differences across series may also reflect inherent differences in
discriminability of F0 peaks vs. valleys (70, 79), distinct segmental compositions and associated
interactions with pitch (5, 80, 81), the precise distribution of the alignment of peaks and valleys with steps
and syllables across conditions, or possibly other factors.
0
0.5
1
1.5
2
2.5
3
Lannameraine millionaire lemonade nonrenewable
Stimulus series
d'
3-away
5-away
7-away

DILLEY, L.C. & HEFFENER, C.C.
JoSS 3(1):3-67.
2.2.2. Locations of d’ maxima and minima for each stimulus series
Of primary interest for testing hypotheses about accent categories was the number of local d’
minima and maxima in each stimulus series. d’ minima and maxima were expected to reflect stimulus
pairs which were heard as maximally alike (and thus representative of the same phonological category) or
maximally different (and thus representative of distinct phonological categories), respectively. Therefore,
finding statistically significant differences between a successive d’ minimum and maximum would
reinforce the interpretation of these stimulus locations as spanning stimuli which were category exemplars
and category boundaries, respectively. Inspection of d’ for stimulus pairs across series revealed that, as
expected, 3-away stimulus pairs showed the greatest numbers of d’ maxima and minima. The remainder of
the analysis therefore focuses on results from the 3-away step size for each series. The shapes of d’ curves
for 5-away and 7-away series were similar to those of the 3-away series, in particular by showing
comparable locations of peaks and valleys to those of the 3-away series but with a general flattening of the
curves associated with the overall higher d’ values due to the larger step sizes. Statistical analyses were
two-tailed, paired-samples t-tests on stimulus pairs representing successive local d’ maxima and minima,
in order to investigate category exemplars and boundaries. Bonferroni corrections were applied on all
comparisons for a given stimulus series, holding familywise Type I error rate to p < .05 for each series.
The role of f0 alignment in distinguishing intonation categories: evidence from American English
JoSS 3(1):3-67
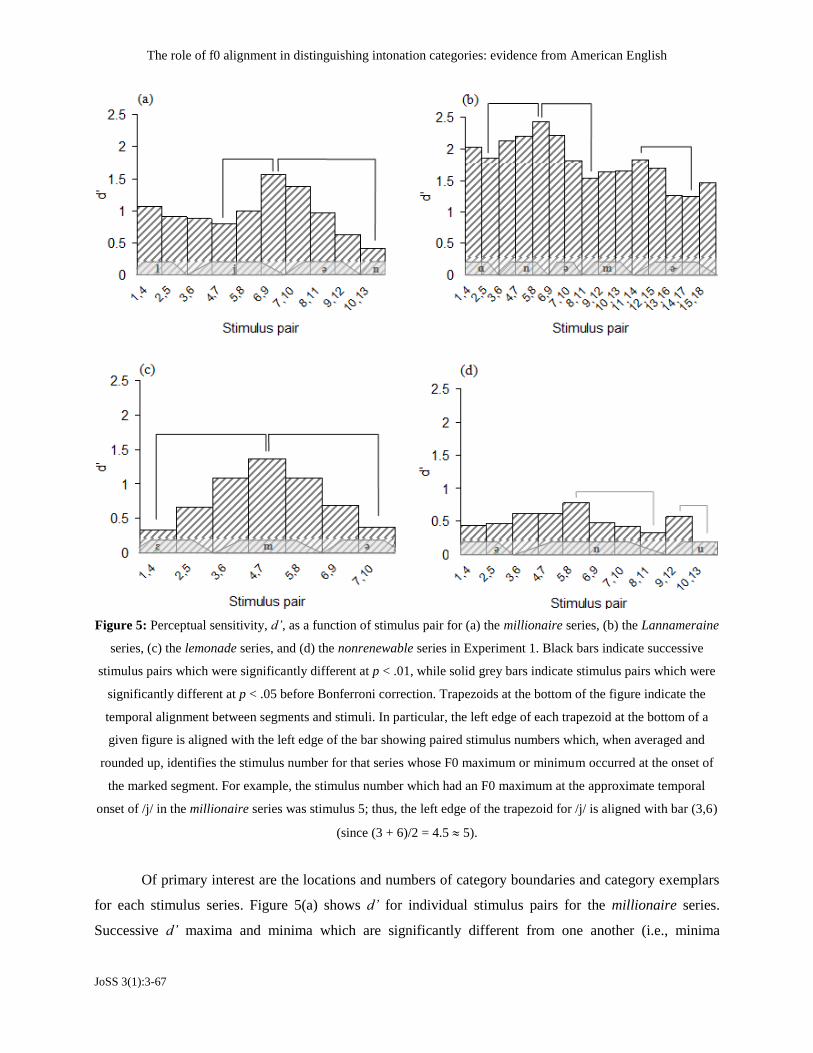
Figure 5: Perceptual sensitivity, d’, as a function of stimulus pair for (a) the millionaire series, (b) the Lannameraine
series, (c) the lemonade series, and (d) the nonrenewable series in Experiment 1. Black bars indicate successive
stimulus pairs which were significantly different at p < .01, while solid grey bars indicate stimulus pairs which were
significantly different at p < .05 before Bonferroni correction. Trapezoids at the bottom of the figure indicate the
temporal alignment between segments and stimuli. In particular, the left edge of each trapezoid at the bottom of a
given figure is aligned with the left edge of the bar showing paired stimulus numbers which, when averaged and
rounded up, identifies the stimulus number for that series whose F0 maximum or minimum occurred at the onset of
the marked segment. For example, the stimulus number which had an F0 maximum at the approximate temporal
onset of /j/ in the millionaire series was stimulus 5; thus, the left edge of the trapezoid for /j/ is aligned with bar (3,6)
(since (3 + 6)/2 = 4.5 5).
Of primary interest are the locations and numbers of category boundaries and category exemplars
for each stimulus series. Figure 5(a) shows d’ for individual stimulus pairs for the millionaire series.
Successive d’ maxima and minima which are significantly different from one another (i.e., minima

DILLEY, L.C. & HEFFENER, C.C.
JoSS 3(1):3-67.
followed by maxima, or maxima followed by minima, with a significant difference in their d’ scores) at p
< .001, t(19) ≥ 4.097 are marked with solid black brackets. Participants found discrimination between
stimuli (4,7) and (10,13) most challenging, as indicated by the d’ minima at those two points, which
suggests that each pair of stimuli has individual stimulus steps which are members of the same perceptual
category as the other member of the same pair for these participants.
Furthermore, it was possible to infer for each pair of stimuli giving rise to a local d’ minimum
which stimulus or stimuli corresponded to the category exemplar(s) following simple assumptions. Note
for a given d’ minimum which was generated by a stimulus pair with three steps of separation—such as
(4,7) for the millionaire series—stimuli with intermediate physical characteristics and thus just a single
step of physical separation—namely, (5,6)—are expected to be equally discriminable or less discriminable
(i.e., equally similar or more similar) than (4,7) had been, so that either stimulus 5 or 6 should be just as
representative or even more representative of the category than either 4 or 7. Based on this same logic, any
stimulus pair which did not give rise to a local d’ minimum—for example, (5,8)—should by definition be
more discriminable than a nearby pair that did generate a d’ minimum, so that the non-minimum pair
should contain stimuli that are not as representative of the same category as the pair that gave rise to the d’
minimum. Thus, it could be inferred that the local d’ minimum at (4,7) corresponded to a category
exemplar at stimulus 5 or 6, and that the local d’ minimum at (10,13) corresponded to a category exemplar
at stimulus 11 or 12.
However, local d’ minima alone are not enough to indicate that listeners perceive two categories
for millionaire, since they may hear the stimuli as members of one category only, perhaps without a well-
defined exemplar. Finding a d’ maximum between two successive d’ minima would indicate that listeners
not only encode two possible exemplars in the pair continua but also differentiate those two exemplars
from each other. For millionaire, there was, in fact, a local maximum at (6,9), between the minima at (4,7)
and (10,13), which suggests that stimuli 6 and 9 belong to distinct perceptual categories. Moreover, the
local maximum at (6,9) is significantly different from (4,7) and (10,13). We here made the reasonable
assumption that the boundary between the two perceptual categories lies mid-way between stimuli 6 and
9, so that stimuli 6 and 7 likely belong to one category and 8 and 9 probably belong to another category.
Thus, the point of transition from one category to the other along the stimulus continuum occurs at about
stimulus 8.
Next, Figure 5(b) shows d’ for individual stimulus pairs for the Lannameraine series. Stimulus
pairs which are significantly different from one another at p < .008, t(19) ≥ 2.996 are marked with solid
black brackets. There are three local minima at (2,5), (8,11), and (14,17). The difference between the
minimum at (8,11) and the maximum at (11,14) missed significance (p = .173), but the preponderance of
evidence following the logic outlined for the millionaire sequence suggests that this series spans up to

The role of f0 alignment in distinguishing intonation categories: evidence from American English
JoSS 3(1):3-67
three pitch accent categories. The best exemplars for these three categories are in the range 2-5, 8-11, and
14-17. By further extension, the two local maxima at (5,8) and (11,14) indicate that there are two category
boundaries, which occur somewhere between stimuli 5-8 and stimuli 11-14, implying that there are a total
of three categories in the Lannameraine stimulus continuum. The first category boundary thus occurs
approximately between stimuli 6 and 7, the middle stimuli between the pair of stimuli giving rise to the d’
maximum at (5,8); the F0 peak for stimulus 7 occurs just after the vowel onset of the second syllable in
Lannameraine. Moreover, the second category boundary lies approximately between stimulus 12 and 13,
the middle stimuli between the pair of stimuli giving rise to the d’ maximum at (11,14); the F0 peak for
stimulus 13 occurs just after the vowel onset of the third syllable in Lannameraine. Note that a significant
motivation of the present paper was the hypothesis that three categories exist in Lannameraine, not two;
this contrasts quite directly with most AM theories of tonal phonology, which can only accommodate two
categories. As a tentative step, the category H*+H is proposed for this third category not predicted by AM
theory. In Section 6.3 we discuss the pitch accent categories that may populate the Lannameraine series.
Figure 5(c) shows d’ for individual stimulus pairs for the lemonade series. Stimulus pairs which
are significantly different from one another at p < .001, t(19) ≥ 4.586 are marked with solid black
brackets. There are two local minima at (1,4) and (7,10), indicating at most two categories for this series;
best exemplars for these categories are in the range 1-4 and 7-10. The local maximum at (4,7) further
indicates that a category boundary lies in the range of stimuli 4-7, implying that two categories exist
within lemonade. This suggests that the crossover from one category to the other is approximately
between stimulus 5 and 6, the midpoint between the two local d’ minima; the F0 valley for stimulus 6 is
aligned just after the onset of /m/ in lemonade.
Finally, Figure 5(d) shows d’ for individual stimulus pairs for the nonrenewable series. Stimulus
pairs which are significantly different from one another at p < .05, t(19) ≥ 2.101 before Bonferroni
correction (but not after) are marked with solid gray brackets. There is thus weak and somewhat
conflicting evidence of three minima, suggesting a possibility of three categories for this series. The
minimum at (8,11) was significantly different before Bonferroni correction with respect to the maximum
at (5,8). In addition, the minimum at (10,13) was different at p < .05 from the maximum at (9,12) before
Bonferroni correction. Attempting to identify ranges of stimuli which encompass category exemplars
suggests that the results conflict about the number of categories. Overall, data from this series suggest
either two or three pitch accent categories, with category boundaries apparently lying somewhere in the
range of stimuli 5-8 and 9-12. The low d’ overall probably contributed to a floor effect for this series,
leading to relatively low power to identify categories. This interpretation is supported by the significance
of some differences before Bonferroni correction, as well as the systematicity of d’ values for stimulus
pairs across the nonrenewable series as successively rising to local maxima and falling to local minima,

DILLEY, L.C. & HEFFENER, C.C.
JoSS 3(1):3-67.
consistent with other series. The relatively lower power for this series could have been due to less salient
stimulus manipulations compared with say, the lemonade series (e.g., since this series involves a longer
phrase requiring more memory to store; 82). To summarize, Experiment 1 provides evidence that the
millionaire series spans two pitch accent categories, the Lannameraine series three categories, the
lemonade series two categories, and the nonrenewable series may span either two or three categories. It is
noteworthy that in each stimulus series the number and alignment of category boundaries (and by
extension, the number and alignment of categories) appear to correspond well to the syllable boundaries
traversed by the F0 extrema for each series.
3. Experiment 2
Experiment 2 involved an AXB categorization task; the purpose of this experiment was to
determine the extent of converging evidence with respect to Experiment 1 for (a) the number of pitch
accent categories in each stimulus series, and (2) the locations along each series for crossover points from
one category to another. In an AXB procedure, a to-be-categorized stimulus, X, is classified as one of two
temporally-ordered, flanking stimuli, A and B. This procedure was selected because it is particularly
useful when categories do not have readily identifiable names or clearly describable meaning differences.
In these stimuli all alignment differences within a stimulus series occurred within the same polysyllabic
word or pseudoword, in order to ensure that no alignment differences could be attributed to a phrase
accent aligned with a word edge. Meaning differences arising from phonological differences in pitch
accent type associated with F0 alignment differences were expected to be too subtle to clearly describe to
participants. Recall that it was hypothesized that category contrasts stemming from F0 peak or valley
alignment differences cued a difference in phrase-level relative prominence, which can sometimes cue
meaning-related differences e.g., in the location of narrow focus (41). However, in order for such a
difference in focus to arise, the strongest phrase-level prominence would need to occur on different words
under distinct F0 peak or valley alignment conditions. Thus, clear meaning differences were not expected
to arise from variations in these stimuli, necessitating an implicit labeling task.
In a pilot AXB experiment using Experiment 1 stimuli, a few participants had a hard time reliably
categorizing items, and in post-experiment interviews some reported that they thought they could not hear
pitch differences among stimuli in a series. It was hypothesized that this was due to participants’ focusing
on the acoustic similarity of stimuli to one another, as well as their being unused to listening for small
pitch changes in speech. To address these issues in the current experiment, instructions were chosen to
sensitize participants to “small differences” in the speech (without naming pitch specifically); moreover, a
familiarization phase was added in which participants were exposed to category exemplars for a stimulus
The role of f0 alignment in distinguishing intonation categories: evidence from American English
JoSS 3(1):3-67
series prior to the AXB task. In addition, given evidence of individual differences in psychophysical
ability to perceive small pitch changes (83-85), it was hypothesized that participants would show
variability in ability to detect, and hence classify, pitch changes in speech. To assess participants’
differential abilities to reliably detect and classify pitch differences in exemplar stimuli, a separate “test
phase” was added between the familiarization and categorization phases. It was reasoned that the
participants who could most accurately perceive, and thus categorize, pitch differences associated with
exemplar stimuli during the test phase might categorize non-exemplar stimuli more consistently during the
generalization phase, thereby generating a steeper s-shaped curve which would permit a more reliable
assessment of the location of category boundaries.
3.1. Methods
3.1.1. Participants
Participants were 73 undergraduate students at the Ohio State University. All were 18 years of age
or older and had self-reported native American English speaking abilities, normal hearing, and a range of
musical experience. They received course credit in an introductory psychology course in return for their
participation. Thirty-six students were randomly assigned to the Peaks condition, and 37 were assigned to
the Valleys condition.
3.1.2. Stimuli
The stimuli consisted of a subset of those used in Experiment 1, as described below.
3.1.3. Equipment
Stimuli were presented over studio-quality headphones in a sound-attenuated booth via a
computer running custom audiovisual presentation software.
3.1.4. Design and Procedure
Due to the lengthy procedure with three separate phases for each set of stimuli (familiarization,
test, categorization), type of stimulus was treated as a between-subjects factor with two conditions: time-
shifted peaks (Peaks condition) or time-shifted valleys (Valleys condition). Participants assigned to the
Peaks condition heard stimuli drawn from the millionaire and Lannameraine series, while participants
assigned to the Valleys condition heard stimuli from the lemonade and nonrenewable series. This ensured

DILLEY, L.C. & HEFFENER, C.C.
JoSS 3(1):3-67.
that the experiment was around an hour in length for any given participant. A second, within-subjects
factor was stimulus identity.
A blocked design was used in each condition. Each block was designed around two category
exemplars, which were selected based on results of Experiment 1. In Experiment 1, local d’ minima were
identified that represented points of lowest intra-pair discriminability for participants, thought to correlate
with perception of a category exemplar somewhere between the members of that pair (refer back to
Section 2.2.2 for a full discussion). Exemplars in Experiment 2 were chosen from within the boundaries of
the pair members of each local d’ minimum in Experiment 1. Because these pairs were 3 steps apart on the
continuum of peak or valley locations, there were two possible exemplar values along the stimulus step
continuum (see Section 2.2.2). Choosing between these values to pick the exemplar could not be
motivated from the results of Experiment 1 alone. Rather, in most cases, which of the two potential
exemplars was chosen to be the category exemplar for Experiment 2 was determined by an attempt to
make the difference between category exemplars as large as possible, as well as, for the Lannameraine
stimuli, to avoid overlapping ranges.
For the Peaks condition, there were three blocks: one block of stimuli from the millionaire series,
and two blocks from the Lannameraine series. Dividing Lannameraine stimuli into two separate blocks
was carried out since discrimination data from Experiment 1 had suggested three categories for this series;
by dividing these stimuli into two blocks (with one exemplar shared between them), participants could
focus on just two category exemplars during each block. Results from both blocks could then be combined
to determine whether there was converging evidence for the existence of three categories, as would be
indicated by categorization of non-exemplars for each block. The Lannameraine I had stimuli 4 and 9 as
exemplars, with stimuli between 4 and 9 used as comparison (i.e., non-exemplar) stimuli. The
Lannameraine II block used stimuli 9 and 17 as exemplars, with stimuli 10-16 serving as non-exemplar
stimuli. The millionaire block used stimuli 5 and 12 as exemplars, with stimuli 6-11 serving as non-
exemplar stimuli. For the Valleys condition, there were two blocks. The lemonade block used stimuli 5
and 9 as exemplar stimuli, with stimuli 6-8 serving as non-exemplar stimuli. An early analysis of d’ data
made it appear as if stimulus 5 was a category exemplar for the lemonade series; this was later discovered
and corrected. The choice of stimulus 5 as an exemplar for the lemonade series, instead of, say, stimulus 3,
is unlikely to have significantly affected results for this experiment, since results of Experiment 1 suggest
that stimuli 3 and 5 were both perceived as belonging to the same category. Finally, the nonrenewable
block used stimuli 2 and 10 as exemplars, with stimuli 3-9 serving as non-exemplar stimuli.
For the Peaks condition, three stimulus lists were constructed by counterbalancing the order of the
three blocks using a Latin Square design. For the Valleys condition, two lists were constructed by

The role of f0 alignment in distinguishing intonation categories: evidence from American English
JoSS 3(1):3-67
counterbalancing the order of the two blocks. Within each condition, participants were randomly assigned
to lists in approximately equal numbers.
The experimental procedures used for both conditions were identical and involved three phases for
each stimulus block: a familiarization phase, a test phase, and a generalization phase. The familiarization
phase consisted of trials in which category exemplars were presented, with feedback provided after each
trial. The subsequent test and generalization phases together consisted of a single series of trials without
feedback. For the test phase, participants heard only stimuli that had been presented during the
immediately preceding familiarization trials, that is, category exemplars. For the generalization phase,
participants heard stimuli that had not been presented during familiarization, in addition to category
exemplars.
Trios of stimuli were constructed for the test and generalization phases; the first stimulus in each
trio consisted of one of the category exemplars for that block, while the third stimulus consisted of the
other exemplar for that block. The second stimulus in each trio corresponded to another repetition of one
of the exemplars during the test phase or a non-exemplar stimulus during the generalization phase. Given
these sequencing restrictions, trios were constructed in all possible orders of the three stimuli. Half of the
trios presented began with one of the two exemplars for that block, while the other half of trios began with
the other exemplar for that block. The inter-stimulus interval (ISI) between successive stimuli in each trio
on a given trial was 0 ms (i.e., each successive stimulus in a trio was presented immediately after the
previous one). The ISI between successive trials was 2.7 seconds.
Participants were told that during each block they would hear speech phrases that were spoken in
slightly different ways, and that they should attempt to learn the small differences. For each
familiarization block, the category exemplar with the lower stimulus number was arbitrarily designated
Category A, and the other exemplar was Category B. On each familiarization trial, participants heard one
of the category exemplars for that block. A screen prompt then indicated that participants should guess
whether the stimulus corresponded to Category A or Category B. Participants then had 2.7 sec to circle
“A” or “B” on their answer sheets. The computer screen then displayed the correct answer. There were 30
familiarization trials (15 Category A, 15 Category B), and the order of presentation of exemplars was
randomized from trial to trial; each familiarization block lasted about two minutes.
Following familiarization, participants heard stimulus trios; the first and third stimuli
corresponded to category exemplars from the immediately preceding familiarization set. Participants
circled responses on an answer sheet to indicate whether they thought the second repetition of the phrase
sounded more like the first repetition, or more like the third repetition. The first 24 trials corresponded to
the test phase, and the remaining trials corresponded to the generalization phase. Each category non-

DILLEY, L.C. & HEFFENER, C.C.
JoSS 3(1):3-67.
exemplar phrase during the generalization phase was presented 12 times as part of a stimulus trio. The
identity of the non-exemplar stimulus varied randomly from trial to trial.
3.2. Results
3.2.1. Categorization of exemplars during the test phase
Figure 6: Box plots of percentage correct exemplar classification for the Peaks vs. Valleys conditions in Experiment
2.
The results showed that, overall, participants categorized exemplars correctly (i.e., categorized
stimuli with a lower stimulus number as “Category A” and stimuli with a higher stimulus number as
“Category B”) during the test phase. Figure 6 shows boxplots of the rate of correct exemplar classification
during the test phase for all participants in the Peaks vs. Valleys condition. Participants in the Peaks
condition more often correctly categorized exemplars (M = 82%) than those in Valleys condition (M =
72%), F(1,72) = 8.976, p < .01. In either condition, classification of exemplars was significantly better
than the chance rate of 50% in two-tailed single-sample t-tests: t(35) = 14.349, p < .001 for the Peaks
condition; and t(36) = 9.495, p < .001 for the Valleys condition. Figure 6 also indicates that a range of
variability in participants’ abilities to correctly categorize exemplars.
There were also differences between individual blocks in participants’ abilities to correctly
categorize exemplars. A one-way ANOVA on individual stimulus blocks within the Peaks condition
revealed a main effect of stimulus block, F(2,70) = 7.032, p < .01. Rates of correct classification were
higher for the millionaire block (M = .87, SE = .03) than for either the Lannameraine I block (M = .83, SE
= .03) or the Lannameraine II block (M = .77, SE = .03). Follow-up two-tailed, paired-samples t-tests

The role of f0 alignment in distinguishing intonation categories: evidence from American English
JoSS 3(1):3-67
confirmed differences between millionaire vs. Lannameraine I, t(35) = 2.041, p < .05, and between
millionaire vs. Lannameraine II, t(35) = 3.460, p < .001, while Lannameraine I vs. Lannameraine II
approached significance, t(35) = 1.966, p = .057. For the Valleys condition, exemplars were classified
more accurately for the nonrenewable block (M = .75, SE =.03) than for the lemonade block (M = .70, SE
= .03); a one-way ANOVA on these stimulus blocks approached significance, F(1,36) = 3.972, p = .054.
3.2.2. Categorization of non-exemplars during the generalization phase
The dependent measure for the generalization phase was the rate of classification of each non-
exemplar stimulus as Category B. Due to prior work showing individual differences in pitch perception
ability (83-85), and data showing variability among participants in the percentage of correct responses
during the test phase, data from the generalization phase were partitioned into two groups. For both
conditions, participants scoring at or above the median percentage correct based on test phase data were
designated the Higher Sensitivity Group (n = 18 and n = 19 for the Peaks and Valleys conditions,
respectively), while participants scoring below the median percentage correct based on test phase data
were designated the Lower Sensitivity Group (n = 18 for both Peaks and Valleys conditions).
Figure 7: Classification of exemplar and non-exemplar stimuli as a Category B exemplar stimulus for (a) the
millionaire block, (b) the Lannameraine I block, (c) the Lannameraine II block, (d) the lemonade block, and (e) the
nonrenewable block in Experiment 2. Boxes at top of each panel illustrate the time-alignment of peaks or valleys of
stimuli with segments.

DILLEY, L.C. & HEFFENER, C.C.
JoSS 3(1):3-67.
Figure 7 shows the rate of categorizing of non-exemplar stimuli as Category B from the
generalization phase, together with rates of exemplar classification from the test phase. Thin solid black
lines show mean response rates for Higher Sensitivity Group, while dashed lines show mean response
rates for Lower Sensitivity Group. As predicted, the Higher Sensitivity Group, who had more accurately
classified stimuli during the test phase, evidenced curves for the generalization phase with a steeper slope
and, sometimes, a clearer s-shape than the Lower Sensitivity Group. Note that the Lower Sensitivity
Group’s curve also shows a positive slope, indicating sensitivity to peak and valley timing, and the ability
to classify non-exemplar stimuli in terms of exemplar categories.
Regressions were computed for each stimulus series based on the responses of the Higher
Sensitivity Group, shown as a thick grey line. If members of each continuum are divided into perceptual
categories by listeners, response functions across stimulus steps will not show a linear relationship
between stimulus step and response; rather, there will be a crossover point with a very steep slope and a
relatively stable slope within categories (see 63, for a discussion of typical patterns found in categorical
perception for segmental phonology). As such, logistic regressions were thought to better model the
typical pattern of results found in categorical perception data. The general form of the regression equation
used is given in (1), where f(s) is the estimated value for rate of classification of each non-exemplar
stimulus as a member of Category B, s is the stimulus step, and γ and θ are estimated parameters for the
model. For these regressions, crossover points were estimated by noting the x-axis value yielding 50% on
the y-axis, corresponding to the “half-way” point between stimuli perceived as being a part of one
category and stimuli being presented as being in another. Parameters for the equation given in (1), as well
as mean squared error for each regression, are given in Table 2(a).
(1) f(s) = 1/[1+e(-γ(s + θ))
]

The role of f0 alignment in distinguishing intonation categories: evidence from American English
JoSS 3(1):3-67
Table 2: Logarithmic regression parameters and mean squared values for each stimulus block in Experiments 2-4.
These were calculated according to the equation in (1).
(a) Experiment 2
Stimulus Block
millionaire Lannameraine I Lannameraine II lemonade nonrenewable
γ 1.05 1.11 0.60 0.78 0.46
θ -8.72 -6.58 -12.57 -6.87 -5.60
MSE 0.020 0.0040 0.022 0.0058 0.0051
(b) Experiment 3
Stimulus Block
millionaire Lannameraine I Lannameraine II lemonade nonrenewable
γ 0.71 0.62 0.93 0.71 0.44
θ -8.26 -6.19 -12.65 -5.65 -8.22
MSE 0.088 0.037 0.091 0.079 0.32
(c) Experiment 4
Stimulus Block
millionaire Lannameraine I Lannameraine II lemonade
γ 0.46 0.86 0.89 0.38
θ -8.53 -8.06 -11.7 -6.44
MSE 0.065 0.036 0.028 0.052
Crossover points fell between the following stimulus pairs, for each of the blocks: millionaire,
stimuli 8 and 9; Lannameraine I, stimuli 6 and 7; Lannameraine II, stimuli 12 and 13; lemonade, stimuli 6
and 7; and nonrenewable, stimuli 5 and 6. The crossover points found here all fell within the range of the
ones seen in Experiment 1. The existence of a crossover point in categorization for each stimulus implies
the existence of two categories, with the crossover point delimiting the boundary at which participants
switch from hearing stimuli as being members of one category to perceiving stimuli as being a member of
a separate category. Note that crossover points were found for both Lannameraine I and Lannameraine II
series, at separate points within the entire Lannameraine continuum, implying the existence of two
crossover points within the Lannameraine continuum considered as a whole. The existence of two
crossover points implies three categories, one ending around stimulus 6, the second one beginning around
stimulus 7 and ending around stimulus 12, and a third one beginning about stimuli 13, just as in
Experiment 1, with category boundaries falling around syllabic boundaries.

DILLEY, L.C. & HEFFENER, C.C.
JoSS 3(1):3-67.
3.3. Discussion
The results show that most participants were able to reliably detect the small pitch changes and
correctly classify stimuli during the test phase using the AXB task. The Valleys condition was somewhat
harder for participants, as gauged by a lower percentage of correct responses than the Peaks condition; this
was likely due to the overall lower discriminability for stimuli in the Valleys series (see Experiment 1).
Differences in F0 valley timing may be harder to perceive than differences in F0 peak timing (70, 79).
Overall, there was variability across individuals in ability to reliably categorize stimuli in the test
phase. Data from the test phase were therefore used to split participants into two groups for examination
of data from the generalization phase. As predicted, higher-sensitivity participants showed classification
curves based on generalization data which were more s-shaped than lower-sensitivity participants.
Significantly, when the curves for higher-sensitivity participants were fit, the locations of category
boundaries agreed well with their locations from discrimination data in Experiment 1. Lower-sensitivity
participants also showed sensitivity to peak and valley timing, as well as the ability to classify non-
exemplar stimuli in terms of exemplar categories.
Overall, these results provide converging evidence for the number of intonational categories
compared with Experiment 1, and the locations of boundaries between categories. In particular, category
boundaries determined from higher-sensitivity participants’ data supported two categories for the
millionaire series, three categories for the Lannameraine series, two for the lemonade series, and two for
the nonrenewable series. The fact that most curves were not strikingly s-shaped but instead rather shallow
is suggestive of gradient categoriality, which has previously been shown for perception of Mandarin tones
(86) as well as for vowels (38). In addition to individual differences in pitch perception, another possible
reason for the differential performance among participants in categorization of exemplar and non-
exemplar stimuli is that some participants, probably the lower-sensitivity participants, could have been
less adept at categorizing stimuli that were phonologically different but (presumably) were not associated
with a meaning difference. These issues might be fruitfully investigated in future studies, and are
discussed further in Section 6.4.
4. Experiment 3
Based on a review of the literature, Gussenhoven (52) concluded that an imitation task was one of
the best available means of assessing categories in intonation. An additional experiment was therefore
conducted in which an imitation task was used, in order to determine whether such a task revealed

The role of f0 alignment in distinguishing intonation categories: evidence from American English
JoSS 3(1):3-67
consistent evidence regarding the nature of the mapping from F0 alignment to English intonational
categories.
4.1. Method
4.1.1 Stimuli
The stimuli were identical to those in Experiment 1.
4.1.2. Participants
Participants were 17 students and staff (5 males, 12 females) at MIT and other colleges in the
Boston area. Participants were at least 18 years old with self-reported native American English
proficiency, normal hearing, and a range of musical experience. None had any known training in
phonetics or linguistics. All were paid a nominal sum for participation.
4.1.3. Design
There were two within-subjects factors in the experiment. The first was stimulus block, with five
levels. Stimuli from the four series were divided into five stimulus blocks in a manner similar to
Experiment 2; there was one block each for all stimuli in the millionaire, lemonade, and nonrenewable
series, and there were two blocks for the Lannameraine series. Division of the Lannameraine series into
two blocks was carried out because data from Experiment 1 had indicated that the Lannameraine series
traversed 3 categories; thus, it was reasoned that dividing the series into two blocks would allow
participants to focus on only two categories in any given block, on the assumption that fine-grained F0
timing differences would be cognitively recoded as an exemplar category. The Lannameraine I and
Lannameraine II blocks corresponded to stimuli 1-11 and 8-18, respectively, from the Lannameraine
series. These represent slightly different continua compared to the ones used for Experiment 2, since in
Experiment 3 exemplars were not necessary to serve as endpoints for each continuum. The second factor
was stimulus step, referring to the stimulus number or position of the F0 peak or F0 valley along the
continuum of possible locations for each stimulus series. There were three repetitions of all five stimulus
blocks. The order of blocks within each repetition was randomized, and the order of stimuli was
randomized within each block.
4.1.4. Procedure and Equipment
Stimuli were sequenced for audio playback via computer using Winamp software (Nullsoft, Inc.)
Participants wore studio-quality headphones and were seated in a sound-attenuated booth in front of a

DILLEY, L.C. & HEFFENER, C.C.
JoSS 3(1):3-67.
computer screen with a high-quality microphone placed 8” from their lips. They were told that they would
hear a phrase over headphones, and that they should imitate each phrase as closely as possible in a
comfortable pitch range. This instruction was included to discourage participants from straining their
voices to achieve the absolute F0 values of the female speaker who produced the original stimuli (the
author). Each stimulus block was preceded by a set of practice trials consisting of stimuli drawn from the
upcoming block. On each experimental trial, participants heard a given stimulus and imitated it; the same
stimulus was then presented again for a second imitation by the participant. This repetition was done in
order to avoid carryover effects from the preceding trial which had been observed in earlier imitation
experiments. As auditory presentation of the first of the two repeated stimuli began, the experimenter
pressed a key to initiate recording to a computer buffer; the length of the buffer corresponded to a pre-
specified trial duration for that block, or the time of a second button press on that trial by the
experimenter, whichever was earlier. The text of each phrase was displayed on a computer screen
simultaneously while each stimulus was heard. Recordings were made using custom computer software
for real-time audio recording and digitization (MARSHA v. 2.0 by Mark Tiede). Utterances were low-pass
filtered at 8 kHz and digitized at 16 kHz. Participants were given a short break between repetitions of the
stimulus blocks. The total duration of the experiment was approximately 50 minutes.
4.1.5. Analysis
Only the second of the two imitated versions on each trial was analyzed, unless the second could
not be analyzed due to pervasive non-modal voicing, experimenter error, etc.; the first imitated version
was analyzed on fewer than 5% of trials for all subjects. For each analyzed imitation, the onset of the first
segment and offset of the last segment in the target segmental sequence were identified and marked using
Praat (73). Target segmental sequences corresponded to the portion of each imitation over which F0 peak
and valley timing varied in each stimulus for all blocks except Lannameraine I and Lannameraine II, for
which the target segmental sequences were /lɑnə/ and /nəmɚ/, respectively. Segment boundaries were
identified through discontinuities in amplitude in the spectrogram and waveform and/or by noting the
location of a rise in frequency of F2 or higher formants.
The normalized timing of the F0 peak or valley, TN, was then determined with respect to the
respective target segmental sequence, using the formula given in (2).
(2) TN = (t-t0)/d
In this formula, t is the time of the peak or valley, t0 is the start of the first segment in the target
segmental sequence, and d is the duration of the target segmental sequence. Thus, TN ranged from 0 to
The role of f0 alignment in distinguishing intonation categories: evidence from American English
JoSS 3(1):3-67
approximately 1. A normalized timing measure was used in order to minimize effects of an irrelevant
variable, speech rate, to measuring F0 peak and valley timing; other methods of normalization were also
tried (e.g., as a difference in seconds between the time of the extremum and one or more segmental
landmarks for the series), and the pattern of data was the same. The temporal locations of F0 peaks and
valleys were determined automatically using a Praat script. All peaks and valleys were subsequently
inspected visually for accuracy and corrected by hand if necessary. In the event that a peak or valley
appeared to be segment-related, that is, due to transient pressure buildup at a nasal-liquid boundary, then
the next highest maximum or minimum across the target SU or US syllable sequence, if available, was
taken as the location of the peak or valley, respectively. Non-modal voicing was present in some speakers’
imitations; see Redi and Shattuck-Hufnagel (87) for a discussion of such irregularities. In the event of
diplophonia without evidence of other voicing irregularities, the F0 maximum or minimum within the
diplophonic region was determined. If other voicing irregularities were present, the token was discarded.
Participants showed differential ability to produce consistent responses in each block. To quantify
consistency across participants and blocks, bivariate correlations were calculated on TN for all pairs of
subjects separately (i.e., pairwise) for each block. Responses of participants which failed to be correlated
at the conservative level of p < .20 with all other subjects were judged to be unreliable imitators and were
not included in subsequent analyses. Based on this analysis, one participant was discarded from the
Lannameraine I block, one participant was discarded from the lemonade block, and three participants
were discarded from the nonrenewable block.
To determine whether there was evidence of the predicted change in the location of the strongest
phrase-level relative prominence in the polysyllabic items millionaire, Lannameraine, and lemonade, as
predicted by AM theory, the durations of the first (D1) and last (D2) syllables were measured. Moreover,
the rms amplitudes of the vowel nuclei of the first (A1) and last (A2) syllables was measured, and the
relative amplitudes of these syllables was calculated by the formula 20log10(A2/A1). Both duration and
intensity are traditionally considered reliable cues to phrase-level prominence, with prominent syllables
having higher intensity and longer duration (88-92). If listeners’ imitations of these phrases show
differences in the relative intensity and duration of the two syllables (i.e., the extent to which either of the
syllables with potential stress is more intense or longer than the other), it could be a sign that changes in
F0 peak location may influence assigned prominence, since listeners would have transferred the perceived
relative prominence of each syllable into produced differences across the wide range of acoustic properties
that characterize prominence.
4.2. Results and Discussion

DILLEY, L.C. & HEFFENER, C.C.
JoSS 3(1):3-67.
Separate one-way ANOVAs were conducted on TN for each of the five blocks (millionaire,
Lannameraine I, Lannameraine II, lemonade, nonrenewable) with stimulus step as the factor. The results
of these ANOVAs are shown in Table 3. There was a significant effect of stimulus step across all five
stimulus blocks at p < .01 or less, supporting a shift in categories part way through each stimulus series.
These data are therefore consistent with the presence of multiple categories for all stimulus blocks, as
changes in stimulus step heard by participants affected in turn the normalized timing of the F0 peak or
valley, with the clearest shifts observed for the millionaire, Lannameraine I, Lannameraine II, and
lemonade blocks.
Table 3: Results of one-way ANOVAs for each stimulus block for Experiment 3. Stimulus item was the factor in
each analysis.
Stimulus block F-ratio p-value
millionaire F(12,192) = 13.129 p < .001
Lannameraine I F(10,150) = 24.201 p < .001
Lannameraine II F(10,160) = 13.187 p < .001
lemonade F(9,144) = 13.738 p < .001
nonrenewable F(12,132) = 2.997 p < .005

The role of f0 alignment in distinguishing intonation categories: evidence from American English
JoSS 3(1):3-67
Figure 8: Normalized turning point time, TN, in imitated versions of stimuli in (a) the millionaire block, (b) the
Lannameraine I block, (c) the Lannameraine II block, (d) the lemonade block, and (e) the nonrenewable block in
Experiment 3. Single points represent outlier responses. Boxes at top of each panel illustrate the time-alignment of
peaks or valleys of stimuli with segments.
Boxplots of TN for each of the five blocks are shown in Figure 8. There is a clear, discrete shift in
the timing of produced peaks and valleys in Figures 8(a), 8(c), and 8(d), but not in 8(b) or 8(e). Figure
8(b) also shows a shift in TN, but this shift is not as clearly discrete as the others and may be somewhat
gradual. In contrast, the data plotted in Figure 8(e) don’t clearly show evidence of a discrete shift in TN.
These data are nevertheless consistent with the presence of two categories for the stimulus blocks in
Figures 8(a)-8(d). To investigate these results quantitatively, as well as to determine crossover points
between categories, logistic regressions were employed, using median TN values for each stimulus step,
similar to the regressions performed in Experiment 2. To conduct the logistic regressions, raw median
values of TN were first normalized using the formula described by Earle (93) as shown in formula (3),
below, which resulted in median TN values being rescaled from 0 to 1, similar to data in Experiment 2. In
(3), xmax is the largest value (here, of median TN) for any step in a given stimulus series or range, xmin is the
smallest value for any step in a given stimulus series or range, and x is the actual value for any member of

DILLEY, L.C. & HEFFENER, C.C.
JoSS 3(1):3-67.
a given stimulus series or range. Finally, xnorm is the normalized value for that member of the stimulus
series or range.
(3) xnorm = (x – xmin)/(xmax – xmin)
The regressions were then calculated using the formula in (1). Based on this procedure, crossover
points were identified as follows: for millionaire, between stimuli 8 and 9; for Lannameraine I, between
stimuli 6 and 7; for Lannameraine II, between stimuli 12 and 13; for lemonade, between stimuli 5 and 6;
and, for nonrenewable, between stimuli 8 and 9. These crossover points were identical compared to those
in Experiment 2 for the millionaire and Lannameraine series, and the crossover points were very similar
to those of Experiment 2 for the lemonade series. The only inconsistent results were found for the
nonrenewable series.
The results from this experiment provide converging evidence with Experiments 1 and 2, using a
third type of task (an imitation task) and provide additional support for the conclusions drawn earlier
about the number of categories present in each stimulus series and the locations of category boundaries.
Consistent with the results of Experiments 1 and 2, support was found for two distinct categories for the
millionaire series, three for the Lannameraine series (as, again, the effects of stimulus series were found
twice for Lannameraine as whole, in both Lannameraine I and Lannameraine II blocks), and two for the
lemonade series. In contrast, results from the nonrenewable series did not show a clear pattern with
respect to categories.
Table 4 shows results of the comparison of average durations and average relative amplitudes of
the first and last syllables (i.e., whether the first syllable had higher amplitude and/or was longer in
duration) in polysyllabic items from the millionaire, Lannameraine, and lemonade blocks over ranges of
stimuli defined by category boundaries in Experiment 1. The millionaire block shows evidence of a shift
in relative prominence, as predicted for AM pitch accent categories, as indicated by significant differences
in average relative duration and amplitude of the first and last syllables for stimuli 1-8 as compared with
9-13, with the last syllable being significantly longer and louder relative to the first syllable in stimuli 9-13
than in stimuli 1-8. There is evidence of a change in relative prominence for the Lannameraine I block, as
indicated by a significant difference in average relative amplitude of the first and last syllables for stimuli
1-6 as compared with 7-11, with the last syllable being significantly louder relative to the first syllable in
stimuli 7-11 than in stimuli 1-6. There is also evidence of a change in relative prominence for the
Lannameraine II block, as indicated by a significant difference in average relative duration and marginally
significant difference in average relative amplitude of the first and last syllables for stimuli 8-12 as
compared with 13-18, with the last syllable being significantly longer relative to the first syllable in

The role of f0 alignment in distinguishing intonation categories: evidence from American English
JoSS 3(1):3-67
stimuli 13-18 than in stimuli 8-12. Finally, there were no significant differences in average duration or
relative amplitude for the lemonade series stimuli 1-5 as compared with 6-10, providing no clear evidence
of a shift in relative prominence for this series. However, the results trended in the same direction as for
the peaks, which may indicate that the statistical power was simply not great enough in the present
measurement set to detect effects.
Table 4. Average relative duration and average relative amplitude of the first and last syllables of polysyllabic
(pseudo)words over stimulus ranges defined by category boundaries from Experiment 1 for the millionaire,
Lannameraine, and lemonade series. All t-tests are two-tailed, paired-samples tests.
Average
over?
D2-D1 (s) Significant? 20log10(A2/A1)
(dB)
Significant?
millionaire 1-8 0.028 t(16) = -2.810, -6.8 t(16) = -4.567,
9-13 0.046 p < .05 -5.8 p < .001
Lannameraine I 1-6 0.054 t(15) = -1.554, -7.6 t(15) = -5.329,
7-11 0.062 p = .14, NS -6.6 p < .001
Lannameraine II 8-12 0.067 t(16) = -2.288, -5.9 t(16) = -1.749,
13-18 0.080 p < .05 -5.6 p = .10
lemonade 1-5 0.026 t(16) = -1.110, -7.2 t(16) = -1.485,
6-10 0.027 p = .28, NS -7.0 p = .157, NS
5. Experiment 4
Experiment 4 involved an explicit relative prominence judgment task. There were several
purposes to this experiment. First, the experiment provided an initial test for the hypothesis that the
productive capacity of alignment differences in American English involved changes in phrase-level
relative prominence. It is well known that differences in phrase-level relative prominence can sometimes
cue focus differences (41). Thus, the establishment of F0 extremum alignment as a cue to relative
prominence within a word would provide an important starting point for future studies that might attempt
to test whether this phonetic cue is involved in cueing focus differences in similar stress contexts (e.g.,
S#US in big#parade giving rise to a focus contrast on BIG vs. PARADE). Recall from Section 2.1.3 that it
was of critical importance that stimuli contain ambiguous stress patterns within a single word, in order to
ensure that a F0 peak or valley could only be attributed to a pitch accent, rather than a word boundary-
related phrase accent or boundary tone (11).

DILLEY, L.C. & HEFFENER, C.C.
JoSS 3(1):3-67.
The second purpose of this experiment was to contribute to knowledge of the role of F0 in cueing
stress differences in English. F0 timing differences have been shown to affect perceived relative
prominence in pairs contrasting in the location of primary stress in verb/noun pairs, for example, imPORT
vs. IMport, and other words with adjacent strong syllables (91, 94, 95); however, this work has examined
adjacent syllables with full vowels or S1S2 stress patterns. The present experiments examined relative
prominence of stressed syllables in nonadjacent positions. In particular, we evaluated the hypothesis that
when an F0 peak or valley was aligned with a stressed syllable, S1 in S1U(U)S2 contexts, syllable S1 would
sound stronger than S2. In contrast, we predicted that a peak or valley which was aligned with a U syllable
would cause the following syllable, S2, to sound stronger than S1, even if the peak or valley was never
aligned with S2.
The third purpose of the experiment was to attempt to further substantiate and clarify aspects of
the AM ToBI inventory for American English, in several respects. In particular, inspection of AM theory
(and ToBI) categories suggests that a shift in F0 peak and valley alignment should generate a shift in
phrase-level relative prominence from H* on S1 to H+L* on S2 for the millionaire series and from L* on
S1 to L+H* on S2 for the lemonade series, respectively. The explicit relative prominence judgment task of
Experiment 4 provided an opportunity to test this prediction about the change in phonological affiliation
of the starred tone across these two stimulus series. In addition, Experiment 4 provided an opportunity to
obtain converging evidence for pitch accent interpretations of the three categories found from earlier
experiments for the Lannameraine series. According to reasoning described in Section 6.1, stimuli in the
early part of the series (approximately 2-5) should correspond to H* on S1, predicting a predominance of
responses that S1 is the strongest stress for these stimuli. Moreover, stimuli in the middle part of the series
(approximately 8-11) should correspond to H*+H on S1, predicting a predominance of responses that S1 is
the strongest stress for these stimuli. Finally, stimuli in the middle part of the series (approximately 14-17)
should correspond to H+L* on S2, predicting a predominance of responses that S2 is the strongest stress
for these stimuli. In other words, our pitch accent category interpretation predicts we should see evidence
of a clear shift in perception from S1 to S2 being heard as the strongest syllable somewhere between
stimuli 11 and 14.
5.1. Method
5.1.1. Participants
There were 24 participants ranging in age from 18 to 45 years. All were students or staff at MIT,
and all were self-reported native speakers of English with normal hearing and a range of musical

The role of f0 alignment in distinguishing intonation categories: evidence from American English
JoSS 3(1):3-67
experience. None of the participants had any known training in linguistics or phonetics. Some had
participated in another experiment reported here. Each participant was paid a nominal sum for
participation.
5.1.2. Stimuli
Stimuli were those from the Lannameraine, millionaire, and lemonade series of Experiment 1.
Stimuli from the nonrenewable series were not used, since this series had given equivocal evidence of
categories in the previous three experiments and the categories which it tested were redundant with those
of the lemonade series.
5.1.3. Design and task
The within-subjects factors in this experiment were stimulus series (millionaire, Lannameraine,
and lemonade) and stimulus identity. All stimuli from a given series were presented as a block. The order
of presentation of stimulus blocks was counterbalanced across subjects.
Subjects were told that they would hear a spoken phrase containing a target word that could have
one of two stress patterns. They were instructed to decide which of the two stress patterns the speaker
intended, to expect both stress patterns in each block of trials, and not to pay attention to loudness alone in
making their judgments.
Stimuli were presented via computer over studio-quality headphones using MATLAB (The
MathWorks, Inc.) in a sound-attenuated booth. To hear a stimulus, subjects used a mouse to click a button
on the computer screen labeled “Play”. Subjects checked the box corresponding to the stress pattern they
heard, where capital letters indicated the strongest stress in a word; for example, participants could click
on “MILLionaire” or “millioNAIRE" for each stimulus in the millionaire series. Each block was preceded
by a set of practice trials; stimuli were then presented in random order for judgments. All three blocks
were repeated three times in counterbalanced order over the course of the 30 minute experiment; this
resulted in three judgments per stimulus per subject for each of the three continua. Data from each series
were analyzed separately. Two participants failed to respond on more than half of the trials for the
Lannameraine series and were therefore discarded from that series.
5.2. Results

DILLEY, L.C. & HEFFENER, C.C.
JoSS 3(1):3-67.
Figure 9. Rate of classifying the last syllable in the word as strongest for all stimuli in Experiment 4 for (a) the
millionaire series, (b) the Lannameraine series, and (c) the lemonade series. “**”, “*”, and “†” indicate stimuli for
which classification rates were significantly different from chance (50%) at p < .01, p < .05, or p < .10, respectively.
The transitions between the categories are clearly better-defined here than in Figure 7. The dotted line in panel (c)
refers to responses of three participants who showed an opposite pattern from the majority as shown in a hierarchical
cluster analysis. Boxes at top of each panel illustrate the time-alignment of stimuli with segments.
For each series, it was necessary to first determine whether subjects could indeed hear stress on
either of the two syllables in each series. For the millionaire series, only two participants reported hearing
stress predominantly on a single syllable, i.e., mil-; these participants reported hearing stress on –naire on

The role of f0 alignment in distinguishing intonation categories: evidence from American English
JoSS 3(1):3-67
0% and 8% of trials, respectively. Instead, the vast majority of participants heard stress variably on mil- or
-naire; these participants reported hearing stress on –naire on average 36% of trials (range: 11%-62%).
The percentage of responses for these participants in which they indicated that the last syllable was
strongest are shown in Figure 9(a) for each stimulus. For each stimulus, a two-tailed, single-sample t-test
was conducted against the chance rate of response (50%). Stimulus pairs for which t(21) ≥ 3.88, p < .01
are marked with “**”, while those for which t(21) ≥ 1.76, p < .1 are marked with “†”.
For the Lannameraine series, only one participant had trouble hearing stress variably on Lan- and
-raine; this participant reported hearing stress on –raine for only 2% of trials. The large majority of
participants readily heard stress on either syllable; these participants reported stress on –raine on an
average of 43% of trials (range: 21%-85%). Responses for this majority of participants are shown in
Figure 9(b). For each stimulus, a two-tailed, single-sample t-test was conducted against the chance rate of
response (50%). Stimulus pairs for which t(20) ≥ 3.627, p < .01 are marked with “**”. It can be seen that
the t-test results separate the Lannameraine series into three response regions of stimuli. In particular, for
stimulus ranges 1-7 and 13-18, listeners predominantly perceived the strongest stress on the first or the last
syllable, respectively, while for stimuli 8-12, perceptions of the location of strongest stress were
ambiguous. This fairly wide region of ambiguity may be a reflection of the increased number of syllables
within the F0-manipulated region.
Lastly, for the lemonade series, only one participant had trouble hearing stress on both lem- and -
nade; this participant reported hearing stress on -nade on 100% of the trials. The vast majority of
participants instead readily reported stress either on lem- or -nade; these participants heard stress on –nade
on an average of 46% of trials (range: 13%-83%).
Three participants for the lemonade series appeared to show an opposite strategy with respect to
classifying responses, compared with the other subjects. To assess this, hierarchical cluster analysis was
carried out on the proportion of last syllable responses using SPSS v.14; this technique provides a means
of partitioning data based on a common trait. The method used for the cluster analysis was between-
groups linkage, which is a common approach; additionally, the distance metric selected was squared
Euclidean distance. The results verified that the three participants indeed clustered together as separate
from the rest of the participants. Responses from these three participants are displayed in Figure 9(c) as a
grey dashed line, while responses from all other participants (except the individual who never heard lem-
as stressed) are displayed as a solid black line. For each stimulus, a two-tailed, single-sample t-test was
conducted on participants shown as the solid line against the chance rate of response (50%). Stimulus
pairs for which t(19) ≥ 2.964, p < .01 are marked with “**”, while those for which 2.342 < t(19) < 2.964,
.01 ≤ p < .05 are marked with “*”.

DILLEY, L.C. & HEFFENER, C.C.
JoSS 3(1):3-67.
Finally, for each stimulus series, logistic regression was conducted to determine the location of the
category boundary for each solid curve, following methods outlined for Experiments 2 and 3 (see sections
3.2.2 and 4.2). For the Lannameraine series, previous studies had shown evidence of three categories, but
there were only two response categories in the present experiment. Moreover, t-test results here showed
three different predominant patterns of listener perceptions regarding stress for this series, as described
above. To determine the extent of convergence with previous experiments regarding crossover points for
the Lannameraine series, logistic regressions were separately calculated across two consecutive,
overlapping regions delineated by the range for which stress perception had been ambiguous in this study:
stimuli 1-12 (Lannameraine I), and stimuli 8-18 (Lannameraine II). Normalization was conducted on the
dependent variable (i.e., percentage of last syllable responses) separately for each of these two regions
using the formula in (3), in order to allow rescaling of responses within the Lannameraine I and II ranges
to a minimum of 0 and maximum of 1. No normalization step was carried out for the millionaire or
lemonade series, since responses for these series already had a minimum and maximum possible response
value of 0 or 1, respectively.
Table 2(c) gives the parameters for the logistic regression as well as the mean squared error values
for each regression. The category boundary was found to be between stimuli 8 and 9 for the millionaire
series, and between stimuli 6 and 7 for the lemonade series. Moreover, the category boundary for
Lannameraine I was between stimuli 8 and 9, while that for Lannameraine II was between stimuli 11 and
12.
5.3. Discussion
The results verified the hypothesis that F0 alignment differences cue phrase-level relative
prominence differences in American English. In particular, when the peak or valley was on S1 in a
S1U(U2)S2 context, listeners perceived S1 to be the strongest syllable. However, when the peak was on a U
syllable immediately preceding S2, participants perceived S2 to be the strongest syllable. Since the relative
prominence differences were in these materials also differences of primary vs. secondary stress, the
present results contribute to the body of work (cf. 90, 91, others) showing that F0 can cue stress
differences (90, 91, 95); results here show that a stimulus with an F0 peak on a U syllable can cue an
upcoming S syllable to be heard as the primary stressed syllable in a word. This indicates that differences
in the alignment of pitch peaks or valleys with respect to stressed syllables, not just the absolute F0 level
on stressed syllables alone, can affect the perception of metrical stress, echoing previous studies (e.g., 49).
This does not necessarily mean that F0 alone is the only cue that triggers perception of lexical stress—
duration and intensity cues certainly play a role, and may do so even in the absence of fundamental

The role of f0 alignment in distinguishing intonation categories: evidence from American English
JoSS 3(1):3-67
frequency cues (88-92)—but, nonetheless, the timing of fundamental frequency contours with respect to
stressed syllables here was used to determine the location of stress in words even without simultaneously
manipulating duration or intensity. It may be desirable to try to integrate those cues in subsequent
experiments, to determine their relative prominence in the ways prosody contributes to stress placement
(cf. Fry, 1958, for explicit lexical contrasts without sentential context).
These findings also supported AM theory and ToBI-based predictions regarding the relationship
of F0 alignment to pitch accent distinctions. In particular, it was correctly predicted that shifting a valley
from S1 to U in the S1US2 word lemonade should result in a stress shift from S1 to S2 consistent with a
change from L* on S1 to L+H* on S2. It is speculated that the three participants who showed an opposite
categorization pattern for the lemonade series may have been basing their responses across all series on
the relative pitch of stressed and unstressed syllables across the critical target region, which would be
expected to give rise to the observed pattern. Similarly, it was correctly predicted that shifting a peak from
S1 to U in S1US2 in the word millionaire would result in a change in the location of the strongest
prominence from S1 to S2, consistent with a change from H* to H+L*. Finally, findings of a consistent
shift in the strongest prominence for the Lannameraine series from S1 to S2 for later stimulus numbers is
also consistent with a change from H* on S1 to H+L* on S2.
These results yield converging evidence for our interpretations of pitch accent categories for the
Lannameraine series in the case when the F0 peak was on U1 in a S1U1U2S2 context. Modeling by logistic
regression across two consecutive, overlapping regions of stimuli that included those stimuli for which
relative prominence was ambiguous (Lannameraine I: stimuli 1-12, Lannameraine II: stimuli 8-18)
suggested evidence of two category boundaries, one corresponding to a crossover point between stimuli 8
and 9 and the other corresponding to a crossover point between stimuli 11 and 12. Both crossover points
are similar to those identified in other experiments, providing converging evidence across experiments for
three categories for the entire Lannameraine stimulus series. The fact that there were three categories and
but only two response choices for relative prominence may have caused some individuals to equate a
perceived changes in category with perceived changes in relative prominence, which may have
contributed to the ambiguity of responses across stimuli 8-12.
Critically, the responses regarding relative prominence of syllables for the Lannameraine series
were quite consistent with the predictions regarding the phonological interpretations of categories. In
particular, for stimuli in the early part of the series (up through around stimulus 8), a preponderance of
participants heard the first syllable as stronger, consistent with a H* accent on S1. Moreover, for stimuli in
the final part of the series (from about stimulus 14 to 18), a preponderance of participants heard the last
syllable as stronger, consistent with a H+L* accent on S2. Finally, we also obtained support for the
prediction that stimuli in the middle part of the series (approximately 8-11) should show a predominance
DILLEY, L.C. & HEFFENER, C.C.
JoSS 3(1):3-67.
of responses that S1 was the strongest stress; this is consistent with our interpretation that these stimuli
corresponded to H*+H on S1. Other interpretations of the phonological categories present are possible;
these are considered in the General Discussion.
6. General Discussion
The present experiments investigated predictions of AM theory regarding the relationship of F0
peak and valley alignment to phonological categories by using multiple experimental paradigms. This
permitted evaluating the extent of converging evidence for AM theory’s phonological categories across a
series of different techniques. Stimuli in all experiments involved shifting an F0 peak or valley across a
syllable sequence with a specific stress pattern. Experiments 1 and 2 were categorical perception
experiments utilizing AX discrimination and AXB identification paradigms, respectively, while
Experiment 3 utilized an imitation task. Finally, Experiment 4 used a prominence judgment task to test the
AM prediction that relative prominence differences would be triggered by F0 peak and valley alignment
shifts. These experiments share a few similarities with classic experiments in segmental perception;
Experiment 4, in particular, provides parallels to studies of prominence judgment in speech. However, the
primary aims of these experiments were directed towards examining theories of intonational phonology,
which is situated more broadly within the context of exemplar and articulatory theories of speech sound
perception and production.
Three main findings were obtained in these experiments. First, there was broadly converging
evidence across intonation paradigms regarding the nature and number of intonational categories for most
stimulus series (i.e., millionaire, Lannameraine and lemonade, while results from nonrenewable were
equivocal); this pattern of consistency is apparent in Table 5, which shows the estimated crossover points
for each stimulus series. Consistent evidence about the number, nature, and placement of categories and
category boundaries was found using discrimination (Experiment 1), identification (Experiment 2),
imitation (Experiment 3), and relative prominence judgment tasks (Experiment 4). Each individual result
on its own contributes some information about the perceptual categories at play. Experiment 1 allowed for
a first pass at the number and location of perceptual boundaries; Experiment 2 helped establish the shape
of the perceptual boundaries observed; Experiment 3 confirmed that perceptual categorization turned up in
production, too; and Experiment 4 showed that the differences in categorization can be associated with
changes in meaning. More importantly, though, these results suggest that the number of intonation
categories underlying an F0 continuum can be profitably investigated by using a combination of
discrimination, identification, and/or imitation tasks. This combination of phonetic approaches to

The role of f0 alignment in distinguishing intonation categories: evidence from American English
JoSS 3(1):3-67
investigating categories may be particularly useful in the case of intonation, since assessing meaning
differences often can be problematic or inadequate for assessing phonological contrast in pitch.
Table 5: Approximate locations of category boundaries identified in Experiments 1-4 for each stimulus continuum.
Here, the notation x-y means “between stimuli x and stimulus y”.
Stimulus Continuum
Exp. millionaire Lannameraine
lemonade nonrenewable I II
1 7-8 6-7 12-13 5-6 6-7
2 8-9 6-7 12-13 6-7 5-6
3 8-9 6-7 12-13 5-6 8-9
4 8-9 8-9 11-12 6-7 n/a
Second, F0 alignment differences of a given magnitude differentially affected representations,
depending on the precise alignment of the peak or valley with segments and the stress pattern of the word.
These results provide broad perspective on recent studies which have investigated factors associated with
fine differences in F0 alignment in production (e.g., 7, 9, 13, 17, 18). This suggests that some timing
differences have little or no impact on phonological representations for intonation, while other timing
differences of comparable magnitude have a quite significant impact on representations. While a full
account of F0 variability will incorporate all factors affecting F0 alignment, the present results illustrate
that the representational significance of fine differences in F0 timing depends on the precise way in which
the F0 peaks and valleys are aligned with segments. Across experiments and series, participants frequently
aligned category boundaries with vowel onsets, suggesting a privileged role for the vowel onset in
determining the location of boundaries in tonal perception, with regard to F0 peak or valley placement.
(See also, e.g., 96, for similar findings.)
Third, there was broad support for a number of specific phonological claims stemming from AM
theory, including support for a prediction that differences in F0 peak and valley timing should engender a
shift in relative prominence and pitch accent affiliation with stressed syllables (Experiment 4). The
evidence also suggests certain qualifications and clarifications relevant to other AM theoretic predictions.
The following section discusses the specific findings of these experiments within the context of the AM
framework. Some broader implications of these findings for phonetics and phonology are then considered.
6.1. Perceptual categories and their implications for AM theory

DILLEY, L.C. & HEFFENER, C.C.
JoSS 3(1):3-67.
A number of findings here clearly supported the predictions of AM theory. In particular, evidence
from the lemonade series was consistent with AM theory’s predictions regarding the relationship between
F0 valley alignment and phonological categories. AM theory claimed that different patterns of F0 valley
alignment with respect to a US or SU syllable sequence should give rise to two contrastive categories,
L+H* and L* (cf. Figures 2a and 2b). Consistent with this claim, shifting an F0 valley across a SU
syllable sequence lemon- in lemonade gave rise to evidence of two distinct categories across both
categorical perception experiments (Experiments 1 and 2) and an imitation experiment (Experiment 3);
this shift also engendered a change in the perceived relative prominence of the initial and final stressed
syllables (Experiment 4), consistent with different pitch accent representations. These findings provide the
first perceptual evidence in American English supporting the proposed AM distinction between L+H* and
L*. Moreover, the findings present the first imitation-based evidence of discreteness in F0 valley timing in
response to an F0 valley alignment continuum, consistent with distinct categories.
The results for the nonrenewable series, which similarly probed the distinction between L+H* and
L*, were not as clearly interpretable as those from the lemonade series. Recall that for the nonrenewable
series, an F0 valley was shifted across a US sequence renew- in nonrenewable (as opposed to a SU
sequence in the lemonade series). Evidence for categories was inconsistent across experiments. Evidence
of two categories was obtained in a labeling experiment (Experiment 2); however, the results from the
discrimination study (Experiment 1) suggested either two or three categories, while evidence from the
imitation study (Experiment 3) failed to show evidence distinguishing any categories. The inconsistency
in findings likely does not present evidence against AM theory’s claims of the distinction between L+H*
and L*. Rather, acoustic cues to the canonical representations in the nonrenewable series may not have
been as distinct as for the lemonade series, as evidenced by the low d’ values across the series for
Experiment 1. As a result, the nonrenewable series may not have presented clear enough exemplars of
L+H* and L* in order to adequately test this distinction, or else the longer phrase length relative to the
lemonade series may have introduced memory limitations. That this series contained categories but that
they were either relatively less clear or less memorable—leading to a floor effect—is bolstered by the
systematicity of d’ values for stimulus pairs across this series that were observed in Experiment 1
(successively rising to local maxima and falling to local minima), consistent with other series, as well as
the statistical significance of some differences before Bonferroni corrections were applied.
Next, results from the millionaire series helped to clarify a well-known conflict in AM criteria
regarding the relationship between F0 peak timing and pitch accent categories. It is well-recognized that
written descriptions of pitch accent categories under AM theory entail conflicting statements about
whether an F0 peak in a U syllable in a S1US2 context corresponds to H* on S1 with a “late peak,” or
H+L* on S2 (see 49). Clear evidence was obtained across Experiments 1-4 that for S1US2 contexts, an F0

The role of f0 alignment in distinguishing intonation categories: evidence from American English
JoSS 3(1):3-67
contour with a peak during S1 belongs to a different category than an F0 contour with a peak during U
(e.g., Figure 1(d)). The precise location of the crossover point was the onset of the postaccentual vowel, a
finding which is reminiscent of the difference in accentual rises in Dutch (10) and Greek (9, 97). Thus, the
present results suggest that the AM category of H* corresponds to a contour with a peak on a stressed
syllable or as late as the consonantal onset of the poststress syllable, but no later, at least for nuclear
accents. It is expected that similar patterns could be obtained for non-nuclear accents, based on similar
results found by, for example, Ladd and colleagues (10), who employed only a production task and found
that, on average, F0 peaks in prenuclear pitch accents were found either just before the end of the pitch
accented vowel or just into the next consonant. Examining whether this relationship holds across the
methodologies employed here merits consideration. Further implications of this finding are considered
later in this discussion.
Finally, results from the Lannameraine series failed to support AM theory regarding the number
of categories expected when an F0 peak traverses a S1U1U2 sequence in a S1U1U2S2 context. AM theory
claims that there should be a maximum of two categories for such a context: H* and H+L*. However,
consistent evidence across three experiments was obtained that the Lannameraine series spanned three
categories. Two of these categories are consistent with AM categories. In particular, the category
associated with an F0 peak during S1 (Lan-) may be interpreted as H* on S1, while the category associated
with an F0 peak during U2 (ma-) may be interpreted as H+L* on S2. The third category, corresponding to
an F0 peak during U1 (na-), is difficult to accommodate under current standard versions of AM theory.
One possibility is that the three categories for Lannameraine corresponded to different
combinations of two accents, H* on Lan- and H+L* on -raine, a phenomenon which is possible in words
such as this which have a secondary stressed syllable (98). Under this interpretation, the two categories
with an F0 peak during S1 and U2 correspond to H* on S1 and H+L* on S2, respectively, while the third
category associated with an F0 peak during U1 corresponds to both H* on S1 and H+L* on S2. If this is
correct, then for stimuli having an F0 peak during U1, participants would be expected to hear two accents:
one on Lan- and one on -raine. To investigate this possibility, an experiment was conducted using 57
undergraduate students at the Ohio State University. The participants first received an explanation about
the difference concerning stress and accentuation, with examples provided. Participants then heard stimuli
in the Lannameraine series in random order. For each stimulus, participants responded whether there was
a single accent on Lan-, a single accent on –raine, or accents on both Lan- and -raine. If the category
associated with contours with an F0 peak during U1 corresponds to the combination of both H* and H+L*,
then participants should have overwhelmingly responded that both Lan- and -raine were accented over
this range of stimuli. The rate of responding that both syllables are accented was not different from chance
(33.3%) for this stimulus range, t(56) = 0.196, p = .845. This experiment may rule out the possibility that

DILLEY, L.C. & HEFFENER, C.C.
JoSS 3(1):3-67.
instances of Lannameraine with an F0 peak during U1 are heard as being double-accented, suggesting that
the three categories in the Lannameraine series cannot be interpreted merely as different combinations of
two accents, H* and H+L*.
We propose that the intonation category corresponding to contours with a peak during U1 for the
Lannameraine series corresponds to H*+H on S1. In Pierrehumbert (20), H*+H was assumed to
correspond most often to a plateau following a high accent, but it could also correspond to a single F0
peak. To this effect, Pierrehumbert (20) states that “[H*+H] contrasts with H* only in environments where
spreading can occur… the H*+H in a nonspreading environment would be realized as a single peak, just
as H* is.” (p. 228) Moreover, it is stated that the contrast between H*+H and H* is neutralized in nuclear
position (p. 230). It is proposed that the +H in H*+H corresponds to the F0 peak on U1 in SU1U2 contexts;
thus, the H* portion is associated with S1 according to this proposal. The results of stress judgments in
Experiment 4 are compatible with this interpretation, since the majority of participants indicated that S1
was stronger than S2 for most stimuli with a F0 peak during U1. In contrast, results from Experiment 4
suggest that H+L* is the correct analysis when an F0 peak occurs on a U2 immediately preceding an S2
syllable. It is worth noting that H* +H is a possible annotation in the recently proposed Rhythm and Pitch
(RaP) prosodic labeling system for corpora and other recorded speech samples (99, 100), which presents
an alternative to the ToBI system and which builds on AM theory and work in phonetics and linguistics
which has taken place since the early 1990s.
Other phonological interpretations of the category with a peak during U1 for the Lannameraine
series may be considered, but seem less plausible to us than H*+H. One possibility is that this category is
L+H*, an accent which has been noted to have a peak that sometimes occurs after the stressed syllable
(11). However, such an accent is associated with a low F0 associated with the unstarred L+ tone on a
prestress syllable(s) immediately preceding the starred tone (11). The Lannameraine series was
specifically designed with prestress syllables which were high in the pitch range and evidenced a rising
contour in order to preclude a L+H* interpretation, as described in Section 2.1.3. Another possibility
suggested by a reviewer was that the category with a peak during U1 for the Lannameraine series
corresponds to L*+H, which has been often noted to evince an F0 peak after the stressed syllable (7, 11,
32). However, this accent is defined by an F0 on the accented syllable (which would be S1 in such a
scenario) which is low in the speaker’s pitch range (7, 11, 32); however, S1 in these stimuli had an F0
which was high in the speaker’s pitch range. Therefore, we cannot find support for the interpretation of
L*+H for this category.
It is noteworthy that while all participants across these experiments were speakers of American
English, they likely represented a diverse set of dialectic backgrounds. Dialectic variation may have
contributed some variability to the results across experiments and stimulus series, though this variability

The role of f0 alignment in distinguishing intonation categories: evidence from American English
JoSS 3(1):3-67
did not hinder obtaining significant differences on relevant variables. Production differences in alignment
have been noted for distinct dialects of American English. For example, speakers of English dialects
spoken in southern California show later peak alignment than speakers of English dialects spoken in
Minnesota (101); see also Ladd, Schepman (102) for British English. However, it is not known whether
these dialect-based production differences translate to perception differences, or whether some categorical
differences may have been triggered by familiarity with dialectic differences.
Finally, it is noteworthy that while all four stimulus series involved varying the timing of an F0
extremum across part of a critical SU(U)S syllable sequence, three of the stimulus series (lemonade,
nonrenewable, and millionaire) contained a SUS syllable sequence while only one (the Lannameraine
series) contained a SUUS sequence. This was done due to the substantial ambiguity in phonological
analysis of F0 peaks on unstressed syllables under AM theory, in contrast to its rather clear phonological
analysis of F0 valleys as tones (see Sections 1.1.2 and 1.1.3). As a result, these experiments were not
designed to test whether varying an F0 valley across a SUU sequence would have given rise to two
categories or three, a question which awaits further experimentation. However, based on our findings
across experiments that word-internal syllable boundaries tend to give rise to evidence of phonological
category boundaries, we would predict that varying an F0 valley across a SUU sequence would give rise
to evidence of three categories.
6.2. Implications for Previous Studies of Intonation
The present results have implications for interpretations of previous studies of American English
intonation. First, Silverman and Pierrehumbert’s (15) study of phonetic factors influencing high F0 peak
timing has been interpreted as supporting the idea that the F0 peak for H* can be timed to occur well past
the associated syllable, for example, in the nucleus of an adjacent poststress syllable (24). Our data
suggest that the F0 peak for H* may occur as late as the onset of the following poststress syllable, but no
later, without hearing the contour as a different accentual category.
These results also have implications for interpretation of data presented by Pierrehumbert and
Steele (46). In that study, an F0 elbow-peak sequence was shifted through the U1S1U2S2 sequence a
million- in the phase Only a millionaire. The peak itself was shifted from the S1 to the following U2
syllable. Pierrehumbert and Steele interpreted their findings as support for the distinction between L+H*
and L*+H accents. However, the fact that the word millionaire has variable lexical stress in general
American English was not considered in that study. Results from the present experiments suggest that an
F0 peak on a prestress U syllable causes the immediately following stressed syllable to sound accented.
The results of our Experiment 4 cast Pierrehumbert and Steele’s findings in a different light by suggesting

DILLEY, L.C. & HEFFENER, C.C.
JoSS 3(1):3-67.
that contours with an F0 peak on S1 versus an adjacent U2 (e.g., in U1S1U2S2) are heard as having different
relative prominence patterns. That is, our results suggest that the pitch accent is heard as being on S1 if the
peak is on S1 but as being on S2 if the peak is on U2. This “stress shift” could have explained the bimodal
patterning of data, and our results are inconsistent with their phonological interpretation that the two
categories involved L+H* on S1 vs. L*+H on S1. Thus, support for the L+H* vs. L*+H distinction is less
clear following these experiments, although the present study supports the distinction between the related
accent distinction of L* vs. L+H*. We do not dispute the existence of a phonological representation that
involves L*+H. Rather, we take the present experiments as support for the phonological analysis offered
by the RaP system and Dilley (30), namely, that the contour on millionaire analyzed by Pierrehumbert and
Steele with a L*+H accent (i.e., as L*+H L H%) should instead be analyzed as double-accented: L* +H
L* H(%).
6.3. Implications for Phonetic Interpolation Functions in AM Theory
The present results also have implications for phonetic models under AM theory. Two types of
phonetic interpolation functions have been put forward explicitly in the literature as part of phonetic
models. First, monotonic interpolation was proposed in Pierrehumbert (20) to occur between any pair of
adjacent tones except adjacent H tones. Second, a specific type of nonmonotonic interpolation function
was assumed in Pierrehumbert (20) to connect pairs of adjacent H tones. This nonmonotonic interpolation
function has been referred to as a “sagging” nonmonotonic interpolation function because it involved an
F0 fall and subsequent rise, thereby generating a low F0 turning point or “sag” which was assumed not to
be a tone. That this “sagging” F0 transition was assumed to arise from something other than a L tone has
been a point of controversy within AM theory ever since (103). Subsequent phonetic evidence suggests
instead that this low “sag” actually arises from a phonological L tone (40).
These two types of interpolation functions – monotonic functions and nonmonotonic “sagging”
interpolation functions – are the only two which have been explicitly discussed in the literature. However,
theoretical revisions in the AM framework which have taken place since Pierrehumbert’s original (20)
proposals have given rise to effective assumptions of two additional types of interpolation functions
connecting H tones which have received no discussion in the literature. The first of these is a monotonic
function which connects adjacent H tones; recall that adjacent H tones were assumed in Pierrehumbert
(20) to be connected by a nonmonotonic “sagging” interpolation function. The assumption of a possible
monotonic interpolation function connecting adjacent H tones arose due to the merging of H*+H with H*
by Beckman and Pierrehumbert (21); the plateau contours originally described as H*+H H* by
Pierrehumbert (20) were subsequently treated as H* H* by Beckman and Pierrehumbert (21). The H*+H

The role of f0 alignment in distinguishing intonation categories: evidence from American English
JoSS 3(1):3-67
accent was originally assumed to give rise to a plateau, and not a series of sags, due to “spreading” of
tones (i.e. perseveration of the phonological tone in time). H*+H was eliminated in a footnote in Beckman
and Pierrehumbert (21) with little explanation and no discussion of the implications for AM theoretic
treatment of interpolation functions.
Finally, the last type of interpolation function that has arisen through theoretical developments
since Pierrehumbert (20) is what might be called a nonmonotonic “bulging” function; this corresponds to
the contours in Figure 1(c)-ii and 1(c)-iii. In this case, the underlying phonological H starred tone arising
from a H* (or L+H*) accent is assumed to occur on (i.e., be phonologically associated with) the stressed
syllable, but an F0 peak occurs temporally later than this H tone by one or two syllables and is thus “late”
relative to the stressed syllable with which the H tone is phonologically associated. The contour
connecting the H tone on the stressed syllable thus must nonmonotonically rise and then subsequently fall,
giving rise to an F0 peak which is not itself assumed to be a direct reflection of an underlying tone. This
type of nonmonotonic function arose as a result of the assumption which became widespread following
the work of Silverman and Pierrehumbert (15) that H* accents may be realized with a peak which occurs
temporally late due to production factors (15, 24).
The foregoing review suggests that current standard versions of AM theory permit three means of
connecting H tones to other tones via interpolation functions. That is, an H tone can be connected to
another tone either via a nonmonotonic “sagging” interpolation function as proposed originally in
Pierrehumbert (20), a monotonic interpolation function, or a nonmonotonic “bulging” interpolation
function. The principles distinguishing these cases have not been discussed anywhere in the literature, nor
their existence tested empirically.
The present results provide evidence against the existence of nonmonotonic “bulging”
interpolation functions (15, 20). In particular, these results show that in SU1(U2) contexts, when F0
contours have a high F0 peak aligned with a poststress syllable (U1 or U2), listeners hear the contour as
belonging to a different category than F0 contours which have a high F0 peak on the stressed syllable.
Furthermore, our data suggest that alignment of an F0 peak on a syllable U1 also results in perception of a
different category from alignment of an F0 peak on a syllable U2.
By extension, the present results provide evidence that F0 contours with extrema on different sides
of a syllable boundary are likely to be heard as distinct phonological categories. In particular, the present
results revealed that distinct patterns of alignment with respect to a SUU syllable sequence yielded
evidence of three intonational categories. Since F0 contours with a high peak during a stressed syllable are
recognized as being canonical examples of H*, F0 contours with a high peak during the nucleus or rhyme
of a poststress syllable must therefore be something different from H*. It was suggested earlier that these
latter contours are instances of H*+H or H+L*, depending on the number of poststress syllables.

DILLEY, L.C. & HEFFENER, C.C.
JoSS 3(1):3-67.
Moreover, evidence against nonmonotonic “sagging” interpolation functions has been accumulating. First,
the original theoretical justification by Pierrehumbert (20) for assuming that a dip between H tones was
not a L tone but instead nonmonotonic “sagging” interpolation – namely, that an L tone should
obligatorily trigger lowering of the upcoming high tone – was later rescinded (45). In addition, Ladd and
Schepman (40) presented data showing that when speakers produce an F0 valley (dip) in the context of
two surrounding high peak accents, the valley is consistently aligned with the unstressed syllable before
the second stressed peak. This consistent alignment suggests that the dip is actually a L tone, rather than a
nonmonotonic “sagging” F0 transition between H tones.
6.4. Implications for Speech Perception
The experiments presented here also have interesting implications for studies of speech
perception. This becomes particularly apparent when considering the results of Experiment 2, where
logistic analyses were performed just for the Higher Sensitivity Group. What does it mean for intonational
categories to be more easily perceived by some participants than others? First, it spotlights the role of
individual differences in perception of phonological contrasts, complementing previous studies, for
example, in language acquisition (104, 105). Speakers of tonal languages, in which listeners are required
to make use of fundamental frequency characteristics of speech in order to distinguish lexical items, differ
in their neural responses to linguistic pitch information (106-108). Musical abilities also influence pitch
perception. Those with musical training have more acute pitch processing abilities than those without
(109), whereas those with the congenital impairment of amusia may have difficulty with pitch processing
both in music and in speech (110, 111). These findings collectively suggest that individuals differ in their
pitch perception ability as a function of both listening experience and innate ability; these factors can
affect how accurately individuals detect pitch changes in speech, which is an issue of ongoing research.
The participants in this experiment had a range of typical musical experience, which may have translated
to differences in F0 contour perception.
Another possible explanation for individual variability in ability to perceive F0 categories which is
not mutually exclusive with those mentioned above concerns the choice of stimuli for the present
experiment. Collectively, Experiments 1-4 supported the hypotheses that alignment differences signal
different intonation categories; Experiment 4 in particular supported our hypothesis that such alignment
differences signal shifts in relative prominence. In our stimuli, F0 extremum alignment was shifted
through individual lexical items, in order to eliminate the possibility that F0 alignment differences could
be attributed to factors other than type of pitch accent, such as different phrase accent configurations.
However, were the F0 extrema to have been shifted across a word boundary in a short phrase, we would

The role of f0 alignment in distinguishing intonation categories: evidence from American English
JoSS 3(1):3-67
likely have expected differences in meaning due to differences in focus arising from the relative
prominence difference. For example, if the critical SU sequence were “red um-” in the phrase She took the
red umbrella, then based on our results we would expect different alignment characteristics of an F0
extremum across this sequence to generate distinct patterns of relative prominence, and hence different
patterns of focus (i.e., meaning). For example, a peak on “red” would be expected to generate the
perception that the strongest stress was on “red” (i.e., She took the RED umbrella, with narrow focus on
“red”), whereas a peak on “um-” would be expected to generate the perception that the strongest stress
was on “umbrella” (i.e., She took the red umBRELla, with narrow focus on “umbrella” or else broad focus
across the whole phrase). However, differences in relative prominence across a single word (e.g., on the
first vs. last syllable of ‘millionaire’) did not generate such meaning differences. We expect that some
listeners might have been more sensitive to the fine-grained pitch changes investigated here if the
perceptual categories had readily mapped to meaning differences, while other listeners were more able to
perceive and remember the characteristics of the perceptual categories themselves.
Alternatively, a reviewer suggested that the F0 contours used in the study might not have provided
a viable means of signaling a word-final stress through intonation cues. We feel that this interpretation is
unlikely, for two reasons. First, the intonation patterns associated with pitch accents and used in the
present studies are well-attested in American English based on corpus data (50). Second, listeners as a
group responded with a high degree of consistency in reliably associating certain alignment patterns with
word-final stress, as revealed in Experiment 4. Still, subtle, as-yet unidentified characteristics of the
stimuli may have made caused a subset of listeners to perceive the stimuli in a less categorical fashion
than other listeners, where these characteristics may have related to differential viability of cues to
signaling stress on distinct syllables of one or more target words.
Moreover, preliminary analyses of spoken corpora support the idea that the differences found in
F0 peak alignment and resulting relative prominence differences likely generalize to spontaneous speech.
Shattuck-Hufnagel and colleagues (49) found that sequences such as those discussed here are not
uncommon in spontaneous speech, and the peak alignment for such sequences is subject to substantial
variation between speakers. Furthermore, differences in peak alignment led to the perception of
differences in relative prominence of syllables in the sequence. Further exploration of the issues raised
here in spontaneous speech awaits more refined corpus analysis or experimental manipulations of
spontaneously-produced sentences.
Several conclusions can be drawn from the present paper. First, variability in F0 peak and valley
alignment has differential significance for phonological representations; this finding provides perspective
on recent studies aimed at investigating fine-grained variation in F0 alignment by demonstrating that such
variability has differential importance for phonological representations. Second, evidence for the proposed

DILLEY, L.C. & HEFFENER, C.C.
JoSS 3(1):3-67.
distinctions in AM theory between two valley-related pitch accents – L* and L+H* – and among three
peak-related pitch accents – H*, H+L*, and H*+H – was presented. Third, positive evidence was found
against nonmonotonic “bulging” interpolation functions, which have arisen as a possibility due to other
theoretical developments in AM theory since interpolation functions were originally addressed in
Pierrehumbert (20). Finally, this work served to validate a combination of perception and production tasks
as useful methodologies for investigation of the types and number of intonational categories underlying F0
continua by demonstrating broadly converging evidence about categories across the different tasks (see
also 33). Each individual experiment shed light on certain aspects of phonological representations:
something about their size, shape, or realization. Collectively, these experiments ultimately elucidate our
understanding of the relationship between acoustic variables, perceptual representations, and higher-level
linguistic constructs.

The role of f0 alignment in distinguishing intonation categories: evidence from American English
JoSS 3(1):3-67
REFERENCES
1. D'Imperio M. On defining tonal targets from a perception perspective: Ohio State University; 2000.
2. Purcell E. Pitch peak location and the perception of Serbo-Croatian word tone. Journal of Phonetics. 1976;4:265-
70.
3. Bruce G. Swedish word accents in sentence perspective. Lund: Gleerups; 1977.
4. Kohler KJ. Categorical pitch perception. In: Viks U, editor. Proceedings of the 11th International Congress of
Phonetic Sciences; 1987; Tallinn.
5. House D. Tonal perception in speech. Lund: Lund University Press; 1990.
6. D'Imperio M, House D. Perception of questions and statements in Neapolitan Italian. Proceedings of Eurospeech;
1997; Rhodes, Greece.
7. Prieto P, van Santen J, Hirschberg J. Tonal alignment patterns in Spanish. Journal of Phonetics. 1995;23:429-51.
8. Caspers J, van Heuven VJ. Effects of time pressure on the phonetic realization fo the dutch accent-lending pitch
rise and fall. Phonetica. 1993;50:161-71.
9. Arvaniti A, Ladd DR, Mennen I. Stability of tonal alignment: The case of Greek prenuclear accents. Journal of
Phonetics. 1998;26:3-25.
10. Ladd DR, Mennen I, Schepman A. Phonological conditioning of peak alignment in rising pitch accents in Dutch.
Journal of the Acoustical Society of America. 2000;107(5):2685-96.
11. Ladd DR, Faulkner D, Faulkner H, Schepman A. Constant "segmental anchoring" of F0 movements under
changes in speech rate. Journal of the Acoustical Society of America. 1999;106(3):1543-54.
12. Dilley LC, Ladd DR, Schepman A. Alignment of L and H in bitonal pitch accents: Testing two hypotheses.
Journal of Phonetics. 2005;33(1):115-9.
13. Arvaniti A, Ladd DR, Mennen I. Effects of focus and "tonal crowding" in intonation: Evidence from Greek Polar
questions. Speech Communication. 2006;48:667-96.
14. Grice M, Ladd DR, Arvaniti A. On the place of phrase accents in intonational phonology. Phonology.
2000;17:143-86.
15. Silverman K, Pierrehumbert J. The timing of prenuclear high accents in English. In: Kingston J, Beckman M,
editors. Papers in Laboratory Phonology I: Between the Grammar and Physics of Speech. Cambridge: Cambridge
University Press; 1990. p. 71-106.
16. Xu Y. Effects of tone and focus on the formation and alignment of F0 contours. Journal of Phonetics.
1999;27:55-105.

DILLEY, L.C. & HEFFENER, C.C.
JoSS 3(1):3-67.
17. Schepman A, Lickley R, Ladd DR. Effects of vowel length and "right context" on the alignment of Dutch nuclear
accents. Journal of Phonetics. 2006;34:1-28.
18. Atterer M, Ladd DR. On the phonetics and phonology of "segmental anchoring" of F0: Evidence from German.
Journal of Phonetics. 2004;32(2):177-97.
19. Arvaniti A, Ladd DR, Mennen I. Tonal association and tonal alignment: Evidence from Greek polar questions
and contrastive statements. Language and Speech. 2006;49:421-50.
20. Pierrehumbert J. The phonology and phonetics of English intonation [Ph.D. dissertation]. Cambridge, MA: MIT;
1980.
21. Beckman M, Pierrehumbert J. Intonational structure in Japanese and English. Phonology Yearbook. 1986;3:255-
309.
22. Liberman M, Pierrehumbert J. Intonational invariance under changes in pitch range and length. In: Aronoff M,
Oerhle R, editors. Language Sound Structure. Cambridge, MA: MIT Press; 1984. p. 157-233.
23. Silverman K, Beckman M, Pierrehumbert J, Ostendorf M, Wightman CWS, Price P, et al. ToBI: A standard
scheme for labeling prosody. Proceedings of the 2nd International Conference on Spoken Language Processing
1992; Banff.
24. Beckman M, Ayers Elam G. Guidelines for ToBI labeling, version 3. Ohio State University; 1997.
25. Pike KL. The intonation of American English. Ann Arbor: University of Michigan Publications; 1945.
26. Liberman M. The intonation system of English [Ph.D. dissertation]. Cambridge, MA: MIT; 1975.
27. 't Hart J, Collier R, Cohen A. A perceptual study of intonation. Cambridge: Cambridge University Press; 1990.
28. Halliday MAK. Intonation and grammar in British English. Paris: Mouton; 1967.
29. Crystal D. Prosodic systems and intonation in English. Cambridge: Cambridge University Press; 1969.
30. Xu Y. Consistency of tone-syllable alignment across different syllable structures and speaking rates. Phonetica.
1998;55:179-203.
31. Xu Y, Wang QE. Pitch targets and their realization: Evidence from Mandarin Chinese. Speech Communication.
2001;33:319-37.
32. Xu Y. Speech melody as articulatorily implemented communicative functions. Speech Communication.
2005;46:220-51.
33. Prieto P. Experimental methods and paradigms for prosodic analysis. In: Cohn AC, Fougeron C, Huffman MK,
editors. The Oxford handbook of laboratory phonology. Oxford: OUP; 2011.
34. Hawkins S. Roles and representations of systematic fine phonetic detail in speech understanding. Journal of
Phonetics. 2003;31:373-405.

The role of f0 alignment in distinguishing intonation categories: evidence from American English
JoSS 3(1):3-67
35. Goldstein L, Fowler CA. Articulatory phonology: A phonology for public language use. In: Schiller NO, Meyer
AS, editors. Phonetics and phonology in language comprehension and production: Differences and similarities:
Mouton de Gruyter; 2003. p. 159-207.
36. Liberman AM, Whalen DH. On the relation of speech to language. Trends in Cognitive Sciences. 2000;4(5):187-
96.
37. Miller JL. On the internal structure of phonetic categories: A progress report. Cognition. 1994;50:271-85.
38. Kuhl P. Human adults and human infants show a "perceptual magnet effect" for the prototypes of speech
categories, monkeys do not. Perception & Psychophysics. 1991;50(2):93-107.
39. Xu Y. Fundamental frequency peak delay in Mandarin. Phonetica. 2001;58:26-52.
40. Ladd DR, Schepman A. "Sagging transitions" between high accent peaks in English: Experimental evidence.
Journal of Phonetics. 2003;31:81-112.
41. Ladd DR. Intonational phonology. Cambridge: Cambridge University Press; 1996.
42. Goldsmith J. Autosegmental phonology [Ph.D. dissertation]. Cambridge, MA: MIT; 1976.
43. Grice M. Leading tones and downstep in English. Phonology. 1995;12:183-233.
44. Dilley LC. The phonetics and phonology of tonal systems [Ph.D. dissertation]. Cambridge, MA: MIT; 2005.
45. Pierrehumbert J, Beckman M. Japanese tone structure. Cambridge, MA: MIT Press; 1988.
46. Pierrehumbert J, Steele SA. Categories of tonal alignment in English. Phonetica. 1989;46:181-96.
47. Redi LC. Categorical effects in production of pitch contours in English. Proceedings of the 15th International
Congress of the Phonetic Sciences; 2003; Barcelona.
48. Knight R-A. Peaks and plateaux: The production and perception of intonational high targets in English:
University of Cambridge; 2003.
49. Shattuck-Hufnagel S, Dilley LC, Veilleux N, Brugos A, Speer R. F0 peaks and valleys aligned with non-
prominent syllables can influence perceived prominence in adjacent syllables. Proceedings of Speech Prosody; 2004;
Nara, Japan.
50. Dainora A. An empirically based probabilistic model of intonation in American English: University of Chicago;
2001.
51. Dilley LC, Brown M. Effects of pitch range variation on F0 extrema in an imitation task. Journal of Phonetics.
2007;35:523-51.
52. Gussenhoven C. The phonology of tone and intonation. Cambridge: Cambridge University Press; 2004.
53. Ladd DR. Intonational Phonology. 2nd ed. Cambridge: Cambridge University Press; 2008.

DILLEY, L.C. & HEFFENER, C.C.
JoSS 3(1):3-67.
54. Pierrehumbert J. Phonetic diversity, statistical learning, and acquisition of phonology. Language and Speech.
2003;46(2-3):115-54.
55. Dilley LC. Pitch range variation in English tonal contrasts: Continuous or categorical? Proceedings of the
International Congress of Phonetic Sciences; 2007; Saarbruecken, Germany.
56. Rietveld ACM, Gussenhoven C. On the relation between pitch and excursion size prominence. Journal of
Phonetics. 1985;13:299-308.
57. Gussenhoven C, Rietveld ACM. Fundamental frequency declination in Dutch: Testing three hypotheses. Journal
of Phonetics. 1988;16:355-69.
58. Ladd DR, Verhoeven J, Jacobs K. Influence of adjacent pitch accents on each other's perceived prominence: Two
contradictory effects. Journal of Phonetics. 1994;22:87-99.
59. Calhoun S. Information structure and the prosodic structure of English: A probabilistic relationship [Ph.D.
dissertation]: University of Edinburgh; 2006.
60. Nash R, Mulac A. The intonation of verifiability. In: Waugh LR, van Schooneveld CH, editors. The Melody of
Language. Baltimore: University Park Press; 1980. p. 219-42.
61. Gussenhoven C, Rietveld T. The behavior of H* and L* under variations in pitch range in Dutch rising contours.
Language and Speech. 2000;43(2):183-203.
62. Liberman AM, Harris KS, Hoffman HS, Griffith BC. The discrimination of speech sounds within and across
phoneme boundaries. Journal of Experimental Psychology. 1957;54(5):358-68.
63. Repp BH. Categorical perception: Issues, methods, findings. In: Lass NJ, editor. Speech and Language:
Advances in Basic Research and Practice. 10. Orlando: Academic Press, Inc.; 1984. p. 243-335.
64. Massaro DW, Cohen MM. Categorical or continuous speech perception: A new test. Speech Communication.
1983;2(1):15-35.
65. Schouten MEH, van Hessen A. Modeling phoneme perception I: Categorical perception. Journal of the
Acoustical Society of America. 1992;92:1841-55.
66. Remijsen, B., van Heuven VJ. Gradient and categorical pitch dimensions in Dutch: Diagnostic tests. Proceedings
of the 14th International Congress of Phonetic Sciences; 1999; San Francisco.
67. Ladd DR, Morton R. The perception of intonational emphasis: Continuous or categorical? Journal of Phonetics.
1997;25:313-42.
68. Post B. Tonal and phrasal structures in French intonation. The Hague: Holland Academic Graphics; 2000.
69. Cummins F, Doherty CP, Dilley LC. Phrase-final pitch discrimination in English. Proceedings of Speech
Prosody; 2006; Dresden, Germany.

The role of f0 alignment in distinguishing intonation categories: evidence from American English
JoSS 3(1):3-67
70. Niebuhr O, Kohler KJ. Perception and cognitive processing of tonal alignment in German. Proceedings of the
International Symposium of Tonal Aspects of Languages: Emphasis on Tone Languages; 2004: Beijing, China, pp.
155-158.
71. Schneider K, Mobius B. Perceptual magnet effect in German boundary tones. Proceedings of Interspeech; 2005;
Lisbon.
72. MacMillan NA, Creelman CD. Detection theory: A user's guide. New York: Cambridge University Press; 1991.
73. Boersma P, Weenink D. Praat: Doing phonetics by computer [Computer program]. 4.0.26 ed: Software and
manual available online at http://www.praat.org; 2002.
74. Moulines E, Charpentier F. Pitch-synchronous waveform processing techniques for text-to-speech synthesis
using diphones. Speech Communication. 1990;9(5-6):453-67.
75. Niebuhr O. Perceptual study of timing variables in F0 peaks. Proceedings of the 15th International Congress of
Phonetic Sciences; 2003: Barcelona, pp. 1225-1228.
76. 't Hart J. F0 stylization in speech: Straight lines versus parabolas. Journal of the Acoustical Society of America.
1991;90(6):3368-71.
77. Studdert-Kennedy M, Hadding-Koch K. Auditory and linguistic processes in the perception of intonation
contours. Language and Speech. 1973;16:293-313.
78. Gósy M, Terken J. Question marking in Hungarian: Timing and height of pitch peaks. Journal of Phonetics.
1994;22:269-81.
79. Demany L, McAnally KI. The perception of frequency peaks and troughs in wide frequency modulations.
Journal of the Acoustical Society of America. 1994;96:706-15.
80. d'Alessandro C, Mertens P. Automatic pitch contour stylization using a model of tonal perception. Computer
Speech and Language. 1995;9(3):257-88.
81. Rossi M. The perception of non-repetitive intensity glides on vowels. Journal of Phonetics. 1978;6:9-18.
82. Baddeley A. Working memory: Looking back and looking forward. Nature Reviews Neuroscience. 2003;4:829-
39.
83. Foxton J, Dean J, Gee R, Peretz I, Griffiths TD. Characterization of deficits in pitch perception underlying 'tone
deafness'. Brain. 2004;127:801-10.
84. Semal C, Demany L. Individual differences in the sensitivity to pitch direction. Journal of the Acoustical Society
of America. 2006;120(6):3907-15.
85. Hyde KL, Peretz I. Brains that are out of tune but in time. Psychological Science. 2004;15(5):356-60.
86. Hallé PA, Chang Y-C, Best CT. Identification and discrimination of Mandarin Chinese tones by Mandarin
Chinese vs. French listeners. Journal of Phonetics. 2004:forthcoming.

DILLEY, L.C. & HEFFENER, C.C.
JoSS 3(1):3-67.
87. Redi LC, Shattuck-Hufnagel S. Variation in the realization of glottalization in normal speakers. Journal of
Phonetics. 2001;29(4):407-29.
88. Kochanski G, Grabe E, Coleman J, Rosner B. Loudness predicts prominence: Fundamental frequency lends little.
Journal of the Acoustical Society of America. 2005;118:1038-54.
89. Morton J, Jassem W. Acoustic correlates of stress. Language & Speech. 1965;8:148-58.
90. Fry DB. Duration and intensity as physical correlates of linguistic stress. Journal of the Acoustical Society of
America. 1955;27:765-8.
91. Fry DB. Experiments in the perception of stress. Language & Speech. 1958;1:126-52.
92. Heldner M. On the reliability of overall intensity and spectral emphasis as acoustic correlates of focal accents in
Swedish. Journal of Phonetics. 2003;31:39-62.
93. Earle MA. An acoustic phonetic study of Northern Vietnamese tones. Santa Barbara, CA: Speech
Communications Research Laboratory, Inc., 1975 SCRL Monograph Number 11.
94. Fry DB. Prosodic phenomena. In: Malmberg B, editor. Manual of Phonetics. Amsterdam: North-Holland; 1968.
p. 365-410.
95. Bolinger D. A theory of pitch accent in English. Word. 1958;14:109-49.
96. Morton J, Marcus S, Frankish C. Perceptual centers (P-centers). Psychological Review. 1976;83(5):405-8.
97. Arvaniti A, Ladd DR, Mennen I. What is a starred tone? Evidence from Greek. Papers in Laboratory Phonology
V: Cambridge University Press; 2000. p. 119-30.
98. Shattuck-Hufnagel S. Pitch accent patterns in adjacent-stress vs. alternating-stress words in American English.
International Congress of Phonetic Sciences; 1995; Stockholm.
99. Dilley LC, Brown M. The RaP (Rhythm and Pitch) Labeling System, Version 1.0. 2005.
100. Breen M, Dilley LC, Kraemer J, Gibson E. Inter-transcriber reliability for two systems of prosodic annotation:
ToBI (Tones and Break Indices) and RaP (Rhythm and Pitch). Corpus Linguistics and Linguistic Theory.
2012;8(2):277-312.
101. Arvaniti A, Garding G. Dialectical variation in the rising accents of American English. In: Cole J, Hualde JH,
editors. Papers in Laboratory Phonology 9. Berlin, New York: Mouton de Gruyter; 2007. p. 547-76.
102. Ladd DR, Schepman A, White L, Quarmby LM, Stackhouse R. Structural and dialectal effects on pitch peak
alignment in two varieties of British English. Journal of Phonetics. 2009;37(2):145-61.
103. Ladd DR. Tones and turning points: Bruce, Pierrehumbert, and the elements of intonational phonology. In:
Horne M, editor. Prosody: Theory and Experiment - Studies presented to Gosta Bruce. Dordrecht: Kluwer; 2000. p.
37-50.

The role of f0 alignment in distinguishing intonation categories: evidence from American English
JoSS 3(1):3-67
104. Wong PCM, Perrachione TK, Parrish TB. Neural characteristics of successful and less successful speech and
word learning in adults. Human Brain Mapping. 2007;28:995-1006.
105. Chandrasekaran B, Sampath PD, Wong PCM. Individual variability in cue-weighting and lexical tone learning.
Journal of the Acoustical Society of America. 2010;128(1):456-65.
106. Klein D, Zatorre RJ, Milner B, Zhao V. A cross-linguistic PET study of tone perception in Mandarin Chinese
and English speakers. NeuroImage. 2001;13:646-53.
107. Gandour J, Wong D, Hsieh L, Weinzapfel B, Van Lancker D, Hutchins GD. A crosslinguistic PET study of tone
perception. Journal of Cognitive Neuroscience. 2000;12:207-22.
108. Gandour J, Wong D, Hutchins G. Pitch processing in the human brain is influenced by language experience.
NeuroReport. 1998;9:2115-9.
109. Wong PCM, Skoe E, Russo NM, Dees T, Kraus N. Musical experience shapes human brainstem encoding of
linguistic pitch patterns. Nature Neuroscience. 2007;10(4):420-2.
110. Patel AD, Wong M, Foxton J, Lochy A, Peretz I. Speech intonation perception deficits in musical tone deafness
(congenital amusia). Music Perception. 2008;25(4):357-68.
111. Peretz I, Hyde KL. What is specific to music processing? Insights from congenital amusia. Trends in Cognitive
Sciences. 2003;7:362-7.