The Review of Economics and Statistics - u.osu.edu. 1 See Karolyi and Stulz (2003) for a review of...
17
The Review of Economics and Statistics VOL. LXXXVI NUMBER 3 AUGUST 2004 SYMPOSIUM ON GLOBAL LINKAGES John Y. Campbell, Harvard University The articles in this symposium were presented at a conference on the economic and financial linkages across countries, with a focus on recent developments and policy implications. The conference was sponsored and hosted by the International Monetary Fund in Washington, DC, on January 30–31, 2003. The Review is grateful to the conference organizers, Robin Brooks, Kristin Forbes, and Ashok Mody, for their work with the editor to create this symposium. ARE DAILY CROSS-BORDER EQUITY FLOWS PUSHED OR PULLED? John M. Griffin, Federico Nardari, and Rene ´ M. Stulz* Abstract—We investigate the conditions under which an intertemporal equilibrium model based on investors’ portfolio decisions can explain the dynamics of high-frequency equity flows. Our model shows that, when there are barriers to international investment and when the expectations of foreign investors are more extrapolative than those of domestic investors (either due to foreigners being less informed or for behavioral reasons), unexpectedly high worldwide or local stock returns lead to net equity inflows in small countries. We investigate these predictions using daily data on net equity flows for nine emerging-market countries. Equity flows are positively related to host-country stock returns as well as market performance abroad at daily frequencies. Though these effects are remark- ably robust at the daily frequency, they dissipate quickly. I. Introduction W ITHIN the neoclassical paradigm, capital flows to where its marginal product is higher. As a result, the allocation of capital is more efficient and welfare is higher if capital can flow freely across borders. The emerging market crises of the 1990s persuaded many to challenge that view. Since 1997, economists, policymakers, and journalists have talked about shocks being propagated across countries with little regard for fundamentals through the actions of an “electronic herd” (Friedman, 1999, p. 142) of investors. This led Bhagwati (1998) to state that “Capital flows are characterized, as the economic historian Charles Kindle- berger of the Massachusetts Institute of Technology has famously noted, by panics and manias.” If markets work this way, it is not surprising that Stiglitz (1998), calling for greater regulation of capital flows, argues that “. . . devel- oping countries are more vulnerable to vacillations in inter- national flows than ever before.” In this paper, we investigate the determinants of daily cross-border equity flows for a sample of countries. Our paper builds upon existing empirical observations about holdings of foreign equity by domestic investors. 1 First, the home-bias evidence shows that domestic investors hold less foreign equity than if they held the world market portfolio. Second, there is some evidence that domestic investors buy foreign stocks following unexpectedly high returns on these stocks, a behavior often characterized as trend-chasing or momentum investing. We build a simple intertemporal model of equity flows and show under which conditions the model yields predictions consistent with these empirical facts. We find that a model consistent with these facts also predicts a relation between flows and nonhost-country stock returns that has not been examined empirically in the published literature. Our main theoretical results are that (1) a model with perfect financial markets and investors who know the true distribution of returns cannot explain the existing evidence on flows, (2) the expectations of nonresident investors regarding the expected returns of a market have to be more extrapolative than the expectations of resident investors in Received for publication March 21, 2003. Revision accepted for publi- cation August 4, 2003. * University of Texas at Austin; Arizona State University; and Ohio State University and NBER, respectively. The research assistance of Patrick Kelly, Susan Ji, and Sriram Villu- puram is greatly appreciated. We also thank Don Hartman for his help in obtaining some of the data. We are grateful for comments from Seung (Min) Ahn, John Campbell (the editor), Gene Fama, Cam Harvey, Andrew Karolyi, Anusha Chari, Hali Edison, Gunter Franke, Ajay Khorana, Spencer Martin, Steve Kamin, Carmen Reinhart, Mark Seasholes, Frank Warnock, two anonymous referees, and participants at seminars at the IMF, the Ohio State University, the University of Arizona, the University of Michigan, Vanderbilt University, the Georgia Tech International Fi- nance Conference, the American Finance Association Meetings, the Con- ference honoring Michael Brennan in Siena, and the IMF Global Linkages Conference. 1 See Karolyi and Stulz (2003) for a review of this literature. The Review of Economics and Statistics, August 2004, 86(3): 641–657 © 2004 by the President and Fellows of Harvard College and the Massachusetts Institute of Technology
Transcript of The Review of Economics and Statistics - u.osu.edu. 1 See Karolyi and Stulz (2003) for a review of...

The Review of Economics and StatisticsVOL. LXXXVI NUMBER 3AUGUST 2004
SYMPOSIUM ON GLOBAL LINKAGESJohn Y. Campbell, Harvard University
The articles in this symposium were presented at a conference on the economic and financial linkages acrosscountries, with a focus on recent developments and policy implications. The conference was sponsored and hostedby the International Monetary Fund in Washington, DC, on January 30–31, 2003. The Review is grateful to theconference organizers, Robin Brooks, Kristin Forbes, and Ashok Mody, for their work with the editor to create thissymposium.
ARE DAILY CROSS-BORDER EQUITY FLOWS PUSHED OR PULLED?
John M. Griffin, Federico Nardari, and Rene M. Stulz*
Abstract—We investigate the conditions under which an intertemporalequilibrium model based on investors’ portfolio decisions can explain thedynamics of high-frequency equity flows. Our model shows that, whenthere are barriers to international investment and when the expectations offoreign investors are more extrapolative than those of domestic investors(either due to foreigners being less informed or for behavioral reasons),unexpectedly high worldwide or local stock returns lead to net equityinflows in small countries. We investigate these predictions using dailydata on net equity flows for nine emerging-market countries. Equity flowsare positively related to host-country stock returns as well as marketperformance abroad at daily frequencies. Though these effects are remark-ably robust at the daily frequency, they dissipate quickly.
I. Introduction
WITHIN the neoclassical paradigm, capital flows towhere its marginal product is higher. As a result, the
allocation of capital is more efficient and welfare is higherif capital can flow freely across borders. The emergingmarket crises of the 1990s persuaded many to challenge thatview. Since 1997, economists, policymakers, and journalistshave talked about shocks being propagated across countrieswith little regard for fundamentals through the actions of an
“electronic herd” (Friedman, 1999, p. 142) of investors.This led Bhagwati (1998) to state that “Capital flows arecharacterized, as the economic historian Charles Kindle-berger of the Massachusetts Institute of Technology hasfamously noted, by panics and manias.” If markets workthis way, it is not surprising that Stiglitz (1998), calling forgreater regulation of capital flows, argues that “. . . devel-oping countries are more vulnerable to vacillations in inter-national flows than ever before.”
In this paper, we investigate the determinants of dailycross-border equity flows for a sample of countries. Ourpaper builds upon existing empirical observations aboutholdings of foreign equity by domestic investors.1 First, thehome-bias evidence shows that domestic investors hold lessforeign equity than if they held the world market portfolio.Second, there is some evidence that domestic investors buyforeign stocks following unexpectedly high returns on thesestocks, a behavior often characterized as trend-chasing ormomentum investing. We build a simple intertemporalmodel of equity flows and show under which conditions themodel yields predictions consistent with these empiricalfacts. We find that a model consistent with these facts alsopredicts a relation between flows and nonhost-country stockreturns that has not been examined empirically in thepublished literature.
Our main theoretical results are that (1) a model withperfect financial markets and investors who know the truedistribution of returns cannot explain the existing evidenceon flows, (2) the expectations of nonresident investorsregarding the expected returns of a market have to be moreextrapolative than the expectations of resident investors in
Received for publication March 21, 2003. Revision accepted for publi-cation August 4, 2003.
* University of Texas at Austin; Arizona State University; and OhioState University and NBER, respectively.
The research assistance of Patrick Kelly, Susan Ji, and Sriram Villu-puram is greatly appreciated. We also thank Don Hartman for his help inobtaining some of the data. We are grateful for comments from Seung(Min) Ahn, John Campbell (the editor), Gene Fama, Cam Harvey, AndrewKarolyi, Anusha Chari, Hali Edison, Gunter Franke, Ajay Khorana,Spencer Martin, Steve Kamin, Carmen Reinhart, Mark Seasholes, FrankWarnock, two anonymous referees, and participants at seminars at theIMF, the Ohio State University, the University of Arizona, the Universityof Michigan, Vanderbilt University, the Georgia Tech International Fi-nance Conference, the American Finance Association Meetings, the Con-ference honoring Michael Brennan in Siena, and the IMF Global LinkagesConference. 1 See Karolyi and Stulz (2003) for a review of this literature.
The Review of Economics and Statistics, August 2004, 86(3): 641–657© 2004 by the President and Fellows of Harvard College and the Massachusetts Institute of Technology

order to explain the evidence that unexpectedly high stockreturns in a country, say Thailand, attract equity flowstoward that country, and (3) in a model where there is ahome bias and extrapolative expectations, net equity flowstoward small countries such as Thailand increase withunexpectedly high worldwide stock returns.
To examine the implications of our simple model, we usea unique data set of aggregate equity flows in nine emergingmarkets.2 When testing the prediction of our model thatflows into a country increase with the performance of othermarkets, we find that lagged returns in bigger markets suchas the United States are helpful to understand flows intosmaller countries such as Thailand. Adding lagged returnsof other markets in a vector autoregression (VAR) of flowsand returns improves the R2 of the flow equation by roughly25% on average. Though local market returns have aneconomically significant effect on flows, our impulse re-sponse analysis shows that flows are generally more respon-sive to past U.S. market performance than to local returns.These daily results persist even after controlling for con-temporaneous effects, pooled analysis, alternative methodsof scaling flows, exchange rate effects, regional flows,currency of denomination, structural breaks, and asymme-tries. However, these effects dissipate rapidly, and at theweekly frequency we find very limited evidence of foreign-ers chasing past local and international returns.
Some papers have explored the relation between equityflows toward foreign countries and U.S. returns usingmonthly and quarterly data. The evidence is mixed, possiblybecause of a lack of power or because analyses using suchdata may be misspecified over longer periods of time thatencompass economic regime changes. Bohn and Tesar(1996) investigate the contemporaneous effect of U.S. re-turns and host-country returns on monthly equity flows fromthe United States. Using a portfolio demand equation forindividuals, they predict a portfolio-rebalancing effect and areturn-chasing effect. With the rebalancing effect, investorssell equities from countries that are the best performers intheir portfolio, for they have become overweighted in thesesecurities. They predict that the portfolio-rebalancing effectimplies that a high U.S. return is accompanied by flowstoward foreign countries. However, most of the correlationsbetween contemporaneous flows and the U.S. return inexcess of the host-country return are insignificant in theirdata set, and no correlation is significantly positive.
Brennan and Cao (1997) present a model in which for-eign investors are less informed than host-country investorsabout host-country stocks. Because of their informationdisadvantage, foreign investors learn more from public
news. Good news announcements lead them to buy stocksfrom host-country investors. They argue that stock pur-chases by foreign investors in the host country could beassociated with high returns in the country of origin of theforeign investors due to wealth effects. Since their investorshave exponential utility functions, they cannot model suchwealth effects, but they allow for them in their regressions.Using quarterly data, they find that equity purchases fromU.S. investors of foreign-market securities are contempora-neously related to foreign-market performance but not re-lated to U.S. equity returns.
Froot, O’Connell, and Seasholes (2001) use daily flowdata to examine whether foreign capital precedes, moveswith, or follows short-term local-market return perfor-mance. They find that flows increase following unexpect-edly high returns in the host market and that they forecastreturns. They interpret their evidence to be consistent withthe view that foreign (say, American) investors are betterinformed about local (say, Thai) stocks than are local (Thai)investors. Because their data cover only custodian clientsfrom State Street, further research is needed to understandwhether their results describe the behavior of foreign inves-tors in general.
A related literature has focused on the relation betweencapital flows and U.S. interest rates and industrial produc-tion. Calvo, Leiderman, and Reinhart (1993), Chuhan, Clas-sens, and Mamingi (1998), and Fernandez-Arias (1996) allexamine data from 1988 to 1992, a period during which anumber of countries liberalized their capital flows, and findsome evidence that low interest rates in the United Stateslead to higher outflows from the United States. WhenBekaert, Harvey, and Lumsdaine (2002) take into accountregime changes brought about by capital flow liberaliza-tions, they fail to find a statistically significant relationbetween interest rates and flows. Edison and Warnock(2003) also take account of liberalization dates in a samplefrom 1989 through 1999 and find that an increase in U.S.interest rates reduces monthly net flows to some emergingcountries.
This paper proceeds as follows. In section II, we presentour model of how stock returns affect equity flows and thetestable hypotheses we derive from the model. In section III,we describe the composition of the foreign flow data andexamine their basic features. Section IV examines the extentof foreign-investor positive-feedback trading within a coun-try and whether foreign investors’ trading behavior fore-shadows future price movements. The effect of regionalreturns on flows is examined in Section V and comparedwith that of local returns. Section VI examines the robust-ness of our results to the scaling of flows, exchange rateeffects, foreign flows, currency of denomination, time peri-ods, structural breaks, return asymmetries, and the use ofweekly data. Section VII concludes.
2 In a study developed independently, Richards (2004) relies on similarflow data from a subset of the countries considered here and for the period1999–2001. He examines several of the relationships analyzed in thepresent paper.
THE REVIEW OF ECONOMICS AND STATISTICS642

II. A Simple Model of Equity Flows
We develop an intertemporal continuous-time model.Investors are infinite-lived. To make the model tractable, weassume that investors have logarithmic utility, so that inves-tors are myopic, and that all investors are the same within acountry. For simplicity, we consider a world with twocountries, the domestic country D and the foreign countryF. We assume that each country has one stock (the marketportfolio of that country) and that the returns of the twostocks are uncorrelated. Let �D(t) and �D(t) be, respec-tively, the instantaneous drift minus the risk-free rate andthe instantaneous volatility of the diffusion process at date tfollowed by the instantaneous return of the domestic stock.We assume that trading is continuous, �D(t) and �D(t)evolve randomly over time, the outstanding supply of sharesof the domestic stock consists of ND
S shares, and a share hasprice PD. The subscript F denotes foreign values. Thoughportfolio choice models generally focus on portfolio shares,the available data on equity flows are in terms of netpurchases and not portfolio shares. We therefore deriveresults for net purchases. Let ND
D(t) be the number ofdomestic shares and NF
D(t) the number of foreign sharesdemanded by domestic investors. The aggregate wealth ofdomestic investors is WD(t). We follow Brennan and Cao(1997) in ignoring currencies, so that foreign nominal quan-tities are in the same currency as domestic nominal quanti-ties. The number of shares of stock in each country is keptfixed.
With internationally perfect capital markets where riskaversion does not differ across countries and where inves-tors consume the same consumption basket, all investorshold the world market portfolio and changes in expectedreturns do not lead to equity flows, because all investorsalways hold assets in the same proportions, which vitiatesthe possibility of a rebalancing effect. Below we first intro-duce a market imperfection—barriers to international in-vestment—so that there is a home bias. We then considerthe additional effect of extrapolative expectations.
A. The Effect of Barriers to International Investment
To introduce barriers to international investment, wefollow Stulz (1981) and assume that the return of domesticinvestors is lower than the return of foreign investors by apositive constant �D on a long position in the foreign stock.The barrier could represent any proportional costs to invest-ing abroad that lowers the net expected return relative to aresident investor. To simplify the analysis, we consider onlythe case where the equilibrium outcome is such that noinvestors hold short positions. With these assumptions, thedemand for foreign shares by domestic investors is
NFD �
�F � �D
�F2
WD
PF. (1)
Since nonresident investors have a lower expected return onlocal shares than resident investors, investors do not holdthe world market portfolio and exhibit a home bias. Thehome bias implies that a positive return on foreign sharesenriches foreign investors relatively more than it enrichesdomestic investors. Everything else equal, foreign investorswould like to take some of the gain from the increase invalue of their country’s shares and invest it abroad. How-ever, if domestic investors earn a dollar on foreign shares,they do not want to keep all of their gain abroad. Obviously,it is not possible for domestic and foreign investors to sellforeign shares at the same time, so that expected returnshave to adjust.
To determine the impact of an increase in the price offoreign shares on flows, we therefore have to turn to aninvestigation of the equilibrium holdings of foreign sharesby domestic investors. The equilibrium holdings of foreignshares by domestic investors and foreign investors arerespectively
NFD � NF
S � ��D
�F2 �� � 1��
WW
PF, (2)
NFF � NF
S�1 � �� ��D
�F2 ��1 � ��
WW
PF, (3)
where � is the ratio of domestic wealth to world wealth.Because � � 1, domestic investors have a lower equilib-rium allocation to foreign stocks in the presence of barriersto international investment than if �D were equal to 0, andforeign investors have a higher allocation. The derivative ofthe holdings of the foreign stock by domestic investors withrespect to the price of the foreign stock (shown in Section 1of the Appendix) cannot be signed unambiguously. How-ever, an increase in the price of the foreign stock decreasesthe holdings of that stock by domestic investors for thesymmetric case where both countries have initially the samesupplies of shares, share prices, wealth, and barriers tointernational investment. Following the increase in the priceof the foreign stock, the weight of the foreign stock mustincrease in the portfolios of investors in equilibrium. Thiscan happen only if the expected return on that stock in-creases. However, in the symmetric case, an increase in theexpected return of the stock has a greater impact on theholdings of the foreign stock by foreign investors, becausetheir wealth has increased more than the wealth of domesticinvestors.
It is useful to examine the properties of equations (2) and(3) numerically. We explore extensively a numerical exam-ple where the volatility of the return of the foreign stock is30%. The base case is PF � PD � 1, WD � WF � 10,NF
S � NDS � 10, �D � 3%. In this base case, domestic
investors hold 3.33 shares of foreign stock and foreigninvestors hold 6.67 shares. If the price of the foreign stockdoubles, domestic holdings of the foreign stock fall from
ARE DAILY CROSS-BORDER EQUITY FLOWS PUSHED OR PULLED? 643

3.33 to 3.20. If we double �D, the holdings of the foreignstock fall by roughly half, and the number of foreign sharesheld by domestic investors falls from 1.67 to 1.51 if theprice of the foreign stock doubles. Though the domesticholdings of the foreign stock generally fall when the price ofthe foreign stock increases, this is not the case when thedomestic country is small.
B. The Effect of Extrapolative Expectations
Suppose now that an unexpectedly high return on foreignstocks leads domestic, but not foreign, investors to expect ahigher return on these stocks. This can be justified for one oftwo reasons. First, if investors do not know the true ex-pected returns but are trying to estimate them with past data,then past returns are useful in forming expectations. As longas resident investors are better informed than nonresidentinvestors, our assumption could be derived from the opti-mizing behavior of investors.3 It could also be the result ofstronger extrapolative expectations for a country’s stockreturns of nonresident investors than of resident investors,on account of behavioral considerations.4 We do not modelthe formation of expectations. Let �F
D be the domesticinvestors’ expected return for the foreign stock. This ex-pected return now depends positively on the past foreignstock return. The foreign investors’ expected return for theforeign stock is assumed to not depend directly on pastreturns. For domestic stocks, the foreign investors’ expectedreturn depends on past domestic stock returns, but thedomestic investors’ expected return does not.
The Impact of Foreign Stock Price Changes: With �FD
positively related to past returns, the foreign stock becomesmore attractive to domestic investors if it has performedwell, which leads them to increase their holdings of thatstock. However, when the foreign stock performs well,foreign investors become overweighted in that stock andwant to sell some of their holdings to buy the domesticstock. As shown in Section 2 of the Appendix, as long as �F
D
increases enough following positive returns, the equilibriumholdings of the foreign stock by domestic investors increaseso that positive returns on the foreign stock lead them to buythat stock.
We can use our numerical example to investigate theimpact of an increase in the price of the foreign stock whendomestic investors expect a higher return on the foreignstock following an unexpectedly high return on that stock.
Using the symmetric case and setting the extrapolationcomponent of �F
D/�F2 , which we denote by F
D, equal to k PF/PF with k � 0.1, the equilibrium holdings of theforeign stock by domestic investors increase from 3.33shares to 3.58 shares with a doubling of the price of theforeign stock. Hence, in this case, foreign investors decreasetheir holdings of foreign shares from 6.67 to 6.42 shares.With weaker extrapolative expectations, however, it be-comes possible for the holdings of the foreign stock bydomestic investors to fall when the foreign stock earns anunexpectedly high return.
The Impact of Domestic Stock Price Changes: Considernow the impact of an unexpectedly high increase in thedomestic stock price on net flows to the foreign country. Theforeign residents investing in the domestic country expect toearn �F � F
D less than domestic investors on domesticstocks. In this case, the demand for the domestic asset byforeign investors is
NDF � ND
S �1 � �� � ��D � FD
�F2 ���1 � ��
WW
PD. (4)
We set the extrapolative component of the domestic stockexpected return for foreign investors to 0.1 PD/PD.Starting from the base case, high past returns on the domes-tic stock increase the demand for the domestic stock forforeign investors, because they increase the expected returnon that stock for these investors; however, the effect isdampened by the rebalancing effect for these investors,which induces them to sell some of their holdings of thedomestic stock. The rebalancing effect for domestic inves-tors leads them to buy the foreign stock. When the domesticcountry is large enough compared to the foreign country andexpectations are sufficiently extrapolative, domestic inves-tors increase their holdings of the foreign stock followinghigh returns on the domestic stock.
C. Summary of Model Implications
Our model shows that equity flows depend on stockreturns both in the host market and outside the host market.If nonresident investors in a market have extrapolativeexpectations for the expected return of that market, equilib-rium holdings of foreign stocks by nonresident investorsrelate as follows to past returns:
Result 1. Unexpectedly high returns on foreign stocks areaccompanied by net equity flows into the foreign country aslong as expectations are sufficiently extrapolative and thewealth of the domestic country is large relative to the wealthof the foreign country.
Result 2. Unexpectedly high returns on domestic stocksare accompanied by net equity flows into the foreign coun-try as long as expectations are sufficiently extrapolative and
3 Though not formulated in an international context, the model ofWilliams (1977) leads to such a result directly. Evidence that foreigninvestors are less informed than domestic investors at the individual stocklevel is provided by Choe, Kho, and Stulz (2004) and Dvorak (2004),whereas Seasholes (2000) argues that foreign investors actually have moreinformation prior to earnings announcements. Froot and Ramadorai(2002) and Pavabutr and Yan (2003) provide evidence supportive offoreign investors possessing information about future market returns.
4 For instance, Hong and Stein (1999) have a group of investors whoestimate expected returns by estimating a univariate regression on a shorttime series of returns. These investors have extrapolative expectations.
THE REVIEW OF ECONOMICS AND STATISTICS644

the wealth of the domestic country is large relative to thewealth of the foreign country.
The model of this section is admittedly very simple. It isalso incomplete in the sense that we do not derive howexpectations are formed, yet extrapolative expectations arecritical to make sense of the empirical evidence. The impactof a high return on the foreign stock on the asset allocationof domestic investors could be short-lived. With rationalextrapolative expectations, there will be cases where inves-tors ex post gave too much weight to yesterday’s high returnand reduce their allocation to the foreign stock following asequence of “normal” returns. Our model does not allow usto work out the dynamics of flow over longer periods oftime. Further work is required to extend the model toaccount for flow persistence. This model is consistent withthe home bias noted at the beginning of the paper. Theattributes of our model that make it consistent with existingevidence also lead to a new empirical prediction (Result 2)that we can test. In addition, though some evidence forResult 1 has been provided in the literature, we test Result 1with short-term aggregate flow data.
III. Data Description
In testing predictions such as Results 1 and 2 above, it isparticularly useful to use high-frequency data. Daily dataallow for a better examination of lead–lag dynamics be-tween flows and returns that, with lower-frequency data
(namely, monthly or quarterly), would likely appear ascontemporaneous relationships. To construct a data set ofdaily equity flows, we contacted approximately 60 stockexchanges and 12 regulatory agencies with Web sites on theInternet.5 In all, we obtained data on foreign flows from ninemarkets, and these markets include the East Asian marketsthat have been the focus in the controversies surroundingthe potentially destabilizing influence of flows.6
Our final sample consists of data from five countries inEast Asia (Indonesia, Korea, the Philippines, Taiwan, andThailand), two in South Asia (India and Sri Lanka), one ineastern Europe (Slovenia), and one in Africa (South Africa).Since these data are recorded by the exchange, they have theadvantage of including all the recorded trades of foreigninvestors on the stock exchange. (They do not, however,include derivatives transactions that may be functionallyequivalent to stock transactions.) As shown in Table 1, thedata begin in January 1996 for Korea, Indonesia, and SouthAfrica, 1997 for Taiwan and Thailand, 1998 for India, SriLanka, and Slovenia, and 1999 for the Philippines. Theending date for daily analysis is February 23, 2001 for all
5 Some of the Web sites we used for finding stock exchanges andregulating agencies are www.gsionline.com/exchange.htm, www.world-exchanges.com, and www.iosco.org.
6 Private data vendors were helpful in obtaining data from two othercountries. We were not able to obtain flow data for two countries for whichstudies using daily data have been published: Sweden and Finland.
TABLE 1.—SUMMARY STATISTICS OF NET CAPITAL FLOWS AND MARKET RETURN BY COUNTRY
Country Start Date Mean MedianStd.Dev. lag 1 lag 2 lag 3 lag 4 lag 5 Corr.
EastAsia
Indonesia Jan. 2, 1996 Flow 0.008 0.003 0.030 0.33* 0.24* 0.18* 0.12* 0.13* 0.375*Ret. �0.021 �0.051 2.361 0.13* 0.01* �0.02* �0.07* 0.01*
Korea Jan. 4, 1996 Flow 0.013 0.006 0.055 0.49* 0.32* 0.29* 0.24* 0.25* 0.270*Ret. 0.000 �0.068 2.739 0.08* �0.03* �0.05* �0.04* �0.06*
Philippines Jun. 1, 1999 Flow �0.003 �0.004 0.022 0.42* 0.22* 0.15* 0.12* 0.13* 0.325*Ret. �0.081 �0.040 1.533 0.11* �0.05* �0.07* 0.03 �0.01
Taiwan Apr. 1, 1997 Flow 0.007 0.006 0.027 0.47* 0.34* 0.23* 0.21* 0.18* 0.282*Ret. �0.006 �0.066 2.031 0.01 0.05 0.03 �0.13* 0.02*
Thailand Dec. 1, 1997 Flow 0.002 �0.004 0.041 0.48* 0.34* 0.28* 0.27* 0.27* 0.441*Ret. �0.007 �0.240 2.686 0.10* 0.05* �0.01* �0.04* �0.01*
South Asia
India Dec. 31, 1998 Flow 0.007 0.006 0.024 0.23* 0.20* 0.18* 0.12* 0.13* 0.218*Ret. 0.050 0.142 1.886 �0.01 0.08 0.00 0.02 �0.03
Sri Lanka Aug. 17, 1998 Flow �0.007 �0.003 0.024 0.17* 0.17* 0.16* 0.09* 0.10* 0.070Ret. �0.013 0.000 1.107 0.27* 0.10* 0.12* 0.02* 0.09*
Other
Slovenia Mar. 2, 1998 Flow 0.000 0.000 0.010 0.58* 0.47* 0.46* 0.38* 0.40* �0.096*Ret. 0.031 �0.001 0.825 0.25* 0.14* �0.04* �0.04* �0.05*
S. Africa Jan. 2, 1996 Flow 0.015 0.012 0.024 0.24* 0.20* 0.22* 0.16* 0.19* �0.086*Ret. 0.052 0.089 1.394 0.13* 0.08* 0.00* �0.02* �0.01*
This table reports descriptive statistics for daily net capital flows and market return in each country. Net flows are defined as (buy value) � (sell value) by foreign investors, scaled by previous-day marketcapitalization. To control for abnormal capital inflows, observations above the 99th percentile of the daily net flow distribution are set equal to the 99th percentile point. Returns and scaled net flows are expressedin local currency and in percentage terms. Returns are continuously compounded returns on the country stock market index. For each country the table shows the starting date of the sample, the mean, median, andstandard deviation of net flows and returns, the contemporaneous correlation between net flows and returns, and the first five autocorrelation estimates for each series. The end date for all countries is February 23,2001 except for Slovenia, which has an ending date of January 31, 2001.
*Significant at the 5% level.
ARE DAILY CROSS-BORDER EQUITY FLOWS PUSHED OR PULLED? 645

countries except Slovenia, which ends on January 31, 2001.The flows we consider contain trading by both foreigninstitutions and foreign individual investors. A legitimateissue is whether we should report results for Slovenia, SouthAfrica, and Sri Lanka. Slovenia and Sri Lanka each repre-sent less than 0.01% of the world market capitalization in1997. South Africa represents a substantially larger market,but it is a country that suffered substantial capital flight,which our model ignores. Capital flight in South Africa hasbeen occurring rapidly since the removal of apartheid lawsand the relaxation of exchange rate controls in 1997, andlaws introduced in 1997 allow South Africans to legallyinvest some capital offshore. With our flow data, as withother sources, there are no guarantees that domestic inves-tors do not use offshore accounts to invest in their country,so that we would mistake them for foreign investors. Wereport results for all countries for the sake of completeness,but pay special attention to the East Asian countries.
The capital flow measure we use is the value of all equitypurchases by foreigners minus all equity sales by foreigners,scaled by the previous day’s market capitalization [ ft �100( fbuy,t � fsell,t)/mktcapt�1]. We use net flows relative tomarket capitalization because this measure tells us howimportant the net demand is relative to the total supply ofavailable shares.7 To control for capital inflows due toabnormal reasons as suggested by Edison and Warnock(2003), we set observations above the 99th percentile of thedaily net flow distribution equal to the 99th percentilepoint.8 Data for market indices and exchange rates arecollected from Datastream.9 We primarily focus on local-currency returns so that exchange rate effects will notconfound our inferences, but subsequently we examineseparately the role of exchange rates as well as the impli-cations of using dollar returns.
We report the mean, median, and standard deviation offoreign net flows in Table 1. The standard deviation of netflows varies across countries, from 0.01% for Slovenia to5.5 times as much (0.055%) for Korea. This means that inall markets most daily foreign net activity is generally lessthan 0.1% of market capitalization. Flows generally havemuch greater autocorrelations than returns. The autocorre-lation in flows declines slowly and is generally still signif-icant out to lag 5, indicating substantial persistence in theforeign investment activity.
Table 1 documents some substantial contemporaneouscorrelations between flows and returns within each country.All of the Asian countries have substantial positive corre-
lations between flows and returns (ranging between 0.07and 0.44). The negative correlations in Slovenia and SouthAfrica are inconsistent with what has been observed else-where (for example, Froot, O’Connell, and Seasholes, 2001)and more consistent with the daily contrarian behaviorobserved for domestic individual investors at the firm level(Choe, Kho, and Stulz, 1999; Griffin, Harris, and Topaloglu,2003; Grinblatt and Keloharju, 2000) and market level(Griffin, Harris, and Topaloglu, 2004).
IV. Flows and Own-Country Returns
This section examines the within-country joint dynamicsof local market returns and net equity flows. Our modelgenerally predicts that in the presence of extrapolativeexpectations, high stock returns in the local market increasethe demand for local stocks from nonresident investors andhence lead to net flows. Though our model does not includeprice pressure effects, such effects could lead to a contem-poraneous correlation between net flows and returns. Theexistence of such effects would mean that high capital flowstoday lead to high flows and returns tomorrow through theeffect of net flows on prices. The end result is that foreigntrading activity could be predictive of future returns evenwhen foreigners are informationally disadvantaged. To ex-amine these implications, we ask two main questions of theflow data. Is there any reliable evidence of foreign investorschasing local market returns? Do foreign investment flowspredict future price movements, and, if so, is this predict-ability more consistent with information or with price pres-sure explanations? To investigate these issues within eachcountry, we use a vector autoregression (VAR) framework.10
Table 2 displays the VAR regression results for both flowsand returns. The examination of the flow regressions inpanel A shows several interesting findings. First, flows arestronglyrelatedtotheirpastvalues.Forexample,a1-standard-deviation positive movement in yesterday’s foreign flows inIndonesia leads to a 0.208 standard deviation increase intoday’s flows. The effect of past flows decreases quickly atlag 2 (coefficients ranging from 0.015 to 0.139 acrosscountries) but persists even out to lag 5 in most of thecountries. Some of the flow persistence might be due tolarge quantities of foreign capital moving slowly in themarket to minimize price impact.
The second interesting finding, which is consistent withour model, is that foreign flows are highly affected by theprevious day’s return. For instance, a 1-standard-deviationincrease in yesterday’s Indonesian market return leads to a
7 Without scaling, it is problematic to compare flows across countries oreven across time within a country. Though Froot, O’Connell, and Sea-sholes (2001), Bekaert, Harvey, and Lumsdaine (2002), and Griffin,Harris, and Topaloglu (2003) scale flows as we do, a number of papers,including that of Edison and Warnock (2003), do not scale flows. InSection V A we examine an alternative way of scaling flows.
8 We also reexamine our main results by using flows including thesetail-end observations, and obtain similar findings.
9 In Sri Lanka and Slovenia, data on market capitalization and returnsare supplied by the exchange.
10 For most countries the Hannan–Quinn information criterion (HQC)selects the optimal lag length at four or five lags. We choose to model thesystem with five lags in each variable for all countries, as this choicemakes the analysis homogeneous across countries. The fairly large samplesize at our disposal allows us to be less concerned about the losses ofdegrees of freedom induced by more highly parameterized models. Wealso reexamine all our VAR results with systems only containing two lags[as selected for several countries by the Schwarz criterion (SIC)] and findthat our results are, essentially, unchanged.
THE REVIEW OF ECONOMICS AND STATISTICS646

0.16-standard-deviation increase in today’s foreign inflows.Foreign flows in all five East Asian countries are highlyresponsive to past returns, with coefficients ranging between0.160 for Indonesia and 0.287 for Thailand. However, thiseffect dies out quickly, the effect of lag-2 returns beingsmall and actually negative in six of the nine countries.Foreigners buy following high previous-day stock returns,but respond little or actually are net sellers several days later.
Moving to the return equation of the VAR, panel B ofTable 2 examines the relationship between current marketreturns and past foreign trading activity as well as laggedreturns. Foreign flows are significant predictors of returns atlag 1 for Korea, Taiwan, Thailand, and India, indicating thatforeign investors are buying before market index increases.Relative to the explained variation in flows, the variation inreturns that is explained by past returns and flows is small.The adjusted R2’s in the return equations are less than 0.04in all the East Asian countries. Comparatively, the adjustedR2’s in the flow equations for East Asian countries range upto approximately 0.40. Nevertheless, we wish to furtherunderstand the cause of this relationship between foreignactivity and next-day stock returns. Froot and Ramadorai(2002) find similar evidence of predictability and concludethat U.S. investors in closed-end country funds do haveinformation about future fundamentals of foreign stockfunds. Flows forecasting returns could arise from pricepressure or information. If price pressure is driving thepredictability, there should be a contemporaneous positivecorrelation between flows and returns that would subsumethe lead–lag dynamics between the flows and the returns. Ifforeign investors are better informed at time t � 1 aboutreturns at time t than domestic investors, flows should stillpredict returns if we include contemporaneous flows in thereturn equation.
The tests for this specification in panel C of Table 2 showthat contemporaneous flows are positive and highly signif-icant in India and all five East Asian countries. However,lagged flows in these countries are positive and significantin two countries only, and negative and significant in twoother countries. Thus, these results seem to suggest that theimportance of foreign flows (in the VAR without contem-poraneous flows) is mainly due to past flows signalingfuture foreign investment that leads to contemporaneous pricemovements. Although admittedly limited, this evidence doesnot support the view that foreigners have better informationthan locals about future local-market movements.
V. Flows and Nonhost-Country Returns
As discussed in Section II, our model predicts a positiverelationship between net flows and nonhost-country (orregional) equity returns when nonhost countries are substan-tially richer than the host country. In this section we inves-tigate the relationship between regional equity returns andforeign investment flows.
A. Cross-Country VAR Models
To investigate the importance of regional indices inexplaining flow dynamics, we estimate a structural VARsystem where net foreign flows and country index returnsdepend on their lagged values as well as those of the Pacific,European, North American, and emerging-market indices. Ifthe predictions of our model hold up, we would expect therelationship between flows and regional returns to be posi-tive and larger for those indices with larger market cap,especially the North American and, then, the Europeanindex. In this structural VAR, the regional index returns areassumed to be exogenous variables. To make the presenta-tion of our results more space-effective, even though weestimate the system with five lags for each variable (exog-enous and endogenous), only two lags are reported in thetables, and the additional lags are discussed when relevant.Table 3 displays the results for the flow regressions.
The coefficients on regional indices are consistent withthe prediction of our model that flows are positively relatedto market returns in large markets. The most noticeableeffect is related to the previous-day North American return.North American returns exhibit a positive and significantrelationship with subsequent foreign inflows in Indonesia,Korea, Taiwan, Thailand, and India. The economic magni-tude of this effect is substantial: a one-unit (one-standard-deviation) shock to the North American return index isfollowed the next day by an increase of between 0.095 and0.247 units in foreign flows in these five countries. Lookingback further in time shows that lagged two-period NorthAmerican returns are sometimes negatively related to cur-rent foreign flows, although only significantly so in Korea.However, in Korea lagged three-period returns from NorthAmerica are positive and significant, and lagged four- andfive-period coefficients are smaller but positive. The Pacific-market index exhibits a positive although not statisticallysignificant relationship to flows, and the lagged emerging-market index is significantly related to foreign flows inTaiwan only. Consistent with the European index beingsecond(behindtheU.S.)inmarketcapitalization,theprevious-day European index is positively and significantly related toequity flows in two countries, Korea and Thailand. We alsoassess the joint significance of the lag-1 to -5 returns andsimilarly find that own-country lagged returns are importantin six markets, North American lagged returns are importantin four markets, and European returns are important in twomarkets.
B. Economic Importance and Dynamic Analysis
To estimate the variation in flows that can be explainedby the different (local versus regional) equity indices, wefirst estimate the basic system with flows as a function ofpast flows only. We add local index returns (as in Table 2),gauge the incremental increases in adjusted R2’s, and thenadd both local and regional index returns. We find that the
ARE DAILY CROSS-BORDER EQUITY FLOWS PUSHED OR PULLED? 647

TABLE 2.—VECTOR AUTOREGRESSION OF RETURNS AND STANDARDIZED NET FLOW BY COUNTRY
East Asia South Asia Others
Indonesia Korea Philippines Taiwan Thailand India Sri Lanka Slovenia South Africa
Panel A: Flow Equations
Intercept 0.006 0.004 0.008 0.004 �0.004 0.013 �0.001 0.018 0.008(p-val) (0.81) (0.88) (0.85) (0.88) (0.88) (0.75) (0.98) (0.53) (0.77)
Net flows Lag 1 0.208 0.391 0.354 0.342 0.307 0.152 0.126 0.370 0.154(p-val) (0.00) (0.00) (0.00) (0.00) (0.00) (0.00) (0.00) (0.00) (0.00)Lag 2 0.115 0.042 0.015 0.117 0.054 0.139 0.114 0.053 0.138(p-val) (0.00) (0.18) (0.79) (0.00) (0.18) (0.00) (0.01) (0.18) (0.00)Lag 3 0.049 0.088 0.094 0.027 0.130 0.108 0.118 0.182 0.080(p-val) (0.11) (0.00) (0.09) (0.45) (0.00) (0.02) (0.00) (0.00) (0.00)Lag 4 0.047 0.052 �0.005 0.098 0.144 0.079 0.020 �0.028 0.100(p-val) (0.13) (0.09) (0.93) (0.01) (0.00) (0.08) (0.62) (0.48) (0.00)Lag 5 0.085 0.102 0.060 0.047 0.100 0.055 0.078 0.149 0.083(p-val) (0.00) (0.00) (0.24) (0.15) (0.01) (0.22) (0.06) (0.00) (0.00)
Returns Lag 1 0.160 0.237 0.178 0.204 0.287 0.059 0.028 �0.108 �0.034(p-val) (0.00) (0.00) (0.00) (0.00) (0.00) (0.18) (0.51) (0.00) (0.21)Lag 2 0.031 �0.079 �0.002 0.010 �0.038 �0.075 0.019 �0.045 �0.006(p-val) (0.28) (0.00) (0.97) (0.75) (0.26) (0.09) (0.66) (0.14) (0.84)Lag 3 �0.002 0.010 0.005 �0.027 �0.063 �0.052 0.040 0.031 0.035(p-val) (0.95) (0.68) (0.92) (0.36) (0.06) (0.24) (0.35) (0.31) (0.19)Lag 4 �0.032 �0.037 �0.004 �0.038 �0.119 �0.060 0.033 �0.060 0.051(p-val) (0.25) (0.14) (0.94) (0.19) (0.00) (0.17) (0.44) (0.04) (0.06)Lag 5 �0.034 �0.041 �0.014 �0.016 �0.087 �0.013 �0.010 �0.018 �0.009(p-val) (0.23) (0.10) (0.77) (0.59) (0.01) (0.76) (0.80) (0.53) (0.74)
Adj. R2 0.162 0.346 0.219 0.307 0.391 0.093 0.068 0.399 0.117Granger 1 0.000 0.000 0.011 0.000 0.000 0.147 0.613 0.000 0.198
Panel B: Return Equations
Intercept �0.022 �0.001 �0.079 �0.011 �0.009 0.048 �0.001 0.024 0.042(p-val) (0.43) (0.96) (0.10) (0.74) (0.79) (0.27) (0.99) (0.50) (0.13)
Net flows Lag 1 0.004 0.107 �0.020 0.196 0.157 0.167 �0.063 �0.132 0.017(p-val) (0.91) (0.00) (0.73) (0.00) (0.00) (0.00) (0.12) (0.01) (0.57)Lag 2 0.054 0.100 �0.096 0.012 0.013 0.018 �0.027 0.080 �0.006(p-val) (0.11) (0.01) (0.12) (0.77) (0.81) (0.70) (0.50) (0.11) (0.83)Lag 3 0.006 �0.017 0.034 �0.125 �0.005 0.056 �0.031 0.071 0.007(p-val) (0.85) (0.66) (0.59) (0.00) (0.93) (0.24) (0.45) (0.15) (0.81)Lag 4 �0.014 �0.039 0.089 0.058 0.054 0.021 0.082 �0.069 �0.028(p-val) (0.67) (0.30) (0.15) (0.17) (0.30) (0.66) (0.05) (0.16) (0.35)Lag 5 0.004 0.002 0.086 �0.009 �0.051 �0.037 0.010 �0.048 0.005(p-val) (0.90) (0.96) (0.13) (0.82) (0.26) (0.42) (0.81) (0.29) (0.86)
Returns Lag 1 0.139 0.069 0.126 �0.031 0.051 �0.020 0.268 0.208 0.136(p-val) (0.00) (0.02) (0.02) (0.36) (0.20) (0.66) (0.00) (0.00) (0.00)Lag 2 �0.022 �0.135 �0.027 0.005 �0.043 0.000 0.019 0.114 0.061(p-val) (0.49) (0.00) (0.61) (0.89) (0.31) (1.00) (0.66) (0.00) (0.03)Lag 3 �0.049 �0.076 �0.039 0.007 �0.057 �0.014 0.075 �0.065 �0.012(p-val) (0.11) (0.01) (0.46) (0.85) (0.17) (0.76) (0.08) (0.09) (0.68)Lag 4 �0.033 �0.043 0.029 �0.085 �0.043 0.005 �0.035 �0.037 �0.046(p-val) (0.28) (0.16) (0.58) (0.01) (0.30) (0.90) (0.41) (0.33) (0.10)Lag 5 �0.016 �0.072 �0.080 �0.001 0.006 �0.016 0.090 �0.038 �0.002(p-val) (0.59) (0.02) (0.12) (0.97) (0.88) (0.71) (0.03) (0.31) (0.96)
Adj. R2 0.018 0.039 0.026 0.036 0.021 0.018 0.085 0.078 0.019Granger 2 0.667 0.000 0.073 0.000 0.012 0.002 0.227 0.007 0.943
Panel C: Return Equations with Contemporaneous Flows Included
Intercept �0.024 �0.002 �0.082 �0.012 �0.007 0.046 0.000 0.024 0.042(p-val) (0.35) (0.93) (0.07) (0.70) (0.83) (0.29) (0.99) (0.50) (0.13)
Net flows Lag 0 0.402 0.303 0.389 0.313 0.567 0.192 0.072 �0.006 �0.085(p-val) (0.00) (0.00) (0.00) (0.00) (0.00) (0.00) (0.07) (0.90) (0.00)Lag 1 �0.080 �0.011 �0.158 0.089 �0.018 0.138 �0.072 �0.130 0.030
THE REVIEW OF ECONOMICS AND STATISTICS648
average adjusted R2’s for East Asian markets with onlylagged flows is 0.242, but the explanatory power increasesby 16.8% to 0.285 with the inclusion of lagged local indexreturns, and increases an additional 12.7% to 0.320 with theinclusion of both local and regional index returns. For theother countries the increases in adjusted R2’s are muchsmaller. Regional index returns appear, thus, to be econom-ically important in determining the variation in foreignflows in East Asian countries.
One potential explanation for the positive relation betweenNorth American returns and foreign flows to Asian countries isthat positive returns in North America incorporate global newsthat spills over into higher Asian equity returns. Since flowsand local market returns are contemporaneously correlated, thepositive relationship between flows and lagged North Ameri-can index returns could simply be an artifact of the correlationbetween North American returns and the next-day East Asianequity returns. To examine this possibility, we assess theoverall dynamics by looking at impulse response functions forflows from a recursive (or orthogonalized) VAR where flowsare ordered before returns.11 This structure implies that flowsare allowed to contemporaneously affect returns but returns arenot allowed to contemporaneously affect flows. Impulse re-sponse graphs are shown in Figure 1. The shocks to North
American returns lead to larger increases to capital flows thanthose from local returns in seven of the nine countries (excep-tions are the Philippines and Sri Lanka). North Americanmarket returns lead to economically and statistically significantincreases in flows in Indonesia, Korea, Taiwan, and Thailand,respectively. In Korea, Taiwan, and Thailand, a 1-standard-deviation increase in the North American market returns leadsto an economically large response of a more than 0.50-standard-deviation increase in net flows.
As another (perhaps more stringent) method to control forcontemporaneous effects, in Table 4 we estimate a structuralVAR where contemporaneous returns are included in theflow equation. This approach of examining coefficients issomewhat limited as compared to the impulse responsegraphs, in that the dynamic nature of the VAR is not fullycaptured. Nevertheless, we find that lagged local returns arepositive and significant in Indonesia, Korea, the Philippines,Taiwan, and Thailand, and negative and significant in Slo-venia. Whereas contemporaneous effects weaken the signif-icance of the North American return somewhat, NorthAmerican returns still significantly affect flows in Korea,Taiwan, and Thailand.
C. Pooled Analysis and Joint Significance Tests
Our analysis thus far has been conducted on a country-by-country basis. We now investigate the dynamics ofinterest by jointly utilizing data from all countries. At the
11 A generalized impulse response function where residuals in the VARequations are allowed to be contemporaneously correlated shows a muchlarger effect of returns on flows, mainly arising from the strong contem-poraneous correlation between shocks to flows and shocks to returns.
TABLE 2.—(CONTINUED)
East Asia South Asia Others
Indonesia Korea Philippines Taiwan Thailand India Sri Lanka Slovenia South Africa
(p-val) (0.01) (0.75) (0.01) (0.03) (0.71) (0.00) (0.08) (0.01) (0.31)Lag 2 0.007 0.087 �0.102 �0.024 �0.018 �0.008 �0.036 0.080 0.005(p-val) (0.81) (0.02) (0.08) (0.55) (0.69) (0.86) (0.39) (0.11) (0.86)Lag 3 �0.013 �0.043 �0.003 �0.133 �0.078 0.035 �0.040 0.072 0.014(p-val) (0.67) (0.24) (0.96) (0.00) (0.09) (0.45) (0.33) (0.15) (0.64)Lag 4 �0.033 �0.055 0.091 0.027 �0.028 0.005 0.081 �0.069 �0.020(p-val) (0.29) (0.13) (0.12) (0.50) (0.55) (0.91) (0.05) (0.16) (0.51)Lag 5 �0.030 �0.029 0.063 �0.023 �0.107 �0.048 0.004 �0.048 0.012(p-val) (0.31) (0.37) (0.24) (0.53) (0.01) (0.30) (0.92) (0.31) (0.68)
Returns Lag 1 0.075 �0.003 0.056 �0.095 �0.111 �0.031 0.266 0.208 0.133(p-val) (0.01) (0.93) (0.25) (0.00) (0.00) (0.48) (0.00) (0.00) (0.00)Lag 2 �0.034 �0.111 �0.026 0.002 �0.021 0.014 0.017 0.114 0.061(p-val) (0.24) (0.00) (0.59) (0.96) (0.58) (0.75) (0.68) (0.00) (0.03)Lag 3 �0.048 �0.079 �0.041 0.015 �0.022 �0.004 0.072 �0.065 �0.009(p-val) (0.09) (0.01) (0.41) (0.65) (0.57) (0.93) (0.09) (0.09) (0.76)Lag 4 �0.020 �0.032 0.030 �0.073 0.024 0.017 �0.037 �0.037 �0.042(p-val) (0.49) (0.28) (0.54) (0.03) (0.52) (0.70) (0.38) (0.33) (0.14)Lag 5 �0.003 �0.059 �0.074 0.004 0.056 �0.014 0.091 �0.038 �0.002(p-val) (0.92) (0.04) (0.12) (0.91) (0.14) (0.75) (0.03) (0.31) (0.93)
Adj. R2 0.153 0.098 0.143 0.102 0.216 0.050 0.089 0.077 0.024Granger 2 0.032 0.044 0.001 0.005 0.002 0.054 0.148 0.015 0.837
This table presents results from the bivariate vector autoregression (VAR) specified below with five lags for each endogenous variable. ri,t is the daily percentage continuously compounded returns on the countrystock market index, fi,t is the daily net capital flow (buy value � sell value) originated by foreign investors scaled by the previous-day market capitalization, the �’s are constant intercept terms, b(L) denotes apolynomial in the lag operator L, and ε i,t
r and ε i,tf are zero-mean disturbance terms that are assumed to be intertemporally uncorrelated. The scaled net flow is also expressed in percentage terms. Returns, flows, and
market capitalizations are all expressed in local currency. The VAR is estimated separately for each country by OLS. Panels A and B report coefficient estimates, their p-values, and adjusted R2 for the flow andreturn equations, respectively, from a standard VAR with no contemporaneous variables in either equation. Panel C reports the return equation results for a structural VAR with contemporaneous flows in the returnequation. For each country the p-values of two Granger causality tests are reported. Granger 1: Returns do not Granger-cause flows. Granger 2: Flows do not Granger-cause returns. The VAR equations are as follows:
� ri,t
fi,t� � ��i,r
�i,f� � � b11 L� b12 L�
b21 L� b22 L��� ri,t�1
fi,t�1� � � εi,t
r
εi,tf � .
ARE DAILY CROSS-BORDER EQUITY FLOWS PUSHED OR PULLED? 649

general level, the first choice the researcher has to make isbetween pooled and heterogeneous specifications, theformer being characterized by assuming homogeneous pa-rameters (some or all) across cross-sectional units. Withineach class, in turn, several alternative estimation and infer-ence approaches are available.12
We restrict the overall covariance matrix to be block-diagonal.13 Thus, heterogeneity across countries is allowedfor through fixed effects as well as through cross-sectionalheteroskedasticity. Within each country, residuals are al-
lowed to be contemporaneously correlated, whereas they areassumed to be uncorrelated across countries.
Since in our applications the time series dimension ismuch larger than in typical panel studies and the number ofcross-sectional units is quite limited, we can circumventmany of the estimation problems ordinarily encountered inthe analysis of dynamic panels [see, among many others,Pesaran and Smith (1995) and Holtz-Eakin, Newey, andRosen (1988)]. We estimate the autoregressive coefficientsand error covariance matrix through a feasible generalizedleast squares (FGLS) pooled procedure where the parame-ters are first estimated by OLS country by country and, in asecond stage, the OLS residuals are used to estimate theresiduals covariance matrix, which then is used to constructthe FGLS estimates.
Using the estimated autoregressive coefficients andvariance–covariance matrix of the residuals, we can thencompute the orthogonalized impulse response function(IRF) for each country and, finally, the pooled orthogonal-ized IRF as the averaged response across countries. As we
12 Theoretical considerations seem to offer little guidance for thechoices, whereas the evidence from applied studies is unsettling at best.Pesaran and Smith (1995), Baltagi and Griffin (1997, 2000), and Hoog-strate, Palm, and Pfann (2000), among others, discuss the pros and cons ofalternative approaches.
13 We restrict the autoregressive coefficients and the lag length to be thesame across countries for both endogenous and exogenous variables. Thelag length is selected by the Hannan–Quinn Information Criterion (HQC)to be 5 for daily data and 2 for weekly data. Checks with the shorter laglength selected by the Schwarz criterion or the longer lag length suggestedby the Akaike criterion indicate that the results are not sensitive to thechosen number of lags.
TABLE 3.—VAR: FLOWS WITH REGIONAL INDEX RETURNS
East Asia South Asia Others
Indonesia Korea Philippines Taiwan Thailand India Sri Lanka Slovenia South Africa
Intercept �0.004 �0.007 0.009 �0.004 �0.015 0.008 �0.004 0.023 0.010(p-val) (0.87) (0.77) (0.83) (0.87) (0.59) (0.84) (0.92) (0.42) (0.72)
Net flows Lag 1 0.212 0.384 0.354 0.301 0.318 0.134 0.125 0.370 0.155(p-val) (0.00) (0.00) (0.00) (0.00) (0.00) (0.00) (0.00) (0.00) (0.00)Lag 2 0.115 0.028 0.013 0.150 0.057 0.132 0.110 0.057 0.140(p-val) (0.00) (0.36) (0.81) (0.00) (0.17) (0.00) (0.01) (0.15) (0.00)
Returns Lag 1 0.148 0.206 0.164 0.168 0.270 0.047 0.028 �0.104 �0.047(p-val) (0.00) (0.00) (0.00) (0.00) (0.00) (0.31) (0.51) (0.00) (0.20)Lag 2 0.035 �0.097 �0.006 0.016 �0.036 �0.066 0.019 �0.052 �0.002(p-val) (0.27) (0.00) (0.90) (0.57) (0.33) (0.16) (0.67) (0.10) (0.96)
Pacific Lag 1 0.009 0.039 �0.040 0.009 �0.013 0.079 0.027 �0.009 0.004(p-val) (0.78) (0.15) (0.47) (0.79) (0.70) (0.12) (0.60) (0.81) (0.92)Lag 2 0.022 0.048 �0.064 0.005 �0.021 0.024 0.017 0.033 0.044(p-val) (0.49) (0.08) (0.25) (0.87) (0.53) (0.63) (0.74) (0.35) (0.19)
Europe Lag 1 0.029 0.073 0.067 0.059 0.122 0.005 �0.023 �0.039 0.001(p-val) (0.40) (0.01) (0.26) (0.09) (0.00) (0.92) (0.67) (0.31) (0.99)Lag 2 0.014 �0.028 0.070 �0.045 �0.011 �0.026 �0.010 �0.053 �0.024(p-val) (0.68) (0.35) (0.27) (0.21) (0.76) (0.65) (0.86) (0.18) (0.54)
North AmericaLag 1 0.095 0.148 0.033 0.247 0.123 0.095 0.020 0.031 �0.062
(p-val) (0.00) (0.00) (0.51) (0.00) (0.00) (0.05) (0.67) (0.34) (0.04)Lag 2 �0.024 �0.076 �0.045 0.034 �0.052 0.028 �0.077 0.009 0.035(p-val) (0.48) (0.01) (0.46) (0.33) (0.14) (0.62) (0.16) (0.82) (0.32)
All emergingLag 1 0.014 0.045 0.061 0.092 �0.013 �0.020 0.071 0.038 0.029
(p-val) (0.69) (0.12) (0.26) (0.01) (0.73) (0.71) (0.17) (0.31) (0.41)Lag 2 �0.022 0.013 0.048 0.027 0.005 �0.021 �0.017 0.027 �0.016(p-val) (0.54) (0.66) (0.38) (0.42) (0.90) (0.70) (0.75) (0.48) (0.66)
Adj. R2 0.170 0.391 0.216 0.394 0.427 0.100 0.050 0.399 0.119
This table presents estimation results from a bivariate VAR of flows and returns. Scaled net flows are expressed in percentage terms. Daily returns on regional market indices, which are considered to be exogenouslydetermined, are included in the VAR. Five lags are used for all endogenous variables as well as exogenous variables, but only the first two are reported. All variables are expressed in local currency, and the systemis estimated separately for each country as seemingly unrelated regressions (SURs).
THE REVIEW OF ECONOMICS AND STATISTICS650

do for the country-by-country analysis, we choose aCholesky ordering with flows before returns so that returnsdo not affect flows contemporaneously. We examine sampleperiods starting in January 1996 as well as September 1998and find similar results across periods. The pooled IRFsshow that shocks to both local and North American returnslead to positive and significant increases in net flows. Theaccumulated effects of return shocks remain significant outto 30 lags for both variables, although most, if not all,appear to be due to the first few lags, indicating a very quickreaction of foreign investors to unexpected local and U.S.returns. Our model predicts that when the foreign market issufficiently large relative to the domestic market, equityflows are positively related to foreign returns and to the sizeof the foreign market. Consistent with these predictions, we
find that equity flows into Asian countries are positive andsignificantly related to North American market returns and,to a lesser extent, to European returns.
VI. Robustness of the Main Results
In this section, we report results taking into accountalternative methods of scaling flows, exchange rate changes,other-country flows, dollar returns, regime shifts, crises, andweekly returns and flows.
A. Scaling Flows by Volume
In all of our previous analysis flows are scaled by theprevious day’s market value. An alternative method to scale
FIGURE 1.—RESPONSES OF FLOWS TO LOCAL AND NORTH AMERICAN RETURN SHOCKS: DAILY DATA
This figure shows impulse response functions describing the response of scaled net flows to a 1-standard-deviation shock in local market returns and in North America index returns. Responses are expressed instandard-deviation units. The time scale on the horizontal axis is in days. Results are based on the vector autoregression (VAR) specified in Table 3. The VAR is estimated separately for each country, with five lagsfor each endogenous variable and for each exogenous variable. All returns are expressed in local currency. Shocks are orthogonalized through a Cholesky factorization in order to allow for contemporaneouscorrelations across equations. For each impulse response functions we also report the 95% confidence intervals (dashed lines), which are computed by Monte Carlo simulation.
ARE DAILY CROSS-BORDER EQUITY FLOWS PUSHED OR PULLED? 651

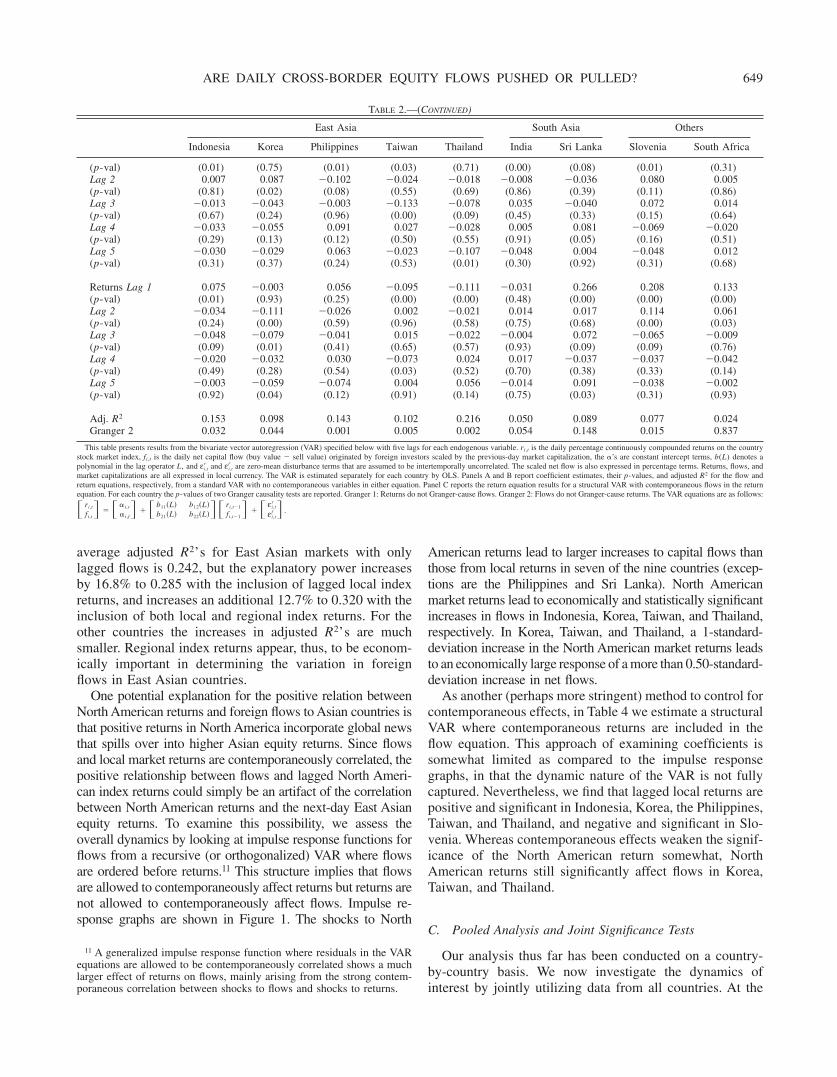
capital flows is relative to the total trading activity. We scalethe buy–sell share value of foreigners by the daily value ofshares traded14 and reexamine our main findings with im-pulse response graphs analogous to those shown previouslyin Figure 1. The results in Figure 2 show that daily foreignflows scaled by the value of shares traded are significantlyrelated to past local returns at some horizon in Indonesia,Korea, the Philippines, Taiwan, Thailand, and Slovenia.
Foreign capital follows U.S. returns in Indonesia, Korea,Taiwan, and Thailand. The alternative method of calculatingflow relative to trading activity and not market capitaliza-tion leads to similar findings.
B. Exchange Rates
To the extent that exchange rate changes are contempo-raneously correlated with equity market increases, a positiverelationship between nonhost-country returns and equityflows could simply be proxying for an exchange rate effect.In regressions not reported here, we add foreign exchange
14 This measure is similar to scaling by trading volume, except that, tobe consistent with the buy–sell value of shares in the numerator, the dailyvalue of shares traded must be in the denominator.
TABLE 4.—VAR: FLOWS WITH CONTEMPORANEOUS LOCAL, LAGGED LOCAL, AND REGIONAL INDEX RETURNS
East Asia South Asia Others
Indonesia Korea Philippines Taiwan Thailand India Sri Lanka Slovenia South Africa
Intercept 0.010 �0.004 0.038 �0.002 �0.007 0.002 �0.003 0.023 0.011(p-val) (0.67) (0.87) (0.36) (0.94) (0.77) (0.97) (0.94) (0.42) (0.69)
Net flows Lag 1 0.207 0.368 0.345 0.274 0.263 0.107 0.130 0.369 0.155(p-val) (0.00) (0.00) (0.00) (0.00) (0.00) (0.02) (0.00) (0.00) (0.00)Lag 2 0.100 0.011 0.038 0.149 0.053 0.131 0.112 0.058 0.140(p-val) (0.00) (0.71) (0.48) (0.00) (0.15) (0.00) (0.01) (0.15) (0.00)
Returns Lag 0 0.339 0.158 0.331 0.151 0.330 0.164 0.085 �0.007 �0.052(p-val) (0.00) (0.00) (0.00) (0.00) (0.00) (0.00) (0.05) (0.82) (0.08)Lag 1 0.112 0.200 0.148 0.175 0.269 0.046 0.007 �0.103 �0.038(p-val) (0.00) (0.00) (0.00) (0.00) (0.00) (0.31) (0.88) (0.00) (0.30)Lag 2 0.043 �0.079 0.019 0.017 �0.012 �0.060 0.016 �0.051 0.001(p-val) (0.15) (0.00) (0.69) (0.55) (0.73) (0.19) (0.71) (0.11) (0.97)
Pacific Lag 1 0.014 0.037 �0.030 �0.002 0.006 0.077 0.029 �0.008 �0.004(p-val) (0.63) (0.17) (0.56) (0.96) (0.84) (0.13) (0.56) (0.81) (0.91)Lag 2 0.019 0.047 �0.089 0.004 �0.015 0.027 0.018 0.033 0.043(p-val) (0.53) (0.08) (0.09) (0.90) (0.64) (0.59) (0.73) (0.35) (0.20)
Europe Lag 1 �0.009 0.054 0.023 0.050 0.097 �0.003 �0.020 �0.039 �0.006(p-val) (0.78) (0.07) (0.69) (0.15) (0.00) (0.95) (0.71) (0.31) (0.88)Lag 2 �0.007 �0.033 0.089 �0.028 �0.028 �0.028 �0.016 �0.052 �0.024(p-val) (0.83) (0.27) (0.13) (0.43) (0.40) (0.61) (0.78) (0.19) (0.53)
North AmericaLag 1 0.035 0.115 �0.038 0.217 0.057 0.073 0.013 0.032 �0.039
(p-val) (0.21) (0.00) (0.44) (0.00) (0.05) (0.12) (0.79) (0.33) (0.24)Lag 2 0.010 �0.061 �0.077 0.038 �0.059 0.027 �0.082 0.008 0.035(p-val) (0.76) (0.04) (0.18) (0.27) (0.07) (0.62) (0.13) (0.83) (0.32)
All emergingLag 1 �0.003 0.045 0.063 0.081 �0.021 �0.012 0.063 0.038 0.030
(p-val) (0.92) (0.12) (0.21) (0.01) (0.55) (0.82) (0.23) (0.31) (0.39)Lag 2 �0.003 0.021 0.059 0.024 0.004 �0.031 �0.018 0.027 �0.015(p-val) (0.93) (0.46) (0.25) (0.47) (0.91) (0.56) (0.73) (0.47) (0.67)
Adj. R2 0.275 0.413 0.311 0.414 0.524 0.124 0.055 0.398 0.120
P-values for joint significance test (Lags 1–5)
Own return 0.000 0.000 0.038 0.000 0.000 0.318 0.663 0.000 0.270Pacific 0.777 0.010 0.881 0.738 0.598 0.204 0.833 0.456 0.460Europe 0.755 0.054 0.311 0.077 0.006 0.779 1.000 0.198 0.532N. America 0.001 0.000 0.704 0.000 0.000 0.382 0.849 0.286 0.121All emerging 0.231 0.321 0.758 0.054 0.325 0.568 0.859 0.567 0.364
This table presents estimation results from the structural bivariate VAR below. ri,t denotes the daily percentage continuously compounded market return for country i, and fi,t denotes the daily net flow (buy value �sell value) originated by foreign investors, scaled by previous-day market capitalization, for country i. The �’s are constant intercept terms, b(L) denotes a polynomial in the lag operator L, and ε i,t
r and ε i,tf are
zero-mean disturbance terms that are assumed to be intertemporally uncorrelated. Scaled net flows are expressed in percentage terms. xt is a vector of daily returns on regional-market indices, which are consideredto be exogenously determined. Five lags are used for all endogenous variables as well as exogenous variables, but only the first two are reported. All variables are expressed in local currency, and the system isestimated separately for each country as seemingly unrelated regressions (SURs). The structural VAR contains contemporaneous local-market returns in the flow equation. Wald tests of joint significance of lags1 through 5 for each regressor are also reported. The equation for the VAR with the contemporaneous local market return included is as follows:
� ri,t
fi,t� � ��i,r
�i,f� � � b11 L� b12 L�
b21 L� b22 L��� ri,t�1
fi,t�1� � � 0
bcri,t� � Ai L� xt�1 � � εi,t
r
εi,tf � .
THE REVIEW OF ECONOMICS AND STATISTICS652
rate changes as exogenous variables in our structural VAR(similar to Table 4). The exchange rate coefficients arepositive in eight of the nine countries, indicating that adepreciation of the local currency leads to more foreignequity inflows. However, the relationship is statisticallysignificant only in Indonesia and the Philippines. As withreturns, the two-period lags of the exchange rate generallyhave coefficients closer to 0, indicating that investors reactquickly to changes in the exchange rate. More importantly,coefficient estimates are generally quite close to the speci-fication excluding exchange rates.
C. Foreign Flows
Flows are correlated across countries, particularly withinEast Asia. One would expect that cross-country flow corre-
lations are due to common information shocks across coun-tries. One could also argue that these cross-country flowrelations are primarily driven by nonfundamental contagion.In a world where nonfundamental contagion is important,one might expect flow herding behavior to be the only majordeterminant of flow activity, and this would drive out theother inferences observed in our model.
To assess the importance of foreign herding behavioracross markets, we estimate structural VARs similar to thosepreviously examined in Table 4 with cross-country flows asan additional exogenous variable. Because of the strongregional component in flows, we examine East Asian flowsfor the four countries with the longest coverage: Indonesia,Korea, Taiwan, and Thailand. We construct a foreign flowindex as a simple equally weighted average of the flows in
FIGURE 2.—RESPONSES OF FLOWS SCALED BY TRADING VALUE TO LOCAL AND NORTH AMERICAN RETURN SHOCKS: DAILY DATA
This figure shows impulse response functions describing the response of scaled net flows to a 1-standard-deviation shock in local-market returns and in North America index returns. Responses are expressed instandard-deviation units. The time scale on the horizontal axis is in days. Results are based on a vector autoregression (VAR) like the one specified in Table 3, but where net flows are scaled by total trading valueand not market capitalization. The VAR is estimated separately for each country with five lags for each endogenous variable and for each exogenous variable. All returns are expressed in local currency. Shocksare orthogonalized through a Cholesky factorization in order to allow for contemporaneous correlations across equations. For each impulse response function we also report the 95% confidence intervals (dashedlines), which are computed by Monte Carlo simulation.
ARE DAILY CROSS-BORDER EQUITY FLOWS PUSHED OR PULLED? 653

the three other East Asian countries. We find that foreignflows are an important determinant of Korean flows and themagnitude of this effect is economically large.15 Interest-ingly, the inclusion of the foreign flow index does sharpensome of the inferences obtained from other variables in thesystem. European equity returns have positive coefficientsin Korea and Thailand, and the emerging market index isnow significantly positive in both Korea and Thailand butsignificantly negative in Taiwan. The coefficients on theNorth American returns are highly significant in three of thefour countries and have a p-value of 0.07 in Indonesia.
D. Currency of Denomination
All of the previously discussed findings are obtained withlocal-currency-denominated returns and thus are taken fromthe perspective of an investor who is completely hedgedagainst exchange rate movements. An alternative method ofconducting (and checking the robustness of) the inferencesis to take the perspective of an investor who is unhedgedagainst foreign currency movements and uses a commoncurrency such as the U.S. dollar. To this end, we computedollar returns on local and regional indices.16 In unreportedresults, structural VAR models estimated with dollar returnsconfirm that positive daily equity returns in other parts ofthe world, particularly the United States, lead to an increasein foreign investments into Asian markets.
E. Subperiod Analysis
An important question is whether our inferences changethrough time. Most of our stronger inferences come fromAsian countries, where we have a time series extendingthrough the Asian crisis. We first examine the importance ofpossible structural breaks using both the univariate andmultivariate tests of Bai, Lumsdaine, and Stock (1998),which have been implemented in flow analysis by Bekaert,Harvey, and Lumsdaine (2002). At the 10% level only threeof the nine countries have significant structural breakdates.17 We run pre- and postbreak regressions in Thailand,Taiwan, and South Africa and find that own-country returnsand the North American returns for Thailand and Taiwan arestill significant both before and after the break date.
Even though the tests indicate no structural break formost markets, one may think that the Asian or Russian
crises altered fundamental flow relations. We first estimateVAR regressions for the three countries with the longestcoverage, Indonesia, Korea, and Taiwan, during the precri-sis period (prior to July 2, 1997), during the crisis (July 2,1997 to December 31, 1997), and after the crisis (January 2,1998 to February 23, 2001). Our findings of Asian capitalflows following large local and North American marketmoves are not driven by the Asian or Russian crisis periods.
F. Return Asymmetries
Another interesting issue is whether net flows are affecteddifferently by up and down market movements. In particu-lar, if foreign investors are more sensitive to negative news,local negative returns may be followed by capital outflowsto a greater extent than a positive return of the sameabsolute value would affect foreign inflows. Similarly, stockprice declines in North American markets may have astronger influence than North American stock price in-creases on capital flows in Asia. Our model gives nopredictions regarding flow asymmetry, and it is not clearwhether positive or negative returns should have moreeffect on flows.
We investigate this issue by estimating VAR regressionsof flows on local and U.S. market returns with dummyvariables for flow asymmetries. Unreported results showthat net flows react differently to positive and negativelagged own returns only in Slovenia and South Africa, andthe asymmetries are of opposite sign. As for lagged U.S.returns, there is no evidence that positive shocks affectsubsequent flows differently than negative shocks, with theexception of Slovenia.
G. Weekly Inferences
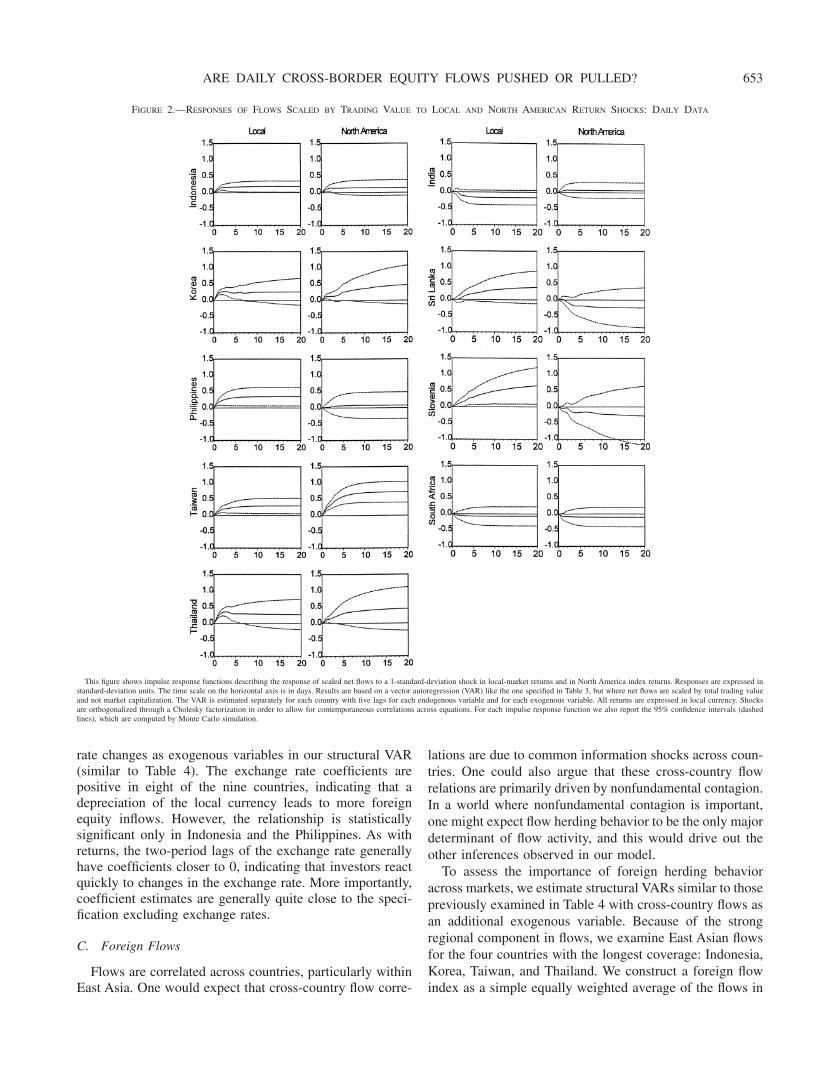
The daily data are important for examining the timing ofcapital movements, but it is also interesting to observe howcapital flows are affected by past returns over longer hori-zons. We cumulate our daily returns and flows to the weeklyfrequency and then examine our basic VAR specification forthe flow equation with regional returns. Figure 3 presentsresults similar to those shown at the daily frequency inFigure 1. Because of the availability of weekly flow data inJapan (beginning in January 1996), we are able to add Japanto the analysis. Shocks to lagged returns lead to larger flowsonly in Japan. There is weak evidence that U.S. returns leadto higher foreign flows in Japan and Thailand. Flows arehighly persistent, and Pacific and European returns havelittle effect on them. In unreported results, we examinepooled impulse response functions similar to those dis-cussed in Section IV C, and find that North Americanreturns have a positive and significant effect on flows at lag1. Weekly flows are not significantly related to past localreturns in any interval. One possible explanation for why
15 This result is consistent with the evidence of a regional common factorin flows presented in Froot, O’Connell, and Seasholes (2001). In unre-ported results, we decomposed the average flow measure into threeseparate foreign flows (one for each other country) and find that it is flowsfrom Thailand that are leading the Korean flows.
16 Net flows are scaled by market capitalization and hence invariant tothe currency of denomination.
17 Given the short time period, the few detected structural breaks couldbe driven by low power, especially in that data prior to the Asian crisis arelimited. Multivariate break dates are June 18, 1998 for Thailand, October8, 1998 for Taiwan, and February 4, 1997 for South Africa. The univariatetests yield dates that are the same for South Africa and within 4 to 6 daysfor Thailand and Taiwan. We also conducted Bai and Perron’s (1998)univariate test and find similar break dates.
THE REVIEW OF ECONOMICS AND STATISTICS654
weekly flows do not seem to follow returns consistent withthe extrapolative expectations in our model is that foreigninvestors believe that past local returns forecast futureexpected returns but only over short (daily) horizons.
VII. Conclusion
We present a simple model of equilibrium equity flowswith barriers to international investment and with foreigninvestors who find past stock prices more informative aboutfuture domestic returns than do domestic investors. Themodel predicts that equity flows toward a country increasewith the return of that country’s stock market. Further, whena country is small, the model predicts that equity flowstoward the country increase with stock returns in biggermarkets. Using daily flow data from nine markets, we findsupport for both of these predictions.
We find that foreign investors invest more following highreturns in a market and that they react quickly, often withina few calendar days. There is only weak evidence offoreigners having information about future market movesafter controlling for the contemporaneous daily flow–returnrelation. Using a bivariate structural VAR where flows areallowed to depend on returns to regional indices as well aspast flows and local returns, we find that equity flowsincrease following unexpectedly positive regional equityreturns. North American returns are particularly importantin determining equity flows toward Asia. These findings arerobust at the daily frequency when taking into accountalternative methods of scaling flows, exchange rate effects,cross-country flow dynamics, the Asian and Russian crises,and potential asymmetric effects of positive and negativereturns. Pooled tests indicate that lagged local and North
FIGURE 3.—RESPONSES OF FLOWS TO LOCAL AND NORTH AMERICAN RETURN SHOCKS: WEEKLY DATA
This figure shows impulse response functions describing the response of scaled net flows to a 1-standard-deviation shock in local market returns and in North America index returns. Responses are expressed instandard deviation units. The time scale on the horizontal axis is expressed in weeks. Results are based on a vector autoregression (VAR) like the one specified in Table 3, but estimated on weekly data. The VARis estimated separately for each country with two lags for each endogenous variable and for each exogenous variable. All returns are expressed in local currency. Shocks are orthogonalized through a Choleskyfactorization in order to allow for contemporaneous correlations across equations. For each impulse response function we also report the 95% confidence intervals (dashed lines), which are computed by Monte Carlosimulation.
ARE DAILY CROSS-BORDER EQUITY FLOWS PUSHED OR PULLED? 655

American returns are both highly significant predictors ofcapital flows at the daily frequency but not at weeklyfrequencies.
Our results open important avenues for further research.First, further research should investigate why the resultsobtained using daily data do not carry over to the weeklyfrequency. It would be worthwhile to examine the implica-tions of our model for flows and returns over longer periodsof time. Second, though some money managers have theirdecisions affected by the returns on the most recent days,many other money managers base their decisions on returnsfor longer periods as well as on fundamental information. Itcould well be that past returns affect trading behaviordifferently for various investor groups. Third, the model ofBrennan and Cao (1997) could be generalized so thatdomestic investors learn from domestic returns about for-eign stocks. Our empirical work does not make it possible toexclude this explanation for the relation between flows andnonhost-country returns. Fourth, the trading practices ofmoney managers could explain the persistence of flows andmight even offer an explanation for why daily results differfrom weekly.
The result that inflows into small countries are positivelyrelated to U.S. stock market returns has important implica-tions for our understanding of equity flows. Some haveargued that capital flows cannot be explained by innovationsabout fundamentals and must be due to some contagiousactivity. However, both our model and our empirical resultsindicate that, to understand daily capital flows into a coun-try, it is not enough to focus on fundamentals of the hostcountry or even markets with similar fundamentals. Capitalcan be pushed toward a country as well as pulled toward it,but our evidence shows that these effects are surprisinglyshort-lived.
REFERENCES
Bai, J., and P. Perron, “Estimating and Testing Linear Models withMultiple Structural Changes,” Econometrica 66 (1998), 47–78.
Bai, J., R. L. Lumsdaine, and J. H. Stock, “Testing for and Dating Breaksin Stationary and Nonstationary Multivariate Time Series,” Reviewof Economic Studies 65 (1998), 395–432.
Baltagi, B. H., and J. M. Griffin, “Pooled Estimators vs. Their Heteroge-neous Counterparts in the Context of Dynamic Demand for Gas-oline,” Journal of Econometrics 77 (1997), 303–327.
“To Pool or Not to Pool: Homogeneous vs. HeterogeneousEstimators Applied to Cigarette Demand,” this REVIEW, 82 (2000),117–126.
Bekaert, G., C. R. Harvey, and R. L. Lumsdaine, “The Dynamics ofEmerging Market Equity Flows,” Journal of International Moneyand Finance 21:3 (2002), 295–350.
Bhagwati, J., “The Capital Myth,” Foreign Affairs 77:3 (1998), 7–12.Bohn, H., and L. Tesar, “U.S. Equity Investment in Foreign Markets:
Portfolio Rebalancing or Return Chasing?” American EconomicReview 86 (1996), 77–81.
Brennan, M. J., and H. Cao, “International Portfolio Flows,” Journal ofFinance 52 (1997), 1851–1880.
Calvo, G., L. Leiderman, and C. Reinhart, “Capital Inflows and the RealExchange Rate Appreciation in Latin America: The Role of Exter-nal Factors,” IMF staff paper (1993).
Choe, H., B. Kho, and R. M. Stulz, “Do Foreign Investors DestabilizeStock Markets? The Korean Experience in 1997,” Journal ofFinancial Economics 54 (2004), 3–46.
“Do Domestic Investors Have More Valuable Information aboutIndividual Stocks than Foreign Investors?” Ohio State Universityworking paper (2000).
Chuhan, P., S. Claessens, and N. Mamingi, “Equity and Bond Flows toLatin America and Asia: The Role of Global and Country Factors,”Journal of Development Economics 55 (1998), 439–463.
Dvorak, T., “Do Domestic Investors Have an Informational Advantage?Evidence from Indonesia,” Journal of Finance (2004), forthcom-ing.
Edison, H. J., and F. E. Warnock, “Cross-border Listings, Capital Con-trols, and Equity Flows to Emerging Markets,” Federal ReserveBoard unpublished paper, Washington, DC (2003).
Fernandez-Arias, E., “The New Wave of Private Capital Inflows: Push orPull?” Journal of Development Economics 48 (1996), 389–418.
Friedman, T. L., The Lexus and the Olive Tree (New York: Farrar StrausGiroux, 1999).
Froot, K., P. O’Connell, and M. Seasholes, “The Portfolio Flows ofInternational Investors,” Journal of Financial Economics 59(2001), 151–193.
Froot, K., and T. Ramadorai, “The Information Content of InternationalPortfolio Flows,” Harvard Business School working paper, Boston(2002).
Griffin, J. M., J. Harris, and S. Topaloglu, “The Dynamics of Institutionaland Individual Trading,” Journal of Finance 58 (2003), 2285–2320.
“Investor Behavior over the Rise and Fall of Nasdaq,” Universityof Texas at Austin working paper (2004).
Grinblatt, M., and M. Keloharju, “The Investment Behavior andPerformance of Various Investor Types: A Study of Finland’sUnique Data Set,” Journal of Financial Economics 55 (2000),43–67.
Holtz-Eakin, D., W. Newey, and H. S. Rosen, “Estimating Vector Autore-gressions with Panel Data,” Econometrica 56 (1988), 1371–1395.
Hong, H., and J. Stein, “A Unified Theory of Underreaction, MomentumTrading, and Overreaction in Asset Markets,” Journal of Finance54 (1999), 2143–2184.
Hoogstrate, A. J., F. C. Palm, and G. A. Pfann, “Pooling in DynamicPanel Data Model: An Application to Forecasting GDP GrowthRates,” Journal of Business and Economic Statistics 18 (2000),274–283.
Karolyi, G. A., “Did the Asian Financial Crisis Scare Foreign InvestorsOut of Japan?” Pacific Basin Finance Journal 10 (2002), 411–442.
Karolyi, G. A., and R. M. Stulz, 2003, “Are Financial Assets PricedLocally or Globally?” (pp. 975–1020), in G. Constantinides, M.Harris, and R. Stulz (Eds.), Handbook of the Economics of Fi-nance, Vol. 2, North-Holland.
Pavabutr, P., and H. Yan, “Foreign Equity Flows and Emerging Markets,”University of Texas at Austin working paper (2003).
Pesaran, M. H., and R. Smith, “Estimating Long-Run Relationships fromDynamic Heterogeneous Panels,” Journal of Econometrics 68(1995), 79–113.
Richards, A., “Big Fish in Small Ponds: The Momentum Investing andPrice Impact of Foreign Investors in Asian Emerging EquityMarkets,” Journal of Financial and Quantitative Analysis (2004),forthcoming.
Seasholes, M., “Smart Foreign Traders in Emerging Markets,” HarvardUniversity working paper (2000).
Stiglitz, J., “Distinguished Lecture on Economics in Government: ThePrivate Uses of Public Interests: Incentives and Institutions,” Jour-nal of Economic Perspectives 12 (1998), 3–22.
Stulz, R. M., “On the Effects of Barriers to International Investment,”Journal of Finance 36 (1981), 923–934.
Williams, J. T., “Capital Asset Prices with Heterogeneous Beliefs,” Jour-nal of Financial Economics 5 (1977), 219–239.
THE REVIEW OF ECONOMICS AND STATISTICS656

APPENDIX
1. Impact of an Increase in PF on NFD When There Are Barriers
to International Investment
Take the derivative of NFD with respect to PF in equation (2):
dNFD
dPF� NF
S��
�PF�
�D
�F2 �2� � 1�
��
�PF
WW
PF
��D
�F2 �� � 1��
� WW/PF�
�PF. (A-1)
The first term is always negative. The second term is negative if � isgreater than 0.5. The third term is always positive. When the domes-tic country is small enough and the ratio �D/�F
2 is large, the second termis positive and more than offsets the first one, so that the derivative ispositive. In the symmetric case, the derivative is negative provided that�D/�F
2 is not greater than 1.
2. Proof that NFD Increases as PF Increases if the Expected Returnfor Domestic Investors Increases
Sufficiently Strongly with PF
Let FD � F
D(PF) and Q � �D � FD. With our assumptions, Q falls
as PF increases. The derivative of NFD with respect to PF is then
dNFD
dPF� NF
S� WD/WW�
�PF�
�Q/�PF
�F2 �WD
WW � 1� WD
PF
�Q
�F2
� WD/WW�
�PF�
Q
�F2 �WD
WW � 1� � WD/WW�
�PF. (B-1)
In this expression, the second and fourth terms are positive and the otherterms are negative. Hence, as long as the second and fourth terms are largeenough, it is possible for a positive return on the foreign stock to leaddomestic investors to purchase foreign shares. The second positive term isthe term that distinguishes this expression from the expression of Section1 of this Appendix. If this term is large enough, it makes the derivativepositive in the symmetric case.
ARE DAILY CROSS-BORDER EQUITY FLOWS PUSHED OR PULLED? 657