Statistics Review Questions)
6
1 Statistics Review. Standard Level. Grade 12. 1. A taxi company has 200 taxi cabs. The cumulative frequency curve below shows the fares in dollars ($) taken by the cabs on a particular morning. (a) Use the curve to estimate (i) the median fare; (ii) the number of cabs in which the fare taken is $35 or less. (2) The company charges 55 cents per kilometre for distance travelled. There are no other charges. Use the curve to answer the following. (b) On that morning, 40% of the cabs travel less than a km. Find the value of a. (4) (c) What percentage of the cabs travel m ore than 90 km on that morning? (4) (Total 10 marks) 2. Three positive integers a, b, and c, where a < b < c, are such that their median is 11, their mean is 9 and their range is 10. Find the value of a. (Total 6 marks) 200 180 160 140 120 100 80 60 40 20 10 20 30 40 50 60 70 80 Fares ($) N u m b e r o f c a b s
Transcript of Statistics Review Questions)

8/4/2019 Statistics Review Questions)
http://slidepdf.com/reader/full/statistics-review-questions 1/6
1
Statistics Review. Standard Level. Grade 12.
1. A taxi company has 200 taxi cabs. The cumulative frequency curve below shows the fares indollars ($) taken by the cabs on a particular morning.
(a) Use the curve to estimate
(i) the median fare;
(ii) the number of cabs in which the fare taken is $35 or less.(2)
The company charges 55 cents per kilometre for distance travelled. There are no other charges.Use the curve to answer the following.
(b) On that morning, 40% of the cabs travel less than a km. Find the value of a. (4)
(c) What percentage of the cabs travel more than 90 km on that morning?(4)
(Total 10 marks)
2. Three positive integers a, b, and c, where a < b < c, are such that their median is 11, their mean is
9 and their range is 10. Find the value of a.
(Total 6 marks)
200
180
160
140
120
100
80
60
40
20
10 20 30 40 50 60 70 80
Fares ($)
N u m b e r o f c a b s

8/4/2019 Statistics Review Questions)
http://slidepdf.com/reader/full/statistics-review-questions 2/6
2
3. The number of hours of sleep of 21 students are shown in the frequency table below.
Hours of sleep Number of students
4 2
5 5
6 4
7 3
8 4
10 2
12 1
Find
(a) the median;
(b) the lower quartile;
(c) the interquartile range.
(d) the standard deviation.
(Total 8 marks)
4. The cumulative frequency curve below shows the marks obtained in an examination by a group of 200 students.
200
190
180
170
160
150
140
130
120
110
100
90
80
70
60
50
40
30
20
10
010 20 30 40 50 60 70 80 90 100
Mark obtained
Number
of
students
8/4/2019 Statistics Review Questions)
http://slidepdf.com/reader/full/statistics-review-questions 3/6
3
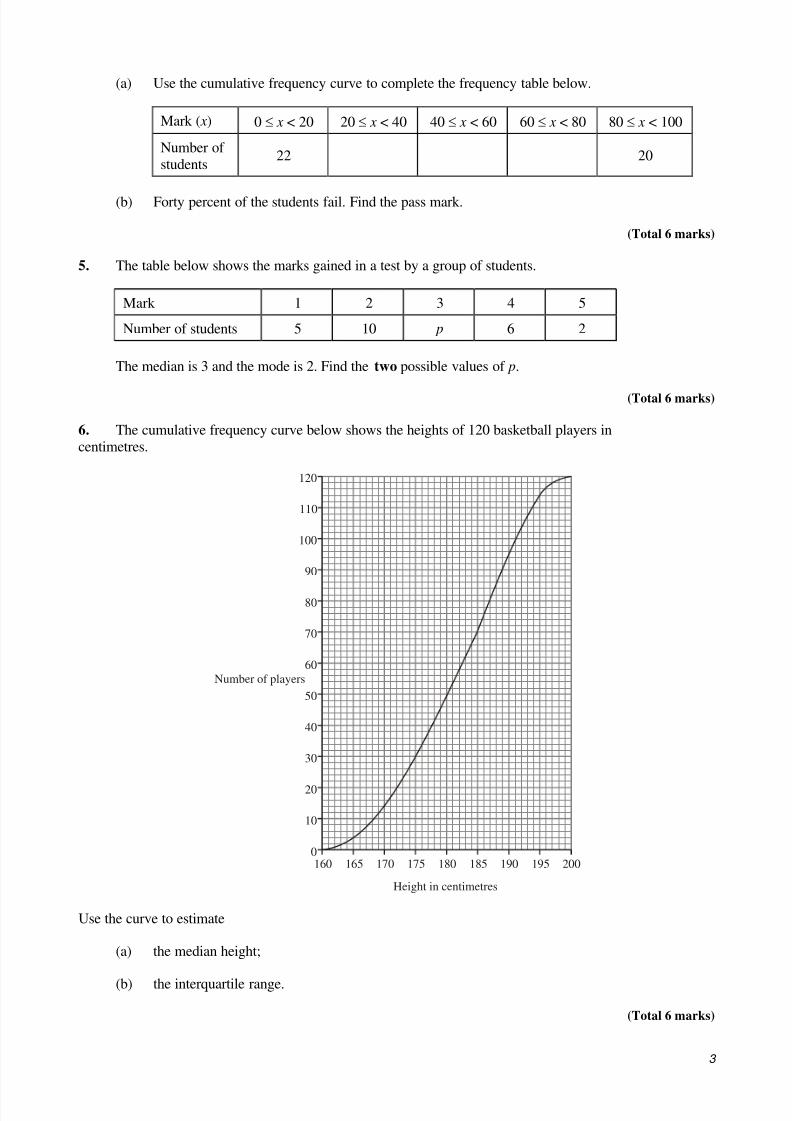
(a) Use the cumulative frequency curve to complete the frequency table below.
Mark ( x) 0 x < 20 20 x < 40 40 x < 60 60 x < 80 80 x < 100
Number of students
22 20
(b) Forty percent of the students fail. Find the pass mark.
(Total 6 marks)
5. The table below shows the marks gained in a test by a group of students.
Mark 1 2 3 4 5
Number of students 5 10 p 6 2
The median is 3 and the mode is 2. Find the two possible values of p.
(Total 6 marks)
6. The cumulative frequency curve below shows the heights of 120 basketball players incentimetres.
Use the curve to estimate
(a) the median height;
(b) the interquartile range.
(Total 6 marks)
120
110
100
90
80
70
60
50
40
30
20
10
0160 165 170 175 180 185 190 195 200
Height in centimetres
Number of players

8/4/2019 Statistics Review Questions)
http://slidepdf.com/reader/full/statistics-review-questions 4/6
4
8. A test marked out of 100 is written by 800 students. The cumulative frequency graph for themarks is given below.
(a) Write down the number of students who scored 40 marks or less on the test.
(b) The middle 50% of test results lie between marks a and b, where a < b. Find a and b.(Total 6 marks)
9. The 45 students in a class each recorded the number of whole minutes, x, spent doing experiments
on Monday. The results are x = 2230.
(a) Find the mean number of minutes the students spent doing experiments on Monday.
Two new students joined the class and reported that they spent 37 minutes and 30 minutesrespectively.
(b) Calculate the new mean including these two students.
(Total 6 marks)
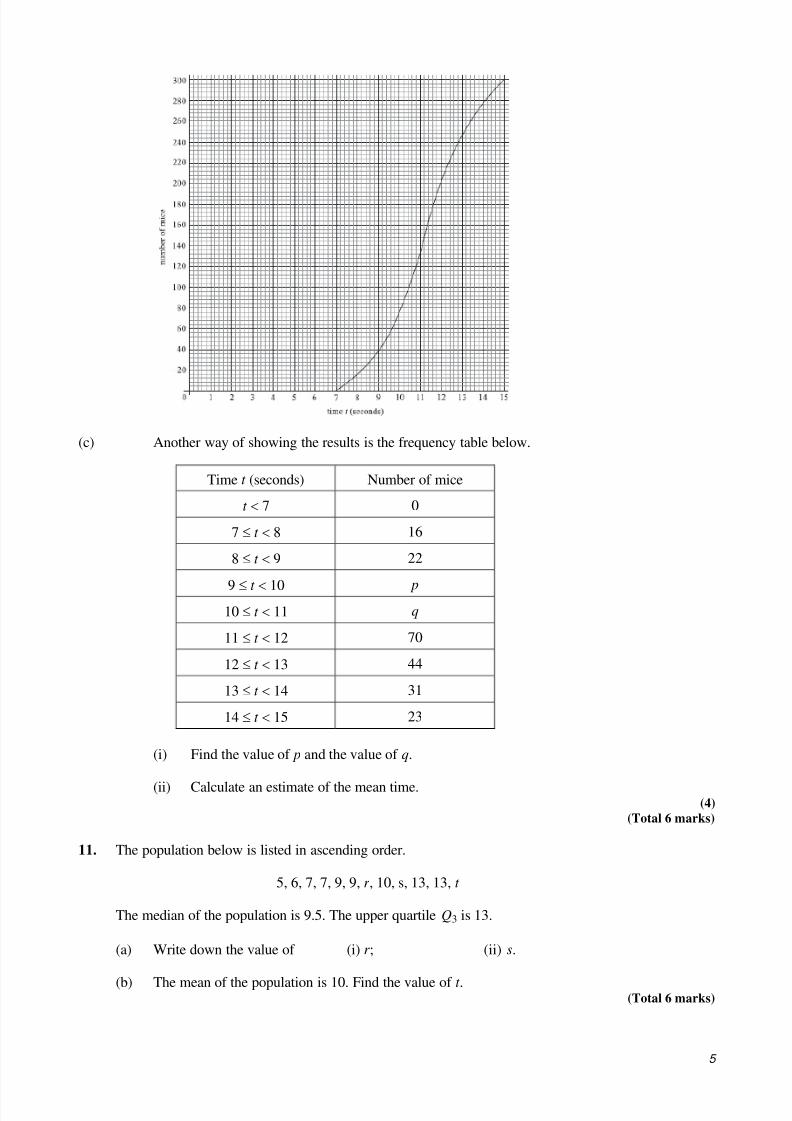
10. In the research department of a university, 300 mice were timed as they each ran through a maze.The results are shown in the cumulative frequency diagram opposite.
(a) How many mice complete the maze in less than 10 seconds?
(1)
(b) Estimate the median time.(1)
800
700
600
500
400
300
200
100
10 20 30 40 50 60 70 80 90 100
Number
of
candidates
Mark
8/4/2019 Statistics Review Questions)
http://slidepdf.com/reader/full/statistics-review-questions 5/6
5
(c) Another way of showing the results is the frequency table below.
Time t (seconds) Number of mice
t 7 0
7 t 8 16
8 t 9 22
9 t 10 p
10 t 11 q
11 t 12 70
12 t 13 44
13 t 14 31
14 t 15 23
(i) Find the value of p and the value of q.
(ii) Calculate an estimate of the mean time.(4)
(Total 6 marks)
11. The population below is listed in ascending order.
5, 6, 7, 7, 9, 9, r , 10, s, 13, 13, t
The median of the population is 9.5. The upper quartile Q3 is 13.
(a) Write down the value of (i) r ; (ii) s.
(b) The mean of the population is 10. Find the value of t .(Total 6 marks)

8/4/2019 Statistics Review Questions)
http://slidepdf.com/reader/full/statistics-review-questions 6/6
6
12. The four populations A, B, C and D are the same size and have the same range. Frequency histograms for the four populations are given below.
(a) Each of the three box and whisker plots below corresponds to one of the four populations.Write the letter of the correct population under each plot.
(b) Each of the three cumulative frequency diagrams below corresponds to one of the fourpopulations. Write the letter of the correct population under each diagram.
(Total 6 marks)
13. The box and whisker diagram shown below represents the marks received by 32 students.
(a) Write down the value of the median mark.
(b) Write down the value of the upper quartile.
(c) Estimate the number of students who received a mark greater than 6.(Total 6 marks)
...... ...... ......