The relative effectiveness and costs of contract and...
39
1 The relative effectiveness and costs of contract and regular teachers in India by Paul Atherton a and Geeta Kingdon b Abstract While use of contract teachers provides a low-cost way to increase teacher numbers, it raises the quality concern that these less trained teachers may be less effective. We estimate the causal contract-teacher effect on student achievement using school and pupil fixed effects, value-added, and saturated models of the education production function, using Indian data. We also present School Fixed Effects teacher pay equations and predict achievement marks per Rupee from regular and contract teachers. We find that despite being paid just a third of the salary of regular teachers with similar observed characteristics, contract teachers produce higher student learning. JEL classification: I21 Keywords: Student achievement, contract teachers, India Contact details: a Institute of Education, University of London, 20 Bedford Way, London, WC1H 0PD. Tel: +44 20 3073 8351. Email: [email protected] b Institute of Education, University of London, 20 Bedford Way, London, WC1H 0PD. Tel: +44 20 3073 8316. Email: [email protected] Acknowledgments: We are grateful to Paul Glewwe and Francis Teal for ideas that have helped to improve the paper. The paper has also benefited from the comments of seminar participants at the Department of Economics at University of Oxford and University of Nottingham, and conference participants at the Indian Statistical Institute, Delhi, in December 2009. We are indebted to Pranav Chaudhari and his team at Sunai Pvt. Ltd., Patna, for conducting the SchoolTELLS survey and collecting data of high integrity, and to Rukmini Banerji for her insightful inputs and advice on the survey questionnaire. Finally, we are also very grateful to Vandana Sipahimalani-Rao, Manasa Patnam and Courtney Monk for assisting with data collection at the early stages. Any errors are ours.
Transcript of The relative effectiveness and costs of contract and...
1
The relative effectiveness and costs of contract and regular teachers in India
by
Paul Athertona and Geeta Kingdonb
Abstract
While use of contract teachers provides a low-cost way to increase teacher numbers, it raises the quality
concern that these less trained teachers may be less effective. We estimate the causal contract-teacher
effect on student achievement using school and pupil fixed effects, value-added, and saturated models of
the education production function, using Indian data. We also present School Fixed Effects teacher pay
equations and predict achievement marks per Rupee from regular and contract teachers. We find that
despite being paid just a third of the salary of regular teachers with similar observed characteristics,
contract teachers produce higher student learning.
JEL classification: I21
Keywords: Student achievement, contract teachers, India
Contact details: a Institute of Education, University of London, 20 Bedford Way, London, WC1H 0PD. Tel: +44 20 3073 8351.
Email: [email protected] b Institute of Education, University of London, 20 Bedford Way, London, WC1H 0PD. Tel: +44 20 3073 8316.
Email: [email protected]
Acknowledgments: We are grateful to Paul Glewwe and Francis Teal for ideas that have helped to improve the
paper. The paper has also benefited from the comments of seminar participants at the Department of Economics at
University of Oxford and University of Nottingham, and conference participants at the Indian Statistical Institute,
Delhi, in December 2009. We are indebted to Pranav Chaudhari and his team at Sunai Pvt. Ltd., Patna, for
conducting the SchoolTELLS survey and collecting data of high integrity, and to Rukmini Banerji for her insightful
inputs and advice on the survey questionnaire. Finally, we are also very grateful to Vandana Sipahimalani-Rao,
Manasa Patnam and Courtney Monk for assisting with data collection at the early stages. Any errors are ours.
2
The relative effectiveness and costs of contract and regular teachers in India
1. Introduction
A central plank of India’s primary school reforms in the past 15 years has been the provision of low-cost
contract teachers, in official data called ‘para’ teachers. Use of contract teachers increased rapidly in India
since the mid-1990s and there were 543,671 contract teachers in India in 2008-091.
The officially stated rationale for provision of contract teachers is to achieve three major equity
and efficiency aims in an affordable way: expanding access to schooling in unserved communities;
eliminating single-teacher schools and relieving multi-grade teaching; and reducing high pupil teacher
ratios. Regular teacher pay scales are high. For instance, in Uttar Pradesh, the ratio of regular teacher pay
to state per capita GDP was 7:1 in 2005 and since then regular teacher salaries have nearly doubled,
following implementation of the Sixth Pay Commission’s recommendations (Kingdon, 2010). Nationally,
contract teachers’ salary rate in 2005 was on average about 35% of regular teachers’ pay rate, and this is
likely to have fallen below 25% following Sixth Pay Commission related increases in regular teacher
salaries (Kingdon and Sipahimalani-Rao, 2010). Contract teacher schemes are favoured because they
expand schooling access, increase teacher numbers, relieve multi-grade teaching and reduce class sizes in
a fiscally manageable way.
Although the schemes vary across states, generally contract teachers have renewable (often
annually renewable) contracts rather than regular teachers’ lifetime employment guarantees. They are
usually not required to have pre-service teacher training and the educational qualification requirements
for contract teachers are mostly lower than those for regular teachers. Finally, contract teachers are
typically recruited and paid by the village local government, rather than being employed directly by the
state government as regular teachers are.
Given that teachers are the most important input into primary schools, the relative effectiveness
of contract and regular teachers – and thus whether the government should fund contract teacher schemes
or scrap them – is one of the most policy relevant and quality-focused issues in Indian basic education
today. On the one hand, their use provides a low-cost way for the state to increase the number of teachers
in the face of rising student populations, budgetary troubles and rapid real increases in salaries of regular
teachers. On the other, it raises educational quality and educational equity concerns2. The quality
1 Authors’ calculations using the percentage of para-teachers in all schools (9.39%) and the total number of elementary school teachers (5,789,898) based on DISE (2009). 2 Govinda and Josephine (2004), Kumar, et al (2001)
3
concern is the fear that these less trained and lower paid teachers may be less effective in imparting
learning. The (related) equity concern arises because contract teachers are often appointed in the remoter
schools or in the ‘Education Guarantee’ schools that serve poorer children (e.g. child labourers, small-
habitations or tribal children), raising the fear that poorer children are potentially being condemned to
lower quality teachers, exacerbating social inequality3.
The relative effectiveness of regular and contract teachers is not obvious, since international
research fails to show a consistent positive association between certification (teacher education, training),
tenure and salary on the one hand and student achievement on the other. Moreover, even if lower
education, training and salary reduce contract teachers’ effectiveness, there may be compensating positive
effects: being appointed by village local government, contract teachers are likely to be more locally
accountable than regular teachers. Further, contract teachers may have greater incentive to apply effort to
ensure contract renewal, unlike regular teachers whose tenures are secure, especially given a high
graduate unemployment rate of 11%4 and paucity of well-remunerated employment. In sum, it cannot be
presumed that contract teachers are necessarily less effective in imparting learning than regular teachers.
Moreover, the employment of contract teachers is expected to lead to a reduction of pupil teacher ratios
and to relieve multi-grade teaching, and this may be conducive to greater learning. Their relative
effectiveness is thus an empirical issue worthy of examination.
Since the early 2000s, the effectiveness of contract and regular teachers in India has attracted
research interest (Pratichi Trust, 2002; Leclercq, 2002; Govinda and Josephine, 2004; EdCil, 2007,
NCAER, 2008). Using descriptive statistics these studies find that achievement and/or attendance levels
of children taught by contract and regular teachers were similar. Sankar (2008a) fits child achievement
regressions for three Indian states (Andhra, Madhya Pradesh and Uttar Pradesh) and after controlling for
children’s home background, finds no significant difference between the learning levels of students taught
by contract and regular teachers. However, if contract teachers are differ from regular teachers in their
unobserved characteristics (e.g. if different types of individuals tend to become contract teachers than
those who become regular teachers), the contract teacher dummy variable will be endogenous, yielding
biased estimates of the contract teacher ‘effect’. Goyal and Pandey (2009) and Kingdon and Sipahimalani
Rao (2010) find that contract teachers have significantly higher effort (attendance rate and time on
teaching task) than regular teachers within the same school. Finally, Muralidharan and Sundararaman
(2009) use experimental data from Andhra Pradesh to find that the provision of a contract teacher in
randomly selected 100 treatment schools led to child test scores that were higher by 0.15 SD in maths and
0.09 SD in language, compared to those in control schools. However, in this paper, the contract teacher
3 Drèze and Sen (2002), Leclercq (2002) 4 Based on our analysis of Indian National Sample Survey (2004-05).
4
effect is indistinguishable from the effect of the reduction in class size that accompanies the provision of
an extra contract teacher5. A true randomized trial of the contract teacher effect requires one of the
following: (a) an additional treatment group who were allocated an extra regular teacher (to act as the
comparator for the group that were allocated an extra contract teacher), (b) the replacement of a regular
teacher with a contract teacher (which would leave class-sizes unchanged), or (c) the random allocation of
pupils to contract and regular teachers within a grade after the hiring of additional teachers. In the spirit
of (c), Duflo, Dupas and Kremer (2009) exploit random allocation of teachers across grade 1 classes
following the hiring of contract teachers in Kenya, to isolate a contract teacher effect. They find that
pupils assigned to contract teachers score significantly higher than those assigned to regular teachers.
The current paper attempts to shed further light on the contract teacher effect in India using a
unique rich dataset collected by Kingdon, Banerji and Chaudhari (2008). We tested the learning
achievement level of individual children in two grades (grades 2 and 4), in two subjects (maths and
language) and at two points in time (start and end of the school year). We also have matched data on the
characteristics of the teacher that taught a given grade a given subject most through the year (by head-
teacher’s report). This data permits estimation of the contract teacher effect at the student level using
school and pupil fixed effects models and value added models, and it allows us to control for changes in
class-size, multi-grade teaching and pedagogical style, which allow us to get close to the causal contract
teacher effect. In addition, the use of a saturated model of the achievement production function, also
allows us to look at how the contract teacher effect works.
Section 2 sets out the methodology and data used. Section 3 presents the results and the last section
concludes.
2. Data and methodology
Data
The data used in this paper come from the SchoolTells survey of primary schools in two north Indian
states: Uttar Pradesh and Bihar. These are two of the most educationally challenged states of India. The
SchoolTells survey was carried out in the 2007-08 school year in 160 rural primary schools across 10
districts of the sample states. It yielded achievement data on over 4000 students of grades 2 and 4 and on
their teachers and schools. Each school was visited four times in the school year. Students were tested in
language and maths at the start and end of the school year, approximately nine months apart. Although
the survey included 35 private schools, we have used only government schools in the analysis in this
paper as contract teachers are used only in government-funded schools. The survey provides an unusually
5 In addition the authors find that the size of the contract teacher effect is greater in the lower than in higher grades, where they also find the reduction in class-size to be greatest.
5
rich source of data with detailed questions on the children’s personal traits (age, gender, height, illness);
family background (parental education, household asset ownership); teacher characteristics
(qualifications, training, gender, age, regular/contract status, absence rate and time on task); and a wide
range of school quality factors. Given high teacher absence rates in north Indian schools (Kremer, et al,
2005), children in a given grade are often taught by a teacher other than the one assigned to teach them. In
matching students to teachers, we rely on the head-teacher’s report of which teacher teaches a given
subject to class 2 and class 4 the most during the year.
The same achievement test was used for students of grades 2 and 4. It tested competencies that
span the kind of material children encounter in the textbooks of grades 2 through 4. It was understood that
most children in grade 2 may not be able to do the more difficult questions. The same type of
achievement test with the same competencies tested was used in time period 2 (near the end of the school
year) as in time period 1 (at the start of the school year).
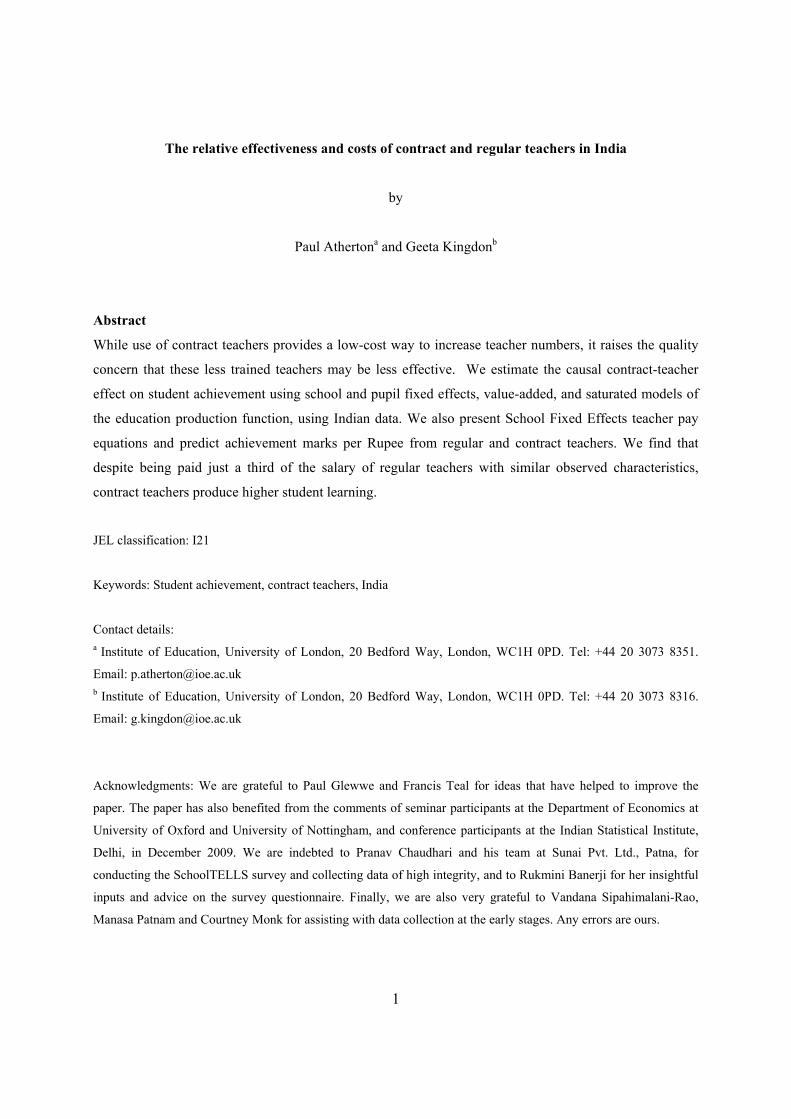
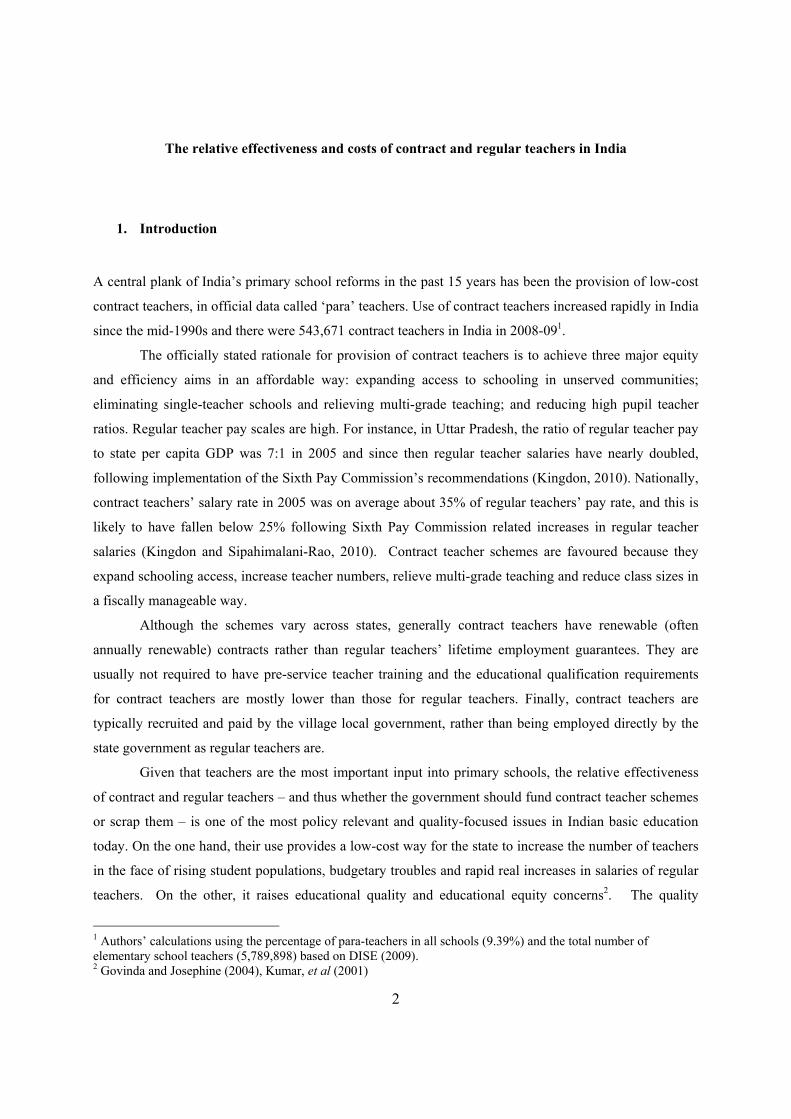
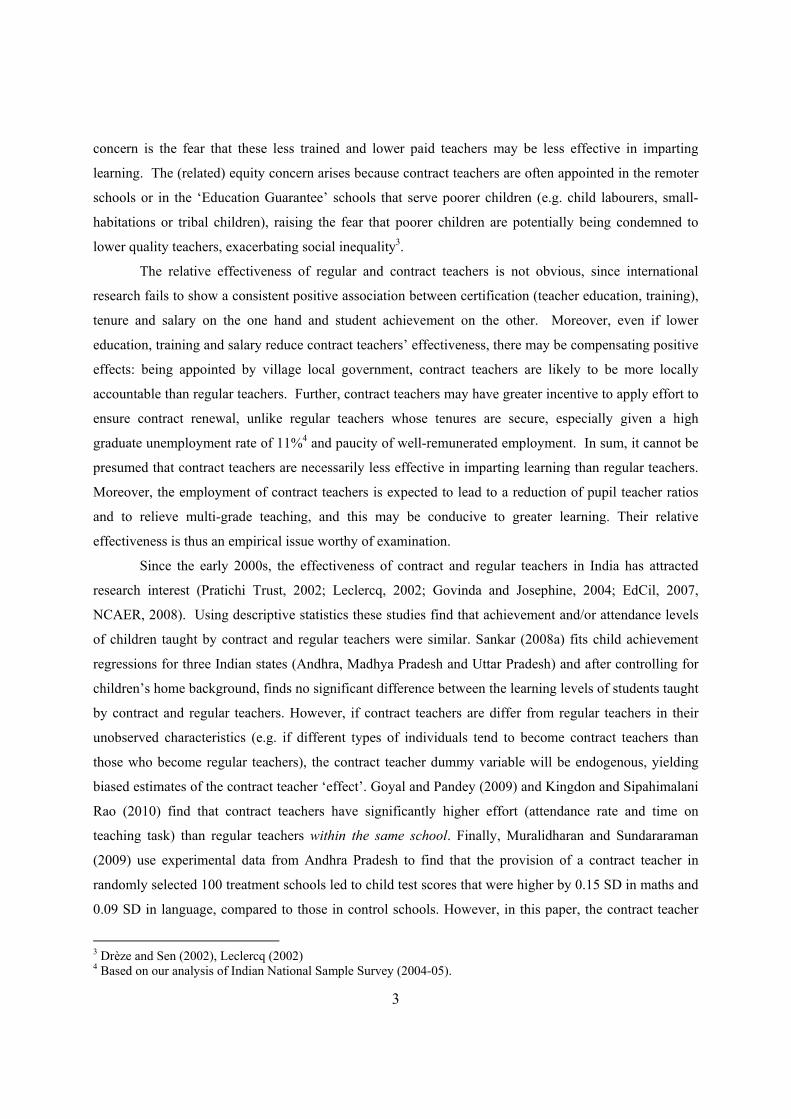
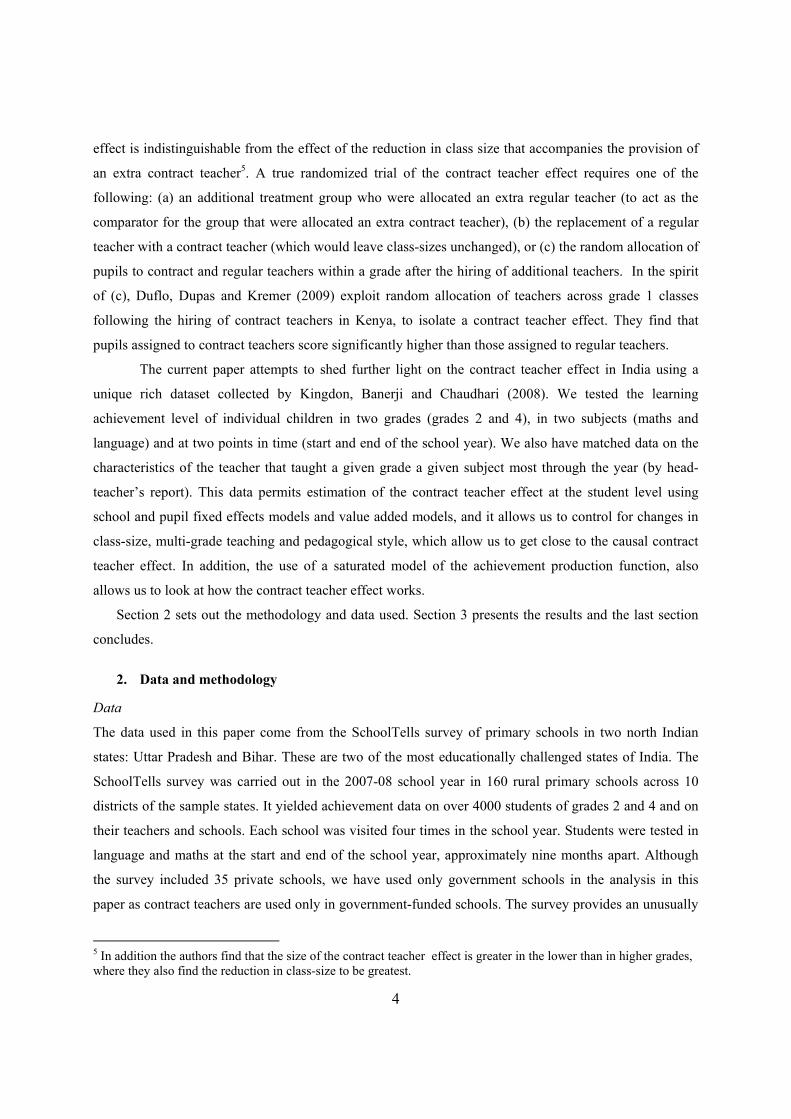
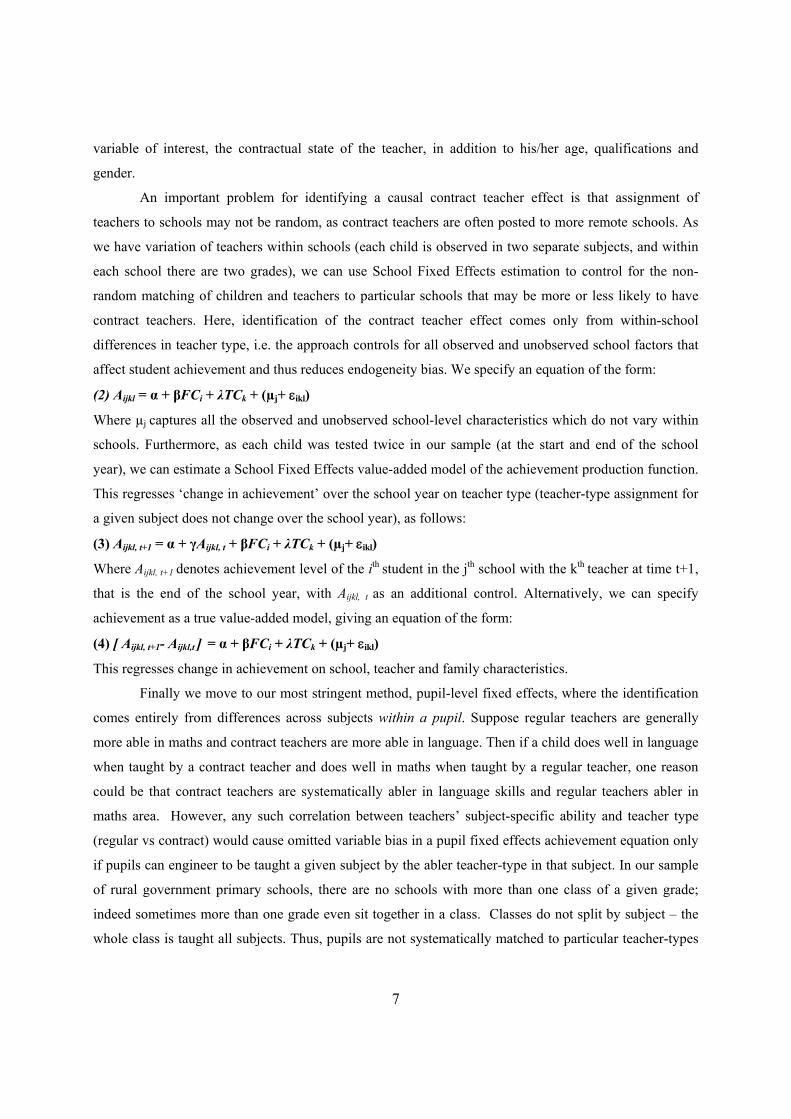
To render achievement level comparable across subjects, grades and time periods, we converted
absolute achievement scores into z-scores. The distribution of absolute marks in maths and language
(grades 2 and 4 and both time-periods taken together) is shown in Figure 1. Appendix Table 1 sets out the
descriptive statistics of the variables used in the analysis.
0.0
05
.01
.01
5kd
ensi
ty m
ark
_su
b
0 50 100 150 200 250x
Kdensity Maths Score Kdensity Language Score
Distribution of Student Achievement in Bihar
Figure 1: Distribution of student achievement
Figure 1 is striking due to the severe left hand skewness of the distribution or marks, especially in
UP. Given that the figures show marks for both grades 2 and 4, one would expect a bi-modal distribution,
instead, the majority of marks are distributed towards the left of the graph, with a very long tale. The
situation is starker for mathematics than for language achievement. The exception to this is language
scores in Bihar, which are somewhat more normally distributed. The figure suggests that learning levels
are very low and do not improve much between grades, a cause of real concern. Such low levels of
achievement are not confined to our sample, with the Annual Status of Education (ASER 2009) finding
that only 37.6% of grade 4 children in India can read a grade two level text.
0.0
1.0
2.0
3.0
4kd
ensi
ty m
ark
_su
b
0 50 100 150 200 250x
Kdensity Maths Score Kdensity Language Score
Distribution of Student Achievement in UP
6
Differences between regular and contract teachers’ characteristics
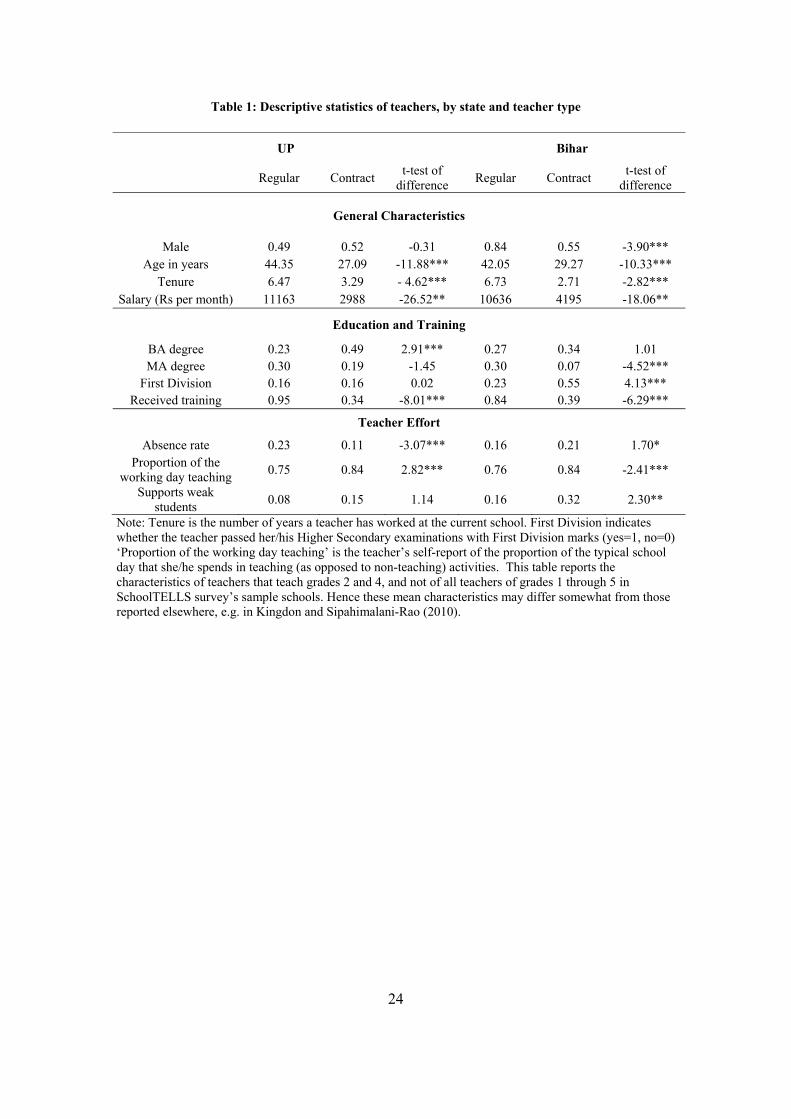
Before examining the main question, we present some descriptive statistics (Table 1) to highlight
key differences between teacher types. In both states contract teachers are noticeably younger than regular
teachers, and this is also partly reflected in their tenures. In Bihar a far higher proportion of contract than
regular teachers are female but in UP the proportions are similar. Salary differences are stark: contract
teachers earn only a quarter as much as regular teachers in UP and a third as much in Bihar, reflecting
extreme pay inequality. Despite commonly held notions, regular teachers do not have higher educational
qualifications than contract teachers; indeed the opposite is true in UP. In Bihar a higher proportion of
contract than regular teachers passed higher secondary exams with first-division marks. However, while
the majority of regular teachers have received teacher training (95% in UP, 84% in Bihar), far fewer
contract teachers have done so.
On teacher effort, contract teachers have roughly half the absence rates of regular teachers in UP
but in Bihar contract teachers’ absence rates are weakly higher than those of regular teachers (many of the
contract teachers appointed in 2006 or later in Bihar were not local to the school, and Bihar contract
teachers do not face annually renewable jobs). In both states, contract teachers spend a significantly
higher proportion of their time teaching (84% compared to 75%), and are more likely to support weak
children with their studies (15 [32] % of contract teachers report doing so in UP [Bihar] compared to 8
[15] % of regular teachers).
Methodology
An ideal method for impact evaluation of contract teachers would be a randomized trial with
children randomly assigned to contract and regular teachers within a school. However, in general
education authorities are not amenable to such an approach, and furthermore while this would give us an
estimate of the effect of contract teachers, it sheds no light on why this effect exists. While propensity
score matching methods may be used to create artificial comparator units, such an approach controls only
for the observed differences between children taught by contract and regular teachers. In the absence of
an ideal methodology, we use a number of other econometric techniques in the context of an achievement
production function.
We begin with the conventional OLS baseline where we specify an achievement production
function of the form:
(1) Aijkl = α + βFCi +δSCj +λTCk +ijkl
Where the achievement level (Aijkl ) of the ith student in lth subject in the jth school with the kth teacher is
determined by the vector of his/her personal and family background characteristics (FC), school
characteristics (SC) and teacher characteristics (TC). The vector of teacher characteristics contains our
7
variable of interest, the contractual state of the teacher, in addition to his/her age, qualifications and
gender.
An important problem for identifying a causal contract teacher effect is that assignment of
teachers to schools may not be random, as contract teachers are often posted to more remote schools. As
we have variation of teachers within schools (each child is observed in two separate subjects, and within
each school there are two grades), we can use School Fixed Effects estimation to control for the non-
random matching of children and teachers to particular schools that may be more or less likely to have
contract teachers. Here, identification of the contract teacher effect comes only from within-school
differences in teacher type, i.e. the approach controls for all observed and unobserved school factors that
affect student achievement and thus reduces endogeneity bias. We specify an equation of the form:
(2) Aijkl = α + βFCi + λTCk + (µj+ ikl)
Where µj captures all the observed and unobserved school-level characteristics which do not vary within
schools. Furthermore, as each child was tested twice in our sample (at the start and end of the school
year), we can estimate a School Fixed Effects value-added model of the achievement production function.
This regresses ‘change in achievement’ over the school year on teacher type (teacher-type assignment for
a given subject does not change over the school year), as follows:
(3) Aijkl, t+1 = α + γAijkl, t + βFCi + λTCk + (µj+ ikl)
Where Aijkl, t+1 denotes achievement level of the ith student in the jth school with the kth teacher at time t+1,
that is the end of the school year, with Aijkl, t as an additional control. Alternatively, we can specify
achievement as a true value-added model, giving an equation of the form:
(4) [ Aijkl, t+1- Aijkl,t ] = α + βFCi + λTCk + (µj+ ikl)
This regresses change in achievement on school, teacher and family characteristics.
Finally we move to our most stringent method, pupil-level fixed effects, where the identification
comes entirely from differences across subjects within a pupil. Suppose regular teachers are generally
more able in maths and contract teachers are more able in language. Then if a child does well in language
when taught by a contract teacher and does well in maths when taught by a regular teacher, one reason
could be that contract teachers are systematically abler in language skills and regular teachers abler in
maths area. However, any such correlation between teachers’ subject-specific ability and teacher type
(regular vs contract) would cause omitted variable bias in a pupil fixed effects achievement equation only
if pupils can engineer to be taught a given subject by the abler teacher-type in that subject. In our sample
of rural government primary schools, there are no schools with more than one class of a given grade;
indeed sometimes more than one grade even sit together in a class. Classes do not split by subject – the
whole class is taught all subjects. Thus, pupils are not systematically matched to particular teacher-types

8
for the different subjects within their grade in the school. This means that we can give the teacher type
variable a causal interpretation. This gives us an equation of the form:
(5) Aijkl, t+1 = α + γAijkl, t + λTCk + (µj+ηi+ kl)
Where ηi captures all observed and unobserved pupil characteristics which do not vary across subjects.
The composite error term represents the unobserved characteristics of the school, pupil and teachers. As
we have two subjects (reading and maths) we identify the contract teacher effect thus:
(6) [Aijk(Reading), t+1 - Aijk(Maths), t+1 ] = γ[Aijk(Reading), t - Aijk(Maths), t] + λ(TCk(reading) - TCk(maths)) + (µj(reading)-
µj(maths)) +(ηi(reading)- ηi(maths)) + (kl(reading)-kl(maths))
Or, in a model of changes in test scores
(7) {[Aijk(Reading), t+1 - Aijk(Reading), t] – [Aijk(Maths), t+1- Aijk(Maths), t ]} = λ(TCk(reading) - TCk(reading)) + (µj(reading)-
µj(maths)) +(ηi(reading)- ηi(maths)) + (kl(reading)-kl(maths))
So here we regress difference in child performance across subject on the difference in teacher
characteristics (including contract status) across subject. If school level unobservables are not subject-
specific, then µj drops out. Similarly if pupil-level unobservables are not subject specific (e.g. if students
who are bright in one subject are generally also bright in other subjects), then ηi also drops out. If it is the
case that children are innately better in reading than mathematics (or vice-versa) and this subject-specific
ability is constant over time, then this will drop out in our value-added framework though if subject-
specific ability changes over time (that is, pupils who are better are reading not only have higher levels,
but higher rates of change in scores, then (ηi(reading) - ηi(maths)) will remain in the error term. This is a
problem if cov[(ηi(reading)- ηi(maths)),(TCk(reading) - TCk(reading))≠0, as this will bias our estimate of the
contractual teacher effect. This could be the case if regular teachers, due to their higher status, can choose
to teach only the higher performing pupils for one subject, which is not possible here as there is only one
class per grade in our sampled schools.
After estimating the causal impact of contract teachers we try to explain our findings, using three
different approaches. Firstly, we look at the impact that contract teachers have on reducing class-size and
alleviating multi-grade teaching. Secondly we use measures of teacher effort to investigate the proposition
that renewable contracts induce higher levels of teacher effort. Finally we allow for differential effects of
observable characteristics by teacher type, using a saturated model, as suggested by Derecho and Glewwe
(2002). In a saturated model our estimations include both observed characteristics and their interaction
with the contract teacher variable. By introducing interaction terms between our variable of interest
(contract teacher dummy variable), and mean-centred values of all other observable characteristics, we
can estimate the Average Treatment Effect of being taught by a contract teacher. A child with
characteristics that are exactly average, in the average school with a teacher with average characteristics,
will not deviate from the mean value for any variable – therefore all variables will equal zero with the
9
exception of the contract teacher variable. In addition to yielding the Average Treatment Effect of having
a contract teacher, this method allows us to see the pathways through which the effect works. A full
derivation of the model can be found in Appendix 2.
We are estimating the achievement equations on a sample of enrolled children only and, in
principle, this could be a selected sample. Ideally one should use a sample selectivity correction approach.
In practice, it is difficult to find convincing exclusion restrictions with which one could identify the
selectivity term lambda using a Heckman selectivity correction model. However, primary school
enrolment rates are high with more than 90% of primary age children in school in the two sample states.
Thus, we do not expect selectivity to be too much of a problem.
Given the dominance of low scores in our data-set, and the subsequent skewness of the test-score
distribution, we are likely to suffer from heteroskedasticity in our estimations. Indeed, even after
controlling for this our model still fails Greene’s (2002) test for group-wise heteroskedasticity. A
consequence of this is that our inference is likely to be inefficient as our standard errors are too high, so
we will understate significance. Given our high number of observations (8,185 falling to 3942 in the
value-added specification) this is unlikely to be much of a problem. An alternative would be to estimate a
non-linear model, such as a count model; however we then lose the ability to estimate using within-
schools as a true fixed effects estimator for the negative binomial6 model does not exist (Allison and
Waterman 2002). As such, we prefer the linear estimator and accept the resulting inefficiency.
3. Findings
Due to some potentially important differences between the contracts of para teachers in Uttar Pradesh
and Bihar, we estimate the achievement model for each state separately. The analysis is restricted to
government schools only since contract teacher schemes exist only in government schools.
Uttar Pradesh
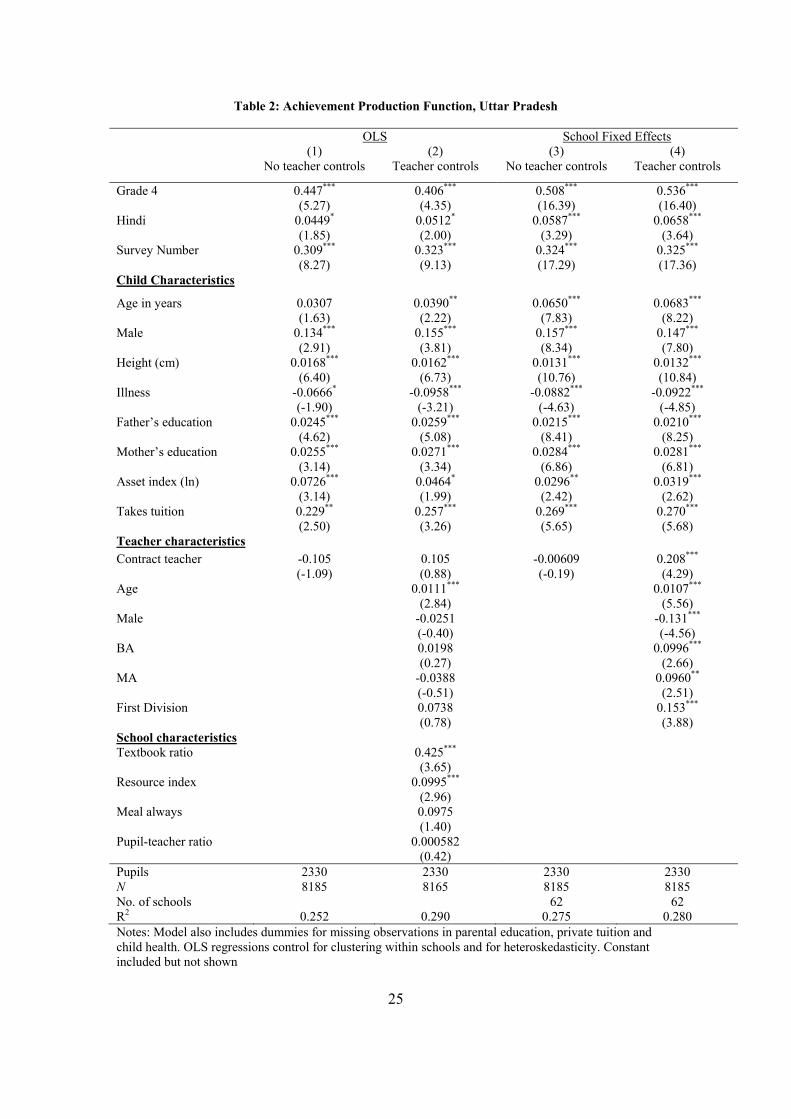
The main results for UP are presented in Table 2. The model pools both subjects (Hindi and
Maths), both grades (2 and 4) and both time periods (i.e. surveys at the start and end of the school year)
and we therefore include controls for subject, grade and time period. The dependent variable in all
regressions is the overall z-score of achievement, using the mean of achievement test score in both
subjects, for both grades and both time periods.
Our variable of main interest is the contractual status of the teacher (contract teacher=1; regular
teacher=0). Columns 1 and 2 provide the OLS baseline and columns 3 and 4 present school Fixed Effects
(FE) estimation. School FE implies within-school estimation where all school level factors (observed and
6 A simple Poisson model is excluded as this assumes the mean and variance of the dependent variable are equal – this is not the case in our data, where the mean is approximately 1/10 of the variance. Thus the negative binomial model is the obvious choice.
10
unobserved) that influence student achievement, are controlled for. Thus school FE estimation corrects
for any bias due to the potentially non-random assignment of contract teachers to particular schools. OLS
and school FE equations are presented with and without controls, to highlight the effect – on the main
variable of interest – of conditioning on teacher and school characteristics.
We briefly discuss other results before turning to our main variable of interest – the contract
teacher dummy variable. In the OLS equation (column 2), school resources and textbook provision have
large and statistically significant associations with child test scores, but mid-day meals and class size do
not. However, these results do not represent causal effects. Looking at the school FE results, pupil
achievement improves between grades: on average children in grade 4 score about half a SD higher than
those in grade 2 (the base category). Boys outperform girls by 0.15 SD, a noticeable amount given that
any selection bias in school enrolment is likely to favour girls’ scores. Healthier children do better (as in
Kingdon and Monk, 2010). Parental education and wealth (as measured by asset ownership) are
significant predictors of achievement and private tuition has strong effects, with children who receive
external tuition scoring over a quarter of a SD higher than those who do not.
In the school fixed-effects regression, male teachers lower achievement by 0.13 SD compared to
being taught by a female teacher. Teachers with BA or higher qualifications have better performing pupils
than those with only higher secondary qualifications or less (base category), but there is no discernable
difference between teachers with Bachelor’s and Master’s qualifications. A teacher who completed
his/her Higher Secondary exams in the first division (a proxy for the teacher’s own cognitive skills) has
higher performing pupils. We have not included the pre-service teacher training variable as that is highly
collinear with the contract teacher dummy, the variable of most interest.7
Turning our focus to the primary question of this paper – the relative effectiveness of contract and
regular teachers – it is seen that in the OLS achievement equation without controls (column 1), the
contract teacher variable has a negative though insignificant coefficient but that the introduction of
teacher and school characteristics in column 2 reverses the sign. A similar story emerges when moving
from column 3 to 4, which introduces teacher characteristics in a school-fixed effects framework. After
controlling for observed teacher characteristics and for all observed and unobserved school characteristics
7 When we estimate using teacher training as an additional control (shown in Appendix 3) we find the contract
teacher effect reduces somewhat (from 0.20 to 0.16 SD), and pupils of trained teachers surprisingly have
significantly lower achievement (-0.19 SD). One would expect training to improve performance, thus teacher
training here is most likely picking up differences in behaviour between teacher types, which are collinear with
contractual status. As such, we prefer estimates without the training variable.
11
(column 4), contract teachers raise child test scores by about 0.21 SD compared to being taught by a
regular teacher.
The increase in the coefficient on the contract teacher variable when we move from OLS (across-
school) to School Fixed Effects (within-school) estimation is unsurprising: the OLS coefficient on the
contract teacher variable is downward biased since contract teachers are generally more likely to be
assigned to communities where households are more deprived. The correlation between ‘proportion of
para teachers in a school’ and household wealth of children in the school is -0.16 and this is highly
statistically significant (p=0.000)8. In other words, in across-school estimation, the contract teacher
variable is partly ‘picking up’ the effect of community’s deprivation.
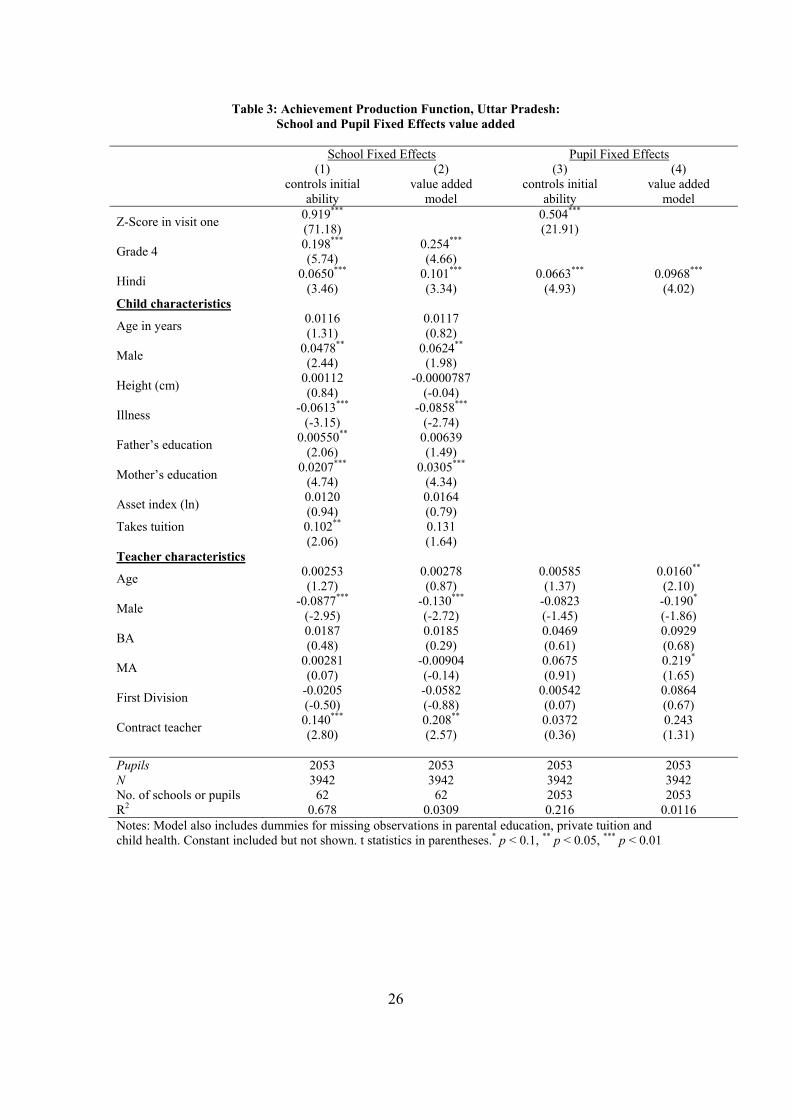
School and Pupil Fixed Effects value-added models of achievement
Table 3 extends the analysis to more stringent models of the achievement production function. It
presents two variants of the value added model, each of them first with school fixed effects and then with
pupil fixed effects. Both of these pool subjects and grades, but not time period9.
Column 1 estimates a School FE model with control for initial ability. Here the dependent
variable is the z-score of achievement in a subject at the end of the school year, and it controls for z-score
of achievement in that subject at the start of the school year. This furnishes the effect of being taught by a
contract teacher after taking into account initial performance. Column 2 estimates a purer value-added
model, where the dependent variable is the z-score of ‘change in absolute pupil achievement in a subject
over the school year’. This tells us how contract teachers affect the growth of cognitive skills over the
school year.
Pupils in grade 4 learn more over the school year than those in grade 2, having value-added
scores of 0.25 SD higher (column 2). This may be because the difficulty level of the tests is pitched at the
type of competencies that are learnt better at the grade 4 stage in Uttar Pradesh.
Child and family variables remain largely unchanged, with the exception of paternal education
which has a far lower effect in the value added than in the levels framework (column 4 of Table 2).
8 At the child level, those taught by contract teachers are more deprived: the t-value of the contract-regular teacher
difference in maternal years of education is 6.0, in paternal education is 6.9 and in household wealth is 2.9. 9 In Table 3, there are 2053 children of grades 2 and 4 but, as there are two rows of data for each child (one for each
subject), N should be double, i.e. 4106. Instead N is 3942. This is mainly because for 164 children, their mark is
available only in one subject rather than both. Similarly, in Table 2 (which pools both surveys at the start and end of
the school year), N should be double of 3942, i.e. it should be 7884 but instead it is 8185. This is mainly because for
about 150 children, achievement mark in both subjects is available only for one time period, not both. However, the
contract teacher results are virtually unchanged when we keep only children on whom we have test score in both
subjects in both time periods.

12
Interestingly, while the coefficient on maternal education falls, it does so by far less and has a significant
coefficient nearly 4 times the size on paternal education. This suggests that children of more educated
mothers learn more throughout the school year, reflecting mothers’ greater time with their offspring than
fathers. The gender differential in value added score declines to 0.048 SD, but is still statistically
significant, suggesting that the big gender gap in the levels regressions (of Table 2) was part of a steady
divergence in learning throughout the years. The benefits from private tuition diminish when we control
for prior ability (relative to column 4 in Table 2).
The positive contract teacher effect remains intact even after we control for prior ability.
Controlling for initial ability yields a contract teacher effect of 0.140 SD (column 1) while in the value
added model it is 0.208 SD (column 2). Given there is a 0.325 SD increase in learning over the school
year (column 4 of Table 2), being taught by a contract teacher yields learning benefits equivalent to
between 2/5ths and 3/5ths of a year in school. In another way of benchmarking its size, the contract teacher
effect of between 0.14 and 0.21 SD is equal to the effect of between 5 and 7 years of mother’s education
(controlling for father’s education).
Even in within-school estimation, the contract teacher variable is potentially endogenous. All the
narratives of concern surrounding contract teacher schemes are based on the fear that contract teachers
may be of lower ability and motivation since they are paid only one-quarter to one-third of the pay of
regular teachers in UP and Bihar, and since their educational and professional qualification-requirements
are lower than regular teachers’. Thus, if the school FE estimate suffered from endogeneity bias, it would
mean that the estimated contract teacher effect is, if anything, downward biased due to such teachers’
lower ability than regular teachers, and would imply that the true contract teacher effect is even higher
than 0.21 SD.
Columns 3 and 4 re-estimate the achievement production function using the pupil fixed effects
estimator, where identification comes entirely from differences in teacher-type across subject within a
pupil, that is, when the same child is taught by a regular teacher for one subject and a contract teacher for
another. This specification controls for all (subject-invariant) unobserved pupil characteristics. We would
argue that in this estimator the teacher characteristics (including contract dummy variable) are not
endogenous since there is nothing in the rules for hiring contract or regular teachers that favours one
subject or another. Moreover, in any case, there is only one class of a given grade in our sample of
schools (indeed about half the time two or more grades sit together in a class), and classes are not split by
subject in the primary grades – thus a school cannot assign the students of a grade who are bright in a
given subject to teachers who are bright in that subject; the whole class is taught as a unit, in both
subjects.
13
Again we present two variants: column 3 regresses test score at the end of the school year on
initial test score at the start of school year, and on teacher characteristics; column 4 presents a value-
added equation, relating temporal change in test score to teacher characteristics. These two columns
report our most stringent estimates of the contract teacher effect. We find a positive and large point
estimate of the contract teacher effect (0.24 SD) in column 4, though it is statistically insignificant in both
models (columns 3 and 4). There may not be enough within-pupil variation in teacher type across subject
to precisely identify the effect of contract teachers.
Bihar
Having presented the results for UP, we now turn to the state of Bihar. The main results are
presented in Table 4. There are strong achievement differences between grades in Bihar, with pupils in
grade 4 scoring 1.023 SD higher than those in grade 2. This is double the achievement differential found
in UP, suggesting a higher relative rate of learning between grades in Bihar than in UP (the level of
learning is also higher in Bihar than in UP, see Appendix 1; this is also corroborated in the national ASER
survey (2009) and in the NCERT survey (2005)). One potential explanation for higher learning levels is
that Bihar students are much more likely to take private tuition (40% of the sample compared to 4% in
UP, see Appendix 1). Another possible explanation is that while much of the cognitive skills tests are
pitched at the grade 4 level of difficulty, in UP grade 4 pupils are more akin to grade 2 pupils in terms of
their level of competency and that is why they exhibit lower levels of achievement growth – because the
test is too difficult for them – while in Bihar grade 4 children are at the grade 4 level of competency and
thus exhibit the sort of gain in learning over the school year that one might expect from a grade 4 child.
The differential between maths and language scores is greater in Bihar than UP, at nearly 0.20 SD
(compared to 0.06 in UP). The gender gap is also nearly double, with boys outperforming girls within the
same school by 0.26 SD. Measures of child health – illness and height – are significantly related to
cognitive outcomes. Both maternal and paternal education is related to performance, though less so than
in UP, and again maternal education has a stronger effect than paternal. The effect of household wealth is
twice as strong as in UP though private tuition has a somewhat smaller effect. The majority of teacher
characteristics are insignificantly correlated with student achievement other than teacher’s gender and
age, which have similar coefficients as in UP.
With regards our variable of most interest, moving from OLS to school FE estimation raises the
contract teacher effect because in Bihar (as in UP), para teachers are more likely to be serving in the more
deprived communities and the para teacher variable ‘picks up’ the effect of community deprivation in the
OLS equation. In the School FE achievement equation conditioning on teacher characteristics, the
contract teacher variable has a positive and weakly significant coefficient: pupils of contract teachers
14
score 0.069 SD higher than their regular teacher counterparts in the same school. This effect is
substantially smaller than in UP (0.208), a point we return to below.
In Bihar a court ruling in 2006 stipulated that applicants with teacher training certificates should
be given preference in contract teacher appointments even if they did not live locally (to the school).
Many of the contract teachers appointed in 2006 in Bihar were thus individuals who possessed teacher
training (often unemployed persons who had done teacher training many years ago). If we consider those
appointed in 2006 and with pre-service training as a separate group to those who were appointed either
pre-2006 or in 2006 without training, then we can classify Bihar contract teacher into three different
types. Re-estimating the model (Table 5) with ‘regular teacher’ as the base category for teacher-type in all
equations, we could not reject the null that the coefficients on the different contract teacher dummy
variables are equal. That is, there is statistically no difference in the relative effectiveness of contract
teachers with and without pre-service training (controlling for age, qualifications and gender). This calls
into question the quality and usefulness of pre-service training.
School and Pupil Fixed Effects value-added models of achievement
In Bihar while the school FE estimate of the contract teacher effect is positive, it is only weakly
significant. In Table 6 we test the robustness of this finding in four more models: firstly school FE with
controls for initial achievement, secondly school FE using value-added achievement, and then these two
repeated again using pupil fixed effects estimation.
We find that while the contract teacher effect is always positive, it is only weakly statistically
significant in one specification. Our most stringent results are from the pupil-fixed effects specification
where identification comes entirely from differences in scores across subjects within a pupil, i.e. it
controls for any (subject-invariant) unobserved child-level characteristics. We find that a pupil’s
achievement in a subject that is taught by a contract teacher is higher than in a subject that is taught by a
regular teacher (by between 0.06 and 0.07 SD) but that the effect is at best only weakly significant.
Thus, our results suggest that contract teachers are substantially more effective than regular
teachers in UP and weakly more effective than regular teachers in Bihar. This raises the question why? To
answer this question we look at two possible avenues – the effect that contract teachers have on changing
classroom organisation (such as multi-grade teaching and class-size) and differences in behaviour by
teacher type.
4. Why are contract teachers equally, or more effective than regular teachers?
a. Changes in class-size and multi-grade teaching
One way through which contract teachers may have beneficial effects on child learning is by lowering
pupil-teacher ratios and reducing or eliminating multi-grade teaching. Indeed, this is one of the officially
15
stated rationales for the hiring of contract teachers. Schools with more contract teachers can be expected
to have lower pupil-teacher ratios and use more mono-grade teaching. Table 7 shows the school-level
correlation between the number of contract teachers in a school on the one hand, and pupil-teacher ratio
and multi-grade teaching on the other. Given the marked differential between the official pupil-teacher
ratio (defined as the ratio of the total number of enrolled pupils to appointed teachers in the school) and
the actual observed pupil-teacher ratio (defined as the number of teachers and pupils present when the
school was visited), we report both measures. A school is defined as being multi-grade when the number
of classes observed was less than the number of grades in the school. Table 7 shows that the number of
contract teachers in a school is significantly negatively correlated with both the official and the actual
pupil-teacher ratio in both states, suggesting that schools with higher numbers of contract teachers do
indeed have lower class sizes. In Bihar, number of contract teachers in a school is significantly negatively
correlated with the incidence of multi-grade teaching.
Is it the case then that the estimated contract teacher ‘effect’ is really an effect of reduced class-
size and improved classroom organisation? To examine this issue, in Table 8 we present OLS and School
FE estimation of achievement, controlling for class-size and mono-grade teaching. We can control for
actual class-size and mono-grade even within a school as these can vary between grades. Given the
identification problems when using OLS regressions, we prefer School FE estimates, but given the across
school correlations highlighted in Table 7, we also report OLS to show there that even in an across school
regression, the contract teacher effect is independent of class-size and mono-grade teaching. The class-
size (pupil-teacher ratio, PTR) effect is wholly insignificant in the OLS regression and weakly significant
with a tiny coefficient in the fixed effects estimation (columns 2 and 5) in both states. Mono-grade
teaching has a large positive association with achievement in UP (column 6), but is perversely negative in
Bihar.
Most importantly for our question, neither the inclusion of class size, nor of control for mono-
grade teaching, significantly changes the coefficient of the contract teacher variable. Thus, while contract
teachers lower class-size (in both states) and lessen multi-grade teaching (in Bihar), this does not appear
to be driving the contract teacher effect.
b. Changes in teacher effort
An additional possible explanation is that contract teachers, due to their short-term insecure contracts
which can be terminated, face greater accountability pressures and thus exhibit more effort than regular
teachers. One way of measuring teacher effort is through the teachers’ absence rate. Certainly in UP
contract teachers display noticeably lower (about half) absence rates than regular teachers. In Table 9 we
re-estimate the school-fixed effect achievement equation (Column 4 of Table 2) but now also control for a
16
number of measures of teacher effort, including whether or not they report spending time supporting weak
children and the proportion of time they spend in beneficial activities in the average school day. Given the
weak significance of the contract teacher effect in Bihar, we report estimates for UP only, though
inclusion of teacher effort measures has similar effects in Bihar as in UP. Each additional control is
evaluated first without teacher type (columns 2, 4 and 6) and then with teacher type (columns 3, 5 and 7).
Table 9 shows that the contract teacher effect is very robust to inclusion of controls for teacher
effort. Statistically there is no difference among the point estimate between all specifications. This result
is robust to allowing non-linearities in the relationship between teacher effort and achievement (not
shown).
Column (2) shows that children whose teacher is absent more frequently score lower. Including
both teacher absence and the contract teacher variable, we find the coefficient on absence halves (from -
0.125 to -0.0595) but the contract teacher effect falls only slightly and remains significant. This can arise
if variation in absence rates in mostly across-teacher types, rather than within-teacher types.
Column (4) reports the effect of teacher’s time-on-task. The measure used is a composite index,
as detailed in the note to Table 9. The variable itself is insignificantly associated with child achievement
and its inclusion does not change the contract teacher effect substantially or statistically significantly.
Column (6) shows that child achievement benefits strongly from having a teacher who supports weak
pupils, as explained in Table 9. This is consistent with Bourdon et al.’s (2007) findings that contract
teachers are particularly effective when teaching lower ability pupils. The effect diminishes slightly when
we control for teacher type (column 7), as contract teachers are more likely to report supporting weak
pupils (17% compared to 6% for regular teachers). Importantly for our main question, inclusion of this
measure of teacher effort does not reduce the contract teacher effect.
We conclude that the positive contract teacher effect is not explained by the dimensions of
teacher effort that are available in our data set. One potential explanation of the contract teacher effect is
as follows: the lower salaries of contract teachers may imply that only persons intrinsically motivated
towards teaching children take these low paid jobs, whereas regular teachers are individuals who are
attracted more by the high salaries of regular teacher posts but have less intrinsic motivation for teaching.
However, the activities inspired by any such higher motivation of contract teachers (that lead them to be
more effective as teachers) are not adequately captured in the measures of teacher effort available to us.
c. Differential effects of observables by teacher type
The previous models have shown that the contract teacher effect is both positive and robust to the
inclusion of the available measures of effort. While it is possible that these effects are driven by
unobserved characteristics of contract teachers, notably higher non-measurable aspects of effort, it is also
17
possible that it partly may be due to differential effects of observable characteristics by teacher type. To
investigate this, we estimate a saturated model, where our estimations include both observed
characteristics, and their interaction with the contract teacher variable. By introducing interaction terms
between our variable of interest (contract teacher dummy variable), and mean-centred values of all other
observable characteristics, we can estimate the Average Treatment Effect (ATE) of being taught by a
contract teacher (see methodology section). A child with characteristics that are exactly average, in the
average school with a teacher with average characteristics, will not deviate from the mean value for any
variable – therefore all variables will equal zero with the exception of the contract teacher variable.
In addition to this, the coefficients on the interaction terms tell us how contract teachers affect
child learning. A significant coefficient on these terms shows that the interaction between contract
teachers and these inputs leads to significantly different outcomes for pupils taught by contract teachers
when compared to those taught by regular teachers. This should allow us to open the black box of why a
contract teacher is equally or more effective than a regular teacher.
In both UP and Bihar the ATE of the contract teacher variable is small and statistically insignificant. This
shows that the average treatment effect of having a contract teacher is zero – that is, contract teachers are
no less and no more effective than regular teachers after controlling for all possible interaction effects.
An F-test of insignificance of the interaction terms is decisively rejected in both states;
interactions between contract teachers and our observable characteristics have a significant effect on
learning outcomes.
In both states male contract teachers are more effective than male regular teachers. Overall, in
schools with more than the average male/female teacher ratio, we find a positive male contract teacher
effect relative to male regular teachers. In UP, male contract teachers are more effective than female
regular teachers, while in Bihar they are not. This suggests that in UP the contract teacher effect
completely mitigates the negative effect of being a male teacher, while in Bihar it reduces it, but male
teachers (regardless of contractual type) are still less effective than female teachers.
In a school with a male/female ratio that was 10% higher than the average, a child taught by a
regular teacher would score 0.038 SD lower than being taught by a female regular teacher. If taught by a
contract teacher they would score 0.0373 SD higher than if they were being taught by a male regular
teacher (or 0.0035 SD higher than a female regular teacher). As the proportion of males in the school
increases, the differential between being taught by a regular male teacher and a regular contract teacher
increases.
Contract teachers appear to mitigate the negative effects of below-average health, both in terms of
long term measures such as child height and short term effects of absence through illness. Children with
below average height and fathers with below average levels of education gain from having a contract
18
teacher in UP. Given that paternal education is likely to have more indirect effects than maternal
education (which has equal effects for both teacher types) – fathers are less likely to be active in the day
to day education of the child, more in determining attitudes to schooling and school choice – this may
suggest that contract teachers reduce the negative impact of coming from families with lower SES. Also,
a child who has a contract teacher and is ill for more than 4 days in the last 3 months would lose 0.09 SD
relative to his healthier peers, while a child in the same situation with a regular teacher would have a mark
0.24 SD lower than his healthier peers.
In Bihar, aside from teacher’s gender, the only other significant differential effect is through
lowering the benefits of receiving private tuition. Given that time-on-task is substantially lower in Bihar
than UP (with teachers spending approximately 111 minutes teaching compared to 187 in UP), private
tuition is far more pervasive, being undertaken by 40% of our sample of Bihar children. It appears that
having a contract teacher narrows the achievement gap between those who take private tuition and those
who do not.
In both states contract teachers appear to mitigate the effects – on test scores – of being from a
disadvantaged background, be it having below averagely educated father (in UP), health problems (in UP)
or not being able to take private tuition (Bihar). This is consistent with the fact that contract teachers are
closer in terms of social standing to their pupils. Regular teachers, who enjoy salaries far above the
average earnings in the areas they teach in, may consider under-privileged pupils less capable, and may
neglect struggling students. The findings that contract teachers benefit weaker or lower-achieving
children are supported by descriptive data from the teacher questionnaire based on teachers’ opinions.
The results (not presented) show that regular teachers are 7 percentage points more likely (than contract
teachers) to agree ‘fully’ or agree ‘quite a lot’ with the statement that ‘schedule caste and schedule tribe
children are generally less attentive or less motivated towards studies than other children’, and this
difference between regular and contract teachers’ opinions is statistically significant at the 6% level of
significance.
The saturated model suggests that while the ATE effect of a contract teacher effect is roughly
zero, contract teachers have significant interaction effects with observables. Most notably they are good
for increasing the efficiency of male teachers, and also appear to lessen the achievement disadvantage for
children of lower socio-economic status.
5. The relative cost of contract teachers
The previous sections have focussed on the relative effectiveness of regular and contract teachers.
However, this is only one half of the discussion. To complete the picture we shift our attention to the
remuneration of teachers and calculate the ‘teacher salary cost per achievement point’. Our estimations
19
suggest that pupils with contract teachers score 0.21 SD higher in Uttar Pradesh, and 0.063 SD higher in
Bihar. This translates into an average absolute-score increase of 8.4 marks in UP and 3.7 marks in Bihar,
taking the average student from 25.5 marks to 33.9 in UP and from 63.4 marks to 67.1 marks in Bihar.
This translates to a 33% increase and 6% increase in marks in UP and Bihar respectively.
To illustrate this point, Table 11 shows the relative cost per achievement point, of regular and
contract teachers in each state. The ratio of regular teacher pay to contract teacher pay is 3.97 in UP and
2.65 in Bihar. However, when we calculate the cost per predicted achievement point (taken from the
average child taught by each teacher type), this ratio increases to 5.27 in UP and 2.80 in Bihar. So UP’s
raw ratio of regular: contract teacher costs (3.97) increases to a standardized ratio of 5.27 when we
consider the true cost (in terms of cost-per-predicted-achievement point).
It may be that regular teachers are paid higher than contract teachers to reward them for other
favourable characteristics. For a more accurate comparison, the influence of these characteristics must be
taken into account. Table 12 reports OLS and School-Fixed effects regressions of the log of teacher pay.
We use as controls the teacher characteristics used in the achievement production functions earlier, but
the results are robust to additional controls for teachers’ caste and religion. We use data from government
primary schools only, as in the achievement analysis in the rest of the paper.
Our model has high explanatory power. The average achievement level of children in the school
is an insignificant determinant of teacher salaries in both states, highlighting the absence of performance
related pay. The age earnings profile is twice as steep in Bihar as in UP. In the main, age and teacher type
are the only significant determinants of teacher salary in these public sector schools. In neither state are
there wage returns to educational qualifications, despite the positive influence they have on achievement.
In all estimates the coefficient on male gender is positive and around 5-6%, though the effect is only
significant for Bihar. This positive coefficient contrasts with the consistently significant negative
coefficient we find for the effect of male teachers on achievement. In Bihar we find that teacher training
yields a wage return of 8%, even though it is uncorrelated with higher child achievement (Table 5) and
may even lower achievement (footnote 7).
Contract teachers are paid far less in both states even after controlling for characteristics (i.e.
when we compare regular and contract teachers of the same age, gender and qualifications). In UP the
ceteris paribus contract teacher wage is approximately 33% of the regular teacher’s wage and in Bihar it
is approximately 56%10. This translates to regular teachers earning 3.06 times more than (otherwise
comparable) contract teachers in UP, and 1.78 times more in Bihar. 10 This is calculated by taking the exponential of the regular teacher’s wage (given by the constant) and the contract
teacher’s wage (constant minus the contract teacher effect). This is likely to be an underestimate, as contract
teachers are younger than regular teachers. After taking this into account the ratio is 3.59 in UP.
20
The structure of teacher pay in the government school sector is inefficient since it does not reward
teaches for possessing characteristics that raise learning (in achievement equations). Female teachers are
paid less despite raising student achievement, trained teachers are rewarded with higher pay despite no
increase in student achievement from teacher training, and there is no performance related pay: teachers
are not paid more if their students have higher achievement This is compounded by the fact that contract
teachers are seriously underpaid relative to regular teachers of the same observed characteristics, despite
producing higher pupil achievement.
6. Conclusions
This paper sought to measure the relative effectiveness and costs of regular and contract teachers
in two Indian states. We used a number of models of the education production function to identify the
causal effect of contract teachers. In all models we find that contract teachers do no worse than regular
teachers, and indeed may be more effective than regular teachers. There is no evidence that the contract
teacher effect is a class-size effect, i.e. that contract teachers appear more effective because they work
with smaller classes or mono-grade classes.
Contract teachers are generally more likely to teach in more deprived schools and this may lead to
an incorrect conclusion regarding their effectiveness. After controlling for all school factors (in a School
Fixed Effects regression) as well as for a rich array of pupil and teacher characteristics, contract teachers
in UP are more effective than regular teachers. Controlling for all unobserved pupil factors confirms a
positive contract teacher effect but it is not precisely estimated. A reason why contract teachers apply
greater effort than regular teachers is plausibly due to the insecure annually renewable nature of their
contracts. Given this uncertainty they are liable to exhibit more effort, which could lead to higher child
outcomes. However, the fact that much of the contract teacher effect remains even after we take their
lower absence rates and other measures of effort into account suggests that they apply greater effort in
dimensions other than being present in school and the other dimensions captured here.
In Bihar, contract teachers do not face strong accountability11, yet are still no less effective
(indeed are weakly more effective) than regular teachers. This holds irrespective of the type of contract
teacher. This shows that it is something intrinsic in the contracting of para teachers that leads them to be
equally or more effective than regular teachers, despite their lack of training and experience, and their far
lower pay. In Bihar, there is a clause in contract teacher contracts saying that appointments can be
reviewed every three years, creating some weak accountability pressures. While these pressures are
clearly not strong enough to elicit a difference in contract teachers’ school attendance habits, it may lead
11 At least in the year of the survey (2007-08) they did not. In July 2009, the Bihar state government announced that it would test contract teachers before re-confirming their jobs. Teachers would have to gain at least 45% marks in the test to be reconfirmed in their jobs.
21
to a weak increase in effort-levels in dimensions that we have not been able to capture here. It could be
that contract teachers are of a different type than regular teachers; for example, lower salaries of contract
teachers may imply that only persons intrinsically motivated towards teaching children take these low
paid jobs, whereas regular teachers are individuals attracted more by the high salaries of regular teacher
posts but have less intrinsic motivation for teaching.
A saturated model suggests that part of the contract teacher effect is due to contract teachers
mitigating the negative effects of being socially disadvantaged, possibly due to the lesser social distance
of contract teachers to their pupils, relative to regular teachers. This is supported by the fact that contract
teachers devote more time supporting weak children in schools. In conjunction with the fact that contract
teachers live closer to school this may induce more effort by making teachers more accountable to
parents. That contract teachers are less socially-distant from their students is supported by Kingdon
(2010) which estimates that in 2005 the ratio of teacher pay to state per capita income in UP was 7.3, i.e.
regular teachers are 7 times as well off as the average student they teach, a great economic distance,
which is likely to be even greater in rural UP since rural per capita incomes are around one-third of urban
incomes. Kingdon concludes that “When teachers are so much better-off than the students, they can look
down on students with disdain since children in government schools typically come from poorer than
average backgrounds in any case, and may come to school shabby, unclean and underfed”.
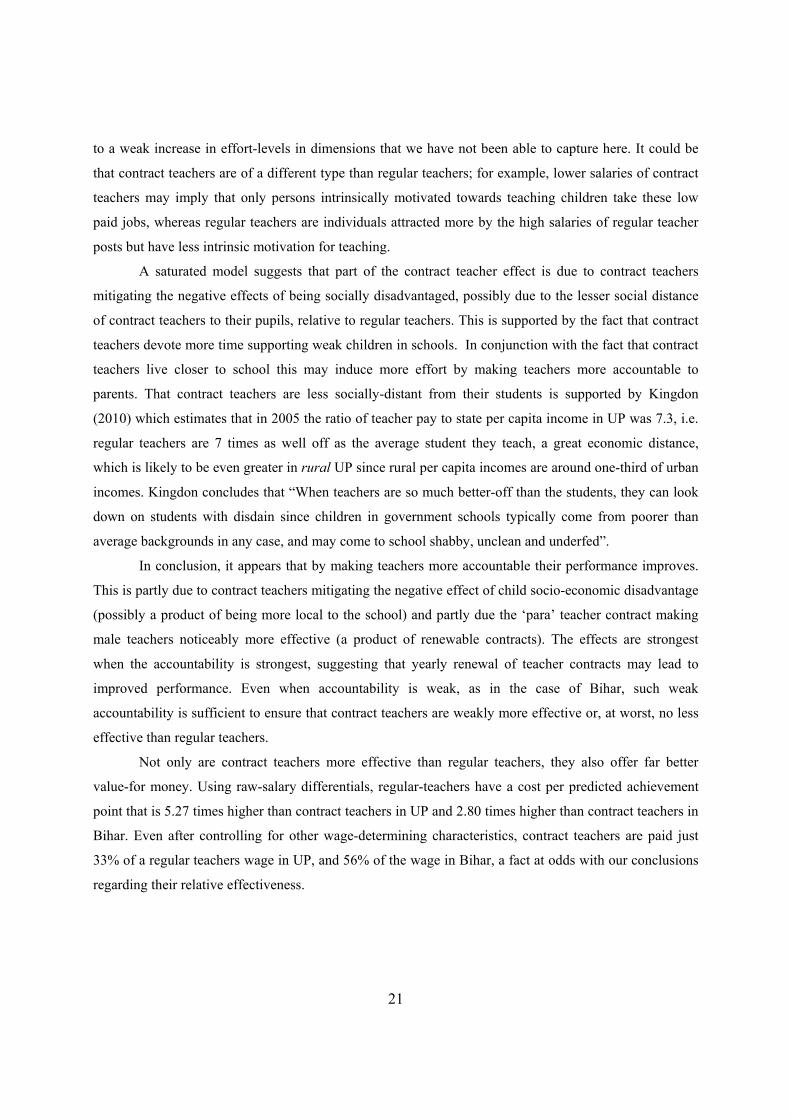
In conclusion, it appears that by making teachers more accountable their performance improves.
This is partly due to contract teachers mitigating the negative effect of child socio-economic disadvantage
(possibly a product of being more local to the school) and partly due the ‘para’ teacher contract making
male teachers noticeably more effective (a product of renewable contracts). The effects are strongest
when the accountability is strongest, suggesting that yearly renewal of teacher contracts may lead to
improved performance. Even when accountability is weak, as in the case of Bihar, such weak
accountability is sufficient to ensure that contract teachers are weakly more effective or, at worst, no less
effective than regular teachers.
Not only are contract teachers more effective than regular teachers, they also offer far better
value-for money. Using raw-salary differentials, regular-teachers have a cost per predicted achievement
point that is 5.27 times higher than contract teachers in UP and 2.80 times higher than contract teachers in
Bihar. Even after controlling for other wage-determining characteristics, contract teachers are paid just
33% of a regular teachers wage in UP, and 56% of the wage in Bihar, a fact at odds with our conclusions
regarding their relative effectiveness.
22
References
Allison, P and R. Waterman (2002) “Fixed-Effects Negative Binomial Regression Models”, Sociological Methodology. 32 (1): 247-265 Angrist, J. and V. Lavy (1999) “Using Maimonides' Rule to Estimate the Effect of Class Size on Scholastic Achievement”, Quarterly Journal of Economics. May; 114(2): 533-75. Banjerji, R, P.Chaudhary, P and G. Kingdon (2007-08). SchoolTELLS (2007-08) Survey of Rural Primary Schools in UP and Bihar Case, A. and A. Deaton (1999) “School Inputs and Educational Outcomes in South Africa”, Quarterly Journal of Economics. August; 114(3): 1047-84. Derecho, A and P. Glewwe (2002) “Are Private Schools More Effective than Public Schools? Estimation Issues and Evidence from the Philippines” Unpublished working paper, University of Minnesota Duflo, E, P. Dupas and M. Kremer (2009) “Additional Resources versus Organizational Changes in Education: Experimental Evidence from Kenya”. Mimeo, MIT, http://econ-www.mit.edu/files/4286 Duthilleul, Y. (2005), “Lessons learnt in the use of 'contract' teachers,”, International Institute for Educational Planning, UNESCO. Froelich, M., J. Bourdon and K. Michaelowa (2007), "Teacher Shortages, Teacher Contracts and their Impact on Education in Africa," University of St. Gallen Department of Economics working paper series 2007 2007-20, Department of Economics, University of St. Gallen. EdCil (2008) Teachers’ Absence in Primary and Upper Primary Schools in Andhra Pradesh, Madhya Pradesh and Uttar Pradesh: Abridged Report. Educational Consultants India Ltd., New Delhi. Greene, W. H. (2002) Econometric Analysis. 5th ed. Upper Saddle River, NJ: Prentice Hall, 1999, 2002
Govinda, R. and Y. Josephine (2004) “Para teachers in India: A Review”, mimeo, National Institute of Educational Planning and Administration, Delhi. http://www.unesco.org/iiep/eng/research/basic/PDF/teachers5.pdf Goyal, S. and P. Pandey (2009) “Contract Teachers”, Report No. 28, South Asia Human Development Sector, World Bank, November. Kingdon, G. (2010) “The implications of the Sixth Pay Commission on Teacher Salaries in India”, RECOUP Working Paper 29, May 2010. Faculty of Education, University of Cambridge.
23
Kingdon, G. and V. Sipahimalani-Rao (2010) “Para teachers in India: Status and Impact”, Economic and Political Weekly, 45 No. 12, March 20 - March 26. Kingdon, G. and C. Monk (2010) “Health, Nutrition and Academic Achievement: New Evidence from India” mimeo, Institute of Education, University of London. May. Krueger, A. B. (1999) “Experimental Estimates of Education Production Functions”, Quarterly Journal of Economics. May 1999; 114(2): 497-532. Kumar, K., Priyam, M., and Saxena, S. (2001). “The Trouble with “Contract teachers”. Frontline, 18/22. Leclercq, François (2002). “The Impact of Education Policy Reforms on the Education System: A Field Study of EGS and Other Primary Schools in Madhya Pradesh”, CSH Occasional Paper N°5, Publication of the French Research Institutes in India, New Delhi Maheshwari, A.N. (2002) “Quality Improvement in Elementary Teacher Education – An Introduction”, mimeo, National Council for Teacher Education, New Delhi. Mehta, Arun C. (2007) Elementary Education in India: Progress towards UEE: Analytical Report 2005-06. National University of Educational Planning and Administration, New Delhi. Muralidharan, K. and V. Sundararaman (2008) “Contract Teachers: Experimental Evidence from India”, mimeo, University of California at San Diego, September. http://econ.ucsd.edu/~kamurali/contract%20teachers.pdf NCAER (2008) “Deployment and Professional Competence of Para-Teachers: Executive Summary”. National Council of Applied Economic Research, New Delhi. NCERT (2009) Reference for the mid-term achievement test (to be added) Pratham (2009) “ASER 2009—Annual Status of Education Report”, New Delhi, Pratham Pratichi Trust (2002) Education Report, http://www.amartyasen.net/pratichi.htm. Probe Team (1999) Public Report on Basic Education in India, Oxford University Press, New Delhi. Sankar, Deepa (2008a) “Unravelling Teachers’ Time on Task and Nature of Tasks: Evidences from Three Indian States”. World Bank draft paper, New Delhi. Sankar, Deepa (2008b). “Does teacher’s instructional time matter in school effectiveness in improving children’s learning outcomes? A study in three Indian States using Hierarchical Linear Modelling”. World Bank, Draft, New Delhi.
24
Table 1: Descriptive statistics of teachers, by state and teacher type
UP Bihar
Regular Contract t-test of
difference Regular Contract
t-test of difference
General Characteristics
Male 0.49 0.52 -0.31 0.84 0.55 -3.90***
Age in years 44.35 27.09 -11.88*** 42.05 29.27 -10.33*** Tenure 6.47 3.29 - 4.62*** 6.73 2.71 -2.82***
Salary (Rs per month) 11163 2988 -26.52** 10636 4195 -18.06**
Education and Training
BA degree 0.23 0.49 2.91*** 0.27 0.34 1.01 MA degree 0.30 0.19 -1.45 0.30 0.07 -4.52***
First Division 0.16 0.16 0.02 0.23 0.55 4.13*** Received training 0.95 0.34 -8.01*** 0.84 0.39 -6.29***
Teacher Effort
Absence rate 0.23 0.11 -3.07*** 0.16 0.21 1.70* Proportion of the
working day teaching 0.75 0.84 2.82*** 0.76 0.84 -2.41***
Supports weak students
0.08 0.15 1.14 0.16 0.32 2.30**
Note: Tenure is the number of years a teacher has worked at the current school. First Division indicates whether the teacher passed her/his Higher Secondary examinations with First Division marks (yes=1, no=0) ‘Proportion of the working day teaching’ is the teacher’s self-report of the proportion of the typical school day that she/he spends in teaching (as opposed to non-teaching) activities. This table reports the characteristics of teachers that teach grades 2 and 4, and not of all teachers of grades 1 through 5 in SchoolTELLS survey’s sample schools. Hence these mean characteristics may differ somewhat from those reported elsewhere, e.g. in Kingdon and Sipahimalani-Rao (2010).
25
Table 2: Achievement Production Function, Uttar Pradesh
OLS School Fixed Effects (1) (2) (3) (4) No teacher controls Teacher controls No teacher controls Teacher controls
Grade 4 0.447*** (5.27)
0.406*** (4.35)
0.508*** (16.39)
0.536*** (16.40)
Hindi 0.0449* (1.85)
0.0512* (2.00)
0.0587*** (3.29)
0.0658*** (3.64)
Survey Number 0.309*** (8.27)
0.323*** (9.13)
0.324*** (17.29)
0.325*** (17.36)
Child Characteristics
Age in years 0.0307 (1.63)
0.0390** (2.22)
0.0650*** (7.83)
0.0683*** (8.22)
Male 0.134*** (2.91)
0.155*** (3.81)
0.157*** (8.34)
0.147*** (7.80)
Height (cm) 0.0168*** (6.40)
0.0162*** (6.73)
0.0131*** (10.76)
0.0132*** (10.84)
Illness -0.0666* (-1.90)
-0.0958*** (-3.21)
-0.0882*** (-4.63)
-0.0922*** (-4.85)
Father’s education 0.0245*** (4.62)
0.0259*** (5.08)
0.0215*** (8.41)
0.0210*** (8.25)
Mother’s education 0.0255*** (3.14)
0.0271*** (3.34)
0.0284*** (6.86)
0.0281*** (6.81)
Asset index (ln) 0.0726*** (3.14)
0.0464* (1.99)
0.0296** (2.42)
0.0319*** (2.62)
Takes tuition 0.229** (2.50)
0.257*** (3.26)
0.269*** (5.65)
0.270*** (5.68)
Teacher characteristics Contract teacher -0.105
(-1.09) 0.105 (0.88)
-0.00609 (-0.19)
0.208*** (4.29)
Age
0.0111*** (2.84)
0.0107*** (5.56)
Male
-0.0251 (-0.40)
-0.131*** (-4.56)
BA
0.0198 (0.27)
0.0996*** (2.66)
MA
-0.0388 (-0.51)
0.0960** (2.51)
First Division
0.0738 (0.78)
0.153*** (3.88)
School characteristics Textbook ratio
0.425*** (3.65)
Resource index
0.0995*** (2.96)
Meal always
0.0975 (1.40)
Pupil-teacher ratio
0.000582 (0.42)
Pupils 2330 2330 2330 2330 N 8185 8165 8185 8185 No. of schools 62 62 R2 0.252 0.290 0.275 0.280 Notes: Model also includes dummies for missing observations in parental education, private tuition and child health. OLS regressions control for clustering within schools and for heteroskedasticity. Constant included but not shown
26
Table 3: Achievement Production Function, Uttar Pradesh:
School and Pupil Fixed Effects value added School Fixed Effects Pupil Fixed Effects (1) (2) (3) (4) controls initial
ability value added
model controls initial
ability value added
model
Z-Score in visit one 0.919*** (71.18)
0.504*** (21.91)
Grade 4 0.198*** (5.74)
0.254*** (4.66)
Hindi 0.0650***
(3.46) 0.101*** (3.34)
0.0663*** (4.93)
0.0968*** (4.02)
Child characteristics
Age in years 0.0116 (1.31)
0.0117 (0.82)
Male 0.0478** (2.44)
0.0624** (1.98)
Height (cm) 0.00112 (0.84)
-0.0000787 (-0.04)
Illness -0.0613***
(-3.15) -0.0858***
(-2.74)
Father’s education 0.00550**
(2.06) 0.00639 (1.49)
Mother’s education 0.0207***
(4.74) 0.0305***
(4.34)
Asset index (ln) 0.0120 (0.94)
0.0164 (0.79)
Takes tuition
0.102** (2.06)
0.131 (1.64)
Teacher characteristics
Age 0.00253 (1.27)
0.00278 (0.87)
0.00585 (1.37)
0.0160** (2.10)
Male -0.0877***
(-2.95) -0.130*** (-2.72)
-0.0823 (-1.45)
-0.190* (-1.86)
BA 0.0187 (0.48)
0.0185 (0.29)
0.0469 (0.61)
0.0929 (0.68)
MA 0.00281 (0.07)
-0.00904 (-0.14)
0.0675 (0.91)
0.219* (1.65)
First Division -0.0205 (-0.50)
-0.0582 (-0.88)
0.00542 (0.07)
0.0864 (0.67)
Contract teacher 0.140*** (2.80)
0.208** (2.57)
0.0372 (0.36)
0.243 (1.31)
Pupils 2053 2053 2053 2053 N 3942 3942 3942 3942 No. of schools or pupils 62 62 2053 2053 R2 0.678 0.0309 0.216 0.0116 Notes: Model also includes dummies for missing observations in parental education, private tuition and child health. Constant included but not shown. t statistics in parentheses.* p < 0.1, ** p < 0.05, *** p < 0.01
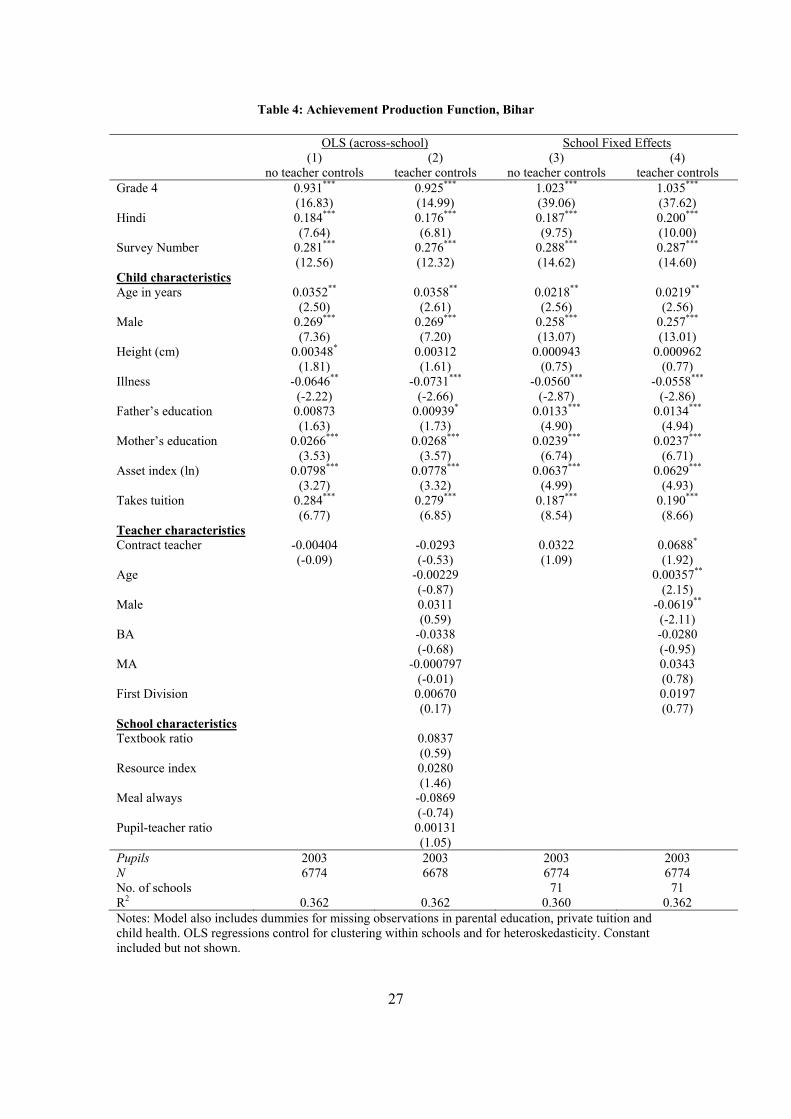
27
Table 4: Achievement Production Function, Bihar
OLS (across-school) School Fixed Effects (1) (2) (3) (4) no teacher controls teacher controls no teacher controls teacher controls Grade 4 0.931***
(16.83) 0.925*** (14.99)
1.023*** (39.06)
1.035*** (37.62)
Hindi 0.184*** (7.64)
0.176*** (6.81)
0.187*** (9.75)
0.200*** (10.00)
Survey Number 0.281*** (12.56)
0.276*** (12.32)
0.288*** (14.62)
0.287*** (14.60)
Child characteristics Age in years 0.0352**
(2.50) 0.0358** (2.61)
0.0218** (2.56)
0.0219** (2.56)
Male 0.269*** (7.36)
0.269*** (7.20)
0.258*** (13.07)
0.257*** (13.01)
Height (cm) 0.00348* (1.81)
0.00312 (1.61)
0.000943 (0.75)
0.000962 (0.77)
Illness -0.0646** (-2.22)
-0.0731*** (-2.66)
-0.0560*** (-2.87)
-0.0558*** (-2.86)
Father’s education 0.00873 (1.63)
0.00939* (1.73)
0.0133*** (4.90)
0.0134*** (4.94)
Mother’s education 0.0266*** (3.53)
0.0268*** (3.57)
0.0239*** (6.74)
0.0237*** (6.71)
Asset index (ln) 0.0798*** (3.27)
0.0778*** (3.32)
0.0637*** (4.99)
0.0629*** (4.93)
Takes tuition 0.284*** (6.77)
0.279*** (6.85)
0.187*** (8.54)
0.190*** (8.66)
Teacher characteristics Contract teacher -0.00404
(-0.09) -0.0293 (-0.53)
0.0322 (1.09)
0.0688* (1.92)
Age
-0.00229 (-0.87)
0.00357** (2.15)
Male
0.0311 (0.59)
-0.0619** (-2.11)
BA
-0.0338 (-0.68)
-0.0280 (-0.95)
MA
-0.000797 (-0.01)
0.0343 (0.78)
First Division
0.00670 (0.17)
0.0197 (0.77)
School characteristics Textbook ratio
0.0837 (0.59)
Resource index
0.0280 (1.46)
Meal always
-0.0869 (-0.74)
Pupil-teacher ratio
0.00131 (1.05)
Pupils 2003 2003 2003 2003 N 6774 6678 6774 6774 No. of schools 71 71 R2 0.362 0.362 0.360 0.362 Notes: Model also includes dummies for missing observations in parental education, private tuition and child health. OLS regressions control for clustering within schools and for heteroskedasticity. Constant included but not shown.
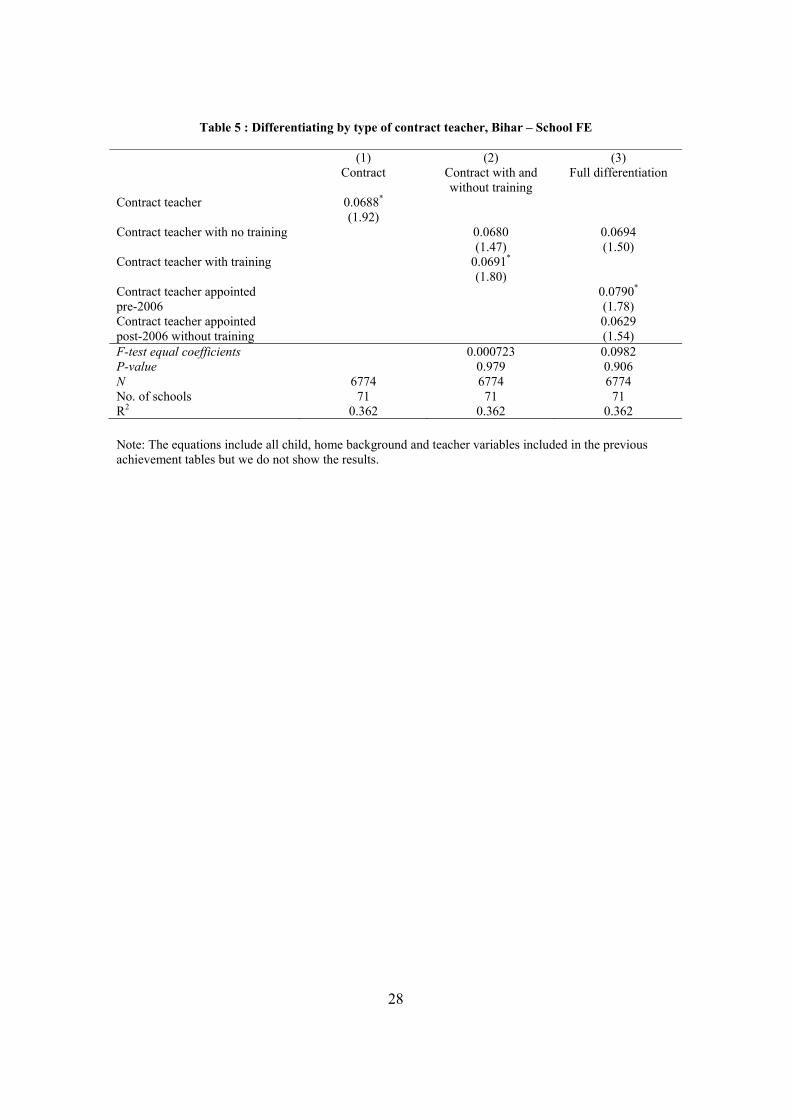
28
Table 5 : Differentiating by type of contract teacher, Bihar – School FE
(1) (2) (3) Contract Contract with and
without training Full differentiation
Contract teacher 0.0688* (1.92)
Contract teacher with no training
0.0680 (1.47)
0.0694 (1.50)
Contract teacher with training
0.0691* (1.80)
Contract teacher appointed pre-2006
0.0790* (1.78)
Contract teacher appointed post-2006 without training
0.0629 (1.54)
F-test equal coefficients 0.000723 0.0982 P-value 0.979 0.906 N 6774 6774 6774 No. of schools 71 71 71 R2 0.362 0.362 0.362
Note: The equations include all child, home background and teacher variables included in the previous achievement tables but we do not show the results.
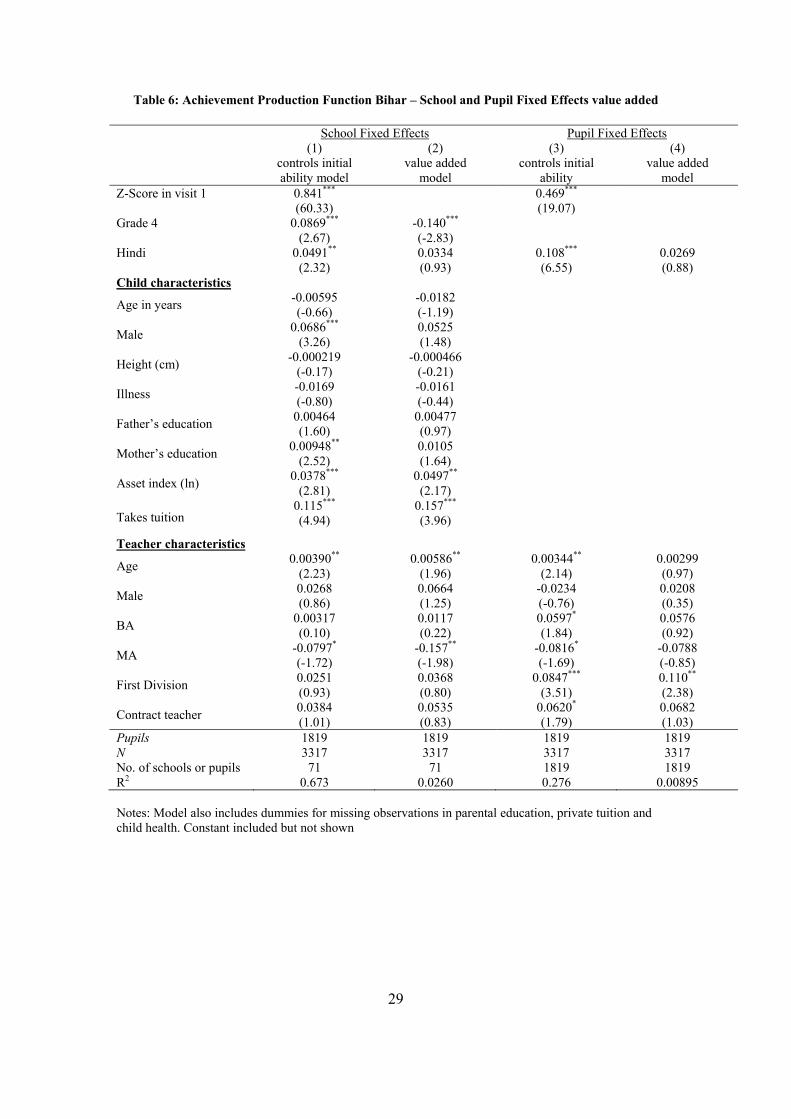
29
Table 6: Achievement Production Function Bihar – School and Pupil Fixed Effects value added
School Fixed Effects Pupil Fixed Effects (1) (2) (3) (4) controls initial
ability model value added
model controls initial
ability value added
model Z-Score in visit 1 0.841***
(60.33)
0.469*** (19.07)
Grade 4 0.0869*** (2.67)
-0.140*** (-2.83)
Hindi 0.0491** (2.32)
0.0334 (0.93)
0.108*** (6.55)
0.0269 (0.88)
Child characteristics
Age in years -0.00595 (-0.66)
-0.0182 (-1.19)
Male 0.0686***
(3.26) 0.0525 (1.48)
Height (cm) -0.000219
(-0.17) -0.000466
(-0.21)
Illness -0.0169 (-0.80)
-0.0161 (-0.44)
Father’s education 0.00464 (1.60)
0.00477 (0.97)
Mother’s education 0.00948**
(2.52) 0.0105 (1.64)
Asset index (ln) 0.0378***
(2.81) 0.0497** (2.17)
Takes tuition 0.115*** (4.94)
0.157*** (3.96)
Teacher characteristics
Age 0.00390**
(2.23) 0.00586**
(1.96) 0.00344**
(2.14) 0.00299 (0.97)
Male 0.0268 (0.86)
0.0664 (1.25)
-0.0234 (-0.76)
0.0208 (0.35)
BA 0.00317 (0.10)
0.0117 (0.22)
0.0597* (1.84)
0.0576 (0.92)
MA -0.0797* (-1.72)
-0.157** (-1.98)
-0.0816* (-1.69)
-0.0788 (-0.85)
First Division 0.0251 (0.93)
0.0368 (0.80)
0.0847*** (3.51)
0.110** (2.38)
Contract teacher 0.0384 (1.01)
0.0535 (0.83)
0.0620* (1.79)
0.0682 (1.03)
Pupils 1819 1819 1819 1819 N 3317 3317 3317 3317 No. of schools or pupils 71 71 1819 1819 R2 0.673 0.0260 0.276 0.00895 Notes: Model also includes dummies for missing observations in parental education, private tuition and child health. Constant included but not shown
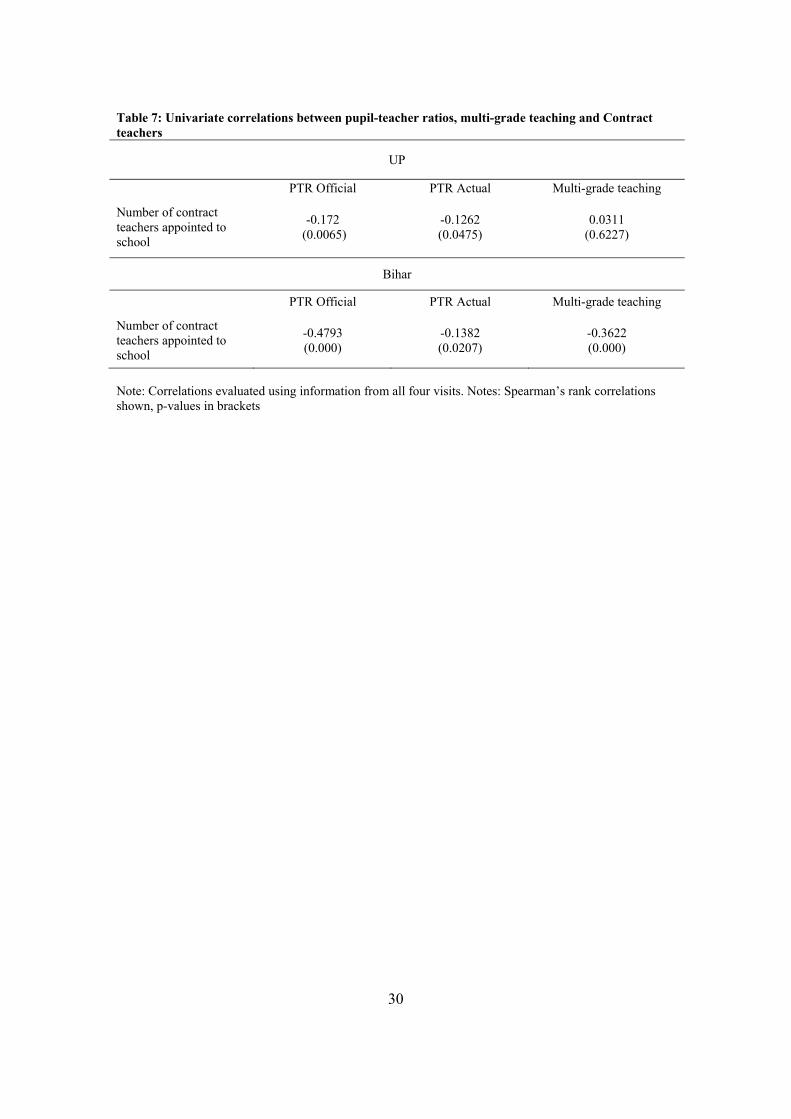
30
Table 7: Univariate correlations between pupil-teacher ratios, multi-grade teaching and Contract teachers
UP
PTR Official PTR Actual Multi-grade teaching
Number of contract teachers appointed to school
-0.172 (0.0065)
-0.1262 (0.0475)
0.0311 (0.6227)
Bihar
PTR Official PTR Actual Multi-grade teaching
Number of contract teachers appointed to school
-0.4793 (0.000)
-0.1382 (0.0207)
-0.3622 (0.000)
Note: Correlations evaluated using information from all four visits. Notes: Spearman’s rank correlations shown, p-values in brackets
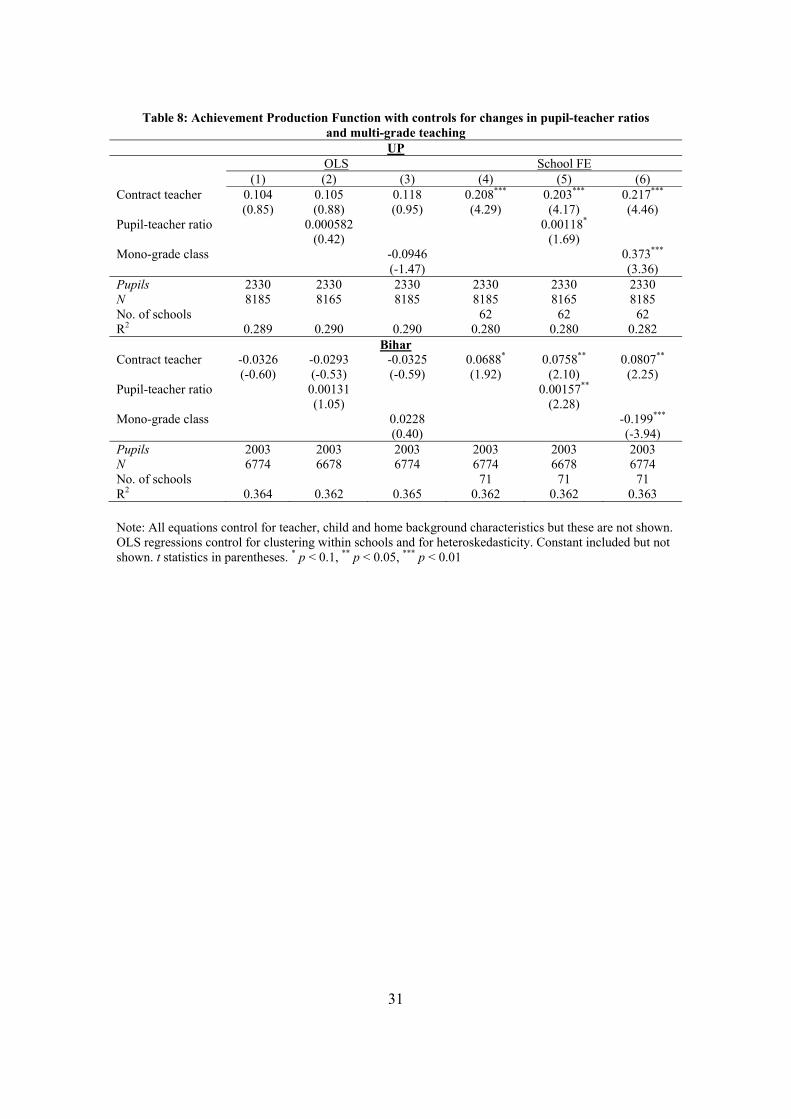
31
Table 8: Achievement Production Function with controls for changes in pupil-teacher ratios and multi-grade teaching
UP OLS School FE (1) (2) (3) (4) (5) (6) Contract teacher 0.104
(0.85) 0.105 (0.88)
0.118 (0.95)
0.208*** (4.29)
0.203*** (4.17)
0.217*** (4.46)
Pupil-teacher ratio
0.000582 (0.42)
0.00118* (1.69)
Mono-grade class
-0.0946 (-1.47)
0.373*** (3.36)
Pupils 2330 2330 2330 2330 2330 2330 N 8185 8165 8185 8185 8165 8185 No. of schools 62 62 62 R2 0.289 0.290 0.290 0.280 0.280 0.282
Bihar Contract teacher -0.0326
(-0.60) -0.0293 (-0.53)
-0.0325 (-0.59)
0.0688* (1.92)
0.0758** (2.10)
0.0807** (2.25)
Pupil-teacher ratio
0.00131 (1.05)
0.00157** (2.28)
Mono-grade class
0.0228 (0.40)
-0.199*** (-3.94)
Pupils 2003 2003 2003 2003 2003 2003 N 6774 6678 6774 6774 6678 6774 No. of schools 71 71 71 R2 0.364 0.362 0.365 0.362 0.362 0.363
Note: All equations control for teacher, child and home background characteristics but these are not shown. OLS regressions control for clustering within schools and for heteroskedasticity. Constant included but not shown. t statistics in parentheses. * p < 0.1, ** p < 0.05, *** p < 0.01
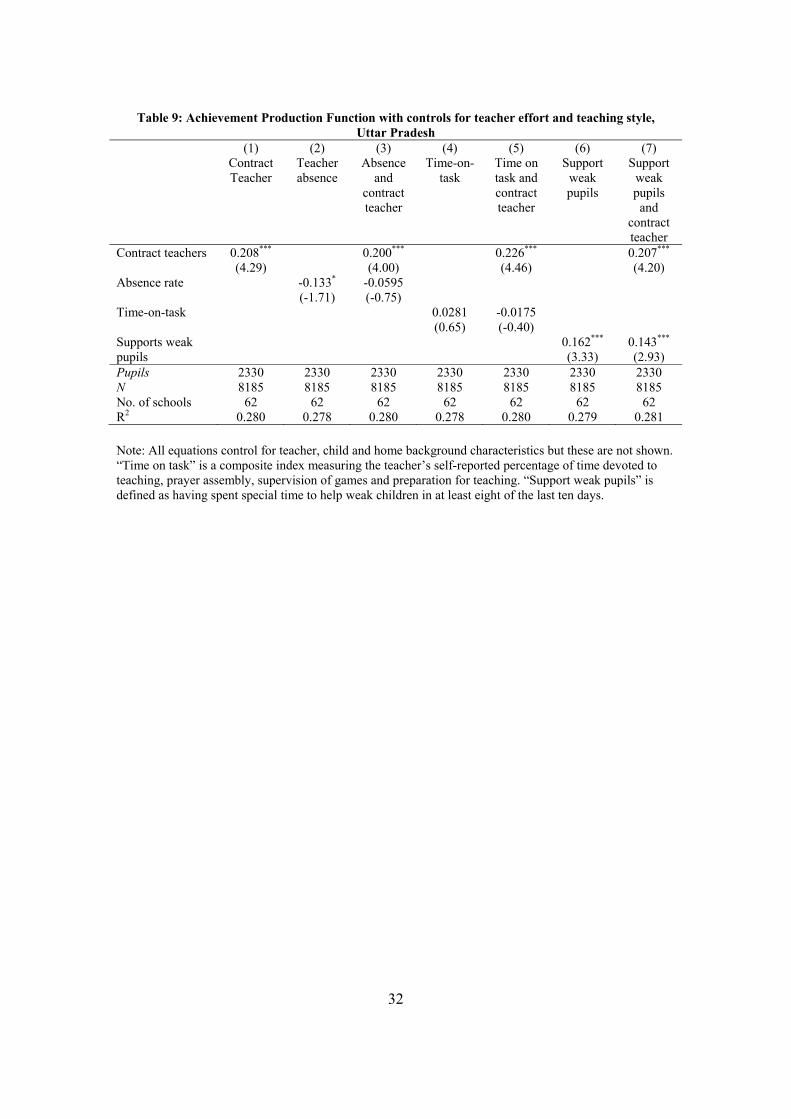
32
Table 9: Achievement Production Function with controls for teacher effort and teaching style, Uttar Pradesh
(1) (2) (3) (4) (5) (6) (7) Contract
Teacher Teacher absence
Absence and
contract teacher
Time-on-task
Time on task and contract teacher
Support weak pupils
Support weak pupils and
contract teacher
Contract teachers 0.208*** (4.29)
0.200*** (4.00)
0.226*** (4.46)
0.207*** (4.20)
Absence rate
-0.133* (-1.71)
-0.0595 (-0.75)
Time-on-task
0.0281 (0.65)
-0.0175 (-0.40)
Supports weak pupils
0.162*** (3.33)
0.143*** (2.93)
Pupils 2330 2330 2330 2330 2330 2330 2330 N 8185 8185 8185 8185 8185 8185 8185 No. of schools 62 62 62 62 62 62 62 R2 0.280 0.278 0.280 0.278 0.280 0.279 0.281
Note: All equations control for teacher, child and home background characteristics but these are not shown. “Time on task” is a composite index measuring the teacher’s self-reported percentage of time devoted to teaching, prayer assembly, supervision of games and preparation for teaching. “Support weak pupils” is defined as having spent special time to help weak children in at least eight of the last ten days.
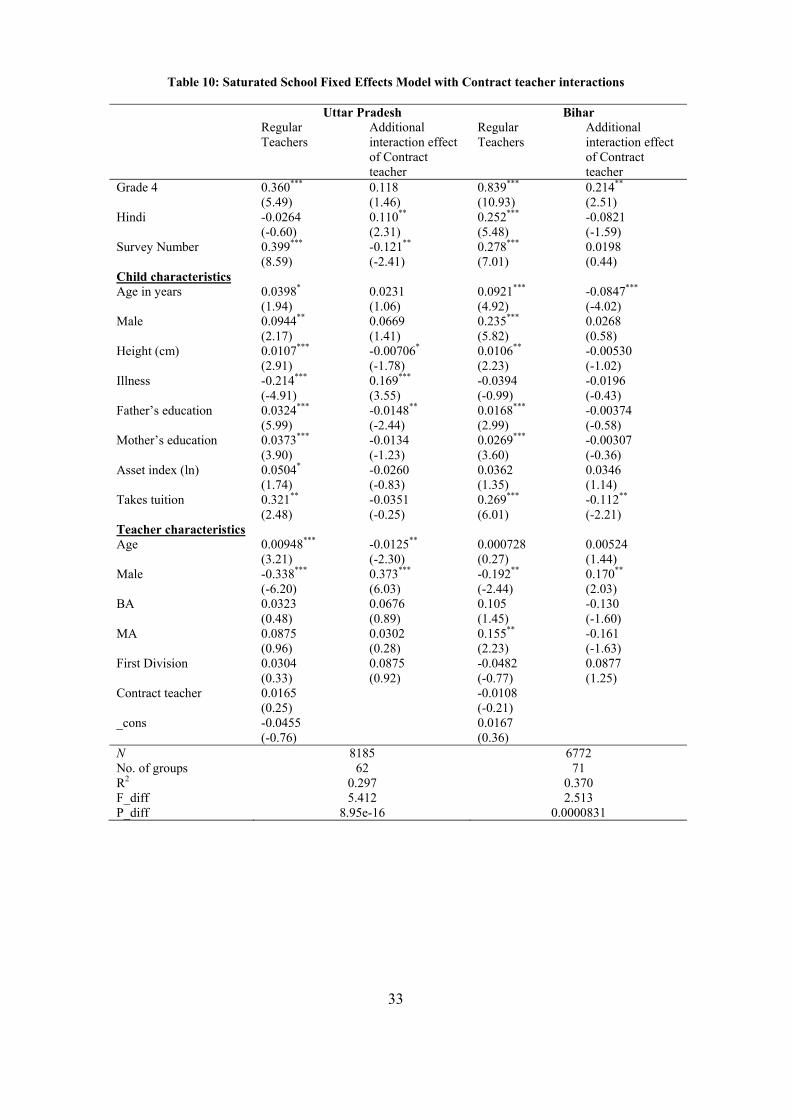
33
Table 10: Saturated School Fixed Effects Model with Contract teacher interactions Uttar Pradesh Bihar Regular
Teachers Additional interaction effect of Contract teacher
Regular Teachers
Additional interaction effect of Contract teacher
Grade 4 0.360*** (5.49)
0.118 (1.46)
0.839*** (10.93)
0.214** (2.51)
Hindi -0.0264 (-0.60)
0.110** (2.31)
0.252*** (5.48)
-0.0821 (-1.59)
Survey Number 0.399*** (8.59)
-0.121** (-2.41)
0.278*** (7.01)
0.0198 (0.44)
Child characteristics Age in years 0.0398*
(1.94) 0.0231 (1.06)
0.0921*** (4.92)
-0.0847*** (-4.02)
Male 0.0944** (2.17)
0.0669 (1.41)
0.235*** (5.82)
0.0268 (0.58)
Height (cm) 0.0107*** (2.91)
-0.00706* (-1.78)
0.0106** (2.23)
-0.00530 (-1.02)
Illness -0.214*** (-4.91)
0.169*** (3.55)
-0.0394 (-0.99)
-0.0196 (-0.43)
Father’s education 0.0324*** (5.99)
-0.0148** (-2.44)
0.0168*** (2.99)
-0.00374 (-0.58)
Mother’s education 0.0373*** (3.90)
-0.0134 (-1.23)
0.0269*** (3.60)
-0.00307 (-0.36)
Asset index (ln) 0.0504* (1.74)
-0.0260 (-0.83)
0.0362 (1.35)
0.0346 (1.14)
Takes tuition 0.321** (2.48)
-0.0351 (-0.25)
0.269*** (6.01)
-0.112** (-2.21)
Teacher characteristics Age 0.00948***
(3.21) -0.0125** (-2.30)
0.000728 (0.27)
0.00524 (1.44)
Male -0.338*** (-6.20)
0.373*** (6.03)
-0.192** (-2.44)
0.170** (2.03)
BA 0.0323 (0.48)
0.0676 (0.89)
0.105 (1.45)
-0.130 (-1.60)
MA 0.0875 (0.96)
0.0302 (0.28)
0.155** (2.23)
-0.161 (-1.63)
First Division 0.0304 (0.33)
0.0875 (0.92)
-0.0482 (-0.77)
0.0877 (1.25)
Contract teacher 0.0165 (0.25)
-0.0108 (-0.21)
_cons -0.0455 (-0.76)
0.0167 (0.36)
N 8185 6772 No. of groups 62 71 R2 0.297 0.370 F_diff 5.412 2.513 P_diff 8.95e-16 0.0000831
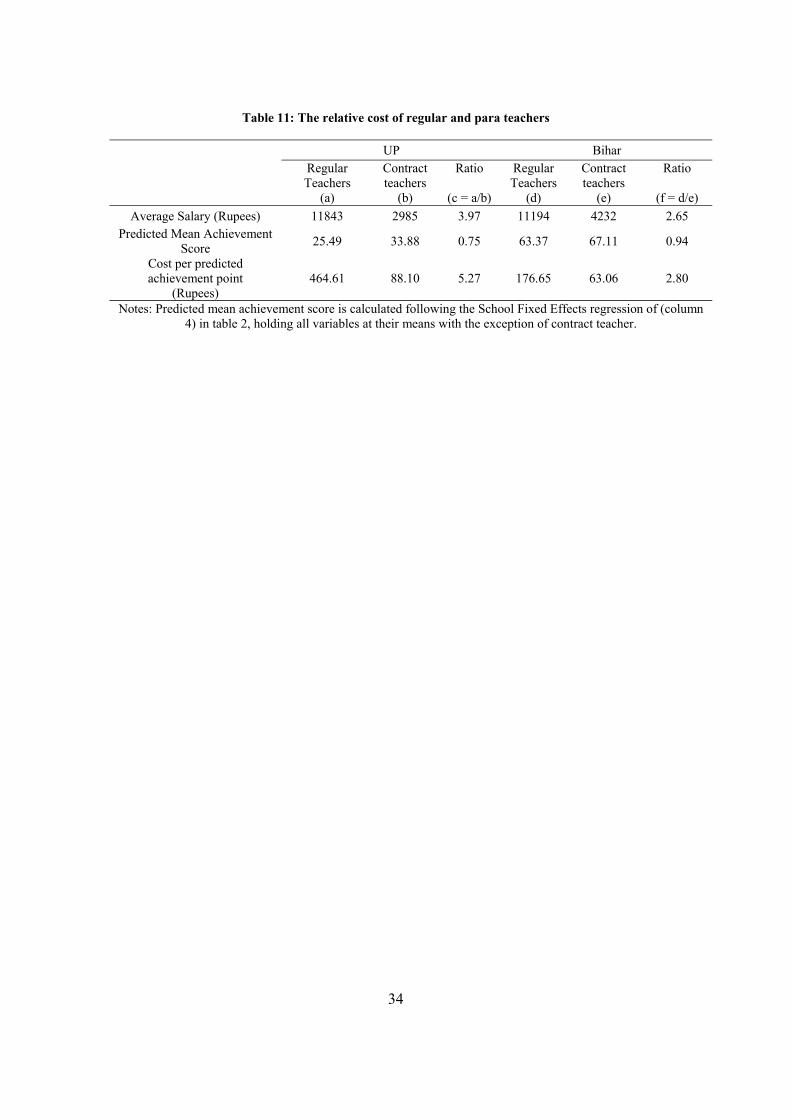
34
Table 11: The relative cost of regular and para teachers
UP Bihar
Regular Teachers
(a)
Contract teachers
(b)
Ratio
(c = a/b)
Regular Teachers
(d)
Contract teachers
(e)
Ratio
(f = d/e)
Average Salary (Rupees) 11843 2985 3.97 11194 4232 2.65 Predicted Mean Achievement
Score 25.49 33.88 0.75 63.37 67.11 0.94
Cost per predicted achievement point
(Rupees) 464.61 88.10 5.27 176.65 63.06 2.80
Notes: Predicted mean achievement score is calculated following the School Fixed Effects regression of (column 4) in table 2, holding all variables at their means with the exception of contract teacher.
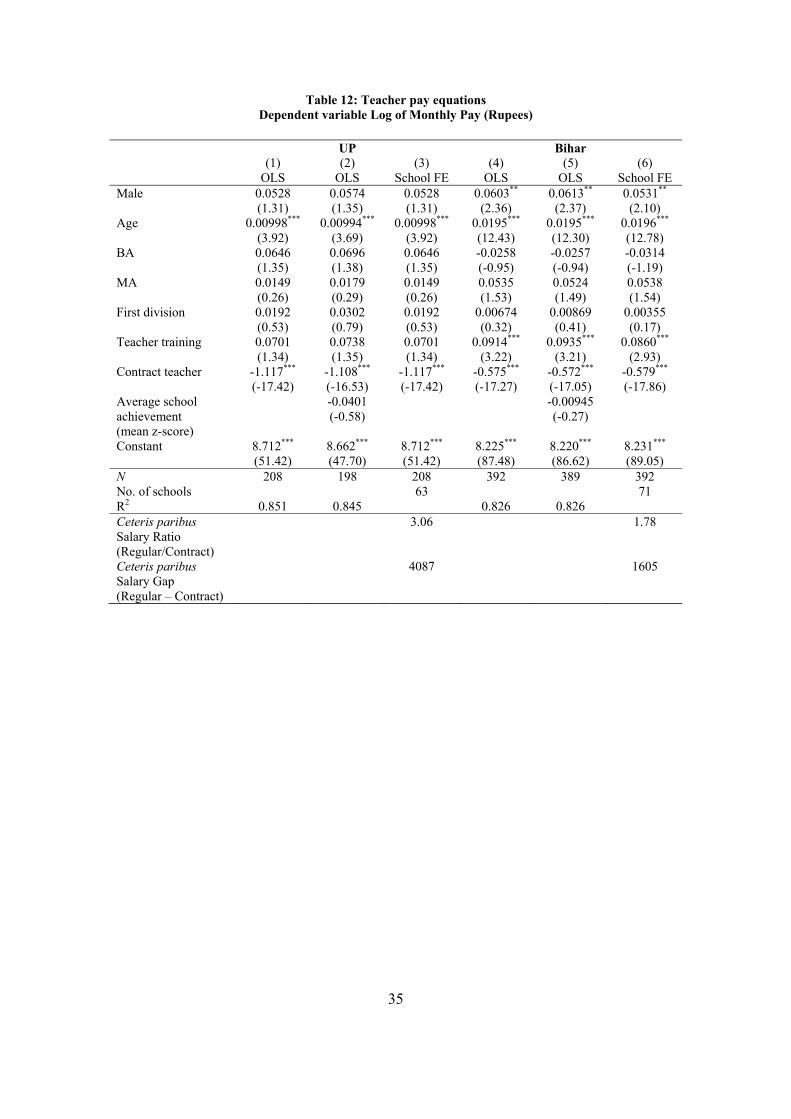
35
Table 12: Teacher pay equations
Dependent variable Log of Monthly Pay (Rupees)
UP Bihar (1) (2) (3) (4) (5) (6) OLS OLS School FE OLS OLS School FE Male 0.0528
(1.31) 0.0574 (1.35)
0.0528 (1.31)
0.0603** (2.36)
0.0613** (2.37)
0.0531** (2.10)
Age 0.00998*** (3.92)
0.00994***
(3.69) 0.00998***
(3.92) 0.0195*** (12.43)
0.0195*** (12.30)
0.0196*** (12.78)
BA 0.0646 (1.35)
0.0696 (1.38)
0.0646 (1.35)
-0.0258 (-0.95)
-0.0257 (-0.94)
-0.0314 (-1.19)
MA 0.0149 (0.26)
0.0179 (0.29)
0.0149 (0.26)
0.0535 (1.53)
0.0524 (1.49)
0.0538 (1.54)
First division 0.0192 (0.53)
0.0302 (0.79)
0.0192 (0.53)
0.00674 (0.32)
0.00869 (0.41)
0.00355 (0.17)
Teacher training 0.0701 (1.34)
0.0738 (1.35)
0.0701 (1.34)
0.0914*** (3.22)
0.0935*** (3.21)
0.0860*** (2.93)
Contract teacher -1.117*** (-17.42)
-1.108*** (-16.53)
-1.117*** (-17.42)
-0.575*** (-17.27)
-0.572*** (-17.05)
-0.579*** (-17.86)
Average school achievement (mean z-score)
-0.0401 (-0.58)
-0.00945 (-0.27)
Constant 8.712*** (51.42)
8.662*** (47.70)
8.712*** (51.42)
8.225*** (87.48)
8.220*** (86.62)
8.231*** (89.05)
N 208 198 208 392 389 392 No. of schools 63 71 R2 0.851 0.845 0.826 0.826 Ceteris paribus Salary Ratio (Regular/Contract)
3.06 1.78
Ceteris paribus Salary Gap (Regular – Contract)
4087 1605
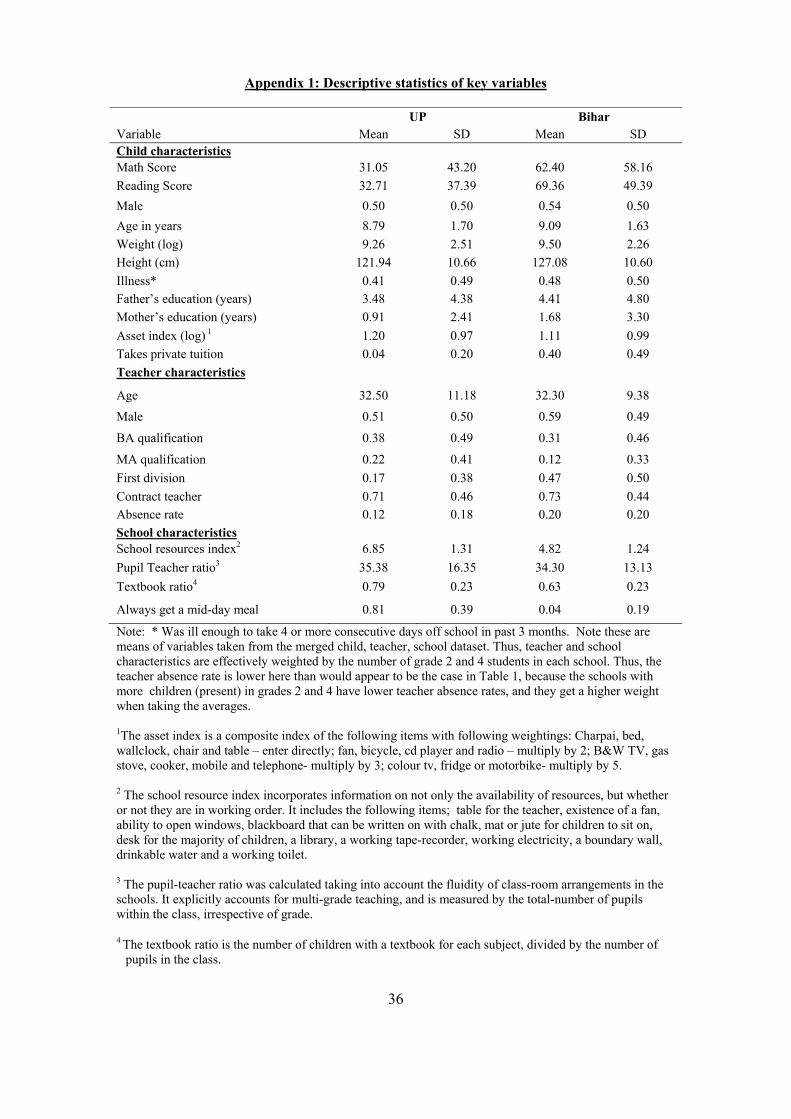
36
Appendix 1: Descriptive statistics of key variables
UP Bihar Variable Mean SD Mean SD Child characteristics Math Score 31.05 43.20 62.40 58.16
Reading Score 32.71 37.39 69.36 49.39
Male 0.50 0.50 0.54 0.50
Age in years 8.79 1.70 9.09 1.63
Weight (log) 9.26 2.51 9.50 2.26
Height (cm) 121.94 10.66 127.08 10.60
Illness* 0.41 0.49 0.48 0.50
Father’s education (years) 3.48 4.38 4.41 4.80
Mother’s education (years) 0.91 2.41 1.68 3.30
Asset index (log) 1 1.20 0.97 1.11 0.99
Takes private tuition 0.04 0.20 0.40 0.49
Teacher characteristics
Age 32.50 11.18 32.30 9.38
Male 0.51 0.50 0.59 0.49
BA qualification 0.38 0.49 0.31 0.46
MA qualification 0.22 0.41 0.12 0.33
First division 0.17 0.38 0.47 0.50
Contract teacher 0.71 0.46 0.73 0.44
Absence rate 0.12 0.18 0.20 0.20
School characteristics School resources index2 6.85 1.31 4.82 1.24
Pupil Teacher ratio3 35.38 16.35 34.30 13.13
Textbook ratio4 0.79 0.23 0.63 0.23
Always get a mid-day meal 0.81 0.39 0.04 0.19
Note: * Was ill enough to take 4 or more consecutive days off school in past 3 months. Note these are means of variables taken from the merged child, teacher, school dataset. Thus, teacher and school characteristics are effectively weighted by the number of grade 2 and 4 students in each school. Thus, the teacher absence rate is lower here than would appear to be the case in Table 1, because the schools with more children (present) in grades 2 and 4 have lower teacher absence rates, and they get a higher weight when taking the averages. 1The asset index is a composite index of the following items with following weightings: Charpai, bed, wallclock, chair and table – enter directly; fan, bicycle, cd player and radio – multiply by 2; B&W TV, gas stove, cooker, mobile and telephone- multiply by 3; colour tv, fridge or motorbike- multiply by 5.
2 The school resource index incorporates information on not only the availability of resources, but whether or not they are in working order. It includes the following items; table for the teacher, existence of a fan, ability to open windows, blackboard that can be written on with chalk, mat or jute for children to sit on, desk for the majority of children, a library, a working tape-recorder, working electricity, a boundary wall, drinkable water and a working toilet. 3 The pupil-teacher ratio was calculated taking into account the fluidity of class-room arrangements in the schools. It explicitly accounts for multi-grade teaching, and is measured by the total-number of pupils within the class, irrespective of grade.
4 The textbook ratio is the number of children with a textbook for each subject, divided by the number of pupils in the class.

37
Appendix 2
Saturated Model
For the saturated model we adapt Derecho and Glewwe (2002). We take a production
function of the form,
Tijs = hs(SCj, TCk, FCi) + ijs (1)
Where Tijks denotes the test score of child i, in school j, with teacher k in subject s;
And SCj denotes the vector of school characteristics;
And TCk denotes the vector of teacher characteristics;
And FCi denotes the vector of child and household characteristics.
ijks is defined to incorporate random noise that is uncorrelated with SC, TC and FC.
and estimate a linear approximation of (1) using a Taylor Approximation;
Tijk = 0 + 1SCj + 2TCk +3FCi + 4SCjTCk + 5SCjFCi+6TCkFCi + 7SCjTCkFCi
+ ijk (2)
Where SCjTCk denotes the interaction between school and teacher characteristics and so
on and so forth.
We wish to know the effect on test scores of being taught by a contract teacher as
opposed to a regular teacher. Defining a typical contract teacher as a weighted average of
all the characteristics of contract teachers, where the weights are the proportion of
children taught by that teacher:
pTC = Pj
wjpTCk (3)
here P is the set of all contract teachers and wjp is the fraction of total children taught by
contract teachers. Similarly the vector of characteristics for the typical regular teacher can
be defined as:
rTC =Rj
wjrTCk (4)
Inserting (3) into (2) we can derive the expected test score of child i if he/she is taught by a
contract teacher
38
E[Ti| TCk, contract teacher] = 0 + 1SCj + 2 pTC +3FCi + 4SCj pTC + 5SCjFCi+6 pTC FCi
+7SCj pTC FCi (5)
And inserting (4) into (2) we can derive the expected test score of child i if he/she is
taught by a regular teacher.
E[Ti| TCk, regular-teacher] = 0 + 1SCj + 2 rTC +3FCi + 4SCj rTC +
5SCjFCi+6 rTC FCi +7SCj rTC FCi (6)
If we then normalize all SC, TC and FC variables to have means equal to zero, then we
are left with
0 + 2 pTC = expected test score of average child with average contract teacher in average school
0 + 2 rTC = expected test score of average child with average regular teacher in average school
We are interested in the expected change in test scores by switching from having a
regular teacher to a contract teacher. That is
2 (TCp – TCr) (7)
Which we can estimate through regression analysis using a conventional dummy variable,
Dc = 1 if a child is taught by a contract teacher, and Dc = 0 if the child is taught by a regular
teacher. If children are assigned to contract teachers randomly, then we can simply estimate
an OLS regression with this dummy variable and we would have an estimate of the
contract teacher effect. Unfortunately we know that this isn’t the case, and that contract
teachers are non-randomly assigned to schools. We can overcome this problem by
estimating the model using school-fixed effects, whereby identification of Dc comes from
within-school variation in teacher types – that is variations in test scores within a school
dependent on teacher type. This reduces our model to
Tik = 0 + 1TCk + 2FCi + 3TCkFCi + ij (8)
Which we can estimate using the dummy variable Dc in the following equation
Tij = (0 + 1 rTC ) + 1( pTC - rTC )Dc + (2 + 3 rTC )FCi + 3( pTC - rTC )DcFCi+ ij
(9)
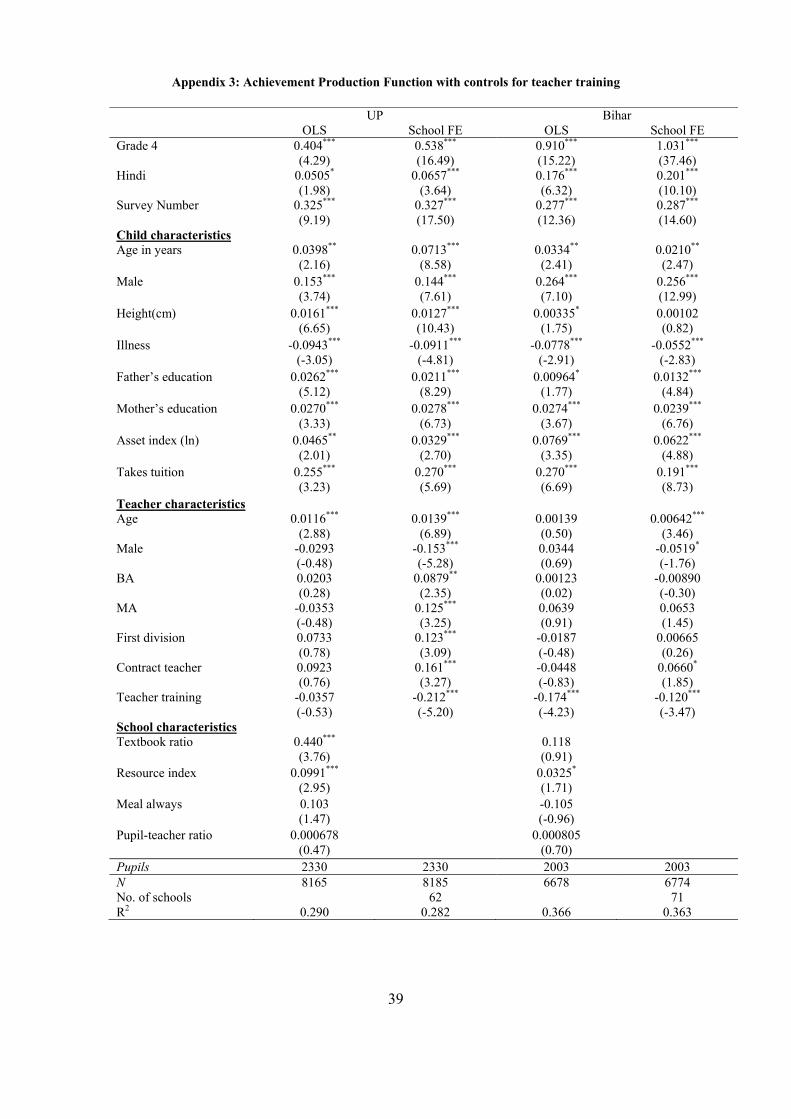
39
Appendix 3: Achievement Production Function with controls for teacher training
UP Bihar OLS School FE OLS School FE Grade 4 0.404***
(4.29) 0.538*** (16.49)
0.910*** (15.22)
1.031*** (37.46)
Hindi 0.0505* (1.98)
0.0657*** (3.64)
0.176*** (6.32)
0.201*** (10.10)
Survey Number 0.325*** (9.19)
0.327*** (17.50)
0.277*** (12.36)
0.287*** (14.60)
Child characteristics Age in years 0.0398**
(2.16) 0.0713***
(8.58) 0.0334** (2.41)
0.0210** (2.47)
Male 0.153*** (3.74)
0.144*** (7.61)
0.264*** (7.10)
0.256*** (12.99)
Height(cm) 0.0161*** (6.65)
0.0127*** (10.43)
0.00335* (1.75)
0.00102 (0.82)
Illness -0.0943*** (-3.05)
-0.0911*** (-4.81)
-0.0778*** (-2.91)
-0.0552*** (-2.83)
Father’s education 0.0262*** (5.12)
0.0211*** (8.29)
0.00964* (1.77)
0.0132*** (4.84)
Mother’s education 0.0270*** (3.33)
0.0278*** (6.73)
0.0274*** (3.67)
0.0239*** (6.76)
Asset index (ln) 0.0465** (2.01)
0.0329*** (2.70)
0.0769*** (3.35)
0.0622*** (4.88)
Takes tuition 0.255*** (3.23)
0.270*** (5.69)
0.270*** (6.69)
0.191*** (8.73)
Teacher characteristics Age 0.0116***
(2.88) 0.0139***
(6.89) 0.00139 (0.50)
0.00642*** (3.46)
Male -0.0293 (-0.48)
-0.153*** (-5.28)
0.0344 (0.69)
-0.0519* (-1.76)
BA 0.0203 (0.28)
0.0879** (2.35)
0.00123 (0.02)
-0.00890 (-0.30)
MA -0.0353 (-0.48)
0.125*** (3.25)
0.0639 (0.91)
0.0653 (1.45)
First division 0.0733 (0.78)
0.123*** (3.09)
-0.0187 (-0.48)
0.00665 (0.26)
Contract teacher 0.0923 (0.76)
0.161*** (3.27)
-0.0448 (-0.83)
0.0660* (1.85)
Teacher training -0.0357 (-0.53)
-0.212*** (-5.20)
-0.174*** (-4.23)
-0.120*** (-3.47)
School characteristics Textbook ratio 0.440***
(3.76)
0.118 (0.91)
Resource index 0.0991*** (2.95)
0.0325* (1.71)
Meal always 0.103 (1.47)
-0.105 (-0.96)
Pupil-teacher ratio 0.000678 (0.47)
0.000805 (0.70)
Pupils 2330 2330 2003 2003 N 8165 8185 6678 6774 No. of schools 62 71 R2 0.290 0.282 0.366 0.363