
the Relationship between sovereign CDS and Stock Indexes. Mara Coronado Vaca M Teresa
22
1 A Case for Europe: the Relationship between sovereign CDS and Stock Indexes. María Coronado Vaca M Teresa Corzo Santamaría 1 Laura Lazcano Benito Abstract Year 2010 have witnessed a major European Sovereign Debt crisis. By examining the links between sovereign CDS and stock indexes during the period 2007-2010, for eight European countries, this paper aims to study the lead-lag relationships of the two markets using a Vector Autoregressive model and a Panel data model. We find a major leading role of the stock market during the sample period, but when year 2010 is isolated we find a change in this relationship and a key role of the CDS markets incorporating new information. This increasing role of the sovereign CDS is stronger for countries with high risk spread. Keywords: sovereign credit risk, sovereign credit derivatives, stock markets, lead-lag relationships. JEL classification: G15, G14, G20 EFM codes: 330, 350, 440, 630 1 Corresponding author and address: M Teresa Corzo Santamaría. Universidad Pontificia Comillas. ICAI‐ ICADE. c/Alberto Aguilera 23, 28015 Madrid, email address: [email protected]. We are particularly grateful to an anonymous referee for helpful comments. In addition, we thank Ricardo Gimeno, Tomás Curto and other participants at the Icade research seminar for suggestions; of course all mistakes are only ours.
Transcript of the Relationship between sovereign CDS and Stock Indexes. Mara Coronado Vaca M Teresa

1
A Case for Europe: the Relationship between sovereign CDS and Stock Indexes.
María Coronado Vaca
M Teresa Corzo Santamaría1
Laura Lazcano Benito
Abstract
Year 2010 have witnessed a major European Sovereign Debt crisis. By examining the links between sovereign CDS and stock indexes during the period 2007-2010, for eight European countries, this paper aims to study the lead-lag relationships of the two markets using a Vector Autoregressive model and a Panel data model. We find a major leading role of the stock market during the sample period, but when year 2010 is isolated we find a change in this relationship and a key role of the CDS markets incorporating new information. This increasing role of the sovereign CDS is stronger for countries with high risk spread.
Keywords: sovereign credit risk, sovereign credit derivatives, stock markets, lead-lag relationships.
JEL classification: G15, G14, G20
EFM codes: 330, 350, 440, 630
1 Corresponding author and address: M Teresa Corzo Santamaría. Universidad Pontificia Comillas. ICAI‐ICADE. c/Alberto Aguilera 23, 28015 Madrid, email address: [email protected]. We are particularly grateful to an anonymous referee for helpful comments. In addition, we thank Ricardo Gimeno, Tomás Curto and other participants at the Icade research seminar for suggestions; of course all mistakes are only ours.

2
1. Introduction
Year 2010 will be known as the year of the European sovereign debt crisis. Since the
beginning of the year the sovereign CDS spreads have widened in Western Europe, and
by late 2010 we could find countries (like Spain) with CDS premiums higher that some
countries in emerging Europe.
During year 2010, as the eurozone’s economies became under pressure due to the
increasing doubts that some European countries could pull off big reductions in their
budget deficits, in the face of stagnating economies, without defaulting or being rescued,
the spread of sovereign CDS reached maximum levels. At the same time we assisted to
severe falls in the affected countries’ stock markets.
Credit Default Swaps are credit protection contracts whereby one party agrees, in
exchange for a periodic premium, to make a contingent payment in the case of a defined
credit event. For buyers of credit protection, the CDS market offers the opportunity to
reduce credit concentration and regulatory capital while maintaining customer
relationships. For sellers of protection, it offers the opportunity to take credit exposure
over a customized term and earn income without having to fund the position.
Sovereign Credit Default Swaps pay the buyer the face value in exchange for the
underlying securities or the cash equivalent should a sovereign nation default on its debt
payments. Quoted in basis points per year, a CDS price indicates the cost per year to
either buy or sell exposure to the possibility of a sovereign defaulting or restructuring.
The main difference between a sovereign CDS and a corporate CDS is the definition of
what constitutes a Credit Event. For a corporate, a credit event is either a bankruptcy, a
failure to pay, and sometimes, a restructuring. For Western European sovereigns,
bankruptcy is replaced with a moratorium/repudiation.
Following ISDA2 we can say that it´s important to understand that sovereign CDS are
useful for controlling risk for investors and lenders. Sovereign CDS provide effective
hedges not only for holders of the government bonds but also for international banks
that extend credit to that particular country corporations and banks, for investors in
stocks and for entities that have significant real state or corporate holdings in the
2 International Swaps and Derivatives Association, News Release, March 15, 2010.

3
country. For many of these participants, the sovereign CDS market is the most effective
way of hedging credit risk in the country.
From these words, we can understand that there is a broad set of investors using
sovereign CDS. After the 2010 sovereign´s financial storm, ISDA reports that “recent
anecdotal evidence indicates that banks with significant credit exposure to entities in
Greece have been active purchasers of Greek Sovereign CDS protection”.
As the same time that the debt crisis has had an impact in the stock exchanges is out of
doubt. If countries like Greece, Ireland, Portugal or Spain should devote increasing parts
of their revenues towards external debts, governments will have little amounts of money
for investments and development. This is no good for companies and for the future of
the countries. Besides citizens and companies will become (and are already becoming)
hard-pressed with taxes in order to pay foreign creditors. The amounts of money
remaining for consumption and investments will drop leading to declining benefits. The
credit risk problem becomes also a market risk problem. We thus enter in a vicious
circle that becomes increasingly difficult to break.
In this article we study the lead-lag relationship between sovereign CDS and stock
markets for eight European countries during the period 2007-2010. The countries are
Greece, Italy, Spain, Portugal Ireland, UK, France and Germany. This is the first paper
that looks at such relationship between the two markets representing credit risk and
market risk for a country.
Using country specific and panel data we find clear interdependency of these two
markets, the stock market generally leading the movement of the CDS markets. We also
find that the two way interaction between the stock and CDS markets is stronger when
the stock market is in a downturn or when the credit market is in turmoil, in this case the
governments’ credit market. During the year 2010 and using daily data, we find that
CDS markets lead stock markets, reversing the general tendency. The sovereign CDS
markets has had an impact on stocks, translating the government’s debt crisis to the
country’ companies.
Besides we study the differences between riskier countries (high CDS premium) and
other central European countries (France and Germany). We find that the lead of the
CDS markets has been strong for companies with high CDS premium during the year
2010, being a different case for the other two where the stock market maintains its lead.

4
The rest of the article is structured as follows. We first review the recent research that
relates CDS spreads and stocks and explicit our objectives. Next we take an exploratory
look at the data and motivate the more formal model. In section 4 we introduce our
country specific model and discuss some extensions of the basic model. Section 5
develops the panel data model. Finally we conclude in section 6. Graphs and tables can
be found at the end of the paper.
2. Existing Literature and Hypothesis
The link between CDS spreads, bond spreads and equity markets has become recently a
fruitful field of studies. The credit derivative market is growing rapidly3 and following
Byström (2005) we can say that the relationships among these three markets are
important not only for risk managers using these markets for hedging purposes but to
anyone trying to profit from arbitrage possibilities4.
At a firm level, the close relationship between CDS and bond spreads has been vastly
documented and the CDS market has been evidenced to have the lead on the bond
market. The bond price would adjust to the CDS price (See for example Norden and
Weber (2004), Blanco et al. (2005), Zhu (2006), Forte and Peña (2009)).
The relationship between CDS spreads and equity prices5 has been discussed in papers
by Byström (2005) and Fung et al. (2008) among others. Using a sample of European i-
Traxx CDS indexes Byström (2005) finds evidence of firm specific information being
embedded into stock prices before it is embedded into CDS spreads. He also finds that
stock price volatility is significantly correlated with CDS spreads. Fung et al. (2008)
using a VAR (Vector Autoregressive) model and daily index data, find also a leading
role of stock market related to CDS market. During the 2007 credit crunch period they
find a closer relationship between the stock and CDS markets and an important role of
the investment grade CDS incorporating information.
The first paper to incorporate the three markets (assets) in the analysis was Longstaff at
al. (2003). Studying lead-lag relationships between weekly single-name CDS spreads 3 BIS (2009). 4 One such example is the paper by Figuerola-Ferretti and Paraskevopoulos (2010)
5 The theoretical link between the credit market and the stock market information was already built by Merton (1974). The value of any credit derivative is linked to the probability of the underlying reference entity being exposed to a credit event at some point in the future, and for entities with traded equity the probability is often estimated using information from the stock market.

5
changes, corporate bond spreads and stock returns of US firms, they find that both stock
and CDS markets lead the bond market. However, in their sample there is no clear lead
of the stock market with respect to the CDS market.
One recent study, Norden and Weber (2009), find a definite lead of the stock market
relative to the CDS and bond markets. They also find that CDS spread changes Granger
cause bond spread changes for a higher number of firms than vice versa. A very
interesting result is that the co-movement between CDS market and stock market
increases the lower the credit quality. This study uses an early sample, 2000-2002, of
companies’ CDS, bond and stock data, estimates a vector autoregressive model and
examines daily, weekly and monthly lead-lag relationships between markets.
Forte and Peña (2009) constitutes another valuable article in the link among the three
assets. In order to investigate which of these markets (assets) leads the credit risk
discovery process, they estimate a Vector Error Correction Model (VECM) for a sample
of North American and European firms. Their results find that stocks lead CDS and
bonds more frequently that the other way round. Besides, it is confirmed the leading
role of CDS with respect to bonds.
In this paper we also focus on the study of the links between CDS spreads and market
prices, and CDS spreads and return volatilities. However we are pioneers using
European sovereign data. This is one of the first papers looking at the relationship
between sovereign CDS and stock markets. At a firm level, finance theories suggest that
the stock market, being efficient, should have already incorporated information
pertaining to the default probability of firms, but what happens at a country level?
Strictly speaking we do not have equity for countries, although we could argue that the
companies of that country are a proxy for this equity and the credit information about
the country should translate to stocks markets. As we already mentioned deteriorating
credit quality for a country means that the government will need to raise funds at higher
rates. This will cause a domino effect: there will be less money to invest and spend,
with high probability taxes will be raised, consumers and companies will face a drop in
consumption and investments, and this situation will end up in a drop in the company’s
profits and a fall in their stock prices.
Analyzing daily prices of sovereign CDS premiums and stock indexes of eight different
countries - France, Greece, Germany, Ireland, Italy, Portugal, Spain and UK – during
the period from January 2007 until July 2010, this paper contributes to the existing
6
literature in three ways: first, we study the lead-lag relationship between the two
markets (assets) in other to find which market leads the process of pricing new
information, if such a lead exists. We use a Vector Autoregressive representation and
find a close relationship and a clear interdependency between both markets. Our results
confirm the revised previous studies: the stock market mainly takes the lead. The
country specific results are robust to the use of panel data.
Our second objective is to test if there has been a change in this relationship during the
year 2010, i.e. during the European sovereign debt crisis. We clearly find that during
this year CDS markets lead the movements in stock markets reversing the previous
tendency. Again panel data confirm the results. So, we find that the general market
conditions underlying the credit information flow between the stock and CDS markets
are important. This result was also found in Fung et al. (2008). Worsening credit
conditions makes this relationship stronger.
Our third goal is to study if there is any difference between countries with lower credit
quality and countries with higher credit quality. In other to test this hypothesis we split
the sample in two subsamples: countries with worse CDS premiums (Greece, Ireland,
Portugal, Spain and Italy) and countries with better CDS premiums (France and
Germany). We test this hypothesis with panel data and we do not incorporate UK due to
the different currency. Panel data results corroborate previous findings. During the
sample period (2007-2010) the stock market lead the process of incorporating new
information, but when year 2010 is isolated the reverse information flow in found: the
CDS market takes the lead. Similar to Norden and Weber (2009) we find that the co-
movement between CDS market and stock market increases the lower the credit quality,
in our case sovereign credit quality.
A recent work by Coudert and Gex (2010) looks at the links between sovereign CDS
and bonds and their results are much related to ours. Using a sample of sovereigns (and
some corporates) the leading role of the CDS markets versus the bond markets is once
more confirmed. They find that the CDS market lead has been fuelled by the current
crisis, although they find that for countries with low risk the bond market has the lead
on the CDS market.
3. An Exploratory Look at the Data

7
In this study we use daily data of the closing price of the 5-year sovereign CDS data and
of the Stock Indexes6. The benchmark maturity of sovereign CDS tends to be five years,
though contracts of 10 years maturity are also available. We use the mid-points between
quoted bid and ask points for the 5-year maturity CDS7 denominated in USD. The
sample contains data for eight European countries: Spain, Portugal, Italy, France,
Ireland, United Kingdom, Greece and Germany. Regarding to Stock Index prices the
sample contains daily closing price for IBEX 35 (Spain), PSI 20 (Portugal), FTSEMIB
(Italy), CAC 40 (France), ISEQ 20 (Ireland), FTSE 100 (United Kingdom), FTSE
Athex 20 (Greece) an DAX (Germany).
This sample has been selected in order to contrast our hypotheses. We need a set of
risky countries (i.e. countries with a high CDS premium), where we want to find how
the relationship between the stocks and the CDS has behaved during and before the
2010 turmoil, and we need safer countries (i.e. countries with lower risk premium) to
find out if there is any difference in this relationship. These two subsamples can be
found at Table 1.b. at the end of the paper.
Our sample coverage starts at January 2007 and ends at July 2010 and we do analyze
three different subsets: January 2007-December 2008; January 2009-December 2009
and finally January 2010-July 2010. Because the behavior of credit markets has been so
different during these sub periods we want to look at the intertemporal stability of the
co-movement of these markets.
Table 1.a, at the end, exhibits the main descriptive statistics for each country’ CDS and
stock Index. We can see how the mean and median CDS premium for every country has
increased during year 2010. Also daily changes on CDS and stock returns show
significant kurtosis and skewness.
We offer Figures 1 and 2 to show some graphical evidence on the movements during
the sample periods of the CDS premiums and the Stock Indexes for Spain and Italy.
Spreads on the CDS widen when deterioration in credit risk is detected or perceived by
the market and tighten when there is less credit risk perceived. We can clearly
appreciate how as the CDS Premiums widen (the credit risk increases) the stock indexes
fall (market risk also increases). Movements in both markets are opposite. 6 Provided by Bloomberg.
7 The 5-Year CDS is more liquid and it is more often used as reference in financial markets.

8
[insert Figure 1 here]
[insert Figure 2 here]
As one would expect we find a large CDS index spread when the stock market valuation
is low and the volatility is high and vice versa.
Table 2 reports the Spearman pair wise rank correlation between the stock index and the
sovereign CDS of daily time-series at a country-level. We look at levels as well as
percentage changes.
[insert Table 2 here]
The correlation coefficients are found to be significantly different from zero at the 0.10-
level in almost all the countries and for each period. As expected, the correlation
between sovereign CDS and Stock Indexes are negative and higher when we size the
risk and the stock prices in absolute terms. Furthermore when we size the correlation
between CDS sovereign change and Stock Index returns we can clearly observe how
these correlations have increased in time and become stronger. For almost every country
in our sample correlations between stocks indexes returns and CDS spread changes
reached maximum levels during year 2010.
In case of the variance, which we estimate with a GARCH (1,1) model, the correlation
as expected is positive. As the values of CDS variances increase the values of the Stock
Index variances also increase and vice versa. However we find that these correlations in
risk are more significant in the case of the countries with higher risk premiums, where
we can also observe an increase in the size of the correlation. Germany, France, and UK,
although mainly show positive correlations between the risk of both markets, exhibit a
more weak link.
Using the Augmented Dickey-Fuller test and the Phillips-Perron test we obtain that the
all series in levels are non-stationary, but the first difference series are stationary. This
result will allow us to use a VAR model in the next section for the first-difference
series8.
4. A VAR Model: Relationship between Sovereign CDS and Stock Markets
8 Results are available upon request. Estimating the parameters in a VAR requires that the dependent and independent variables be covariance stationary, meaning that their first two moments exist and are time invariant. If they are not covariance stationary, but their first differences are, a vector-error correction model (VECM) can be used.

9
In this section, we analyze the intertemporal co-movement of CDS sovereign spreads
changes and Stock Index prices. We use the vector autoregressive (VAR) model to
analyze the lead-lag relationship between both markets. Previous literature (see
Longstaff et al. (2003), Norden y Weber (2009) and Fung et al. (2008)) show that VAR
model is appropriate to analyze the co-movement of markets because it captures lead-
lag relationships within and between stationary variables in a simultaneous multivariate
framework9.
We estimate the following two dimensional VAR model:
∆
[1]
∆ ∆
With Rt: stock index return in t,
∆CDSt: sovereign CDS spread change in t,
p: lag order index,
εt: disturbance term in t.
For the above model specification, the lag structure and the maximum lag order p has to
be determined. For each country we found the optimal lag computing four information
criteria, the final prediction error, Akaike’s information criterion, the Hannan-Quinn
information criterion and Schwarz’s Bayesian information criterion.
Evidence of VAR analysis results for the eight countries with the corresponding optimal
lag length is found in Table 3. We split the whole time series sample into three different
and non-overlapped subsets to generate a more detailed picture of the relationship
9 Other authors, like Forte and Peña (2009) apply a VECM to the original series in levels and perform a price discovery analysis. Norden and Weber (2009) also perform a VECM study. In this article we find more meaningful to study the evolution of daily changes and focus on the lead-lag relationships, so we do not study here the price discovery process.

10
between sovereign CDS and Stock Indexes. Also the estimation for the different time
series will serve as robustness tests.
[insert Table 3 here]
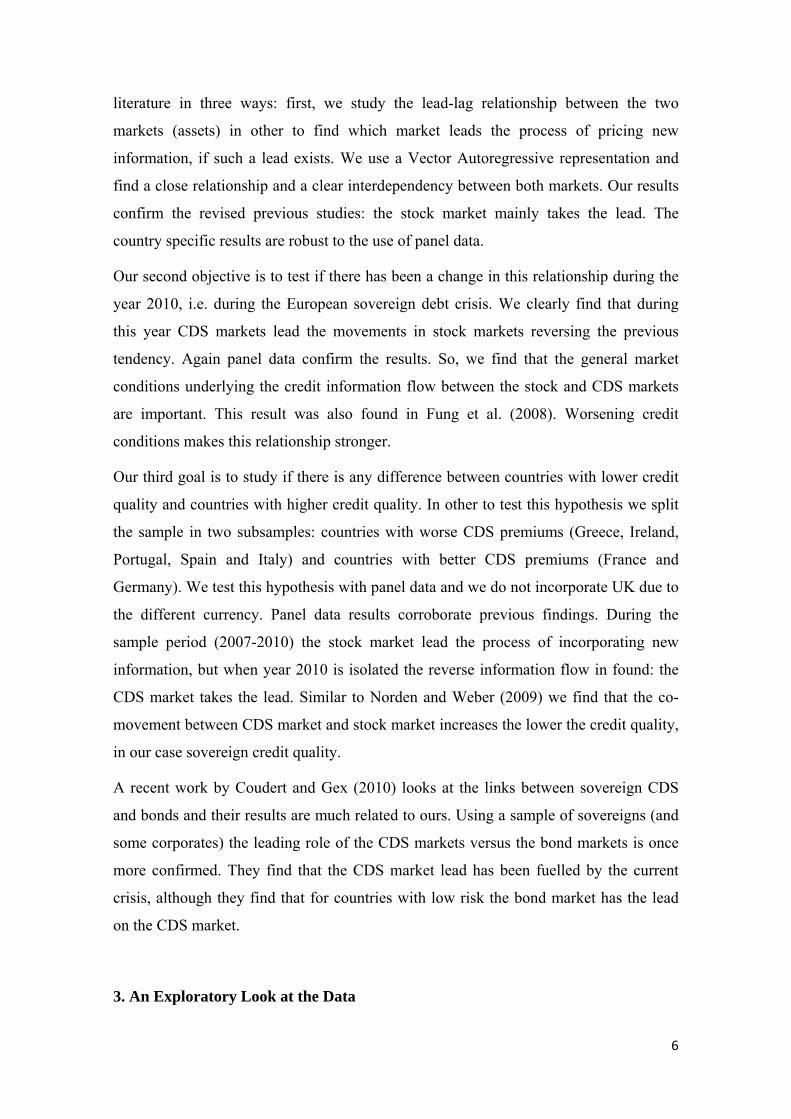
The analysis of the entire sample period (2007-2010) suggests that, for all the countries
analyzed except for Italy in which CDS market leads stock market and for Ireland where
there is no apparent relationship between both markets, results are consistent with a
leading role of stock market. If we consider the different time series it is noteworthy that
the leading role of the CDS market increases over time.
After fitting a VAR, we want to know whether one variable “Granger-causes” another.
A variable x is said to Granger-cause a variable y if, given the past values of y, past
values of x are useful for predicting y. Note that Granger causality is not a causality in a
deep sense of the word. It just talks about linear prediction, and we find Granger
causality if one thing happens before the other. We may have an unmodeled factor
causing the response of x and y, and we will observe Granger causality even though the
real causality is different.
There is reciprocal Granger causality for a considerable number of countries, and we
can talk about a feedback process. A leading role of the stock exchanges during the
whole period can clearly be appreciated. When looking at the different sub periods we
appreciate a change in the lead-lag relationship. During year 2009 the leading role of
stocks becomes weaker, and finally in year 2010 the CDS market takes the lead in 6 out
of the 8 countries. We don’t find much feedback process during this year, corroborating
the view that the CDS market has become, during the turmoil, the target where
information and speculation is rapidly incorporated.
We also note a clear increase in the model R2 when using the 2010 data, indicating the
better suitability of this model during last period.
5. Panel Data Model
To test further our results and provide further insight into the relationship of the
sovereign CDS and Stock Indexes we estimate a panel data model with the following
structure:

11
∆
[2]
∆ ∆
with Rt being the stock index return of country i at time t, ∆CDSt sovereign CDS spread
change of country i at time t, p is the lag order index and εit is the disturbance term of
country i at time t.
Following Nickell (1980) we use a panel model with fixed effects10. Norden and Weber
(2004) also follow this approach. Panel regressions confirm the previous results: the
stock market clearly leads CDS market, which support the view that the stock market is
relatively more sensitive to new information and more liquid. However we can observe
a strong feedback process. These results are robust to time divisions.
If we divide the panel into two groups: countries with high CDS premium (Greece,
Ireland, Spain, Portugal and Italy) and countries with lower risk premium (Germany,
France)11 we realize that the leadership of the CDS markets during 2010 has been
exacerbated by the financial turmoil in Southern Europe. We can appreciate a more
modest leading role of CDS in the countries with lower spreads.
6. Conclusions
In this paper we have studied the relationship between the Stock Index prices and
sovereign CDS market, using daily data from January 2007 to July 2010.
10 Nickell (1980) shows that for samples with large time series observations and relatively small number of “N” (countries), a panel data model with fixed effects is appropriate. See also Baltagi (2005), Cameron and Trivedi (2005).
11 We don’t include here data from the UK due to the different currency. We would be mixing credit risk and currency risk.

12
First analyzing the country-specific market co-movements, we find that stock Index
returns and sovereign CDS spread changes show significantly negative correlation.
Second, Stock index return volatility is also found to be considerably correlated with
sovereign CDS spreads movements revealing a close link between both markets.
Moreover we find that these correlations are more significant in the case of the countries
with higher risk premiums (Italy, Greece, Spain, Italy and Portugal). However countries
with lower CDS spreads (France, Germany and UK) show positive but weaker
correlations between both markets.
Motivated by the previous literature and these significant correlations, we use a vector
autoregression framework to examine the lead-lag relations between the sovereign
credit-derivatives and Stock market. We find evidence that changes in Stock price
returns lead changes in sovereign CDS spreads during the period (January 2007 to
December 2009). In contrast during last period analyzed (January 2010-July 2010)
sovereign CDS lead Stock markets.
Finally, in order to provide further insight to these results we estimate a panel data with
all the countries and with the two subsamples (countries with higher and lower CDS
spreads). Panel regressions confirm the previous results: the stock market clearly leads
CDS market, which support the view that the stock market is relatively more sensitive
to new information and more liquid. However we can observe a strong feedback process.
These results are robust to time divisions.
If we divide the panel into two groups: countries with high CDS premium (Greece,
Ireland, Spain, Portugal and Italy) and countries with lower risk premium (Germany,
France) we realize that the leadership of the CDS markets during 2010 has been
exacerbated by the financial turmoil in Southern Europe. We can appreciate a more
modest leading role of CDS in the countries with lower spreads.

13
7. References
Baltagi, B. (2005) “Econometric Analysis of panel data”, John Wiley and Sons, United Kingdom.
Bank for International Settlement (2010), Triennial and semiannual surveys on positions in global over-the-counter (OTC) derivatives markets at end-June 2010, November, Monetary and Economic Department.
Blanco, R., S. Brenan. and I.W. Marsh (2005) “An Empirical Analysis of the Dynamic Relationship Between Investment Grade Bonds and Credit Default Swaps” The Journal of Finance, 60, pp.2255-2281.
Bystrom, H. (2005) “Credit Default Swaps and Equity Prices: The iTraxx CDS Index Market” Working Paper, Department of Economics, Lund University.
Cameron, A. and Trivedi, P (2005) “Microeconometrics: methods and applications”, Cambridge University Press, New York.
Campbell, J.Y. and G.B. Taksler (2003) “Equity Volatility and Corporate Bond Yields” The Journal of Finance, 58 (6), pp. 2321-2349.
Coudert, V. and M. Gex (2010) “Credit Default Swaps and Bond Markets: which leads the other?” Financial Stability Review, 14, Banque de France.
Das, S.R. and P. Hanouna (2006) “Credit Default Swap Spreads”, Journal of Investment Management, 4, pp.93-105.
Forte, S. and J.I. Peña (2009) “Credit Spreads: An Empirical Analysis on the informational Content of Stocks, Bonds and CDS” Journal of Banking and Finance, 33, pp. 2013-2025.
Figuerola-Ferretti, I. and I. Paraskevopoulos (2010) “The Dynamic Relation Between CDS Markets and the VIX Index”, Working paper, Carlos III University, Madrid.
Fung, H.G., G.E. Sierra, J. Yau and G. Zhang (2008) “Are the US Stock Market and Credit Default Swap Market Related? Evidence from the CDX Indices” The Journal of Alternative Investments, pp.43-61.
Hull, J., Predescu, M. and White, A. (2004). “The Relationship between CDS Spreads,
Bond Yields and Credit Rating Announcements”. Journal of Banking and Finance, 28,
pp. 2789-2811.
Longstaff, F.A., S. Mithal and E. Neis (2003) “The Credit Default Swap Market: Is Credit Protection Priced Correctly?” Working paper, Anderson School, UCLA, August.

14
Longstaff, F.A., S. Mithal and E. Neis (2005) “Corporate Yield Spreads: Default Risk or Liquidity? New Evidence from the Credit Default Swap Market” The Journal of Finance, 60, pp. 2213-2253.
Merton, R. (1974) “On the Princing of Corporate Debt: the Risk Structure of Interest Rates” The Journal of Finance, 29, pp. 449-470.
Nickell, S. (1980) “Correcting the Biases in Dynamic Models with Fixed Effects”, Working paper n.133, Princeton University, Department of Economics, Industrial Relations Section.
Norden, L. and M. Weber (2009) “The Co-movement of Credit Default Swap, Bond and Stock Markets: an Empirical Analysis” European Financial Management, 15 (3), pp 529-562.
Zhu, H. (2006) “An Empirical Comparison of Credit Spreads between the Bond Market and the Credit Default Swap Market” Journal of Financial Services Research, 29, pp 211-235.

15
Table 1.a: Descriptive Statistics
For each country we show the main descriptive statistics splitting the sample into two time series: January 2007-July 2010 and January 2010-July 2010. For each country we include six different variables: CDS (sovereign CDS premium), ∆CDS (sovereign CDS premium daily changes), VarCDS (sovereign CDS premium variance calculated with a GARCH (1, 1)), Stock Index, Stock Index daily returns and Stock Index variance (calculated with a GARCH (1, 1) of daily returns.
Spain
CDS ∆CDS VarCDS IBEX ∆IBEX VarIBEX CDS ∆CDS VarCDS IBEX ∆IBEX VarIBEXN 924 923 924 898 897 898 140 140 140 137 137 137Mean 66,02 0,48% 0,62% 11.957,11 -5,27% 0,04% 165,84 0,50% 0,70% 10.457,73 -0,14% 0,05%Median 57,32 0,00% 0,27% 11.761,00 6,19% 0,02% 145,11 0,82% 0,48% 10.441,00 0,09% 0,03%Maximum 274,87 75,55% 30,26% 15.945,70 1348,36% 0,35% 274,87 25,17% 5,74% 12.222,50 13,48% 0,33%Minimum 2,55 -75,55% 0,08% 6.817,40 -958,59% 0,01% 93,81 -37,04% 0,10% 8.669,80 -6,87% 0,01%Kurtosis 1,22 26,17 172,60 -1,18 6,74 15,38 -1,16 3,26 19,54 -0,83 9,67 10,04Skewness 1,17 0,04 11,59 -0,08 0,28 3,64 0,52 -0,60 3,75 0,03 1,16 3,03
Portugal
CDS ∆CDS VarCDS PSI20 ∆PSI20 VarPSI20 CDS ∆CDS VarCDS PSI20 ∆PSI20 VarPSI20N 924 923 924 905 904 905 140 140 140 137 137 137Mean 70,94 0,44% 0,52% 9.357,54 -6,17% 0,02% 217,32 0,83% 0,69% 7.646,76 -0,13% 0,03%Median 47,75 0,00% 0,29% 8.479,32 1,67% 0,01% 192,31 0,35% 0,43% 7.569,25 -0,04% 0,02%Maximum 450,63 44,58% 5,23% 13.702,03 1019,59% 0,34% 450,63 20,54% 5,23% 8.839,75 10,20% 0,26%Minimum 4,02 -47,38% 0,10% 5.743,09 -1037,92% 0,00% 81,44 -47,38% 0,13% 6.624,29 -5,51% 0,01%Kurtosis 4,03 8,71 14,24 -1,40 8,35 23,50 -1,11 8,29 11,96 -0,81 7,28 11,55Skewness 1,99 0,22 3,38 0,30 0,06 4,36 0,32 -1,19 3,20 0,27 0,93 3,10
Italy
CDS ∆CDS VarCDS FTSEMIB ∆FTSEMIB VarFTSEMIB CDS ∆CDS VarCDS FTSEMIB ∆FTSEMIB VarFTSEMIBN 924 923 924 896 895 896 140 140 140 137 137 137Mean 71,20 0,32% 0,31% 28.661,61 -9,66% 0,04% 142,70 0,34% 0,43% 21.434,94 -0,11% 0,04%Median 60,40 0,00% 0,19% 24.344,00 0,03% 0,02% 129,99 0,16% 0,26% 21.501,24 0,14% 0,02%Maximum 245,88 42,88% 3,85% 44.364,00 1087,42% 0,35% 245,88 19,71% 3,38% 23.811,13 9,93% 0,20%Minimum 5,58 -43,73% 0,08% 12.621,00 -859,91% 0,00% 89,74 -43,73% 0,10% 18.382,71 -5,40% 0,01%Kurtosis -0,59 13,23 24,99 -1,42 5,28 13,36 -0,19 13,19 15,56 -1,13 5,70 6,04Skewness 0,68 0,18 4,34 0,32 0,17 3,31 0,79 -1,66 3,59 -0,21 0,64 2,36
France
CDS ∆CDS VarCDS CAC ∆CAC VarCAC CDS ∆CDS VarCDS CAC ∆CAC VarCACN 924 923 924 904 903 904 140 140 140 137 137 137Mean 26,78 0,40% 1,97% 4.360,93 -6,86% 0,04% 60,55 0,69% 0,62% 3.747,75 -0,09% 0,03%Median 21,39 0,00% 0,53% 4.038,66 -2,17% 0,02% 60,40 0,33% 0,56% 3.739,46 0,00% 0,02%Maximum 98,45 136,82% 82,44% 6.168,15 1059,46% 0,38% 98,45 16,46% 1,74% 4.065,65 9,22% 0,19%Minimum 1,50 -131,06% 0,33% 2.519,29 -947,15% 0,01% 29,69 -15,39% 0,35% 3.331,29 -4,71% 0,01%Kurtosis -0,06 33,74 83,81 -1,34 5,87 18,00 -0,97 0,08 5,50 -1,15 5,93 9,48Skewness 0,95 0,38 7,89 0,23 0,22 3,83 0,24 0,11 1,90 -0,17 0,62 2,85
Greece
CDS ∆CDS VarCDS FTSEAthex20 ∆FTSEAthex20 VarFTSEAthex20 CDS ∆CDS VarCDS FTSEAthex20 ∆FTSEAthex20 VarFTSEAthex20N 924 923 924 882 881 882 140 140 140 133 133 133Mean 154,09 0,51% 0,67% 1.709,12 -10,85% 0,06% 537,72 0,76% 0,64% 904,55 -0,28% 0,09%Median 79,28 0,00% 0,30% 1.558,99 -0,62% 0,04% 419,66 0,20% 0,38% 938,09 -0,53% 0,08%Maximum 1037,41 59,45% 21,93% 2.841,23 1011,41% 0,39% 1037,41 23,07% 10,50% 1.202,91 9,99% 0,32%Minimum 5,20 -58,39% 0,20% 667,70 -979,63% 0,00% 247,01 -49,15% 0,21% 667,70 -7,64% 0,03%Kurtosis 5,07 15,68 95,36 -1,59 220,11% 7,49 -1,32 15,57 63,82 -1,19 0,65 4,62Skewness 2,23 -0,08 8,27 0,15 -8,11% 2,33 0,48 -2,02 7,30 -0,10 0,29 2,01
2007-2010 2010
2007-2010 2010
2007-2010 2010
2007-2010 2010
2007-2010 2010

16
Table 1.a continued.
Table 1.b: Average CDS premium
We report CDS average premium for each country in 2010. So we can split the sample into groups: European countries with lower spreads (CDS average premium below 100 p.b) and European countries with higher spreads (CDS average above 100 p.b).
Ireland
CDS ∆CDS VarCDS ISEQ20 ∆ISEQ20 VarISEQ20 CDS ∆CDS VarCDS ISEQ20 ∆ISEQ20 VarISEQ20N 720 719 720 924 923 924 140 140 140 140 140 140Mean 106,28 0,53% -2,33% 5.086,37 -0,14% 0,05% 181,67 0,34% -11,65% 3.063,84 -0,02% 0,03%Median 122,84 0,00% 0,85% 3.464,99 0,00% 0,03% 155,17 0,02% -11,40% 3.035,84 0,05% 0,02%Maximum 386,46 315,75% 3,06% 9.981,08 10,00% 0,42% 287,79 26,81% -8,53% 3.497,17 7,57% 0,14%Minimum 5,19 -32,69% -15,50% 1.916,38 -14,00% 0,01% 110,53 -32,69% -15,50% 2.776,55 -4,58% 0,01%Kurtosis -0,74 595,37 -0,37 -1,23 3,79 17,26 -1,22 7,90 -1,17 -0,21 2,31 2,53Skewness 0,56 23,30 -0,95 0,57 -0,31 3,68 0,53 -0,21 -0,24 0,68 0,15 1,73
United Kingdom
CDS ∆CDS VarCDS FTSE100 ∆FTSE100 VarFTSE100 CDS ∆CDS VarCDS FTSE100 ∆FTSE100 VarFTSE100N 505 504 505 897 896 897 140 140 140 135 135 135Mean 77,66 0,29% 0,19% 5.435,46 -2,95% 0,03% 81,42 -0,07% 0,15% 5.366,37 -0,02% 0,02%Median 79,13 0,00% 0,19% 5.473,48 2,43% 0,02% 80,86 -0,07% 0,12% 5.325,09 0,13% 0,01%Maximum 164,92 26,91% 2,15% 6.732,40 938,43% 0,32% 94,74 10,37% 0,76% 5.825,01 5,03% 0,06%Minimum 16,50 -17,74% 0,10% 3.512,09 -926,56% 0,00% 69,31 -14,43% 0,10% 4.805,75 -3,20% 0,00%Kurtosis 0,49 7,77 74,50 -1,04 5,86 21,51 0,27 3,33 25,49 -1,00 2,26 2,51Skewness 0,32 0,86 7,35 -0,32 -0,05 4,22 0,30 -0,38 4,36 0,03 0,13 1,64
Germany
CDS ∆CDS VarCDS DAX ∆DAX VarDAX CDS ∆CDS VarCDS DAX ∆DAX VarDAXN 924 923 924 897 896 897 140 140 140 137 137 137Mean 22,14 0,27% 1,00% 6.187,40 -2,90% 0,03% 38,30 0,30% 0,75% 5.954,22 0,01% 0,02%Median 19,64 0,00% 0,73% 6.183,49 6,88% 0,02% 40,29 0,11% 0,73% 5.984,75 0,17% 0,02%Maximum 90,61 114,51% 17,85% 8.105,69 1079,75% 0,27% 56,89 13,73% 0,94% 6.332,10 5,16% 0,06%Minimum 2,97 -87,86% 0,69% 3.666,41 -743,35% 0,01% 25,18 -11,41% 0,69% 5.434,34 -3,39% 0,01%Kurtosis 1,17 43,02 78,42 -0,90 6,45 14,65 -0,95 0,96 1,67 -0,67 1,46 2,70Skewness 1,09 0,63 8,14 -0,13 0,25 3,59 -0,09 0,07 1,51 -0,50 -0,07 1,77
2007-2010 2010
2007-2010 2010
2007-2010 2010
Greece 537,72Portugal 217,32Ireland 181,67Spain 165,84Italy 142,70United Kingdom 81,42France 60,55Germany 38,30
CDS Average 2010Country

17
Table 2: Contemporaneous correlation of country specific time-series
We report Spearman´s rank correlation coefficients ρs, calculated for a pair of country- specific time series (2007 and 2008 year, 2009 year and 2010, stock indexes R, CDS premium CDS, log stock indexes ∆R, spread changes ∆CDS, log stock indexes volatility var ∆R, and CDS premium volatility).
ρs (R,CDS) ρs (∆R,∆CDS) ρs (var ∆R,var CDS)Spain 2007-2008 -0,786** -0,161** -0,121**
2009 -0,632** -0,356** 0,366**2010 -0,814** -0,507** 0,708**
Portugal 2007-2008 -0,815** -0,144** 0,200**2009 -0,769** -0,323** 0,309**2010 -0,883** -0,567** 0,672**
Italy 2007-2008 -0,945** -0,186** 0,402**2009 -0,799** -0,423** 0,317**2010 -0,842** -0,496** 0,718**
France 2007-2008 -0,863** -0,060 - 0,226**2009 -0,854** -0,271** 0,1172010 -0,837** -0,430** 0,111
Greece 2007-2008 -0,773** -0,144** - 0,128**2009 -0,705** -0,426** 0,422**2010 -0,926** -0,576** 0,542**
Ireland 2007-2008 -0,485** 0,051 0,349**2009 -0,626** -0,276** 0,673**2010 -0,270** -0,223** 0,579**
United Kingdom 2007-2008 -0,763** -0,234** 02009 -0,768** -0,245** 0,0752010 -0,468** -0,439** 0,285**
Germany 2007-2008 -0,665** -0,134** 0,142**2009 -0,894** -0,236** 0,263**2010 -0,157* -0,361** 0,086
18
Table 3: Country-specific lead-lag analysis with VAR model
The country-specific VAR model consists of two-equations with the log stock index return (Rt) and the CDS sovereign spread change (∆CDS) as dependent variables respectively. In this table, we report the coefficients (Coeff.) and the p-value which reflects if explanatory variable is significantly for each country and for each period. We show the p-value for the Granger causality test (GC) only in the cases in which p is significant at a 10% level.
Spain
Dep.VarCoeff. p-val. Coeff. p-val. Coeff. p-val. Coeff. p-val. Coeff. p-val. Coeff. p-val. Coeff. p-val. Coeff. p-val.
Rt-1 -0.059 0.101 -0.573 0.000 -0.092 0.045 -0.424 0.016 0.044 0.518 -0.992 0.000 -0.054 0.613 0.088 0.822Rt-2 -0.069 0.060 -0.271 0.041 -0.083 0.073 -0.318 0.074 0.021 0.769 -0.553 0.006 -0.023 0.821 -0.019 0.960Rt-3 -0.070 0.055 0.080 0.550 -0.085 0.068 -0.019 0.917 -0.094 0.192 0.081 0.689 -0.007 0.947 0.120 0.751Rt-4 0.061 0.093 0.074 0.575 0.118 0.011 0.039 0.827 0.070 0.330 -0.087 0.667 0.051 0.615 -0.129 0.730∆CDSt-1 -0.021 0.028 -0.240 0.000 -0.009 0.460 -0.363 0.000 -0.005 0.828 -0.046 0.489 -0.074 0.014 0.116 0.284∆CDSt-2 -0.008 0.397 -0.094 0.010 -0.015 0.240 -0.090 0.067 -0.002 0.923 -0.021 0.001 0.066 0.027 -0.196 0.071∆CDSt-3 -0.006 0.528 -0.037 0.307 -0.010 0.418 -0.008 0.870 -0.001 0.963 0.175 0.004 -0.047 0.120 -0.103 0.343∆CDSt-4 0.015 0.123 0.084 0.017 -0.007 0.554 -0.014 0.768 0.014 0.523 -0.082 0.172 0.100 0.001 -0.325 0.004Const. -0.00056 0.406 -0.0078 0.002 -0.00081 0.372 0.0104 0.003 0.00080 0.438 0.0037 0.200 -0.00182 0.322 0.0068 0.305Obs. 836 836 473 473 236 236 127 127R2 0.0197 0.0698 0.0390 0.1230 0.0157 0.1873 0.2061 0.1742GC test 0.085 0.000 --- 0.074 --- 0.000 0.000 ---
Dep.VarCoeff. p-val. Coeff. p-val. Coeff. p-val. Coeff. p-val. Coeff. p-val. Coeff. p-val. Coeff. p-val. Coeff. p-val.
Rt-1 -0.007 0.845 -0.591 0.000 0.027 0.557 -0.539 0.004 -0.069 0.297 -1.046 0.000 -0.327 0.005 1,511 0.002Rt-2 -0.048 0.183 -0.113 0.463 -0.036 0.435 -0.254 0.173 0.049 0.468 -0.549 0.069 -0.126 0.292 0.419 0.410Rt-3 -0.030 0.408 0.397 0.010 -0.005 0.908 0.163 0.385 -0.077 0.253 0.213 0.475 -0.092 0.442 1.014 0.045∆CDSt-1 -0.019 0.025 -0.078 0.031 -0.004 0.143 -0.247 0.000 -0.011 0.457 -0.121 0.058 -0.118 0.000 0.622 0.000∆CDSt-2 -0.015 0.073 -0.045 0.208 -0.020 0.729 -0.109 0.024 -0.002 0.860 -0.032 0.617 0.007 0.803 -0.074 0.555∆CDSt-3 -0.007 0.384 0.089 0.013 -0.015 0.085 0.082 0.082 0.012 0.397 0.210 0.001 -0.026 0.357 0.071 0.557Const. -0.00068 0.199 0.0052 0.023 -0.001 0.206 0.007 0.021 0.0006 0.401 0.003 0.432 0.0011 0.481 0.007 0.259Obs. 851 851 482 482 240 240 129 129R2 0.0100 0.0341 0.0093 0.0811 0.0211 0.1076 0.1487 0.2424GC test 0.051 0.000 --- 0.010 --- 0.002 0.000 0.005
Italy
Dep.VarCoeff. p-val. Coeff. p-val. Coeff. p-val. Coeff. p-val. Coeff. p-val. Coeff. p-val. Coeff. p-val. Coeff. p-val.
Rt-1 -0.025 0.492 -0.100 0.320 -0.090 0.055 0.090 0.507 0.864 0.223 -0.390 0.001 0.006 0.959 0.404 0.326Rt-2 -0.050 0.173 -0.145 0.152 -0.118 0.012 -0.277 0.041 0.077 0.276 0.060 0.620 -0.201 0.858 0.062 0.876Rt-3 -0.102 0.006 0.123 0.224 -0.158 0.001 0.086 0.529 -0.090 0.207 0.111 0.357 0.034 0.761 0.199 0.619Rt-4 0.117 0.002 0.098 0.331 0.137 0.004 -0.243 0.076 0.136 0.056 -0.007 0.952 0.012 0.913 0.122 0.760∆CDSt-1 -0.025 0.061 0.019 0.603 -0.017 0.279 -0.109 0.020 0.0003 0.994 0.167 0.019 -0.045 0.177 0.330 0.005∆CDSt-2 -0.009 0.455 -0.002 0.948 -0.031 0.057 0.012 0.798 0.032 0.431 0.051 0.458 0.056 0.093 -0.151 0.202∆CDSt-3 -0.031 0.018 0.031 0.387 -0.046 0.005 0.112 0.017 -0.067 0.100 0.073 0.288 -0.043 0.195 -0.034 0.775∆CDSt-4 0.007 0.583 -0.059 0.103 -0.040 0.013 0.019 0.676 0.059 0.131 -0.088 0.183 0.078 0.015 -0.118 0.302Const. -0.00094 0.153 0.0042 0.021 -0.0012 0.155 0.0059 0.019 0.0001 0.901 0.0002 0.893 -0.001 0.441 0.004 0.447Obs. 824 824 461 461 236 236 127 127R2 0.0300 0.0105 0.0864 0.0461 0.0460 0.1209 0.1199 0.1311GC test 0.044 --- 0.004 0.086 --- 0.024 0.037 ---
Rt
2010Rt ∆CDSt∆CDSt Rt ∆CDSt
Rt
2007-2010 2007-2008 2009Rt ∆CDSt
Rt
RtRt ∆CDSt
Rt
∆CDSt
2007-2010
∆CDSt Rt
2007-2010
2010
Portugal
2007-2008 2009∆CDSt
∆CDSt
∆CDSt Rt ∆CDSt
2007-2008 2009 2010
Rt ∆CDSt

19
Table 3 continued.
Dep.VarCoeff. p-val. Coeff. p-val. Coeff. p-val. Coeff. p-val. Coeff. p-val. Coeff. p-val. Coeff. p-val. Coeff. p-val.
Rt-1 -0.094 0.007 -0.854 0.000 -0.132 0.004 -0.710 0.056 -0.014 0.827 -0.886 0.000 -0.117 0.214 -0.393 0.173Rt-2 -0.075 0.031 -0.459 0.051 -0.117 0.011 -0.369 0.324 0.053 0.437 -0.416 0.032 -0.115 0.225 0.357 0.218Rt-3 -0.082 0.019 -0.229 0.333 -0.107 0.020 -0.245 0.514 -0.051 0.461 0.009 0.963 -0.019 0.837 0.599 0.041Rt-4 0.086 0.014 -0.207 0.381 0.128 0.006 -0.122 0.744 0.086 0.205 -0.407 0.035 -0.138 0.144 0.135 0.641∆CDSt-1 -0.006 0.243 -0.371 0.000 -0.004 0.450 -0.412 0.000 0.013 0.575 0.038 0.567 -0.092 0.002 0.106 0.255∆CDSt-2 -0.003 0.573 -0.181 0.000 -0.003 0.568 -0.219 0.000 0.025 0.265 -0.094 0.142 0.010 0.742 0.039 0.680∆CDSt-3 -0.0009 0.859 -0.103 0.005 -0.0007 0.907 -0.139 0.005 0.012 0.576 0.103 0.096 -0.038 0.217 0.138 0.144∆CDSt-4 -0.002 0.728 -0.158 0.000 -0.001 0.837 -0.177 0.000 -0.002 0.906 -0.157 0.008 -0.028 0.346 -0.103 0.268Const. -0.00083 0.199 0.0091 0.037 -0.0015 0.088 0.0141 0.057 0.0004 0.663 0.0009 0.753 -0.0003 0.796 -0.0064 0.160Obs. 839 839 475 475 237 237 127 127R2 0.0286 0.1425 0.0584 0.1654 0.0237 0.1538 0.1107 0.0980GC test --- 0.003 --- --- --- 0.000 0.012 ---
Dep.VarCoeff. p-val. Coeff. p-val. Coeff. p-val. Coeff. p-val. Coeff. p-val. Coeff. p-val. Coeff. p-val. Coeff. p-val.
Rt-1 0.053 0.178 -0.549 0.000 0.067 0.211 -0.388 0.068 - 0.017 0.818 -0.346 0.009 0.102 0.405 0.074 0.812Rt-2 -0.091 0.025 -0.206 0.096 -0.039 0.485 -0.138 0.534 -0.090 0.232 -0.033 0.808 -0.270 0.025 -0.129 0.673∆CDSt-1 -0.015 0.235 -0.227 0.000 -0.003 0.779 -0.398 0.000 -0.064 0.080 0.003 0.961 0.002 0.972 0.275 0.026∆CDSt-2 0.0006 0.957 -0.164 0.000 0.008 0.487 -0.280 0.000 - 0.009 0.811 0.111 0.090 - 0.050 0.294 -0.193 0.111Const. -0.00084 0.336 0.005 0.048 -0.0014 0.165 0.009 0.030 0.00099 0.553 0.00032 0.916 -0.002 0.376 0.0066 0.354Obs. 697 697 366 366 219 219 112 112R2 0.0127 0.0732 0.0074 0.1745 0.0180 0.0567 0.0515 0.0747GC test --- 0.000 --- --- --- 0.032 --- ---
Dep.VarCoeff. p-val. Coeff. p-val. Coeff. p-val. Coeff. p-val. Coeff. p-val. Coeff. p-val. Coeff. p-val. Coeff. p-val.
Rt-1 0.022 0.556 0.321 0.102 0.031 0.578 0.0002 0.997 0.021 0.729 1.118 0.069 -0.200 0.028 0.458 0.145Rt-2 -0.013 0.727 0.052 0.790 -0.039 0.489 -0.329 0.472 0.042 0.502 0.106 0.864 -0.067 0.461 0.142 0.652∆CDSt-1 -0.003 0.647 0.032 0.392 -0.021 0.753 -0.154 0.006 -0.002 0.758 0.036 0.562 -0.073 0.006 0.321 0.000∆CDSt-2 0.004 0.577 0.008 0.825 0.046 0.509 -0.007 0.901 0.003 0.670 0.014 0.822 0.025 0.339 -0.129 0.165Const. -0.0014 0.116 0.0056 0.227 -0.0039 0.015 0.0022 0.084 0.0008 0.502 0.0084 0.488 -0.00009 0.947 0.0029 0.561Obs. 717 717 316 316 261 261 140 140R2 0.0016 0.0045 0.0046 0.0251 0.0029 0.0131 0.0714 0.0916GC test --- --- --- --- --- --- 0.020 ---
Dep.VarCoeff. p-val. Coeff. p-val. Coeff. p-val. Coeff. p-val. Coeff. p-val. Coeff. p-val. Coeff. p-val. Coeff. p-val.
Rt-1 -0.027 0.567 -0.233 0.023 -0.041 0.701 -0.008 0.964 -0.032 0.627 -0.647 0.000 0.089 0.362 -0.236 0.299Rt-2 -0.086 0.073 -0.260 0.011 -0.196 0.065 -0.237 0.210 0.047 0.480 -0.397 0.018 0.031 0.756 0.065 0.778Rt-3 -0.096 0.045 -0.017 0.867 -0.118 0.268 0.048 0.799 -0.096 0.151 - 0.060 0.722 0.142 0.157 0.205 0.380Rt-4 0.185 0.000 -0.159 0.124 0.208 0.049 -0.222 0.239 0.111 0.100 -0.050 0.770 0.021 0.838 -0.128 0.603∆CDSt-1 0.029 0.527 0.031 0.513 0.079 0.186 0.090 0.394 0.022 0.398 -0.009 0.891 0.013 0.745 -0.235 0.012∆CDSt-2 -0.004 0.204 0.098 0.041 -0.053 0.389 0.022 0.839 0.042 0.104 0.072 0.276 -0.007 0.865 0.128 0.182∆CDSt-3 -0.021 0.871 0.057 0.218 0.007 0.907 -0.004 0.973 -0.018 0.470 0.127 0.043 -0.004 0.915 -0.014 0.886∆CDSt-4 0.014 0.342 -0.090 0.057 0.002 0.973 -0.196 0.068 0.011 0.648 -0.041 0.508 0.049 0.215 -0.213 0.021Const. -0.00059 0.514 0.0034 0.087 -0.00463 0.250 0.02091 0.004 0.00037 0.702 0.00118 0.630 0.00007 0.945 -0.0023 0.351Obs. 428 428 88 88 225 225 115 115R2 0.0635 0.0519 0.1406 0.0599 0.0495 0.0983 0.0487 0.1266GC test --- 0.017 --- --- --- 0.001 --- ---
Rt ∆CDStRt ∆CDSt Rt ∆CDSt Rt ∆CDSt
2007-2010 2007-2008United Kingdom
Rt
2007-2010 2007-2008∆CDSt Rt ∆CDSt
2010
Rt ∆CDSt Rt ∆CDSt
2009
∆CDSt
2010
2010Rt ∆CDSt Rt ∆CDSt Rt
France2009
Ireland2007-2010 2007-2008 2009
∆CDSt Rt
Rt ∆CDSt∆CDSt
Greece2007-2010 2007-2008 2009 2010
Rt ∆CDSt Rt ∆CDSt Rt

20
Table 3 continued.
Dep.VarCoeff. p-val. Coeff. p-val. Coeff. p-val. Coeff. p-val. Coeff. p-val. Coeff. p-val. Coeff. p-val. Coeff. p-val.
Rt-1 -0.039 0.260 -0.371 0.066 -0.064 0.169 -0.030 0.926 -0.008 0.905 -1.063 0.000 -0.071 0.451 0.222 0.462Rt-2 -0.057 0.099 -0.314 0.120 -0.091 0.050 -0.327 0.308 0.029 0.674 -0.110 0.555 -0.121 0.194 0.333 0.263Rt-3 -0.048 0.167 -0.379 0.062 -0.071 0.126 -0.516 0.109 0.013 0.849 -0.069 0.709 0.116 0.218 0.470 0.118Rt-4 0.087 0.014 -0.279 0.171 0.105 0.024 -0.301 0.354 0.110 0.106 -0.158 0.384 -0.043 0.652 0.085 0.780∆CDSt-1 - 0.002 0.747 -0.218 0.000 0.0006 0.923 -0.259 0.000 -0.006 0.816 0.005 0.934 -0.066 0.020 0.374 0.000∆CDSt-2 -0.007 0.250 -0.008 0.808 -0.009 0.182 -0.038 0.431 0.041 0.078 0.043 0.493 -0.029 0.338 0.080 0.396∆CDSt-3 -0.003 0.615 -0.145 0.000 -0.006 0.345 -0.171 0.000 0.014 0.522 0.054 0.350 0.026 0.373 -0.149 0.116∆CDSt-4 0.002 0.738 -0.110 0.002 0.0003 0.963 -0.126 0.008 0.0006 0.975 -0.086 0.115 0.006 0.836 0.070 0.444Const. -0.00029 0.630 0.0057 0.110 -0.00097 0.261 0.0087 0.147 0.00071 0.535 0.0019 0.545 0.00036 0.753 0.0028 0.442Obs. 830 830 467 467 236 236 127 127R2 0.0161 0.0721 0.0328 0.0938 0.0260 0.1595 0.0885 0.1963GC test --- 0.051 --- --- --- 0.000 0.068 ---
2007-2008 2009 2010Rt ∆CDStRt ∆CDSt Rt ∆CDSt Rt ∆CDSt
2007-2010Germany

21
Table 4: Aggregate lead-lag analysis with fixed-effects panel regressions
For each market (stock and CDS) we estimate fixed panel regressions to study aggregate lead lag relationship across markets. We report coefficients and p-values from fixed-effects models. For each of the two equations in each panel we show the overall R2 (which is close to the within R2). We show three tables: first refers to seven countries (we exclude United Kingdom because of its coin which is different from euro), second and third refers to European countries with lower (France and Germany) and higher (Spain, Portugal, Italy, Greece and Ireland) spreads.
All the countries
Dep.VarCoeff. p-val. Coeff. p-val. Coeff. p-val. Coeff. p-val. Coeff. p-val. Coeff. p-val. Coeff. p-val. Coeff. p-val.
Rt-1 -0.015 0.270 -0.317 0.000 -0.036 0.045 -0.247 0.004 0.020 0.424 -0.366 0.004 -0.095 0.021 0.262 0.059Rt-2 -0.079 0.000 -0.124 0.054 -0.125 0.000 -0.230 0.008 0.022 0.390 -0.085 0.504 -0.099 0.015 0.208 0.134Rt-3 -0.048 0.001 0.054 0.406 -0.079 0.001 -0.110 0.218 -0.023 0.368 0.101 0.427 -0.031 0.446 0.463 0.001Rt-4 0.059 0.002 0.012 0.856 0.075 0.002 -0.154 0.084 0.092 0.000 -0.016 0.901 -0.014 0.731 0.346 0.012Rt-5 -0.092 0.003 -0.006 0.928 -0.169 0.003 -0.163 0.072 -0.003 0.914 0.229 0.072 0.019 0.642 0.071 0.610∆CDSt-1 -0.007 0.008 -0.176 0.000 -0.005 0.227 -0.334 0.000 -0.003 0.508 0.018 0.476 -0.077 0.000 0.282 0.000∆CDSt-2 -0.005 0.063 -0.043 0.002 -0.010 0.012 -0.131 0.000 0.004 0.456 -0.0003 0.988 0.018 0.134 -0.080 0.052∆CDSt-3 -0.003 0.214 -0.030 0.029 -0.009 0.038 -0.090 0.000 -0.0008 0.872 0.031 0.217 -0.033 0.006 0.017 0.675∆CDSt-4 0.005 0.100 -0.085 0.000 -0.005 0.178 -0.127 0.000 0.011 0.030 -0.029 0.243 0.050 0.000 -0.144 0.000∆CDSt-5 0.000 0.974 -0.033 0.014 -0.002 0.660 -0.066 0.000 0.0008 0.856 -0.022 0.376 -0.019 0.097 0.095 0.018Const. -0.00088 0.001 0.0065 0.000 -0.002 0.000 0.0096 0.000 0.0007 0.115 0.003 0.211 -0.00094 0.147 0.006 0.011Obs. 5423 5506 2938 2990 1625 1647 860 869R2 0.0208 0.0369 0.0519 0.1062 0.0118 0.0111 0.0956 0.1477
European countries with lower spreads
Dep.VarCoeff. p-val. Coeff. p-val. Coeff. p-val. Coeff. p-val.
Rt-1 -0.040 0.107 -0.632 0.000 -0.060 0.430 -0.111 0.655Rt-2 -0.066 0.009 -0.383 0.003 -0.077 0.307 0.348 0.164Rt-3 -0.083 0.001 -0.127 0.330 0.042 0.570 0.376 0.129Rt-4 0.094 0.000 -0.231 0.077 -0.089 0.242 0.148 0.552Rt-5 -0.090 0.000 -0.241 0.065 0.058 0.441 0.058 0.816∆CDSt-1 -0.008 0.074 -0.324 0.000 -0.073 0.001 0.215 0.004∆CDSt-2 -0.007 0.171 -0.132 0.000 0.031 0.178 -0.041 0.586∆CDSt-3 -0.007 0.195 -0.082 0.002 -0.033 0.144 0.054 0.472∆CDSt-4 -0.003 0.581 -0.172 0.000 0.029 0.211 -0.152 0.043∆CDSt-5 0.003 0.524 -0.087 0.000 -0.033 0.894 0.135 0.066Const. -0.00099 0.034 0.0078 0.001 -0.0009 0.440 0.005 0.171Obs. 1639 1661 250 252R2 0.0320 0.1117 0.0913 0.1091
European countries with higher spreads
Dep.VarCoeff. p-val. Coeff. p-val. Coeff. p-val. Coeff. p-val.
Rt-1 -0.019 0.302 -0.439 0.000 -0.083 0.147 0.431 0.031Rt-2 -0.121 0.000 -0.190 0.013 -0.118 0.040 0.128 0.521Rt-3 -0.048 0.009 -0.023 0.774 -0.083 0.144 0.583 0.003Rt-4 0.043 0.022 -0.032 0.686 -0.010 0.858 0.339 0.086Rt-5 -0.125 0.000 -0.016 0.841 0.003 0.953 0.171 0.392∆CDSt-1 -0.012 0.005 -0.197 0.000 -0.078 0.000 0.332 0.000∆CDSt-2 -0.013 0.003 -0.063 0.001 0.011 0.507 -0.104 0.074∆CDSt-3 -0.007 0.131 -0.058 0.002 -0.042 0.012 0.050 0.389∆CDSt-4 0.004 0.398 -0.084 0.000 0.059 0.000 -0.162 0.005∆CDSt-5 -0.005 0.217 -0.043 0.020 -0.032 0.050 0.132 0.021Const. -0.0006 0.080 0.006 0.000 -0.0012 0.198 0.006 0.055Obs. 3070 3131 470 477R2 0.0328 0.0463 0.1153 0.1727
2007-2010 2010Rt ∆CDSt Rt ∆CDSt
Rt ∆CDSt
2007-2010Rt ∆CDSt
2010Rt ∆CDSt
Rt ∆CDSt
2007-2010 2007-2008 2009 2010Rt ∆CDSt Rt ∆CDSt

22
Figure 1: Daily time series from Spain Sovereign CDS spread vs. IBEX 35 return
Figure 2: Daily time series from Italy Sovereign CDS spread vs. FTSE MIB return


![VACA [Autosaved]](https://static.fdocuments.in/doc/165x107/56d6bd261a28ab30168cd384/vaca-autosaved.jpg)


