The Relationship between R&D Spending and the Earnings ...
29
Working Paper 125 The Relationship between R&D Spending and the Earnings Management of Japanese Electronics Companies - A case of earnings management through real management activity- Yoshihiro Tokuga Graduate School of Management, Kyoto University Shin Tanaka Graduate School of Health Care Sciences, Jikei institute November 2011
-
Upload
truongxuyen -
Category
Documents
-
view
217 -
download
2
Transcript of The Relationship between R&D Spending and the Earnings ...

Working Paper 125
The Relationship between R&D Spending
and the Earnings Management of
Japanese Electronics Companies
-A case of earnings management through real
management activity-
Yoshihiro Tokuga
Graduate School of Management,
Kyoto University
Shin Tanaka
Graduate School of Health Care Sciences,
Jikei institute
November 2011

The Relat ionship between R&D Spending and the Earnings
Management of Japanese Electronics Companies
-A case of earnings management through real management act ivity-
Yoshihiro TOKUGA1
Shin TANAKA2
ABSTRACT
Japanese companies have been prohibited from using accrual manipulat ion
for R&D since 1999; however, many Japanese companies had not used accrual
manipulat ion even before 1999. Many companies (more than 90%) had
expensed all of R&D spending when it occurred because of tax benef its,
despite the fact that they could have used accrual manipulat ion of R&D
spending based on the exist ing accounting rules. Therefore, Japanese f irms
would seem to have, in general, used real manipulat ion to (A) increase or
decrease R&D spending, and/or (B) to change the content of R&D to gain
target results within the short-term.
1 Professor o f Account ing, Graduate School o f Management, Graduate School o f Economics Kyoto Universi ty
2 Assoc ia te Professor , Graduate School o f Heal th Care Sc iences, J ike i ins t i tu te

Using the f inancial data from 1980 to 2006 of Japanese electronics
companies, this paper shows two kinds of evidence that managers adjusted the
amount of R&D spending for all periods according to their expected income and
that since 2000 they have tr ied to shorten the term in which the benef it of their
R&D spending was realized to improve short-term performance.
To determine the amount and/or the content of R&D spending for the
purpose of gaining a short-term benef it can result in the loss of opportunit ies to
gain greater long-term benef its.
ⅠⅠⅠⅠ Introduction
Japanese f irms, in general, consistent ly increased their R&D spending from
the end of World War II to 1991. Japanese managers stated, and believed,
that increasing R&D investment was their obligat ion, regardless of the effect
on the short-term performance of their f irm. However, R&D decreased for the
f irst t ime in 1992, just after the burst of the economic bubble in Japan. From
that t ime unti l 1999, Japanese managers, according to Mande et al. [2000],
made optimal allocat ions to R&D. As a result , even in 2005, the R&D spending

of Japanese f irms has been ranked number two in the world.
Japanese companies have been prohibited from using accrual manipulat ion
for R&D since 1999. However, many Japanese companies had not used
accrual manipulat ion even before 1999 because of tax benef its, despite the
fact that they could have used it for R&D spending based on the exist ing
accounting rules. Therefore, Japanese f irms would seem to have generally
used real manipulat ion: (A) increase or decrease R&D spending and/or (B)
change the content of R&D to meet short-term target results.
This paper shows empir ical evidence that Japanese electronics companies
have used real manipulat ion, especially changes in the content of their
investment, regardless of changes in the accounting rules.
ⅡⅡⅡⅡ R&D investment by Japanese electronics companies
Graph No.1 shows the t ime series change in R&D investment for the leading
Japanese electronics companies. The historical change of R&D investment by
the electronics industry in Japan is almost the same as that of Japanese f irms
in general. The amount of R&D spending grew continuously during the period

between 1980 and 1991. After 1992, although the total amount of R&D
spending of al l electronics companies was growing, the t ime series change
became errat ic, depending on the f irm. Moreover, companies can be divided
into two groups based on their tendencies in R&D spending after 1997; some,
such as Fuj itsu and NEC, have decreased it and others, such as Panasonic and
Sony, have increased it regardless of their performance. As graph 2 makes
clear, the Japanese electronics industry, including Panasonic and Sony, fel l
into a cr it ical situat ion from 2000 to 2001.
【Graph 1】
図表Ⅳ-1.研究開発投資額の時系列変化
0
100000
200000
300000
400000
500000
600000
1980
1982
1984
1986
1988
1990
1992
1994
1996
1998
2000
2002
2004
東芝
三菱
NEC
富士通
松下
シャープ
ソニー
パイオニア
-R&D Spending in the Japanese Electronics Industry-
Toshiba
Mitsubishi
NEC
Fujitsu
Panasonic
Sharp
Sony
Pioneer

Table 1 shows that Japanese companies, except for those in the chemical
and text i le industr ies, increased R&D spending from 1991 and 2004,. Although
the growth rate of R&D spending by the electronics industry decreased
between 1991 and 2004, the actual amount of R&D spending by the electronics
industry consistent ly increased.
【【【【Table 1】】】】
Graph 2 shows the histor ical change of the operat ing income per sales rat io,
after adjust ing for inf lat ion, of Japanese companies. The red l ine represents
the electronics industry, the blue l ine represents the automobile industry, and
the black l ine represents all industr ies. We can see that this rat io has been
decreasing, by and large, despite a continuous increase of R&D spending, as
1981-90 1991-00 2001-04 2005-06
Pharmaceutical (9.4) 8.6 3.5 6.0 12.5
Electronics (5.5) 12.4 1.7 0.8 5.1
Transportation
Equipment (4.2) 9.4 0.2 6.6 11.3
Machinery (3.7) 9.5 2.9 3.9 8.3
Chemistry (3.7) 7.4 -0.5 -0.4 7.4
Textile (1.7) 8.0 -1.5 -15.2 11.8
Growth Rate of Industry-classified R&D

【【【【Graph 2】】】】
Declining Tend of Operating Income /
Sales Ratio for Japanese Manufactures
65656565 67676767 69696969 71717171 73737373 75757575 77777777 79797979 81818181 83838383 85858585 87878787 89898989 91919191 93939393 95959595 97979797 99999999 01010101 03030303 05050505
Source: Nobeoka[2007]
Electronics
Automobile
All Industries
shown in table 1. Notably, the income of the electronics industry plunged from
2000 to 2001, which is very important to our research.
ⅢⅢⅢⅢ Previous Research and Hypothesis
1. Management Short-term decision-making and R&D Spending
Inst itut ional investors (especially, mutual fund investors) reward short-term
performance with large investment inf lows. Fund managers facing strong
performance-related f lows have been shown to focus more on short horizon
investments: The fund manager’s investment horizons are driven by the short

horizons of their investors. Based on Suto et al. [2005], Japanese inst itut ional
investors in 2004 were much more myopic than their American counterparts. In
Japan, about three fourths of the inst itut ional investors planned to buy and sell
within six months, compared to only one fourth in the US. Pressure from the
capital market tends to make managers become myopic.
Notably, Bushee [1998] examined, in the U.S., whether or not inst itut ional
investors create or reduce incentives for corporate managers to reduce
investment in R&D. He found that a large proport ion of ownership by
inst itut ions signif icant ly increased the probabil i ty that managers would reduce
R&D to reverse an earnings decline. This was especially the case if they had
high portfol io turnover and engaged in momentum trading,
2. Accrual and real manipulation
It is generally accepted that there are two kinds of manipulat ion, accrual and
real. Accrual manipulat ion means "accrual-based earnings management"…"to
change the t iming of a presentat ion" (Shipper [1989]). Roychowdhury [2006]
refers to it as “earnings management through accrual manipulat ion.” Real

manipulat ion means "real earnings management"… "to change the t iming of a
transact ion" (Shipper [1989]). Roychowdhury [2006] dif ferent ly postulates it as
“earnings management through real act ivit ies.” Shipper's conception is too
narrow. Real manipulat ion should include not only changes in the t iming of
R&D spending but also the discontinuation of a planned transact ion and/or the
change of the content of a transact ion to meet short-term earnings goals if the
part done through a manager's real act ivity is important for i ts conception.
Managers use both accrual and real manipulat ion to improve short-term
performance.
Japanese f irms have been prohibited from using R&D spending as a deferred
asset since 1999. Even previous to 1999, they had not deferred R&D spending
because of tax benefits. For example, only 5 of the 53 electronics f irms had
used R&D spending as a deferred asset before 1998. Thus, most Japanese
f irms may have used only real manipulat ion in their earnings management. To
attain a short-term performance gain, a f irm might adopt two methods, used
alternat ively or simultaneously, to meet their target performance; ① adjust
( increase or decrease) R&D spending, or ② change the content of R&D.
Previous studies have documented that R&D spending is both an impetus for
the growth of the f irm and a source of competit ive advantage (Ett l ie [1998]; Lev
and Sougiannis [1996]). However, managers may reduce R&D spending to
opportunist ically boost short-term performance (Bushee [1998]).
3. The Horizon and Myopia Problems
Past empir ical research has presented evidence for the existence of a
“Horizon Problem” and a “Myopia Problem” for R&D Investment.
Dechow and Sloan [1991] reported that opportunist ic reduct ions in R&D
spending become more l ikely when the CEO approaches ret irement. This so
called “Horizon Problem” is not covered in this paper.
The “Myopia Problem” is as fol lows; Opportunist ic reduct ions in R&D
spending become more l ikely when the f irm faces a small earnings decline or a
small loss. Mande et al. [2000] attempted to determine the relat ionship
between income smoothing and the discret ionary R&D expenditure of
Japanese f irms. They tested whether or not Japanese managers adjusted R&D
based on short-term performance. Their results show that Japanese f irms in

several industr ies adjust their R&D budgets to smooth prof its. Interest ingly,
adjustments to R&D are larger in expansion years. These results point to
short-term decision making by Japanese managers that is similar to that
documented for U.S. managers.
Based on the above discussion, our null hypotheses are as fol lows;
H1. Managers do not adjust R&D spending to improve short-term
performance.
H2. Managers do not change the content of R&D spending to improve
short-term performance.
ⅣⅣⅣⅣ Analytical Method
Previous research dealt with the regressional relat ionship between R&D
investment and sales or operat ing income without considering a t ime lag or
with a f ixed t ime lag. Therefore, we attempted to determine whether or not an
increase or decrease of R&D investment causes an increase or decrease of
operat ing income by incorporat ing a f lexible t ime lag. More concretely, we
determined the relat ionship between current performance and investment in

R&D at t-1, then worked backwards for each successive year unt i l the
relat ionship lost stat ist ical signif icance. We then repeated the same process in
regards to the performance of each year, proceeding from t-1 backwards.
OI t = ß0 RD t + ß1 RD t-1 + ß2 RD t-2 +・・・・・・・+ ßk RD t-k + u t
Pt may be the result of the R&D of t-1,t-2, t-3, and so on. To the contrary,
R&D t-4 may have an inf luence on the P of t-3, t-2, t-1, and so on.
The problem with the est imation of this equation is that because of the high
correlat ions between RDt and its lagged values, we do not get reliable
est imates of the parameter ß i, the so-called mult icolinearity problem. Irving
Fisher [1937] assumed the ß i to decline arithmetically and S. Almon [1965]
generalized this to the case where the ß i fol low a polynomial of degree r in i .
(1) Pt vs. R&Dt-1, R&Dt-2, R&Dt-3, R&Dt-4 ・・・・・・・・・・・・・・・・・・・・
R&Dt-4 R&Dt-3 R&Dt-2 R&Dt-1 Pt
t-4 t-3 t-2 t-1 t t+1
(2) R&Dt-4 vs. Pt-3, Pt-2, Pt-1, ・・・・・・・・・・・・・・・・・・・・
Pt-4 Pt-3 Pt-2 Pt-1 Pt
t-4 t-3 t-2 t-1 t t+1
R&Dt-4
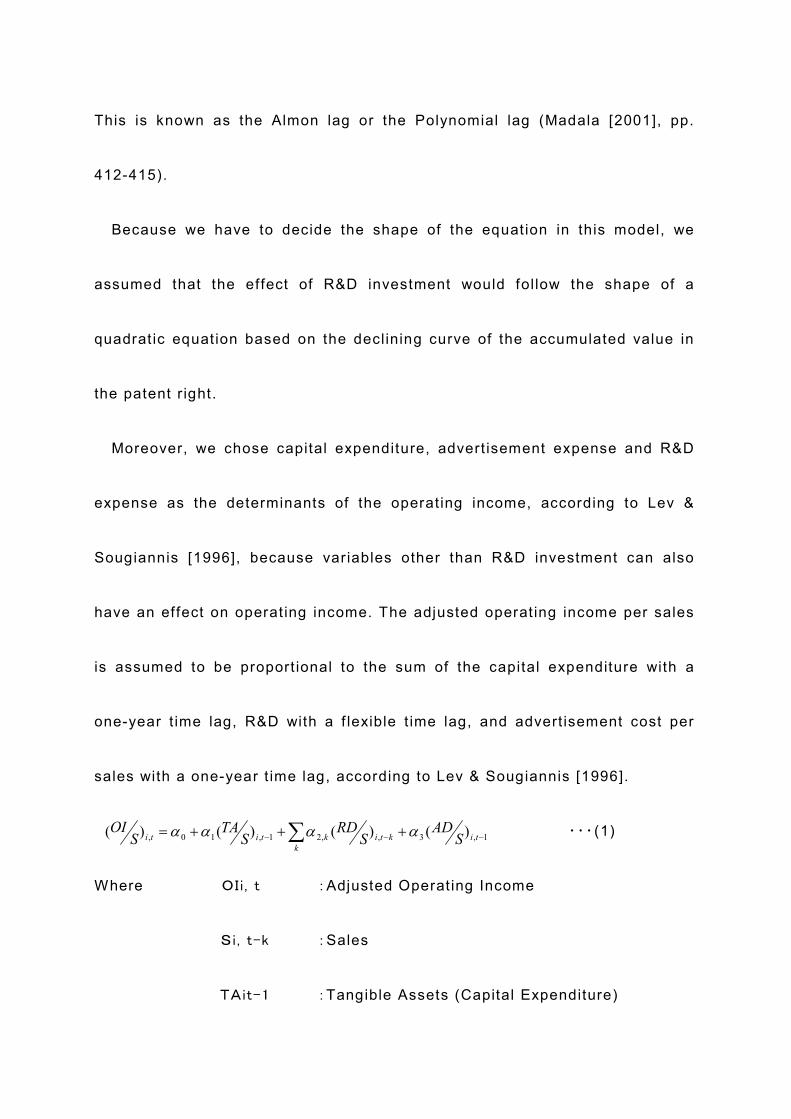
This is known as the Almon lag or the Polynomial lag (Madala [2001], pp.
412-415).
Because we have to decide the shape of the equation in this model, we
assumed that the effect of R&D investment would fol low the shape of a
quadrat ic equation based on the declining curve of the accumulated value in
the patent r ight.
Moreover, we chose capital expenditure, advert isement expense and R&D
expense as the determinants of the operat ing income, according to Lev &
Sougiannis [1996], because variables other than R&D investment can also
have an effect on operat ing income. The adjusted operat ing income per sales
is assumed to be proport ional to the sum of the capital expenditure with a
one-year t ime lag, R&D with a f lexible t ime lag, and advert isement cost per
sales with a one-year t ime lag, according to Lev & Sougiannis [1996].
・・・(1)
Where OIi, t :Adjusted Operat ing Income
Si, t-k :Sales
TAit-1 :Tangible Assets (Capital Expenditure)
1,3,,21,10, )()()()(−−−
+++= ∑ ti
k
ktiktiti SAD
SRD
STA
SOI αααα

RDi, t-k :R&D Spending
ADi, t-1 :Advert isement Expense
To verify Hypothesis 1, reverse regression of the mult iple regression
equation (1) is needed, as fol lows;
・・・(2)
Where OIi, t :Adjusted Operat ing Income
Si, t-k :Sales
TAi, t-1 :Tangible Assets (Capital Expenditure)
RDi, t-k :R&D Spending
ADi, t-1 :Advert isement Expense
To verify Hypothesis 2, mult iple regression equation (1) was used.
ⅥⅥⅥⅥ Analysis and Results
1. Sample
Although the number of Japanese electronics companies l isted on the First
Sect ion of the Tokyo Stock Exchange has varied from 140 to 150, the number
of companies for which a complete data set was available for the period from
1,3,,21,10, )()()()(−−−
+++= ∑ ti
k
ktiktiti SAD
SOI
STA
SRD αααα

1980 to 2005 was 533 in the AMSUS data base (Nikkei Quick Co.)4.
2. Results
H1. Managers do not adjust R&D spending to improve short-term performance.
H2. Managers do not change the content of R&D spending to improve
short-term performance.
For Hypothesis 1, we determined the relat ionship between the R&D
investment of each previous year and the adjusted operat ing income of each
year using mult iple regression equation (2), while controll ing for the effects of
capital expenditure and advert isement act ivity. Concerning Hypothesis 1, the
result of the Polynomial regression is as fol lows;
3 The names of the companies and the i r descrip t ive s ta t is t ics are shown at the end of the
paper . Al l 53 companies have been l is ted on the f i rs t sec t ion o f Tokyo Stock Exchange. 53 is
a suf f ic ient sample s ize for our mul t ip le regress ions.
4 AMSUS is a f inanc ia l data base which Nikke i Quick Co. provides. ht tp : / /corporate .qu ick.co. jp /serv ice/product /amsus_market .h tml

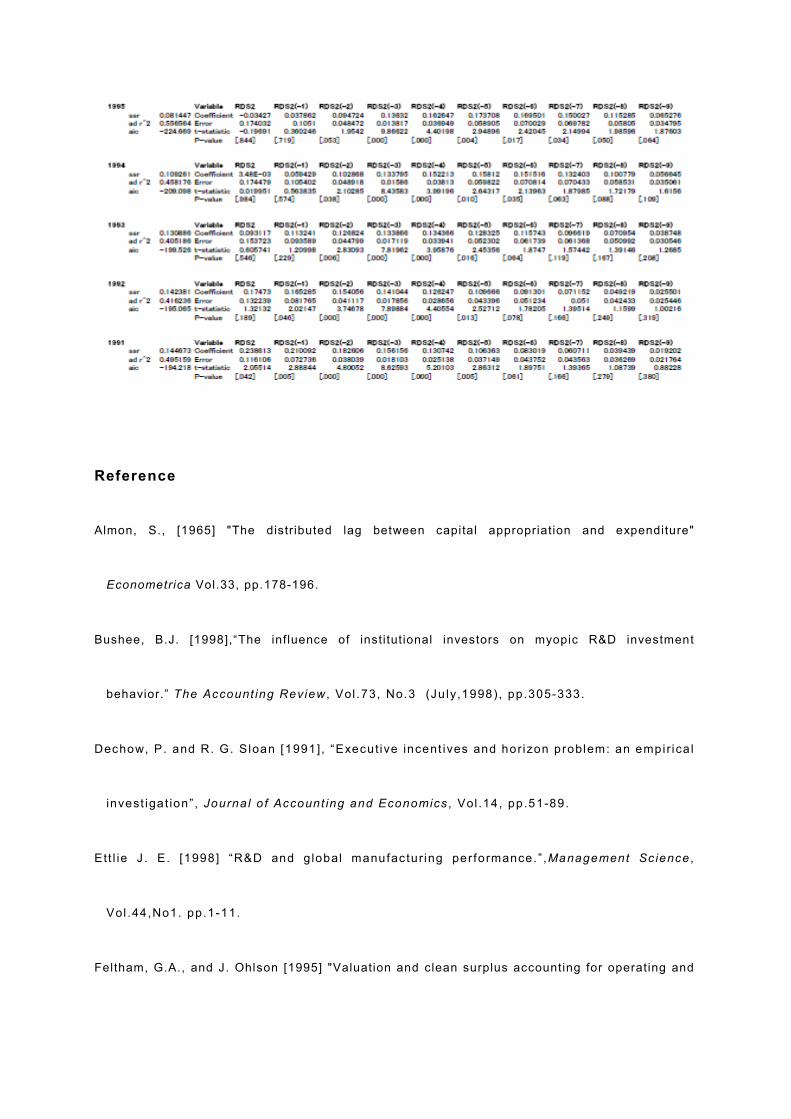
【【【【 table 2.】】】】 (See the result of the analysis 1 at the end of this paper)
AIC represents Akaike Information Criter ia5.
Investment in R&D was shown to be strongly inf luenced by the operat ing
income through all periods analyzed, at a signif icance level less than 1 %. The
length of the t ime lag was one (current period) or two years (one year
previously), except for 2005.
Next, we analyzed the relat ionship between the adjusted operat ing income of
each year and the R&D investment of each previous year using mult iple
regression equation (1), while controll ing for the effects of capital expenditure
and advert isement act ivity, Concerning Hypothesis 2, the result of the
Polynomial regression is as fol lows;
5 Two cr i ter ia are of ten used to re f lec t the c loseness of f i t and the number o f parameters
es t imated. One is the Akaike in format ion cr i ter ion (AIC), and the o ther is the Bayes ian in format ion cr i ter ion (BIC). AIC is a more genera l c r i ter ion that can be appl ied to any model that can be es t imated by the method of maximum l ike l ihood. See Maddala [2005] , pp. 485, 488, 525.
1991 1992 1993 1994 1995 1996 1997 1998 1999 2000 2001 2002 2003 2004 2005
Time Lag 1 1 2 2 2 1 1 1 2 2 2 2 2 2 3
Significance
Level0.002 0.009 0.003 0.006 0.003 0.000 0.003 0.008 0.001 0.002 0.003 0.001 0.002 0.007 0.001
AIC 3.158 2.645 3.017 2.797 3.087 3.874 3.077 2.698 3.346 3.177 3.034 3.329 3.249 2.734 3.494

【【【【 table 3.】】】】 (See the result of the analysis 2 at the end of this paper)
1991199119911991 1992199219921992 1993199319931993 1994199419941994 1995199519951995 1996199619961996 1997199719971997 1998199819981998 1999199919991999 2000200020002000 2001200120012001 2002200220022002 2003200320032003 2004200420042004 2005200520052005
Time Lag 2 3 3 4 4 3 4 4 4 1 1 1 1 1 1
Significance
Level0.005 0.000 0.006 0.000 0.000 0.000 0.000 0.000 0.000 0.009 0.000 0.000 0.000 0.000 0.000
AIC 4.801 3.747 2.831 8.436 9.866 3.910 8.389 7.027 5.523 2.648 3.611 4.025 4.278 3.895 3.722
Duration of
Effect (year)5 3 3 3 3 4 2 2 1 4 4 4 4 4 4
The result of investment in R&D was found to be ref lected in the operat ing
income after a t ime lag through all periods, at a signif icance level of less than
1 %. The length of the t ime lag was three or four years before 1999, but it
decreased to one year after 2000 and continued as such unti l 2005.
3. Implications
First ly, Hypothesis 1 "Managers do not adjust R&D spending to improve
short-term performance" was stat ist ically rejected. This shows that managers
engaged in earnings management that included adjustments to R&D spending.
Secondly, Hypothesis 2 "Managers do not change the content of R&D
spending to improve short-term performance" was also stat ist ically rejected.
This indicates the possibil i ty that corporate managers changed the content of

R&D spending after the cr isis in the Japanese electronics industry to create
short-term performance improvements.
Thirdly, we found empir ical evidence that corporate managers have adopted
two kinds of real R&D spending manipulat ion. Corporate managers have
adjusted R&D spending and at the same t ime may have changed the content of
R&D spending to improve short-term performance.
4. Limitations
A problem may exist concerning the second hypothesis. We cannot conclude
without a doubt that the decrease in the period of the t ime lag was due solely to
the myopic decisions of management because there is the possibil i ty that the
decrease was due to reduced product l ife cycles brought about by rapid
technological innovation. However, there is collateral evidence indicat ing that
Japanese electronics companies pulled the tr igger and made strategic changes
in the content of R&D when the electronics industry fel l into a cr it ical situat ion
from 2000 to 2001.
ⅥⅥⅥⅥ Conclusion
Japanese companies have been prohibited from using accrual manipulat ion
for R&D since 1999; however, many Japanese companies had not used accrual
manipulat ion even before 1999 because of tax benefits, despite the fact that
they could have used it for R&D spending based on the exist ing accounting
rules. This indicates that Japanese f irms generally used real manipulat ion by
(A) increasing or decreasing R&D spending and/or by (B) changing the content
of R&D to meet their short-term target results. This paper shows empir ical
evidence that Japanese electronics companies have used real manipulat ion
regardless of changes in the accounting rules.
First ly, R&D investment was both an impetus for growth and a source of
competit ive advantage, as shown by the stat ist ically meaningful relat ionship
between R&D spending and adjusted operat ing income during the period of our
analysis (see Table 3). This result coincides with the results of previous
studies by Ett l ie [1998] and Lev and Sougiannis [1996].
Secondly, R&D investment was adjusted ( increased or decreased) by the
current or past adjusted operat ing income, as shown by the stat ist ically
meaningful relat ionship concerning the inf luence from operat ing income on
R&D spending during the period of our analysis (see Table 2). Our results
show that adjustment of R&D spending has been a means of real earnings
management by Japanese Electronics companies.
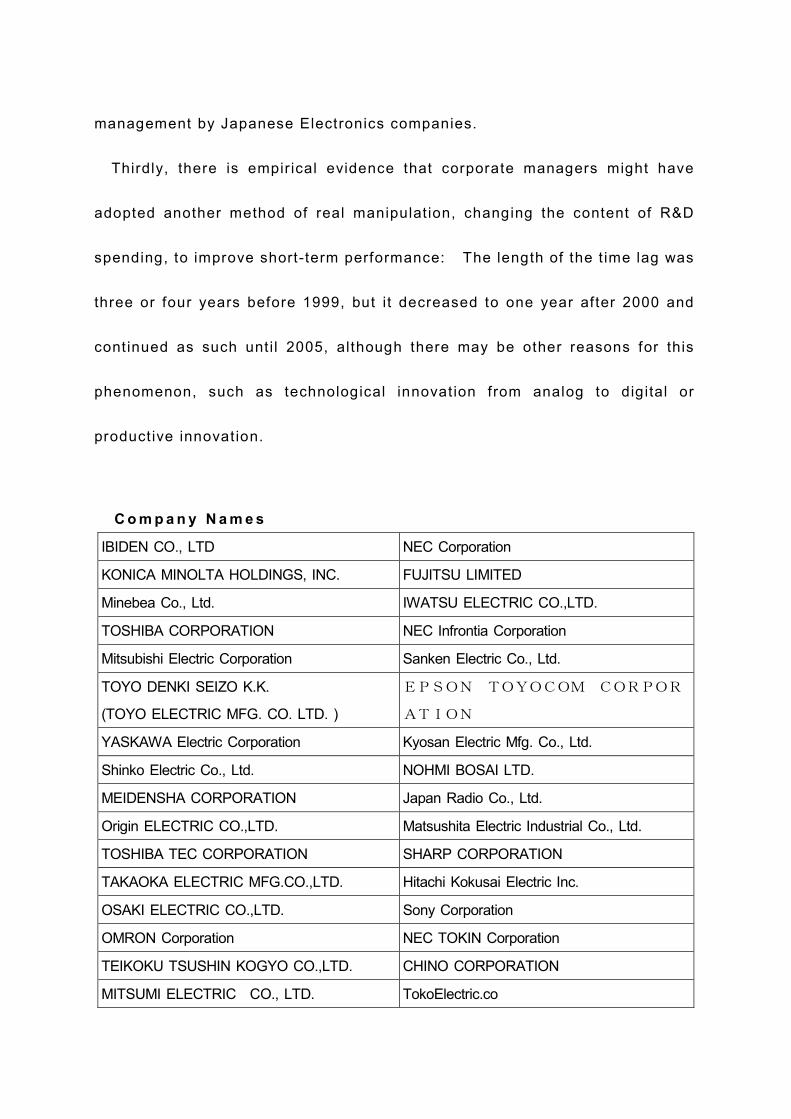
Thirdly, there is empir ical evidence that corporate managers might have
adopted another method of real manipulat ion, changing the content of R&D
spending, to improve short-term performance: The length of the t ime lag was
three or four years before 1999, but it decreased to one year after 2000 and
continued as such unti l 2005, although there may be other reasons for this
phenomenon, such as technological innovation from analog to digital or
productive innovation.
C o m p a n y N a m e s
IBIDEN CO., LTD NEC Corporation
KONICA MINOLTA HOLDINGS, INC. FUJITSU LIMITED
Minebea Co., Ltd. IWATSU ELECTRIC CO.,LTD.
TOSHIBA CORPORATION NEC Infrontia Corporation
Mitsubishi Electric Corporation Sanken Electric Co., Ltd.
TOYO DENKI SEIZO K.K.
(TOYO ELECTRIC MFG. CO. LTD. )
EPSON TOYOCOM CORPOR
ATION
YASKAWA Electric Corporation Kyosan Electric Mfg. Co., Ltd.
Shinko Electric Co., Ltd. NOHMI BOSAI LTD.
MEIDENSHA CORPORATION Japan Radio Co., Ltd.
Origin ELECTRIC CO.,LTD. Matsushita Electric Industrial Co., Ltd.
TOSHIBA TEC CORPORATION SHARP CORPORATION
TAKAOKA ELECTRIC MFG.CO.,LTD. Hitachi Kokusai Electric Inc.
OSAKI ELECTRIC CO.,LTD. Sony Corporation
OMRON Corporation NEC TOKIN Corporation
TEIKOKU TSUSHIN KOGYO CO.,LTD. CHINO CORPORATION
MITSUMI ELECTRIC CO., LTD. TokoElectric.co

TAMURA Corporation IWASAKI ELECTRIC CO., LTD.
IKEGAMI TSUSHINKI CO.,LTD. Ushio Inc.
PIONEER CORPORATION Shin-Kobe Electric Machinery Co. ,Ltd.
Victor Company of Japan, Limited (JVC) CASIO COMPUTER CO.,LTD.
Foster Electric Company, Limited Nihon Inter Electronics Corporation
Clarion Co., Ltd. Nippon Chemi-Con Corporation.
TOKO,INC. ICHIKOH INDUSTRIES,LTD.
Hoshiden Corporation KOITO MANUFACTURING CO., LTD.
HIROSE ELECTRIC CO.,LTD. DAINIPPON SCREEN MFG. CO., LTD.
Japan Aviation Electronics Industry, Limited Canon Inc.
Hitachi Maxell, Ltd. Ricoh Company, Ltd.
Shindengen Electric Manufacturing Co., Ltd. NIDEC SANKYO CORPORATION


Reference
Almon, S., [1965] "The distributed lag between capital appropriation and expenditure"
Econometrica Vol.33, pp.178-196.
Bushee, B.J. [1998],“The influence of institutional investors on myopic R&D investment
behavior.” The Account ing Review , Vol .73, No.3 (Ju ly,1998) , pp.305-333.
Dechow, P. and R. G. Sloan [1991], “Execut ive incent ives and horizon problem: an empi r ica l
invest igat ion” , Journa l o f Account ing and Economics , Vol .14, pp.51-89.
Ett l ie J . E. [1998] “R&D and g lobal manufactur ing per formance.” ,Management Sc ience ,
Vol .44,No1. pp.1-11.
Feltham, G.A., and J. Ohlson [1995] "Valuation and clean surplus accounting for operating and
f inancial activit ies, Contemporary Accounting Research , Vol.11, pp.689-732.
Gril iches, Z. [1980], "Returns to Research and Development Expenditures in the Private
Sector," in Kendrick, J. W. and B. N. Vaccara, eds., New Developments in Productivity
Measurement and Analysis, The University of Chicago Press .
Healy, P. M.[2002], “R&D Accounting and the Tradeoff between Relevance and Objectivity,”
Journal of Accounting Research , Vol.40, No.3, pp.677-711.
Lev, B and T. Saugianis [1996], "The Capital ization , Amortization, and Value-Relevance of R&D,
" Journal of Accounting and Economics , No.21, pp.107-138.
Lev, B[2004], "Sharpening the Intangibles Edge," Harvard Business Review, Vol.82, Issue 6,
pp.109-116.
Maddala,G.S., [1977] "Econometrics -International edit ion-" McGraw-Hil l .
Mande, V., R. G. File, and W. Kwak [2000], “Income smoothing and discretionary R&D
expenditures of Japanese firms.”,Contemporary Accounting Research , Vol.17,No.2,
pp.263-302.
Nishimura, Y. [2001], R&D Strategy and Accounting , Hakuto-shobo.
OECD [2001], The New Economy: Beyond the Hype , OECD Publications.
Pakes, A and M. Schankerman[1984], “The Rate of Obsolescence of Knowledge, Research

Gestation Lags, and the Private Rate of Return to Research Resources,” NBER Working Paper,
No.346, National Bureau of Economic Research, Inc.
R o y c h o w d h u r y , S [ 2 0 0 6 ] “ E a r n i n g s m a n a g e m e n t t h r o u g h r e a l a c t i v i t i e s
m a n i p u l a t i o n . ” , J o u r n a l o f A c c o u n t i n g a n d E c o n o m i c s , V o l . 4 2 , p p . 3 3 5 - 3 7 0 .
Sakakibara, K. and M. Tsujimoto [2003], “Why did the Efficiency of Japanese Companies’ R&D
decrease ?,” Economic and Socia l Research Inst i tute.
Shipper , K. [1989] “Commentary on earnings management . ” , Account ing Hor i zons , Vo l .3 ,
pp.91-102.
Suto,M. , L.Menkhof f , and D. Beckmann[2005] ,"Behaviora l b iases of ins t i tu t ional investors
under pressure f rom customers:
Japan and Germany vs . the US." , W IF-05-006,Waseda Universi ty
Suto, M and M. Toshino. "Behavioral B iases of Japanese Ins t i tu t iona l Investors: fund
management and corporate governance” , Corporate Governance: An In ternat iona l Rev iew ,
Vol .13, No.4, 2005, pp.466-477.
Yaekura, T. , “The Relat ionship between Cost A l locat ion of R&D Investment and Future
Per formance,” K. I to Ed. Account ing for In tangib les , 2006, pp. 317-337, Hakuto-shobo.

Ac k n ow l e d g m e n t s
W e a r e t h a n k f u l f o r t h e c ommen t s a n d s u g g e s t i o n s o f t h e
p a r t i c i p a n t s a t a w o r k s h o p a t t h e N a t i o n a l T a i w a n U n i v e r s i t y o n t h e
2 n d o f F e b r u a r y , 2 0 0 8 i n wh i c h w e m a d e a p r e s e n t a t i o n c o v e r i n g t h e
s ame t o p i c a s t h i s p a p e r. Sp e c i a l t h a n k s g o t o P r o f e s s o r s S . L i , J .
T s a y , C . L i n , K . C h e n , a n d C . W a ng .