Do Tax Evaders Manage Earnings More? - DiVA portal823897/FULLTEXT01.pdf · Do Tax Evaders Manage...
50
Do Tax Evaders Manage Earnings More? A Quantitative Study on the Relationship Between Tax Evasion and Earnings Management Master’s Thesis 30 credits Department of Business Studies Uppsala University Spring Semester of 2015 Date of Submission: 2015-05-29 Johan Pettersson Edmund Wu Supervisor: Jiri Novak
Transcript of Do Tax Evaders Manage Earnings More? - DiVA portal823897/FULLTEXT01.pdf · Do Tax Evaders Manage...
!
Do Tax Evaders Manage Earnings More? A Quantitative Study on the Relationship Between Tax Evasion and Earnings Management
Master’s Thesis 30 credits Department of Business Studies Uppsala University Spring Semester of 2015
Date of Submission: 2015-05-29
Johan Pettersson Edmund Wu Supervisor: Jiri Novak
Abstract The relationship between earnings management and tax manipulation has been discussed in
academia recently. We contribute to this discussion by using a list of tax evader companies,
to test the relationship. The list was supplied by the Swedish Tax Agency and consists of
public companies from the Swedish stock exchanges. Our findings show that tax evader
companies are more prone to manage their earnings and that they do it by reporting small
earnings. The effect of labelling the companies as tax manipulators does also not change the
extent that they manipulate their earnings in the future. There is therefore no disciplinary
effect from the tax evader fine on a manipulating company to behave more credible in the
future. Out of our results the most unexpected was however that when we compare the
NASDAQ companies with the ones listed on less liquid stock exchanges the NASDAQ ones
were more pervasive in managing their earnings. This goes against our own hypothesis as
well as previous literature and shows that investors have to be careful also when investing in
premium markets.
Keywords: Tax evasion, Earnings management, Tax authority, Small gains and small losses,
NASDAQ.
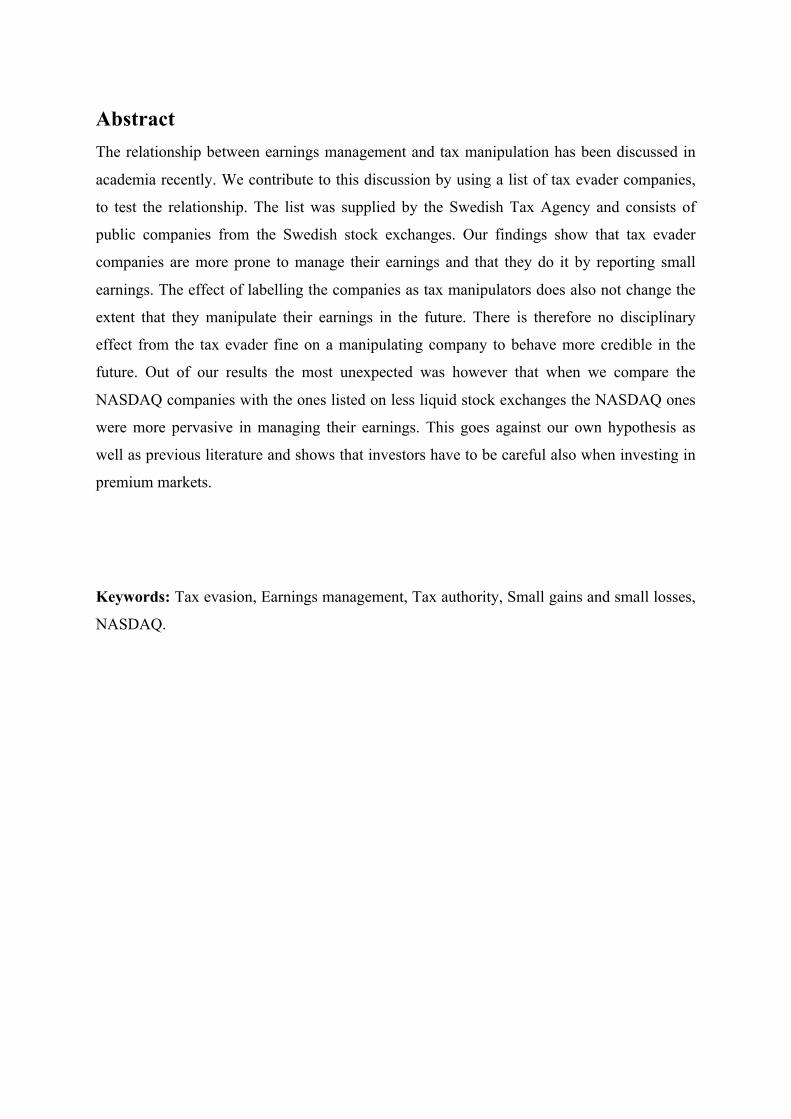
Table of Contents
1.#INTRODUCTION#.........................................................................................................................................#1!1.1!THE!THESIS!STRUCTURE!..........................................................................................................................................!5!
2.#LITERATURE#REVIEW#AND#HYPOTHESES#DEVELOPMENT#.........................................................#6!2.1!EARNINGS!MANAGEMENT!........................................................................................................................................!6!2.2!MEETING!OR!BEATING!EARNINGS!..........................................................................................................................!9!2.3!LIQUIDITY!OF!STOCK!MARKETS!............................................................................................................................!11!2.4!TAX!EVASION!............................................................................................................................................................!11!2.4.1%How%to%Measure%Tax%Evasion%.....................................................................................................................%12!2.4.2%Tax%Morale%.........................................................................................................................................................%12!2.4.3%Who%Benefits%and%Who%is%Doing%it?%.........................................................................................................%13!2.4.4%How%is%Tax%Evasion%Mitigated?%.................................................................................................................%14!2.4.5%Corporate%Tax%and%its%Connection%to%Earnings%Management%.....................................................%14!2.4.6%The%Effect%of%Exposing%a%Company%as%a%Tax%Evader%........................................................................%16!
3.#METHOD#....................................................................................................................................................#17!3.1!THE!SAMPLE!.............................................................................................................................................................!17!3.2!THE!FRAMEWORK!....................................................................................................................................................!19!3.2.1%The%Test%Variables%Used%...............................................................................................................................%19!3.2.2%Test%1%K%The%Test%for%Existence%of%Earnings%Management%.............................................................%20!3.2.3%Control%Group%...................................................................................................................................................%20!3.2.4%Test%2%K%The%Test%to%See%the%Before%and%After%Effect%.........................................................................%21!3.2.5%Test%3%–%The%Test%Between%NASDAQ%and%nonKNASDAQ%..................................................................%22!3.2.6%IndependentKSamples%TKTest%.....................................................................................................................%22!3.2.7%Regression%Analysis%and%its%Independent%Variables%.........................................................................%22!
3.3!DATABASE!LIMITATIONS!........................................................................................................................................!24!3.4!METHODOLOGICAL!CRITICISM!...............................................................................................................................!25!3.4.1%Sample%Size%........................................................................................................................................................%25!3.4.2%The%Identification%of%Tax%Evaders%............................................................................................................%25!
4.#RESULTS#....................................................................................................................................................#27!4.1!TEST!1!C!EARNINGS!AND!EARNINGS!CHANGES!...................................................................................................!28!4.1.1%Earnings%Management%by%Small%Earnings%...........................................................................................%28!4.1.2%Earnings%Management%by%Small%Increases%..........................................................................................%29!
4.2!TEST!2!–!EARNINGS!YEARS!BEFORE!AND!AFTER!TAX!EVASION!EXPOSURE!................................................!31!4.3!TEST!3!–!NASDAQ!AGAINST!NONCNASDAQ!COMPANIES!.............................................................................!33!4.3.1%Scaled%Earnings%at%Liquid%Stock%Exchange%..........................................................................................%33!
4.4!REGRESSION!ANALYSIS!...........................................................................................................................................!35!5.#CONCLUSIONS#..........................................................................................................................................#38!5.1!LIMITATIONS!AND!FUTURE!RESEARCH!.................................................................................................................!40!
REFERENCES#.................................................................................................................................................#42!APPENDICES#.................................................................................................................................................#45!APPENDIX!A!......................................................................................................................................................................!45!APPENDIX!B!......................................................................................................................................................................!46!

List of Figures and Tables
FIGURE 1 ............................................................................................................................................ 28
FIGURE 2 ............................................................................................................................................ 33
TABLE 1 .............................................................................................................................................. 18
TABLE 2 .............................................................................................................................................. 27
TABLE 3 .............................................................................................................................................. 30
TABLE 4 .............................................................................................................................................. 31
TABLE 5 .............................................................................................................................................. 34
TABLE 6 .............................................................................................................................................. 36
Pettersson & Wu 1
1. Introduction This paper provides evidence that tax evaders manage earnings more than their peers. Our
results also show that tax evaders do not change their behaviour within earnings management
after getting caught, rather continue managing their earnings. The list of tax evaders for our
sample was provided by the Swedish Tax Agency and consists of public companies that have
been fined by the Swedish Tax Agency for tax evasion. Apart from tax evaders managing
their earnings in a greater extent than the control companies we as well find evidence that
NASDAQ listed companies exercise earnings management more than companies that are
listed on less liquid stock exchanges.
From academia we know that the use of earnings management is not merely isolated events,
but rather a widespread phenomenon has been shown in previous literature (see Burgstahler
and Dichev, 1997; Burns and Kedia, 2008; Chan et al., 2010; Kraft et al., 2014; Louis and
Robinson, 2005; Zheng and Zhou, 2012). For this widespread problem there is also
conflicting ideas among researchers, where different methods are presented on detecting
earnings management (see Becker et al., 1998; Dechow et al., 1995; Dechow et al., 1996;
Farrell et al., 2014; Healy and Wahlen, 1999; Lee et al., 2008; Leuz et al., 2003; Nelson et al.,
2002).
The most frequently used method to identify earnings management companies is with the use
of quantitative methods based on total accruals of the firm (see Dechow et al., 2011; Dechow
et al., 1995; Jeter and Shivakumar, 1999; Liu et al., 2014; Ronen and Yaari, 2007), based on
certain pieces of the financial records (see Barton and Simko, 2002; Phillips, 2003), or by
studying the way in which managers meet or beat forecasts (see Bartov et al., 2002; Ronen
and Yaari, 2007). Burgstahler and Dichev (1997) try to explain how the earnings are
managed, but firstly they show that earnings management is performed by companies on the
stock market at large and has been around for some time also. Companies manage their
earnings both to avoid losses as well to avoid decreases in earnings and as the years of
managed earnings go by the earnings manipulations get worse and worse. The pattern was
both visually apparent, through the frequency distribution of the histograms that was anything
but normal statistically speaking. Burgstahler and Dichev (1997) argue that there are strong
incentives to avoid reporting decreases and they find in prior research that firms that maintain
earnings increases get rewarded for it, and the market punishes firms that fail to maintain it.
Pettersson & Wu 2
Moreover Bartov et al. (2002) claim that in today’s corporate culture it is known that meet or
beat analysts’ forecasts of earnings is a notion well established. Moreover Bartov et al.
(2002) argue that prior research shows that firms are active in the game of meet or beat
analysts’ forecasts. The incentives are to maximize the stock price, avoid litigation costs and
increase creditability of the management. Firms that succeed to meet or beat the forecasts
experience a greater return than peers that fail to meet the expectations (Bartov et al., 2002).
Furthermore Byun and Roland-Luttecke (2014) state that the market does not distinguish
between earnings attained operationally versus earnings management.
Even though more current research has started to understand how taxes and earnings
management is related they are often preoccupied with the gap between tax accounting and
financial accounting, where the gap is seen as a red flag. Because there are different standards
in financial reporting and in tax reporting the accounted earnings can differ and by looking at
this gap some researchers has established a link between tax manipulation and earnings
manipulation (Badertscher et al., 2009; Frank et al., 2009; Hanlon, 2005). The link between
the managers’ behaviour and the company’s might not be that hard to grasp, but rather
intuitive. What impact that tax evasion, where the taxes are untruthfully reported, and
earnings management, where the earnings is untruthfully reported, is still not as intuitive.
Most of the articles also do not focus on tax evasion but rather tax accounting, which is not
what we are trying to study.
Nonetheless the company is made out of the people that work there and as Chyz (2013)
shows the managers play a key role in how the company chooses to handle their taxes, when
it comes to reporting or evading them. When a tax evader comes in control of a company that
company also starts to evade taxes in a greater extent. In the same way when that person
leaves the company the aggressive tax evasion act diminishes. Alm (2011) argues that it is
hard to document tax evasion, since by definition taxes are hidden. Moreover the global
organization OECD (Organization for Economic Co-operation and Development) defines tax
evasion as “Illegal arrangements where liability to pay tax is hidden or ignored, i.e. the
taxpayer pays less tax than he is legally obligated to pay by hiding income or information
from the tax authorities” (OECD, 2015), which goes in line with Alm (2011) that taxes are
hidden. Phillips (2003) states that managers have incentive as motivation to pay less tax.
Furthermore Whitaker (2005) states that recent history shows that firms have abandoned the
relative conservatism that historically characterized financial accounting, and have become

Pettersson & Wu 3
keener to push the restrictions of accounting rules. Moreover that there is a connection
between the recent accounting frauds and tax shelter transactions, the incentives of
accounting frauds and tax frauds are similar; to meet earnings growth goals determined by
the market. “Lying to shareholders and lying to the IRS are just opposite sides of the same
coin” (Murray, 2002 citied by Whitaker, 2005, p. 695).
While some studies apparently see manipulation of taxes and manipulation of earnings as
intertwined there is still not consensus among the articles that we have found and they most
often do not address tax evasion, but rather the legal act of tax avoidance. Moreover that most
prior research are focused on individuals and do not address the problem with the separation
of ownership and control (Crocker and Slemrod, 2005).
The relationship between tax evasion and earnings management is somewhat problematic
because both manipulate the figures, but usually in different directions. Whereas earnings
management generally manage the figures upwards (Bartov et al., 2002; Burgstahler and
Dichev, 1997), tax evasion manage it downwards by hiding tax (Alm, 2011; OECD, 2015).
However in both cases they do manipulate the figures to their own agenda, which made us
want to study how the relationship between tax evasion and earnings management manifests
itself and get answers to the following questions. Does the one amplify the other? Does a
company who evades taxes also manage their earnings more than other companies so that the
two adds on another? Are tax evasion companies more pervasive in managing their earnings?
If there is a relationship, it could be important for regulators, auditors and investors to see tax
evasion also as a red flag for earnings management. The aim of this thesis is therefore to
analyse how the manipulation of taxes, through tax evasion, correlates with the manipulation
of earnings through earnings management and how pervasive this pattern is.
Our sample of tax evaders was, as mentioned above provided to us by the Swedish Tax
Agency. Like the sample of SEC filings that Dechow et al. (1996) got our list gave us an
opportunity to use a sample of companies that had already been investigated for
manipulations and form our test based on that. But while Dechow et al. (1996) tested the
earnings reporting behaviour of accounting manipulating companies we tested the earnings
reporting behaviour for tax evasion companies. The propensity to manipulate earnings is
intuitive if you are an earnings manipulating company like the companies in Dechow et al.'s
(1996). However the tendency to manipulate earnings, if you are a tax manipulating

Pettersson & Wu 4
company, is not as intuitively obvious. This list of tax evaders therefore gave us a unique
opportunity to study the relationship between tax evasion and earnings management.
Because our sample was from listed companies we also wanted to study what impact the type
of stock market had on the tendency to manage earnings, since more liquid and regulated
stock exchanges should diminish the information asymmetry and thus the frequency of
managed earnings. Even though our main aim was related to tax evasion’s effect on earnings
management frequencies the characteristics of the stock exchange was assumed to also be
able to have an effect, which we wanted to investigate further with our sample.
We have tested the propensity to manage earnings between different groups and have gotten
interesting results that will contribute to understanding the management of earnings and when
it is performed. We used Burgstahler and Dichev's (1997) methodology with small gains to
investigate how our test groups reported their earnings. The result was that, in line with our
hypothesis, tax evaders were more pervasive in managing their earnings. They had greater
occurrence of reporting small earnings in comparison with our control group. The results
were significant and showed a clear distinction between the earnings reporting pattern of tax
evaders and that of our control companies. Burgstahler and Dichev's (1997) results, that
companies use earnings increases to manage earnings, could not be supported by our study.
But it was apparent that small earnings were used by the tax evader companies in a great
extent and also in a lesser extent by the control companies.
Furthermore the results from our study show that being labelled as a tax evader did not
change the companies’ behaviour of managing their earnings, even though previous research
has shown that being caught as a manipulating manager results in disciplinary repercussions
from both the market and the company itself. The attempt to restore credibility is also
something that we assumed would drive a manipulating company to refrain from further
management of earnings. That seemed however not to be the case, because we found no
significant evidence that companies manage earnings less after they are exposed as being a
tax evader company.
Apart from the tax evaders managing the earnings more than other companies the ones that
were the most pervasive in managing their earnings were NASDAQ companies. Unlike the
companies from less liquid lists and stock exchanges the NASDAQ companies managed their
earnings in a significantly larger degree than the other companies. Those results went against
our preconceived assumptions as well as previous literature, since a more liquid and heavily
Pettersson & Wu 5
regulated stock exchange should lead to less information asymmetry and less earnings
management.
1.1 The Thesis Structure The thesis is structured in the following way. In Section 1 we have presented the theoretical
problem of earnings management, tax evasion and how they are related to each other. We
will elaborate further on these subjects in Section 2 and build the theoretical framework for
this thesis. In Section 3 we will present our research design, where we will explain how we
got data for our study and how we will analyse it. Section 4 will explain what empirical
evidence that we have gathered, what they resulted in as well as a review of this data. Section
4 will also present our analysis of the data. Our conclusions, limitations and the paper’s
contribution will be carried out in Section 5.
Pettersson & Wu 6
2. Literature Review and Hypotheses Development
2.1 Earnings Management
Earnings management occurs when managers use judgment in financial reporting and
in structuring transactions to alter financial reports to either mislead some
stakeholders about the underlying economic performance of the company or to
influence contractual outcomes that depend on reported accounting numbers. (Healy
and Wahlen, 1999, p. 368)
The citation above is Healy and Wahlen's (1999) definition of earnings management. In their
paper they review what findings that earnings management research has come up with so far.
They point out that even though academia is aware that earnings management exists the
phenomenon has still been difficult to document. Healy and Wahlen (1999) argue that
managers can exercise judgment in several ways in the financial reporting. Judgment by
managers is necessary to estimate in several future economic events, e.g. deferred taxes,
expected lives and salvage values of long-term assets, losses from bad debts and asset
impairments, obligations for pension benefits and other post-employment benefits (Healy and
Wahlen, 1999). Managers are also required to decide accounting methods for reporting the
same transactions, for example straight-line or accelerated depreciation methods or the FIFO,
LIFO, or weighted-average inventory valuation methods (Healy and Wahlen, 1999).
Furthermore, the management must exercise judgment in working capital management that
affects net revenues and cost allocations, such as receivable policies, the timing of inventory
shipments or purchases, and inventory levels (Healy and Wahlen, 1999). The management
need also decide to make or defer expenditures, e.g. advertising, research and development
(R&D), or maintenance (Healy and Wahlen, 1999).
Cormier et al. (2013) look at earnings management in uncertain environments and investor’s
ability to detect earnings management in these situations. They classify the different
environments based on complexity and dynamism (Cormier et al., 2013). The complexity is
based on how diversified that the business and the geographical spread of the company is.
The dynamism is related to the use of intangible assets, such as R&D capitalization. Since
there are not any asset prices that derive directly from R&D and because of its uniqueness it
is difficult for investors to evaluate the performance and value of such firms. The information
Pettersson & Wu 7
asymmetry is therefore high in these types of firms and the presence of earnings management
is assumed also to be high (Cormier et al., 2013). The results of the study confirm that the
likelihood of earnings managements increase with both the complexity of the firm and the
R&D operations as well as those facing high sales volatility. Cormier et al. (2013) conclude
however that investors are more likely to detect the earnings managements of complex and
dynamic firms, when the shares are traded at liquid stock markets as the US stock exchange.
They also find that the presence the board of directors as well as audit committee affect
earnings management negatively (Cormier et al., 2013).
Firms that operate in complex and dynamic environments such as high tech start-ups, have
hard to value technologies, or complex positions and trading strategies (Peng and Röell,
2014). That fact makes the companies to refrain from incentivizing managers with short-term
compensations (Peng and Röell, 2014). The authors found evidence that, counter intuitively
enough, in such situations as above; where the manipulation uncertainty and short-term
performance is unclear the management pay is more linked to short-term stock price changes
(Peng and Röell, 2014). The firm categories that they found more propensity of short-term
compensation schemes was companies that dealt with high tech, where high growth, or relied
on intangible assets, such as the examples that Cormier et al. (2013) warned about (Peng and
Röell, 2014). That was also true for firms that had managers that were young and untested
(Peng and Röell, 2014).
The role of ownership by the founders was furthermore said to have effects on the likelihood
of having manage their earnings. This was shown in the study from Dechow et al. (1996),
where a company was more likely to be on their list of earnings manipulators if the founder
was still the CEO. In contrast to their results a more recent study by Wang (2006) showed
that earnings quality was actually higher for founding family companies.
Healy and Wahlen (1999) mention that the objective of earnings management can be to
mislead stakeholders about the underlying economic performance of the company. This can
occur if the management thinks that stakeholders do not detangle earnings management
(Healy and Wahlen, 1999). Furthermore, it can also arise when the management has
information that is not accessible for outsiders so that earnings management is improbable to
be transparent to outsiders (Healy and Wahlen, 1999). Brooks et al. (2012) find that earnings
management is more likely to occur if it is based on private information. However,
stakeholders are prone to anticipate and endure a certain amount of earnings management

Pettersson & Wu 8
(Healy and Wahlen, 1999). Accounting judgment can make financial reports more
informative for users, which can arise if accounting decision or estimates are recognized to be
reliable signals of a company’s financial performance (Healy and Wahlen, 1999). Managers’
judgment in financial reporting has both upsides and downsides (Healy and Wahlen, 1999).
The upsides include potential improvements in managers’ reliable communication of private
information to outside stakeholders and improving decisions on allocation of resources. The
downsides can be the opposite; the potential resource misallocation (Healy and Wahlen,
1999).
Investors and financial analysts extensive use of accounting information to help stocks in
capital markets can generate an incentive for managers to exercise earnings management in
an attempt to affect the stock price performance short-term (Healy and Wahlen, 1999). Healy
and Wahlen (1999) argue that previous researches have found that investor view earnings
more informative than cash flow as value-relevant data. Furthermore that earnings
management is not so pervasive to make earnings data unreliable (Healy and Wahlen, 1999).
According to Healy and Wahlen (1999) there is relatively small sample of evidence on the
magnitude or frequency of earnings management for capital market purposes. But the
evidence shows that there are some firms that appear to manipulate earnings for stock market
reasons. Whether the behaviour is frequent widespread or not is an open question. Healy and
Wahlen (1999) argue that there is conflicting evidence on whether earnings management has
an effect on stock prices. In some cases do investors see through earnings management, but in
other cases not, notably in the banking and property-casualty industries. Healy and Wahlen
(1999) discusses that an explanation can be that investors in banking and insurance
companies have access to extensive disclosures that are closely related to the key accruals,
which is determined by regulations. Nevertheless Chan (2003) state that bad news had a
greater effect downwards, then good news had upwards and the trend was most profound for
smaller companies. Furthermore Carvalho et al. (2011) argue that investors are not able to
price the stocks after having found out that the news that they received were false.
Burghstahler et al. (2006) find that contrary to previous studies stock market companies have
smaller degrees of accounting earnings management than private ones do. The opinion has
been that the capital market increases the pervasiveness of earnings management
(Burghstahler et al., 2006). Their study however shows otherwise and concludes that the
capital market improves the earnings informativeness (Burghstahler et al., 2006). The study
Pettersson & Wu 9
also finds that for privately held firms the signal of earnings is not as important as in public
firms (Burghstahler et al., 2006). Due to that fact the use of tax minimizing measures are
therefore used in a larger extent by private firms, where reported earnings are lowered to
decrease the corporate tax (Burghstahler et al., 2006). Companies from countries where the
tax accounting is closely linked to the financial reporting were more engaged in earnings
management (Burghstahler et al., 2006). However this was not significant when it came to
the public firms, which the authors explain is due to the mitigating effect that the capital
market has (Burghstahler et al., 2006).
Even though the common insight that earnings management occurs, it has been hard for
scholars to persuasively document it (Healy and Wahlen, 1999). The problem to identify if
earnings have been managed occurs mainly because scholars have to begin with estimate
earnings and then estimate the effects of earnings management, which is problematic (Healy
and Wahlen, 1999).
2.2 Meeting or Beating Earnings In today’s corporate culture it is known that meet or beat analysts’ forecasts of earnings is a
notion well established (Bartov et al., 2002). Corporate boards’ communication to financial
press reports and Internet chats emphasise on whether the firm meets its forecast of earnings
(Bartov et al., 2002). Bartov et al. (2002) argue that prior research shows that firms are not
passive observers in the game of meet or beat analysts’ forecasts. The firms are instead active
and the motivations are to maximize the stock price, avoid litigation costs, and increase the
credibility of management to meet the company’s stakeholders (Bartov et al., 2002).
Companies that meet or beat analysts’ earnings expectation experience a greater return over
the quarter than peers that fail to meet the expectations (Bartov et al., 2002). Byun and
Roland-Luttecke (2014) find that the market does not distinguish between meeting-or-beating
attained operationally versus earnings management. Although companies that meeting-or-
beating and do not exercise earnings management have better future performance than their
peers that manage earnings (Byun and Roland-Luttecke, 2014).
McVay et al. (2006) state that the possibility of just meeting the forecast versus just missing
the forecast is strongly linked with subsequent managerial stock transactions. Furthermore
managers in firms that are more likely to meet analysts’ forecast tend to sell more shares in
the following quarter (McVay et al., 2006). The authors find that non-managerial insiders
(e.g. large shareholders and directors) do not show the same pattern, and the reason is

Pettersson & Wu 10
according to the authors that these insiders have little influence to exercise earnings
management at their convenience (McVay et al., 2006). McVay et al. (2006) find that
managers at companies with a majority representation of outsiders on the board of directors
have a lower propensity to sell shares after meeting the forecast, which indicate active
performance from managers. McVay et al. (2006) state that managerial incentives are a key
driver of all earnings management.
Burgstahler and Dichev (1997) claim that there are strong incentives to avoid reporting
earnings decreases and that increases in earnings is important to mention in the beginning of
the management discussion section of the annual report. Furthermore Barth et al. (1995,
mentioned in Burgstahler and Dichev, 1997) state that a consistent pattern of earnings
increases command higher price-to-earnings multiples for a company. The authors also find
that the premium increased for longer string of earnings increases and the premium reduced
significantly or eliminated if the established pattern of earnings broke (Barth et al., 1995
mentioned in Burgstahler and Dichev, 1997). Moreover DeAngelo et al. (1996 mentioned in
Burgstahler and Dichev, 1997) find when a pattern of consistent earnings increases broke, did
the firm’s stock return abnormal decreased with 14% the particular year. Burgstahler and
Dichev (1997) argue that there are strong incentives for managers to manage earnings to
avoid reporting earnings decreases, and the incentives increases in the duration of foregoing
series of earnings increases.
Hayn (1995 mentioned in Burgstahler and Dichev, 1997) presents evidence that indicates that
companies try to avoid reporting losses. Hayn (1995 mentioned in Burgstahler and Dichev,
1997) find that there were a large number of cases just above zero, and fewer than expected
of cases just below zero earnings. The result indicates that companies that fall just below zero
managed their earnings to get above zero (Hayn, 1995 mentioned in Burgstahler and Dichev,
1997). Burgstahler and Dichev's (1997) own research confirms that losses and earnings
decreases are managed away frequently. The reason according to Burgstahler and Dichev
(1997) is that the management try to avoid reporting losses and decreases to minimize the
costs on the company in transactions with stakeholders. We therefore expect to see the
following patterns in the reporting of earnings.
H1A: An unusually large amount of companies’ earnings will just above zero,
and also an unusually small amount just below zero.

Pettersson & Wu 11
H1B: An unusually large amount of companies will have small earnings
increases, and also an unusually small amount will have small earnings
decreases.
2.3 Liquidity of Stock Markets Burghstahler et al. (2006) and Cormier et al. (2013) conclude that liquid stock markets
mitigate information asymmetry, which can therefore in turn mitigate earnings management.
Especially so in larger and more developed stock markets, with strong legal enforcement and
law system pointing to the thought that the institutions reinforce each other (Burghstahler et
al., 2006). Liquid stock exchanges have great trading volumes, which attracts analysts. The
analysts also reduce the information asymmetry that exists and with their private knowledge
they increase the certainty about a company (Alford and Berger, 1999). There is also
evidence that shows that analysts have an information-bridging role when it comes to
following firms with high accruals, which is an indication of earnings management. The
analysts, through monitoring these companies, act to influence managers in a way that
reduces the usage of discretionary accruals. This effect is stated to be that the management of
earnings is reduced for these companies (Hong et al., 2014). This brings us to assume that
more liquid stock exchanges will have deterring effects on the occurrence of earnings
management. Leuz et al.'s (2003) further argue that when minority shareholder rights and
legal enforcement is high the earnings management will be less prominent in the market. The
importance of regulatory environment is also something that has proven to be of importance
for the mitigation of earnings management in the market (Pelucio-Grecco et al., 2014). Since
the most liquid and heavily regulated stock exchange in Sweden is the NASDAQ OMX stock
exchange we formulate our second hypothesis as follows.
H2: NASDAQ listed companies exercise earnings management less than non-
NASDAQ listed companies.
2.4 Tax Evasion The global organization OECD (Organization for Economic Co-operation and Development)
defines tax evasion as “Illegal arrangements where liability to pay tax is hidden or ignored,
i.e. the taxpayer pays less tax than he is legally obligated to pay by hiding income or
information from the tax authorities” (OECD, 2015). According to the Oxford Press it means
“Minimizing tax liabilities illegally, usually by not disclosing that one is liable to tax or by
giving false information to the authorities.” (Oxford Reference, 2015). Crocker and Slemrod
Pettersson & Wu 12
(2005) use the term tax evasion as a “corporate tax reporting behaviour that would, if
discovered, be subject to civil or criminal sanctions”. None of these definitions stress that it
has to be a deliberate act from the tax evader. If a person states too low taxable income he has
evaded taxes. However, these definitions make the clear distinction that it has to be a criminal
act, deliberate or not.
In academia many articles discuss the difficulty in measuring tax evasion and showing its
prevalence (Alm, 2011; Korndörfer et al., 2014). There are also some articles that focus more
on the behaviour of the tax evader and tries to understand which people that actually evades
taxes (Dell’Anno, 2009; Korndörfer et al., 2014). How to control, or minimize tax evasion, is
also an area that is debated in academia (Alm, 2011; Crocker and Slemrod, 2005; Levaggi
and Menoncin, 2012).
2.4.1 How to Measure Tax Evasion
Alm (2011) discusses the difficulty in measuring tax evasion, since, by definition, taxes are
hidden. He gives examples of how the literature has tried to measure it. The examples are
ranging from evidence gathered through actual tax audits, other ways are by estimation of the
shadow economy, surveys interviewing people about their behaviour, tax amnesties, or
indirectly through some gap between reported taxable income and other national income
reporting (Alm, 2011). Korndörfer et al. (2014) also discuss different ways to measure tax
evasion for individuals, but all of them are different survey approaches.
2.4.2 Tax Morale
Dell’Anno (2009) points to the widespread use of different words used by scholars in
explaining the same thing. Some scholars use definitions as tax ethics, psychic costs and
social stigma etc. All of these terms are however used to explain tax morale, or the
willingness from the taxpayer to either report its income, or conceal it (Dell’Anno, 2009). In
his model he found that social stigma has a great effect on the tax morale. If the person feels
that the authorities are fair and have a good relationship with them there will be greater social
stigma to cheat them and he will adjust his evading level based on this satisfaction level
(Dell’Anno, 2009). Traditional literature has nonetheless presented that the evasion is due to
rational maximization of material wealth (Dell’Anno, 2009). This article however deals with
individuals and not the way that corporations behave.
That personality matters when it come to the decision to evade taxes is stated as uncontested
by (Korndörfer et al., 2014). People who are self-interested and egoistic have been shown to
Pettersson & Wu 13
evade taxes in greater extent than other people. People with such characteristics care a lot
about their own wealth, lie to others if they benefit from it, place a high value on money and
do not feel included in society. The authors however reason that even though this is true,
more factors have to be included in the investigation (Korndörfer et al., 2014).
Egoistic or not, different incentive schemes create different outcomes as Phillips (2003)
shows in his study. He looked at how the effective tax rate of a company was affected by the
after tax performance measures by business managers and CFOs. Where these incentive
schemes existed the company had a lower effective tax rate, thus paying less taxes. They
further concluded that such incentives motivate managers’ efforts to minimize taxes (Phillips,
2003). The study was however related to the avoidance of taxes, or more commonly referred
to as tax planning, which is legal and not tax evasion.
2.4.3 Who Benefits and Who is Doing it?
Earlier literature has argued that minimizing taxes is beneficial to the value of the firm, since
costs are reduced and earnings are therefore higher than otherwise (Desai and Dharmapala,
2009). To presume that shareholders benefit directly from this transfer from the state to the
shareholders is however questionable, because it also brings with it agency problems (Desai
and Dharmapala, 2009). Their results show that where there is poor governance the
shareholders do not benefit from the tax avoidance (Desai and Dharmapala, 2009). They
provide evidence in an earlier study that tax-sheltering activities are primarily driven by
managers from high powered incentive companies. These managers are more aligned with
the principal’s wish to increase the earnings of the firm and use measures to shelter the taxes
to increase the earnings of that firm. This phenomenon predominantly existed for the poorly
governed companies and did not hold for the companies that were well governed (Desai and
Dharmapala, 2006). Chyz (2013) also looks on the managers’ behaviour in correlation to that
of the company. He finds that those managers who are suspected of having engaged in
aggressive tax sheltering themselves, affect the tax sheltering aggressiveness of the company
(Chyz, 2013). During years when the suspected managers arrive the probability of tax
sheltering increases for the company. When the suspected manager then leaves the company
the probability furthermore decreases (Chyz, 2013). The author claims that this study is the
first to identify the correlation between the manager’s trait associated to tax evasion and that
of the company (Chyz, 2013).

Pettersson & Wu 14
2.4.4 How is Tax Evasion Mitigated?
Early research on the control of tax evasion speaks of optimal tax rates that deter or increase
tax evasion. By including the fine that the tax agency sets on evaded taxes in the calculations
different results emerge. It is not solely the tax rate that has an effect on tax evasion, also if
there is a fine on the tax evasion and if it stands in proportion to the evaded taxes. Where the
fine is exactly proportionate to the evaded taxes there is a negative correlation between tax
evasion and change in tax rates (Levaggi and Menoncin, 2012).
Alm (2011) finds that this statement is not necessarily true. For individual tax payers factors
such as higher tax rates, more audits, repeated audits, targeted audit selection, more public
disclosure, increased penalty rates etc. all have a significant effect on how the individual
behaves when deciding to evade, or not to evade taxes (Alm, 2011). Imposing fines not only
on the company, which punishes the shareholders, but also on the tax manager of the
company would have a negative effect on corporate tax evasion behaviour (Crocker and
Slemrod, 2005). The authors find that almost exclusively all literature on tax evasion is
focused on individuals and the literature also does not address the problem with the
separation of ownership and control (Crocker and Slemrod, 2005). Only fining the company,
and thereby in extension the owners and ignoring the people actually in control of the
company, will not have the desired effect of mitigating tax evasion (Crocker and Slemrod,
2005).
2.4.5 Corporate Tax and its Connection to Earnings Management
There are several articles discussing how earnings management is connected to tax
accounting. These articles look at the gap between reported income in the financial reports
and the reported taxable income to the tax authorities. This gap is supposed to help as an
indicator in detecting earnings management (Badertscher et al., 2009; Frank et al., 2009;
Hanlon, 2005).
Badertscher et al. (2009) divided their sample firms in firms that had managed their earnings
with effects on the taxable income and firms whose taxable income was unaffected by the
managed earnings. All of these firms had restated their previously reported earnings. The
reasons differed from misinterpretations of GAAP, material misstatements and fraud etc.
(Badertscher et al., 2009). The results from the study imply that book-tax differences are
useful in identifying earnings management companies. The companies who had high book-
tax differences were more prevalent in managing their earnings also. Because there is a

Pettersson & Wu 15
detection risk associated with having this book-tax gap the misstating companies trade off the
gain from understating their taxable income with the increased risk of being detected. This is
done when they decide to either manage their earnings upwards and lowering their taxable
income, or managing their earnings upwards and increasing their taxable income
(Badertscher et al., 2009).
The markets reaction to these earnings management attempts differs depending on the study.
Frank et al. (2009), much as (Badertscher et al., 2009), discuss that firms do not necessarily
trade off between increasing earnings upwards, with the taxable income tagging along, but
rather manage earnings upwards and taxes downwards in the same period (Frank et al.,
2009). The authors also found a strong correlation between firms that had high discretionary
accruals, indicating earnings management, and aggressive tax reporting (Frank et al., 2009).
The market furthermore overprices financial statements from aggressive financial reporting
companies and also overprices the aggressive tax reporting from such companies. This means
that for the companies that have aggressive tax reporting the market incorporates this
information by giving less increase in stock price, except for the companies that also have
aggressive financial reporting with high discretionary accruals. The latter types of firms enjoy
increases in stock prices (Frank et al., 2009).
Hanlon (2005) also finds that the market responds negatively to large book-tax differences
and sees them as red flags. Even though she does not distinguish between the firms in the
way that Frank et al. (2009) do she shows that where there are large discretionary accruals
future earnings are less persistent. With the assumption that large book-tax gaps indicate
discretionary accruals she finds that such companies get less persistent earnings in the future
and that the investors also incorporates this in their pricing of the stocks (Hanlon, 2005). The
market nonetheless is not fully efficient when it comes to negative book-tax differences, or
small book-tax differences. In these cases the market often exaggerates their response to this
difference. She further proposes more disclosure of firms’ book-tax differences, since there
seem to be predicative power in these figures (Hanlon, 2005).
There seem to exist a connection between tax manipulation and earnings manipulation, the
connection neither seem to benefit investors (Desai and Dharmapala, 2009) nor the future
earnings of the company (Frank et al., 2009; Hanlon, 2005). Tax evasion is by its inherent
nature hard to measure both in existence and magnitude as Alm (2011) discusses. The choice
to evade taxes both for individuals and those in control of the companies seem to have in
Pettersson & Wu 16
common with earnings management that they care about their own wealth and personal gains
from the tax evasion (Korndörfer et al., 2014) and that these people who manipulate their
own taxes, manipulate those of the company (Chyz, 2013). This makes us want to test the
following hypothesis:
H3: Tax evaders employ earnings management more than non-tax evaders.
2.4.6 The Effect of Exposing a Company as a Tax Evader
Managers should take in consideration the effect of their accounting choices, since if they are
caught manipulating the market will feel less confident to invest in the company (Wu, 2002).
If a company has to restate their earnings that are a bad sign that has repercussions in the
performance on the stock exchange. Forced restatements are even more severe when it comes
to the investors’ response for the company (Wu, 2002). Apart from the market giving
penalties to managers, who are caught manipulating the accounting figures, the companies
themselves also in a great extent punish such managers. Around 60% of the firms in Desai et
al.'s (2006) study had removed managers or board members from their positions following
earnings restatements. There is apparently a risk of negative reactions, both from the stock
market as well as the company itself that the manager works for, if they manipulate earnings.
Many firms that have conducted acts of earnings manipulation do however change and
reshape their corporate governance and use other measures as well to restore credibility. The
efforts to reshape the companies and restore trust were also rewarded by superior
performance in the stock market (Farber, 2005). Since forced restatements of earnings has
negative disciplinary effects on the manipulating firm and its managers and that the market
rewards companies who have made an effort to regain credibility we think that similar effects
might happen from forced restatements of taxes. Companies that are labelled as manipulators,
because they are identified as tax evaders, should therefore manipulate their earnings less
afterwards, since the market is more sceptical towards the earnings results of manipulating
companies.
H4: Companies exercise earnings management more before getting fined for
tax evasion than after.

Pettersson & Wu 17
3. Method To test our hypotheses we have identified a group of tax evaders. These tax evaders will form
our sample, which will be tested against a control group of similar sized companies. We will
first perform a test to see if the tax evaders manage earnings in a greater extent than the
control group. The second test will be to see how the companies behave before and after they
have been fined for evading taxes. The third test will investigate the difference between
premium market companies listed on NASDAQ and the other listed companies in our sample
and control group. An independent-samples t-test will be conducted to see if the mean
differences between the groups are significant, and therefore represent the population. We
will also perform a regression analysis to try to explain what affects this management of
earnings and to control for certain variables.
3.1 The Sample A tax evader is someone who, deliberately or not, does not disclose or hides income from the
tax authorities and is sanctioned if caught. We therefore wanted a measure that identifies such
persons. In Sweden if an individual or a company states a false figure of taxable income or
hides it from their income statement, they are sanctioned with a fine if caught by the tax
authorities (Tax Procedure Act (2011:1244) section 49 §4). The fine stands in direct
proportion to the evaded taxes, with a percentage of 40 (Tax Procedure Act (2011:1244)
section 49 §11). This means that if the tax authorities in Sweden finds, for example, that 10
Million SEK in taxes were evaded by not disclosing, hiding, or in any other way giving a
false statement of the taxable income then the fine will be 4 Million SEK on top of the tax
that is due. Based on the discussed definition of a tax evader and that the fine is a sanction for
evaded taxes from the tax authorities those companies are identified as tax evaders in our
sample.
We were in contact with the tax authorities in Sweden to get a list of all of the stock market
companies in Sweden that had gotten this fine on their income statement and therefore by
definition were labelled as tax evaders. We limited our sample to stock market companies
through discussions with the tax authorities, since for example all companies would not be
feasible for them to test and if private companies would be included there would be several
issues regarding which companies that should be included, on what parameters etc. Even
though the tax authorities accept questions of this sort, because it is public accessible data,
there are limitations on how large data sets and how many different parameters that they will
Pettersson & Wu 18
process. We needed to supply a list of companies and their organization numbers for the
authorities to accept our request for data. Since our request was limited to the companies on
the stock exchange our request was accepted, while more generic question would not have
been tolerated.
Furthermore there is a limitation on the years that can be covered in the request to the tax
authorities in Sweden. Because records of tax information can only, by law, be kept for 6
years after the end of the fiscal year that it concerns, we cannot get data before 2009 (see
appendix A for an overview). Our sample is therefore of companies that have gotten fined in
their income statements for tax evasion between the years 2009 and 2014.
There are 550 companies listed in Sweden. The regulated and most liquid stock markets are
the OMX NASDAQ Small, Medium and Large Cap. First North is also on the NASDAQ list.
First North is also under surveillance of NASDAQ, but not as regulated as the regular
NASDAQ markets though and also not as liquid as the other NASDAQ markets. The less
liquid stock markets are Aktietorget, Bequoted, NGM Equity and NGM OTC. Out of these
550 companies 70 were on the list that we requested from tax authorities. 14 companies out
of the 70 had gotten their fines removed in full. The remaining 56 companies qualified as our
sample of tax evaders. With this sample we will test the prevalence of earnings management
against a control group with the following framework.
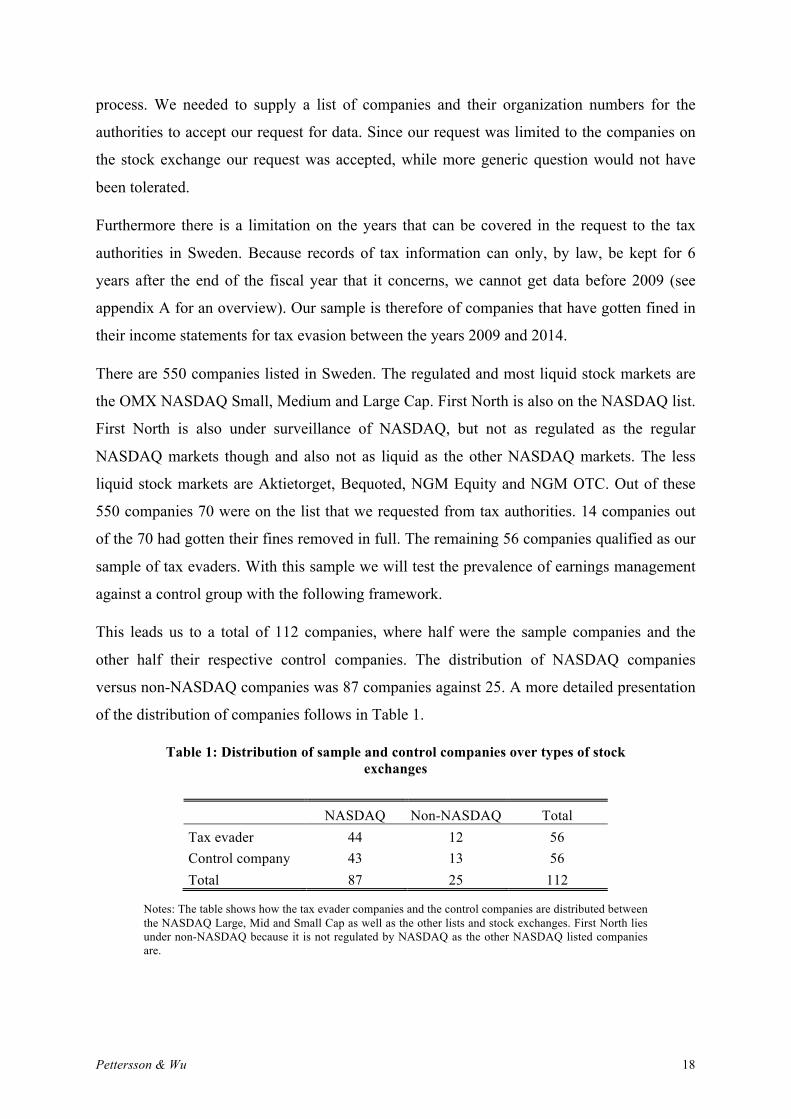
This leads us to a total of 112 companies, where half were the sample companies and the
other half their respective control companies. The distribution of NASDAQ companies
versus non-NASDAQ companies was 87 companies against 25. A more detailed presentation
of the distribution of companies follows in Table 1.
Table 1: Distribution of sample and control companies over types of stock exchanges
NASDAQ Non-NASDAQ Total Tax evader 44 12 56 Control company 43 13 56 Total 87 25 112
Notes: The table shows how the tax evader companies and the control companies are distributed between the NASDAQ Large, Mid and Small Cap as well as the other lists and stock exchanges. First North lies under non-NASDAQ because it is not regulated by NASDAQ as the other NASDAQ listed companies are.
Pettersson & Wu 19
3.2 The Framework
3.2.1 The Test Variables Used
We test Burgstahler and Dichev's (1997) framework of gains and losses to identify the
prevalence of earnings management within our sample. Like Burgstahler and Dichev's (1997)
we focus on net income as our figure for earnings, which we retrieved from the business
register Retriever Business. For some companies, mostly the major banks, we had to collect
the financial data from their financial reports on their websites manually.
The companies of course differ in size, since they come from different lists and stock
exchanges. In the same way as Burgstahler and Dichev (1997) we also have to scale the
observations, since the companies differ in firm size. The authors claim that while financial
literature mention different measures of scaling, such as scaling for market capitalization,
book value, assets, or sales they obtained similar results with all of the three. We have chosen
to scale for previous year’s total assets, because Retriever does not supply information on
market capitalization. Even though this is not the scaling measure that Burgstahler and
Dichev (1997) have used to present their results with we feel confident that it will not have a
negative impact on our results based on the above argument from the authors themselves.
We have gone back 9 years in time in our observations, since Retriever keeps the information
10 years and many companies have not released their annual report for 2014. Burgstahler and
Dichev (1997) tested both scaled earnings (net income) and scaled changes in earnings. With
our way of scaling this would lead us to test:
!"#$%&!!ℎ!"#$%!!"!!"#$%$&!! = !(!"#$%$&!!!– !!"#$%$&!!!!)
!"#$%!!""#$!!!!!
!"#$%&!!"#$%$&!!:=!!"#$%$&!!
!"#$%!!""#$!!!!!
With the above test variables Scaled Earnings and Scaled Changes in Earnings we will
evaluate the existence of earnings management within our sample as well as the control
group. The framework from Burgstahler and Dichev (1997) is constructed to look at earnings
management to avoid losses as well as to avoid decreases in earnings. Their hypotheses were
that these two reasons lay behind the decision to manage the earnings. Where there would be
abnormally high frequencies of small positive earnings and small increases in net income
earnings management would be present. The authors used different increasing intervals to
identify an earning as small, where the more conservative increasing interval widths were
Pettersson & Wu 20
0.00 to 0.005, 0.005 to 0.01 and 0.01 to 0.015. The same increasing interval widths were also
tested below zero, i.e. 0.00 to -0.005, -0.005 to -0.01 and -0.01 to -0.015. That is also the
interval widths that we will test throughout our study to identify small gains and losses as
well as small increases and decreases in earnings.
3.2.2 Test 1 - The Test for Existence of Earnings Management
The test variable of Scaled Earnings is used to test if there exists earnings management to
avoid losses. If earnings are not managed there will also not be any great irregularities in the
frequencies around zero. The interval of Scaled Earnings just above zero will not occur with
a larger frequency than the Scaled Earnings in the interval just left of zero, i.e. there will be a
smooth normal distribution of both small losses and small gains.
The results from Burgstahler and Dichev (1997) test were in contrast that the distribution was
smooth, except around zero. Earnings less than zero happened less often than anticipated and
earnings just in the first interval above zero a lot more frequent than expected (Burgstahler
and Dichev, 1997). We therefore expect to see higher frequencies of small positive earnings
than small losses when we perform the same type of tests on our sample group.
The change in earnings between the years was tested by Burgstahler and Dichev (1997) to
evaluate the existence and prevalence of earnings management to avoid decreases in
earnings. As with the first test variable, this second test variable showed similar traits in their
study, where changes in earnings just below zero occurred less often than small earnings
increases did (Burgstahler and Dichev, 1997). Even though there was evidence of earnings
management within changes in earnings the most pervasive one is where losses are avoided
by managing the earnings (Burgstahler and Dichev, 1997). This leads us to expect similar
results in our sample, where loss avoidance is the most pervasive reason behind earnings
management actions.
3.2.3 Control Group
While Burgstahler and Dichev (1997) compared all companies covered by Compustat data
between 1976-1994 to evaluate the existence and prevalence of earnings management we
have already selected our sample group, ours being composed out of tax evaders. This
group’s prevalence for earnings management will not be tested in isolation against expected
normally distributed figures, as it is done in Burgstahler and Dichev (1997) paper. Instead it
will be in comparison with a control group of stock market companies that share similar size
in total assets, without being on our tax evader list. We look at the year when our sample

Pettersson & Wu 21
company has got fined for tax evasion and choose a control company that has similar size in
asset for the year preceding the event.
If there is not a significant difference between the two groups there is also not a correlation
between tax evasion, as it is defined in this study, and earnings management behaviour of the
stock market companies in general. Where however the frequency of small increases and
small positive earnings is more pervasive in the sample group the null hypothesis will be
rejected and there is a positive correlation between tax evasion and earnings management.
3.2.4 Test 2 - The Test to See the Before and After Effect
If there is a trend in how the tax evaders behave before and after getting exposed for their tax
evasion than that can give us more insights on how corporate tax evasion influences the
management of earnings. If there is not much difference from the first test then the timing of
the tax evasion does not have great effect on the management of earnings. It is therefore
important to test if there is any difference or not.
The second test of our thesis is therefore to look at the behaviour before and after the
companies are labelled as tax evaders, by getting fined. For this test it is important to capture
how the reporting behaviour of the company changes due to the tax evasion sanction. With
this test we do consider when they get fined and not only that they have ever got labelled as a
tax evader. We try to answer the question of what effect the decision from the Tax Agency
has on the company?
Here the period t is the year when they have been fined for tax evasion. The year t-1 is the
year before and t+1 is the year after and so on. We look at all available years before and after
the tax fine year for this test. Since we have to look at the financial reporting after a company
has got fined we include the companies that have been fined during 2012 and backwards,
since our data stretches from the financial years 2013 back to 2005 (see appendix A for an
overview). As explained above we have information from the Tax Agency of tax evaders
from 2014 back to 2009, so our sample for this test will include the companies that have got
fined between 2012 and 2009. The evaders of 2013 and 2014 are not covered since we do not
have financial data for 2014 and 2015 and can therefore not perform this test on those
companies.
To exemplify, if our sample company has got fined in 2010, then year t is 2010, 2009 is t-1
and t+1 is 2011. The test will also be made with our control companies that we have selected
for the first test. Since they were selected based on when our sample company got fined we

Pettersson & Wu 22
can still use those control companies for this test. We will then test the same years for our
control companies.
3.2.5 Test 3 – The Test Between NASDAQ and non-NASDAQ
This test has the same structure as the first test related to earnings. In test 1 for earnings we
have looked at how tax evader companies report earnings over the years. With test 3 we have
instead grouped the companies depending on what type of stock exchange that they belong
to. Instead of having one group with tax evader companies and one with the control
companies for those companies we will have one NASDAQ group. The NASDAQ
companies are traded on the most liquid stock exchange in Sweden and we therefore want to
investigate how that fact affects their earnings reporting. The other companies are listed on
less liquid stock exchanges as explained in section 3.1.
This test is the same as test 1 of earnings in the way that we will also look on the distribution
of frequencies on different intervals below and above zero.
3.2.6 Independent-Samples T-Test
An independent-samples t-test will be conducted to see if the mean differences between the
groups are significant, and therefore represent the population. The t-test will be performed for
test 1, test 2 and test 3, and the groups and variables will be adjusted for each test. For
example for test 3, the test between NASDAQ and non-NASDAQ, is the groups NASDAQ
and non-NASDAQ and the variable scaled earnings.
3.2.7 Regression Analysis and its Independent Variables
We have selected control variables that, based on previous research, have an impact on the
earnings levels. The variables have been selected, because they are either discussed by
Burgstahler and Dichev (1997) in their framework or in other way in the literature on
earnings management. By controlling for these variables we test, which factors that might
impact the results that we have gotten in our tests 1, 2 and 3.
3.2.7.1 Tax Evader
To see if the tax evaders that we have identified have an impact on the earnings management
figures we will use a Dummy-variable of 1, if the company is a tax evader and 0 if it is a
control company. If the tax evaders are more prone to manage earnings then we will see a
positive correlation for this variable.

Pettersson & Wu 23
3.2.7.2 Before and After Fine
We control for the change in behaviour before and after getting fined for tax evasion. This
change is measured in per cent. If a company for example had 25% occurrence of small gains
for the years before getting fined and afterwards had 40% occurrence the change percentage
would be a positive number of 15%.
3.2.7.3 Stock Exchange
Another control variable is if the company is listed on a liquid stock exchange (NASDAQ) or
on a list with less liquidity. Liquid markets are presumed to be more efficient in monitoring
companies, as well as mitigating and detecting earnings management companies like
Burgstahler et al. (2006) and Cormier et al. (2013) conclude in their studies. Due to the large
difference between these markets we will control for this variable in our regression analysis
to see how great an effect it has on the results. If a market is liquid or not will be
operationalized by assigning 1 to the companies that are listed on NASDAQ Large Cap, Mid
Cap and Small Cap and zero to the companies from other stock lists. Even though the First
North list is on NASDAQ those companies are not under the supervision of NASDAQ and
are not under the influence of the same type of institutions, in terms of the regulatory body
and supervisory role that the NASDAQ stock exchange offers the Large, Mid and Small Cap
companies, as discussed previously.
3.2.7.4 Total Assets
Different variables can have an impact on the results that we have received through our
analysis and therefore have to be controlled for. Size of the company is one of such factors
that can play a part major part in the behaviour of the company in managing their earnings.
Size will therefore be controlled for in our OLS regression. Size is used in our regression
based on the total assets in periodt. Even though we scale the earnings by total assets we also
want to see if the size has any effect in itself on the scaled earnings, or if the earnings just
stand in proportion to the size of the total assets.
3.2.7.5 Market- to-Book Ratio
The performance of a company, measured in earnings is said to be influenced by the Market-
to-book ratio (Fama and French, 1995), which is why we have included that variable also in
our regression analysis.
Pettersson & Wu 24
3.2.7.6 Financial Companies
Financial companies as well as banks were deleted from Burgstahler and Dichev (1997)
sample. The reason is that there can be incentives that are pressuring these types of
companies to state lower earnings, due to some favourable treatment from regulators. The
authors therefore explain that shrinking earnings for such companies can happen because of
the oversight from regulatory bodies. However they also mention that they actually got
similar results when doing a separate examination with the excluded financial companies
(Burgstahler and Dichev, 1997). Due to this discussion we want to include the financial
companies, but control for them in our regression analysis.
3.2.7.7 The Regression Analysis Structure
Based on the above control variables we have made the following regression that we will test:
!"#$%&'!!"#$$!!"#$%= !!! + !! !!"#!!"#$!% + !! !"#$%"!!"#!!"#!"!!"#$+ !! !"#$%!!"#ℎ!"#$ + !! !"#$%!!""#$"+ !! !"#$%&!!"!!""# + !! !"#$#%"$&!!"#$%&' + !!"
Notes: Where Reports small gains is calculated as the propensity to report small scaled earnings over the years. If the company never reports small gains then the figure is zero for that company and if they do it every year then the figure is one. Small scaled earnings lies between zero and 1.5%. This measure is one of the more conservative ones that Burgstahler and Dichev (1997) used in their study when looking at earnings and changes in earnings.
3.3 Database Limitations Because we have to use the total assets of the year preceding the earnings year for the scaled
earnings we cannot look at scaled earnings for 2005, since Retriever does not have data on
the beginning of the year total assets. Most of the companies have not reported their financial
figures for 2014 or have not had them transferred into the Retriever database yet. We
therefore are limited to the years 2013 through 2006 for the scaled earnings.
For the change in scaled earnings we use the total assets of two years back in time from the
change in earnings. This means that we can only go back so far as to 2007 when we look at
the change in earnings between 2006 and 2007. This limits the observations in earnings
changes to the years 2013 through 2006.
It should be pointed out however that the National Institute for Economic Research
(Konjunkturinstitutet), which is the authority in Sweden that monitors the business cycles of
the economy, forecasts the development of the Swedish and international economy and does
Pettersson & Wu 25
research related to this field define a business cycle for the economy as three to eight years
(National Institute for Economic Research, 2005). With this definition we are still in range of
an entire business cycle, if not several. This would decrease the risk for noise in our results
caused by how the economy as such has developed. The interval of 2006 to 2013 that we
have in our sample also covers years prior to, during and post the financial crisis caused by
the subprime mortgage bubble. Even though we may be limited in our sample years we
therefore still feel confident that the years that we have for our observations will suffice to
bring valuable and reliable results for this study.
3.4 Methodological Criticism
3.4.1 Sample Size
As for all quantitative analysis there is always the question of if we got the right amount of
data for the study sample. Our study is no different. Our sample size got diminished by
several reasons. One of them was because of the data retrieval program that we used.
Retriever only covers 10 years. If there is a need to cover a greater time span then this will be
a bad thing for the study, which could have the risk to undermine the bearing of the results
that we get from it.
The second reason that our sample size got diminished lies in how that second test was
performed. Because we also wanted to look at how the company acted after the tax evasion
fine we had to exclude two years of sample firms out of six. This of course has repercussions
on the quality of those test results, which the reader has to bear in mind when reading our
results. This sample size shrinkage does however only affect the sample size for the second
test and not the first one, or third.
3.4.2 The Identification of Tax Evaders
As many studies have pointed out (see e.g. Alm, 2011; Korndörfer et al., 2014) it is both hard
to distinguish how large the extent of tax evasion is and to find the tax evader. Our definition
of a tax evasion company has been based on the list of companies that the Tax Agency has
provided us with. One can easily criticize this methodology since there are surely other
companies that have evaded taxes that the Tax Agency has not been able to catch. There is
therefore a risk that some of the control companies are in fact themselves tax evaders, which
would distort the comparison between the two groups. Another issue is also that our list of
tax evaders is short in terms of covered years, namely six years back in time, due to Swedish
legislation. Of course there may be other companies before this time period that are on the

Pettersson & Wu 26
stock exchange, has evaded taxes, has got fined by the Tax Agency, but does not show up on
our list, because it happened too long time ago. Such companies would possibly not be
analysed in the right manner and could also be labelled as a control company, when they
should actually be part of our tax evader sample group.

Pettersson & Wu 27
4. Results Table 2 displays the results of the independent t-test for the distribution of earnings that we
received. The t-tests that we performed were between the tax evader groups and their control
groups as well as within them to see if the differences in frequency distributions that we saw
for the respective tests were significant or not. For test 3 we also looked at if the results
between NASDAQ and non-NASDAQ companies were significant. The t-tests that got
significant results were the earnings distributions between tax evaders and control companies,
the differences in earnings distribution prior to the tax fine year as well as differences in
distribution of earnings between NASDAQ and non-NASDAQ companies. Where we got
significant result from the t-test there were significant differences between those groups,
which most likely could not explained by chance. We explain in more detail for the different
test in this chapter how the earnings were distributed and how that corresponds with past
literature.
Table 2: Independent t-tests of group means
Tests Observations Mean
difference Scaled earnings between groups 854 0.0875 (2.534)*** Scaled change in earnings between groups 743 0.0231 (0.586) Before tax fine between groups 322 -0.0035 (-0.136)** Year of tax fine between groups 80 0.021 (0.357) After tax fine between groups 228 -0.01 (-0.299) Before/after within tax evaders 278 0.049 (1.828) Before/after within control group 278 0.042 (1.313) NASDAQ versus non-NASDAQ 854 0.24 (6.67)*** ***,**,* Sig. 1%, 5%, 10%
Notes: The different independent t-tests are presented above with the number of observations and the mean difference between the tested groups stated. The t-value is stated in brackets and their level of significance by the number of *. See appendix B for descriptive statistics for scaled earnings and scaled change earnings.

Pettersson & Wu 28
4.1 Test 1 - Earnings and Earnings Changes
4.1.1 Earnings Management by Small Earnings
In Figure 1 we see by looking at the chart that intuitively there is a possibility of earnings
management present. Out of the 433 observations there are almost three times the amount of
cases slightly right of zero compared with the cases just left of zero (10.9% against 3.7%).
There is double the occurrence of reported small gains as opposed to small losses in the first
interval closest to zero. This pattern rapidly becomes stronger for each increasing interval.
For the intervals up to 1.5% from zero the occurrence of small earnings is 10.9% of all
observations. The distribution is almost bell curved with highest occurrence just right of zero.
Visually this displays a picture of companies that tend to report many small earnings and
therefore are likely to manage their earnings.
Figure 1: Distribution of annual net income, scaled by previous year’s total assets. The distribution interval widths are 0.005 and the vertical dash in the middle marks zero. The first positive interval is scaled earnings between 0.000 and 0.005. The second interval is 0.005 to 0.010 and so on. The number of observations in each interval is represented by the height that they reach on the vertical frequency axis.
We did the same test for the same years with the control companies also listed on the stock
exchanges. For these years we had 421 observations and the occurrence of small gains versus
small losses was much stronger with the control companies. When we compare the first
positive and the first negative interval there is a six times higher occurrence of small gains

Pettersson & Wu 29
compared to those of small losses (1.2% against -0.2%). For the second interval there are
more than 3 times more reported small gains as there are reported small losses. So the
relationship between small gains and small losses is more dramatic within the control group
than for the tax evader companies. However there is more than double the percentage of
small gains by the tax evader companies than there are in the control company group. So the
relationship between gains and losses is more dramatic for the control group, but the
occurrence is actually greater among the tax evader companies, which Table 3 shows in more
detail.
The t-test between the tax evader groups and the control group shows a difference by 8.75%
on average. These results are significant at the 1% level. We therefore accept our third
hypothesis H3, that tax evader companies manage earnings in a greater extent, since the
occurrence is much greater for this group.
We also accept our first hypothesis H1A - that we would find an unusually large frequency of
reported small earnings - since both the control group and tax evader companies have a
higher frequency of earnings just above zero than just below. Due to this outcome we
confirm the results of Burgstahler and Dichev's (1997) that companies manage earnings by
reporting small gains. Our results further confirms the results that Healy and Wahlen (1999)
found, that earnings management is present in the market on a wide scale. Furthermore, the
results also confirm Bartov et al.'s (2002) study that firms are not passive observers.
4.1.2 Earnings Management by Small Increases
The distribution of changes in earnings is not as big as it was with the earnings. For the tax
evader companies in our sample small gains are reported slightly more often than small gains
are, but the relationship is different from the one that we saw with reported earnings. Here
there is almost the same proportion that has small increases in earnings as has small decreases
in earnings. Out of the 377 observations a brief analysis is that quite many companies had
diminishing earnings, even though there was a large proportion that had earnings increases.
There is not that much difference between the occurrences of small increases in earnings
against how many decreases in earnings we find. There is a higher tendency to report small
increases than there are to report small decreases, but the proportion is not double, like we
saw with the small earnings, but more closer to 14% higher occurrence in small increases
against small earnings decreases up to the third interval above zero. So between the interval
zero to 1.5% and zero to -1.5% the occurrence is 14.3% against 12.5%. That means that in
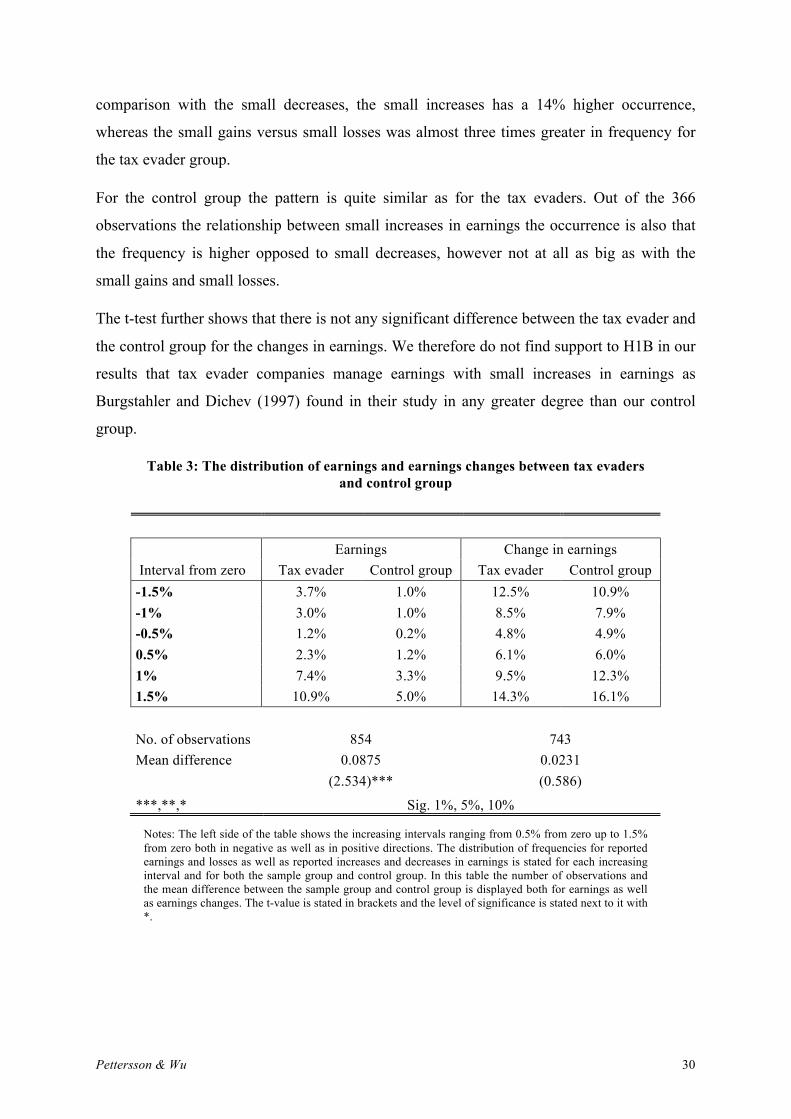
Pettersson & Wu 30
comparison with the small decreases, the small increases has a 14% higher occurrence,
whereas the small gains versus small losses was almost three times greater in frequency for
the tax evader group.
For the control group the pattern is quite similar as for the tax evaders. Out of the 366
observations the relationship between small increases in earnings the occurrence is also that
the frequency is higher opposed to small decreases, however not at all as big as with the
small gains and small losses.
The t-test further shows that there is not any significant difference between the tax evader and
the control group for the changes in earnings. We therefore do not find support to H1B in our
results that tax evader companies manage earnings with small increases in earnings as
Burgstahler and Dichev (1997) found in their study in any greater degree than our control
group.
Table 3: The distribution of earnings and earnings changes between tax evaders and control group
Earnings Change in earnings Interval from zero Tax evader Control group Tax evader Control group -1.5% 3.7% 1.0% 12.5% 10.9% -1% 3.0% 1.0% 8.5% 7.9% -0.5% 1.2% 0.2% 4.8% 4.9% 0.5% 2.3% 1.2% 6.1% 6.0% 1% 7.4% 3.3% 9.5% 12.3% 1.5% 10.9% 5.0% 14.3% 16.1%
No. of observations 854 743 Mean difference 0.0875 0.0231 (2.534)*** (0.586)
***,**,* Sig. 1%, 5%, 10%
Notes: The left side of the table shows the increasing intervals ranging from 0.5% from zero up to 1.5% from zero both in negative as well as in positive directions. The distribution of frequencies for reported earnings and losses as well as reported increases and decreases in earnings is stated for each increasing interval and for both the sample group and control group. In this table the number of observations and the mean difference between the sample group and control group is displayed both for earnings as well as earnings changes. The t-value is stated in brackets and the level of significance is stated next to it with *.
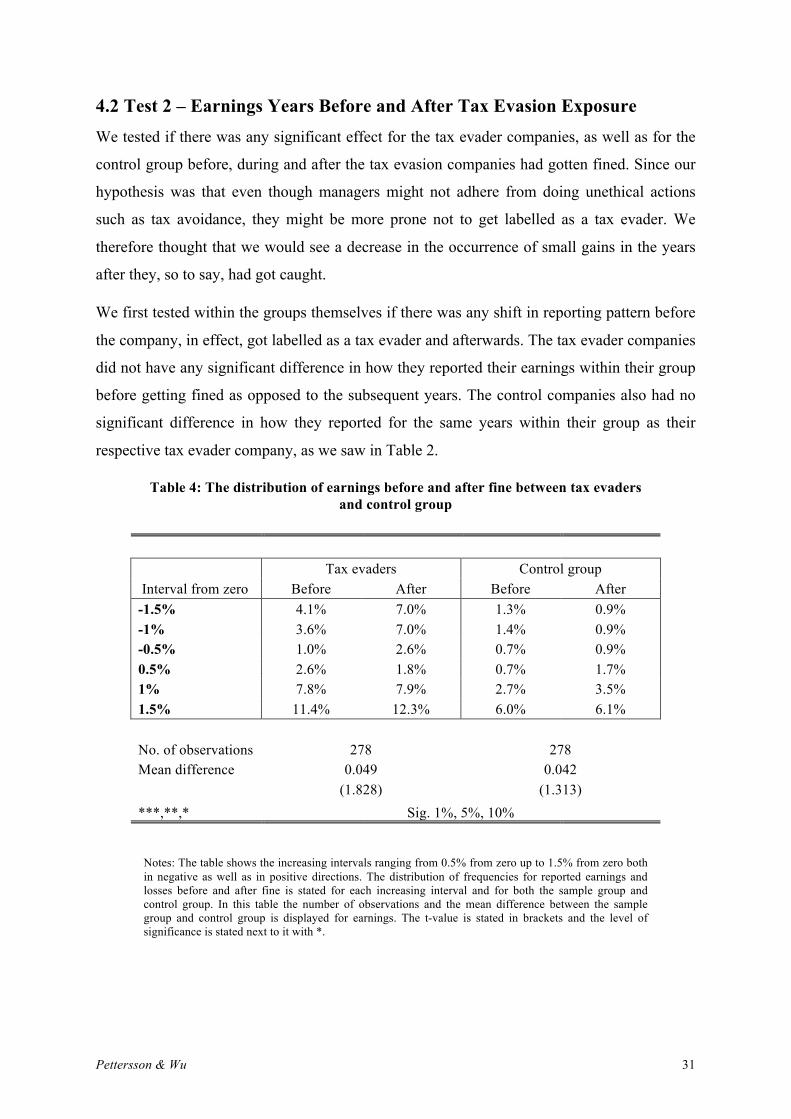
Pettersson & Wu 31
4.2 Test 2 – Earnings Years Before and After Tax Evasion Exposure We tested if there was any significant effect for the tax evader companies, as well as for the
control group before, during and after the tax evasion companies had gotten fined. Since our
hypothesis was that even though managers might not adhere from doing unethical actions
such as tax avoidance, they might be more prone not to get labelled as a tax evader. We
therefore thought that we would see a decrease in the occurrence of small gains in the years
after they, so to say, had got caught.
We first tested within the groups themselves if there was any shift in reporting pattern before
the company, in effect, got labelled as a tax evader and afterwards. The tax evader companies
did not have any significant difference in how they reported their earnings within their group
before getting fined as opposed to the subsequent years. The control companies also had no
significant difference in how they reported for the same years within their group as their
respective tax evader company, as we saw in Table 2.
Table 4: The distribution of earnings before and after fine between tax evaders and control group
Tax evaders Control group Interval from zero Before After Before After -1.5% 4.1% 7.0% 1.3% 0.9% -1% 3.6% 7.0% 1.4% 0.9% -0.5% 1.0% 2.6% 0.7% 0.9% 0.5% 2.6% 1.8% 0.7% 1.7% 1% 7.8% 7.9% 2.7% 3.5% 1.5% 11.4% 12.3% 6.0% 6.1% No. of observations 278 278 Mean difference 0.049 0.042 (1.828) (1.313) ***,**,* Sig. 1%, 5%, 10%
Notes: The table shows the increasing intervals ranging from 0.5% from zero up to 1.5% from zero both in negative as well as in positive directions. The distribution of frequencies for reported earnings and losses before and after fine is stated for each increasing interval and for both the sample group and control group. In this table the number of observations and the mean difference between the sample group and control group is displayed for earnings. The t-value is stated in brackets and the level of significance is stated next to it with *.
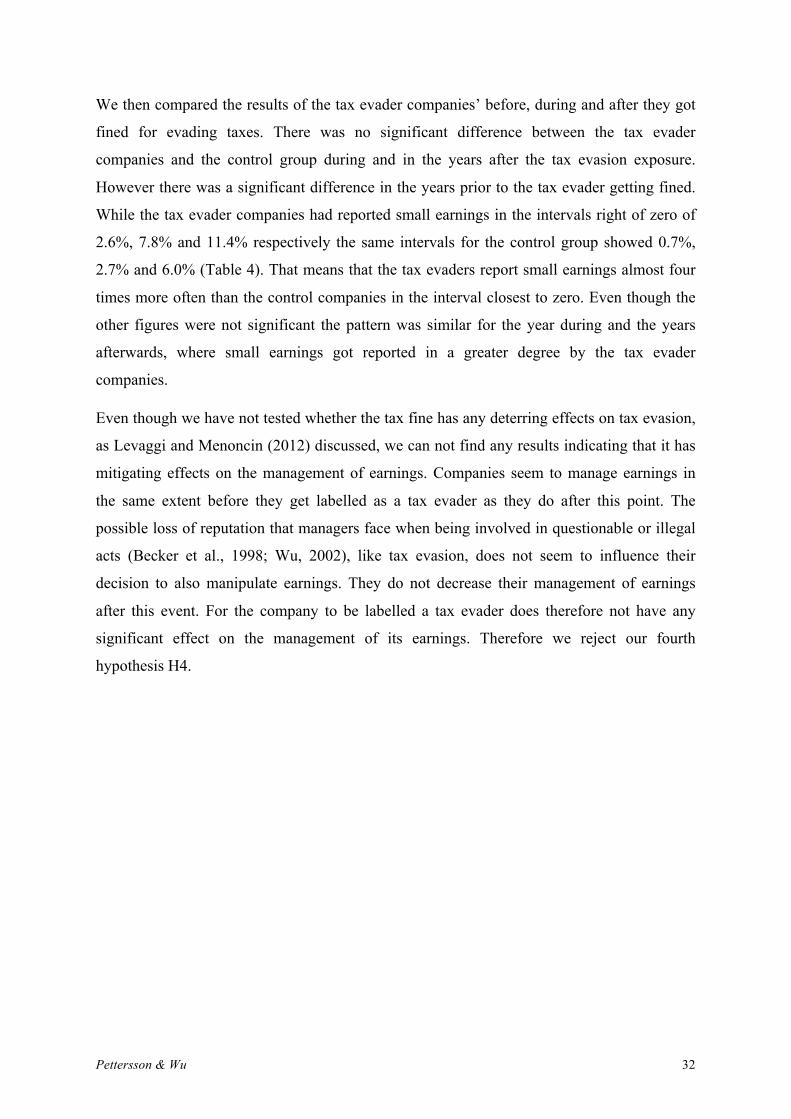
Pettersson & Wu 32
We then compared the results of the tax evader companies’ before, during and after they got
fined for evading taxes. There was no significant difference between the tax evader
companies and the control group during and in the years after the tax evasion exposure.
However there was a significant difference in the years prior to the tax evader getting fined.
While the tax evader companies had reported small earnings in the intervals right of zero of
2.6%, 7.8% and 11.4% respectively the same intervals for the control group showed 0.7%,
2.7% and 6.0% (Table 4). That means that the tax evaders report small earnings almost four
times more often than the control companies in the interval closest to zero. Even though the
other figures were not significant the pattern was similar for the year during and the years
afterwards, where small earnings got reported in a greater degree by the tax evader
companies.
Even though we have not tested whether the tax fine has any deterring effects on tax evasion,
as Levaggi and Menoncin (2012) discussed, we can not find any results indicating that it has
mitigating effects on the management of earnings. Companies seem to manage earnings in
the same extent before they get labelled as a tax evader as they do after this point. The
possible loss of reputation that managers face when being involved in questionable or illegal
acts (Becker et al., 1998; Wu, 2002), like tax evasion, does not seem to influence their
decision to also manipulate earnings. They do not decrease their management of earnings
after this event. For the company to be labelled a tax evader does therefore not have any
significant effect on the management of its earnings. Therefore we reject our fourth
hypothesis H4.
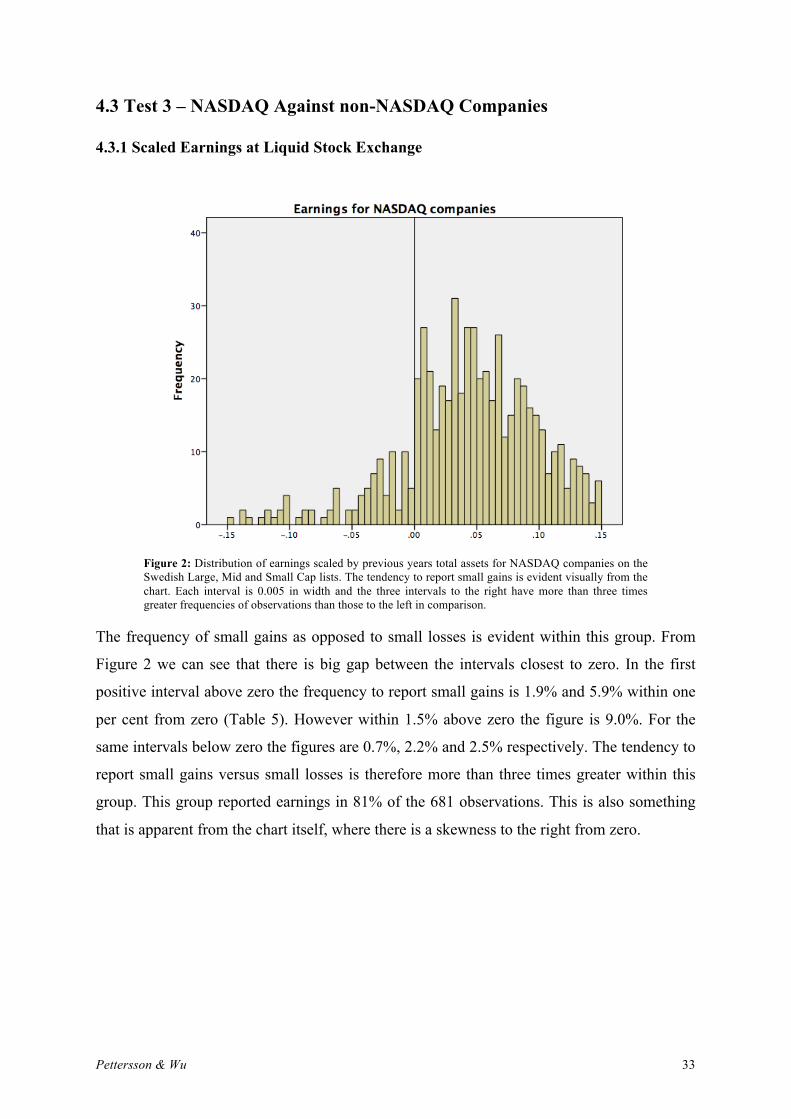
Pettersson & Wu 33
4.3 Test 3 – NASDAQ Against non-NASDAQ Companies
4.3.1 Scaled Earnings at Liquid Stock Exchange
Figure 2: Distribution of earnings scaled by previous years total assets for NASDAQ companies on the Swedish Large, Mid and Small Cap lists. The tendency to report small gains is evident visually from the chart. Each interval is 0.005 in width and the three intervals to the right have more than three times greater frequencies of observations than those to the left in comparison.
The frequency of small gains as opposed to small losses is evident within this group. From
Figure 2 we can see that there is big gap between the intervals closest to zero. In the first
positive interval above zero the frequency to report small gains is 1.9% and 5.9% within one
per cent from zero (Table 5). However within 1.5% above zero the figure is 9.0%. For the
same intervals below zero the figures are 0.7%, 2.2% and 2.5% respectively. The tendency to
report small gains versus small losses is therefore more than three times greater within this
group. This group reported earnings in 81% of the 681 observations. This is also something
that is apparent from the chart itself, where there is a skewness to the right from zero.
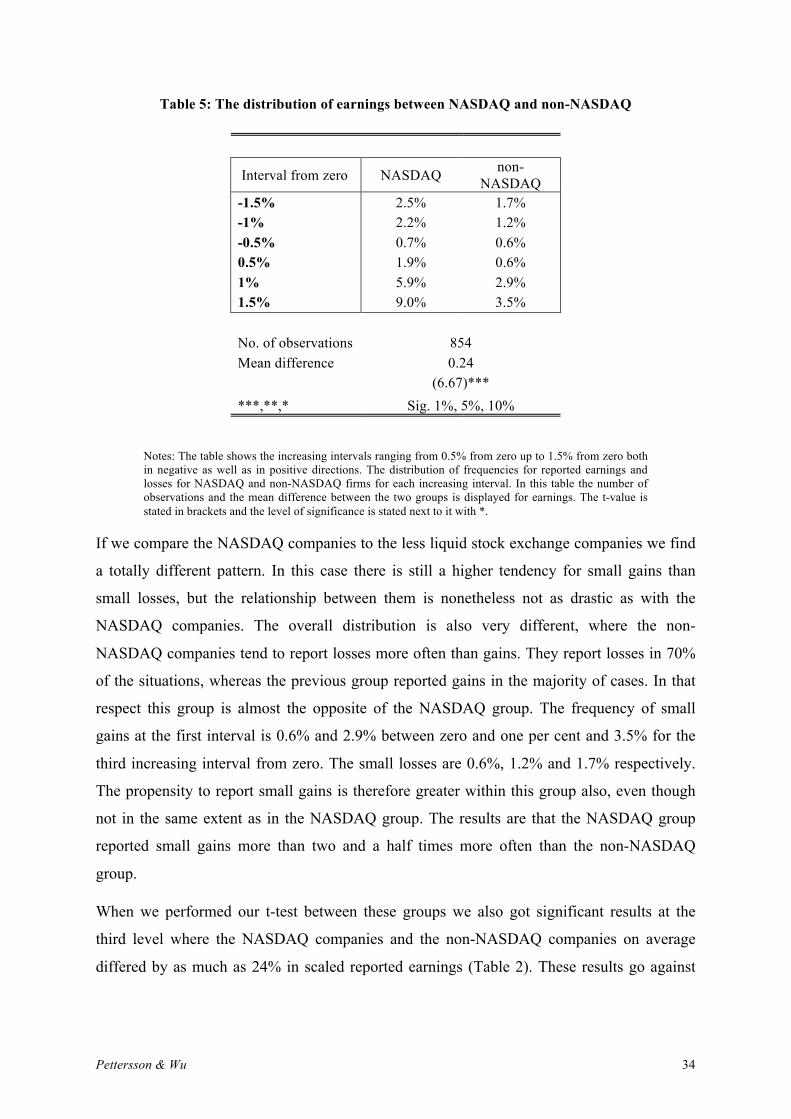
Pettersson & Wu 34
Table 5: The distribution of earnings between NASDAQ and non-NASDAQ
Interval from zero NASDAQ non-NASDAQ
-1.5% 2.5% 1.7% -1% 2.2% 1.2% -0.5% 0.7% 0.6% 0.5% 1.9% 0.6% 1% 5.9% 2.9% 1.5% 9.0% 3.5% No. of observations 854 Mean difference 0.24 (6.67)*** ***,**,* Sig. 1%, 5%, 10%
Notes: The table shows the increasing intervals ranging from 0.5% from zero up to 1.5% from zero both in negative as well as in positive directions. The distribution of frequencies for reported earnings and losses for NASDAQ and non-NASDAQ firms for each increasing interval. In this table the number of observations and the mean difference between the two groups is displayed for earnings. The t-value is stated in brackets and the level of significance is stated next to it with *.
If we compare the NASDAQ companies to the less liquid stock exchange companies we find
a totally different pattern. In this case there is still a higher tendency for small gains than
small losses, but the relationship between them is nonetheless not as drastic as with the
NASDAQ companies. The overall distribution is also very different, where the non-
NASDAQ companies tend to report losses more often than gains. They report losses in 70%
of the situations, whereas the previous group reported gains in the majority of cases. In that
respect this group is almost the opposite of the NASDAQ group. The frequency of small
gains at the first interval is 0.6% and 2.9% between zero and one per cent and 3.5% for the
third increasing interval from zero. The small losses are 0.6%, 1.2% and 1.7% respectively.
The propensity to report small gains is therefore greater within this group also, even though
not in the same extent as in the NASDAQ group. The results are that the NASDAQ group
reported small gains more than two and a half times more often than the non-NASDAQ
group.
When we performed our t-test between these groups we also got significant results at the
third level where the NASDAQ companies and the non-NASDAQ companies on average
differed by as much as 24% in scaled reported earnings (Table 2). These results go against

Pettersson & Wu 35
our hypothesis H2 as well as the literature that we have relied on. We therefore reject our
hypothesis that we would find more earnings management in the less liquid stock markets.
According to Burgstahler et al. (2006) the capital markets should decrease the management
of earnings and actually more so in a more developed and larger stock market, and Cormier et
al. (2013) also argue that investors are more likely to detect earnings management for
companies that are listed on more liquid stock exchanges. Alford and Berger (1999) state that
liquid stock exchanges have great trading volumes and therefore attract analysts, which
reduces the information asymmetry. That the NASDAQ companies were managing their
earnings in such a way as they did compared to the non-NASDAQ companies was therefore
not expected. Leuz et al. (2003) mentioned that the minority shareholders rights had a
mitigating effect on earnings management. Because these are not as strong in Sweden, it
might be one of the reasons why larger and more developed stock markets as the NASDAQ
OMX in Sweden still has a higher occurrence of earnings management than the other
Swedish stock exchanges.
4.4 Regression Analysis We tested the propensity to report earnings ranging from zero, where the company never
reports small gains, to one where the company always reports small gains. Small gains was
identified as a scaled positive earning of up to 1.5% as in the previous tests. This dependent
variable was tested against the independent variables that we mentioned in the method
section of this paper. The adjusted R2 for our regression analysis was 43.1%. The regression
analysis that we have used can therefore only explain 43.1% of the results that we see in the
propensity to report small earnings.
Table 6 is a presentation of our OLS regression results. One of the independent variables that
has a significant impact on our dependent variable is the size of the company measured by
previous years total assets The effect, even though significant, is however minuscule. Our
result is that it rather has a positive correlation with earnings management, even though it is
rather small.
Furthermore being listed on a liquid stock exchange, market-to-book ratio, being a financial
company, or being a tax evader company do not any of them get significant results according
to the t-tests in our regression analysis. We can therefore not make any conclusions from
these results, since we cannot confirm that these independent variables impact the results that
we see in the propensity to report small gains over the years.
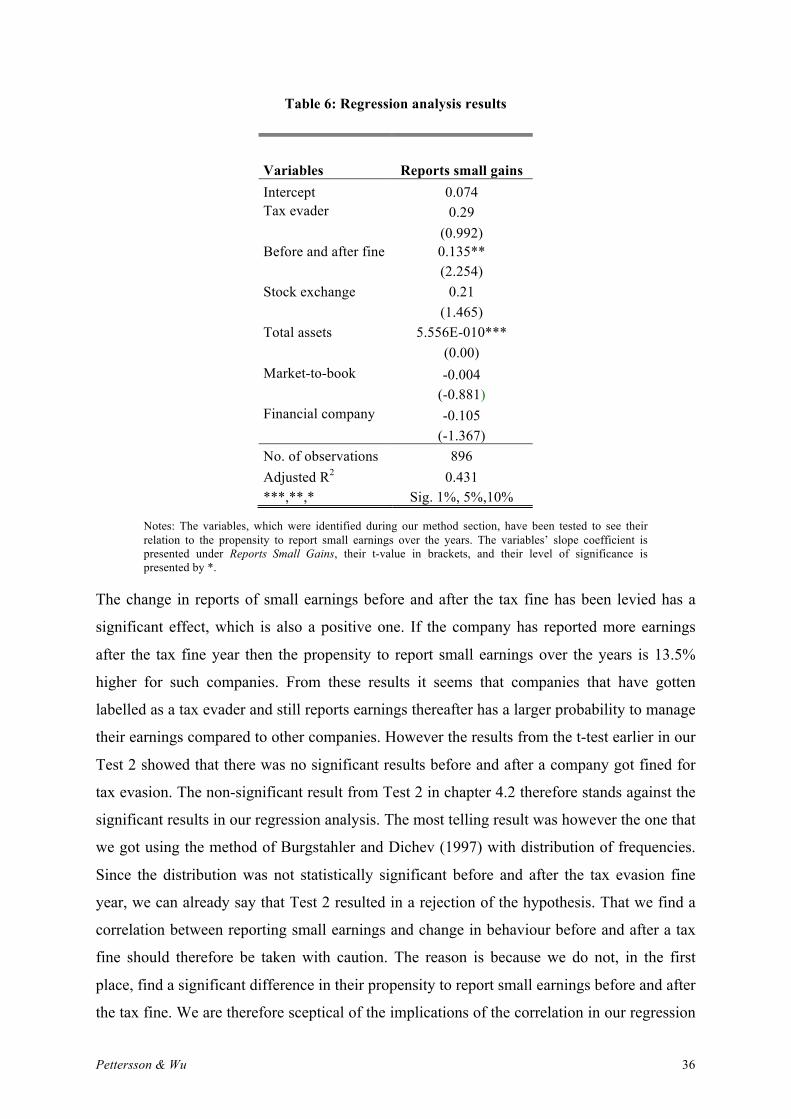
Pettersson & Wu 36
Table 6: Regression analysis results
Variables Reports small gains Intercept 0.074 Tax evader 0.29 (0.992) Before and after fine 0.135** (2.254) Stock exchange 0.21 (1.465) Total assets 5.556E-010*** (0.00) Market-to-book -0.004 (-0.881) Financial company -0.105 (-1.367) No. of observations 896 Adjusted R2 0.431 ***,**,* Sig. 1%, 5%,10%
Notes: The variables, which were identified during our method section, have been tested to see their relation to the propensity to report small earnings over the years. The variables’ slope coefficient is presented under Reports Small Gains, their t-value in brackets, and their level of significance is presented by *.
The change in reports of small earnings before and after the tax fine has been levied has a
significant effect, which is also a positive one. If the company has reported more earnings
after the tax fine year then the propensity to report small earnings over the years is 13.5%
higher for such companies. From these results it seems that companies that have gotten
labelled as a tax evader and still reports earnings thereafter has a larger probability to manage
their earnings compared to other companies. However the results from the t-test earlier in our
Test 2 showed that there was no significant results before and after a company got fined for
tax evasion. The non-significant result from Test 2 in chapter 4.2 therefore stands against the
significant results in our regression analysis. The most telling result was however the one that
we got using the method of Burgstahler and Dichev (1997) with distribution of frequencies.
Since the distribution was not statistically significant before and after the tax evasion fine
year, we can already say that Test 2 resulted in a rejection of the hypothesis. That we find a
correlation between reporting small earnings and change in behaviour before and after a tax
fine should therefore be taken with caution. The reason is because we do not, in the first
place, find a significant difference in their propensity to report small earnings before and after
the tax fine. We are therefore sceptical of the implications of the correlation in our regression

Pettersson & Wu 37
analysis and the reason is probably the way that we have measured our dependent variable
and not the real effect that the tax evasion fine has on the propensity to manage earnings by
reporting small earnings.

Pettersson & Wu 38
5. Conclusions The tax evader companies were more pervasive when it came to report small earnings than
our control companies. We can therefore conclude that tax evader companies manage
earnings in a larger extent than other companies in accordance with our hypothesis. Because
the tendency to manage earnings by small gains was more pervasive in our group of tax
evaders we see that this could be a red flag for earnings management in the future.
Regulators, auditors and investors could use the information to investigate the tax evaders
more careful after they get caught. Our results are highly significant for small gains between
our tax evader group and control group. Because we do not find significant results between
the two groups when it comes to decreases and increases in earnings we cannot conclude if
the tax evaders use small increases to manage their earnings as well. We furthermore find
evidence that earnings management by small gains exists in the overall market also, which
supports our first hypothesis and is in line with previous research.
Even though our results support our hypotheses that there are unusually large frequencies of
small gains in the market as such and that tax evader companies manage earnings in a greater
extent we cannot explain what affects this behaviour. Our regression analysis does not get
significant results for the independent variables that we have tested, except for the effect of
the size of total assets and the effect of the tax fine. But while the effect of total assets is
almost miniscule our t-tests do not find significant results between the years before and after
a company gets fined for tax evasion. The results are in this regard inconclusive and we
cannot say that the actual fining of a company for tax evasion has any important disciplinary
effect on the management of earnings.
We do however conclude that since we do not find any significant differences between the
years before and after a company gets fined for tax evasion then being labelled as a tax
evader does not seem to have any behavioural effects on the company in relation to earnings
management. Our hypothesis regarding the possible disciplinary effect of a tax evasion fine
does not hold and we conclude that labelling a company, as a tax evader does not have any
deterring effect on their management of earnings. There are probably stronger incentives that
drive companies and its management to manage earnings than those that restrict them.
One of our most unexpected results was that our hypothesis of less earnings management
within the liquid NASDAQ group was rejected. The NASDAQ companies reported small
gains more than twice as often as the non-NASDAQ companies did. We therefore conclude

Pettersson & Wu 39
that liquid stock exchanges, like NASDAQ, enhance the tendency to manage earnings and
not the other way around as was anticipated. We expected that type of pattern among the less
liquid stock exchanges, but they had lesser occurrences of small gains than the NASDAQ
ones. Possible explanations can be that the ownership of NASDAQ listed companies is more
disperse, which creates greater risks of agency problems. In contrast the companies at the less
liquid stock exchanges are more often owned and operated by the founder, who might have
greater incentives not to manipulate his own shares if he intends to hold his shares on long
term. There are, as we have discussed earlier, differing results related to founding family
ownership and earnings quality, but in the light of our result, that could be one explanation to
the smaller frequency of small earnings that we got in our test of non-NASDAQ companies.
We furthermore anticipated that NASDAQ would have stronger institutions in place like their
regulations and monitoring role and that such institutions would mitigate earnings
management. Even though these institutions are in place other forces are apparently stronger.
One possible explanation of other forces that can have an impact is analysts. The coverage of
analysts is higher for NASDAQ companies than for other listed companies, which should
have worked as an information asymmetry bridge between investors and managers.
Nonetheless such coverage can be an incentive for managers to beat benchmarks and report
small earnings by using earnings management techniques. Since the coverage of analysts are
higher for NASDAQ firms managers of such firms are also more likely to be driven to keep
reporting earnings. Managers of non-NASDAQ companies are not pressured in this manner,
since the analyst coverage is lower for such companies. That makes it less important for non-
NASDAQ companies to report earnings, which in turn makes the occurrence of earnings
management by small gains less present.
These findings contribute to research in the field of earnings management as well as in the
field of tax manipulation and gives further explanations as to how earnings management and
tax evasion is related to each other. With our unique list of tax evader companies we were
able to test this relationship and also show how companies behave when they are exposed for
tax evasion. The disciplinary effect of labelling a company for one type of accounting does
not make them change their behaviour in relation to other fields. This is an important finding
for regulatory bodies if they have the intention of changing the overall behaviour of an
organization. Furthermore that companies on liquid and regulated stock exchanges were in
fact more prone to manage their earnings show that investors have to be careful also with
Pettersson & Wu 40
reputable firms and that a premium stock market, such as NASDAQ, cannot give assurance
of premium earnings quality.
5.1 Limitations and future research As we mentioned in our method sections there are limitations to this study that has to be
addressed and which can form a basis for future research. One of our limitations is that our
sample size is made out of 56 companies and the same amount of control companies. Even
though the sample of tax evaders represents about 10% of the number of listed companies in
Sweden, the total amount is not extensive, which might have affected our results. If there is a
possibility to find a similar tax evasion list in another country with a bigger stock exchange,
than such a sample could be used to replicate our study.
Our regression analysis did not get significant results for most of the independent variables
that we used. This might be related to the dependent variable that we used. Even though
small earnings has proven to be a good way of identifying earnings management companies
in previous studies the propensity to report small earnings might not be a good measure to
test against independent variables. For future studies the dependent variable used in the
regression analysis might consist of some other measure, even though small earnings could
still be used to identify earnings management companies at first.
We have focused on listed companies, which according to previous literature should have
more incentives to manage earnings. It would however also be interesting to see what the
relationship between tax evasion and earnings management for private companies looks like.
Even though the occurrence of earnings management is less frequent within such a group the
relationship towards tax evasion might not be affected in the same degree. This could be an
interesting topic for tax authorities to investigate. For such companies there nonetheless is the
issue of which private companies that should be included in the sample and on what
parameters.
The tax evader list, which gave us a unique opportunity to test the relationship between tax
evasion and earnings management, still comes with limitations. Like the SEC list that was
used by Dechow et al. (1996) these companies are the ones that the authorities have been able
to identify as well as investigate. Since the authorities have limited resources to both identify
as well as investigate and fine companies it is evident that all publicly listed tax evader
companies will not be on our list. It would be interesting to see a study that would use a list
like ours in conjunction with another method of identifying tax evasion companies to see

Pettersson & Wu 41
what type of results that it would lead to. To measure and identify a tax evader is difficult,
like the articles in our literature review show, but together with our list we as researchers are
able to enhance the reliability of our results and contribute even further to the knowledge of
tax evasion’s relationship to earnings management.
Pettersson & Wu 42
References Alford, A.W., Berger, P.G., 1999. A Simultaneous Equations Analysis of Forecast Accuracy,
Analyst Following, and Trading Volume. Journal of Accounting, Auditing & Finance 14(3): 219–240.
Alm, J., 2011. Measuring, explaining, and controlling tax evasion: lessons from theory, experiments, and field studies. International Tax and Public Finance 19(1): 54–77.
Badertscher, B.A., Phillips, J.D., Pincus, M., Rego, S.O., 2009. Earnings Management Strategies and the Trade-Off between Tax Benefits and Detection Risk: To Conform or Not to Conform? The Accounting Review 84(1): 63–97.
Barton, J., Simko, P.J., 2002. The Balance Sheet as an Earnings Management Constraint. The Accounting Review 77(4): 1-27.
Bartov, E., Givoly, D., Hayn, C., 2002. The rewards to meeting or beating earnings expectations. Journal of Accounting & Economics 33(2): 173–204.
Becker, C.L., Defond, M.L., Jiambalvo, J., Subramanyam, K. r., 1998. The Effect of Audit Quality on Earnings Management*. Contemporary Accounting Research 15(1): 1–24.
Brooks, R., Chance, D.M., Cline, B., 2012. Private Information and the Exercise of Executive Stock Options. Financial Management 41(3): 733–764.
Burghstahler, D.C., Hail, L., Leuz, C., 2006. The Importance of Reporting Incentives: Earnings Management in European Private and Public Firms. The Accounting Review 81(5): 983–1016.
Burgstahler, D., Dichev, I., 1997. Earnings management to avoid earnings decreases and losses. Journal of Accounting & Economics 24(1): 99-126.
Burns, N., Kedia, S., 2008. Executive option exercises and financial misreporting. Journal of Banking & Finance 32(5): 845–857.
Byun, S., Roland-Luttecke, K., 2014. Meeting-or-Beating, Earnings Management, and Investor Sensitivity after the Scandals. Accounting Horizons 28(4): 847–867.
Carvalho, C., Klagge, N., Moench, E., 2011. The persistent effects of a false news shock. Journal of Empirical Finance 18(4): 597–615.
Chan, K., Ikenberry, D.L., Lee, I., Wang, Y., 2010. Share repurchases as a potential tool to mislead investors. Journal of Corporate Finance 16(2): 137–158.
Chan, W.S., 2003. Stock price reaction to news and no-news: drift and reversal after headlines. Journal of Financial Economics 70(2): 223.
Chyz, J.A., 2013. Personally tax aggressive executives and corporate tax sheltering. Journal of Accounting and Economics 56(2-3): 311–328.
Cormier, D., Houle, S., Ledoux, M.-J., 2013. The incidence of earnings management on information asymmetry in an uncertain environment: Some Canadian evidence. Journal of International Accounting, Auditing and Taxation 22(1): 26–38.
Crocker, K.J., Slemrod, J., 2005. Corporate tax evasion with agency costs. Journal of Public Economics 89(9-10): 1593–1610.
Dechow, P.M., Ge, W., Larson, C.R., Sloan, R.G., 2011. Predicting Material Accounting Misstatements. Contemporary Accounting Research 28(1): 17–82.
Dechow, P.M., Sloan, R.G., Sweeney, A.P., 1995. Detecting Earnings Management. The Accounting Review 70(2): 193–225.
Dechow, P.M., Sloan, R.G., Sweeney, A.P., 1996. Causes and Consequences of Earnings Manipulation: An Analysis of Firms Subject to Enforcement Actions by the SEC*. Contemporary Accounting Research 13(1): 1–36.
Dell’Anno, R., 2009. Tax evasion, tax morale and policy maker’s effectiveness. The Journal of Socio-Economics 38(6): 988–997.
Pettersson & Wu 43
Desai, H., Hogan, C.E., Wilkins, M.S., 2006. The Reputational Penalty for Aggressive Accounting: Earnings Restatements and Management Turnover. The Accounting Review 81(1): 83–112.
Desai, M.A., Dharmapala, D., 2009. Corporate Tax Avoidance and Firm Value. The Review of Economics and Statistics 91(3): 537–546.
Desai, M.A., Dharmapala, D., 2006. Corporate tax avoidance and high-powered incentives. Journal of Financial Economics 79(1): 145–179.
Fama, E.F., French, K.R., 1995. Size and Book-to-Market Factors in Earnings and Returns. The Journal of Finance 50(1): 131–155.
Farber, D.B., 2005. Restoring Trust after Fraud: Does Corporate Governance Matter? The Accounting Review 80(2): 539–561.
Farrell, K., Unlu, E., Yu, J., 2014. Stock repurchases as an earnings management mechanism: The impact of financing constraints. Journal of Corporate Finance 25: 1–15.
Frank, M.M., Lynch, L.J., Rego, S.O., 2009. Tax Reporting Aggressiveness and Its Relation to Aggressive Financial Reporting. The Accounting Review 84(2): 467–496.
Hanlon, M., 2005. The Persistence and Pricing of Earnings, Accruals, and Cash Flows When Firms Have Large Book-Tax Differences. The Accounting Review 80(1) 137–166.
Healy, P.M., Wahlen, J.M., 1999. A Review of the Earnings Management Literature and Its Implications for Standard Setting. Accounting Horizons 13(4): 365–383.
Hong, Y., Huseynov, F., Zhang, W., 2014. Earnings Management and Analyst Following: A Simultaneous Equations Analysis. Financial Management Wiley-Blackwell 43(2): 355–390.
Jeter, D.C., Shivakumar, L., 1999. Cross-sectional estimation of abnormal accruals using quarterly and annual data: Effectiveness in detecting event-specific earnings management. Accounting and Business Research 29(4): 299–319.
Korndörfer, M., Krumpal, I., Schmukle, S.C., 2014. Measuring and explaining tax evasion: Improving self-reports using the crosswise model. Journal of Economics Psychology 45: 18–32.
Kraft, A., Lee, B.S., Lopatta, K., 2014. Management earnings forecasts, insider trading, and information asymmetry. Journal of Corporate Finance 26: 96–123.
Lee, T. a., Clarke, F., Dean, G., 2008. The dominant senior manager and the reasonably careful, skilful, and cautious auditor. Critical Perspectives on Accounting 19(5): 677–711.
Leuz, C., Nanda, D., Wysocki, P.D., 2003. Earnings management and investor protection: an international comparison. Journal of Financial Economics 69(3): 505–527.
Levaggi, R., Menoncin, F., 2012. Tax audits, fines and optimal tax evasion in a dynamic context. Economics Letters 117(1): 318–321.
Liu, L., Liu, H., Yin, J., 2014. Stock Option Schedules and Managerial Opportunism. Journal of Business Finance & Accounting 41(5-6): 652–684.
Louis, H., Robinson, D., 2005. Do managers credibly use accruals to signal private information? Evidence from the pricing of discretionary accruals around stock splits. Journal of Accounting and Economics 39(2): 361–380.
McVay, S., Nagar, V., Vicki Wei Tang, 2006. Trading incentives to meet the analyst forecast. Review of Accounting Studies 11(4): 575–598.
National Institute for Economic Research, 2005. Konjunkturterminologi. Available from: http://www.konj.se/download/18.70c52033121865b1398800099353/Konjunkturterminologi.pdf [11 April 2015].
Nelson, M.W., Elliott, J.A., TarpIey, R.L., 2002. Evidence from Auditors about Managers’ and Auditors’ Earnings Management Decisions. The Accounting Review 77(4): 175-202.
Pettersson & Wu 44
OECD, 2015. Glossary of Tax. Available from: http://www.oecd.org/ctp/glossaryoftaxterms.htm#E [21 March 2015].
Oxford Reference, 2015. A Dictionary of Finance and Banking. Available from: http://www.oxfordreference.com.ezproxy.its.uu.se/view/10.1093/acref/9780199664931.001.0001/acref-9780199664931-e-3742 [22 March 2015].
Pelucio-Grecco, M.C., Geron, C.M.S., Grecco, G.B., Lima, J.P.C., 2014. The effect of IFRS on earnings management in Brazilian non-financial public companies. Emerging Markets Review 21: 42–66.
Peng, L., Röell, A., 2014. Managerial Incentives and Stock Price Manipulation. The Journal of Finance 69(2): 487–526.
Phillips, J.D., 2003. Corporate Tax-Planning Effectiveness: The Role of Compensation-Based Incentives. The Accounting Review 78(3): 847–874.
Ronen, J., Yaari, V., 2007. Earnings Management: Emerging Insights in Theory, Practice, and Research. Springer Science & Business Media.
Tax Procedure Act (2011:1244), 2011. Wang, D., 2006. Founding Family Ownership and Earnings Quality. Journal of Accounting
Research 44(3): 619–656. Whitaker, C., 2005. Bridging the Book-Tax Accounting Gap. The Yale Law Journal 115(3):
680–726. Wu, M., 2002. Earnings Restatements: A Capital Market Perspective. The University of
Hong Kong. Available from: Social Science Research Network. Zheng, L., Zhou, X., 2012. Executive Stock Options and Manipulated Stock-Price
Performance. International Review of Finance 12(3): 249–281.
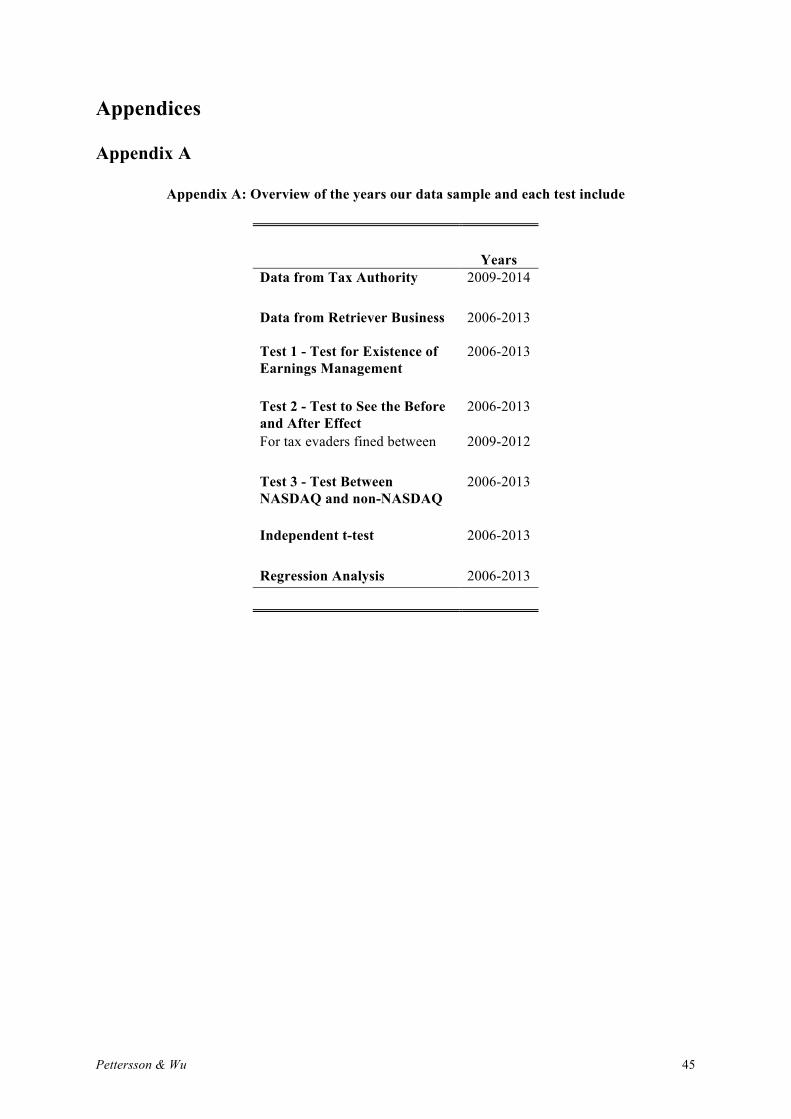
Pettersson & Wu 45
Appendices
Appendix A
Appendix A: Overview of the years our data sample and each test include
Years Data from Tax Authority 2009-2014 Data from Retriever Business 2006-2013 Test 1 - Test for Existence of Earnings Management
2006-2013
Test 2 - Test to See the Before and After Effect
2006-2013
For tax evaders fined between 2009-2012 Test 3 - Test Between NASDAQ and non-NASDAQ
2006-2013
Independent t-test 2006-2013 Regression Analysis 2006-2013

Pettersson & Wu 46
Appendix B
Appendix B: Descriptive statistics by year for scaled earnings and changes in earnings
Panel A: Scaled change in earnings Year N Mean Std. Dev. 25% 50% 75% 2007 56 -0.04502 0.743465 -0.03805 0.00711 0.09197 2008 54 -0.01095 0.545327 -0.13743 -0.01676 0.03642 2009 54 0.055123 0.20538 -0.03107 -0.0002 0.06853 2010 52 0.019655 0.213015 -0.0137 0.0087 0.05879 2011 52 -0.02112 0.250198 -0.05894 -0.00717 0.02077 2012 56 -0.05139 0.226208 -0.04036 0.001155 0.02809 2013 56 0.024408 0.112798 -0.02226 0.002738 0.04194 Total 380 Panel B: Scaled earnings Year N Mean Std. Dev. 25% 50% 75% 2006 51 0.026087 0.31366 0.00428 0.06650 0.14375 2007 51 0.055006 0.258847 -0.00586 0.05362 0.13934 2008 55 -0.01385 0.255736 -0.04522 0.00561 0.07454 2009 55 0.0101 0.207554 -0.01269 0.01635 0.06536 2010 55 0.034424 0.189032 0.004259 0.04523 0.08850 2011 55 0.008471 0.177955 -0.00456 0.04039 0.08220 2012 56 -0.01028 0.167554 -0.03373 0.02201 0.07202 2013 56 -0.00261 0.150686 -0.0159 0.02190 0.07711 Total 434
Notes: Earningst: Net income in period t. Scaled change in earningst: (Earningst – Earningst-1)/ Previous year’s total assetst-1. Scaled earningst: Earningst/Previous year’s total assetst-1